supplemental evaluation report: 2003-04 survey...
TRANSCRIPT

Project CO-SEED (Community-based School Environmental Education) Supplemental Evaluation Report: 2003-04 Survey Results
The Haley School
Prepared for: CO-SEED The Haley School Boston Nature Center
Prepared by: Michael Duffin, Rob Beranek, & PEER Associates
April 13, 2005

CO-SEED is part of the Place-based Education Evaluation Collaborative (PEEC), a unique partnership of organizations whose aim is to strengthen and deepen the practice and evaluation
of place-based education initiatives. PEEC programs (and organizations) include the CO-SEED Project (Antioch New England
Institute); the Community Mapping Program (the Orton Family Foundation, and the Vermont Institute of Natural Science); the Sustainable Schools Project (Shelburne Farms, and the Vermont Education for Sustainability Project); and A Forest for Every Classroom Project
(Shelburne Farms, The Northeast Natural Resource Center of the National Wildlife Federation, The Marsh Billings Rockefeller National Historical Park, The Conservation Study
Institute, and Green Mountain National Forest). In addition, the Upper Valley Community Foundation provides funding and support for
several of these programs through its Wellborn Ecology Fund, as well as financial, administrative and staff support for collaborative evaluation and research efforts.
www.PEECworks.org
ACKNOWLEDGEMENTS
We wish to extend a particular thanks to the individual educators, students, and community members who so graciously participated in this evaluation. Michael Duffin’s work on this evaluation report was partially funded through a fellowship from the National Network for Environmental Management Studies (NNEMS) program of the U.S. Environmental Protection Agency. Thank you.
NOTE
This report was authored by PEER Associates, Inc. A more complete description of the evaluation personnel involved in this project can be found in the Introduction of this report. Evaluation Co-Directors for PEER Associates Amy Powers and Michael Duffin can be contacted at [email protected] or [email protected].

Haley Survey Results, 2003-04 CO-SEED Evaluation page 1
Introduction The Dennis C. Haley Elementary School (the Haley School) became a CO-SEED site in September 2003. As part of the 2003-04 CO-SEED evaluation, surveys were administered to students, educators, and community members to establish baseline data on thoughts and attitudes about school and community activities. This report presents analysis and complete data for the subset of Haley School data only. The intent is to support reflection on the program by CO-SEED, Haley, and Boston Nature Center staff, hopefully resulting in refinement of program implementation. For presentation and analysis of 2003-04 survey results aggregated across all CO-SEED sites, for more detail about the survey design and administration process, and for discussion of qualitative Haley School data, please refer to the 2003-04 Project CO-SEED Final Report, available at http://www.peecworks.org/PEEC/PEEC_Reports/S001F605E. This report was produced by PEER Associates under the direction of Principal Investigator Michael Duffin and with technical guidance from Senior Research Associate Dr. George Tremblay. Much of the data management, analysis, and formatting of this work was done by Research Associate Rob Beranek. Rob’s work on this project was also completed in partial fulfillment of a Masters in Environmental Education from Antioch New England Graduate School.
Interpreting These Results The results from each of three groups of Haley School survey respondents (i.e. 21 educators, 66 fourth and fifth grade students , and 58 community members) are presented separately in this report. For all surveys, respondents were asked how much they agreed with various statements or else how often they performed or witnessed certain activities. All items (i.e. individual survey questions) were standardized with a four point response scale (Figure 1). A complete summary of all the survey results at the individual item level is provided in the Appendix of this report. Program staff are encouraged to explore this item level data further via our web-based survey administration and data access system. In order to make the analysis more coherent and to reduce certain types of statistical error, the discussion below combines individual survey items into groups of items that address similar ideas. “Indices” are groups of one to six different survey items that each address a different aspect of a fairly narrow concept. Indices are combined into “modules” which are groups of two to six indices that all relate to a single broad concept. In some instances, several modules were grouped together to form an “overall module.” Results are presented for all indices and modules for which data exists, and discussion highlights the few that were most unique, typical, or otherwise interesting.

Haley Survey Results, 2003-04 CO-SEED Evaluation page 2
Figure 1. Interval Points, Measurements, and Modules Interval Point Measure of Agreement Measure of Frequency
1 Strongly Disagree Twice per year or less 2 Tend to Disagree Three to six times per year 3 Tend to Agree About once a month 4 Strongly Agree Once a week or more
Modules Measured
C Student engagement: civic & learning
P Improving educator craft W Reports of whole school
improvement X Reports of student
performance Y Perceptions of community
improvement
L Use of local resources N Student attachment
to place
The surveys used for CO-SEED evaluation during 2003-04 were part of a larger cross-program investigation by the Place-based Education Evaluation Collaborative (PEEC). Over the course of the year, the content and format of CO-SEED surveys were integrated with those of other PEEC programs, eventually resulting in a coherent system of survey instruments that can be administered and analyzed across many different place-based education contexts. As it turns out, the surveys filled out by Haley School educators and community members represent “older” versions because they were administered at the beginning of the school year, whereas the surveys filled out by Haley School students represent “newer” versions because they were administered near the end of the school year. All 2003-04 CO-SEED evaluation reports present the survey analysis in terms of the newer system of items, indices, and modules in order to provide more consistent comparison to future results. Items from older surveys that do not map cleanly onto newer items, indices, or modules are not presented in this report unless they yielded results of particular interest. Old and new versions of actual survey instruments, as well as a template for mapping older versions onto the new system, can be found in the 2004-04 Project CO-SEED Final Report.

Haley Survey Results, 2003-04 CO-SEED Evaluation page 3
Results and Discussion of Educator Surveys The Haley School’s educator results (Table 1) suggest a potential for future success on several CO-SEED-related outcomes. Educators reported a somewhat low frequency of practicing place-based education as compared to veteran CO-SEED sites, but tended to believe that increased place-based practices could positively influence their students’ performance in multiple realms. The surveys were administered to educators in early October, 2003, one month after Project CO-SEED began at the Haley School. Thus, all educator results presented here can be clearly interpreted as baseline levels and should not reflect effects of CO-SEED.
Table 1. Summary of Data for 2003-2004
CO-SEED Haley School Educator/Staff Surveys Variable
(items included)
# of items incl.
N _ X SD
Overall educator practice (overall module=p1,p6,l1,l2,l3,l4,l5) 15 20 2.1 .48
Use of local resources (L module = l1,l2,l3,l4,l5)
13 20 2.1 .47
Use of local places (llp index = l1,l4) 6 19 2.1 .50 Use of local people (llpeop index = l2,l5) 6 20 2.0 .53
Service learning (lsl index = l3) 1 15 1.9 .80
Improving educator craft (P module = p1,p6)
2 6 1.3 .61
Meeting curricular goals (pcg index = p1) 1 3 1.7 1.15 Educator engagement/growth (pteg index = p6) 1 6 1.2 .41
Reports of student performance (X module = x1,x2,x3,x4,x6,x7)
10 20 2.8 .52
Student engagement in learning (xsel index=x1) 1 20 2.2 .83 Student academic achievement (xsaa index=x2) 2 20 2.8 .67 Student civic engagement (xsce index = x3,x7) 3 19 2.8 .67
Student stewardship behavior (xsbb index = x4) 1 18 3.5 .51 Satisfied with quality of school (item = x6) 3 19 2.8 .77
NOTE: Table row shading represents the level of data reduction, i.e. modules are light gray, overall module is darker gray. N = sample size; X = mean;
M = median; SD = standard deviation Because of the unique consequences of mapping older survey versions onto the newer versions of analysis categories, the Overall educator practice module is almost entirely determined by items about Use of local resources. The mean (i.e. average) of X = 2.1 suggests that three to six times per year may be a typical baseline frequency for place-based activities at Haley before CO-SEED. This is an area to

Haley Survey Results, 2003-04 CO-SEED Evaluation page 4
watch for increased frequency in subsequent years. Within this module, item l3, which read “Our schools regularly engage in community-based schoolwork,” had the lowest mean ( X = 1.9). At first glance, educators reported appreciably low ( X = 1.3) for the Improving educator craft module. This module is designed to measure if educators believe CO-SEED is aiding in meeting curricular goals and engaging educators in professional/personal growth. Item p1 reads “As a result of CO-SEED involvement, I am more able to align my teaching to state frameworks,” and item p6 reads “I have gained new content understanding and/or new skills as a result of CO-SEED involvement.” What the means do not show is that most educators felt it more appropriate to report “Not Sure” to these items. Only three educators answered item p1 and six answered item p6 out of the twenty educators who received the survey. It makes common sense that many educators thought one month of CO-SEED involvement was insufficient to answer these items.
Figure 2 could be interpreted to suggest that most Haley educators have moderate baseline levels of agreement with the idea that place-based education could have a positive effect on student outcomes. The Reports of student performance module ( X = 2.8) combines ten items about student academic achievement, student engagement in learning, student civic engagement, and student environmental stewardship behavior. Within this module, educators agreed most strongly with item x4 ( X = 3.5), which read “There are many things my students can do to protect the local environment, including the school grounds.” Also within this module, educators tended
to slightly disagree with item x1 ( X = 2.1), which read “I am satisfied with our students’ enthusiasm for learning.” Item x1 will be interesting to track over the next couple years of CO-SEED’s presence at Haley.
Figure 2. Reports of student performance (module)From the Haley School CO-SEED educator surveys, 2003-04
1.0 1.5 2.0 2.5 3.0 3.5 4.0
Reports of student performance module consists of ten items measuring student engagement in
learning, academic achievement, civic engagement, stewardship behavior, and satisfaction with school.
Scale: Strongly disagree = 1, to strongly agree = 4
2
4
6
8
Freq
uenc
yS
cale
: Num
ber o
f tea
cher
s
resp
ondi
ng a
t eac
h le
vel o
f agr
eem
ent

Haley Survey Results, 2003-04 CO-SEED Evaluation page 5
Results and Discussion of Student Surveys The Haley School’s student survey modules (Table 2) covered three main areas. Students tended to slightly agree with statements about their own engagement (with their community and with learning). They also reported experiencing a minor attachment to place. Student reports of use of local resources are suggestive (but not definitive) of early positive effects of CO-SEED on this outcome. The surveys were administered to students in late April, 2004, eight months after Project CO-SEED began at the Haley School. Therefore, the results do not strictly reflect baseline student responses, but rather are more likely to illustrate very early effects of CO-SEED.
Table 2. Summary of Data for 2003-2004 CO-SEED Haley School Student Surveys
Variable (items included)
# of items incl.
N _ X SD
Use of local resources (L module = l1,l2,l4,l5)
4 65 2.7 .85
Use of local places (llp index = l1,l4) 2 52 2.5 1.00 Use of local people (llpeop index = l2,l5) 2 65 2.9 .97
Student engagement: civic & learning (C module=c1,c2.c3,c4,c5,c6,c7,c8,c9,c10,c11,c12,c13,c14,c15)
15 66 2.9 .52
Connection to community (ccc index = c1,c2,c7) 3 65 3.0 .73 Self-efficacy (cse index = c5,c8) 2 63 2.8 .93
Social responsibility (csr index = c3,c4,c6,c9) 4 66 3.3 .48 Enthusiasm for learning (cel index=c10,c11,c12,c15) 4 66 2.7 .74
Stewardship behavior (csb index = c13,c14) 2 62 2.5 1.11
Student attachment to place (N module=n1,n2,n3,n4,n5,n6,n7,n8,l1,l2,l4,l5,c1,c2,c7)
15 66 2.8 .54
Learning through local resources (nlr index=l1,l2,l4,l5) 4 65 2.7 .85 Time spent outdoors (nto index = n1,n2,n6) 3 64 2.7 .88
Understanding of place (nup index = n3,n5,n7) 3 63 2.8 .82 Overall affect about place (noa index=n4,n8,c1,c2,c7) 5 66 2.9 .69
Items not included in student indices or modules -- -- -- -- CO-SEED helps me get better grades (item=x10) 1 50 3.2 1.0
Satisfied with quality of school (item = x6) 1 61 3.3 .88 School is environmentally healthy (item = w2) 1 56 2.7 .75 Community is environmentally healthy (item=y4) 1 55 2.8 .89
NOTE: Table row shading loosely represents the level of data reduction, i.e. modules are light gray. N = sample size; X = mean; M = median; SD = standard deviation
Haley Survey Results, 2003-04 CO-SEED Evaluation page 6
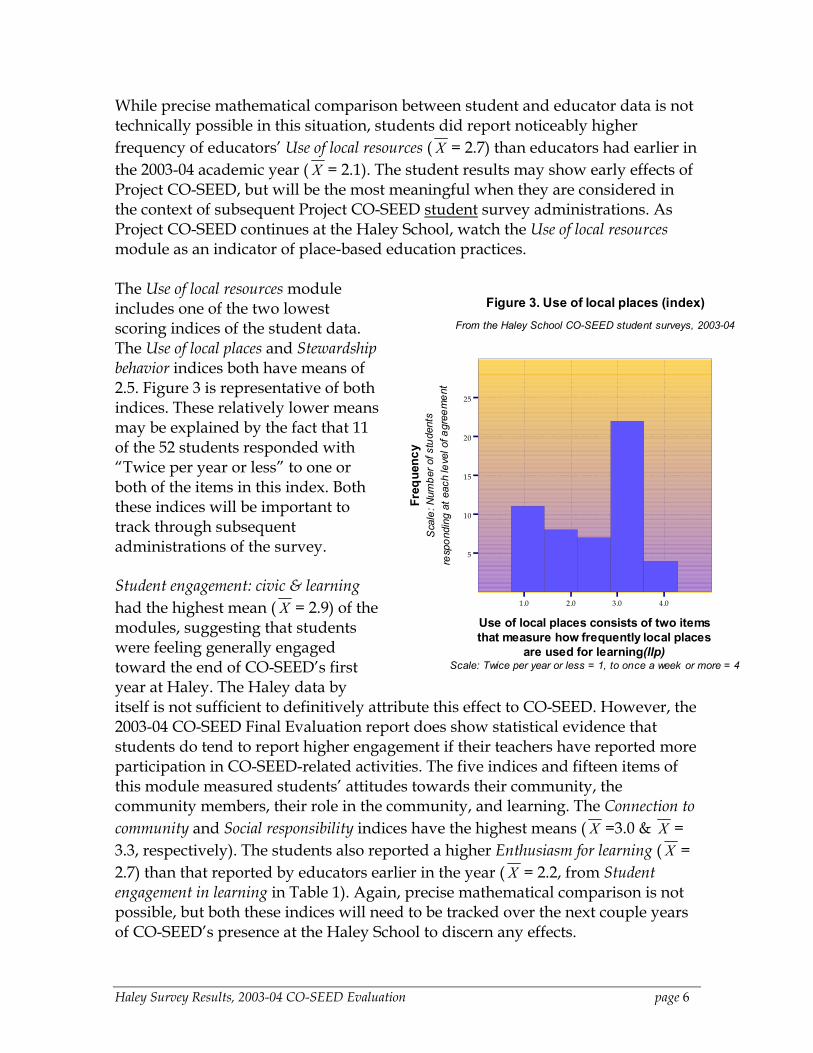
While precise mathematical comparison between student and educator data is not technically possible in this situation, students did report noticeably higher frequency of educators’ Use of local resources ( X = 2.7) than educators had earlier in the 2003-04 academic year ( X = 2.1). The student results may show early effects of Project CO-SEED, but will be the most meaningful when they are considered in the context of subsequent Project CO-SEED student survey administrations. As Project CO-SEED continues at the Haley School, watch the Use of local resources module as an indicator of place-based education practices. The Use of local resources module includes one of the two lowest scoring indices of the student data. The Use of local places and Stewardship behavior indices both have means of 2.5. Figure 3 is representative of both indices. These relatively lower means may be explained by the fact that 11 of the 52 students responded with “Twice per year or less” to one or both of the items in this index. Both these indices will be important to track through subsequent administrations of the survey. Student engagement: civic & learning had the highest mean ( X = 2.9) of the modules, suggesting that students were feeling generally engaged toward the end of CO-SEED’s first year at Haley. The Haley data by itself is not sufficient to definitively attribute this effect to CO-SEED. However, the 2003-04 CO-SEED Final Evaluation report does show statistical evidence that students do tend to report higher engagement if their teachers have reported more participation in CO-SEED-related activities. The five indices and fifteen items of this module measured students’ attitudes towards their community, the community members, their role in the community, and learning. The Connection to community and Social responsibility indices have the highest means ( X =3.0 & X = 3.3, respectively). The students also reported a higher Enthusiasm for learning ( X = 2.7) than that reported by educators earlier in the year ( X = 2.2, from Student engagement in learning in Table 1). Again, precise mathematical comparison is not possible, but both these indices will need to be tracked over the next couple years of CO-SEED’s presence at the Haley School to discern any effects.
Figure 3. Use of local places (index)From the Haley School CO-SEED student surveys, 2003-04
1.0 2.0 3.0 4.0
Use of local places consists of two itemsthat measure how frequently local places
are used for learning(llp)Scale: Twice per year or less = 1, to once a week or more = 4
5
10
15
20
25
Freq
uenc
yS
cale
: Num
ber o
f stu
dent
sre
spon
ding
at e
ach
leve
l of a
gree
men
t

Haley Survey Results, 2003-04 CO-SEED Evaluation page 7
As Project CO-SEED continues at the Haley School, Student attachment to place and its four indices will be things to watch for potential increases. Students’ Overall affect about place is the highest of the indices ( X = 2.9). As their dose of CO-SEED and place-based education increases, Learning through local resources, Time spent outdoors, and Understanding of place may increase as well. Two noteworthy items were not included in the indices or modules. Item x6 read “My school is good at academics (literacy, math, science, social studies)” and, along with Social Responsibility, had the highest mean reported ( X = 3.3). Item x10 does not, however, carry as much statistical weight as an index or module because it is the measure of only a single item and there is an increased chance of statistical error. Nonetheless, it is still a strikingly high result ( X = 3.2). Item x10 read “The CO-SEED program helps me do better on tests and get better grades.” The results for item x10 are displayed in Figure 4.
Figure 4. CO-SEEDhelps me get better grades (item x10)
From the Haley School CO-SEED student surveys, 2003-04
1 2 3 4
CO-SEED helps me getbetter grades is a single item(item x10)
Scale: Strongly disagree = 1, to strongly agree = 4
5
10
15
20
25
Freq
uenc
yS
cale
: Num
ber o
f stu
dent
sre
spon
ding
at e
ach
leve
l of a
gree
men
t
Haley Survey Results, 2003-04 CO-SEED Evaluation page 8
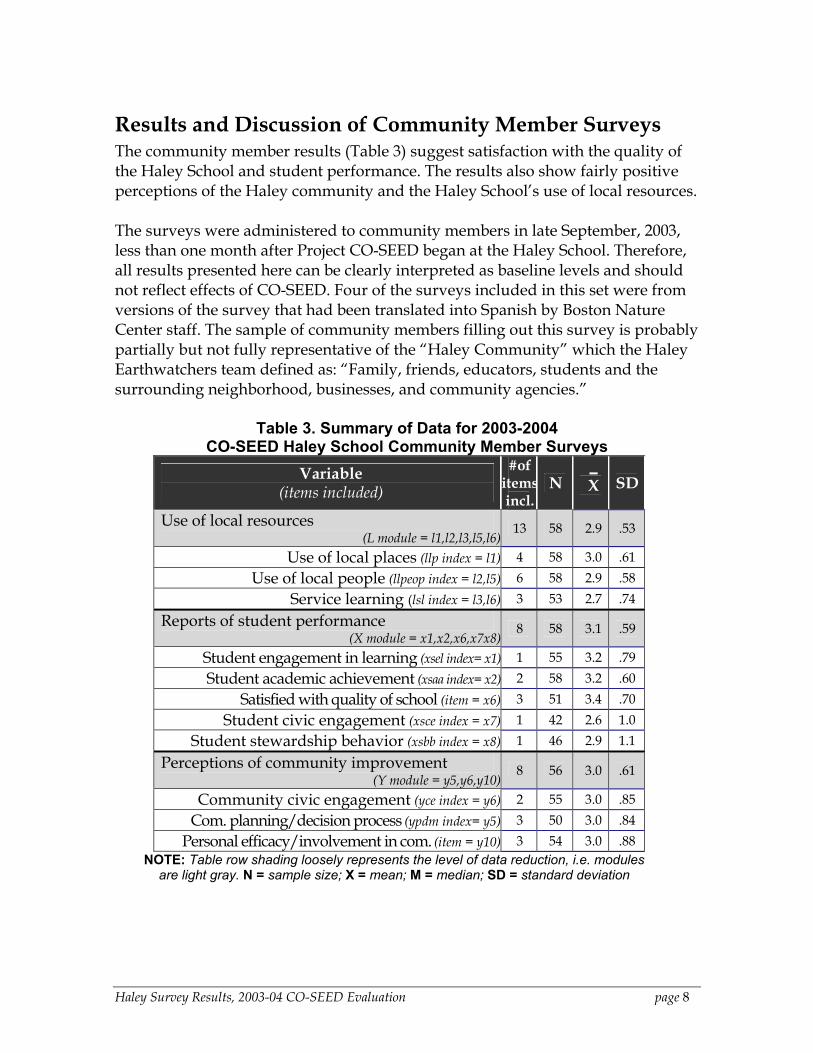
Results and Discussion of Community Member Surveys The community member results (Table 3) suggest satisfaction with the quality of the Haley School and student performance. The results also show fairly positive perceptions of the Haley community and the Haley School’s use of local resources. The surveys were administered to community members in late September, 2003, less than one month after Project CO-SEED began at the Haley School. Therefore, all results presented here can be clearly interpreted as baseline levels and should not reflect effects of CO-SEED. Four of the surveys included in this set were from versions of the survey that had been translated into Spanish by Boston Nature Center staff. The sample of community members filling out this survey is probably partially but not fully representative of the “Haley Community” which the Haley Earthwatchers team defined as: “Family, friends, educators, students and the surrounding neighborhood, businesses, and community agencies.”
Table 3. Summary of Data for 2003-2004 CO-SEED Haley School Community Member Surveys
Variable (items included)
#of itemsincl.
N _ X SD
Use of local resources (L module = l1,l2,l3,l5,l6)
13 58 2.9 .53
Use of local places (llp index = l1) 4 58 3.0 .61 Use of local people (llpeop index = l2,l5) 6 58 2.9 .58
Service learning (lsl index = l3,l6) 3 53 2.7 .74
Reports of student performance (X module = x1,x2,x6,x7x8)
8 58 3.1 .59
Student engagement in learning (xsel index= x1) 1 55 3.2 .79 Student academic achievement (xsaa index= x2) 2 58 3.2 .60
Satisfied with quality of school (item = x6) 3 51 3.4 .70 Student civic engagement (xsce index = x7) 1 42 2.6 1.0
Student stewardship behavior (xsbb index = x8) 1 46 2.9 1.1
Perceptions of community improvement (Y module = y5,y6,y10)
8 56 3.0 .61
Community civic engagement (yce index = y6) 2 55 3.0 .85 Com. planning/decision process (ypdm index= y5) 3 50 3.0 .84
Personal efficacy/involvement in com. (item = y10) 3 54 3.0 .88 NOTE: Table row shading loosely represents the level of data reduction, i.e. modules
are light gray. N = sample size; X = mean; M = median; SD = standard deviation

Haley Survey Results, 2003-04 CO-SEED Evaluation page 9
The comparatively high means found in Table 3 may be due to the fact that community members sampled happen to be the more involved and/or supportive parents. The survey was administered at an evening function at the school. The Haley School may need to reach farther out into the community to more compellingly test CO-SEED’s effect on the community. The Use of local resources module suggests that community members tend to believe ( X = 2.9) that students use local resources for learning. This establishes a relatively high baseline for future comparison. The lowest index of this module, Service learning ( X = 2.7), included two items: Item l3 read “Our schools regularly engage students in community-based schoolwork.” Item l6 read “Youth in my community regularly participate in volunteer activities.”
The Reports of student performance module (Figure 5) had the highest mean ( X = 3.1) of the three modules. As a consequence of mapping the older version of the survey to the newer version, all the indices within this module are comprised of only one item. While these results provide a sense of baseline perceptions, caution should be taken to not attribute too much weight to them because single item analysis is prone to statistical error. In general, the indices show relatively high satisfaction with students’ engagement and achievement. The highest index reported was Satisfied with quality of school ( X = 3.4). Student civic engagement, the lowest index ( X = 2.6), was measured by
item x7, which read “Youth in my community regularly participate in community affairs such as town meeting day or town commissions.”
The Perceptions of community improvement module ( X = 3.0) and its indices showed consistent, moderately high results. The Community engagement, Community Planning/decision process, and Personal efficacy/involvement in community indices all have the same means ( X = 3.0). These results suggest community members believe there is a relatively high level of community involvement.
Figure 5. Reports of student performance (module)From the Haley School CO-SEED community member surveys, 2003-0
1.5 2.0 2.5 3.0 3.5 4.0
Reports of student performance moduleconsists of five items that measure student
engagement in learning, academicachievement, civic engagement, stewardship
behavior, and satisfaction with school.Scale: Strongly disagree = 1, to strongly agree = 4
0
5
10
15
Freq
uenc
yS
cale
: Num
ber o
f com
mun
ity m
embe
rs
resp
ondi
ng a
t eac
h le
vel o
f agr
eem
ent

Haley Survey Results, 2003-04 CO-SEED Evaluation page 10
Concluding Remarks There are two contexts within which all three sets of results (educator, student, and community members) should be considered. First, the results should be considered in terms of when surveys were administered. Educator and community member results were both from surveys administered about one month after Project CO-SEED began at the Haley School. As such, they are results that should provide a good baseline for future comparison and should also show no to minimal effects of CO-SEED. Student results, however, were calculated from surveys administered eight months after CO-SEED began, and thus may be indicators of very early effects of CO-SEED. The second context is how the group of people who filled out the surveys (the sample) compares to the larger group that we are trying to learn about (the population). Educator and student results were compiled from a nearly complete census of the total population. Community member results, contrastingly, were compiled from a relatively small portion of the total population of community members. This means that we need to be more careful about drawing conclusions from the community member survey results. Most importantly, there are appropriate and inappropriate ways to use these results. These descriptive survey results of a single site at the beginning of its work with CO-SEED should not be used to verify or disprove CO-SEED’s effects. Drawing conclusions about the effects of CO-SEED from survey data like this requires comparison to other sample groups, whether that be comparable groups from other schools, or these same Haley School groups after some time has passed. The correct use of these results is to search for areas in which the Haley School may be commended, for areas in which it can improve, and to stimulate questions and curiosity about what is really happening with CO-SEED at the Haley School.

Haley Survey Results, 2003-04 CO-SEED Evaluation page 11
APPENDIX NOTE: The Appendix contains the item level (i.e. individual survey question)
results from the educator, student, and community member surveys. The Appendix should be used with two thoughts in mind. First, the educator and community member surveys were completed using older versions. Some items of the newer versions of the survey have been left blank as a consequence of mapping the older versions onto the newer versions. Second, item level data should be used with caution. It does not contain the same level of statistical certainty as index or module level data because it is more prone to statistical error. The advantage of item level data, though, is that it shows what the survey respondents actually wrote, without making further assumptions about the broader idea (i.e. index or module) that that item is supposed to represent. The Appendix data is taken directly from our web-based survey administration and data access system. Program staff are encouraged to use this on-line resource to look at this item level data further, playing with it and exploring it in various combinations in order to raise questions and/or triangulate impressions that program staff have from other data or first hand experience. The web-based survey system has tools for filtering and looking at detail or summary views of the data. Access to this resource can be obtained through the CO-SEED staff person. Finally, several items that show 100% of respondents choosing the “n/a or not sure” response. These are items that are in the newer versions of surveys but were not in the older versions of surveys.
Haley Survey Results, 2003-04 CO-SEED Evaluation page 12
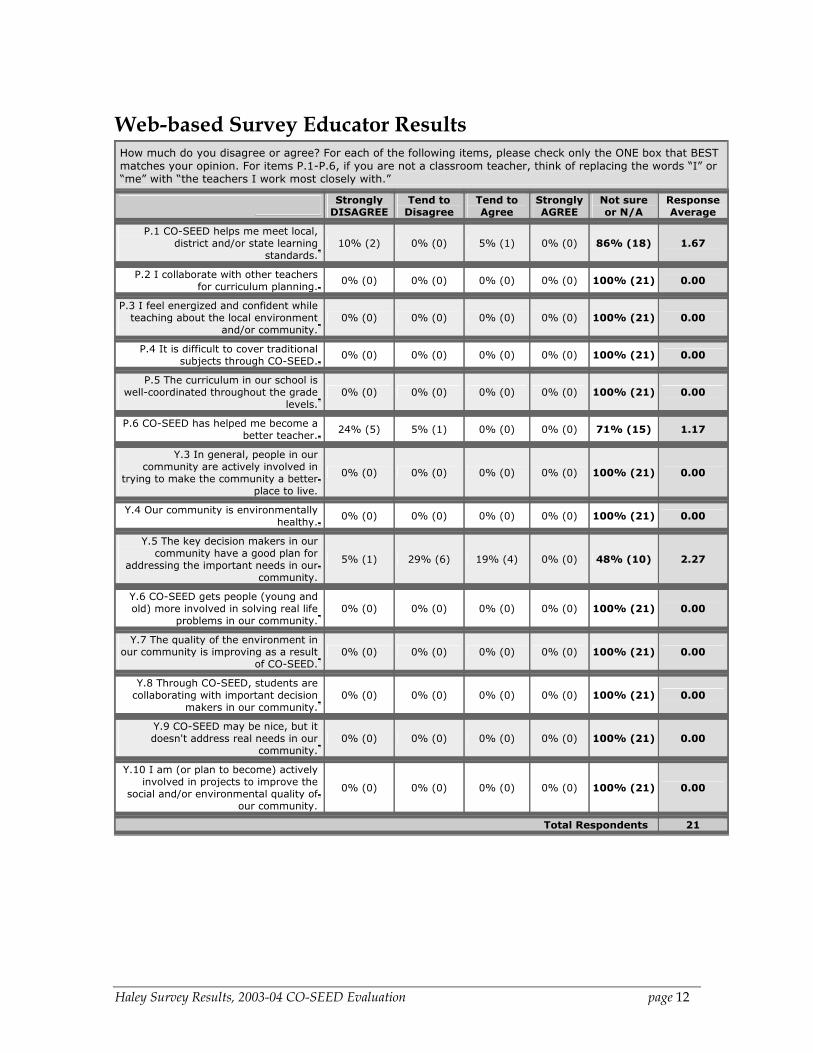
Web-based Survey Educator Results How much do you disagree or agree? For each of the following items, please check only the ONE box that BEST matches your opinion. For items P.1-P.6, if you are not a classroom teacher, think of replacing the words “I” or “me” with “the teachers I work most closely with.”
Strongly
DISAGREE Tend to
Disagree Tend to Agree
Strongly AGREE
Not sure or N/A
Response Average
P.1 CO-SEED helps me meet local,district and/or state learning
standards. 10% (2) 0% (0) 5% (1) 0% (0) 86% (18) 1.67
P.2 I collaborate with other teachersfor curriculum planning. 0% (0) 0% (0) 0% (0) 0% (0) 100% (21) 0.00
P.3 I feel energized and confident whileteaching about the local environment
and/or community. 0% (0) 0% (0) 0% (0) 0% (0) 100% (21) 0.00
P.4 It is difficult to cover traditionalsubjects through CO-SEED. 0% (0) 0% (0) 0% (0) 0% (0) 100% (21) 0.00
P.5 The curriculum in our school iswell-coordinated throughout the grade
levels. 0% (0) 0% (0) 0% (0) 0% (0) 100% (21) 0.00
P.6 CO-SEED has helped me become abetter teacher. 24% (5) 5% (1) 0% (0) 0% (0) 71% (15) 1.17
Y.3 In general, people in ourcommunity are actively involved in
trying to make the community a betterplace to live.
0% (0) 0% (0) 0% (0) 0% (0) 100% (21) 0.00
Y.4 Our community is environmentallyhealthy. 0% (0) 0% (0) 0% (0) 0% (0) 100% (21) 0.00
Y.5 The key decision makers in ourcommunity have a good plan for
addressing the important needs in ourcommunity.
5% (1) 29% (6) 19% (4) 0% (0) 48% (10) 2.27
Y.6 CO-SEED gets people (young andold) more involved in solving real life
problems in our community. 0% (0) 0% (0) 0% (0) 0% (0) 100% (21) 0.00
Y.7 The quality of the environment inour community is improving as a result
of CO-SEED. 0% (0) 0% (0) 0% (0) 0% (0) 100% (21) 0.00
Y.8 Through CO-SEED, students arecollaborating with important decision
makers in our community. 0% (0) 0% (0) 0% (0) 0% (0) 100% (21) 0.00
Y.9 CO-SEED may be nice, but itdoesn't address real needs in our
community. 0% (0) 0% (0) 0% (0) 0% (0) 100% (21) 0.00
Y.10 I am (or plan to become) activelyinvolved in projects to improve the
social and/or environmental quality ofour community.
0% (0) 0% (0) 0% (0) 0% (0) 100% (21) 0.00
Total Respondents 21

Haley Survey Results, 2003-04 CO-SEED Evaluation page 13
How much do you disagree or agree? For each of the following items, please check only the ONE box that BEST matches your opinion. Items X.1-X.12 refer to the group of students that you know best or work most closely with in your school or project
Strongly
DISAGREE Tend to
Disagree Tend to Agree
Strongly AGREE
Not sure or N/A
Response Average
X.1 Our students are enthusiasticabout learning. 19% (4) 43% (9) 29% (6) 5% (1) 5% (1) 2.20
X.2 CO-SEED may be nice, but itdoesn't really improve student
academic achievement. 0% (0) 14% (3) 43% (9) 14% (3) 29% (6) 3.00
X.3 Through their schoolwork,students gain a sense of
responsibility for improving the localcommunity and environment.
0% (0) 19% (4) 43% (9) 24% (5) 14% (3) 3.06
X.4 Through their schoolwork,students regularly take action to
protect and improve theenvironment.
0% (0) 0% (0) 38% (8) 48% (10) 14% (3) 3.56
X.5 Students prefer CO-SEED-styleactivities to more traditional-style
school activities. 0% (0) 0% (0) 0% (0) 0% (0) 100% (21) 0.00
X.6 I am satisfied with the quality ofeducation in our school. 5% (1) 19% (4) 48%
(10) 24% (5) 5% (1) 2.95 X.7 Students have a strong
connection to the community whereour school is located.
5% (1) 52% (11) 14% (3) 5% (1) 24% (5) 2.25
X.8 At home or outside of school,students regularly take action to
protect and improve theenvironment.
0% (0) 0% (0) 0% (0) 0% (0) 100% (21) 0.00
X.9 Standardized test scores are anaccurate indicator of student
academic achievement. 0% (0) 0% (0) 0% (0) 0% (0) 100% (21) 0.00
X.10 CO-SEED helps studentsincrease their scores on standardized
tests. 0% (0) 0% (0) 0% (0) 0% (0) 100% (21) 0.00
X.11 CO-SEED is particularlybeneficial for students with learning
challenges. 0% (0) 0% (0) 0% (0) 0% (0) 100% (21) 0.00
X.12 Students are self-directed intheir work on the CO-SEED project. 0% (0) 0% (0) 0% (0) 0% (0) 100% (21) 0.00
W.1 Our school staff shares acommon vision for education about
the environment and community. 0% (0) 0% (0) 0% (0) 0% (0) 100% (21) 0.00
W.2 Our school is environmentallyhealthy. 0% (0) 0% (0) 0% (0) 0% (0) 100% (21) 0.00
W.3 The sense of community withinour school is fairly weak or non-
existent. 0% (0) 0% (0) 0% (0) 0% (0) 100% (21) 0.00
W.4 Our school is active in naturalresource conservation (water,energy, soil, air, solid waste).
0% (0) 0% (0) 0% (0) 0% (0) 100% (21) 0.00
Total Respondents 21

Haley Survey Results, 2003-04 CO-SEED Evaluation page 14
How often do these things happen? For each of the following items, please check only the ONE box that BEST matches your opinion. Items L.1-L.6 refer to the classrooms that you know best or work most closely with
Two days per year or less
Three to six days per year
About one day a month
One day a week or
more Not sure or N/A
Response Average
L.1 The school building and grounds(places outside of the classrooms)
are used as places for learning. 5% (1) 29% (6) 33% (7) 14% (3) 19% (4) 2.71
L.2 Parents and/or other communitymembers work directly with students
on school-related projects. 0% (0) 29% (6) 48% (10) 19% (4) 5% (1) 2.90
L.3 As part of school, students workon real-world problems in their
community, school buildings and/orschool yard.
19% (4) 43% (9) 5% (1) 5% (1) 29% (6) 1.93
L.4 The content of classroomassignments and homework isdirectly connected to the local
natural and/or urban environment. 24% (5) 52% (11) 10% (2) 5% (1) 10% (2) 1.95
L.5 Students learn about and/orinteract with local cultural heritage,
history and people through theirschoolwork.
10% (2) 52% (11) 19% (4) 0% (0) 19% (4) 2.12
L.6 Students do communityvolunteering and/or service-learning
work to satisfy their educationalrequirements.
0% (0) 0% (0) 0% (0) 0% (0) 100% (21) 0.00
Total Respondents 21
For how many school years have you been working in this school? (count the current school year as one)
Response Percent
Response Total
a. first year here 28.6% 6
b. 2-3 years 9.5% 2
c. 4-5 years 4.8% 1
d. 6 or more years 57.1% 12 Total Respondents 21

Haley Survey Results, 2003-04 CO-SEED Evaluation page 15
What subject do you teach:
Response Percent
Response Total
a. not a teacher/ doesn’t apply tome 4.8% 1
b. elementary classroom,integrated 42.9% 9
c. math 0% 0
d. science 4.8% 1
e. social studies/ history 0% 0
f. English 0% 0
g. foreign language 0% 0
h. physical education or health 0% 0
i. art or music technology 4.8% 1
k. After school or other non-formaleducation project leader 4.8% 1
j. other (please specify in the boxbelow) 38.1% 8
Total Respondents 21
My role in the school is:
Response Percent
Response Total
a. specialist 33.3% 7
b. student aide or paraprofessional 0% 0
c. administrator 4.8% 1
d. classroom teacher:elementary 52.4% 11
e. classroom teacher: middle school 0% 0
f. classroom teacher: high school 0% 0
g. other (please specify in the boxbelow) 9.5% 2
Total Respondents 21

Haley Survey Results, 2003-04 CO-SEED Evaluation page 16
Web-based Survey Student Results How much do you disagree or agree? For each of the following items, please check only the ONE box that BEST matches your opinion.
Strongly
DISAGREE Tend to
Disagree Tend to Agree
Strongly AGREE
Not sure or N/A
Response Average
W.2 Our school is environmentallyhealthy. 5% (3) 27% (18) 44%
(29) 9% (6) 15% (10) 2.68 Y.4 Our community is environmentally
healthy. 6% (4) 27% (18) 32% (21) 18% (12) 17% (11) 2.75
C.1 I feel like I am part of a community. 9% (6) 15% (10) 15% (10) 39% (26) 21% (14) 3.08
C.2 I pay attention to news events thataffect the community. 8% (5) 15% (10) 35%
(23) 32% (21) 11% (7) 3.02 C.3 Doing something that helps others is
important to me. 2% (1) 3% (2) 38% (25) 48% (32) 9% (6) 3.47
C.4 I like to help other people, even if itis hard work. 3% (2) 15% (10) 36% (24) 39%
(26) 6% (4) 3.19 C.5 I know what I can do to help make
the community a better place. 11% (7) 12% (8) 32% (21) 30% (20) 15% (10) 2.96
C.6 Helping other people is somethingeveryone should do, including myself. 3% (2) 2% (1) 27% (18) 65%
(43) 3% (2) 3.59 C.7 I know a lot of people in thecommunity, and they know me. 9% (6) 17% (11) 20% (13) 45%
(30) 9% (6) 3.12 C.8 I feel like I can make a difference in
the community. 11% (7) 24% (16) 24% (16) 26% (17) 15% (10) 2.77
C.9 I try to think of ways to help otherpeople. 5% (3) 11% (7) 50%
(33) 26% (17) 9% (6) 3.07 C.11 I like it when I get to be absent on
a regular school day. 26% (17) 20% (13) 15% (10) 32% (21) 8% (5) 2.57
C.12 On my own time, I often study orread extra about the topics we’re
working on at school. 20% (13) 27% (18) 38%
(25) 9% (6) 6% (4) 2.39
C.13 In the last two months I have donesomething WITH MY CLASSMATES to
take care of my neighborhood orcommunity.
21% (14) 12% (8) 17% (11) 35% (23) 15% (10) 2.77
C.14 In the last two months I have donesomething ON MY OWN TIME to take
care of my neighborhood or community. 38% (25) 9% (6) 24% (16) 14% (9) 15% (10) 2.16
C.15 I enjoy learning about theenvironment and my community. 14% (9) 17% (11) 39%
(26) 23% (15) 8% (5) 2.77 X.6 My school is good at academics
(literacy, math, science, social studies). 6% (4) 8% (5) 32% (21) 47% (31) 8% (5) 3.30
X.10 Community mapping projects helpme do better on tests and get better
grades. 9% (6) 8% (5) 17% (11) 42%
(28) 24% (16) 3.22
Total Respondents 66

Haley Survey Results, 2003-04 CO-SEED Evaluation page 17
How often do these things happen? For each of the following items, please check only the ONE box that BEST matches you do or see the things described.
Two days per year or less
Three to six days per year
About one day a month
One day a week or
more Not sure or N/A
Response Average
L.1 The school building andgrounds (places outside of the
classrooms) are used as places forlearning.
20% (13) 8% (5) 29% (19) 12% (8) 32% (21) 2.49
L.2 Parents and/or othercommunity members work directly
with students on school-relatedprojects.
15% (10) 9% (6) 21% (14) 18% (12) 36% (24) 2.67
L.4 Our classroom assignments andhomework are about nearby nature
and/or the city where we live. 11% (7) 17% (11) 18% (12) 17% (11) 38% (25) 2.66
L.5 In my school, we learn aboutlocal people, culture and history. 12% (8) 9% (6) 20% (13) 47% (31) 12% (8) 3.16
L.6 Students in our school docommunity volunteering and/or
service-learning work to satisfy oureducational requirements.
0% (0) 0% (0) 0% (0) 0% (0) 100% (66) 0.00
N.1 I visit parks, playgrounds,forests, creeks, ponds or other
natural areas BY MYSELF. 18% (12) 14% (9) 12% (8) 21% (14) 35% (23) 2.56
N.2 I visit parks, playgrounds,forests, creeks, ponds or other
natural areas WITH MY FRIENDS,FAMILY, OR AS PART OF A GROUP.
17% (11) 12% (8) 21% (14) 35% (23) 15% (10) 2.88
N.3 As I go about my day, I noticeplants and animals that I know a
lot about. 12% (8) 11% (7) 30% (20) 24% (16) 23% (15) 2.86
N.4 I think to myself that I am gladto live in this community. 24% (16) 9% (6) 21% (14) 29% (19) 17% (11) 2.65
N.5 I stop and think about howthings that I do are going to affectnature and the people around me.
11% (7) 20% (13) 26% (17) 21% (14) 23% (15) 2.75
N.6 I spend almost the whole dayinside buildings, cars or buses. 18% (12) 21% (14) 9% (6) 23% (15) 29% (19) 2.51
N.7 I share my opinions about whatshould be done to take care of the
community where I live. 17% (11) 17% (11) 26% (17) 17% (11) 24% (16) 2.56
N.8 I feel good about what thiscommunity will be like in the future
when I am grown up. 14% (9) 12% (8) 20% (13) 35% (23) 20% (13) 2.94
Total Respondents 66

Haley Survey Results, 2003-04 CO-SEED Evaluation page 18
This is how I feel about school:
Response Percent
Response Total
a. I do not enjoy school and whatI’m learning is not important to me. 6.1% 4
b. Sometimes I learn useful things
in school, but usually what I learn isnot that important. 6.1% 4
c. I learn something important onmost days. I can usually see howmost of what I learn at school will
be useful in my life. 28.8% 19
d. Almost everything I learn isimportant and useful. I enjoylearning at school every day. 37.9% 25
e. I’m not sure 21.2% 14 Total Respondents 66
Your grade:
Response Percent
Response Total
4 62.1% 41
5 37.9% 25 Total Respondents 66
Your gender:
Response Percent
Response Total
Male 51.5% 34
Female 48.5% 32 Total Respondents 66
Haley Survey Results, 2003-04 CO-SEED Evaluation page 19
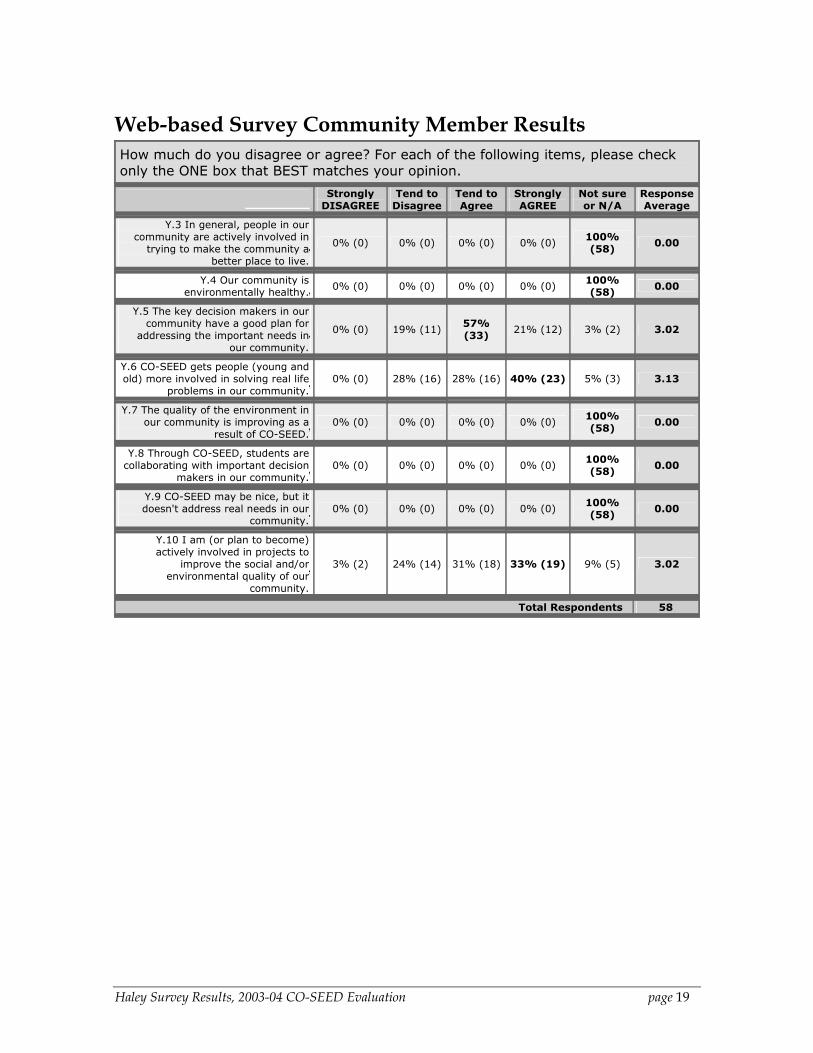
Web-based Survey Community Member Results How much do you disagree or agree? For each of the following items, please check only the ONE box that BEST matches your opinion.
Strongly
DISAGREE Tend to
Disagree Tend to Agree
Strongly AGREE
Not sure or N/A
Response Average
Y.3 In general, people in ourcommunity are actively involved in
trying to make the community abetter place to live.
0% (0) 0% (0) 0% (0) 0% (0) 100% (58) 0.00
Y.4 Our community isenvironmentally healthy. 0% (0) 0% (0) 0% (0) 0% (0) 100%
(58) 0.00 Y.5 The key decision makers in our
community have a good plan foraddressing the important needs in
our community. 0% (0) 19% (11) 57%
(33) 21% (12) 3% (2) 3.02
Y.6 CO-SEED gets people (young andold) more involved in solving real life
problems in our community. 0% (0) 28% (16) 28% (16) 40% (23) 5% (3) 3.13
Y.7 The quality of the environment inour community is improving as a
result of CO-SEED. 0% (0) 0% (0) 0% (0) 0% (0) 100%
(58) 0.00
Y.8 Through CO-SEED, students arecollaborating with important decision
makers in our community. 0% (0) 0% (0) 0% (0) 0% (0) 100%
(58) 0.00
Y.9 CO-SEED may be nice, but itdoesn't address real needs in our
community. 0% (0) 0% (0) 0% (0) 0% (0) 100%
(58) 0.00
Y.10 I am (or plan to become)actively involved in projects to
improve the social and/orenvironmental quality of our
community. 3% (2) 24% (14) 31% (18) 33% (19) 9% (5) 3.02
Total Respondents 58

Haley Survey Results, 2003-04 CO-SEED Evaluation page 20
How much do you disagree or agree? For each of the following items, please check only the ONE box that BEST matches your opinion. Items X.1-X.12 refer to the group of students that you know best or work most closely with in your school or project
Strongly
DISAGREE Tend to
Disagree Tend to Agree
Strongly AGREE
Not sure or N/A
Response Average
X.1 Our students are enthusiastic aboutlearning. 3% (2) 10% (6) 41%
(24) 40% (23) 5% (3) 3.24 X.2 CO-SEED may be nice, but it
doesn't really improve student academicachievement.
22% (13) 64% (37) 7% (4) 2% (1) 5% (3) 1.87
X.3 Through their schoolwork, studentsgain a sense of responsibility for
improving the local community andenvironment.
0% (0) 0% (0) 0% (0) 0% (0) 100% (58) 0.00
X.4 Through their schoolwork, studentsregularly take action to protect and
improve the environment. 0% (0) 0% (0) 0% (0) 0% (0) 100%
(58) 0.00
X.5 Students prefer CO-SEED-styleactivities to more traditional-style
school activities. 0% (0) 0% (0) 0% (0) 0% (0) 100%
(58) 0.00
X.6 I am satisfied with the quality ofeducation in our school. 2% (1) 19% (11) 43%
(25) 36% (21) 0% (0) 3.14 X.7 Students have a strong connectionto the community where our school is
located. 12% (7) 22% (13) 22%
(13) 16% (9) 28% (16) 2.57
X.8 At home or outside of school,students regularly take action to protect
and improve the environment. 14% (8) 14% (8) 21%
(12) 31% (18) 21% (12) 2.87
X.9 Standardized test scores are anaccurate indicator of student academic
achievement. 0% (0) 0% (0) 0% (0) 0% (0) 100%
(58) 0.00
X.10 CO-SEED helps students increasetheir scores on standardized tests. 0% (0) 0% (0) 0% (0) 0% (0) 100%
(58) 0.00 X.11 CO-SEED is particularly beneficialfor students with learning challenges. 0% (0) 0% (0) 0% (0) 0% (0) 100%
(58) 0.00 X.12 Students are self-directed in their
work on the CO-SEED project. 0% (0) 0% (0) 0% (0) 0% (0) 100% (58) 0.00
W.1 Our school staff shares a commonvision for education about theenvironment and community.
0% (0) 0% (0) 0% (0) 0% (0) 100% (58) 0.00
W.2 Our school is environmentallyhealthy. 0% (0) 0% (0) 0% (0) 0% (0) 100%
(58) 0.00 W.3 The sense of community within our
school is fairly weak or non-existent. 0% (0) 0% (0) 0% (0) 0% (0) 100% (58) 0.00
W.4 Our school is active in naturalresource conservation (water, energy,
soil, air, solid waste). 0% (0) 0% (0) 0% (0) 0% (0) 100%
(58) 0.00
Total Respondents 58

Haley Survey Results, 2003-04 CO-SEED Evaluation page 21
How often do these things happen? For each of the following items, please check only the ONE box that BEST matches your opinion. Items L.1-L.6 refer to the classrooms that you know best or work most closely with
Two days per year or less
Three to six days per year
About one day a
month One day a week or more
Not sure or N/A
Response Average
L.1 The school building and grounds(places outside of the classrooms) are
used as places for learning. 0% (0) 9% (5) 40% (23) 48%
(28) 3% (2) 3.41
L.2 Parents and/or other communitymembers work directly with students
on school-related projects. 2% (1) 7% (4) 34% (20) 57%
(33) 0% (0) 3.47
L.3 As part of school, students work onreal-world problems in their
community, school buildings and/orschool yard.
3% (2) 19% (11) 45% (26) 19% (11) 14% (8) 2.92
L.4 The content of classroomassignments and homework is directlyconnected to the local natural and/or
urban environment. 0% (0) 0% (0) 0% (0) 0% (0) 100%
(58) 0.00
L.5 Students learn about and/orinteract with local cultural heritage,
history and people through theirschoolwork.
0% (0) 17% (10) 52% (30) 28% (16) 3% (2) 3.11
L.6 Students do communityvolunteering and/or service-learning
work to satisfy their educationalrequirements.
10% (6) 28% (16) 19% (11) 16% (9) 28%
(16) 2.55
D.9 I go to the school building for apurpose other than picking up or
dropping off children. 12% (7) 28%
(16) 5% (3) 28% (16)
28% (16) 2.67
Total Respondents 58
Please check all of the following roles that apply to you:
Response Percent
Response Total
a. parent of current student(s) 93.1% 54
b. parent of former student(s) 0% 0
c. member of the CO-SEED team thatmeets monthly 0% 0
d. member of the PTSA or otherregular school committees 0% 0
e. volunteer in classrooms or fieldtrips this school year 0% 0
f. employee or representative of an
organization that is working with theschool on one or more projects this
school year 0% 0
g. have lived in this community for 0-10 years 0% 0
h. have lived in this community formore than 10 years 0% 0
i. none of the above 6.9% 4
Other (please specify) 0% 0 Total Respondents 58