supplementary figure 1. expression of bag3 protein in ... · supplementary figure 1. expression of...
TRANSCRIPT
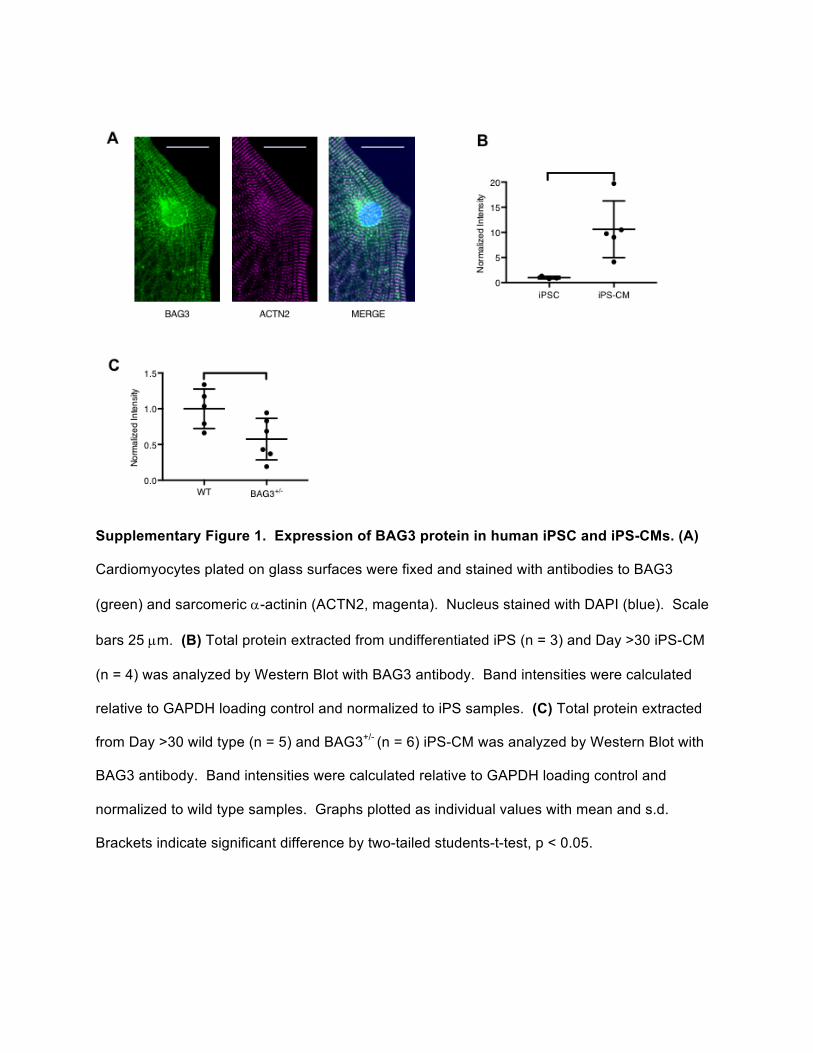
Supplementary Figure 1. Expression of BAG3 protein in human iPSC and iPS-CMs. (A)
Cardiomyocytes plated on glass surfaces were fixed and stained with antibodies to BAG3
(green) and sarcomeric a-actinin (ACTN2, magenta). Nucleus stained with DAPI (blue). Scale
bars 25 µm. (B) Total protein extracted from undifferentiated iPS (n = 3) and Day >30 iPS-CM
(n = 4) was analyzed by Western Blot with BAG3 antibody. Band intensities were calculated
relative to GAPDH loading control and normalized to iPS samples. (C) Total protein extracted
from Day >30 wild type (n = 5) and BAG3+/- (n = 6) iPS-CM was analyzed by Western Blot with
BAG3 antibody. Band intensities were calculated relative to GAPDH loading control and
normalized to wild type samples. Graphs plotted as individual values with mean and s.d.
Brackets indicate significant difference by two-tailed students-t-test, p < 0.05.

Supplementary Figure 2. Genotyping iPSC lines with targeted mutations. (A) PCR assays
were designed to detect the integration of the knockout vector at the BAG3 and MYBPC3 loci,
and the C-terminal FLAG tag at BAG3 locus. Primers were designed to detect the integration
junction of the transgene and the endogenous locus. A separate primer pair was used to detect

the wild type allele. pC represents a positive control plasmid for integration of the BAG3-
knockout vector (KO1). (B-C) Both alleles from heterozygous and homozygous KO2 lines were
amplified by PCR and cloned into TOPO-TA vector and sequenced. Both wild type and mutant
alleles are shown from BAG3+/- KO2 line demonstrating 17-bp deletion leading to a frameshift
with 18 aberrant amino acids followed by a stop codon in the mutant allele. Alleles from BAG3-/-
KO2 were indistinguishable, with homozygous duplication of 13 bp leading to a frameshift with
16 aberrant amino acids followed by a stop codon. (D) Copy number assay for 3xFLAG
sequence relative to RPP30 reference allele, using gDNA from the final iPSC BAG3-3xFLAG
clones. (E) Copy number assay for puromycin resistance sequence relative to RPP30 reference
allele, using gDNA from the final iPSC BAG3-3xFLAG clones.

Supplementary Figure 3. Karyotype of mutant iPSC lines. All isogenic derived lines
demonstrated normal 46 X,Y karyotype consistent with parental line.

Supplementary Figure 4. Mutant iPSC lines express pluripotency factors and efficiently
differentiate into cardiomyocytes. (A) Immunofluorescent staining of iPSC colonies with
antibodies to OCT4, SOX2, SSEA-4, and TRA1-81 in WT, BAG3-/- (KO1), and MYBPC3+/- lines.
Scale bars 200 µm. (B) iPS-CMs were collected at day 15 of differentiation (before lactate
purification) and assessed by flow cytometry with antibody staining for cardiac troponin-T
(TNNT). Individual samples graphed as percentage of cells positive for TNNT. (C)
Representative flow cytometry plots for TNNT from a typical BAG3-/- (KO1) iPS-CM

differentiation along with a negative control sample from a failed differentiation. The percentage
of cells in each quadrant is indicated.

Supplementary Figure 5. Quantification of myofibrillar disarray in BAG3-mutant
cardiomyocytes. (A) Example images for each category used to score myofibrillar integrity.
Class 1 and 2 represented uniformly intact myofibrils with the distinguishing factor being that
most myofibrils were aligned in parallel for class 1 (rarely seen). Class 3, 4, and 5 cells
represent myofibrillar fragmentation, disintegration, or aggregation in a progressively increasing
proportion of cell volume (3 < 50%, 4 ³ 50%, 5 = no visible myofibrils). Scale bars 50 µm. (B,C)
Distribution of scores in wild type and BAG3-mutant cell lines from two different targeting
strategies, (B) KO1, (C) KO2. Plotted as mean of biological replicates with box representing
interquartile range and whiskers min-max. Brackets indicate significant difference from wild
type by two-way ANOVA with Bonferroni’s test for multiple comparisons, p <0.05.

Supplementary Figure 6. BAG3 mutations produce contractile deficits in iPS-CMs
cultured on micro-patterned substrates with increased stiffness. Day >30 purified iPS-CMs
were cultured on micro-patterned polyacrylamide hydrogel substrates with a mechanical
stiffness of 35 kPa. BAG3 KO1 mutant lines were used. (A) Contraction power was calculated
from the measured force and contraction velocity determined by traction force microscopy from
the movement of fluorescent beads in the substrate. Results were normalized to wild type and
individual replicates plotted with mean and s.d. Brackets indicate significant difference by one-
way ANOVA with Bonferroni’s test for multiple comparisons, p < 0.001. (B) Sarcomere
shortening was measured in Lifeact-labeled myofibrils. Results were normalized to wild type and
individual replicates plotted with mean and s.d. Brackets indicate significant difference by two-
tailed students t-test, p < 0.05. Measurements were obtained from three independent device
cultures, with 11-47 cells analyzed per line for force measurement and 7-8 cells analyzed per
line for sarcomere shortening measurement.

Supplementary Figure 7. Effect of proteasome inhibitors on WT iPS-CM contractility. (A–
B) Contractility was measured before and after varying doses of bortezomib or carfilzomib using
the Cellogy Pulse system. Contractility index represents the contraction peak height at each
time point normalized to the baseline value for each well. Measurements were obtained every
24 h for 5 days, with cells exposed to drug for the first 48 h. Shown are mean and s.e.m. of
triplicate wells. (C) Contractility was measured for wild type and BAG3 mutant (KO1) iPS-CM
during and after exposure to DMSO vehicle control.

Supplementary Figure 8. BAG3 mutant iPS-CMs have a positive chronotropic response
to adrenergic stimulation without loss of contractility. (A–D) Lactate-purified > day 30 iPS-
CMs were treated with PBS, 10 µM norepinephrine, 1 µM isoproterenol, or 10 µM
phenylephrine. Contractile motion was measured on a Cellogy Pulse system at baseline and 1 h
after addition of drug. Norepinephrine was dosed daily for 5 consecutive days; results from
days 1 and 5 are shown. Individual replicates are graphed (3-8) with mean and s.d. of
normalized beat rate or contractility index. Brackets indicate significant difference from PBS
control by two-way ANOVA with Bonferroni’s test for multiple comparisons, p < 0.05.

Supplementary Figure 9. Dose-response assay for cardiomyocyte viability after
chemotherapy drug exposure. Wild type, BAG3-mutant (KO2), and MYBPC3 mutant day >30
iPS-CM were treated with (A) bortezomib, (B) carfilzomib, or (C) doxorubicin at the doses
indicated for 48 hours. Cells were allowed to recover for 5 days in basal media, after which
viability was measured with a PrestoBlue resazurin assay. Relative fluorescent units were
normalized to wells treated with vehicle only. Mean and s.e.m. are plotted for triplicate samples
at each dose. Lower graphs represent the calculated LD50 and 95% confidence interval from
each corresponding dose response curve using non-linear regression analysis. LD50 values
not shown for carfilzomib as they were not able to be accurately calculated for all lines.
Brackets indicate significant differences by one-way ANOVA with Bonferroni’s test for multiple
comparisons, p < 0.05.

Supplementary Figure 10. Genome engineering a 3X-FLAG affinity tag in the
endogenous BAG3 locus of WTc human iPSC. (A) Schematic of the BAG3 gene with four
exons in the predominant coding isoform. CRISPR-Cas9 and gRNA was designed to target
near the BAG3 stop codon (open triangle). The targeting vector included flanking left and right
homology arms (LH and RH, respectively) with the 3x-FLAG tag (FL) followed by selection
cassette flanked by loxP sites (black triangles). The selection cassette contained mCherry (FP)
and puromycin resistance genes (PR) driven by CAG promoter. (B) Western blot for BAG3
protein in iPS-CMs, introduction of 3xFLAG tag was visualized by a larger size band and
reactivity to anti-FLAG antibody. (C) Venn diagram demonstrating the overlap in interactors
identified from iPSC versus iPS-CM.