supplementary information - royal society of chemistry · adivision of chemistry ... cuvette and...
TRANSCRIPT

Supplementary Information
NIR-Triggered Drug Release from Switchable Rotaxane-
Functionalized Silica-Covered Au Nanorods
Menghuan Li,a,b Hong Yan,a Cathleen Teh,c Vladimir Korzhc and Yanli Zhaoa,b,*
aDivision of Chemistry and Biological Chemistry, School of Physical and Mathematical
Sciences, Nanyang Technological University, 21 Nanyang Link, Singapore 637371,
Singapore. E-mail: [email protected] of Materials Science and Engineering, Nanyang Technological University,
Singapore 639798, Singapore.cLaboratory of Fish Development Biology, Institute of Molecular and Cell Biology, 61
Biopolis Drive, Singapore 138673, Singapore.
S1
Electronic Supplementary Material (ESI) for ChemComm.This journal is © The Royal Society of Chemistry 2014

Table of Content
Experiment Section.............................................................................................................................S3
1. Materials and equipment .......................................................................................................S3
2. Preparation of mesoporous silica coverd Au nanorod .........................................................S3
3. Synthesis of N-(3-(triethoxysilyl) propyl) propiolamide ......................................................S4
4. Grafting N-(3-(triethoxysilyl) propyl) propiolamide onto Au@MNS surface ..................S4
5. Synthesis of 7-((4-(2-(2-azidoethoxy) ethoxy) phenyl) diazenyl) naphthalene-1,3-disulfonic acid and conjugation of photo-responsive rotaxane onto [email protected]
6. Characterizing the conformation transition of [email protected]
7. Photothermal effect of Au@MSN-Rotaxane ........................................................................S6
8. Drug loading and release profile measurement....................................................................S7
9. In vivo evaluation using zebrafish embryo models...............................................................S8
Experimental results.........................................................................................................................S10
Figure S1. BET and BJH characterization.. ...................................................................................S10
Figure S2. UV and FTIR spectrum analysis. .................................................................................S11
Figure S3. Characterization of photothermal effect. ......................................................................S12
Figure S4. Confocal study on zebrafish embryo at 25°C. ..............................................................S13
Figure S5. Confocal study on zebrafish embryo at 37°C. ..............................................................S14
S2

Experiment Section
1. Materials and equipment
All the chemicals were purchased from Sigma-Aldrich and used without any purification. FT-
IR spectra were recorded on a Perkin-Elmer 1760X FT-IR spectrometer with the sample
powder diluted in KBr (1%). BET surface areas were determined using a Micromeritics
ASAP 2020M automated sorption analyzer. The transmission electron microscopy (TEM)
images were observed using a JEOL 2010. UV-vis analyses were performed on a Shimadzu
UV-3600 UV-Vis-NIR spectrophotometer (1-mm quartz cell used). Fluorescent spectra were
recorded on a Shimadzu RF-5301 spectrofluorophotometer.
2. Preparation of mesoporous silica covered Au nanorods (Au@MSN)
The Au nanorods were synthesized according to previous study with some modifications1.
Generally, the ultra-small Au seeds were prepared by the reduction of HAuCl4 using NaBH4
in aqueous environment. Aqueous cetyltrimethyl ammonium bromide (CTAB) solution
(0.2M, 10 mL) was first mixed with HAuCl4 solution (m/V 1%, 100 µL). Then, ice-cold
NaBH4 aqueous solution (0.01 M, 0.6 mL) was added to the above mixture. The ultra-small
Au seeds were formed immediately upon the addition of NaBH4 solution. The Au seeds were
always used within 3 h after the preparation.
The growth solution for Au nanorods was a mixture of CTAB solution (0.1 M, 100 mL),
HAuCl4 solution (0.01 M, 5 mL), AgNO3 solution (10 mM, 1 mL), H2SO4 solution (0.5 M, 2
mL) and ascorbic acid solution (0.1 M, 800 µL) added sequentially. The growth was initiated
by adding above seed solution (240 µL). The nanorod growth was carried out for 6 h and the
temperature was kept at 30 °C. The Au nanorods prepared were first washed with deionized
water for several times to remove the excessive CTAB and remaining reactants. The Au
nanorods were extracted through centrifugation and then concentrated to 10 mg Au/mL.
S3

The mesoporous silica coating was achieved via a template method. Firstly, the concentrated
Au nanorod solution (1 mL) was re-dispersed in aqueous CTAB solution (0.01 M, 100 mL),
and the mixture was gently stirred for about 15 min. Ammonia water (0.01M, 1 mL) was
subsequently added into the mixture solution in order to adjust the solution pH to be slightly
basic, followed by the injections of TEOS (30 μL each) for three times with 30 min interval.
The temperature of the mixture was kept at 30°C. The reaction was carried out about 24 h.
The silica coated Au nanorods were then extracted via centrifugation and washed with
ethanol for 3 times.
The CTAB template was removed by using ethanol solution of hydrochloride. To be specific,
silica coated Au nanorods (60 mg) were dispersed in ethanol (40 mL) containing
hydrochloric acid (m/V 35%, 5 mL), and the mixture was stirred at 40°C. After 24 h of
reaction, mesoporous silica coated Au nanorods were collected through centrifugation. The
extracted sample was anhydrated under vacuum and the product was denoted as Au@MSN.
3. Synthesis of N-(3-(triethoxysilyl) propyl) propiolamide
N-(3-(triethoxysilyl) propyl) propiolamide was prepared according to a previous report2. N,N-
Dicyclohexylcarbodiimide (2.46 g, 12.0 mmol) was added into a mixed solution of 3-
aminopropyltriethoxysilane (2.40 g, 10.9 mmol) and propiolic acid (0.87 g, 11.9 mmol) in
dichloromethane (15 mL). The mixture was kept stirring at room temperature for 1 h, and
then roughly separated using a filter paper. Evaporation of excessive solvent from the filter
liquor was achieved by co-evaporation with toluene (40 mL). The co-evaporation was
repeated 3 times, and the solution was diluted with toluene to 20 mL.
4. Grafting N-(3-(triethoxysilyl) propyl) propiolamide onto Au@MNS surface
(Au@MSN-Alkyne)
The anhydrous Au@MSN was homogeneously suspended in toluene (10 mg powder in 20
mL anhydrous toluene). N-(3-(triethoxysilyl) propyl) propiolamide solution (1 mL) was
S4

subsequently added. The mixture was refluxed at 120°C for 24 h. After that, the product was
extracted via centrifugation. The precipitate was washed first by acetone and then deionized
water for several times, followed by anhydration under vacuum at room temperature. The
product was denoted as Au@MSN-Alkyne.
5. Synthesis of 7-((4-(2-(2-azidoethoxy) ethoxy) phenyl) diazenyl) naphthalene-1,3-
disulfonic acid and conjugation of photo-responsive rotaxane onto Au@MSN-
Alkyne
The synthesis of the azobenzene moiety, 7-((4-(2-(2-azidoethoxy) ethoxy) phenyl) diazenyl)
naphthalene-1,3-disulfonic acid, was achieved by following a route provided in a previous
paper (Scheme S1)3. The azobenzene moiety (150 mg, 0.27 mmol) and α-cyclodextrin (525
mg, 0.54 mmol) were then dissolved in H2O (10 ml), which was stirred at room temperature
under N2 protection for 2 h to give the complex, denoted as Azidized-Switch 1.
A solution of Au@MSN-Alkyne (20 mg), CuSO4•5H2O (3.4 mg), and sodium ascorbate (3.4
mg) in H2O (5 mL) were added to the above complex solution. The mixture solution was then
stirred at room temperature for 3 days. The product was extracted via centrifugation, and then
washed by deionized water for several times to afford the final product, denoted as
Au@MSN-Rotaxane (Scheme S1).
OH
OHOH Si
O
OO
HN
O
SiO
OO
HN
O
N NN O O N
NSO3H
SO3H
Alkyne grafting
HN
O
(EtO)3Si ß-CD, CuSO4•5H2Osodium ascorbateAzidized-Switch 1
Click reaction
Au@MSN Au@MSN-Alkyne
Au@MSN-Rotaxane
Scheme S1. Synthetic procedure for the azobenzene derivative conjugates.
S5

6. Characterizing the conformation transition of Au@MSN-Rotaxane
Au@MSN-Rotaxane (100 μg) was dispersed in deionized water, which was stored at 35°C
for 10 min. The UV-vis absorbance was subsequently measured and the obtained absorption
spectrum was denoted as the “on” state. The sample was cooled down to room temperature
and then irritated with UV light at 365 nm for 15 min. The UV-vis spectrum was measured
again, which was denoted as the “off” state. The same cuvette was subsequently illuminated
with NIR laser (808 nm, 200mW/cm2) for 30 min before the UV-vis spectrum was measured
(Scheme S2). The UV-NIR illumination processes were repeated for 5 cycles using the same
cuvette and sample solution in order to reduce the interference of other potential factors.
SiOOO
HNO
NNN
O
O
NN
SO3H
SO3H
SiOOO
HNO
NNN
O
O
NN
SO3H
SO3H
UV rays
NIR light
Scheme S2. Photo-induced conformation transition of Au@MSN-Rotaxane
7. Photothermal effect of Au@MSN-Rotaxane
Au@MSN-Rotaxane (500 μg) was dispersed in deionized water (0.5 mL), which was
transferred into a cuvette. To achieve the maximized conversion efficiency, the cuvette was
wrapped in tin foil. Temperature reading of the solution was recorded by a digital
S6

thermometer. The lens module of the NIR laser was located right above the cuvette and the
calculated power density of the NIR illumination was 1.5W/cm2. Same volume of deionized
water was used as the experiment control, which was also continuously illuminated with NIR
laser under the same power density. Initial temperature of all the sample solutions was 25°C.
In the experiment, the sample solution was continuously illuminated with NIR laser under the
same power density. The duration of the NIR illumination was 1 h and the temperature of the
sample solution was recorded when the illumination was complete.
8. Drug loading and release profile measurement
FITC, a widely used fluorophore, was used as the model drug to be loaded into Au@MSN-
Rotaxane via diffusion in aqueous solution at 40°C under dark environment for 1 day. FITC-
loaded Au@MSN-Rotaxane was then irritated with UV light at 365 nm for 15 min, where
trans-to-cis isomerization of the azobenzene-based rotaxane in Au@MSN-Rotaxane enabled
the closure of the mesopores. FITC-loaded Au@MSN-Rotaxane was extracted through
centrifugation, and then washed with deionized water for several times to remove free FITC
attached on the particle surface. For the release test, each cuvette contained 20 μg of FITC-
loaded Au@MSN-Rotaxane, and deionized water was added to make the total volume of
1mL. Three same sample groups were prepared. The release behavior of FITC-loaded
Au@MSN-Rotaxane against heat and NIR irradiation was monitored by the
spectrofluorophotometer. The excitation and emission wavelengths were 495 nm and 519 nm,
respectively. A blank sample where no specific trigger was applied (25°C, placed in dark
environment) was used as the control group. For the temperature induced release, the
temperature of the sample solution was kept at 25°C for the first 5 min and subsequently
heated to 45°C using a digital heat source. For the NIR triggered release, the sample solution
was illuminated with NIR laser continuously (power output: 200mW/cm2). The cuvette was
wrapped with tin foil for maximizing the NIR absorption. For all the three samples, the
S7

fluorescent intensity readings were taken after 5 min, 11 min, 19 min, 45 min, 100 min and
180 min, respectively. The release tests under each condition were repeated for 3 times to
eliminate accidental error.
9. In vivo evaluation using zebrafish embryo models
Doxorubicin (DOX) as one of the typical clinical anticancer drug was used as the cargo for
delivery and fluorescent indicator. Au@MSN-Rotaxane (40 mg) was dissolved in aqueous
DOX solution (1mg/mL, 10 mL), and the mixture was stirred at 40°C in dark environment for
1 day to allow for maximized loading amount. DOX-loaded Au@MSN-Rotaxane was also
extracted through centrifugation. It was illuminated with UV light for 15 min and
subsequently stored in a sealed container out of light at 25°C. For every 5-day old zebrafish
embryo, a dose of concentrated DOX-loaded Au@MSN-Rotaxane solution (40mg/mL, 5µL)
was injected into its brain ventricle. Each mounted zebrafish embryo was imaged under
bright field with HeNe 543 nm laser attached to a 560/615 nm emission band-pass filter,
which were used to simultaneously detect optically opaque gold nanorods and the intrinsic
red fluorescent of the DOX cargo. For the release test in the zebrafish embryo models, the
particle-injected embryos were illuminated with NIR light (power density: 1.5 W/ cm2) for 1
h. The experimental samples were then incubated together with the controls in a dark
environment at 25°C for another 2 days before imaging. This process was to evaluate the
long-term effect in vivo. For the study of the drug-release kinetic characteristics, the two
experimental groups were illuminated with NIR light for 10 min and 5 min respectively, one
day after the injection under the same power density (1.5W/cm2). The embryos were then
immobilized and mounted, and simultaneously imaged for 2 h after the NIR illumination. In
another experimental group, the injected embryos were incubated under the physiological
temperature of 37°C for 3h and subsequently imaged. The image size and corresponding
positions in the imaged area were kept the same, and a fixed line where the terminal position
S8

was demarcated by an arrowhead was first drawn across the bright field image. Bright field
intensity profile, detecting the distance occupied by the opaque Au@MSN-Rotaxane, with
the minimum gray value along the demarcated line was measured and depicted. The DOX
intensity profile was subsequently examined across the same position and length using Image
J. A red serrated box was drawn to delimit the region that corresponded to the DOX trapped
in the mesoporous silica layer of the Au nanorods. Equal distance was selected and compared
across all samples and control group.
S9

Experimental results
0.0 0.4 0.80
200
400
600
Vol
ume
/mL(
STP
)g-1
Relative pressure
Adsorption Desorption
a
Figure S1. a) BET isotherms and b) the pore size distribution of Au@MSN.
The N2 adsorption/desorption isotherms and the corresponding pore size distribution curves
(Figure S1) indicate detailed porous properties of Au@MSN. The Au@MSN has a total
surface area of 535.110m² g-1, a pore volume of 0.8215 cm3/g and an average pore diameter
of 1.45 nm.
S10
0 5 10 15 200.00
0.02
0.04
0.06
dV/d
r
Pore width/nm
b

400 600 800 1000
Wavelength /nm
Au nanorods Au@MSN Au@MSN-Alkyne Au@MSN-Rotaxane
1
2
3
4
Figure S2. UV-vis spectra showing the evolution of the drug delivery system through
different modification stages. 1: Au nanorods, 2: Au@MSN, 3: Au@MSN-Alkyne, and 4:
Au@MSN-Rotaxane.
S11
0 10 20 30 40 50 6020
30
40
Tem
pera
ture
/°C
Time / min
Au nanorod solution, 1mg/ml Deionized water
a
0 1 2 3 4 520
25
30
35
40
45
Tem
pera
ture
/°C
Cycle number
Phot
othe
rmal
Hea
ting
Cooling
b
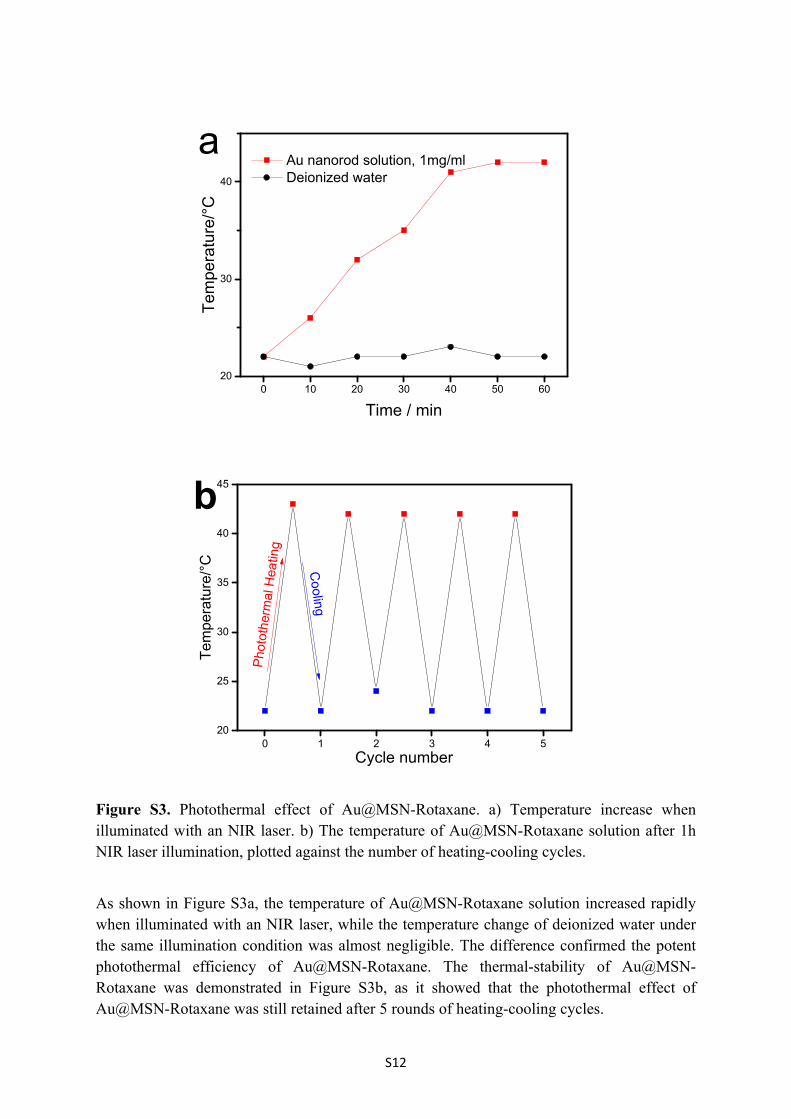
Figure S3. Photothermal effect of Au@MSN-Rotaxane. a) Temperature increase when illuminated with an NIR laser. b) The temperature of Au@MSN-Rotaxane solution after 1h NIR laser illumination, plotted against the number of heating-cooling cycles.
As shown in Figure S3a, the temperature of Au@MSN-Rotaxane solution increased rapidly when illuminated with an NIR laser, while the temperature change of deionized water under the same illumination condition was almost negligible. The difference confirmed the potent photothermal efficiency of Au@MSN-Rotaxane. The thermal-stability of Au@MSN-Rotaxane was demonstrated in Figure S3b, as it showed that the photothermal effect of Au@MSN-Rotaxane was still retained after 5 rounds of heating-cooling cycles.
S12

Figure S4. Confocal images and intensity plot of gray value showing the DOX release from
the injected DOX-loaded Au@MSN-Rotaxane at 25°C. Each sample group was marked by a
box. Sample a and c are the blank controls in each experimental group. b) Embryo
illuminated with NIR for 10 min. d) Embryo illuminated with NIR for 5 min. 1) Images taken
under bright field. 2) DOX fluorescence, 3) Merged image of 1 and 2, and 4) Intensity plot of
the gray value across the arrow.
S13

Figure S5. Confocal images and the gray value intensity plots showing the DOX release at
37°C from the DOX-loaded Au@Silica-Rotaxane in zebrafish embryos. Top-down: a) Un-
illuminated sample, b) NIR illumination for 10 min, c) NIR illumination for 20 min, and d)
NIR illumination for 30 min. Left-right: 1) Images taken under bright field, 2) DOX
fluorescence, and 3) intensity plot of the gray value across the blue line.
S14
At 37°C, some background noises (around 30%) were observed in the control group due to
the particle dispersion during the local injection. However, it can be noted that the major red
DOX fluorescence still overlapped with the DOX-loaded Au@Silica-Rotaxane. The distance
of DOX fluorescence spreading increased significantly after extending the NIR illumination
time (from 10 to 30 min), indicating that the mode of release is indeed NIR-triggered release.
Overall, the in vivo experiment conducted at 37°C is consistent with the conclusion that the
NIR light can effectively trigger the drug release from the nanocarrier, and moreover, the
released drug amount correlates positively with the illumination duration.
References:
1 C. J. Johnson, E. Dujardin, S. A. Davis, C. J. Murphy and S. Mann, J. Mater. Chem., 2002, 12, 1765.
2 M. Ortega-Muñoz, J. Lopez-Jaramillo, F. Hernandez-Mateo and F. Santoyo-Gonzalez, Adv. Syn. Cat., 2006, 348, 2410.
3 H. Yan, C. Teh, S. Sreejith, L. Zhu, A. Kwok, W. Fang, X. Ma, K. T. Nguyen, V. Korzh and Y. Zhao, Angew. Chem. Inter. Ed., 2012, 51, 8373.
S15