supplementary material: surface-active ionic liquids in
TRANSCRIPT
Supplementary Material:
Surface-active ionic liquids in catalytic water splitting
Alice Cognigni,a Ádám Márk Palvögyi,a Christian Schröder,b Herwig Peterlik,c Alexander R. M. Müllner,c
Ronald Zirbsd , Matthias Weile and Katharina Bica∗a
Contents
1 Reaction profiles 2
2 Reaction kinetics 42.1 Rationalization . . . . . . . . . . . . . . . . . . . . . . . . . . . . . . . . . . . . . . . . . . . . . . . . . . . . . . . . . . . 42.2 Turn over frequency of the autocatalyzed reaction . . . . . . . . . . . . . . . . . . . . . . . . . . . . . . . . . . . . . . . . 42.3 Turn over frequency of the first order reaction . . . . . . . . . . . . . . . . . . . . . . . . . . . . . . . . . . . . . . . . . . 42.4 Mean reaction time . . . . . . . . . . . . . . . . . . . . . . . . . . . . . . . . . . . . . . . . . . . . . . . . . . . . . . . . . 5
3 SAXS measurements 6
4 Ionic liquid stability 6
a Institute of Applied Synthetic Chemistry, Vienna University of Technology, Getreidemarkt 9/163, 1060 Vienna, Austria, Fax: +43 1 58801 16360; Tel: +43 1 58801 163601.E-mail: [email protected] or [email protected]
b University of Vienna, Faculty of Chemistry, Department of Computational Biological Chemistry, Währingerstrasse 17, 1090 Vienna, Austriac University of Vienna, Faculty of Physics, Boltzmanngasse 5, 1090 Vienna, Austria.d Institute for Biologically inspired materials, Department of Nanobiotechnology, University of Natural Resources and Life Sciences, Vienna, Muthgasse 11-II, 1190 Vienna,
Austria.e Institute for Chemical Technologies and Analytics, Vienna University of Technology, Getreidemarkt 9/164, 1060 Vienna, Austria.
1
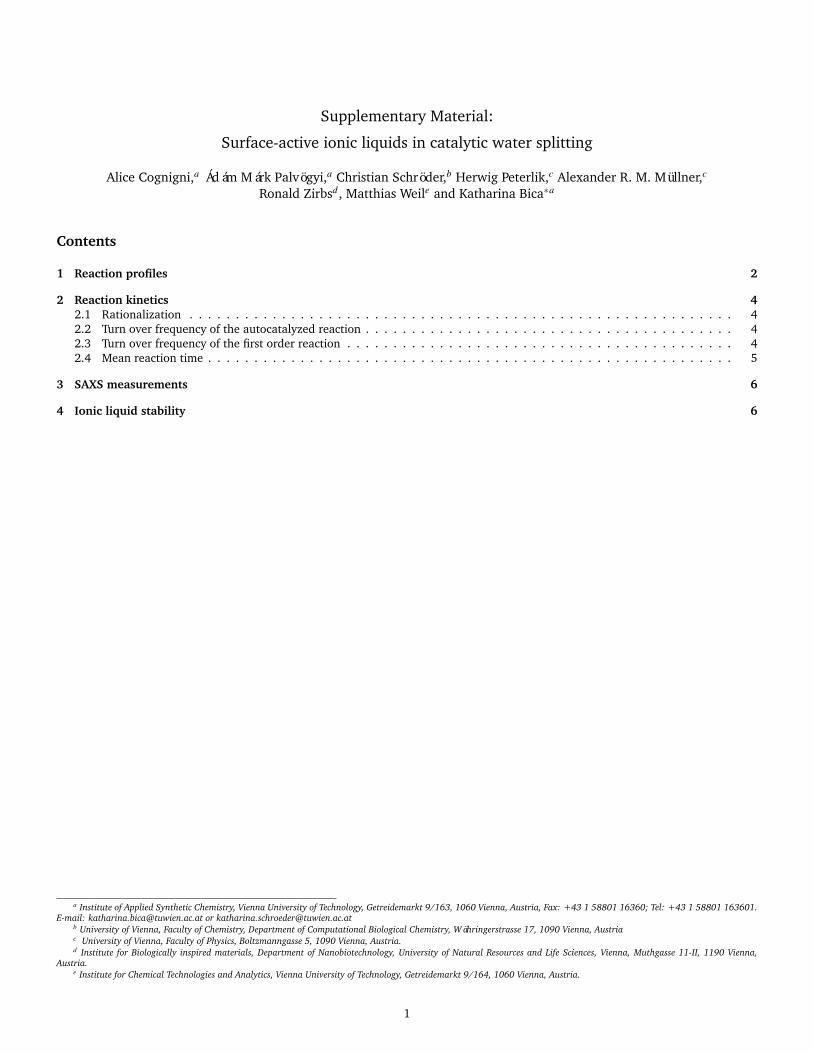
1 Reaction profiles
Figure S1 Representative kinetic profiles for the three new catalysts at concentration of 2 µM and CAN 3 mM in HNO3 0.1 M
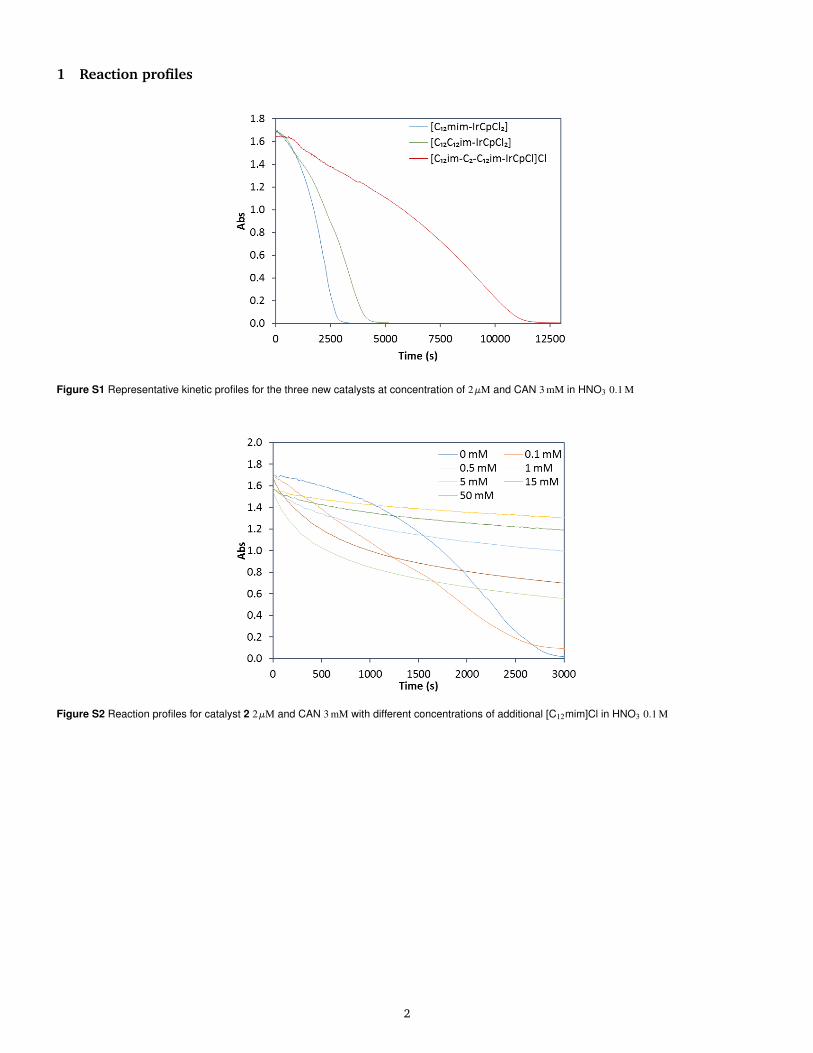
Figure S2 Reaction profiles for catalyst 2 2 µM and CAN 3 mM with different concentrations of additional [C12mim]Cl in HNO3 0.1 M
2

Figure S3 Reaction profiles for catalyst 2 2 µM and CAN 1.5 mM with different concentrations of additional [C12mim]Cl in HNO3 0.1 M
Figure S4 TOF〈t〉 and TOFmax for catalyst 2 2 µM and CAN 1.5 mM with different concentrations of additional [C12mim]Cl in HNO3 0.1 M
3

2 Reaction kinetics
We assume that the depletion of the Ce4+ can be described by
[Ce4+](t) = a1e−k1t +a2
(1−b2)+b2ek2t (S1)
with the initial absorbance a0 = a1 + a2. The first part on the right hand side is a first order reaction. The second part stems from anautocatalyzed reaction. a1 and a2 are the relative importance of the two processes. If, for example, a1 is almost a0, then the overallreaction follows first order, if a2 is almost a0 the reaction is determined by the autocatalyzed process. k1 and k2 are the correspondingrate constants in Hz. The parameter b2 describes the position of the turn point of the logistic function.
Eq. (S1) can be reformulated
a1e−k1t +a2
(1−b2)+b2ek2t = a1e−k1t +a2
1+ ek2(t−t0)(S2)
using a2 = a2/(1−b2) and t0 = ln((1−b2)/b2
). Here, t0 corresponds to the time when half of the second process had taken place.
2.1 Rationalization
A first order reaction can be described by
− d[Ce4+]
dt= k1[Ce4+]. (S3)
Solving this differential equation yields the first part of Eq. (S1).In principle, the differential equation of the pure autocatalytic part looks like
− d[Ce4+]
dt= k′[Ce4+]+ k′′[Ce4+]
([Ce4+]0− [Ce4+]
)(S4)
resulting in
[Ce4+](t) =[Ce4+]0([Ce4+]0 · k′′+ k′)
k′e([Ce4+]0k′′+k′)t +[Ce4+]0k′′(S5)
Substituing k2 = [Ce4+]0k′′+ k′ and k′ = k2 ·b2 one yields
[Ce4+](t) =[Ce4+]0
1−b2 +b2ek2t (S6)
which is similar to the logistic function of Eq. (S1).
2.2 Turn over frequency of the autocatalyzed reaction
The time-dependent concentration of the product, [Ce3](t), should be [Ce4+]0−[Ce4+](t). Consequently, the rate r(t) of Ce3+-production is
r(t) =d[Ce3+]
dt' [Ce4+]0
a0· a2 · k2 ·b2ek2t
(1−b2 +b2ek2t)2 (S7)
neglecting the first order reaction. The maximum rate r is reached at
tmax =ln(1−b2)− ln(b2)
k2(S8)
As a result, the maximum turn-over-frequency
TOF =r(tmax)
[cat]=
a2 · k2 · [Ce4+]04(1−b2) ·a0 · [cat]
(S9)
2.3 Turn over frequency of the first order reaction
In the rare case, that the depletion of [Ce4+] follows a first order reaction without the autocatalyzed process, i.e. a1 ' a0 and
r(t) =d[Ce3+]
dt' [Ce4+]0
a0a1 · k1 · e−k1t , (S10)
the turn-over-frequency has its maximum value at t = 0:
TOF =[Ce4+]0 ·a1 · k1
[cat] ·a0(S11)
4
The last value can also be gained from a Taylor-series expansion of the [Ce3+](t)
[Ce3+] = [Ce4+]0(1−a1
a0e−k1t) (S12)
= [Ce4+]0(1− e−k1t) (S13)
' [Ce4+]0
(1− (1− k1t + . . .)
)(S14)
' [Ce4+]0 · k1 · t (S15)
since a1 = a0 is the initial assumption of this rare case. The slope of Eq. (S15) is [Ce4+]0 · k1 which has to be divided by [cat] to get theturn-over-frequency.
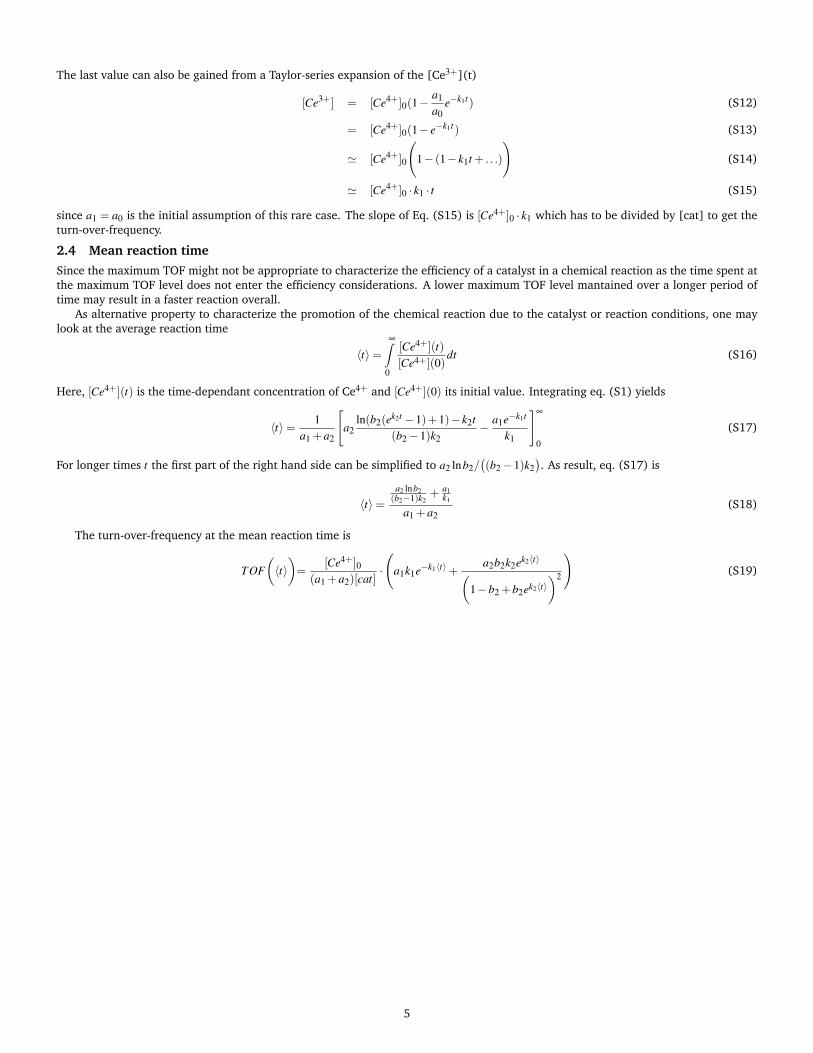
2.4 Mean reaction timeSince the maximum TOF might not be appropriate to characterize the efficiency of a catalyst in a chemical reaction as the time spent atthe maximum TOF level does not enter the efficiency considerations. A lower maximum TOF level mantained over a longer period oftime may result in a faster reaction overall.
As alternative property to characterize the promotion of the chemical reaction due to the catalyst or reaction conditions, one maylook at the average reaction time
〈t〉=∞∫
0
[Ce4+](t)[Ce4+](0)
dt (S16)
Here, [Ce4+](t) is the time-dependant concentration of Ce4+ and [Ce4+](0) its initial value. Integrating eq. (S1) yields
〈t〉= 1a1 +a2
[a2
ln(b2(ek2t −1)+1)− k2t(b2−1)k2
− a1e−k1t
k1
]∞
0
(S17)
For longer times t the first part of the right hand side can be simplified to a2 lnb2/((b2−1)k2
). As result, eq. (S17) is
〈t〉=a2 lnb2(b2−1)k2
+ a1k1
a1 +a2(S18)
The turn-over-frequency at the mean reaction time is
TOF(〈t〉)=
[Ce4+]0(a1 +a2)[cat]
·
(a1k1e−k1〈t〉+
a2b2k2ek2〈t〉(1−b2 +b2ek2〈t〉
)2
)(S19)
5

3 SAXS measurementsSAXS measurements were performed using a Bruker Nanostar (Bruker AXS) equipped with microfocus X-ray source (Incoatec ImS HighBrilliance) with CuKα radiation with a wavelength of 0.1542 nm, a pinhole camera and a 2D-position sensitive detector (Vantec 2000).The samples were filled into glass capillaries (1.5 mm diameter, 10 µm wall thickness, from Hilgenberg). Scattering patterns wererecorded for 6 hours, azimuthally integrated and corrected for background scattering from the capillary. The integrated intensity isshown in Fig. S5 in dependence on the scattering vector q=(4π/λ) sinΘ, with 2Θ being the scattering angle (black line). The red lineis a fit with a core-shell model as in ref. 25 of the paper. Additionally, a power-law term was added to describe the strong intensityincrease towards low q-values. The fit results in a core radius of 0.75 nm, a shell thickness of 2.1 nm and a value of 0.035 for the scaledmedium contrast γ.
Figure S5 SAXS intensity for the reaction mixture (as described in Table 2 of the paper), black line, together with fit from the core-shell model, red line
4 Ionic liquid stabilityStability experiments were done in 10 mL screw cap vials equipped with magnetic stirrer and thermostat at 25◦ C. 20 µl of stock solutionin acetonitrile of the catalyst 2 were added to 2 ml of HNO3 0.1 M Milli-Q water solution containing 50 µM of C12mim-Cl. Afterwards1 ml of freshly prepared cerium ammonium nitrite stock solution in HNO3 0.1 M in Milli-Q water and 1 ml of HNO3 0.1 M in Milli-Qwater were added to the vials, respectively. After one hour, the aqueous phases were extracted with dichloromethane 5 times. Thecombined organic phases were dried on Na2SO4, filtered, and evaporated in vacuo. The ionic liquid stability against oxidation wasproven by comparing the 1H NMR spectra of the two reactions.
6
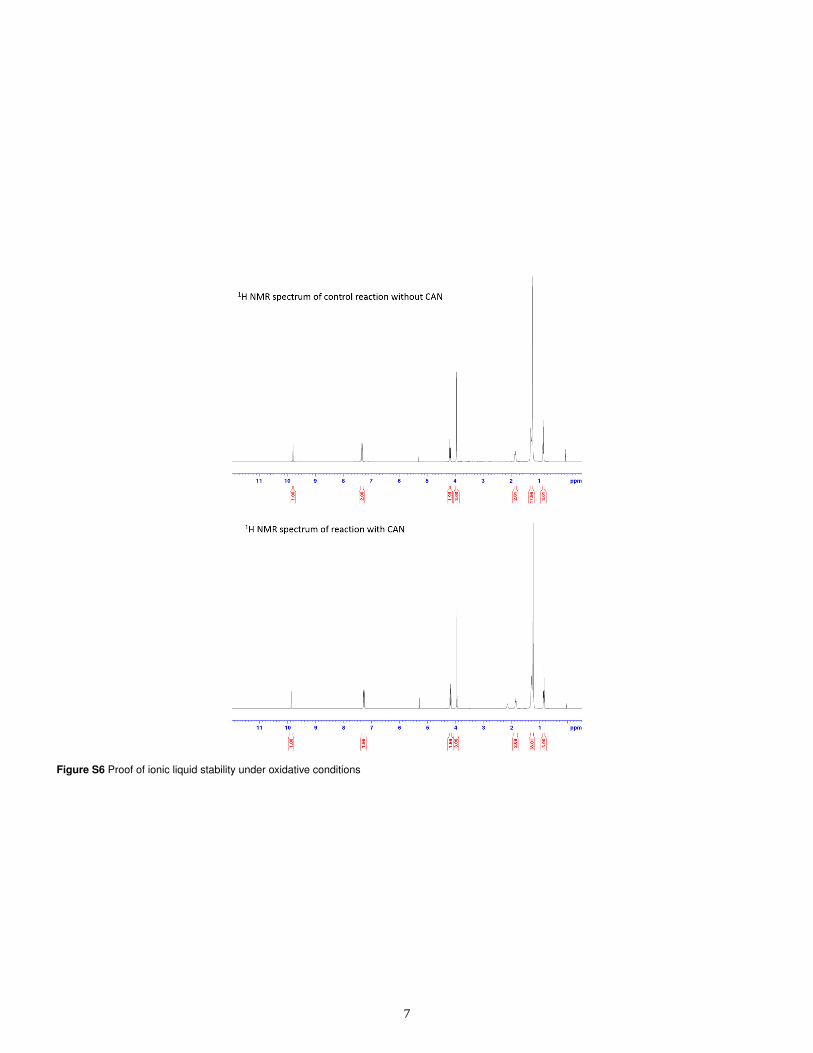
Figure S6 Proof of ionic liquid stability under oxidative conditions
7