supporting information for collision cross section
TRANSCRIPT
Supporting information for: Collision Cross Section Predictions using 2-Dimensional
Molecular Descriptors, by Soper-Hopper et al.
Corresponding author: Facundo M. Fernandez
E-mail: [email protected]
Ph: 404 385 4432
Fax: 404 385 6447
Electronic Supplementary Material (ESI) for ChemComm.This journal is © The Royal Society of Chemistry 2017

General Workflow.
Collision cross section prediction can be applied to many areas of research. Highlighted here are two such applications. In A) the molecular descriptors for a a calibration set of lipids with known CCS are used to develop a PLS regression model. The PLS model can then be used to calculate the theoretical CCS of a pool of new lipids which have been selected by MS and MS/MS. The theoretical CCS value is compared to the experimentally measured CCS to narrow down the pool of potential lipids for a more accurate identification. In the other scenario, B), a calibration set made up of pure amino acid chains and pure hydroxy acid chains are used in the development of the PLS regression model. This model is then applied to a library of depsipeptides composed of the amino acids and hydroxy acids used in the calibration. This library is built computationally and consists of all possible combinations of monomeric units, up to a specified chain length. Theoretical CCS values are compared to one another to identify sequences which deviate significantly from the norm. These sequences can then be subjected to experiments such as IM-MS, circular dichroism, NMR, microscopy, and other structural biology techniques.
Lipid CCS prediction model development.

The accompanying spread sheet details the calibration and validation sets for the lipid model development. Collision cross section (CCS) values were taken from the Astarita et. al. database1. General classes of lipids used are shown below.
Results of PLS model using all molecular descriptors (excluding 3D descriptors) for lipids are detailed below.
Genetic algorithms and reverse iPLS were used to reduce the total number of molecular descriptors from 3827 to 68. Genetic algorithms with population sizes of 124-256, a window width of 1, and penalty slope of 0.01 were tested. A maximum of 25 variables (descriptors) was targeted over a maximum of 200 generations with 50% variable overlap at convergence, and a mutation rate of 0.003-0.007 (double crossover). Random block cross validation was employed on 5 splits and 5 iterations. The overall GA runs were replicated 3 times. The table below details the parameters used for each GA and the total number of selected molecular descriptors in each GA. The selected molecular descriptors were

pooled, and further reduced by reverse iPLS. Unless specified the parameters in the table are the same as Set A.
The final molecular descriptors selected for lipid CCS prediction are listed below with their variable importance in projection (VIP) score. The higher the score, the more influential the molecular descriptor is to the final model. A VIP score close to or greater than one indicates the a variable important to the model. The molecular descriptor with the highest VIP score was Information Index on Molecular Size (ISIZ). Each molecular descriptor belongs to a class of descriptor. The descriptors with highest VIP scores typically fall into 4 main categories: information indices, 2D-Matrix based descriptors, burden eigenvalues, and topological indices.
Name Description VIP Score
ISIZ information index on molecular size 1.707809
Ho_Dz(Z) Hosoya-like index (log function) from Barysz matrix weighted by atomic number
1.683778
SpMax_D/Dt leading eigenvalue from distance/detour matrix 1.678203
Ho_D Hosoya-like index (log function) from topological distance matrix
1.670958
SpDiam_Dz(e) spectral diameter from Barysz matrix weighted by Sanderson electronegativity
1.657083
SpMin6_Bh(i) smallest eigenvalue n. 6 of Burden matrix weighted by ionization potential
1.640293
SpMin5_Bh(i) smallest eigenvalue n. 5 of Burden matrix weighted by ionization potential
1.639537
Wi_D/Dt Wiener-like index from distance/detour matrix 1.632239
VE2_Dz(v) average coefficient of the last eigenvector (absolute values) from Barysz matrix weighted by van der Waals volume
1.631325

VE2_D average coefficient of the last eigenvector (absolute values) from topological distance matrix
1.629118
BAC Balaban centric index 1.628818
VE2_Dz(i) average coefficient of the last eigenvector (absolute values) from Barysz matrix weighted by ionization potential
1.624038
SpMAD_D/Dt spectral mean absolute deviation from distance/detour matrix
1.600553
IDET total information content on the distance equality 1.595744
ATS3m Broto-Moreau autocorrelation of lag 3 (log function) weighted by mass
1.586922
Eig12_AEA(dm) eigenvalue n. 12 from augmented edge adjacency mat. weighted by dipole moment
1.585274
Wi_Dz(i) Wiener-like index from Barysz matrix weighted by ionization potential
1.580123
Wi_Dz(p) Wiener-like index from Barysz matrix weighted by polarizability
1.572199
QW_L quasi-Wiener index (Kirchhoff number) from Laplace matrix
1.562315
SMTI Schultz Molecular Topological Index (MTI) 1.546356
SM06_AEA(bo) spectral moment of order 6 from augmented edge adjacency mat. weighted by bond order
1.541396
GMTI Gutman Molecular Topological Index 1.534685
Eig06_EA(ri) eigenvalue n. 6 from edge adjacency mat. weighted by resonance integral
1.528521
IDMT total information content on the distance magnitude 1.527572
H_D/Dt Harary-like index from distance/detour matrix 1.521057
CENT centralization 1.520379
SM07_AEA(bo) spectral moment of order 7 from augmented edge adjacency mat. weighted by bond order
1.517004
SM03_EA(ed) spectral moment of order 3 from edge adjacency mat. weighted by edge degree
1.453774
nCsp3 number of sp3 hybridized Carbon atoms 1.444398
SM09_EA(ed) spectral moment of order 9 from edge adjacency mat. weighted by edge degree
1.416581
SpMax3_Bh(v) largest eigenvalue n. 3 of Burden matrix weighted by van der Waals volume
1.414511
SM12_EA(ed) spectral moment of order 12 from edge adjacency mat. weighted by edge degree
1.409085
SpMax_L leading eigenvalue from Laplace matrix 1.393004
Eig04_AEA(bo) eigenvalue n. 4 from augmented edge adjacency mat. weighted by bond order
1.315147
DECC eccentric 1.31135
Eig04_EA(bo) eigenvalue n. 4 from edge adjacency mat. weighted by bond order
1.300912
SpMax_B(m) leading eigenvalue from Burden matrix weighted by mass
1.251246
C-002 CH2R2 1.140123
ALOGP Ghose-Crippen octanol-water partition coeff. (logP) 1.053641
GATS2e Geary autocorrelation of lag 2 weighted by Sanderson electronegativity
1.04824
ALOGP2 squared Ghose-Crippen octanol-water partition coeff. (logP^2
0.991153
P_VSA_s_1 P_VSA-like on I-state, bin 1 0.925566
P_VSA_p_4 P_VSA-like on polarizability, bin 4 0.902342
JGI8 mean topological charge index of order 8 0.710091

SpMax5_Bh(s) largest eigenvalue n. 5 of Burden matrix weighted by I-state
0.548636
P_VSA_LogP_4 P_VSA-like on LogP, bin 4 0.510328
PW4 path/walk 4 - Randic shape index 0.46771
IC3 Information Content index (neighborhood symmetry of 3-order)
0.388996
Eig03_EA(dm) eigenvalue n. 3 from edge adjacency mat. weighted by dipole moment
0.369221
CATS2D_00_AN CATS2D Acceptor-Negative at lag 00 0.229799
CATS2D_05_DL CATS2D Donor-Lipophilic at lag 05 0.224391
MATS7m Moran autocorrelation of lag 7 weighted by mass 0.219895
MCD molecular cyclized degree 0.18916
Chi_D/Dt Randic-like index from distance/detour matrix 0.185162
WiA_D/Dt average Wiener-like index from distance/detour matrix 0.185036
Eig08_EA(dm) eigenvalue n. 8 from edge adjacency mat. weighted by dipole moment
0.13586
MATS6p Moran autocorrelation of lag 6 weighted by polarizability
0.107775
NssNH Number of atoms of type ssNH 0.098605
B04[C-N] Presence/absence of C - N at topological distance 4 0.098605
SIC2 Structural Information Content index (neighborhood symmetry of 2-order)
0.0898
B02[O-O] Presence/absence of O - O at topological distance 2 0.082945
Eig09_EA(dm) eigenvalue n. 9 from edge adjacency mat. weighted by dipole moment
0.063465
N-066 Al-NH2 0.057733
SsNH2 Sum of sNH2 E-states 0.057132
VE1sign_D/Dt coefficient sum of the last eigenvector from distance/detour matrix
0.038758
nOHp number of primary alcohols 0.021518
VE1sign_D coefficient sum of the last eigenvector from topological distance matrix
0.005006
SRW03 self-returning walk count of order 3 0

Depsipeptide CCS Prediction
Depsipeptides contain a mixed hydroxy acid/ amino acid backbone. Shown below is the structure for a representative depsipeptide with lactic acid and a generic amino acid. Hydroxy acids are boxed in red, with the amino acids in blue.
Molecular descriptor

calculation for depsipeptides.
Sequence of the depsipeptides of a desired length were generated in FASTA file format via permutations of the alphabet of amino and hydroxy acids of a certain type (alanine and lactic acid for this work), where the capital letters represented amino acids and equivalent small letters denoted the corresponding hydroxy acids. The FASTA sequences were then converted to the 3D structure files in mol2 format using an in house modified OpenBabel package. The resulting mol2 files were uploaded into Dragon 7.0. Molecular descriptors were calculated as the same way detailed for the lipids, and excluding all 3D descriptors.
To enable the support for both hyrdoxy and amino acids, the fastaformat.cpp routine of OpenBabel was modified in two ways. First, a case sensitivity support was added to the code to distinguish between the sets of the amino and hydroxy acids. Second, a new sequence type DepsiSequence containing both hydroxy and amino acid residues was added to the routine. A set of residue record for DepsiResidues was created. The records for the amino acid residues have been copied from the existing ProteinResidues record. The records for the corresponding hydroxy acid residues were generated by editing the records for the amino acid residues and replacing an amide “N” atom with ester “O” and removing the attached hydrogen. The beta strand conformation inherited from the protein residues was retained for all hydroxy acid residues.
Depsipeptide Synthesis. One hundred μL of the sample solution containing 100 mM of L-lactic acid and 100 mM L-alanine was heated to 95⁰C by a Bio-Rad MyCycler 96 well thermal cycler. The oligomer mixtures were obtained after 3 days dry down. Both L-lactic acid and L-alanine were from Sigma-Aldrich.
IM-MS Instrumental Methods. Mass spectra were collected on a quadrupole-ion mobility-time-of-flight mass spectrometer (Synapt G2 HDMS, Waters, Milford, MA, USA) with an electrospray ionization source. Depsipeptide ions were generated using direct infusion at a capillary voltage of 2.5kV. The source was operated in negative ion mode with a source temperature of 80°C, the sample cone at 30 V and extraction cone at 3.0 V. The desolvation gas flow was 650 L/Hr, and a desolvation temperature of 250°C. The trap region of the traveling wave IM separator was operated at a wave velocity of 311 m/s, wave height of 6.0 V. The IMS wave velocity was 500 m/s, with a wave height of 40 V. The transfer wave velocity was 190 m/s, with a wave height of 4.0 V. Fragmentation was induced in the transfer region using a transfer collision energy between 10 and 40V. Mass spectra were calibrated using sodium formate and analyzed using MassLynx 4.1 and Driftscope 2.0 software. CCS (Ω) measurements were externally calibrated using the published values for malic acid in nitrogen. Measurements were taken in triplicate. Samples were prepared by rehydrating dried sample in water containing 0.1% formic acid, and analyzed immediately.
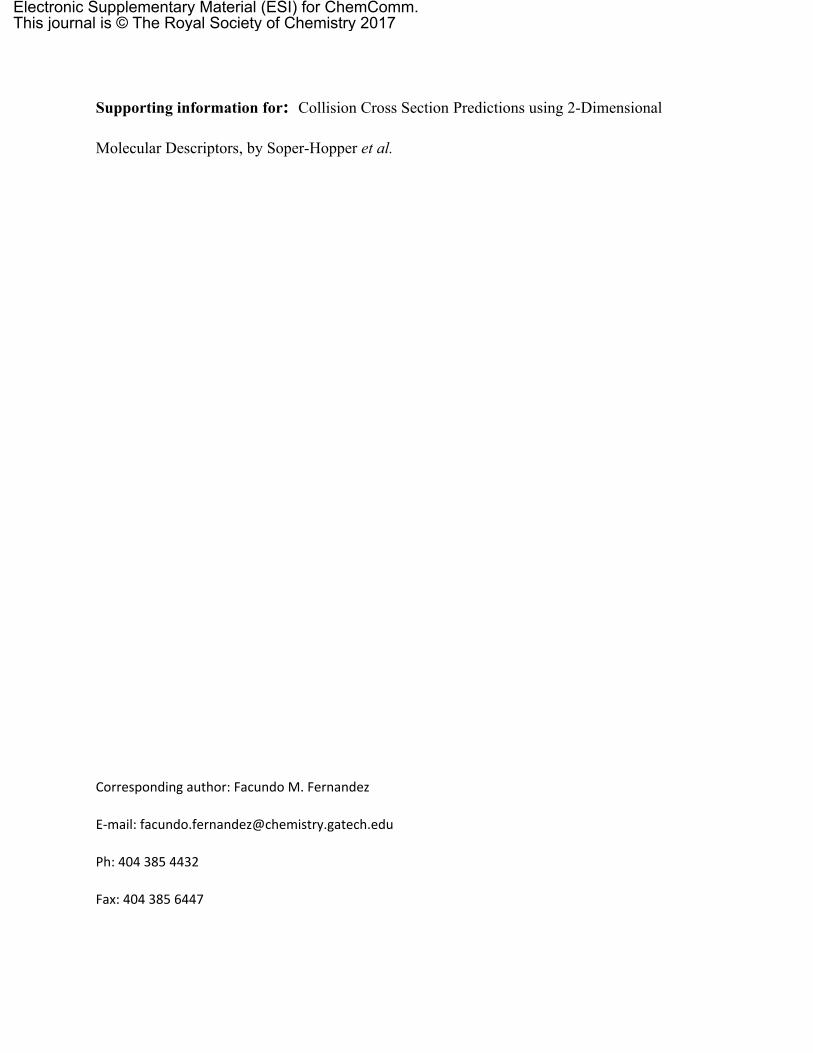
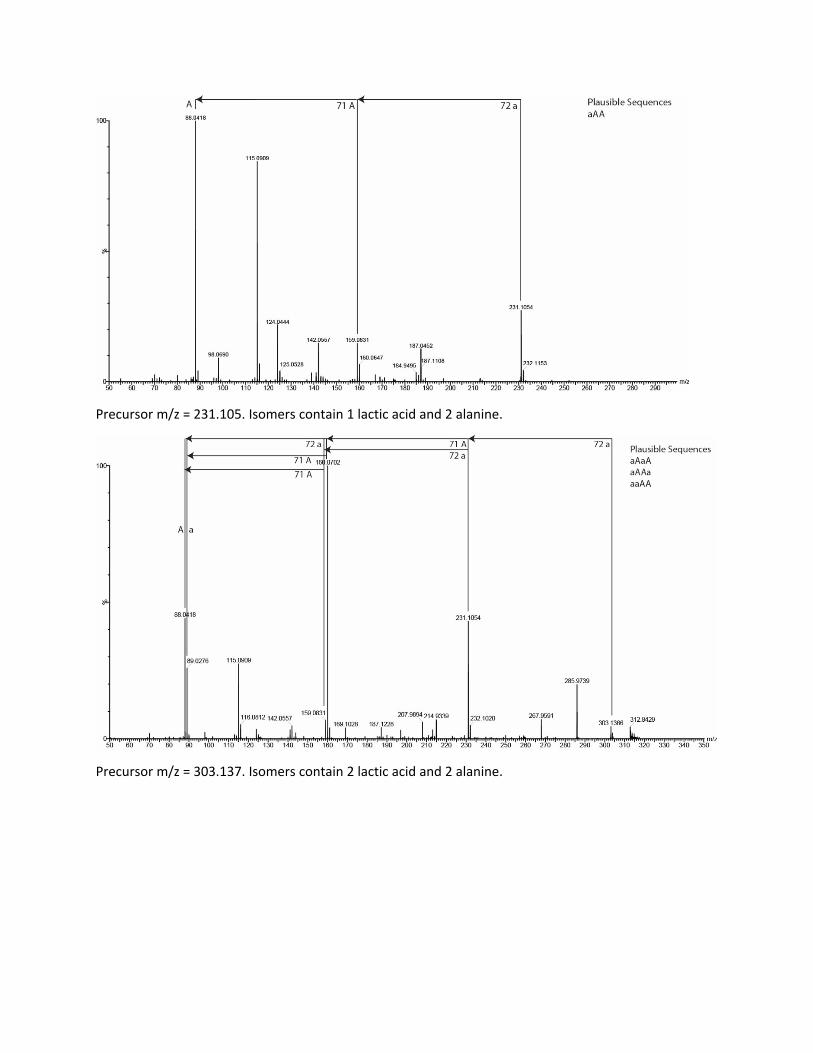
MS/MS depsipeptide identification. The quadrupole settings required to achieve a high-enough level of sensitivity for detection did not provide perfect isolation of a single mass. Data shown below shows other species differing by only 1 Da. From previous work, we know that the first residue on the N-terminus of the depsipeptide is a hydroxy acid (for this work, lactic acid). Therefore, we only considered fragments which started with lactic acid. Additionally, we do not typically see b ions in the fragmentation patterns, as the charge carrier is the carboxylic acid at the C-terminus.
Precursor m/z = 231.105. Isomers contain 1 lactic acid and 2 alanine.
Precursor m/z = 303.137. Isomers contain 2 lactic acid and 2 alanine.

Precursor m/z = 375.163. Isomers contain 3 lactic acid and 2 alanine.
Precursor m/z = 447.183. Isomers contain 4 lactic acid and 2 alanine.

Precursor m/z = 518.223. Isomers contain 4 lactic acid and 3 alanine.
Precursor m/z = 519.207. Isomers contain 5 lactic acid and 2 alanine.

Precursor m/z = 590.248. Isomers contain 5 lactic acid and 3 alanine.
Precursor m/z = 591235. Isomers contain 6 lactic acid and 2 alanine.

Precursor m/z = 633.277. Isomers contain 7 lactic acid and 2 alanine.
Precursor m/z = 734.317. Isomers contain 7 lactic acid and 3 alanine.
We checked the accuracy of our predictions through comparison to the sequenced fragments. Below is a table of the % difference for each sequence identified. The percent difference is always less than 3%, within the experimental error of IM-MS instruments.

Sequence Predicted CCS (Å2) Measured CCS (Å2) % DifferenceaAA 149.54 150.01 -0.32aAaA 165.27 167.23 -1.17aAAa 163.45 167.23 -2.29aaAA 166.52 167.23 -0.42aaAaA 180.19 181.05 -0.48aaAAa 179.63 181.05 -0.79aAaaA 179.62 181.05 -0.79aAaAa 178.94 181.05 -1.18aaaAAa 196.89 195.99 0.46aaaAaA 196.98 195.99 0.50aaAaaA 195.93 195.99 -0.03aaAaAa 195.87 195.99 -0.06aaAAaa 194.62 195.99 -0.70aAaaAa 195.75 195.99 -0.12aAaAaa 194.57 195.99 -0.73aAAaaa 193.43 195.99 -1.32aAaaaA 196.08 195.99 0.04aAAaaAa 208.32 210.01 -0.81aAAaAaa 207.65 210.01 -1.13aAaaAAa 210.20 210.01 0.09aAaAaAa 208.91 210.01 -0.53aAaAAaa 208.33 210.01 -0.81aaAaAAa 210.08 210.01 0.03aaAAaAa 208.72 210.01 -0.62aaAAAaa 208.03 210.01 -0.95aaaaAAa 211.27 210.00 0.60aaaAaAa 210.03 210.00 0.01aaaAAaa 209.71 210.00 -0.14aaAaaAa 209.58 210.00 -0.20aaAaAaa 208.64 210.00 -0.65aAaaaAa 209.93 210.00 -0.03aAaaAaa 209.39 210.00 -0.29aaaAAaAa 224.19 223.25 0.42aaaAAAaa 224.14 223.25 0.40aaaAaAAa 225.19 223.25 0.87aaAAaaAa 222.87 223.25 -0.17aaAAaAaa 222.73 223.25 -0.23aaAaAaAa 223.90 223.25 0.29aaAaAAaa 223.51 223.25 0.12aaAaaAAa 224.75 223.25 0.67aAaAaaAa 223.90 223.25 0.29aAaAaAaa 222.95 223.25 -0.13

Sequence Predicted CCS (Å2) Measured CCS (Å2) % DifferenceaAaaAaAa 224.38 223.25 0.50aAaaAAaa 224.13 223.25 0.39aAaaaAAa 225.19 223.25 0.86aAAaaaAa 223.01 223.25 -0.11aAAaaAaa 223.07 223.25 -0.08aAaAaaaa 222.22 223.24 -0.46aAaaAaaa 223.14 223.24 -0.05aAaaaAaa 224.22 223.24 0.44aAaaaaAa 224.52 223.24 0.57aaaAAaaa 237.26 223.24 6.09aaaAaAaa 238.23 223.24 6.50aaaAaaAa 238.87 223.24 6.76aaaaAAaa 225.01 223.24 0.79aaaaAaAa 225.37 223.24 0.95aaaaaAAa 226.03 223.24 1.24aaAAaaaa 221.99 223.24 -0.56aaAaAaaa 222.77 223.24 -0.21aaAaaAaa 223.97 223.24 0.33aaAaaaAa 224.17 223.24 0.41aAaAaaaaa 236.14 237.13 -0.42aAaaAaaaa 236.78 237.13 -0.15aAaaaAaaa 237.63 237.13 0.21aAaaaaAaa 238.89 237.13 0.74aAaaaaaAa 238.45 237.13 0.56aAAaaaaaa 236.44 237.13 -0.29aaAAaaaaa 236.07 237.13 -0.45aaAaAaaaa 236.02 237.13 -0.47aaAaaAaaa 237.31 237.13 0.08aaAaaaAaa 237.83 237.13 0.29aaAaaaaAa 238.15 237.13 0.43aaaAAaaaa 236.82 237.13 -0.13aaaAaAaaa 237.10 237.13 -0.01aaaAaaAaa 238.32 237.13 0.50aaaAaaaAa 238.23 237.13 0.47aaaaAAaaa 238.23 237.13 0.46aaaaAaAaa 238.37 237.13 0.52aaaaAaaAa 238.83 237.13 0.72aaaaaaAAa 240.04 237.13 1.22aAAaaaaAaa 251.02 249.09 0.77aAAaaaaaAa 250.56 249.09 0.59aAaAaaaAaa 250.31 249.09 0.49aAaAaaaaAa 250.66 249.09 0.63

Sequence Predicted CCS (Å2) Measured CCS (Å2) % DifferenceaAaaAaaAaa 251.27 249.09 0.87aAaaAaaaAa 251.00 249.09 0.76aAaaaAaAaa 251.57 249.09 0.99aAaaaAaaAa 252.08 249.09 1.19aAaaaaAAaa 252.36 249.09 1.30aAaaaaAaAa 252.08 249.09 1.19aAaaaaaAAa 252.58 249.09 1.39aaAAaaaAaa 250.24 249.09 0.46aaAAaaaaAa 249.98 249.09 0.36aaAaAaaAaa 250.51 249.09 0.57aaAaAaaaAa 250.13 249.09 0.42aaAaaAaAaa 251.41 249.09 0.93aaAaaAaaAa 251.39 249.09 0.92aaAaaaAAaa 251.92 249.09 1.13aaAaaaAaAa 251.45 249.09 0.94aaAaaaaAAa 252.17 249.09 1.23aaaaAAaAaa 251.77 249.09 1.07aaaaAAaaAa 251.54 249.09 0.98aaaaAaAAaa 252.12 249.09 1.21aaaaAaAaAa 251.70 249.09 1.04aaaaAaaAAa 252.48 249.09 1.35aaaaaAAaAa 252.44 249.09 1.34aaaaaAaAAa 253.13 249.09 1.61aaaAAaaaAa 250.36 249.09 0.51aaaAAaaAaa 250.79 249.09 0.68aaaAaAaaAa 251.21 249.09 0.85aaaAaAaAaa 250.99 249.09 0.76aaaAaaaAAa 252.99 249.09 1.55aaaAaaAaAa 251.68 249.09 1.03aaaAaaAAaa 252.44 249.09 1.34
CCS Calibration Curve. Below is the calibration curve created for the calculation of experimental CCS measurements on the Waters Synapt G2, operated as described previously. Polymalic acid in negative ion mode was used for calibration2. Parameters are as specified above in IM-MS Instrumental Methods.
0.0000 0.2000 0.4000 0.6000 0.8000 1.0000 1.2000 1.4000 1.6000 1.80006.0000
6.5000
7.0000
7.5000 PolyMA cal
ln td'
ln Ω
'

1. G. Paglia, P. Angel, J. P. Williams, K. Richardson, H. J. Olivos, J. W. Thompson, L. Menikarachchi, S. Lai, C. Walsh and A. Moseley, Analytical chemistry, 2014, 87, 1137-1144.
2. J. G. Forsythe, A. S. Petrov, C. A. Walker, S. J. Allen, J. S. Pellissier, M. F. Bush, N. V. Hud and F. M. Fernández, Analyst, 2015, 140, 6853-6861.