supporting information - pnas · supporting information ... 10 1.5 >200 >200 tntc tntc 14300...
TRANSCRIPT
Supporting InformationEricson et al. 10.1073/pnas.0914018107
A
B
C
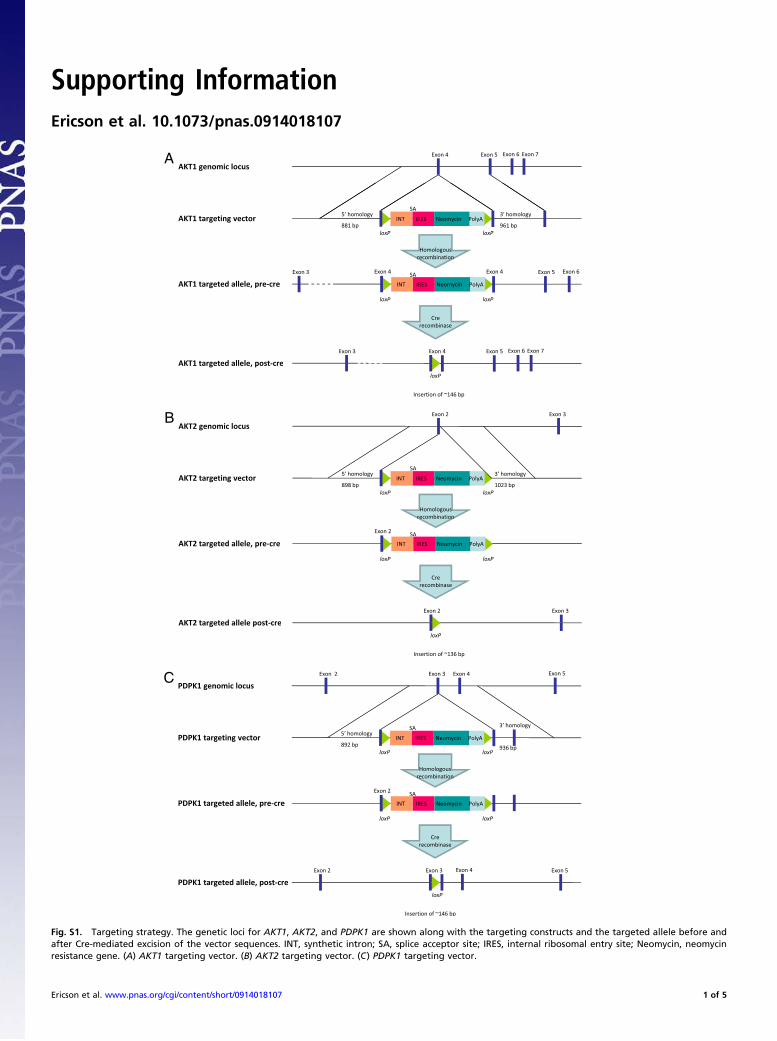
Fig. S1. Targeting strategy. The genetic loci for AKT1, AKT2, and PDPK1 are shown along with the targeting constructs and the targeted allele before andafter Cre-mediated excision of the vector sequences. INT, synthetic intron; SA, splice acceptor site; IRES, internal ribosomal entry site; Neomycin, neomycinresistance gene. (A) AKT1 targeting vector. (B) AKT2 targeting vector. (C) PDPK1 targeting vector.
Ericson et al. www.pnas.org/cgi/content/short/0914018107 1 of 5

500
600
500
600
200
300
400
200
300
400
0
100
Parental AKT1 KO AKT2 KO AKT1/2 KO PDPK1 KO
0
100
Parental AKT1 KO AKT2 KO AKT1/2 KO PDPK1 KO
HCT116 (10% FBS) DLD1 (10% FBS)
Fig. S2. Colony formation in normal growth media. Approximately 1,500 cells of the indicated cell lines were seeded in T25 flasks, cultured for 11–12 days inmedium containing 10% FBS, and then stained and counted.
HCT116 611TCHlatneraP AKT1/2 KO
CA
DB
HCT116 PDPK1 KO NO CELLS INJECTED
Fig. S3. Tumor foci visible on the liver surface 5 weeks after injection of the indicated cells.
HCT116 611TCHlatneraP AKT1/2 KO2
GE
HF
NO CELLS INJECTEDHCT116 PDPK1 KO
Fig. S4. H&E-stained sections of the livers shown in Fig. S3. The arrows indicate areas containing cancer cells.
Ericson et al. www.pnas.org/cgi/content/short/0914018107 2 of 5
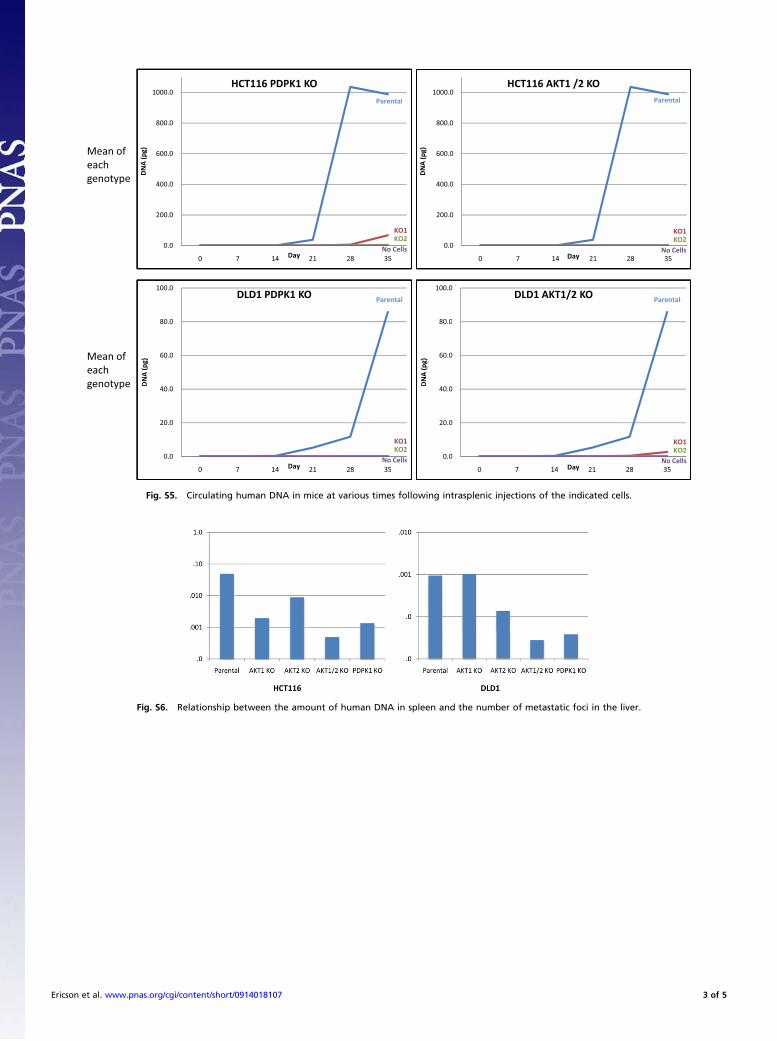
Fig. S5. Circulating human DNA in mice at various times following intrasplenic injections of the indicated cells.
Fig. S6. Relationship between the amount of human DNA in spleen and the number of metastatic foci in the liver.
Ericson et al. www.pnas.org/cgi/content/short/0914018107 3 of 5
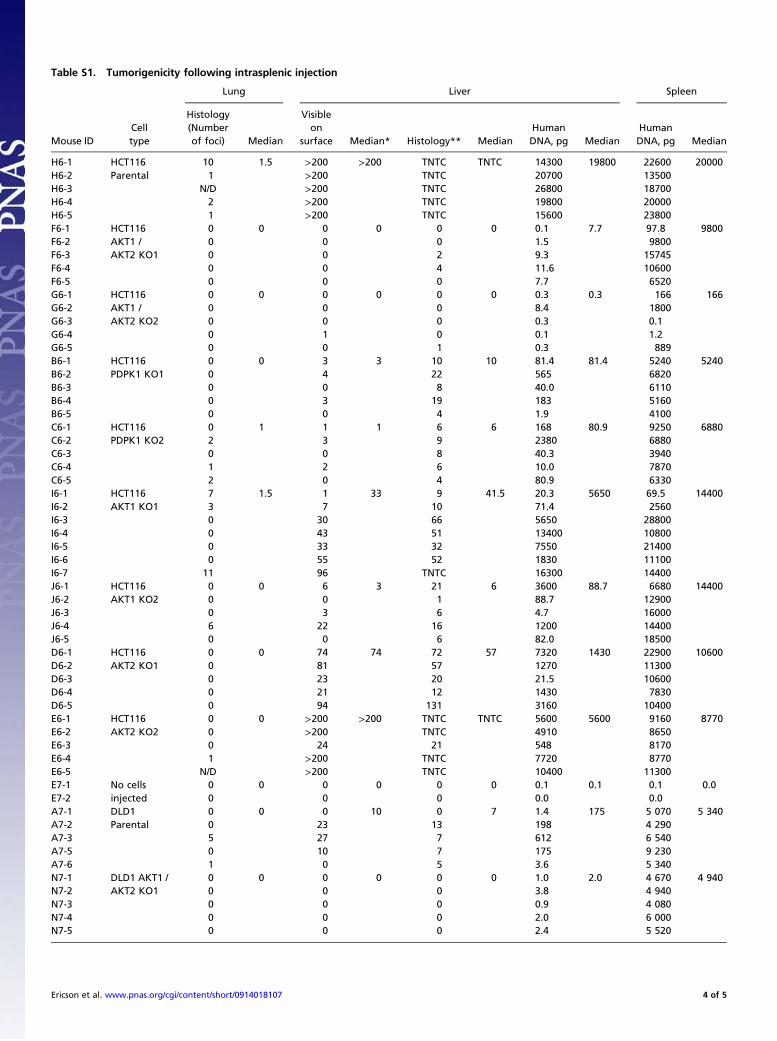
Table S1. Tumorigenicity following intrasplenic injection
Mouse IDCelltype
Lung Liver Spleen
Histology(Numberof foci) Median
Visibleon
surface Median* Histology** MedianHumanDNA, pg Median
HumanDNA, pg Median
H6-1 HCT116Parental
10 1.5 >200 >200 TNTC TNTC 14300 19800 22600 20000H6-2 1 >200 TNTC 20700 13500H6-3 N/D >200 TNTC 26800 18700H6-4 2 >200 TNTC 19800 20000H6-5 1 >200 TNTC 15600 23800F6-1 HCT116
AKT1 /AKT2 KO1
0 0 0 0 0 0 0.1 7.7 97.8 9800F6-2 0 0 0 1.5 9800F6-3 0 0 2 9.3 15745F6-4 0 0 4 11.6 10600F6-5 0 0 0 7.7 6520G6-1 HCT116
AKT1 /AKT2 KO2
0 0 0 0 0 0 0.3 0.3 166 166G6-2 0 0 0 8.4 1800G6-3 0 0 0 0.3 0.1G6-4 0 1 0 0.1 1.2G6-5 0 0 1 0.3 889B6-1 HCT116
PDPK1 KO10 0 3 3 10 10 81.4 81.4 5240 5240
B6-2 0 4 22 565 6820B6-3 0 0 8 40.0 6110B6-4 0 3 19 183 5160B6-5 0 0 4 1.9 4100C6-1 HCT116
PDPK1 KO20 1 1 1 6 6 168 80.9 9250 6880
C6-2 2 3 9 2380 6880C6-3 0 0 8 40.3 3940C6-4 1 2 6 10.0 7870C6-5 2 0 4 80.9 6330I6-1 HCT116
AKT1 KO17 1.5 1 33 9 41.5 20.3 5650 69.5 14400
I6-2 3 7 10 71.4 2560I6-3 0 30 66 5650 28800I6-4 0 43 51 13400 10800I6-5 0 33 32 7550 21400I6-6 0 55 52 1830 11100I6-7 11 96 TNTC 16300 14400J6-1 HCT116
AKT1 KO20 0 6 3 21 6 3600 88.7 6680 14400
J6-2 0 0 1 88.7 12900J6-3 0 3 6 4.7 16000J6-4 6 22 16 1200 14400J6-5 0 0 6 82.0 18500D6-1 HCT116
AKT2 KO10 0 74 74 72 57 7320 1430 22900 10600
D6-2 0 81 57 1270 11300D6-3 0 23 20 21.5 10600D6-4 0 21 12 1430 7830D6-5 0 94 131 3160 10400E6-1 HCT116
AKT2 KO20 0 >200 >200 TNTC TNTC 5600 5600 9160 8770
E6-2 0 >200 TNTC 4910 8650E6-3 0 24 21 548 8170E6-4 1 >200 TNTC 7720 8770E6-5 N/D >200 TNTC 10400 11300E7-1 No cells
injected0 0 0 0 0 0 0.1 0.1 0.1 0.0
E7-2 0 0 0 0.0 0.0A7-1 DLD1
Parental0 0 0 10 0 7 1.4 175 5 070 5 340
A7-2 0 23 13 198 4 290A7-3 5 27 7 612 6 540A7-5 0 10 7 175 9 230A7-6 1 0 5 3.6 5 340N7-1 DLD1 AKT1 /
AKT2 KO10 0 0 0 0 0 1.0 2.0 4 670 4 940
N7-2 0 0 0 3.8 4 940N7-3 0 0 0 0.9 4 080N7-4 0 0 0 2.0 6 000N7-5 0 0 0 2.4 5 520
Ericson et al. www.pnas.org/cgi/content/short/0914018107 4 of 5

Table S1. Cont.
Mouse IDCelltype
Lung Liver Spleen
Histology(Numberof foci) Median
Visibleon
surface Median* Histology** MedianHumanDNA, pg Median
HumanDNA, pg Median
O7-1 DLD1 AKT1 /AKT2 KO2
0 0 0 0 0 0 1.1 0.3 3 327 642O7-2 0 0 0 0.1 50.7O7-3 0 0 0 0.4 807O7-4 0 0 0 0.3 642O7-5 0 0 0 0.1 419H7-1 DLD1
PDPK1 KO10 0 0 0 0 0 0.1 0.2 2 020 2 020
H7-2 0 1 1 0.1 1 110H7-3 0 0 0 0.2 185H7-4 0 0 0 0.7 8 010H7-5 0 1 1 0.4 6 200I7-1 DLD1
PDPK1 KO20 0 0 0 0 0 0.2 0.2 5 400 4 340
I7-2 0 0 0 0.2 4 020I7-3 0 0 0 0.1 6 300I7-4 0 0 0 0.2 4 340I7-5 0 0 0 0.1 1 620F7-1 DLD1
AKT1 KO10 0 15 18 8 7 195 40.6 5 320 5 320
F7-2 1 9 4 0.5 4 710F7-3 0 23 7 600 2 680F7-4 0 19 16 0.6 6 050F7-5 3 18 6 40.6 5 680G7-1 DLD1
AKT1 KO20 0 7 7 1 7 19.6 14.3 11 200 9 030
G7-2 0 5 7 14.3 8 310G7-3 3 7 3 0.5 9 030G7-4 0 11 9 251 9 560G7-5 0 13 12 6.8 5 630J7-1 DLD1
AKT2 KO10 0 0 0 0 1 0.5 0.4 7 340 5 840
J7-2 0 3 1 0.2 2 740J7-4 0 2 2 0.2 6 360J7-5 0 0 1 0.5 6 010J7-7 0 0 1 1.0 4 530J7-8 0 0 0 0.3 5 680K7-1 DLD1
AKT2 KO20 0 0 4 0 0 1.6 2.4 7 550 7 220
K7-2 0 4 3 2.7 7 150K7-3 0 4 0 4.3 5 130K7-4 0 5 0 2.0 7 220K7-5 0 0 1 2.4 7 360E7-1 No cells
injected0 0 0 0 0 0 0.1 0.1 0.1 0.0
E7-2 0 0 0 0.0 0.0
**In the indicated specimens, there were at least 200 foci but the actual number was difficult to count because of adjoining lesions (see Fig. S3).* The number of foci present in a total of five sections, one from each of five lobes of the liver. TNTC: Too numerous to count.
Table S2. Primers used in Fig. 1
Wild-type PDPK1 Forward ACCACCAGCCAGCTGTATGACReverse TCGCATATTCTCTGGAGGTTG
pSEPT inserted in PDPK1 Forward ACCACCAGCCAGCTGTATGACReverse AAGCCTGCCACACCTCAAGC
Wild-type AKT1 Forward AGGCTCCCCTCAACAACTTCReverse CTCCTCCTCCTCCTGCTTCT
pSEPT inserted in AKT1 Forward CCTCGCAGACAGCGAATTAReverse ATGGCACCTTCATTGGCTAC
Wild-type AKT2 Forward GGTGCCTCCTGCATGTCCReverse CCTCTCGGTCTTCATCAGC
pSEPT inserted in AKT2 Forward GGTGCCTCCTGCATGTCCReverse AAGCCTGCCACACCTCAAGC
Ericson et al. www.pnas.org/cgi/content/short/0914018107 5 of 5