supporting information interaction-dependent pcr ...evolve.harvard.edu/67-idpcr-jacs-si.pdfprimer...
TRANSCRIPT

SI-1
Supporting Information
Interaction-Dependent PCR: Identification of Ligand-Target Pairs from Libraries of
Ligands and Libraries of Targets in a Single Solution-Phase Experiment
Lynn M. McGregor, David J. Gorin, Christoph E. Dumelin and David R. Liu*
Department of Chemistry and Chemical Biology and Howard Hughes Medical Institute
Harvard University, 12 Oxford Street, Cambridge, Massachusetts 02138
Table of Contents
I. Materials and Methods
A. General Methods SI-2
B. Oligonucleotide Sequences SI-2
C. Synthesis and Purification of Oligonucleotide Conjugates SI-5
D. IDPCR Methods
i. Primer Extension and qPCR SI-9
ii. IDPCR in a Library Format SI-10
iii. IDPCR of a Ligand Library and a Target Library in a Single Solution SI-12
E. Ligand-Target Affinity Measurements SI-13
II. Supporting Results
A. Optimization of Length of Complementary Region SI-14
B. Effect of Ligand-Oligonucleotide Linker Length SI-15
C. Affinities of DNA-linked Ligands SI-16
D. Detection of Multivalent Analytes by IDPCR SI-17
E. PAGE Characterization of DNA-Protein Conjugates SI-18
F. Tables Summarizing DNA Sequencing Results SI-19
III. References Cited SI-20

SI-2
I. Materials and Methods
General Methods
All chemical reagents were purchased from Sigma-Aldrich, unless otherwise noted.
Water was purified with a Milli-Q purification system. DNA oligonucleotides were synthesized
on a PerSeptive Biosystems Expedite 8909 DNA synthesizer or purchased from Integrated
DNA Technologies. All reagents and phosphoramidites for DNA synthesis were purchased
from Glen Research. All oligonucleotides were synthesized and deprotected according to
manufacturer’s protocols. Oligonucleotides were purified by reverse-phase high-pressure liquid
chromatography (HPLC, Agilent 1200) using a C18 stationary phase (Eclipse-XDB C18, 5 µm,
9.4 x 200 mm) and an acetonitrile/ 100 mM triethylammonium acetate gradient.
Oligonucleotide concentrations were quantitated by UV spectroscopy using a Nanodrop
ND1000 spectrophotometer. Non-commercial oligonucleotides were characterized by LC/ESI-
MS; reverse-phase separation was performed on an Alliance 2695 (Waters) HPLC system using
a UPLC BEH C18 column (1.7 µm, 2.1 x 50 mm) stationary phase and 6 mM aqueous
triethylammonium bicarbonate/methanol mobile phase interfaced to a Q-Tof Micro mass
spectrometer (Waters). Oligonucleotides greater than 70 nt in length were analyzed by PAGE.
DNA Sequences
In the sequences below: <3> = biotinTEG phosphoramidite (Glen Research, 10-1955);
<4> = 3’Thiol Modifier C6 S-S (20-2936); <5> = 3’biotinTEG (20-2955); <6> =
3’desthiobiotinTEG (20-2952); <7> = Spacer 18 (10-1918); <8> = 5’CarboxyC10 (10-1935);
<9> = 3’aminoC6 (20-2956); <0> = Cy3 (10-5913) and N is an equimolar solution of A, T, C,
and G phosphoramidites. Underlined sequences are barcodes or sequences recognized by
restriction endonucleases. Italicized portions of primer sequences are adaptor sequences
required for Illumina sequencing.1
1, 1b, 1c: 5’-<8><7>CGGCGATCGTGAAGGAGGCTAGACTGAGTGAG-3’
1a: 5’-<8><7><0>CGGCGATCGTGAAGGAGGCTAGACTGAGTGAG-3’
1 Oligonucleotide sequences ©2007-2009. Illumina, Inc. All rights reserved.

SI-3
positive control: 5’-TGGATCGTGATGACTGTCCCGACAAGCATACGTATCTCACTCAGT<9>-3’
2: 5’-TGGATCGTGATGACTGTCCCGACAAGCATACGTATCTCACT<7><7><9>-3’
2a-biotin:
5’-TGGATCGTGATGACTGTCCCGACAAGCATACGTATCTCACT<7><7><5>-3’
3a-biotin: 5’-TGGATCGTGATGACTGTCCCGACAAGCATACGTATTACTAG<7><7><5>-3’
2b-desthiobiotin:
5’-TGGATCGTGATGACTGTCCCGACAAGCATACGTATCTCACT<7><7><6>-3’
2c-antipain, 2d-CBS, 2e-GLCBS:
5’-TGGATCGTGATGACTGTCCCGACAAGCATACGTATCTCACT<7><7><9>-ligand-3’
3b: 5’-5’-TGGATCGTGATGACTGTCCCGACAAGCATACGTATTACTAG<7><7><9>-3’
3c-CBS: 5’-TGGATCGTGATGACTGTCCCGACAAGCATACGTATTACTAG<7><7><9>-CBS-3’
1d-aptamer: 5’-ACCATCTGTGTAAGGGGTAAGGGGTGGGGGTGGGTACGTCTCGGCGATCGTGAAGGAGACT
GAGTGAG-3’
2f: 5’-GGATTCTGTATGACTGTCCCACGTATCTCACT<7><4>-3’
2g-Dn, 2h-Dx: 5’-GGATTCTGTATGACTGTCCCACGTATCTCACT<7><4>-linker-ligand-3’
2i-biotin: 5’-TGGATCGTGATGACTGTCCCGACAAGAATTCGTATCTCACT<7><7><5>-3’
2k-GLCBS: 5’-TGGATCGTGATGACTGTCCCGACAAGCTTACGTATCTCACT<7><7><9>-GLCBS-3’
1f-aptamer: 5’-ACCATCTGTGTAAGGGGTAAGGGGTGGGGGTGGGTACGTCTCGGCGATCGTGAAGGAG
TAAGCTACTGAGTGAG-3’
1g-aptamer: 5’-ACCATCTGTGTAAGGGGTAAGGGGTGGGGGTGGGTACGTCTCGGCGATCGTGAAGGAGATG
CATACTGAGTGAG -3’
1h-unstructured DNA: 5’-ATTGATCACTTGATTTCTGCCCATTGATTAAAGTCGCAAGTCGGCGATCGTG
AAGGAGTAAGCTACTGAGTGAG-3’
2l: 5’-TGGATCGTGATGACTGTCCCGACAAGCATACGTATCTCACT<7><4>-3’
2m: 5’-TGGATCGTGATGACTGTCCCGACAAATGCATGTATCTCACT<7><4>-3’
2n-Dn: 5’-TGGATCGTGATGACTGTCCCGACAAATGCATGTATCTCACT<7><4>-linker-Dn-3’
1i: 5’-<8><7>CGGCGATCGTGAAGGAGGCTCGAGTGAGTGAG-3’
1k: 5’-<8><7>CGGCGATCGTGAAGGAGGCTAGCCTGAGTGAG-3’
1j: 5’-<8><7>CGGCGATCGTGAAGGAGGANNNNTTGAGTGAG-3’
2o-CBS: 5’-TGGATCGTGATGACTGTCCCGACAAGCTTACGTATCTCACT<7><7><9>-CBS-3’
2p: 5’-TGGATCGTGATGACTGTCCCGACAACCATGGGTATCTCACT<7><7><9>-3’
2q-desthiobiotin:
5’-TGGATCGTGATGACTGTCCCGACAACCATGGGTATCTCACT<7><7><9>-desthiobiotin-3’
2r:5’-TGGATCGTGATGACTGTCCCGACAAGGATCCGTATCTCACT<7><7><9>-3’
2s-GLCBS: 5’-TGGATCGTGATGACTGTCCCGACAAGGATCCGTATCTCACT<7><7><9>-GLCBS-3’
2t: 5’-TGGATCGTGATGACTGTCCCGACAAAGTACTGTATCTCACT<7><7><9>-3’
2u-antipain:5’-TGGATCGTGATGACTGTCCCGACAAAGTACTGTATCTCACT<7><7><9>-antipain-3’
2v-amine: 5’-TGGATCGTGATGACTGTCCCGACAATNNNNAGTATCTCACT<7><7><9>-3’
Primer A: 5’-TGGATCGTGATGACTGTCCC-3’

SI-4
Primer B: 5’-CGGCGATCGTGAAGGAG-3’
Primer C: 5’-AATGATACGGCGACCACCGAGATCTACACTCTTTCCCTACACGACGCTCTTCCGATCTTT
CTCGCGGCGATCGTGAAGGAG-3’
Primer D: 5’-AATGATACGGCGACCACCGAGATCTACACTCTTTCCCTACACGACGCTCTTCCGATCTTCT
ACCCGGCGATCGTGAAGGAG-3’
Primer E: 5’-CAAGCAGAAGACGGCATACGAGCTCTTCCGATCTTGGATCGTGATGACTGTCCC-3’
Figure S1:
1 – 4 nt overlap: 5’-<8><7>CGGGGATCGTGAAGGAGGCTAGACTG-3’
1 – 6 nt overlap: 5’-<8><7>CGGGGATCGTGAAGGAGGCTAGACTGAG-3’
1 – 8 nt overlap: 5’-<8><7>CGGGGATCGTGAAGGAGGCTAGACTGAGTG-3’
1 – 10 nt overlap: 5’-<8><7>CGGGGATCGTGAAGGAGGCTAGACTGAGTGAG-3’
2: 5’-TGAGTCGTGATGACTGTCCCGACAAGCTTACGTATCTCACTCAGT<9>-3’
hairpin – 4 nt overlap: 5’-TGAGTCGTGATGACTGTCCCGACAAGCTTACGTATCTCACTCAG<7>
CGGGGATCGTGAAGGAGGCTAGACTG-3’
hairpin – 6 nt overlap: 5’-TGAGTCGTGATGACTGTCCCGACAAGCTTACGTATCTCACTCAG<7>
CGGGGATCGTGAAGGAGGCTAGACTGAG-3’
Figure S2:
2-biotin-17: 5’-TGGATCGTGATGACTGTCCCGACAAGCATACGTATCTCACT<5>-3’
2-biotin-38: 5’-TGGATCGTGATGACTGTCCCGACAAGCATACGTATCTCACT<7><5>-3’
2-biotin-80: 5’-TGGATCGTGATGACTGTCCCGACAAGCATACGTATCTCACT<7><7><7><5>-3’
2-biotin-101: 5’-TGGATCGTGATGACTGTCCCGACAAGCATACGTATCTCACT<7><7><7><7><5>-3’
2-biotin-123: 5’-TGGATCGTGATGACTGTCCCGACAAGCATACGTATCTCACT<7><7><7><7><7><5>-
3’
2-amine-7: 5’-TGGATCGTGATGACTGTCCCGACAAGCATACGTATCTCACT<9>-3’
2-amine-28: 5’-TGGATCGTGATGACTGTCCCGACAAGCATACGTATCTCACT<7><9>-3’
2-amine-70: 5’-TGGATCGTGATGACTGTCCCGACAAGCATACGTATCTCACT<7><7><7><9>-3’
2-amine-91: 5’-TGGATCGTGATGACTGTCCCGACAAGCATACGTATCTCACT<7><7><7><7><9>-3’
2-amine-112: 5’-TGGATCGTGATGACTGTCCCGACAAGCATACGTATCTCACT<7><7><7><7><7><9>-
3’
2-antipain-7: 5’-TGGATCGTGATGACTGTCCCGACAAGCATACGTATCTCACT<9>-antipain-3’
2-antipain-28: 5’-TGGATCGTGATGACTGTCCCGACAAGCATACGTATCTCACT<7><9>-antipain-3’
2-antipain-70: 5’-TGGATCGTGATGACTGTCCCGACAAGCATACGTATCTCACT<7><7><7><9>-
antipain-3’
2-antipain-91: 5’-TGGATCGTGATGACTGTCCCGACAAGCATACGTATCTCACT<7><7><7><7><9>-
antipain-3’
2-antipain-112: 5’-
TGGATCGTGATGACTGTCCCGACAAGCATACGTATCTCACT<7><7><7><7><7><9>-antipain-3’
2-GLCBS-7: 5’-TGGATCGTGATGACTGTCCCGACAAGCATACGTATCTCACT<9>-GLCBS-3’
2-GLCBS-28: 5’-TGGATCGTGATGACTGTCCCGACAAGCATACGTATCTCACT<7><9>-GLCBS-3’

SI-5
2-GLCBS-70: 5’-TGGATCGTGATGACTGTCCCGACAAGCATACGTATCTCACT<7><7><7><9>-GLCBS-3’
2-GLCBS-91: 5’-TGGATCGTGATGACTGTCCCGACAAGCATACGTATCTCACT<7><7><7><7><9>-
GLCBS-3’
2-GLCBS-112: 5’-TGGATCGTGATGACTGTCCCGACAAGCATACGTATCTCACT<7><7><7><7><7><9>-
GLCBS-3’
Figure S3:
1e-biotin: 5’-<3><7>CGGCGATCGTGAAGGAGGCTAGACTGAGTGAG-3’
Figure S4:
complementary 20mer: 5’-GGGACAGTCATCACGA<0>TCCA-3’
Synthesis of Ligand-DNA Conjugates
2a-biotin, 2b-desthiobiotin, and 3a-biotin were prepared directly during
oligonucleotide synthesis using commercially available phosphoramidites. 2c, 2d, 2e, 2k, 2o,
2q, 2s, 2u, and 3c were prepared by conjugating antipain, CBS, GLCBS, or desthiobiotin
(referred to below as the “ligand”) to the corresponding 3’ amine modified oligonucleotide
(sequences 2 or 3 above). To 215 µL DMSO was added the ligand (1.25 µmol in 12.5 µL
DMSO), sulfo-NHS (sNHS, 3.33 µmol in 10 µL 2:1 DMSO:H2O), and 1-ethyl-3-(3-
dimethylaminopropyl carbodiimide) (EDC, 1.2 µmol in 12 µL DMSO). After the reaction
mixture (final volume = 249.5 µL) was stirred at room temperature for 30 minutes, 3’-amine
modified oligonucleotide (5 nmol in 10 µL H2O) and triethylamine/HCl pH 10 (50 µL of a
500mM stock solution) were added. The reaction was stirred at room temperature for 12 hours.
Tris-HCl, pH 8.0 (20 µL of a 500 mM stock solution) was added and the reaction mixture was
incubated for 1 hour at room temperature. The products were purified by reverse-phase HPLC,
precipitated with ethanol, and characterized by UV/Vis spectroscopy and LC/MS.
Synthesis of DNA-Daunomycin and DNA-Doxorubicin Conjugates
To 3’ dithiol-modified DNA (4 nmol in 37.5 µL 1xPBS buffer, sequence 2f or 2m
above) were added 7.5 µL of 500 mM pH 8 HEPES buffer and 5 µL of 1 M aqueous DTT.
After 30 minutes at room temperature, the DNA fraction was isolated by size exclusion
chromatography (SEC) using Centri-Sep spin columns (Princeton Separations, Inc.). To the
deprotected 3’ thiol-modified DNA was then added 29 µL of 3xPBS buffer supplemented with
3 mM EDTA and the appropriate small molecule (daunomycin or doxorubicin) (200 nmol in 20
µL of 10 mM pH 7.4 Tris-HCl buffer). The bifunctional linker SM(PEG)24 (Piercenet) was then

SI-6
added (100 nmol in 1 µL of DMSO). After brief agitation, the reaction mixture was incubated
at room temperature for 90 minutes, and then purified by SEC using a Nap-5 column (GE
Healthcare). The product was further purified by HPLC, and characterized by UV/Vis
spectroscopy and LCMS.
LC/MS Characterization of Oligonucleotides and Ligand-Oligonucleotide Conjugate
All raw data were processed using MassLynx MaxEnt1 (Waters Micromass) to obtain
the deconvoluted mass using m/z 1500-5000 and the following MaxEnt1 parameters: 5000 Da
output mass range around expected mass (from 5000 to 25000 Da, depending on construct); 0.1
Da output resolution; minimum intensity ratio left and right, 33%; width at half height for
uniform Gaussian model, 0.75; number of iterations, 10.

SI-7

SI-8
Synthesis of Protein-DNA Conjugates
To 50 µL of sodium MES buffer (50 mM, pH 5.4) was added sNHS (1.6 mmol in 5 µL
2:1 DMSO: H2O), EDC (500 nmol in 5 µL DMSO), and the corresponding 5’ carboxylate
modified oligonucleotide (0.8-7 nmol in 22-35 µL water, sequences 1, 1a, 1b, 1c, 1i, 1k, or 1j
above). The resulting solution was incubated at room temperature for 30 minutes and then
subjected to SEC using an Illustra MicroSpin G-25 spin column (GE Healthcare). The
corresponding protein (0.4-5.7 nmol protein in 5-50 µL PBS of streptavidin (New England
Biolabs), bovine carbonic anhydrase II, bovine trypsin, or glutathione S-transferase (Sigma
Aldrich)) was added to a final stoichiometry of ~0.7:1 protein:DNA. The reaction mixture was
incubated at room temperature for 4 hours, then quenched by addition of Tris-HCl pH 8.0 (10
µL of a 500 mM stock solution). The protein-DNA conjugates were purified by SEC on a
Sephadex 75 10/300 column (GE Healthcare) using an ÄKTA FPLC (Amersham Biosciences)
over 1.5 column volumes at a flow rate of 0.8 mL/min in 1xPBS. Fractions were characterized
by SDS-PAGE (Figure S5). 1a-SA was quantitated by UV-Vis spectroscopy using absorption
of the Cy3 chromophore.
Synthesis of Gly-Leu-CBS
4-carboxy benzene sulfonamide (20 µmol in 20 µL dry DMF (J.T. Baker), N-
hydroxysuccinimide (22 µmol in 22 µL dry DMF), and EDC-HCl (14 µmol in 140 µL dry
DMF) were mixed together and stirred at room temperature for 4 hours. The dipeptide H-
leucine-glycine-OH (2 µmol in 20 µL dry DMF) and DIPEA (1.2 µL, 8 µmols) were added and
the resulting mixture was stirred overnight at room temperature. ESI-MS calculated for [M-H+]-
: 370.41 Found : 369.97. 1H NMR (DMSO-d6, 500 MHz) δ 8.72 (d, 1H, J = 8.5 Hz), 8.30 (t, 1H,
J = 5.5 Hz), 8.09 (d, 2H, J = 8 Hz), 7.94 (d, 2H, J = 8 Hz), 7.52 (s, 2H), 4.61 (m, 1H), 3.77 (m,
2H), 1.72 (m, 2H), 1.62 (m, 1H), 0.95 (d, 3H, J = 6.5 Hz), 0.92 (d, 3H, J = 6.5 Hz). 13C NMR
(DMSO-d6, 125 MHz) δ 173.0, 171.8, 166.0, 147.0, 137.7, 128.9, 126.2, 52.4, 41.5, 41.0, 25.1,
23.8, 22.0.

SI-9
Primer Extension with Klenow Fragment
An extension mixture consisting of 10x NEB Buffer 2 (2 µL), dNTPs (660 pmol each in
2 µL water, Bio-Rad), and the target strand (200 fmol in 9 µL PBS) was incubated at 37 °C for
5 minutes. The appropriate ligand strand (200 fmol in 2 µL water) was added and the reaction
mixture was incubated at 37 °C for 15 minutes. Klenow fragment exo– (2.5 U in 5 µL of 1x
NEB Buffer 2, New England Biolabs) was added. The primer extension reaction (final volume
= 20 µL) was incubated at 37 °C for 15 minutes. The polymerase was inactivated by heating to
75 °C for 20 minutes.
Primer Extension Conditions for Aptamer Experiments
The aptamer-DNA conjugate, (1d-aptamer, 1f-aptamer, 1g-aptamer, or 1h-
unstructured listed above) (200 pmol), was diluted into 18 µL extension buffer (1x NEB
Buffer 2 supplemented with 1 mM CaCl2, 5 mM KCl, and 33 µM dNTPs). This solution was
heated to 95 °C, then gradually cooled to 37 °C and incubated for 15 minutes. If required,
excess small molecule was then added and the resulting solution was incubated for 15 minutes
at 37 °C. The DNA-ligand conjugate (200 pmol in 2 µL) was added and the resulting solution
was incubated for 15 minutes at 37 °C. The extension reaction was initiated by the addition of
Klenow fragment exo– (1 U in 2 µL 1x NEB Buffer 2). After 15 minutes, the polymerase was
inactivated by heating to 75 °C for 20 minutes.
Quantitative PCR (qPCR) Analysis of Primer Extension Reactions
For each 25 µL qPCR reaction, 12.5 µL of 2x SYBR Green iQ Supermix (Bio-Rad) was
combined with 1 µL of 10 µM Primer A, 1 µL of 10 µM Primer B, and 9.5 µL Milli Q H2O.
Unless otherwise stated, the primer extension products were diluted 1:100 into H2O and 1 µL of
this solution was added to the mixture described above. Quantitative PCR was performed using
a CFX-96 Real-Time System with a C1000 Thermal Cycler (Bio-Rad). PCR conditions: 5 min
at 95 °C, then 40 cycles of [30 sec at 95 °C, 30 sec at 50 °C, 30 sec at 72 °C].
IDPCR on Single Target-Ligand Pairs (Figures 1 & 2)
All primer extension and qPCR reactions were performed as described above, except
that free ligand (200 pmol in 2 µL 10% DMSO) or DMSO (2 µL of 10% DMSO) was added

SI-10
when appropriate. To verify that the observed qPCR threshold cycles correlated with
formation of PCR product, we performed gel electrophoresis analyses of PCR reactions halted
at the cycle threshold value of the matched ligand-target Klenow extension. Unless otherwise
noted, PCR products were analyzed by PAGE on 10% TBE gels at 200 V for 25 minutes
staining with ethidium bromide and imaging on a ChemiImager (AlphaInnotech).
The ligand strands, targets, and PCR conditions were as follows. For streptavidin (1a-
SA), the following ligand strand sequences were used: positive control, 3a-biotin, 2, 2a-biotin
and 2b-desthiobiotin; PCR was performed for 20 cycles (Figure 1b). For trypsin (1b-trypsin),
the following ligand strand sequences were used: positive control, 2, 2a-biotin, 2e-GLCBS,
and 2c-antipain; PCR was performed for 20 cycles (Figure 1c). For carbonic anhydrase (1c-
CA), the following ligand strand sequences were used: positive control, 3b-CBS, 2, 2a-biotin,
2d-CBS and 2e-GLCBS; PCR was performed for 24 cycles (Figure 1d). For the aptamer (1d-
aptamer), the following sequences were used: 2f, 2g-Dn, and 2h-Dx; PCR was performed for
23 cycles (Figure 1e). In this case, the products were stained with SYBRI (Invitrogen) and
imaged on a Typhoon Trio Imager (Amersham).
IDPCR in a Library Format (Figure 2)
In order to investigate the enrichment of DNA encoding ligand-target pairs in the
presence of excess nonbinding ligand conjugates, a series of IDPCR experiments were
conducted with mixtures of binding conjugate and nonbinding conjugates. These mixtures were
subjected to Klenow extension either in the presence of the target conjugate (the “selection”
case) or a target strand lacking protein (the “negative control” case). Primer extension reactions
were performed with constant concentrations of a nonbinding ligand-DNA conjugate (10 nM)
and varying concentrations of a binding ligand-DNA conjugate (1 nM, 100 pM, 10 pM). The
appropriate cycle number for each reaction was determined by qPCR evaluation, such that
preparative PCR reactions (50 µL total volume) were stopped in the exponential amplification
phase, in order to minimize dynamic compression during PCR. An aliquot (16 µL) of the PCR
reaction mixture was then incubated with the appropriate restriction enzyme (Figure 2b: EcoRI;
Figure 2c: HindIII; Figure 2 d,e: NsiI). All restriction enzymes were purchased from New
England Biolabs. The resulting samples were analyzed by PAGE as described above (10%
TBE, 200 V, 25 minutes).

SI-11
Figure 2b:
Figure 2c:
Figure 2d:
Figure 2e:

SI-12
*indicates samples that were not diluted 100-fold prior to qPCR
IDPCR of a Ligand Library and Target Library in a Single Solution (Figure 3)
Primer extension was performed with ligand sequences (40 pM each 2i-biotin, 2q-
desthiobiotin, 2s-GLCBS, 2o-CBS, and 2u-antipain and 9.8 nM 2v) and target sequences (60
pM each 1a-SA, 1i-CA and 1j-trypsin and 9.8 nM 1k-GST) such that the reaction contained an
equimolar quantity of each of 261 ligand sequences and 259 target sequences. A control primer
extension reaction was also performed using the same pool of ligand strands, but with a pool of
target strands lacking conjugated proteins (1, 1i, 1j, 60 pM each and 1k, 9.8 nM). Adapter
sequences required for Illumina sequencing, as well as barcodes identifying the input and
selection experiments, were installed by PCR with either Primer C (input control) or Primer D
(selection) and Primer E. The appropriate cycle number for each reaction was determined by
qPCR evaluation, such that preparative PCR reactions (50 µL total volume) were stopped in the
exponential amplification phase in order to minimize dynamic compression during PCR. PCR
product was purified by gel (3% agarose, 200V, 20 min followed by Qiagen Extraction Kit),
quantitated using PicoGreen (Invitrogen), and pooled in equimolar amounts (10 nM total DNA)
for sequencing. Sequencing was performed on an Illumina (Solexa) Genome Analyzer II (FAS
Center for Systems Biology, Harvard University).
Approximately 500,000 sequence reads were obtained after sequencing and data
processing using MATLAB2: 286,784 from the selection experiment, and 189,133 from the
control (no protein) experiment. Due to the large number of possible sequences, many of the
67,599 possible sequences were not observed. A value of 1 was therefore added to the number
of observed counts in the input and selection datasets for every sequence. The observed
sequence counts were normalized (results from selection were divided by 286,784 and results
from control were divided by 189,133). Enrichment factors were determined by dividing the
fraction of total counts observed for each sequence after selection by the fraction of total counts
observed for that sequence in the input control. The resulting set of enrichment factors are
plotted in Figure 2 and described in Tables S1 and S2.
2 The MATLAB script was run on the Odyssey Cluster supported by the FAS Sciences Division Research Computing Group. Code is available upon request.

SI-13
Ligand-Target Affinity Measurements (Figure S3)
CBS, 2d-CBS, GLCBS and 2s-GLCBS / carbonic anhydrase complex (Figures S3a-
b). Enzymatic activity was measured by adopting a previously described method:1 carbonic
anhydrase (20 pmol for CBS and 2d-CBS, 4 pmol for GLCBS and 2s-GLCBS) was diluted in
180 µL assay buffer (PBS, 5% DMSO) and incubated with various concentrations of inhibitor
for 10 minutes at room temperature and then for 5 minutes at 37˚C before addition of a
chromogenic substrate, 4-nitrophenyl acetate (2 mmol in 20 µL acetonitrile). The change in
absorbance signal (400 nm) was measured over 10 minutes at 37˚C using a SpectraMax
microplate reader. The data obtained at various inhibitor concentrations was plotted and the Ki
was determined by fitting the equation below.
Antipain, 2e-antipain / trypsin complex (Figure S3d). Conditions were adopted from
a previously reported protocol.2 Trypsin (200 fmol) was diluted in 90 µL PBS and was
incubated with various concentrations of antipain, a known inhibitor of tryptic proteolysis, or
2e-antipain. The solution was equilibrated at room temperature for 10 minutes and at 35˚C for
5 minutes before addition of the fluorogenic proteolytic substrate Z-Arg-AMC (Bachem) (10
nmol in 10 µL 50% DMSO) (final volume = 100 µL). The change in fluorescence signal (ex:
383 nm; em: 455 nm; cutoff filter: 420 nm) was measured over 10 minutes at 35˚C using a
SpectraMax microplate reader, and fitting of results obtained at various concentrations of
inhibitor enabled determination of Ki (see equation below).
Equation used to fit Ki from inhibitory curves (Figures S3a, b, d). The Ki was
determined by fitting the following equation to the plot of normalized activity vs. inhibitor
concentration: Vo = c + d(([E]tot + [I]tot + Ki) – sqrt((-[E]tot - [I]tot - Ki)^2-
4*[E]tot*[I]tot))/(2*[E]tot), where Vo is initial reaction velocity, [E]tot is total enzyme
concentration, [I]tot is total inhibitor concentration; c and d are variable parameters for the
maximum Vo and for the difference between the minimum and maximum Vo, respectively.
2b-desthiobiotin / streptavidin complex by gel shift (Figure S3c). The DNA-ligand
conjugate 2b-desthiobiotin was hybridized to a complementary 20-mer carrying a Cy3 label at
the 3’ end. The resulting duplex (10 nM) was incubated with increasing concentrations of
streptavidin in binding buffer (145 mM NaCl, 10 mM Tris/HCl, 10 mM MgCl2, 7 mM Na2PO4,
1.9 mM KCl, 1mM dithiothreitol, pH 7.4), for 1 h and analyzed on a 20% TBE polyacrylamide
gel. The appearance of a higher molecular weight band indicated formation of a streptavidin-
SI-14
2b-desthiobiotin complex. The apparent Kd was determined from the streptavidin
concentration for which the bands corresponding to free DNA and to the complex were of
approximately equal intensity.
II. Supporting Results
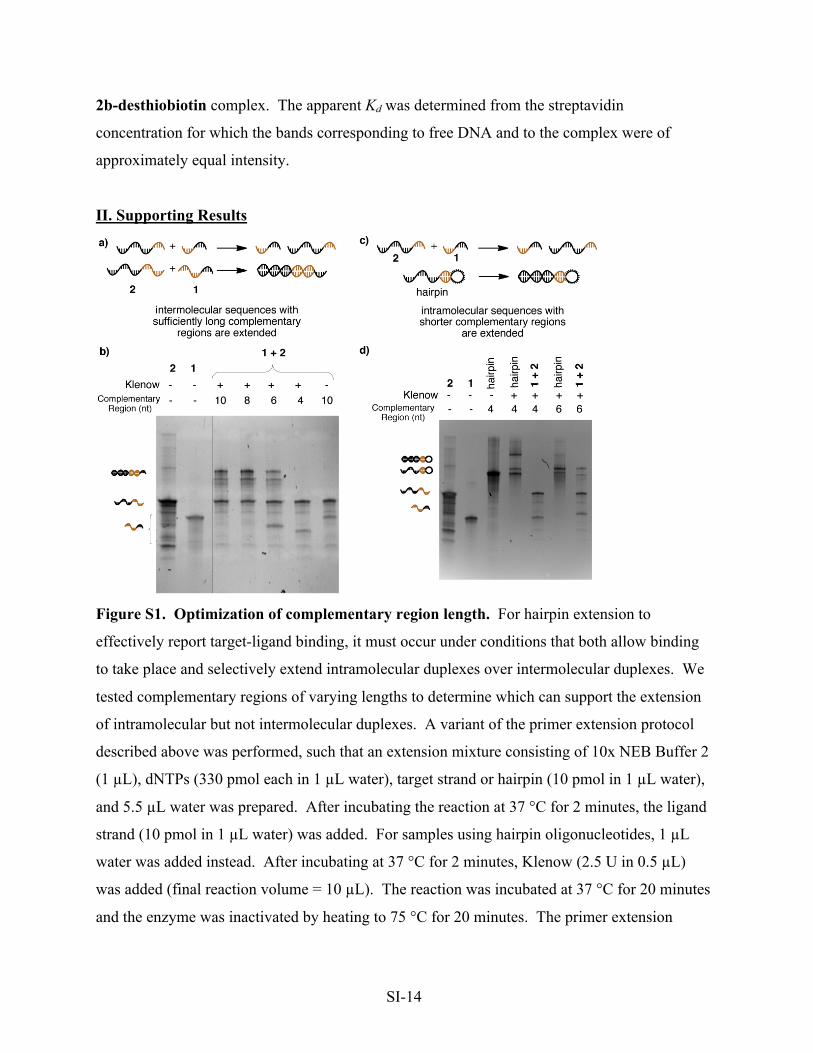
Figure S1. Optimization of complementary region length. For hairpin extension to
effectively report target-ligand binding, it must occur under conditions that both allow binding
to take place and selectively extend intramolecular duplexes over intermolecular duplexes. We
tested complementary regions of varying lengths to determine which can support the extension
of intramolecular but not intermolecular duplexes. A variant of the primer extension protocol
described above was performed, such that an extension mixture consisting of 10x NEB Buffer 2
(1 µL), dNTPs (330 pmol each in 1 µL water), target strand or hairpin (10 pmol in 1 µL water),
and 5.5 µL water was prepared. After incubating the reaction at 37 °C for 2 minutes, the ligand
strand (10 pmol in 1 µL water) was added. For samples using hairpin oligonucleotides, 1 µL
water was added instead. After incubating at 37 °C for 2 minutes, Klenow (2.5 U in 0.5 µL)
was added (final reaction volume = 10 µL). The reaction was incubated at 37 °C for 20 minutes
and the enzyme was inactivated by heating to 75 °C for 20 minutes. The primer extension

SI-15
reaction was analyzed by PAGE (15% TBE-Urea, 200V, 20 minutes, stained with SYBRI,
imaged on a ChemiImager).
Complementary overlap regions 10 nt and 8 nt in length were efficiently extended
intermolecularly, while analogous intermolecular constructs with 6 nt and 4 nt complementary
regions were extended poorly or not at all (a and b). Incorporating the 6-nt and 4-nt
complementary regions into intramolecular constructs, however, dramatically increased their
extension efficiency compared with the corresponding intermolecular constructs (c and d).
These results suggest that complementary regions shorter than 8 nt are best suited to benefit
from the effective molarity increase caused by target-ligand binding.
B
B
BB
B B
J
J
J
J J
H
H
HH H H
0
2
4
6
8
10
12
0 20 40 60 80 100 120 140
B BiotinJ GLCBSH Antipain
Number of Atoms in Linker
! C T
Figure S2. The affect of ligand-oligonucleotide linker length on IDPCR efficiency.
Because target-ligand binding involves complexes of large and variable size that might
influence complementary region hybridization in unanticipated ways, we sought to understand
the structural requirements for successful IDPCR. We performed IDPCR on 1a-SA and 2a-
biotin conjugates, while varying the length of the linker between the biotin group and the DNA
oligonucleotide from 4 to 34 polyethyleneglycol (PEG) units. Primer extension and qPCR
reactions were performed as described above (SI-9 and SI-10). For streptavidin (1a-SA), the
following ligand strand sequences were used: 2-biotin-17, 2-biotin-38, 2a-biotin, 2-biotin-80,
2-biotin-101, and 2-biotin-123. For trypsin (1j-trypsin), the following ligand strand sequences
were used: 2-antipain-7, 2-antipain-28, 2c-antipain, 2-antipain-70, 2-antipain-91, and 2-
antipain-113. For carbonic anhydrase (1c-CA), the following ligand strand sequences were
used: 2-GLCBS-7, 2-GLCBS-28, 2e-GLCBS, 2-GLCBS-70, and 2-GLCBS-91.

SI-16
As linker length was increased from 4 to 16 PEG units (7 to 59 atoms), we observed an
increase in ∆CT values upon ligand-receptor binding towards the positive control value of 8
cycles (not shown), suggesting that the DNA-ligand linker must be sufficiently long to
simultaneously accommodate ligand-target binding, primer-template hybridization, and DNA
polymerase binding. As the length of the PEG linker was further increased from 16 to 34 PEG
units, ∆CT values slowly decreased, consistent with the expected decrease in effective molarity
of the primer and template as the linker is further lengthened. Similar results were obtained
from analogous experiments performed with 1b-trypsin and 2c-antipain sequences and with
1c-CA and 2e-GLCBS sequences. Collectively, these results demonstrate that a single linker
structure is appropriate for the three targets investigated here and suggest that IDPCR will be
able to accommodate targets of varying size and relative orientation.
Figure S3. Affinities of ligands and ligand-DNA conjugates for protein targets. The
binding, annealing, and extension steps of IDPCR are performed at 37˚C, and for this reason,
the affinity measurements for carbonic anhydrase and trypsin were taken at this temperature. (a)
The affinity of 2d-CBS for carbonic anhydrase is 1.50 µM, and is approximately 5-fold higher
than the affinity of CBS for CA (7.53 µM). This difference is likely due to the presence of the

SI-17
hydrophobic hexylamine at the 3’ end of the oligonucleotide, rather than an effect of the
oligonucleotide itself; it is well known that derivatives of CBS containing hydrophobic groups
at this position have increased affinities for carbonic anhydrase.3 (b) As previously reported,4
addition of a hydrophobic dipeptide (gly-leu) to CBS increased its affinity for CA (GLCBS Ki =
470 nM). Conjugation of GLCBS to DNA did not greatly affect its affinity for CA (2s-GLCBS
Ki = 380 nM). (c) The apparent Kd of 2b-desthiobiotin for streptavidin is 8 nM. (d) Antipain
and 2c-antipain have similar affinities for trypsin (Ki = 39.5 nM and Ki = 21.7 nM,
respectively).
Figure S4. Detection of multivalent analytes by IDPCR. (a) Scheme for detection of
multivalent analytes using IDPCR. A noncovalent interaction can replace the covalent bond
between the target and the target strand. In the presence of the analyte, a ternary complex
comprising the analyte and two ligands forms, promoting hybridization of the complementary
regions on the ligand-linked oligonucleotides and resulting in increased amplification efficiency
of the DNA. (b) 200 fmol of 1e-biotin or 1 and 200 fmol of 2a-biotin or 2 were diluted in 14

SI-18
µL of 1.5x NEB Buffer 2. After incubation at 94 ˚C for 5 minutes followed by 5 minutes at 37
˚C, 1 µL of H2O with or without 100 fmol of streptavidin was added. Following incubation at
37 ˚C for 15 minutes, Klenow Fragment exo– (2.5 U in 5 µL H2O pre-equilibrated at 37 ˚C) was
added. The primer extension reaction was incubated at 37 °C for 15 minutes. The polymerase
was inactivated by heating to 75 °C for 20 minutes. The extension reaction was subjected to
qPCR as described above. Samples containing 1e-biotin, 2a-biotin, and streptavidin are
amplified more efficiently than samples lacking streptavidin or lacking one of the biotin
moieties (∆CT = 6-7 cycles). (c) For the detection of sub-attomole quantities of streptavidin a
slight variation of the protocol was applied: 200 amol of 1e-biotin and 2a-biotin were
incubated with 200, 20, 2, 0.2, or 0.02 amol of streptavidin, followed by addition of Klenow as
above. The primer extension mixture was not diluted for qPCR analysis. In this sandwich
mode IDPCR can be used to detect as little as 2x10-19 moles (200 zeptomoles) of streptavidin.
FPLC fractions
1j-trypsin[CA] nM 9 10 11 12cr
ude
no re
actio
n
25 85 254
no reaction[CA] nM
crud
e
FPLC fractions1i-CA
9 10 11 12635 320 160 80 40 20
no reaction[GST] µM
crud
e
FPLC fractions1k-GST
8 9 10 11 121 .5 .25 .12 .06 .03 .01
a) b)
c)
Figure S5. PAGE characterization of DNA-target conjugates. Protein-DNA conjugates
were synthesized and fractionated as described above (SI-8). Protein-DNA conjugates were
characterized and quantitated by SDS-PAGE and densitometry. Representative gels are shown
here. Aliquots (12 µL) of fractions collected from the FPLC were diluted in 4X NuPAGE
Sample Loading Buffer (4 µL) (Invitrogen), heated to 95 °C for 5 minutes and analyzed by

SI-19
electrophoresis (12% Bis-Tris gel, 150V, 45 minutes). The gel was stained with Sypro Ruby
Gel Stain and imaged on a ChemiImager. Conjugation of the oligonucleotide to the protein
results in the appearance of higher molecular weight bands after conjugation. Protein dilution
series standards were used to quantitate the protein-DNA conjugates. (a) Conjugation of 1i to
CA. Fractions 9 and 10 were pooled for use in IDPCR experiments. (b) Conjugation of 1j to
trypsin. Fractions 10 and 11 were pooled for use in IDPCR experiments. (c) Conjugation of 1k
to GST. Fractions 8, 9, and 10 were pooled for use in IDPCR experiments.
Table S1. Enrichment factors observed for the five expected interactions as well as the mean
enrichment of all 67,599 possible combinations of ligand and target sequences.
Table S2. The number of presumed false positives (out of 67,594 possibilities) at a variety of
enrichment factor thresholds.
Complete Reference for (15):
Clark, M. A.; Acharya, R. A.; Arico-Muendel, C. C.; Belyanskaya, S. L.; Benjamin, D. R.; Carlson, N. R.; Centrella, P. A.; Chiu, C. H.; Creaser, S. P.; Cuozzo, J. W.; Davie, C. P.; Ding, Y.; Franklin, G. J.; Franzen, K. D.; Gefter, M. L.; Hale, S. P.; Hansen, N. J. V.; Israel, D. I.; Jiang, J.; Kavarana, M. J.; Kelley, M. S.; Kollmann, C. S.; Li, F.; Lind, K.; Mataruse, S.; Medeiros, P. F.; Messer, J. A.; Myers, P.; O'keefe, H.; Oliff, M. C.; Rise, C. E.; Satz, A. L.; Skinner, S. R.; Svendsen, J. L.; Tang, L.; Van Vloten, K.; Wagner, R. W.; Yao, G.; Zhao, B.; Morgan, B. A. Nat. Chem. Biol. 2009, 5, 647.

SI-20
III. References Cited
(1) Pocker, Y.; Stone, J. T. Biochemistry 1967, 6, 668. (2) Melkko, S.; Zhang, Y.; Dumelin, C. E.; Scheuermann, J.; Neri, D. Angew. Chem., Int.
Ed. 2007, 46, 4671. (3) Jain, A.; Whitesides, G. M.; Alexander, R. S.; Christianson, D. W. J. Med. Chem. 1994,
37, 2100. (4) Mincione, F.; Starnotti, M.; Menabuoni, L.; Scozzafava, A.; Casini, A.; Supuran, C. T.
Bioorg. Med. Chem. Lett. 2001, 11, 1787.