surface transportation board rate... · the surface transportation board (stb or the board) ......
TRANSCRIPT

33re23623
Surface Transportation Board
An Examination of the STB’s Approach to Freight Rail
Rate Regulation and Options for Simplification
Project FY14-STB-157
Draft Interim Report Task 1
PREPARED FOR
Surface Transportation Board
PREPARED BY
InterVISTAS Consulting Inc.
September 14, 2016

Project FY14 – STB - 157
Railroad rate regulation ii
Contents
Executive Summary ...................................................................................................... v Introduction .......................................................................................................................... v Legislative and Regulatory Context ..................................................................................... vi STB’s Rate Regulation Procedures ................................................................................... viii Applying the Three-Benchmark and Simplified-SAC Tests to Settled Cases ........................ ix Conclusions ......................................................................................................................xvii
1 Introduction ............................................................................................................ 1 1.1 Objectives of this Report ............................................................................................... 4 1.2 Organization of the Report ............................................................................................ 4 1.3 Methodology ................................................................................................................. 5 1.4 Acknowledgements ....................................................................................................... 6
2 Legislative and Regulatory Context ...................................................................... 7 2.1 Regional Rail Reorganization Act of 1973 ..................................................................... 7 2.2 Railroad Revitalization and Regulatory Reform Act of 1976 ........................................... 9 2.3 The Staggers Rail Act of 1980 .................................................................................... 10 2.4 Constrained Market Pricing Principles ......................................................................... 13 2.5 The Stand-Alone Cost Test ......................................................................................... 15 2.6 ICC Termination Act of 1995 ....................................................................................... 16 2.7 The STB’s Rate Case Simplification Efforts ................................................................. 16
3 Economies of Scope and Ramsey Pricing ......................................................... 21 3.1 Optimal Pricing for Multiproduct Firms: Ramsey Pricing .............................................. 23
4 Rate Reasonableness Standards and Challenges in Their Uses ...................... 34 4.1 The Full-SAC Procedure ............................................................................................. 34 4.2 The Three-Benchmark Procedure ............................................................................... 44 4.3 The Simplified-SAC..................................................................................................... 54
5 Simplifying the SAC Procedure: Two Cases, Two Procedures ........................ 58 5.1 Introduction ................................................................................................................. 58 5.2 Adapting the Three-Benchmark Test ........................................................................... 59 5.3 Findings of the Three-Benchmark Adaptation .............................................................. 63 5.4 Adaptation of the Simplified-SAC Methodology ........................................................... 67 5.5 Conclusions ................................................................................................................ 74
6 Alternatives to Maximum Rate Regulation: Are There Lessons from Other Countries? ............................................................................................................ 75 6.1 Constraining Rail Rates in Canada.............................................................................. 75 6.2 The UK – Access Charges for Freight ......................................................................... 79 6.3 Australia – Access Charges ........................................................................................ 82
7 Maximum Rate Methodologies from Other Regulated Industries ..................... 86 7.1 Rate-Base Rate-of-Return and Price Cap Regulation Are Not Appropriate for U.S.
Rail Transport ............................................................................................................ 86 7.2 Structural (Access) vs. Conduct (Rates) Regulation .................................................... 86

Project FY14 – STB - 157
Railroad rate regulation iii
7.3 Overview of Federal Regulation of Electricity Transmission and Gas Pipeline Transportation Rates and Service .............................................................................. 87
7.4 Experience in U.S. Telecommunications with TELRIC ................................................. 99 7.5 Is TELRIC Applicable to the Railroad Industry? ......................................................... 103 7.6 Application of TELRIC to Allocate Common Costs for the Two Rail Cases................. 105 7.7 Efficient Components Pricing Rule (ECPR) - Concepts ............................................. 108 7.8 Using URCS Data to Illustrate ECPR Access Pricing for Two Cases ......................... 111 7.9 How M-ECPR Might be Applied to Maximum Shipper Rates for US Freight Rail ........ 115 7.10 Illustrative Example of an M-ECPR Method 2 (Build-in) Regulated Rate .................... 117
8 Summary and Conclusions ............................................................................... 119 8.1 Context ..................................................................................................................... 119 8.2 Objectives of the Study ............................................................................................. 120 8.3 Review of Regulatory Methods Applied to Network Industries ................................... 120 8.4 Is the SAC Test Still Valid? ....................................................................................... 124 8.5 Testing Two Variants of CMP and an Alternative Methodology, ECPR ...................... 126 8.6 Can the SAC Test Be Simplified? .............................................................................. 128 8.7 Are There Methodologies Other Than CMP that are Simpler? ................................... 130
9 Synopsis of Key Conclusions ........................................................................... 132
Appendices ............................................................................................................... 135 Appendix I: Comments on the Debate on the Boundaries of Economies of Scope ............ 135 Appendix II: Three-Benchmark Adaptation for Otter Tail v. BNSF using Eagle Butte as
Point of Origin .......................................................................................................... 141 Appendix III: Development of the ECPR Concept for Freight Rail .................................... 144 Appendix IV: Bibliography ................................................................................................ 150

Project FY14 – STB - 157
Railroad rate regulation ii
List of Figures
Figure 3-1: Ramsey Pricing ................................................................................................................... 26 Figure 3-2: Different Measures of Rate Reasonableness ....................................................................... 31 Figure 4-1: Comparison of Two Hypothetical Stand-Alone Railroad Configurations ................................ 42 Figure 4-2: Major Regulatory Changes to the Three-Benchmark Method................................................ 46 Figure 5-1: Results of the Three-Benchmark Analysis Using the 2007 RSAM ......................................... 64 Figure 5-2: Results of the Three-Benchmark Approach Using the Pre-2007 RSAM ................................ 65 Figure 5-3: Results of the DCF Analysis Using Eagle Butte as Point of Origin ........................................ 73 Figure 7-1: Structure of the Electric Power System ................................................................................ 90 Figure 7-2: Regional Transmission Organizations / Independent System Operators ............................... 93 Figure 7-3: Estimates of Percentage Markups from Applying Different TELRIC Methodologies to Two Rail
Cases .................................................................................................................................................. 107 Figure 7-4: Railroad Bottleneck ............................................................................................................ 108 Figure 7-5: Alternative Routings for WFA Traffic on Incumbent (BNSF) and Hypothetical Entrant (UP) . 112 Figure 7-6: Computation of ECPR Access Charge for WFA Case ($ per Trainload) .............................. 112 Figure 7-7: Alternative Routings for Otter Tail Traffic on Incumbent (BNSF) and Hypothetical Entrant (UP)
............................................................................................................................................................ 114 Figure 7-8: Computation of ECPR Access Charge for Otter Tail Power Case ($ per Trainload) ............ 115 Figure 7-9: Threatened Build-Out by Gainesville Regional Utilities ....................................................... 118
List of Tables
Table 5-1: RSAM and R/VC>180 Example Tables, 1998-2001 ................................................................. 61 Table 5-2: Summary of Three-Benchmark Method Analysis: 2007 RSAM Methodology.......................... 66 Table 5-3: Summary of Three-Benchmark Method Analysis: Pre-2007 RSAM Methodology ................... 67 Table 5-4: Traffic Group Determination .................................................................................................. 69 Table 5-5: Operating Expenses Estimation Using Modified URCS Data ................................................. 70 Table 5-6: Estimated Value of the Simplified-SAC RPI Category using Eagle Butte Point of Origin ......... 72

Project FY14 – STB - 157
Railroad rate regulation iii
Abbreviations Used
3B Three-Benchmark Test
3R Act Regional Rail Reorganization Act of 1973
4R Act Railroad Revitalization and Regulatory Reform Act
AC Average costs
ACCC Australia Competition and Consumer Commission
ARTC Australian Rail Track Corporation
ATC Average Total Cost
BNSF Burlington Northern and Santa Fe Railway Company
BPW Baumol, Panzar and Willig
CLR Competitive Line Rates
CMP Constrained Market Pricing
COAG Council of Australian Governments
Conrail Consolidated Rail Corporation
CTAR Canada Transportation Act Review
DCF Discounted Cash Flow
DOT Department of Transportation
ECPR Efficient Component Pricing Rule
ELRA Enterprise Level Revenue Adequacy
EP Ex Parte
FCC Federal Communications Commission
FERC Federal Energy Regulatory Commission
FOA Final Offer Arbitration
GAO Government Accountability Office
ICAct Interstate Commerce Act
ICC Interstate Commerce Commission
ICCTA ICC Termination Act of 1995

Project FY14 – STB - 157
Railroad rate regulation iv
LEC Local Exchange Carriers
LRVC Long Run Variable Costs
M-ECPR Market determined efficient pricing rule
MMM Maximum Markup Methodology
ORR Office of Rail and Road
PRB Powder River Basin
RBROR rate-base rate-of-return
RCAF Rail Cost Adjustment Factor
RPI Road Property Investment
RSAM Revenue Shortfall Allocation Method
R/VC Revenue/variable cost
R/VC COMP Revenue/variable cost of comparable traffic
R/VC >180 Revenue/variable cost of comparable traffic of potentially captive shippers
SAC Stand Alone Cost
SARR Stand-Alone Railroad
Simplified-SAC Simplified Stand-Alone Cost
STB Surface Transportation Board
TC&W Twin Cities & Western Railroad Company
TELRIC Total Element Long Run Incremental Cost
TSLRIC Total Service Long Run Incremental Cost
TRB Transportation Research Board
UP Union Pacific Railroad Company
URCS Uniform Railroad Costing System
USC United States Code
USRA United States Railway Association
WFA Western Fuels Association, Inc.
WGTA Western Grain Transportation Act

Project FY14 – STB - 157
Railroad rate regulation v
Executive Summary
Introduction
The Surface Transportation Board (STB or the Board) exercises economic regulatory oversight over
certain surface transportation matters. One of the STB’s statutory duties is to adjudicate complaints
brought by shippers seeking reductions in railroad transportation rates. For rail traffic that is subject to
the STB’s rate jurisdiction, the STB’s governing statute requires that rates be “reasonable.” The Board
does not have jurisdiction over the reasonableness of a rate for rail transportation unless the rail carrier
providing the service has “market dominance” in that particular market. Market dominance exists when
there is “an absence of effective competition from other rail carriers or modes of transportation for the
transportation to which a rate applies.”1 The statute explicitly recognizes that competitive alternatives can
comprise both intra-modal competition (another railroad) and inter-modal competition (e.g., trucks, ships,
barges, pipelines, etc.). Moreover, by statute, a railroad is not considered to have market dominance
unless the revenue produced by the rate is greater than 180% of its variable cost of providing the service
(R/VC Ratio, or R/VC>180) as determined under the STB’s Uniform Rail Costing System, known as
“URCS.”2
The process through which STB determines the reasonableness of rates is complex. Under the
regulatory regime established by Congress, the basic challenge to the Board is to estimate what a
reasonable rate would be were a competitive market to exist. Complaining customers must develop
detailed evidence to calculate both direct operating expenses (such as the cost of locomotives, crew, and
railcars) and indirect operating expenses (such as maintenance of way) of a hypothetical railroad
designed to serve its traffic. If the complaining shipper can show that the revenues earned by the
defendant from serving the entire traffic group exceed what it would cost to build and operate the
hypothetical railroad (including a reasonable profit), then the STB determines the specific relief, if any, to
which the complaining shipper is entitled.
In response to complaints from the shipper community and Congress about the complexity (and thus the
cost) of seeking regulatory relief, and Congressional direction in the ICC Termination Act of 1995 to
complete a rulemaking initiated by the STB’s predecessor agency “to establish a simplified and expedited
method of determining the reasonableness of challenged rates” in for smaller cases,3 the STB
implemented simplified procedures for determining rate reasonableness when the agency’s original
procedure was too costly, given the value of the case.
In 2014, the STB decided to request the services of an outside expert consultant to examine alternatives
to the Board’s existing methodologies for railroad rate regulation. The investigation was to include a
review and evaluation of other rate regulation methodologies used by regulators of network industries.
The STB also sought recommendations regarding how it could employ any relevant and practicable rate
regulation methods.
1 49 U.S.C. § 10707(a). 2 49 U.S.C. § 10707(d)(1)(A). 3 49 U.S.C. § 10701(d)(3).

Project FY14 – STB - 157
Railroad rate regulation vi
Ongoing interest in the possibility of providing an additional path to potentially lower rates through
competitive access motivated a request to expand the study to include an analysis of means for
regulating access charges to bottlenecks – railroad segments that are controlled by one carrier with
exclusive access to either a shipper or consignee.
This report is a response to the STB mandate for an investigation and analysis. Its objectives are as
follows:
Review available academic and legal literature addressing the STB’s rate regulation methodology
and conceivable alternatives;
Determine the applicability of alternative methods of rate regulation or competitive-access pricing
that could be used by the STB; and
Provide the STB with detailed recommendations for how it could deploy alternative
methodologies to reduce the time, complexity and expense historically involved in the litigation
and resolution of rate reasonableness complaints while producing outcomes that are fair and
reasonable to railroads and complaining shippers.
Legislative and Regulatory Context
Federal oversight of freight rail rates has existed since 1887, when the Congress enacted the Interstate
Commerce Act to protect shippers from the monopoly power of the rail industry. That act created the
predecessor to the STB -- Interstate Commerce Commission (ICC) -- to provide regulatory oversight. By
the 1970s, American freight railroads were in a serious financial decline. The Congress responded by
passing three pieces of major legislation with the overall goal of revitalizing and stabilizing the railroads’
financial health, and establishing a more flexible regulatory regime that placed primary reliance on
competition. Arguably the most important of those laws was the Staggers Rail Act of 1980 (Staggers Act),
which provided a framework for the deregulation in the railroad industry.
The Staggers Act clearly stated federal policy with respect to railroads and rail regulation. Among the
several policies specifically mentioned were the following:
(1) to allow, to the maximum extent possible, competition and the demand for services to establish
reasonable rates for transportation by rail;
(2) to minimize the need for Federal regulatory control over the rail transportation system and to
require fair and expeditious regulatory decisions when regulation is required;
(3) to promote a safe and efficient rail transportation system by allowing rail carriers to earn adequate
revenues, as determined by the Interstate Commerce Commission;
Among the major changes introduced by the Staggers Act, the most important was the removal of the
inefficient regulation of rate levels by commodity. The Staggers Act permitted railroads to freely set rates
and to enter into confidential contracts with shippers. By deregulating the industry, the Congress
effectively allowed the railroads to become responsible of their own performance. At the same time,
however, the Act provided shippers with a regulatory mechanism to protect them from unreasonable rates
where market dominance existed. Under the Staggers Act, for market dominance to exist, the revenue-
variable cost ratio of the disputed service must exceed 180 percent. (The original 160 percent threshold
was increased to 180 percent in 1984.) The statute expressly provides that 180 percent is a threshold
only, and meeting it does not prove market dominance. Therefore, the complainant must also

Project FY14 – STB - 157
Railroad rate regulation vii
demonstrate the absence of effective competition from other rail carriers or modes of transportation.4 Only
after market dominance was established would the rate be examined to determine if it was unreasonably
high.
The ICC published a set of economic principles to determine whether rates charged by market dominant
railroad that are challenged by shippers are unreasonable These were the “Constrained Market Pricing”
(CMP) principles that were published in the ICC’s “Coal Rate Guidelines, Nationwide” in 1985. The CMP
principles are designed to prevent “captive” shippers from paying more than is necessary for the carrier
involved to earn adequate revenues, from paying for inefficient service, and from bearing the cost of
facilities or services from which they derive no benefit. The CMP principles recognized the importance of
“Ramsey pricing” in the context of economies of scale and high fixed and common costs by allowing
railroads to price above marginal cost.5 The ICC viewed the CMP principles as “meet[ing] our dual
objectives of providing railroads the real prospect of attaining revenue adequacy while protecting captive
coal shippers from ‘monopolistic’ pricing practices.”6
The CMP principles represent an operational solution to implement differential pricing based on Ramsey
pricing principles. CMP is conceived as three possible constraints that a shipper may advocate to limit the
rates charged by a railroad for movements where the carrier is market dominant:
The Revenue-Adequacy Constraint: This constraint reflects the need for the STB, when
considering the reasonableness of the rate, to bear in mind that the rate must be adequate to
allow the railroad to earn revenue sufficient to cover costs, make normal profit and attract capital;
The Management Efficiency Constraint: This constraint prevents customers from paying
avoidable costs that result from the inefficient operation and management of a railroad;
The Stand-Alone Cost (SAC) Constraint: This constraint protects customers from bearing the cost
of inefficiencies or cross subsidizing other services. This constraint intends to ensure that the
revenue that a railroad earns does not exceed the total cost that a hypothetical, efficient railroad
would incur in providing the same service or group of services. In short, the stand-alone
constraint is designed to protect captive shippers from undue exercise of market power.
The SAC concept was first described by Gerald Faulhaber in 1975. The original concern was to define a
criterion to identify whether a group of consumers of a public multi-product firm was being cross-
subsidized by another group of consumers.7 In 1983, Baumol and Willig further articulated these concepts
in the context of the U.S. rail industry.8
4 49 U.S.C. § 10707(d)(2). 5 “Ramsey pricing” is an economic tenet sometimes referred to as differential pricing which allows firms to fix their
prices above their marginal cost to cover their common and fixed costs by pricing their products higher when there is less elasticity of demand. 6 Coal Rate Guidelines, Nationwide, 1 I.C.C. 2d 520, 6 (1985), aff’d sub nom., Consol. R. Corp. v. ICC, 812 F. 2d 1444
(3d Cir. 1987) (“Coal Rate Guidelines”). 7 Faulhaber, Gerald R. “Cross-Subsidization: Pricing in Public Enterprises.” The American Economic Review 65, no. 5
(1975): 966-977. 8 Baumol, William J. and Robert D. Willig. “Pricing Issues in the Deregulation of Railroad Rates.” In Economic Analysis of Regulated Markets, ed. Jörg Finsinger, 11-47. London: McMillan,1983.

Project FY14 – STB - 157
Railroad rate regulation viii
By 1995, the substantial deregulation of the rail industry was largely complete. In a further effort to limit
federal economic regulation of surface transportation, Congress passed the ICC Termination Act of 1995,
which abolished the ICC, but transferred most of the ICC’s railroad regulatory responsibilities to the newly
created Surface Transportation Board (STB).
STB’s Rate Regulation Procedures
The ICC described its Stand-Alone Cost (SAC) procedure for assessing rate reasonableness in Coal
Rate Guidelines (1985). This original SAC procedure, or “Full-SAC,” is the principal regulatory process
that permits railroad customers to seek relief from rates that they believe are unreasonable and to
determine if prevailing rates reflect an incumbent railroad’s inefficiencies or the cost of railroad facilities
from which they derive no benefits.
To determine if a rate is reasonable under the Full-SAC test, a shipper must determine the lowest cost at
which a hypothetical, fully efficient “stand alone railroad” (SARR) could provide the service at issue free
from any costs associated with inefficiencies or cross-subsidization. If the rate required to cover these
costs (taking into account a reasonable return for the railroad) is less than the disputed rate, then the
disputed rate may be considered to be unreasonable.9
The process begins with the railroad customer defining a hypothetical SARR which could serve the traffic
if the market was free from entry and exit barriers. This hypothetical SARR is designed to replicate the
conditions of a contestable market. By simulating a contestable market, the Full-SAC procedure
approximates the maximum rate that would be charged to the shipper in a competitive environment.
While the Full-SAC procedure is considered to be precise as a mechanism for determining the
reasonableness of challenged rail rates, it is highly complex and is often a multi-million dollar exercise. In
a Full-SAC test, estimations of variable costs and investment are typically developed from models and
studies. This methodology, straightforward and intuitive in theory, evolved into an elaborate, time
consuming and expensive process in practice.
Consequently, the STB issued Simplified Guidelines to assess rate reasonableness on captive traffic for
which the CMP guidelines could be practicably applied.10
The Simplified Guidelines were intended to
decrease the cost of the litigation while still relying on the CMP principles. The challenge for STB was to
balance the need for sound economic criteria with the necessity to simplify the calculation process to
reduce the cost of the procedure. The approach was based on a comparison between the
revenue/variable cost ratio (R/VC) of the traffic at issue and a combination of Three-Benchmark ratios:
The Revenue Shortfall Allocation Method (RSAM). This measure approximates the rates
necessary for a railroad to become revenue-adequate. This measure is computed and reported
annually by the STB.
9 Major Issues in Rail Rate Cases, Ex Parte No. 657 (Sub-no. 1) (STB served Oct. 30, 2006) (“Major Issues”). 10 Rate Guidelines – Non-Coal Proceedings, Ex Parte No. 347 (Sub-no. 2) (STB served Dec. 27, 1996), 1 S.T.B. 1004 (1996) (“Simplified Guidelines”).

Project FY14 – STB - 157
Railroad rate regulation ix
R/VCCOMP: The ratio of the revenue to variable cost ratio for comparable traffic, based on
movements sharing the same characteristics with the traffic at issue. This measure is intended to
provide a means of reflecting demand-based differential pricing principles.
R/VC>180: The ratio of revenue to variable costs over 180 percent ratio measures the average
markup over variable cost earned on potentially captive shippers by the defendant railroad. This
benchmark measures the degree of differential pricing actually being practiced by that carrier.
The “Three-Benchmark Procedure” has been criticized on several grounds, including claims that it lacks
theoretical support, is too simple to take into account the unique demand characteristics of each
movement, and is still too complex and costly for shippers of certain commodities, particularly grain. Since
the introduction of the Simplified Standards, only one Three-Benchmark case has been litigated to a final
STB decision and four were settled.
In reaction to the unexpectedly low level of usage, the Board held public hearings to hear the concerns of
stakeholders and to understand why shippers so seldom used the simplified procedure. Concluding that
“the shipper community perceives [the Simplified Guidelines] as too vague, and as requiring prolonged
litigation over whether a shipper even qualifies to use them,”11
the Board proposed new Simplified
Standards, which revised the existing Three-Benchmark procedure and created a new simplified
procedure called the Simplified Stand-Alone Cost (Simplified-SAC). The Simplified-SAC procedure is
similar to a Full-SAC approach, but adopted many simplifying assumptions and standardization measures
to streamline the process and decrease the litigation cost for shippers. The simplifications included
assumptions regarding the route over which the traffic would move, the SARR’s facilities, the traffic group,
and cross-over traffic.
Consequently, the Simplified-SAC procedure has been criticized for preserving existing inefficiencies in
the operating cost structure of railroads serving the traffic at issue because historical URCS data is used
in the cost formulations. All five cases involving the Simplified-SAC methodology were settled before the
procedure could be tested.
Applying the Three-Benchmark and Simplified-SAC Tests to Settled Cases
The project team examined two cases that had previously been presented and decided based on Full-
SAC analyses. The team’s re-examination sought to determine whether use of either the Three-
Benchmark procedure or the Simplified-SAC would yield outcomes that were consistent with the analyses
and findings of a Full-SAC test. Two past cases were selected, each with different outcome concerning
rate reasonableness.
In Otter Tail Power Company v. BNSF Railway Company, although market dominance was
uncontested, the Board found that Otter Tail failed to demonstrate that the challenged rates were
unreasonably high.12
11 Proposed Rule, Simplified Standards for Rail Rate Cases, Ex Parte No. 646 (Sub-No. 1), slip op. at 3 (STB served Jul. 28, 2006). The STB issued its Final Rule in a decision served in the same docket on September 5, 2007 (“Simplified Standards”). 12 Otter Tail Power Co. v. BNSF Ry., NOR 42071 (STB served Jan. 27, 2006) (Otter Tail).

Project FY14 – STB - 157
Railroad rate regulation x
In Western Fuels Association, Inc. and Basin Electric Power Cooperative v. BNSF Railway
Company, the Board determined that the rates charged were unreasonable.13
To compare the results of the three methods for these two cases, the Simplified Standards were adapted
to simulate the outcomes of rate reasonableness complaints in Otter Tail and Western Fuels if the
complaining shippers had utilized the Three-Benchmark or Simplified SAC procedures rather than Full
SAC. The analysis must be viewed as provisional as it has not undergone the rigorous scrutiny of an
actual rate case hearing before the STB. For example, in an actual Three-Benchmark case, both the
railroad and shipper can propose adjustments to the rate determined by the methodology based on “other
relevant factors.” No such adjustments were applied here.
Adaptation of the Three-Benchmark Procedure
The team adapted and applied the Three-Benchmark method to simulate how shippers and the Board
might have estimated the maximum allowable rate under the Three-Benchmark method and to assess
whether or not the analysis would provide the same conclusion as the Full-SAC analysis. The first step in
all of the rate relief methodologies was to compute the revenue to variable cost ratios for the issue traffic.
Two different revenue shortfall allocation calculations were used, based on the methodologies that were
applicable before and after 2007, when the STB changed how it calculated the measure. Different ratios
were calculated, reflecting variations in distance traveled, rail car ownership, and rail car type. For the
Western Fuels example, variations also reflected different points of origin, because there were five
separate mine origin/destination pairs in this case.
Otter Tail. While the pre-2007 methodology would not have provided a clear outcome for the Otter Tail
case, the results based on the most recent Simplified Standards suggest that the outcome of the Three-
Benchmark would have been the same as the actual STB decisions using the Full-SAC test: Both the
Full-SAC proceeding and the project team’s re-examination using the adapted Three-Benchmark method
did not find that the challenged rates were unreasonably high.
Western Fuels. The project team’s adaptation of the Three-Benchmark approach yielded conclusions
that were similar to those reached using the Full-SAC case when using the most recent methodology.
Based on the Western Fuels Association’s adjusted revenue to variable cost ratios, the adapted Three-
Benchmark would suggest that the rates are unreasonable, because the ratios of the traffic at issue would
be higher than the Three-Benchmark test.
Adaptation of the Simplified-SAC Procedure
Once the Board determines that market dominance has been shown, the first step in a Full-SAC or a
Simplified-SAC proceeding is to determine the traffic group to be analyzed. For its re-examination of
these cases under a Simplified-SAC test, the project team sought to determine what the total traffic would
have been at the time of the case. Because the team lacked access to the carrier’s data, it estimated this
traffic based on case filings. To estimate the operating expenses of the SARR, the project team used
URCS data from STB to make needed modifications as per Simplified Standards. The team estimated
the road property investment expenses based on past cases, and completed the discounted cash flow
13 Western Fuels Ass’n, Inc., and Basin Elec. Power Coop. v. BNSF Ry., NOR 42088 (STB served Feb. 18, 2009) with technical corrections (STB served Jun. 5, 2009) (“Western Fuels”).
Project FY14 – STB - 157
Railroad rate regulation xi
analysis using the exact parameters used at the time of the case (inflation, traffic projection, cost of
capital, depreciation schedule, etc.).
The analysis of Simplified-SAC also produced results consistent with the Full-SAC procedure for the
Western Fuels case, confirming that BNSF rates were unreasonable. The analysis was unable to come to
a full conclusion for the Otter Tail Power case due to the inability to re-create the Road Property
Investment component of the analysis with simplified SAC methodologies. However, based on operating
cost data, conclusions were found consistent with the STB decision.
Alternatives to Maximum Rate Regulation: Lessons from Other Countries
Other counties have adopted different regulatory regimes for their freight rail industries. The project team
examined these alternatives to determine whether they might offer options for the U.S.
Canada
The National Transportation Act of 1987 removed the maximum rate regulation provision and instead
relied primarily on commercial negotiation of contracts between carriers and shippers to constrain rates,
and created a provision for commercial arbitration of railway rates. If a shipper is unsatisfied with a rate
charged by a carrier, it applies to the Canada Transportation Agency to designate a commercial arbitrator
to choose the final rate/service offer of either the carrier or the shipper. The arbitrator can choose one
offer or the other but cannot create any other rate (such as splitting the difference). Decisions made by
the arbitrator are not made public, and reasons are not given by the arbitrator to either the parties (carrier
and shipper) or to the government. Because it is non-transparent, it is our opinion that the Canadian final
offer arbitration process provides no guidance for alternatives to SAC. Even if sound economic analysis is
applied, because the process is confidential, no guidance can be identified or developed.
Canada’s rail regime allows for interswitching, which requires the originating carrier for a specific shipper
to pick up and switch a shipment to another carrier’s line if the switching distance was relatively short.
Because the methodology used to calculate the rate is distance-based, and given that the STB rejected
use of distance-based fully allocated cost as a basis for maximum rate regulation, it is our opinion that the
Canadian interswitching methodology provides no insight for the STB on potential revision to or
replacement of SAC.
Canadian law also allows a shipper to seek a competitive line rate (CLR). CLRs allow qualifying shippers
served directly by only one carrier to obtain a regulated rate on the originating carrier from origin to the
closest interchange point with another railway (which would complete the origin-destination movement).
The methodology for establishing the CLR is not cost-based, but rather based on the originating carrier’s
system average revenue per ton-mile for similar traffic. Because it is based on system average revenues,
not costs, and will embed revenue inadequacy, and conversely could embed above normal returns for a
carrier, it is our opinion that the CLR provides no insight to STB on a possible replacement of the SAC
test.
United Kingdom
The UK’s rail system is fundamentally different from that in the U.S. and Canada. There is a nationalized
track company, Network Rail, and a number of competing “above-the-rail” operators (i.e., train operators
such as Great Western, Virgin Trains, and London Midland). Rail regulation is the responsibility of the
Office of Rail and Road (ORR), formerly the Office of Rail Regulation. All railroad infrastructure and some
railway stations in the UK are owned by Network Rail, an arm’s-length government monopoly that is

Project FY14 – STB - 157
Railroad rate regulation xii
accountable to the ORR, Parliament, and the Secretary of State for Transport.14
Above-the-rail train
operators seeking access to Network Rail track to run freight trains must apply to the ORR for a track
access agreement. It is our view that the UK approach, based on a nationalized track operator which is
heavily subsidized, is of limited relevance to the U.S. ORR once used stand-alone cost to assess
maximum track access rates, but found it to be irrelevant since SAC rates were well above the subsidized
rates.
Australia
Australia’s rail system is similar to that found in the UK, where the majority of the interstate rail network is
owned or leased by the vertically-separated Australian Rail Track Corporation (ARTC), whose shares are
owned by the Australian government. State-owned railways or private above- the-rail train operators
lease track “windows” to operate trains. Access charges of ARTC can be regulated by the Australia
Competition and Consumer Commission. Australia’s regulatory system is further complicated because
there are separate access regimes operated by each Australian state for access to publicly owned,
vertically integrated intra-state rail lines. State regulators are responsible for regulation of access fees
paid by above-the-rail operators in such situations. Maximum rate regulation is guided by stand-alone
cost principles for a single shipper or a group of shippers. The regulation process is multiyear and
involves a myriad of steps and decisions. It is our assessment that the Australian experience reinforces
some of the key economic principles underlying the STB’s CMP, while providing no insight for
simplification of the SAC methodology.
Alternatives to Maximum Rate Regulation: Lessons from Other Network
Industries
A regulatory system based on an access regime, where the access prices charged by one carrier to
another, may provide an alternative to maximum rate regulation. Theoretically, access regimes can be
calibrated to provide for a reasonable return on investment for host networks, while simultaneously
encouraging competition and efficiency. Two potential tools for regulating the price of access were
identified:
Total Element Long Run Incremental Cost (TELRIC): The pricing approached adopted by the
Federal Communications Commission (FCC) in the telecommunications industry; and
Efficient Component Pricing Rule (ECPR): This technique compensates a host railroad (or
network) for the incremental cost of allowing access to its bottleneck segment of track and for the
net opportunity cost of foregone revenue related to providing access.
14 The U.K. government reclassified Network Rail in 2014 from a private company to an “arm’s-length central government body,” meaning the company is now a public company. “Arm’s-length” refers to it not being a government department, but still being accountable to the government. “An arm’s-length body is an organisation that delivers a public service, is not a ministerial government department, and which operates to a greater or lesser extent at a distance from Ministers.” Public Administration Select Committee, “Who’s Accountable? Relationships between Government and Arm’s-Length Bodies,” United Kingdom House of Common, First Report of Session 2014-15, Nov. 10, 2014. http://www.publications.parliament.uk/pa/cm201415/cmselect/cmpubadm/110/110.pdf

Project FY14 – STB - 157
Railroad rate regulation xiii
Some have proposed use of one or the other of these methodologies as an alternative or complement to
maximum rate regulation on routes where the railroad is found to be market dominant. The report
examines these methodologies and discusses whether the underlying regulatory pricing principles could
be applied to rail rates paid by shippers as a simpler alternative to CMP.
The report also examines the suitability of an access type of regulation now employed by the Federal
Energy Regulatory Commission (FERC) to the interstate transmission of electricity and natural gas. In
both of those industries, the federal government sought to increase the competitiveness of the energy
markets by requiring industries that had historically been highly vertically integrated to “unbundle,” or
separate, their sales and transmission services. By doing so, the government sought to encourage
greater innovation and efficiency in the production of energy and allow consumers to benefit from more
competitive and cheaper providers.
Federal Regulation of Interstate Electricity and Natural Gas Distribution
FERC is the independent federal agency that regulates interstate transmission of electricity and natural
gas.15
FERC has exclusive jurisdiction over the "transmission of electric energy in interstate commerce,”
and over the "sale of [electric energy] at wholesale in interstate commerce.”16
FERC also regulates
natural gas pipeline transportation rates and services. Under authority originally granted in 1938, FERC
has the authority to set "just and reasonable rates" for interstate transmission of natural gas.
Electricity. The market for electricity has evolved considerably over time. Decades ago, electric utilities
were mostly vertically integrated firms that constructed and operated their own generation, transmission,
and distribution facilities. Rates paid by consumers were subject to approval by local or state public utility
commissions. Over time, utilities built major interconnecting transmission lines large enough to deliver
power in case of a major generator outage. Technological advancement brought the possibility of
cheaper sources of power. However, the potential consumer benefits that could be derived could be
realized only if more efficient generating plants could obtain access to regional transmission grids.
Vertically integrated companies did not offer open access to new entrants.
One goal of the 1992 Energy Policy Act17
was to promote greater competition in bulk power markets by
encouraging new generation entrants. In 1996, FERC required each public transmission providers to
functionally unbundle its wholesale generation and transmission services and file an open-access
transmission tariff containing minimum terms of non-discriminatory transmission service.18
15 FERC was established in 1977 in the Department of Energy Organization Act (91 Stat. 565; 42 U.S.C. § 7101). The predecessor regulator was the Federal Power Commission, which had originally been established in 1920 to coordinate hydroelectric projects under federal control. FERC’s authority to regulate the transmission of natural gas originated in the Natural Gas Act of 1938, 15 U.S.C. § 717 et seq. The Natural Gas Act gave these regulatory powers to the Federal Power Commission, and those powers transferred to FERC in 1978. 16
16 U.S.C. § 824. 17 Energy Policy Act of 1992, Pub. L. No. 102-486, 106 Stat. 2776-3133 (1992). 18 Federal Energy Regulatory Commission, “Promoting Wholesale Competition through Open Access Non-Discriminatory Transmission Services by Public Utilities; Recovery of Stranded Costs by Public Utilities and Transmitting Utilities,” 61 Fed Reg. 21541, 21551-21552 (May 10, 1996), https://www.gpo.gov/fdsys/pkg/FR-1996-05-10/pdf/96-10694.pdf

Project FY14 – STB - 157
Railroad rate regulation xiv
FERC uses rate-base rate-of-return regulation (RBROR) to regulate transmission providers and ensure
they earn reasonable rates of return on their investments. The transmission companies use various forms
of pricing to recover their costs of providing service and earn a return on the investment in infrastructure
within a service territory. Rates can be zone specific (license plate pricing), depend on the distance (point
to point sensitive), or be the same whatever the distance (postage stamp pricing).19
Postage stamp
pricing is a form of uniform pricing method applied in a defined area.
FERC can reject rates if they are found to be “unjust and unreasonable” or “unduly discriminatory and
preferential.”20
FERC can review rate filings independently or after receiving a complaint. To be deemed
just and reasonable, rates need to be cost-justified or market justified. Complainants must show that the
return on equity (ROE) is outside a range defined by a lower and an upper band ROE computed using
FERC’s preferred discounted cash flow model.
Natural gas. The natural gas industry is composed of three major segments--production, transmission,
and distribution.
The production segment is made up of natural gas producers who explore for and extract gas
from the ground.
The transmission sector consists of pipelines, or transmission companies, that historically
purchased natural gas from producers or other suppliers, and then transported and sold and
delivered the gas to other pipelines, distributors, or customers. Pipelines may transport gas within
the boundaries of a single state (intrastate) or between states (interstate).
The distribution sector consists of local distributors, primarily local public utilities that purchase
natural gas from pipelines. These distributors then resell the gas to end-users, such as
residential, commercial, or industrial customers.
For many years, the industry functioned with separate intrastate and interstate markets. Natural gas was
somewhat cheaper in the interstate market as a result of wellhead price regulation under the Natural Gas
Act. But many producers refused to commit all of their gas to the interstate market. Based on proximity
and the absence of wellhead price regulation, industries reliant on natural gas chose to locate in gas
producing states and obtain supplies through intrastate pipelines. In response to a national shortage of
natural gas in the 1970s, particularly in the interstate market, and subsequent Congressional action
reforming and ultimately eliminating wellhead price controls, FERC required interstate pipeline companies
to unbundle, or separate, their sales and transportation services. This allowed distribution companies to
purchase gas directly from producers and pay the pipeline companies to transport the gas. Unbundling
was intended to increase competition among gas sellers and diminish the market power of pipeline
companies.
19 The Regulatory Assistance Project, “Electricity Regulation in the US: A Guide” (2010): 67 http://www.raponline.org/document/download/id/645 20 16 U.S.C. § 824(d).

Project FY14 – STB - 157
Railroad rate regulation xv
Similar to its requirements with electricity transmission providers, FERC requires natural gas pipelines to
offer transmission services on a non-discriminatory basis.21
Pipelines must file with the FERC their
proposed tariffs, which are calculated on an RBROR basis. FERC sets the maximum rates for each
pipeline separately.22
Whenever a new rate or change to a rate is needed, the company must complete a
submission to FERC for approval. Customers can also file complaints with the FERC, which considers
complaints on a case-by-case basis.
Suitability for Freight Rail Regulation. Federal regulation of electricity and natural gas transmission is
not an appropriate method to consider as an alternative for the U.S. rail industry.
Most importantly, FERC’s regulatory approach represents a departure from CMP principles. Adopting
some form of Rate Based Rate of Return regulation similar to what FERC applies would represent a step
away from economic efficiency. Some form of pricing in electricity transmission such as the postage
stamp pricing allows the transmission company to recover its costs uniformly leading to potential cross-
subsidies. If such a rate-making approach was used in the U.S. railroad industry, some shippers would
bear a share of cost that is higher than the benefit they receive. Moreover, FERC’s regulatory processes
require a higher level of oversight compared to that applied in the U.S. in its regulation of railroads.
Further, the agency’s case-by-case approach to price regulation seems to be inconsistent with the
Staggers Act, which emphasizes relying on market-based solutions whenever possible.
TELRIC
The Telecommunications Act of 1996 required the incumbent providers of local telephone service
(primarily the “Baby Bells” created after the breakup of AT&T) to open their networks to competition at the
retail level by leasing portions of their networks to new entrants. Congress tasked the FCC with
developing a rate methodology under which the charges to the new entrants would obtain access to the
lowest reasonable cost. The pricing principle adopted by the FCC --TELRIC -- is a forward-looking, cost-
based methodology that attempts to allocate to the new entrant its share of the costs of hypothetical
network that would employ the most efficient technology for reasonably foreseeable capacity
requirements. It omits Ramsey pricing considerations integral to CMP principles used by the STB in
railroad rate regulation and assumes that the financial health of the incumbent carriers leasing portions of
their networks would not be adversely affected. 23
This contrasts with a major legislative goal of the
Staggers Act to promote the financial health of U.S. railroads.
Efficient Component Pricing Rule (ECPR)
In contrast, the ECPR measure reflects an incumbent’s net opportunity costs of providing access. This
includes the revenue foregone from lost traffic and, by implication, invokes the Ramsey pricing principles
implicit in modern U.S. railroad ratemaking. Some have argued that ECPR conforms to Ramsey
principles because it provides a means of pricing access that makes the host railroad whole with respect
21 Viscusi et al., Economics of Regulation and Antitrust, Fourth Edition (Cambridge, Massachusetts: The MIT Press, 2005), 684. 22 “How Are Pipelines Regulated?” Interstate Natural Gas Association, http://www.ingaa.org/cms/143.aspx 23 Federal Communications Commission, First Report and Order, In the Matter of Implementation of the Local Competition Provisions in the Telecommunications Act of 1996 CC Docket No. 96-98 and Interconnection between Local Exchange Carriers and Commercial Mobile Radio Service Providers, CC Docket No. 95-185, FCC 96-325, Adopted August 1, 1996, 7.

Project FY14 – STB - 157
Railroad rate regulation xvi
to its opportunity costs. Critics argue that the opportunity cost element of ECPR potentially preserves
monopoly rates and related inefficiencies that were embedded in opportunity cost.
In 1996, J. Gregory Sidak collaborated with Daniel F. Spulber advanced the concept of the “market-
determined efficient component pricing rule” or M-ECPR, which took forward-looking alternative access
costs into account.24
The difference between ECPR and M-ECPR lies in its constrained interpretation of
an incumbent’s opportunity cost. In cases where there are no actual and potential market alternatives to
using the incumbent’s bottleneck segment, that incumbent’s contribution is the relevant measure of
opportunity cost for ECPR. However, where existing or potential market alternatives exist, the price of
those alternatives becomes the relevant measure for calculating ECPR opportunity costs.
Modeling the Application of TELRIC and ECPR to U.S. Freight Rail Cases
The project team applied both methodologies to the Otter Tail and Western Fuels cases. Both
applications required numerous simplifying assumptions.
TELRIC. This analysis tested the likely outcomes of TELRIC-based rail regulation by solving for implied
TELRIC rates for the Otter Tail and Western Fuels cases, using URCS to estimate costs attributable to
the traffic at issue. Three sensitivities were tested for the markup over unattributable or shared costs of
the movements. The project team’s calculations of these sensitivities produced results that varied widely.
All three combinations resulted in cost markups below those demonstrated in the two Full-SAC cases.
The results could be interpreted as being consistent with a methodology that aims to promote entry and
competition, but not revenue adequacy.
In light of the different legislative mandate given by the Congress to STB and the FCC, the project team
concluded that TELRIC has little applicability to the U.S. railroad industry. A railroad application of
TELRIC would potentially impede operators’ ability to recover common costs and reduce financial
viability. Further, its implementation would require legislative action. Although TELRIC, as an access
pricing methodology, could be adapted to replace SAC for determination of maximum allowable rates to
be paid by railroad customers, the resulting adaption would have similar complexity to SAC.
ECPR. This investigation sought to determine if ECPR-based access pricing might indicate that a viable
competitive alternative were potentially available. Shippers’ rates were held constant and carrier costs
were adjusted to include ECPR access prices, including the landlord’s full opportunity cost. In the
Western Fuels case a small negative contribution resulted for the new entrant carrier, from which it was
inferred that sustainable competition would have not have resulted from a constrained bottleneck price .
In the Otter Tail case, a similar analysis found that ECPR-based access pricing for the short 24-mile
bottleneck segment, with the unconstrained opportunity cost and without offset for alternative uses of
crews and equipment, implied a significant loss. In other words, the price that would be extended to the
shipper by the competitive alternative could not be less than that offered by the incumbent.
The M-ECPR approach, which limited the price of access to the cost of building a “market alternative”
connecting track, was applied using the Otter Tail case data using both SAC and Simplified-SAC
construction cost estimates. The results suggested that the M-ECPR could have provided a positive
24 Sidak, J. Gregory, and Daniel F. Spulber, The Tragedy of the Telecommons: Government Pricing of Unbundled Network Elements Under the Telecommunications Act of 1996, 97 Colum. L. Rev. 1081 (1997).

Project FY14 – STB - 157
Railroad rate regulation xvii
contribution to the new entrant’s fixed cost, providing potentially, sustainable competition. The study team
concluded that in cases where a potential market alternative is identified, additional contribution might be
attracted. Still, under M-ECPR and ECPR, any rate incorporating a mandated access charge would
necessarily be subject to some variant of a SAC analysis.
Conclusions
Having already discussed the methodologies applied by other countries to their freight rail industry and
the regulatory regimes applied to some other network industries, we return to the questions of whether
SAC remains a valid instrument to determine the reasonableness of railroad rates, and whether the
procedure can be simplified. We reach the following conclusions:
First, the existing stand-alone cost methodology does recognize economies of scope with respect
to total costs via the contribution of bridge traffic to the fixed costs of the SARR.
Second, conceptually there could be additional economies of scope effect in reducing the
marginal/variable costs of the traffic in dispute. The STB’s guidance on SAC submissions allows
and even encourages shippers to consider such economies.
Third, at least one observer has recommended that the SAC methodology allows shippers to
consider economies of scope between the SARR and all the other lines in the carrier’s network,
even if in different regions. This is not a recipe for simplification of the SAC methodology. It is,
indeed, quite the opposite. It also seems to be at odds with the Staggers Act provisions for line
rationalization and abandonment. These provisions indicate that policy requires rail lines to stand
on their own financially and thus introducing revenue contribution from other lines seems
inconsistent with the legislative provisions.
The project team concluded that there are two basic ways to simplify the SAC.
First, the definition of the “most efficient network” could be simplified. Considering the
consolidation and line discontinuance that has occurred throughout the industry over the past four
decades, the existing railroads have much more direct routes than they formerly had. As a result,
this expensive and time consuming aspect of the stand-alone costing of determining the optimal
route is perhaps no longer required (as already done in Simplified SAC).
Second, STB could consider simplifying the contribution of the cross-over traffic, especially now
that the U.S. rail network is operated by only seven Class I railroads. It is quite possible that they
probably already have the maximum traffic that can be expected for a SARR.
These changes are only possible now, given the wave of rail mergers that were authorized since
deregulation, which implicitly suggests that perhaps the U.S. no longer needs to debate potential efficient
routings as in the past, when networks were fragmented.
At the same time, however, the Team believes that simplification of either the Three-Benchmark or
Simplified-SAC tests risks moving the approaches further away from the bedrock CMP principles,
undermine the reliability of the tests, and would not necessarily incentivize shippers to use those tests.
An alternative regulatory regime focused on offering competitive access may be an alternative to STB’s
Full-SAC approach. However, if such an approach was adopted:

Project FY14 – STB - 157
Railroad rate regulation xviii
a) Shippers would lose access to maximum rate regulation; shippers would have no assurance that
the rates offered by a competitor would be less than that offered by the incumbent.
b) There would still need to be a regulatory role to set carrier-to-carrier access prices, and
c) Unless the Congress is willing to abandon carrier revenue adequacy as a major legislated
objective of U.S. freight rail policy, the rate reasonableness methodology for access charges will
still require some form of SAC analysis for the most common disputes, such as those involving
coal rates.
In sum, STB’s Full-SAC has stood the test of time as a maximum rate reasonableness methodology and
is justifiable in some cases. However, the less expensive Simplified-SAC and Three-Benchmark methods
are also available as options for shippers, and there is reason to believe that shippers can achieve similar
results to Full SAC under these less-costly alternatives.
Project FY14 – STB - 157
Railroad rate regulation 1
1 Introduction
The Surface Transportation Board (STB or the Board) was established in January 1996 as a decisionally
independent, bipartisan, adjudicatory body, with jurisdiction over certain surface transportation economic
regulatory matters.25
One of the STB’s statutory duties is to adjudicate complaints brought by shippers
against the rates charged for railroad transportation pursuant to its authority under 49 United States Code
(U.S.C.) § 10701 et seq. For rail traffic that is subject to the STB’s rate jurisdiction, the STB’s governing
statute requires that rates be “reasonable.” The Board does not have jurisdiction over the reasonableness
of a rate for rail transportation unless the rail carrier providing the service has “market dominance” in that
particular market. Market dominance exists when there is “an absence of effective competition from other
rail carriers or modes of transportation for the transportation to which a rate applies.”26
The statue
explicitly recognizes that competitive alternatives can comprise both intra-modal competition (another
railroad) and inter-modal competition (e.g., trucks, ships, barges, pipelines, etc.).
Since the mid-1970s, the freight railroad industry has become more concentrated. According to the U.S.
Government Accountability Office (GAO), there were 63 Class I railroads operating in the United States in
1976, but the number had been reduced to 7 by 2006 as a result of mergers, bankruptcies, and a
redefinition of what constitutes a major railroad.27
These are: BNSF Railway Company (BNSF); CSX
Transportation, Inc. (CSX); Grand Trunk Corporation (including U.S. affiliates of Canadian National
Railway); Kansas City Southern Railway Company; Norfolk Southern Combined Railroad Subsidiaries
(Norfolk Southern); Soo Line Corporation (including U.S. affiliates of Canadian Pacific Railway); and
Union Pacific Railroad Company (Union Pacific). The railroad industry is dominated by four Class I
railroads, two in the East (CSX and Norfolk Southern) and two in the West (BNSF and Union Pacific).
Consolidation in the industry has helped improve its overall financial condition, but also raised concerns
among some stakeholders about a loss of competition among railroads and service quality degradation.
In its 2006 report on competition in the U.S. freight railroad industry, the GAO gave an example of the
difference in rates paid by shippers that were served by more than one railroad from those that were
served by only one. The report documented differences in rates paid by grain shippers on two different
routes ending in Portland, Oregon: “Both routes carry comparable tonnage, but the route originating in
the economic area in and around Sioux Falls, South Dakota, is served by two Class I railroads, whereas
the route from the Minot, North Dakota, economic area is served by one Class I railroad. The rates for the
Minot route are roughly double the rates for the Sioux Falls route.”28
However, even if rates paid on the
Minot route may be double those charged on the Sioux Falls route, that is not necessarily indicative of
whether or not those rates were unreasonable because railroads are permitted to differentially price with
25 Administratively, the STB was part of the Department of Transportation until passage of the Surface Transportation Board Reauthorization Act of 2015, Pub. L. No. 114-110, which, in Section 3, made the STB “an independent establishment of the United States Government.” 26 49 U.S.C. § 10707(a). 27 U.S. Government Accountability Office, “Freight Railroads: Industry Health has Improved, but Concerns about Competition and Capacity Should be Addressed,” GAO-07-94 (Washington, DC, 2006), 19. http://www.gao.gov/products/GAO-07-94 28 Ibid., 21.
Project FY14 – STB - 157
Railroad rate regulation 2
the consequence that shippers without good alternatives will pay higher rates. It is the responsibility of
the STB to make that determination.
The process through which STB determines the reasonableness of rates is complex, time-consuming,
and expensive. The basic challenge to the Board is to estimate what a reasonable rate would be were a
competitive market to exist, given the legislative framework within which it operates. As this report
discusses in more detail in subsequent chapters, the standards that the STB uses to assess freight rail
rates are intertwined with STB’s legislative guidance and with the freight railroad industry and its evolving
financial condition.
The Staggers Rail Act of 198029
(Staggers Act) built upon other important pieces of legislation passed
during the 1970s to assist with the industry’s recovery and to improve the efficacy of its regulation. The
Staggers Act contained multiple goals and regulatory policies, including
to assist the rail system to remain viable in the private sector of the economy; and
to provide a regulatory process that balances the needs of carriers, shippers, and the public.
Section 101 of the Staggers Act specified the policies of the Federal government with respect to rail
regulation.30
These included allowing competition and the demand for services to establish reasonable
rates for rail transportation, minimizing Federal regulatory control over rates, and promoting an efficient
rail system by allowing carriers to earn adequate revenues.
In 1980, when the Staggers Rail Act was passed, there were 18 Class I railroad systems operating in the
U.S.31
By 2000, that number had fallen to seven. Such consolidation has helped the industry rationalize
its network and better match capacity to the market. At the same time, however, consolidation has raised
challenges for shippers, which have may have fewer options for transporting products. Some shippers
have complained that STB’s rate-review process is inaccessible to them – that only the largest shippers
can afford the investment to challenge rates. STB itself has likewise recognized the issue.
In 2011, the STB initiated a public hearing process to examine competition issues. Among the factors the
Board cited as its reasons for opening the proceeding were, “the improving economic health of the
railroad industry” and “increased consolidation in the Class I railroad sector.”32
In June 2013, the STB began re-examining whether many of the economic regulatory practices in place
for many years remained appropriate for and relevant to the rail industry. The Board held a hearing to
further examine issues related to the accessibility of rate complaint procedures for grain shippers and
29 Staggers Rail Act of 1980, Pub. L. No. 96-448, 94 Stat. 1895-1966 (1980). 30 These were codified at 49 U.S.C. §10101 – Rail Transportation Policy. 31 Class I railroads are regulated by the STB and subject to the Uniform System of Accounts (49 CFR 1201). Railroads are classified based on their annual operating revenues. The Class to which a carrier belongs is determined by comparing its adjusted operating revenues for three consecutive years. Class I railroads are those with adjusted operating revenues of $475 million or more as of 2014. There are currently seven Class I railroads (BNSF Railway Company, Canadian National Railway Company, Canadian Pacific Railway, CSX Transportation Inc., Kansas City Southern Railway Company, Norfolk Southern Corporation, and Union Pacific Railroad). 32 Competition in the Railroad Industry, Ex Parte No. 705, slip op. at 3 (STB served Jan. 11, 2011).

Project FY14 – STB - 157
Railroad rate regulation 3
provide interested persons the opportunity to comment on the modifications to the existing procedures
and the alternative rate relief methodologies proposed during the public comment period.33
In 2014, the Board also instituted an ex parte proceeding (EP 722) to explore the Board’s methodology
for determining railroad revenue adequacy and the use of the revenue adequacy component of
Constrained Market Pricing in rate reasonableness cases.
The U.S. Congress has also taken note of the improving financial condition of the industry and the
challenges faced by some shippers. In 2013, the staff of the U.S. Senate Committee on Commerce,
Science and Transportation issued a report that found that U.S. railroads were establishing record-low
operating ratios, experiencing record growth in operating income, and posting record earnings-per-share
figures.34
Based on these findings and statements from senior railroad officials, the report then concluded
that it was an appropriate time to reassess the regulatory approach applied to the industry. The
Committee report noted that “railroads were struggling financially when the Staggers Act was enacted”
and “the regulatory system that was built on that law places heavy focus on helping railroads earn higher
revenues.”35
Because railroads had since begun to consistently generate significant profits and healthy
returns, it was now appropriate for policy-makers to assess “whether the current regulatory system
effectively balances the interests of railroads, shippers, and consumers.”36
The Congress has held oversight hearings of STB in 2014 and 2015 as part of its ongoing legislative
responsibilities and as part of the work leading to the reauthorization of the STB.37
In 2015, the Board’s
acting chairman testified to the House Committee on Transportation and Infrastructure concerning the
STB’s rate review process. She also said that while the SAC test is “based on sound economic
principles,” its execution “creates difficulty” and can be “herculean.”38
She noted that “No grain shipper
has brought a rate complaint before the agency since 1981.”39
33 Rail Transportation of Grain, Rate Regulation Review, Ex Parte No. 665 (Sub-no. 1), slip op. at 1 (STB served Dec.
12, 2013). 34
Senate Committee on Commerce, Science, and Transportation, Office of Oversight and Investigations, “Update on the Financial State of the Class I Freight Rail Industry,” Majority Staff Report, (2013), 2. 35 Ibid., i. 36 Ibid. 37 U.S. Congress, Senate Committee on Commerce, Science, and Transportation, Freight Rail Service: Improving the Performance of America’s Rail System, hearings, 113th Cong., 2nd sess., September 10, 2014 (Washington, DC: GPO, 2014). U.S. Congress, Senate Committee on Commerce, Science, and Transportation, Freight Rail Transportation: Enhancing Safety, Efficiency, and Commerce, hearings, 114h Cong., 1st sess., January 28, 2015 (Washington, DC: GPO, 2015). U.S. Congress, House Committee on Transportation and Infrastructure, Subcommittee on Railroads, Pipelines, and Hazardous Materials, The 35th Anniversary of the Staggers Rail Act: Railroad Deregulation Past, Present, and Future, 114h Cong., 1st sess., May 13, 2014 (Washington, DC: GPO, 2015). 38 Testimony of Deb Miller, Acting Chairman, STB, Before the Subcommittee on Railroads, Pipelines, and Hazardous Materials, Committee on Transportation and Infrastructure, U.S. House of Representatives, (May 13, 2015), 10. 39 Ibid., 8.

Project FY14 – STB - 157
Railroad rate regulation 4
1.1 Objectives of this Report
As part of its effort to examine its approach to reviewing rail rate reasonableness, the STB initiated this
study to examine the academic and scholarly
literature that addresses proposed alternatives to all
or part of the STB’s current rate regulation
methodologies. The general research questions that
this report sought to answer were:
What methodologies do other national
regulatory agencies apply to examine the
reasonableness of rates levied by railroads,
utilities, natural monopolies, or other network
industries, and are any of those approaches
suitable for the STB’s purposes, given its
statutory responsibilities and limitations?
Is SAC still a valid instrument to determine
the reasonableness of rates?
Can that procedure be simplified?
1.2 Organization of the Report
This report is organized broadly into four major sections.
The first section provides an overview of the legislative history of federal oversight of the freight rail
industry, which is inevitably tied to the industry’s economic regulation. Chapter 2 provides a summary of
the major pieces of legislation that shaped the government’s regulatory oversight of the industry, from the
creation of the Interstate Commerce Commission (ICC) to the present. It discusses the legislative
response to the industry’s financial decline, with the overall goal of revitalizing and stabilizing the
railroads’ financial health, and establishing a more flexible regulatory regime that placed primary reliance
on competition. The chapter also briefly reviews some of the major economic and regulatory concepts of
the government’s approach to rate regulation, especially constrained market pricing principles and the
stand-alone cost test. These were instituted following enactment of the major federal pieces of
legislation. The chapter also introduces STB’s efforts to simplify its regulatory approach to rate relief.
The second section covers the economics of freight rail regulation. Chapter 3 provides a summary of the
important economic concepts that govern rail operations and pricing, including economies of scope, joint
and common costs, and Ramsey Pricing. Economies of scope arise in the railroad industry because of
the presence of joint and common costs. Joint and common costs in the railroad industry generally
appear when the railroads use the same tracks and infrastructure to serve different shipments by various
shippers of commodities. Ramsey pricing is a principle under which firms set their prices above the
marginal cost to cover their fixed and common costs. The chapter reviews some of the leading economic
literature that connects the concepts of constrained market pricing and the stand alone cost with
economies of scope and Ramsey pricing principles. Chapter 4 then explains in greater detail the tests
The research questions that this report
sought to answer were:
• What methodologies do other national
regulatory agencies apply to examine the
reasonableness of rates?
• Is SAC still a valid instrument to
determine the reasonableness of rates?
• Can that procedure be simplified?

Project FY14 – STB - 157
Railroad rate regulation 5
used by the STB to determine the reasonableness of rates charged by railroads: the “Full Stand-Alone
Cost” procedure and the two subsequent simplifications of that procedure, the Three-Benchmark
procedure and the Simplified Stand-Alone Cost procedure. This chapter also examines the main
challenges that have emerged since their introduction.
In the third major section, the report examines the broad questions of whether the Board’s Stand-Alone
Cost procedure can be simplified. Chapter 5 reports the results of the project team’s application of STB’s
simplified standards to two cases that were decided using the Full-SAC procedure. The fundamental
question examined was whether the use of the Three-Benchmark or Simplified-SAC procedure produced
the same basic results as the Full-SAC. Chapter 6 then summarizes the experience of other countries
that employ fundamentally different regulatory regimes – Canada’s system of final offer arbitration to
negotiated commercial rates and access regimes used in the United Kingdom (UK) and Australia. In
Chapter 7, the project team examines whether some form of access regulation might be applied in the
United States, were it considered within the STB’s legislative authority.
The fourth and final section offers conclusions and recommendations. Chapter 8 summarizes the project
team’s analysis of its examination of the use of the STB’s simplified standards and access regimes. The
chapter offers insights into whether the Simplified Standards could be applied more widely and if so, what
the implications might mean not only for shippers and carriers, but for the STB as well.
1.3 Methodology
This project was divided into four distinct phases, culminating in the production of this final report.
Literature Review. First, the study team completed a thorough review of the literature relevant to SAC
and potential alternative approaches to rate regulation methodologies. This forms the intellectual
foundation of the project. The project team systematically reviewed economics, business, law, and other
relevant literature (e.g., academic manuscripts and books) concerning rail rate regulation in particular and
network industries in general. The literature covered both STB’s regulatory processes (in theory and
application), as well as other models applied by other national governments both to their rail industry and
other network industries. Much of this research is reflected in the report that follows concerning the
economic foundations of the STB’s regulatory approach. The brief summary of the regulatory
approaches applied by Australia and the UK to their freight rail sector, and the regulatory approaches
applied to the telecommunications industry are included in this report. The details of the literature review
are under separate cover as the Task 1 report.
Analysis of Alternative Approaches. Following discussions with STB staff, the study team then
analyzed those materials and evaluated the claims, findings, and conclusions regarding whether those
approaches might be appropriate for the STB’s possible adoption and implementation. Major
considerations were whether the proposed methodologies would likely reduce the time, complexity, and
expense that has historically been involved in the litigation and resolution of rate reasonableness
complaints. The study team also assessed whether the alternatives might affect the STB’s ability to
achieve outcomes that are fair and reasonable to both railroads and shippers.
Discussion. The project team then held discussions with the STB staff on the tentative conclusions of
this analysis.

Project FY14 – STB - 157
Railroad rate regulation 6
Report. Finally, the project team assembled all of the materials, analyses, conclusions, and
recommendations into this final report. The report was provided to the STB for its review and comments.
STB offered a number of comments to clarify the draft, which the project team considered and
incorporated as appropriate.
1.4 Acknowledgements
The conclusions in this report reflect the independent analysis of InterVISTAS Consulting Inc. However,
the project team included assistance from several other individuals and firms, without whose assistance
the report would not have been possible. These were J. Chris Rooney of the Vanness Company, John H.
Broadley & Associates, P.C., and K.R. Saline and Associates, PLC.

Project FY14 – STB - 157
Railroad rate regulation 7
2 Legislative and Regulatory Context
Federal oversight of freight rail rates has existed since 1887, when the Congress enacted the Interstate
Commerce Act (ICAct) to protect shippers from the monopoly power of the rail industry.40
That act created
the Interstate Commerce Commission (ICC) to provide regulatory oversight. The ICC’s statutory mandate
was later expanded to include interstate trucking, bus operations, pipelines, domestic water carriers, and
freight forwarders. Federal economic regulation of transportation encompassed supervision of market
entry and exit, rates, terms and conditions of service, consolidations, and service quality.41
For decades, railroads have been the primary mode of transportation for many products, especially for
such bulk commodities as coal, grain, chemicals, fertilizers and forest products, among others. Yet, by the
1970s American freight railroads were in a serious financial decline. The Congress responded by passing
three pieces of major legislation with the overall goal of revitalizing and stabilizing the railroads’ financial
health, and establishing a more flexible regulatory regime that placed primary reliance on competition.
This chapter reviews the primary changes in the legislative and regulatory context for freight rail.
2.1 Regional Rail Reorganization Act of 1973
The Regional Rail Reorganization Act of 1973 (the “3R Act”) was enacted by Congress in an effort to
consolidate and revitalize insolvent railroads in the Northeastern United States following the financial
collapse of the nation’s largest transportation company, the Penn Central – which was one of the largest
bankruptcies in U.S. history.42
Although the factors that caused the decline in the financial viability of American railroads beginning after
World War II were national in scope, their effects were most pronounced in the Northeast. Between 1967
and 1973, eight northeastern railroads, in addition to the Penn Central, filed for bankruptcy reorganization
under section 77 of the Bankruptcy Act.43
First, and of the upmost importance, many of the industries which relied upon railroad declined in
importance, while the geographic location and service requirements of major industrial users shifted.
Heavy industry had begun migrating from the Northeast to the South and West, while the industry that
40 Some states began forms of regulation of railroads as early as the 1840s. 41 Dempsey, Paul Stephen, The Rise and Fall of the Interstate Commerce Commission: The Tortuous Path From Regulation to Deregulation of America’s Infrastructure, 95 Marq. L. Rev. 1150, 1160-1161 (2012). 42 Drury, George H., The Historical Guide to North American Railroads: Histories, Figures and Features of more than 160 Railroads Abandoned or Merged since 1930, (Waukesha, Wisconsin: Kalmbach Publishing, 1994), 215, 248–251. 43 Bleich, Alisa Levin, Note, Regional Rail Reorganization Act of 1973: Was Congress on the Right Track?, 49 St. John’s L. Rev. 98 (1974) http://scholarship.law.stjohns.edu/lawreview/vol49/iss1/5/
Project FY14 – STB - 157
Railroad rate regulation 8
remained in the Northeast was shifting away from train-delivered coal at individual industrial plants to
delivery to utilities where power was generated and sold to users.44
Second, following World War II, railroads saw a dramatic decline in their passenger business, which, by
1967, had become deeply unprofitable, again particularly in the Northeast. In 1970, the Rail Passenger
Service Act allowed the railroads to contribute their passenger services and equipment to the National
Railroad Passenger Corporation (Amtrak) for stock to unburden themselves of passenger losses.45
Third, railroads faced increasing competition from the trucking, barge, and air cargo sectors. This
competition was also facilitated by federal investment in (i.e., subsidization of) interstate highways,
waterways, and airports. Trucking was a particularly relevant alternative in the Northeast where distances
between major cities are relatively short and many highways were then relatively new and uncongested.
At the time, the Northeast rail system was also primarily designed for short-haul service. While it would
have been economically advantageous to focus on long-haul service, the railroads then lacked sufficient
capital available for a major restructuring.46
The result of competition between modes was that the
railroad share of intercity freight dropped from around 75 percent at the end of the 1920s to 40 percent by
1970.47
Fourth, government regulatory policies further contributed to the weakening of the railroads. In particular,
the rail rate structure was relatively inflexible under the then-existing regulatory procedures. Notably, the
ICC set minimum rates for the majority of railroad charges, but regulated a relatively smaller portion of the
charges of the trucking and barge industries. This further hindered the railroads’ ability to respond to
increased competition.48
Fifth, existing legislation was ill-equipped to deal with the Northeast rail problem. It was widely believed
that major consolidation and abandonment of excess trackage was necessary to revitalize the railroads in
the Northeast.49
However, under section 77 of the Bankruptcy Act, each debtor was required to seek
approval of its own plan of reorganization. With seven Class I railroads and two Class II railroads
petitioning for reorganization in several different jurisdictions, it would have been virtually impossible for
any single plan to accomplish the needed consolidation and rationalization of rail service. Section 77
proceedings were also highly time-consuming. Although ultimate responsibility rested with the District
Court, the ICC had to authorize any reorganization prior to judicial confirmation. As a result, proceedings
could continue for several years during which the assets of the railroads suffered continued and
substantial deterioration.50
44 Guetschow, Gregg, The Creation of Conrail and Its Impact on Railroad Regulation, 8 Policy Perspectives 14-15 (2009). 45 Rail Passenger Service Act of 1970, Pub. L. No. 91-518, 84 Stat. 1327-42 (1970), 49 U.S.C. § 24101 et seq. 46 Bleich, Regional Rail Reorganization, 49 St. John’s L. Rev. at 100. 47 Braeutigam, Ronald R, Consequences of Regulatory Reform in the American Railroad Industry, 59 So. Econ. J. 470 (1993). 48 See, for example, Winston, Clifford, “The Success of the Staggers Rail Act of 1980,” AEI-Brookings Joint Center for Regulatory Studies Publication 05-24, (2005): 2-3. http://www.brookings.edu/~/media/research/files/papers/2005/10/railact-winston/10_railact_winston.pdf 49 Bleich, Regional Rail Reorganization, 49 St. John’s L. Rev. at 103. 50 Ibid., 104.

Project FY14 – STB - 157
Railroad rate regulation 9
To resolve the Northeast rail crisis, the 3R Act established two organizations: (1) the United States
Railway Association (USRA), a government-owned corporation which formulated a final system plan for
addressing the problem of rail service in the Northeast, and (2) Consolidated Rail Corporation (Conrail), a
for-profit enterprise which acquired the lines designated under the final system plan and operated the rail
system formulated by the USRA. In 1973, the bankrupt Penn Central and five smaller railroads were
merged into Conrail.51
The final recommendation by the USRA involved abandoning designated portions of the Northeast
system, while Conrail would operate the remainder until it returned to profitability. Although shippers and
communities directly impacted by the abandonments expressed opposition to the plan, the 3R Act
provided that the final recommendation from the USRA would “have the force of law if it was not
disapproved by either house of Congress within sixty legislative days after its release.”52
There was no
Congressional disapproval, and the plan went into effect on November 9, 1975.
2.2 Railroad Revitalization and Regulatory Reform Act of 1976
Three years after the 3R Act, Congress enacted the Railroad Revitalization and Regulatory Reform Act of
1976 (the “4R Act”) to address nationwide problems in the rail industry. The 4R Act implemented the first
substantial reduction in federal regulation of railroads since passage of the ICAct.
The 4R Act modified railroad regulation by the ICC in a range of areas, including rates, line abandonment,
and mergers. First, it provided new rate-setting flexibility by permitting a railroad to adjust its rates up or
down within a “zone of reasonableness” without regulatory approval. The “zone of reasonableness’’ was
initially within seven percent of the existing ICC tariff and was to be widened over time.53
Rail rates that
might exceed cost-based just and reasonable maximum rate levels would be allowed so long as they
applied to traffic where the railroad did not have “market dominance” (which was defined as “an absence
of effective competition from other carriers or modes of transportation, for the traffic or movement to which
a rate applies.”)54
Second, the 4R Act set timelines for the ICC to process abandonment applications to limit the time (and
cost) to the railroads of abandoning unprofitable lines.55
The Act also made provision for unprofitable
lines to be subsidized where a “financially responsible person” would provide financial assistance which
would allow the line to cover avoidable costs, including “a reasonable return on the values of such line”.56
51 Guetschow, “The Creation of Conrail,“ 18. 52 Perritt Jr., Henry H., Ask and Ye Shall Receive: The Legislative Response to the Northeast Rail Crisis, 28 Vill. L. Rev. (1983), 311. 53 Braeutigam, Consequences of Regulatory Reform, 59 So. Econ. J. at 471. 54 Railroad Revitalization and Regulatory Reform Act of 1976, Pub. L. No. 94-210, 90 Stat. 1(1976), Section 202(c)(1). 55 Keeler, Theodore E., Railroads, Freight, and Public Policy, (Washington D.C.: The Brookings Institution, (1983), 34. 56 Railroad Revitalization and Regulatory Reform Act of 1976, Section 802 (amending former section 1 of the ICAct by adding new paragraph a(6), 49 U.S.C. § 1a(6)). The ICAct was recodified in 1978 with the substantive provisions beginning at 49 U.S.C. § 10101.

Project FY14 – STB - 157
Railroad rate regulation 10
Third, the 4R Act introduced statutory changes to merger regulation to encourage consolidation and joint
use of facilities. Specifically, the Act aimed to expedite the processing of merger petitions. To accomplish
this objective, legislation established time constraints for each stage of the processing. The ICC was
required to render its decision on proposed mergers within 31 months of submission.57
2.3 The Staggers Rail Act of 1980
The Staggers Rail Act of 1980 (Staggers Act) built on the foundation of the 4R Act to further revitalize the
railroad industry in the U.S. following a long period of decline in performance.
Goals of the Staggers Act
Anticipating a capital shortfall of between $16 and $20 billion, the Congress concluded there was an
urgent need to end the ineffective regulation that was impeding the industry from becoming profitable.58
Congress believed that deregulation was the necessary solution to return to profitability and to boost
innovation. The Staggers Act of 1980 was intended to provide a framework for the deregulation in the
railroad industry.
The Staggers Act pursued multiple goals:
(1) to assist the railroads of the Nation in rehabilitating the rail system in order to meet the demands
of interstate commerce and the national defense;
(2) to reform Federal regulatory policy so as to preserve a safe adequate, economical, efficient, and
financially stable rail system;
(3) to assist the rail system to remain viable in the private sector of the economy;
(4) to provide a regulatory process that balances the needs of carriers, shippers, and the public; and
(5) to assist in the rehabilitation of financing of the rail system.59
The main purpose of the Staggers Rail Act of 1980 was thus to restore the economic efficiency of the
industry by allowing railroads to compete with each other and other modes of transportation on the basis
of price and service quality and by establishing railroad revenue adequacy as a regulatory priority which
would ensure a financially stable rail system.
Importantly, in a new section captioned Rail Transportation Policy,60
the Staggers Act clearly stated
federal policy with respect to railroads and rail regulation. These included:
(1) to allow, to the maximum extent possible, competition and the demand for services to establish
reasonable rates for transportation by rail;
57 Crum, Michael R. and Allen, Benjamin J., "U.S. Transportation Merger Policy: Evolution, Current Status, and Antitrust Considerations" (1986). Supply Chain and Information Systems Publications. Paper 9. 58 Staggers Rail Act of 1980, § 2(7). 59 Staggers Rail Act of 1980, § 3 (1) – (5). 60 Staggers Rail Act of 1980, § 101(a), codified as 49 U.S.C. § 10101a (Suppl. IV 1980).

Project FY14 – STB - 157
Railroad rate regulation 11
(2) to minimize the need for Federal regulatory control over the rail transportation system and to
require fair and expeditious regulatory decisions when regulation is required;
(3) to promote a safe and efficient rail transportation system by allowing rail carriers to earn adequate
revenues, as determined by the Interstate Commerce Commission;
(4) to ensure the development and continuation of a sound rail transportation system with effective
competition among rail carriers and with other modes, to meet the needs of the public and the
national defense;
(5) to foster sound economic conditions in
transportation and to ensure effective competition
and coordination between rail carriers and other
modes;
(6) to maintain reasonable rates where there is
an absence of effective competition and where
rail rates provide revenues which exceed the
amount necessary to maintain the rail system and
to attract capital;
…
(12) to prohibit predatory pricing and practices, to
avoid undue concentrations of market power, and
to prohibit unlawful discrimination;
…and
(15) to provide for the expeditious handling and
resolution of all proceedings required or permitted
to be brought under this part.
Staggers Act - Major Measures
Among the major changes introduced by the Staggers Act, the most important was the removal of
inefficient commodity rate regulation. The Staggers Act phased out industry-wide rate increases and
permitted railroads to freely set rates and to enter into confidential contracts with shippers. By removing
rate regulation except for situations where the carrier was market dominant and the shipper could
demonstrate that the rate was unreasonable, the Congress effectively allowed the railroads to become
responsible for their own performance.
The Staggers Act authorized the railroads to use differential pricing. Rates would be established based on
market demand, which would reflect, in part, shippers’ ability to pay. Congress understood that if railroads
charged the same price per ton-mile to all shippers, this average price would give some shippers an
incentive to choose another less expensive transportation mode. With fewer shippers remaining, they
would have to pay higher rates in order to cover the fixed and common costs of the railroad. This higher
rate could force additional shippers out of the market, leaving even fewer shippers to cover fixed and
common costs. Differential pricing would allow railroads to design pricing strategies, based on market
forces which would enable them to cover their total costs. This was particularly important for commodities
The Staggers Act clearly stated federal
policies regarding rail regulation. Among
others, these included:
allowing competition and the demand for
services to establish reasonable rates,
requiring fair and expeditious regulatory
decisions when required,
allowing rail carriers to earn adequate
revenues, and
protecting shippers by requiring rates to
be reasonable where there is an absence
of effective competition.

Project FY14 – STB - 157
Railroad rate regulation 12
and manufactured products facing strong competition from the trucking industry and enabled railroads to
retain more traffic. Those shippers with the fewest alternatives were expected to bear a higher share of
the costs to ensure revenue adequacy.61
Differential pricing effectively provided new tools for railroads to
maximize the use of rail transport, and the resulting higher traffic volumes allowed lower rates for shippers
overall than if fixed pricing (i.e., average cost pricing) had been used.
The Act also enhanced the ability of railroads to rationalize their systems by abandoning unprofitable lines
and merging with each other. The Staggers Act introduced a new process intended to ease the
abandonment of lines to speed up operational improvement and financial recovery. The Act reduced
some regulatory barriers to ease railroad mergers by establishing a shorter decision process and
streamlining rules. This measure allowed railroads to reduce their costs and increase their productivity by
focusing on higher density and longer haul traffic. It also permitted the railroads to rationalize their
networks by eliminating small, inefficient and costly segments.62
Finally, the Act provided shippers with a regulatory mechanism to protect them from situations where
market dominance existed. The Act also gave the ICC broad authority to issue exemptions from
regulation where regulation was not necessary to carry out federal rail transportation policy and the
transportation or service was of limited scope or regulation was not necessary to protect shippers from
the abuse of market power.63
Residual Regulation
As a result of the direction by Congress, residual regulation was retained as necessary to prevent
potential abuse of market dominance where there was an absence of effective competition.
“Captive shippers” are those that do not have an effective competitive alternative to the single railroad
that serves their traffic. However, there is no widely agreed upon definition of what constitutes an
“effective competitive alternative.” At a minimum, competitive alternatives comprise intra-modal
competition (another railroad) or inter-modal competition (e.g., trucks, ships, barges, pipelines). Others
cite other competitive constraints on railroad pricing that stems from gateway competition, source of
supply competition, product competition, competition in the final goods market and shipper countervailing
powers. Determining what constitutes effective competition can be difficult and estimates can range
widely. According to Fritelli,64
citing testimony of former STB chairman Roger Nober, captive shippers are
a minority among all shippers and account for 15 to 20 percent of all rail movements. Clifford Winston and
Curtis Grimm defined a captive shipper in their analysis of the U.S. railroad industry as a shipper that “is
served by only one railroad, with the only alternative railroad more than 50 miles away, is unable to use
water transportation and does not use truck, and has no alternative locations that competing railroads
61 Casavant, Ken et al., Rail Rate and Revenue Changes Since the Staggers Act, 50 J. of the Transp. Research Forum no. 1 (2011), http://ses.wsu.edu/wp-content/uploads/2015/03/RailRate.pdf 62 Not all trackage the larger railroads could not operate profitably were necessarily abandoned. The Staggers Act also facilitated the development of short-line railroads. This enabled track that was not profitable for major carriers to be sold and continue in productive use by small, flexible and low-cost short lines. According to the Association of American Railroads, about 45,000 miles of track are now operated by short lines. 63 Staggers Rail Act of 1980, § 10505. The exemption power currently is codified at 49 U.S.C. § 10502. 64 U.S. Library of Congress, Congressional Research Service, “Railroad Access and Competition Issues,” by John Fritelli, RL34117, (2007): 1, http://www.publicpower.org/files/PDFs/CRSReportoRailCompetitio80307.pdf

Project FY14 – STB - 157
Railroad rate regulation 13
could use to serve the receiver.”65
They estimated that captive shippers represented roughly 20 percent
of the traffic and were mainly coal, non-metallic mineral or chemical shippers in the mountain or southern
states with length of haul less than 1,000 miles.66
If a captive shipper and the railroad fail in their commercial negotiations, the shipper can challenge the
rate offered by the carrier by filing a complaint with the agency on the ground that the rate is
unreasonable. Under this regulatory mechanism, the shippers and the railroads bear the cost of the
regulation, meaning they are expected to provide evidence to support their respective cases. The burden
on the shipper is substantial because, as the complainant, it bears the burden of proving that the rate is
unreasonable.
The Staggers Act established a market-dominance threshold criterion: for market dominance to exist, the
revenue-variable cost ratio (R/VC ratio) of the disputed service must exceed 180 percent.67
If the R/VC
ratio was less than 180 percent, then the carrier was deemed to not have market dominance over the
particular service and the proposed rate was not considered unreasonable. But a ratio that exceeded the
180 percent threshold in and of itself was not sufficient to establish market dominance. Rather, the
shipper was also required to prove that the railroad had market dominance by demonstrating the absence
of effective rail and inter-modal competition (road, pipelines, and water transportation).
Once market dominance was established, the ICC still had to determine whether the shipper had
demonstrated that the challenged rate was unreasonably high and, if so, what rate to apply to the service
at issue. Complicating that determination was the requirement specifically included in the Staggers Act
that the reasonableness of the rate should be determined with the underlying constraint of ensuring
revenue adequacy to the railroads.
The standards and procedures to determine the reasonable rate were not detailed in the Staggers Act but
left to the responsibility of the ICC. The ICC published a set of economic principles aiming to determine
rates that ensure economic efficiency and revenue adequacy for the railroads. These were the
“Constrained Market Pricing“(CMP) principles that were published in the ICC’s Coal Rate Guidelines in
1985.68
2.4 Constrained Market Pricing Principles
The main purpose of these principles, which the STB continues to apply, is to protect captive shippers by
constraining the potential market power of an incumbent railroad with respect to specific movements
where the carrier is market dominant without imposing an inefficient regulatory mechanism on railroads
generally. The objective behind the CMP principles is that: “A captive shipper should not be required to
pay more than is necessary for the carrier involved to earn adequate revenues. Nor should it pay more
65 Grimm, Curtis and Clifford Winston, “Competition in the Deregulated Railroad Industry: Sources, Effects and
Policy Issues,” in Deregulation of Network Industries: What’s Next?, ed. Sam Peltzman and Clifford Winston, 41-71, (Washington, D.C.: AEI-Brookings Joint Center for Regulatory Studies, 2000), 62. 66 Ibid., 63. 67 The R/VC ratio was initially 160% but progressively increased to 180% in 1984. 68 Coal Rate Guidelines, 1 I.C.C. 2d, 520 (1985), aff’d sub nom. Consol. R. Corp. v. ICC, 812 F. 2d 1444 (3d Cir. 1987).

Project FY14 – STB - 157
Railroad rate regulation 14
than is necessary for efficient service. And a captive shipper should not bear the cost of any facilities or
services from which it derives no benefit.”69
The CMP principles are designed to prevent “captive” shippers from paying more than is necessary for
the carrier involved to earn adequate revenues, from paying for inefficient service, and from bearing the
cost of facilities or services from which it derives no benefit. The CMP principles recognized the
importance of “Ramsey pricing” in the context of
economies of scale and high fixed and common
costs by allowing railroads to price above marginal
cost. (Ramsey pricing is discussed in more detail in
Chapter 3 below.) The CMP principles represent an
operational solution to implement differential pricing
based on Ramsey pricing principles. To implement
these rules, the CMP principles are composed of
three main components acting as constraints on the
ability of market-dominant carriers to exercise their
pricing power.70
The first is the revenue adequacy constraint. This constraint states that “…captive shippers should not
be required to continue to pay differentially higher rates than other shippers when some or all of that
differential is no longer necessary to ensure a financially sound carrier capable of meeting its current and
future service needs.”71
The revenue adequacy constraint reflects the requirement that, in determining
whether a rate is reasonable, the ICC (later the STB), must recognize the Congressional policy that the
rate must be high enough to allow the railroad to earn revenue sufficient to cover costs, make normal
profit and attract capital. Indeed, the Interstate Commerce Act, as amended by the ICC Termination Act
(ICCTA, see below), continues to require that railroad revenues should:
(A) provide a flow of net income plus depreciation adequate to support prudent capital outlays,
assure the repayment of a reasonable level of debt, permit the raising of needed equity capital,
and cover the effects of inflation; and
(B) attract and retain capital in amounts adequate to provide a sound transportation system in the
United States.72
In other words, the revenue adequacy constraint is intended to ensure that railroads earn enough
revenue to make normal profits -- but not more.
69 Major Issues, slip op. at 6-7, citing Coal Rate Guidelines, 1 I.C.C. 2d at 523-24.
70 Coal Rate Guidelines, 1 I.C.C.2d at 534. There is also a fourth “phasing constraint,” which is to mitigate the impact of the imposition of large rate increases, even when justified. The concern is that such large changes “could cause significant economic dislocations which must be mitigated for the greater public good.” Ibid., 546-47. 71 Ibid., 535-36. 72 49 U.S.C. § 10704(a)(2).
The CMP principles represent an
operational solution to implement
differential pricing based on Ramsey
pricing principles.

Project FY14 – STB - 157
Railroad rate regulation 15
The second constraint is the management efficiency constraint, which prevents the shippers from
paying avoidable costs that result from the inefficiency of the railroad. Inefficiencies could be the
consequence of multiple factors such as operating inefficiencies (management errors), plant inefficiency
(nonproductive assets), and pricing inefficiencies.73
The third component is the stand-alone cost (SAC)
constraint, which is designed to protect captive
shippers from the undue exercise of market power,
from bearing the cost of inefficiencies arising from a
poorly designed railroad, or from cross subsidizing
other services. 74
In general, this constraint is intended
to ensure that the revenue that a railroad earns from a
service or a group of services does not exceed the
total cost that a hypothetical efficient new railroad
would incur in providing the same service or group of
services. In short, the SAC constraint simulates the
competitive rate that would exist in a contestable
market by assuming competitive entry by a new highly
efficient competitor railroad.
The Stand-Alone Cost test has been the predominant method used by shippers in rate reasonableness
complaints. A few cases have been brought based on the Revenue Adequacy Constraint.75
No cases
have relied on the Management Efficiency constraint.
2.5 The Stand-Alone Cost Test
To prove that a challenged rate is unreasonable under the STB’s SAC test, the shipper must demonstrate
that the rate that a new competitor –the Stand-Alone Railroad (SARR)—would charge to serve the
complaining shipper’s traffic while fully covering its costs, including a reasonable return on investment, is
lower than the challenged rate. To build this evidence, the shipper must design the hypothetical SARR,
develop a credible operating plan and compute the SARR’s costs, which generally require the use of
complex computer models. The SAC test is based on a comparison between the rate obtained by
simulating the financial requirements of this hypothetical efficient stand-alone railroad and the rate
proposed by the railroad for this traffic in order to judge its reasonableness.
To serve the traffic at issue, the design of the hypothetical SARR and the operating plan need to take into
account all geographical and technical constraints. Road property investments are estimated to ensure
73 Coal Rate Guidelines, 1 I.C.C.2d at 537-42. 74 Ibid., 542-48. In Major Issues, slip op. at 7, the STB states that contestable markets “have competitive characteristics which preclude monopoly pricing.” 75 The few revenue adequacy-based complaints have either settled or involved other transportation modes. See S. Miss. Elec. Power Ass'n v. Norfolk S. Ry., NOR 42128 (STB served Aug. 31, 2011) (proceeding in which revenue adequacy constraint raised in complaint was subsequently settled); CF Indus., Inc. v. Koch Pipeline Co., 4 STB 637 (2000) (finding rate increases for pipeline transportation unreasonable under 49 U.S.C. § 15501 using revenue adequacy constraint), aff'd sub nom. CF Indus., Inc. v. STB, 255 F. 3d 816 (D.C. Cir. 2001).
CMP principles are composed of three
main components acting as constraints
on carriers:
Revenue adequacy constraint
Management efficiency constraint
Stand-alone cost constraint

Project FY14 – STB - 157
Railroad rate regulation 16
that the efficient SARR will be financially viable in the long term. Operational costs such as labor,
material, resources, and administrative costs are also computed. Present values of the future financial
flows are estimated using a Discounted Cash Flow model based on a 20-year period (reduced later to 10
years).
2.6 ICC Termination Act of 1995
By 1995, the substantial deregulation of the rail industry was largely complete. In a further effort to limit
federal economic regulation of surface transportation, Congress passed the ICC Termination Act of 1995
(ICCTA), which abolished the ICC, but transferred
most of the ICC’s railroad regulatory responsibilities
to the newly created Surface Transportation Board
(STB). The ICCTA made some notable changes to
railroad regulation. For instance, the new law
eliminated the requirement for railroad tariff and
contract filings. It did not, however, remove railroads’
common carrier obligations or alter the railroads’
ability to carry out demand-based differential pricing
or to negotiate service contracts containing
confidential terms and conditions.76
2.7 The STB’s Rate Case Simplification Efforts
The CMP principles are embedded in a complex methodology. By 1995, it had become widely
recognized and accepted that the process for seeking regulatory relief from rates perceived to be
unreasonable was exceptionally difficult and expensive, and prevented smaller shippers from seeking
relief. Therefore, in ICCTA, the Congress directed the Board to develop a simplified rate review process
for smaller complaints where the amount at issue was too low for the shipper to seek rate relief in light of
the cost of a SAC case.77
The STB subsequently developed and adopted its first set of simplified procedures (generally known as
Simplified Guidelines) in Rate Guidelines -- Non-Coal Proceedings in 1996.78
Rate Guidelines – Non-Coal Proceedings (1996) – Simplified Guidelines
The Simplified Guidelines were intended to decrease the cost of the litigation while still relying on the
CMP principles. The challenge for STB was to balance the need for sound economic criteria with the
necessity to simplify the calculation process to reduce the cost of the procedure. The approach adopted
was known as the Three-Benchmark procedure. The proposed procedure was based on a comparison
76 U.S. General Accounting Office, “Railroad Regulation: Changes in Railroad Rates and Service Quality since 1990,” GAO/RCED-99-93 (Washington, DC, 1999), 22-24, http://www.gao.gov/products/GAO/RCED-99-93. 77 Technically, the Congress directed the STB to complete a rulemaking that the ICC had started to establish a simplified method for deciding rate reasonableness in cases where a full stand-alone cost presentation would be too costly given the value of the case. 49 U.S.C. § 10701(d)(3). 78 STB Docket No. Ex Parte 347 (Sub No. 2), 1 STB 1004 (STB served Dec. 31, 1996) (“Rate Guidelines - Non-Coal”) (“Simplified Guidelines”).
The ICCTA did not alter the railroads’
ability to carry out demand based
differential pricing.

Project FY14 – STB - 157
Railroad rate regulation 17
between the revenue/variable cost ratio (R/VC) of the traffic at issue and a combination of three
benchmark ratios.
The first benchmark is the Revenue Shortfall Allocation Method (RSAM). The RSAM measures
“the uniform markup above variable cost that would be needed from every shipper of potentially
captive traffic (the >180 traffic group) in order for the carrier to recover all of its URCS fixed
costs.”79
The second benchmark is the revenue to variable cost ratio for comparable traffic, (R/VC COMP),
based on movements sharing the same characteristics with the traffic at issue. This measure is
intended to “provide a means of reflecting demand-based differential pricing principles.80
While
the STB noted this test is “admittedly crude” it concluded that this “was the only simple means
available to obtain even a rough measure of this very important pricing factor.81
Some might call
this the “markup (or mark down) rates paid by comparable traffic” method.
Finally, the third benchmark is the revenue to variable costs over 180 percent ratio (R/VC >180). It
measures the average markup over variable cost earned on potentially captive shippers by the
defendant railroad. This benchmark “measures the degree of differential pricing actually being
practiced by that carrier.82
STB computes the RSAM and the R/VC >180 every year. Some might
call this the “What is the actual current average markup being paid by all potentially captive
shippers” method.
Simplified Standards (2007)
A decade after their publication, only three shippers had initiated a proceeding using the Simplified
Guidelines. All three settled before an STB decision on the merits.83
The Congress was cognizant of the challenges that shippers faced in challenging rail rates. In response
to congressional concern about the potential barriers that shippers face in seeking relief from allegedly
unreasonable rail rates, the GAO examined issues related to the Board’s oversight of rates shippers pay.
In 1999, the GAO reported that very few shippers served by class I railroads had complained to the Board
about the railroads’ rates. Shipper associations noted that the complexity of the rate complaint process
may have reduced the number of complaints. GAO surveyed a large number of shippers about the rate
review process. Of those who expressed an opinion about the rate complaint process, over 70 percent
79 Simplified Guidelines, slip op. at 19, 1 S.T.B. at 1027. 80
Ibid., slip op. at 25, 1 S.T.B. at 1034. 81 Ibid. 82 Ibid., slip op. at 28, 1 .S.T.B. at 1038. 83 In addition, there have been four cases where the railroad did not wish to undergo a full SAC proceeding, and agreed to a “Stipulated R/VC” process. In these cases, the parties agreed to use the R/VC ratio at the 180% level in lieu of SAC.

Project FY14 – STB - 157
Railroad rate regulation 18
believe that the time, complexity, and costs of filing complaints are barriers that often preclude them from
seeking rate relief.84
In reaction to the unexpectedly low level of usage, the Board held public hearings to learn about the
concerns of stakeholders and to understand why shippers so seldom used the simplified procedure.
Concluding that “the shipper community perceives [the Simplified Guidelines] as too vague, and as
requiring prolonged litigation over whether a shipper
even qualifies to use them,”85
the Board adopted new
Simplified Standards in September 2007,86
which
revised the existing Three-Benchmark procedure and
created a new simplified procedure called the
Simplified Stand-Alone Cost (Simplified-SAC). This
new approach was intended to provide simpler and
faster procedures for shippers seeking what was
considered a “medium” level of relief (originally
proposed to be between $1 million (for the Three-
Benchmark Method) and $5 million (for Simplified SAC) or less over five years).The Board concluded that
rate relief under the simplified approaches needed to be capped because they were less precise and
robust than a full SAC case. Simplified Standards gave complaining shippers the option of proceeding
under the Three-Benchmark method, Simplified-SAC, or full SAC, but the decision had to be made at the
outset when filing the complaint.
The Simplified-SAC procedure was designed to mimic the previously-adopted “Full-SAC” process while
being less onerous. The main difference was that under the simplified approach, shippers were not
required to “build” an entire hypothetical railroad. They were expected to use the existing infrastructure
that serves the traffic at issue to estimate the cost of an efficient railroad. After the wave of mergers and
the track abandonments that occurred in the industry since the Staggers Act, the rail network was
considered to be close to what can be seen as an efficient and rationalized network by 2007.
In its Simplified Standards decision, the Board also introduced major changes to the Three-Benchmark
test, including changes in the comparable group determination, the RSAM and R/VC>180 calculations, and
the rate relief cap. These changes are discussed in greater detail in Section 4.
Since 2007, shippers have filed two Simplified-SAC cases (in both cases the parties reached a
settlement) and five Three-Benchmark cases, only one of which was actually determined by the STB.87
The four remaining Three-Benchmark cases were settled by the parties prior to a Board decision on the
84 U.S. General Accounting Office, Railroad Regulation: Current Issues Associated with the Rate Relief Process, GAO/RCED-99-46 (Washington, DC, 1999), http://www.gao.gov/products/GAO/RCED-99-46. The General Accounting Office was renamed the Government Accountability Office in 2004. 85 Simplified Standards for Rail Rate Cases, Docket No. Ex Parte 646 (Sub No. 1), slip op. at 4 (STB served Sept. 5, 2007) (“Simplified Standards”). 86 Ibid. 87 STB, Docket No. 42114: U.S. Magnesium v. Union Pacific. The decision, issued on January 28, 2010, found the rates to be unreasonable.
The Simplified-SAC procedure was
designed to mimic the previously-
adopted “Full-SAC” process while being
less onerous.

Project FY14 – STB - 157
Railroad rate regulation 19
merits.88
The procedure has been criticized for the approximation it made to the CMP principles and its
presumed lack of adherence to these principles.89
However, in view of the response to Simplified
Standards from shippers who were supposed to benefit from rate case simplification, shippers had
success in convincing the STB that the relief caps were too low to make the Simplified Standards a viable
alternative to Full SAC.
Removal of the Rate Relief Limit for Simplified SAC in 2013
In Rate Regulation Reforms, Ex Parte 715, (served July 18, 2013), the STB removed the limit on relief
available through the Simplified-SAC method and increased the relief available under the Three-
Benchmark method to $4 million based on the Board’s conclusion that the cost of litigating a Simplified
SAC case would be in the $4 million range.
The removal of the limit on relief was meant to increase the use of the Simplified-SAC method over Full-
SAC analysis to reduce the cost of large rate reasonableness proceedings.90
With removal of the limit
however, the STB decided to increase the precision of the Simplified-SAC analysis by modifying the Road
Property Investment (RPI) portion of the analysis. Previously, the RPI analysis for Simplified-SAC cases
(used to compute the fixed costs of the railroad) was analyzed using the results of past Full-SAC cases.
The Simplified-SAC method now requires a full RPI analysis to be completed, estimating the fixed cost of
the SARR.
Complexity of the Full-SAC Procedure
Despite their lower costs and reduced complexity, the simplified procedures have not been heavily used
since their introduction. As noted, only five Simplified-SAC procedures have been initiated, and all of
them were settled by the railroad and shipper. Five Three-Benchmark procedures were also initiated, four
of which were settled and one was decided by the STB (a finding of unreasonable rates). In contrast, the
STB noted in its Rate Regulation Reforms decision that shippers have mainly used the Full-SAC test and
that Full-SAC presentations are becoming more and more complex. The STB observed that some of the
early SAC submissions were relatively short but had later grown to hundreds or thousands of pages in
length.91
88 STB Freight Rail Rate Cases: http://www.stb.dot.gov/stb/industry/Rate_Cases.htm 89 See for example, Burton, Mark, The Economics of Evolving Rail Rate Oversight: Balancing Theory, Practice, and Objectives, 81 J. of Transp. Law, Logistics & Policy 267-293 (2014). 90
The STB reasoned that both the Full- and Simplified- SAC methods are designed to prevent railroads from abusing market power. The simplified method, however, does not provide the same level of precision as the full method. Nevertheless, it is still able to detect abuse of market power, and the STB determined that it did not need to limit the level of rate relief. 91 For example, the Opening Statement of Otter Tail in the STB Docket No. 42071, Otter Tail v. BNSF, is more than 2,000 pages in length.

Project FY14 – STB - 157
Railroad rate regulation 20
In 2012, agricultural shippers claimed that the Full-SAC approach was not appropriate for their industry.
Since they use many origin-destination pairs, the Full-
SAC procedure can became very complicated with
multiple interchange points and service configurations
leading to a very high litigation cost. They also claimed
that even the Simplified-SAC and the Three-Benchmark
procedures were too complex and too costly relative to
the expected benefits.
In the case of the Full-SAC procedure, the STB noted
that the complexity of the cases often arises from
shippers designing very complex railroads with
extensive networks to maximize the contribution of
“cross-over traffic”92
which moves on an actual railroad to the revenues of the hypothetical railroad. By
seeking to maximize the contribution of the cross-over traffic, shippers are trying to take advantage of the
revenue effect of the economies of scope to effectively lower the average variable cost of the traffic at
issue. However, it is not clear whether shippers are effectively taking advantage of all the economies of
scope the network can produce. The following chapter examines the issue of the economies of scope in
the Full-SAC test.
92 “Cross-over traffic” refers to movements included in the traffic group that would be routed over the Stand-Alone Railroad for only part of its through movement. The use of cross-over traffic allows the complaining shipper sponsoring the SARR to avoid the need to replicate all of the incumbent railroad’s services. Rather, the assumption is that the SARR would interchange traffic with the residual portion of the incumbent railroad’s system. Major Issues, slip op. at 24.
The STB noted that the complexity of the
cases often arises from shippers
designing very complex railroads with
extensive networks to maximize the
contribution of “cross-over traffic.
Project FY14 – STB - 157
Railroad rate regulation 21
3 Economies of Scope and Ramsey Pricing
Among the core economic principles underlying the STB’s Constrained Market Pricing policy are
recognizing the benefits from economies of scope; and
the use of Ramsey pricing principles for achieving railroad revenue adequacy as well as the
greatest economic efficiency or national welfare from railroad assets and services conditional on
carriers being revenue adequate. 93
Economies of scope arise in the railroad industry
because of the presence of joint and common
costs. Joint and common costs in the railroad
industry generally appear when the railroads use
the same tracks and other infrastructure to serve
different shipments by various shippers of a range
of commodities such as coal, agricultural products,
chemicals, fertilizers and forest products, among
others.94
These common costs are not directly
attributable to individual shipments, or even
particular commodities. Because of the presence of
joint and common costs, marginal cost pricing
methods do not allow railroads to recover all their
costs from the shippers. Thus, the multi-product
characteristic of the railroad leads to complex
pricing issues: railroads, to be revenue adequate,
need to cover joint and common costs that are not
allocable to any specific traffic movement.
Economists have long debated the issue of sharing the portion of costs that are not allocable in a manner
that is the least arbitrary. The consensus among economists is that fully distributed costs should not be
used due to their arbitrariness and the misallocation of resources they can produce.95
The ICC in Coal
Rate Guidelines concluded that “a meaningful maximum rate policy could not be founded on a strictly
cost-based approach. Because competition compels the railroads to provide some of their services
below an arbitrarily assigned ‘cost’, they must be able to price other services above their assigned ‘cost’
in order to compensate.”96
By contrast, economists generally favor the concept of “Ramsey pricing” – a pricing principle that allows
firms to set their prices above the marginal cost to cover their common and fixed costs. This is achieved
93 See generally, Coal Rate Guidelines, 1 I.C.C.2d at 525-28. 94
Bereskin, C. Gregory, Railroad Economies of Scale, Scope, and Density Revisited, 48 J. of the Transp. Research Forum 23‐38 (2009): http://ageconsearch.umn.edu/bitstream/207130/2/2261-4266-1-PB.pdf 95
Baumol, “Minimum and maximum pricing,” 235-248. 96 Coal Rate Guidelines, 1 I.C.C.2d at 523.
Among the core economic principles
underlying the STB’s Constrained Market
Pricing policy are
recognizing the benefits of economies of
scope; and
using Ramsey pricing principles for
achieving railroad revenue adequacy as
well as the greatest economic efficiency
or national welfare from railroad assets
and services conditional on carriers being
revenue adequate.

Project FY14 – STB - 157
Railroad rate regulation 22
by having the markup for each shipper as a percentage that is proportional with the inverse elasticity of
demand for the traffic to be carried. In plain language, this means that some shippers will pay rates with
only modest markups above variable cost because their price sensitivity is so high that rates that are any
higher will drive them off the rail system; while other, less price sensitive shippers will need to pay higher
rates to ensure the viability of individual rail lines.
This is not merely an academic point. Historically many rail carriers were driven to bankruptcy and/or
liquidation by regulatory pricing policies that violated these fundamental principles of railroad economics.
Much of their track was ultimately abandoned as being uneconomic, to the detriment of shippers on those
lines.
In practice, regulators cannot directly apply Ramsey pricing to railroad rates because it is cumbersome to
compute inverse demand elasticities. As well, strict application of Ramsey pricing rules requires solving
the optimal rates for all shippers on the line in order to establish the rate for one shipper. The regulatory
alternative is to allow a form of differential pricing under which “railroads are left free to set prices over a
fairly wide range, albeit with specified end points on the range. Rail firms use this freedom to extract
larger contributions towards fixed costs from some customers than from others, according to conditions in
different markets.”97
The floor price is theoretically established as marginal cost. The well-known criterion
to define the ceiling lies in the concept of the stand-alone cost test.98
The stand-alone cost test is used as
a proxy for Ramsey prices that ensures rates do not exceed the rate that the market would impose if it
were subject to competition.
The Coal Rate Guidelines established the Constrained Market Pricing (CMP) principles as the regulatory
mechanism to be applied to analyze the reasonableness of rail rates. CMP’s objectives can be
summarized as:
A captive shipper should not be required to pay more than is necessary for the carrier involved to
earn adequate revenues. Nor should it pay more than is necessary for efficient service. And a
captive shipper should not bear the cost of any facilities or services from which it derives no
benefit.99
Under the SAC test, a shipper challenging a rate must design a hypothetical stand-alone railroad (SARR)
to determine whether it is paying for inefficiencies in the railroad’s investment or operations or the serving
railroad is unreasonably exploiting its market power by charging more than the SARR would need to
charge to serve the traffic at issue and other traffic that could be profitably served on the new railroad.
The SAC test is based on a comparison between the rate obtained by simulating the financial
requirements of this hypothetical efficient stand-alone railroad that would serve the traffic at issue and the
rate proposed by the railroad for this traffic to judge the rate’s reasonableness.
97 Beshers, Eric, “Efficient Access Pricing For Rail Bottlenecks,” Report Prepared for Volpe National Transportation
Systems Center in Support of Federal Railroad Administration, U.S. Department of Transportation (Washington, DC, 2000), 4, https://www.fra.dot.gov/eLib/details/L03017#p1_z5_gD_kbeshers 98 Baumol, “Minimum and maximum pricing,” 235-248. 99 Major Issues, slip op. at 6-7.
Project FY14 – STB - 157
Railroad rate regulation 23
In Coal Rate Guidelines, the ICC contemplated that a SARR would include all of the network and facilities
required to serve the transportation needs of the selected traffic group. In practice, however, it became
apparent that such a requirement would risk making the Full-SAC test wholly unmanageable due to
“economies of traffic density” and “economies of scope.” Economies of density reflect the decrease in
average total costs as output (i.e., traffic) increases on a particular origin-destination pair. Economies of
scope reflect the decrease in average total costs when the railroad consolidates traffic from different
unique origin-destination pairs on a given rail line. The problem for the design of the Stand-Alone
Railroad is that to generate economies comparable to those enjoyed by the incumbent railroad whose
rates are being challenged, the SARR would have to carry comparable volumes of traffic, all of which
would likely be coming from and going to many different locations. Without some method of simplifying
the inquiry, a complaining shipper would likely have to hypothesize a SARR that replicated virtually the
entirety of the incumbent’s system. The solution to this problem was to allow the SARR to serve some
“cross-over traffic”, which allowed the complaining shipper to include sufficient traffic other than its own in
its traffic group to achieve economies of density comparable to those enjoyed by the incumbent railroad
without having to replicate the entirety of the incumbent’s system.
But the use of cross-over traffic created its own issues in rate cases. Over the years, it appears that SAC
cases are becoming increasingly complex with shippers creating hypothetical railroads with routes
specifically designed to get additional cross-over traffic and to maximize the benefit from economies of
scope, rather than focusing on a more direct or efficient routing for their own for traffic. Allowing the
shipper to include cross over traffic addresses the revenue side of economies of scope, but it does not
necessarily address all the potential average cost reductions arising from economies of scope.
This chapter examines the basics of the costing issue for the railroad industry. In particular, the first
section recalls the theoretical fundamental of pricing in multiproduct firms and the importance of Ramsey
pricing in industries that exhibit economies of scope and scale. Ramsey pricing leads directly to the SAC
test to identify cross-subsidies in the context of a multiproduct firm having economies of scope and
subject to a zero profit constraint.100
The second section examines a recent discussion between Gerald
Faulhaber101
and Robert Willig about the economies of scope issue in the SAC test.102
3.1 Optimal Pricing for Multiproduct Firms: Ramsey Pricing
This section provides a background technical discussion of economies of scope and Ramsey pricing. In
order to be precise, and because there is a debate among some professional economists on this topic, it
is done using the technical parlance and mathematics of economists. Section 3.3 returns the discussion
to how the Stand-Alone Cost test relates to Ramsey pricing.
100 Faulhaber, Gerald R. “Cross-Subsidization: Pricing in Public Enterprises.” The American Economic Review 65, no. 5 (1975): 966-977. 101 Gerald Faulhaber, in addition to publishing papers, has also testified before the STB on behalf of The Concerned Shipper Associations (e.g., Ex Parte No. 722, Railroad Revenue Adequacy, Reply Comments submitted by Concerned Shipper Associations, filed Nov. 4, 2014). The CSA consists of the American Chemistry Council, The Fertilizer Institute, The Chlorine Institute, and The National Industrial Transportation League. 102 Robert Willig, in addition to publishing papers, has also testified before the STB on behalf of the Association of American Railroads (e.g., Ex Parte No. 722, Railroad Revenue Adequacy, Reply Comments of The Association of American Railroads, filed Nov. 4, 2014).

Project FY14 – STB - 157
Railroad rate regulation 24
Multi-product Firms and Economies of Scope
Multi-product firms are those firms that use the same production factors (labor, capital, fuel, and
materials) to produce different products or services. The railroads are multi-products firms as they use
any particular piece of track to serve shippers having different traffic characteristics such as length of
haul, weight, volume, competitive environment or commodity mixes. As shippers share the same track
and other operating facilities and resources, the presence of joint and common costs can give rise to
economies of scope. Economies of scope are those economies that arise in multiproduct firms when
there is also the possibility that cost savings may result from simultaneous production of several
different outputs in a single enterprise, as contrasted with their production in isolation, each by its
own specialized firm.103
Baumol, Panzar and Willig note that economies of scope are a restricted form of subadditivity.104
(Subadditivity is a more general concept of cost functions that means that it is less costly to produce a
quantity of a good in one firm than to divide the production in several firms.) They mathematically defined
subadditivity as follow: 105
106
a cost function is strictly subadditive at y if for any and all quantities of output y1, …,y
k, y
j ≠ y, j =
1,…,k, such that ∑ 𝑦𝑗 = 𝑦𝑘𝑗=1 we have
𝐶(𝑦) < ∑ 𝐶(𝑦𝑗)
𝑘
𝑗=1
The concept of economies of scope is more specific as it refers to different products instead of quantities.
Baumol, Panzar and Willig modify this definition of subadditivity and provide a formal mathematical
definition where there are economies of scope at ys if:
∑ 𝐶(𝑦𝑇𝑖)
𝑘
𝑖=1
> 𝐶(𝑦𝑠)
103 Baumol, William J., John C. Panzar and Robert D. Willig, Contestable Markets and the Theory of Industry
Structure (New York: Harcourt Brace Jovanovich, Inc., 1982), 71. 104 Ibid. 105 Ibid., 17. 106 Difficult concepts in economics, especially those with subtleties, are often expressed mathematically to be clear and precise. As an example, a term such as ‘cross subsidy’ may seem to be straightforward, but in practice it can mean different things to different people and in different contexts. The economics profession thus has tended to use mathematics to be more clear and precise as to exactly which concept is being discussed and analyzed. This has been of great benefit to the profession, although at the expense of broader participation in the dialogue. Reluctantly, this study has a few passages where we use mathematics because the subtle concepts have been and continue to be debated in mathematics by some leading researchers. This study wishes to be clear in the context of these debates. An attempt is made to also state the key propositions in plain English – well in plainer English than the mathematics.
Project FY14 – STB - 157
Railroad rate regulation 25
With ⋃ 𝑇𝑖𝑖 = 𝑆, 𝑇𝑖 ∩ 𝑇𝑗 = ∅ 𝑓𝑜𝑟 𝑖 ≠ 𝑗, 𝑇𝑗 ≠ ∅, and 𝑘 > 1. 107
This means that the total cost of producing each product in isolation is greater than the cost of producing
them jointly. Economies of scope refer to a multiproduct firm cost advantage: the firm benefits from the
cost reducing effect of using common production factors or inputs.
In the U.S. railroad industry, some costs are shared and generally not specific to any particular traffic.
Such costs are incurred to service all traffic and are not assignable to any specific movement. For
example, costs related to depreciation, maintenance and repair or snow clearance of a railroad may be
incurred for the benefit of all traffic moving over a line and are shared in common. Some shared costs are
fixed and do not vary with traffic levels.
In such a situation, if each product is priced at marginal cost, then the railroad would be unable to cover
the common cost. As a result, pricing at marginal costs prevents the railroads from achieving normal
economic profits and attracting the proper level of investment to sustain an efficient service in the long
run.
Ramsey Pricing
Marginal cost pricing is the process of setting the price at the same level as the marginal cost. Such a
practice is generally called the “first best” pricing because it is the price that maximizes the total national
economic welfare from resources used to provide services. Economists will refer to this as maximizing
surplus (consumer and producer) in the economy. Unfortunately, in industries with economies of scale (or
traffic density or scope) or with common/joint costs, pricing at marginal cost will leave the fixed or
common/joint costs uncovered, resulting in a loss. Such an industry can only achieve “first best” economic
welfare in the long run if it is subsidized.
In situations where the first best pricing cannot be considered (e.g., a firm with large economies of scale
or scope, high fixed or common costs which is not subsidized), economists have defined what are
considered the “second best” prices.108
Second best prices are those prices that maximize the total
surplus subject to a constraint on profit (or in the case of railroads, subject to a revenue adequacy
constraint). This means that second best pricing are those prices that allow a firm to cover its fixed and
common costs with the minimum deviation from the marginal cost (minimum deadweight loss) and no
subsidies. Such prices are called Ramsey prices.
Figure 3-1 diagrammatically illustrates one aspect of the Ramsey pricing concept. The Ramsey prices
are obtained by adding a markup to the marginal costs. If prices are set to marginal cost, the price would
be Ps. However average total costs would be AC(Qs), which exceeds price; thus the rail carrier would
experience a loss. To be financially viable, the firm would need to set price so that total revenues cover
total costs. If there is only one shipper on the line, then the “second best” price is P2. The second best
price is the closest to the first best option (PS) that also respects the revenue adequacy constraint. Indeed
if the price was set below the average cost (AC(QS)), it would violate the breakeven constraint and would
not permit the railroad to recover its total costs.
107 Baumol, Panzar and Willig, Contestable Markets, 71-72. 108 We apologize for this terminology but use it because it is a term of art in the economics profession.

Project FY14 – STB - 157
Railroad rate regulation 26
Figure 3-1: Ramsey Pricing
Source: Replicated from Church, Jeffery and Roger Ware, Industrial Organization, a Strategic Approach (New York:
McGraw-Hill, 2000), 787.
Ramsey prices cover the case when there are two or more shippers, and they have different price
elasticities (different abilities to pay rail rates).109
A diagrammatical illustration for two shippers is possible
but complex. The essence is that one shipper will pay a price above P2, and the other will pay a price
below P2 but above Ps. The total use of railway services will be higher (i.e., higher than QRamsey), one of
the major benefits of Ramsey pricing. It enables affordable service to more traffic than would be the case
with a uniform markup at P2.
The Ramsey prices are quite simple in theory but are very complicated to determine in practice in
multiproduct firms. To illustrate the principle, assume that a multiproduct firm exists with products having
109 Diagrammatically shippers with different elasticities might be shown with different demand curves, each with a different slope. For those interested, the Church and Ware book presents such a more complex diagram.

Project FY14 – STB - 157
Railroad rate regulation 27
independent demands.110
In this case, the Ramsey number (i.e., the Ramsey pricing percent markup for a
particular shipment)111
is a function of the deviation of price from the marginal cost and of the price
elasticity of the product. This is as described mathematically below:
(𝑝𝑖 − 𝑚𝑐𝑖
𝑝𝑖
) = 𝜆1
|𝜀𝑖|
𝑤𝑖𝑡ℎ 𝑝𝑖 = 𝑝𝑟𝑖𝑐𝑒 𝑜𝑓 𝑝𝑟𝑜𝑑𝑢𝑐𝑡 𝑖, 𝑚𝑐𝑖 = 𝑚𝑎𝑟𝑔𝑖𝑛𝑎𝑙 𝑐𝑜𝑠𝑡 𝑜𝑓 𝑝𝑟𝑜𝑑𝑢𝑐𝑡 𝑖,
𝜀𝑖 = 𝑃𝑟𝑖𝑐𝑒 𝐸𝑙𝑎𝑠𝑡𝑖𝑐𝑖𝑡𝑦 𝑜𝑓 𝑏𝑢𝑦𝑒𝑟 𝑖 𝑎𝑛𝑑 𝜆 = 𝑡ℎ𝑒 𝑅𝑎𝑚𝑠𝑒𝑦 𝑛𝑢𝑚𝑏𝑒𝑟
If price equals marginal cost, the Ramsey number is zero. In this case, the price is the first best price,
although the carrier may end up bankrupt. When prices need to deviate from the marginal cost to cover
the fixed and common costs, the Ramsey number is not zero, it is a positive number. Ramsey pricing is
also called the inverse elasticity rule because the more price inelastic the demand for a product is, the
higher the mark-up above marginal cost will be.112
This means that those products that have no viable
transportation substitute for their movement will bear a higher share of the common and fixed costs than
buyers with many viable transportation options who could leave the network and use another mode of
transport.
In the U.S. freight railroad industry, Ramsey prices ensure that unattributable fixed and common costs are
distributed among the services on the basis of the value of those services to shippers, as calculated by
the inverse elasticity of demand.113
The demand for a service will be relatively inelastic for a shipper
placing high value on this service. That means that a shipper having a relatively high value for a service
would have higher markups. Shippers with relatively high price elasticity of demand, and thus a more
limited ability to absorb price increases, will have lower markups so as to avoid a transfer of the market to
other transportation modes.
While this is intuitively appealing as it minimizes distortions to the industry, economists almost universally
agree that determining Ramsey prices in practice is difficult, particularly in the railroad industry. This is
because Ramsey pricing requires solving for all of the prices the railroad charges or all the prices it
charges on a particular line. It also requires the railroad to have information or knowledge about
customers’ price elasticity of demand, as well as the marginal costs, of all the products at issue. Such
information is generally not disclosed by shippers. It would have to be estimated based on statistical
analysis of different sources of information or via inferences from behavior of shippers in response to
price changes.114
110 Ramsey pricing can be developed for cases where demand are dependent, but the mathematics and empirical methods are more complex. An example of dependent demands might be shipments of grain and shipments of fertilizer. 111 This is represented by the left hand side of the equation: Markup over price is percent markup. 112
Church, Jeffery and Roger Ware, Industrial Organization, a Strategic Approach (New York: McGraw-Hill, 2000), 790. 113 Baumol, William J. and Robert D. Willig, “Pricing Issues in the Deregulation of Railroad Rates,” In Economic Analysis of Regulated Markets, ed. Jörg Finsinger, 11-47 (London: McMillan,1983), 12. 114 Baumol and Willig suggested that it would be sufficient to compute the price elasticity of demand as well as the marginal cost for an entire category (or commodity) and to use this average elasticity of demand and average
Project FY14 – STB - 157
Railroad rate regulation 28
For these reasons, the STB cannot directly apply Ramsey pricing. The ICC explained in Coal Rate
Guidelines that it was not practical to directly use Ramsey pricing as a regulatory method because “the
amount of data and degree of analysis required seemed overwhelming.”115
Instead, as an approximation
of Ramsey Pricing, the ICC decided to allow railroads to engage in differential pricing within a range
created by the CMP principles:116
Rates that cover variable costs and make a small contribution to
common and fixed costs represent the floor. The ceiling is represented by rates that a hypothetical
efficient stand-alone railroad would charge to provide the service on its own (the stand-alone cost).
Theoretically, prices that ensure the railroad is revenue adequate and cover all its costs lie within this
band.117
The Stand-Alone Cost Test and Ramsey Pricing
Faulhaber. The STB’s SAC test is intrinsically linked to the concept of economies of scope. The concept
eventually utilized by the STB in setting up CMP was first described by Gerald Faulhaber in 1975.118
The
original concern was to define a criterion to identify whether a group of consumers of a public multi-
product firm was being cross-subsidized by another group of consumers. The main objective of the cross
subsidy analysis was to ensure that each consumer is paying no more for a service than the consumer
would pay otherwise (i.e., in the absence of cross-subsidization).
Faulhaber analyzed the issue of cross-subsidization using an “n-person cooperative game”. The
necessary conditions for his demonstration are that the firm is a natural monopoly, benefits from
economies of joint production (i.e., economies of scope), and is subject to a zero profit constraint and no
cross-elasticity.
He showed that under these specific conditions, the price of providing a set of services to a group of
customers is lower than the cost of providing each service individually. (Another way of saying this is that
if there are economies of scope, a customer is better off with other customers on the network, even if they
end up paying somewhat less per unit.) He defined the stand-alone cost of a service or of a group of
services as the minimum amount per unit it would cost to provide the service or group of services if it
marginal cost as an informative indicator for each service and movement if the movements in the category are homogeneous. Ibid., 40. 115
Coal Rate Guidelines, 1 I.C.C.2d at 527. The authors of the current study are of the view that today, in the era of ‘big data’ and big processing power, computing reasonable Ramsey price estimates may be possible, although challenging. When the Staggers Act was passed, the IBM PC had not been invented. At the time the CMP was established, the internet as we know it today did not yet exist, and thus “big data” was nonexistent. However, there will still be an issue as to whether the courts would uphold a decision based on a Ramsey Pricing calculation. It is a method that implies solving for all the rates charged by a railroad, and this would raise issues as to whether the data on other shipments meets the tests of verifiability and transparency. 116 As the ICC explained: “Under CMP, the carriers are expected to use the market demand which they observed as the basis for their pricing, but they need not calculate the precise elasticity of demand for every movement. . . . . We are satisfied that the constraints and incentives CMP contains should lead to rates approximating Ramsey prices and protect captive coal shippers from possible carrier abuse of pricing discretion.” Ibid., 527-28. 117 But revenue inadequacy is not a defense to a complaint that a railroad is charging a shipper more than a properly designed SARR would charge for the same service. 118 Faulhaber, Gerald R. “Cross-Subsidization: Pricing in Public Enterprises.” The American Economic Review 65, no. 5 (1975): 966-977.

Project FY14 – STB - 157
Railroad rate regulation 29
were offered by a single-product supplier. If the stand-alone cost is lower than the cost under joint
production, then individual companies have an incentive to provide the service on their own (or find
someone else to provide it). The stand-alone cost is then the upper limit above which each individual
company has an incentive to provide the service itself.
Faulhaber showed that under joint production, each company benefits from the cost reducing effect of
economies of scope. If one individual company decides to provide the service by itself, it would lose the
cost reducing effect from economies of scope. Faulhaber also noted that for any service that is priced at
the stand-alone cost, that service, like a company providing the service itself, would not benefit from
economies of scope or scale.119
Baumol and Willig. In 1983, Baumol and Willig further articulated these concepts in the context of the
U.S. rail industry.120
Their work aimed to provide sound economic principles behind rate regulation in the
case of unsubsidized railroads. The authors demonstrated that there are economic principles that
promote economic efficiency and ensure rail carriers can earn adequate revenues when traffic is
experiencing economies of density.
These principles led the authors to embrace Ramsey pricing. They concluded that Ramsey prices were
best suited for regulating the U.S. rail industry, because such prices would allow railroads to recover their
fixed costs while maximizing total economic surplus in an industry subject to revenue adequacy
constraint.
But because Ramsey pricing was not possible in practice, the ICC adopted CMP to approximate the
Ramsey pricing rates.121
In particular, CMP introduced the SAC test in the U.S. railroad industry based on
the underlying theory of contestable markets. As the ICC explained, CMP
establishes constraints on the pricing freedom of the railroads which induce them to price all
traffic efficiently. As with Ramsey pricing, services are priced according to market demand and to
cover only the total costs of an efficient carrier. CMP will have defined the total amount of
unattributable costs to which the shipper must contribute and focused on the traffic which can
reasonably be expected to pay those costs. At that point, market forces will largely determine the
share of the costs to be borne by each shipper. The result of the process is a rate structure
which reflects long-run marginal costs, demand elasticity and differential pricing of unattributable
costs-the same result that occurs under Ramsey pricing.122
The theory was extensively addressed (mathematically) by Baumol, Panzar and Willig in their 1982 book
Contestable Markets and the Theory of Industry Structure. There, the authors showed that even in a
119 Faulhaber, Gerald R., “Verified Statement – Stand-Alone Cost – Response to Comments,” Ex Parte No. 722 (Sub-No. 2) Railroad Revenue Adequacy and Ex Parte No. 664 (Sub-No. 2), Petition of the Western Coal Traffic League to Institute a Rulemaking Proceeding to Abolish the Use of the Multi-Stage Discounted Cash Flow Model in Determining the Railroad Industry’s Cost of Equity Capital, Reply Comments submitted by Concerned Shipper Associations, Exhibit A, (Nov. 4, 2014): 8. 120
Baumol and Willig, “Pricing Issues,” 11-45. 121 Coal Rate Guidelines, 1 I.C.C.2d at 527-34. 122 Ibid., 534.
Project FY14 – STB - 157
Railroad rate regulation 30
monopolistic situation, the multi-product incumbent under certain conditions will be constrained in its
pricing by the threat of competitive entry. A contestable market is one where
potential entrants can, without restriction, serve the same market demands and use the same
productive techniques as those available to the incumbent firms … and evaluate the profitability
of entry at the incumbent firm’s pre-entry
prices.123
In practice. The U.S. railroad industry is far from
being a contestable market in practice. A potential
entrant would have to invest significantly in
infrastructure to compete with the incumbents. These
considerable sunk costs prevent any potential
competitor from easily entering the market.
Nevertheless, the regulator can assess rates as if the
market were contestable by asking what costs would
be for an efficient entrant, and what other traffic is
available to create price reducing economies of scope
for the issue traffic.
To be considered as a potential entrant, the
hypothetical SARR must be defined as if the railroad
industry was a contestable market. This situation
requires three conditions.
The first is that competitors can enter the market without bearing a high cost of entry and exit.
The CMP allow shippers to simulate a stand-alone cost by removing all advantages (entry and
exit barriers) of the existing carriers industry: “The costs and other limitations associated with
these entry and exit barriers must be omitted from the SAC in order to approximate the cost
structure of a contestable market”.124
The second, known as the subadditivity condition, is that the incumbent is able to produce at a
lower price than a market with two or more competitors mainly due to economies of scale (i.e.,
economies of traffic density) and economies of scope.
The third and last condition, known as the sustainability condition, is that the prices are such that
the firm earns zero economic profit. In other words, it does not have a loss and only earns a fair
rate of return, rather than an excessive profit that would attract entry into the market.
Economies of Scope in the Stand-Alone Cost Test
The SAC model, as developed under the CMP principles, takes into account the revenue effect from
economies of scope by incorporating all possible cross-over traffic for the SARR. However, it is unclear
whether the Full-SAC test accounts for the cost reducing effect of the economies of scope. Figure 3-2
123 Baumol, Panzar and Willig, Contestable Markets, 5. 124 Coal Rate Guidelines, 1 I.C.C. 2d at 529.
The U.S. railroad industry is far from
being a contestable market in practice.
Nevertheless, the regulator can assess
rates as if the market were contestable
by asking what costs would be for an
efficient entrant, and
what other traffic is available to create
price-reducing economies of scope for
the issue traffic.

Project FY14 – STB - 157
Railroad rate regulation 31
illustrates the different costs of traffic on the railroad industry and how different SAC determinations might
compare to those rates.
Figure 3-2: Different Measures of Rate Reasonableness
Source: InterVISTAS representation
Note: As described earlier, the statutory test is 180% of variable costs as determined under URCS. URCS is a
measure of intermediate-term variable costs on a system-average basis that includes costs (such as return on road
property investment) that are fixed in the short term. E.I. DuPont De Nemours & Co. v. CSX Transp. Inc., NOR
42099, slip op. at 19 (STB served June 30, 2008).
To begin the discussion of rate reasonableness, we start at the left of the diagram.
Economic efficiency requires that any shipment on a rail line must at least cover its marginal
costs (in the railroad industry, marginal costs are estimated as long run average variable costs –
LRVC). Hence any rate below LRVC is deemed to be economically inefficient, hence
unreasonably low.
As noted, any rate below 180% of URCS Variable Costs is deemed by law to be not the result of
market dominance, hence is assessed as a matter of law as not being unreasonably high.
Any rate above stand-alone cost is deemed by Faulhaber, Baumol & Willig and by CMP to be
unreasonably high. However, there are a number of different concepts of what constitutes stand-alone
cost, so the diagram indicates each.
Stand-alone cost SAC1 is the cost incurred by a shipper if it were to form its own company
providing the transportation service for the traffic at issue but no other traffic would use the line.
This concept -- SAC1 -- is deficient as it does not allow the shipper to reap the benefit of
economies of scope from other traffic that could use the line of the SARR. In the STB’s parlance,

Project FY14 – STB - 157
Railroad rate regulation 32
SAC1 does not offset the costs of the SARR using potential revenue from “cross-over traffic”.
Thus, SAC1 is considered unreasonably high as it does not allow the shippers to benefit from any
economies of scope.
SAC2 is the point where the revenue contributions from the other traffic utilizing the line are taken
into account. SAC2 recognizes the benefits of economies of density/scope by modeling the
SARR with traffic other than the complainant shipper. It takes into account the revenue benefit to
the shipper from adding additional cross-over traffic to the SARR. SAC2 seems to embody the
concept of economies of scope envisioned by Baumol and Willing. Any rate above SAC2 is
unreasonably high.
SAC3 is similar to SAC2 but is also reduced by any marginal-cost-reducing effects from
economies of scope. Indeed, economies of scope should reduce variable costs because there
are certain costs that could be partially allocated to other traffic (bridge traffic). SAC3, like SAC2,
reduces the costs that the shipper must bear by recognizing the revenue contribution from other
(cross over) traffic that can use the line of the SARR. However, economies of scope would not
only produce the revenue benefit from such cross over traffic, it could also reduce the unit cost of
providing service. This does not seem to be explicitly recognized in the Baumol and Willig
discussion of economies of scope in CMP, but Faulhaber does seem to recognize it. The
conclusion of this report is that any rate above SAC3 should also be deemed to be unreasonably
high.
An issue is whether the STB’s current SAC test allows SAC3. It is our view that it does. The computation
of offsetting revenue contribution from cross over traffic is a computational step in the STB’s SAC
methodology. There is no explicit step for the cost reducing effect of economies of scope, but the STB’s
discussion of CMP and SAC invite the shipper to make use of all available benefits of economies of
scope. Thus, the STB’s SAC method is a SAC3 construct.
To complete our discussion, we have introduced two other price levels in the diagram.
The Ramsey price would be the actual Ramsey price if it were computable. The SAC is an approximation
to the un-computable Ramsey price. The diagram shows the Ramsey price as being a bit below SAC3 (to
keep the diagram legible), but it could be somewhat above as well.125
A rate should be judged
unreasonable if it exceeds either the SAC or the Ramsey price. Because the latter cannot be computed,
the SAC test must be used to judge rate reasonableness. Another price level added to the diagram
(labeled “LRVC + average required markup”) involves abandoning differential pricing (Ramsey pricing)
and applying the same markup percentage to all traffic. This is one of the concepts proposed in the rate
reasonableness test used by the Federal Communications Commission for access prices to the
telecommunications infrastructure of the large telecom carriers. (This will be discussed in Chapter 7.)
125 An example of Ramsey pricing being above SAC3 would be a case where the issue traffic is extremely price
inelastic. For example, some years ago metallurgical coal for export was selling in the $75 range in world markets, and then the price jumped for a period well over $150, and in some cases was selling at over $300. If the coal was able to pay the rail rate at $75, at higher coal prices the coal shipper would be able to pay (much) higher rail rates. In this high coal price situation, coal shippers would have been extremely insensitive to rail rates and computation of Ramsey prices with the inverse elasticity rule could produce Ramsey prices which far exceeded the SAC test.

Project FY14 – STB - 157
Railroad rate regulation 33
However, while such rates are easy to compute, we know that they are not economically efficient. They
produce a lower level of economic surplus than Ramsey prices (or SAC rates). Such rates may be very
attractive to shippers with low elasticities (price-insensitive traffic) who are currently paying rates with high
markups. However, by applying a uniform markup, the more price sensitive traffic will face rates that
would cause them to switch to less expensive alternatives or to cease doing business. This reduces the
economic surplus from rail infrastructure and services. It will also result in either revenue inadequacy for
the carrier, and/or start an upward rate spiral. Each price sensitive shipper that is lost to the system will
cause a re-computation of the average percentage markup, which will necessarily be higher. This in turn
may induce the next level of price sensitive shippers to leave the system.
Appendix I includes a detailed discussion of the technical and academic debate, particularly between
Faulhaber and Willig, concerning on the SAC concept, particularly as it relates to economies of scope.

Project FY14 – STB - 157
Railroad rate regulation 34
4 Rate Reasonableness Standards and
Challenges in Their Uses
Chapter 2 introduced the tests under which the STB examines the reasonableness of rates charged by
railroads. This chapter provides greater detail on those tests – the Full-SAC procedure and the two
subsequent simplifications of that procedure, the Three-Benchmark procedure and the Simplified-SAC.
This chapter also examines the main challenges that have emerged since their introduction.
The Full-SAC procedure is STB’s primary regulatory process through which a shipper may seek relief on
rates it believes are unreasonable and determines if it is bearing the cost of inefficiencies or the cost of
railroad facilities from which it derives no benefits. To make its case, a shipper must provide evidence that
a rate is unreasonably high by simulating what the rate would be in a contestable market. In practice, this
means that the shipper has to design an efficient hypothetical stand-alone railroad (SARR) that would
serve the traffic at issue. The Board then compares the competitive rate of this hypothetical SARR with
the challenged rate to decide whether the latter is reasonable or not.
The complexity and cost associated with the Full-SAC procedure eventually led to the introduction of two
other procedures for determining rate reasonableness, the Three-Benchmark procedure and the
Simplified-SAC procedure. The Three-Benchmark procedure was introduced in 1996, with a methodology
based on benchmarks developed by the STB. In 2007, the Simplified-SAC method was introduced, with a
methodology mirroring the Full-SAC analysis, but with a set of assumptions that aim to reduce the cost
and time needed to complete a SAC analysis.
4.1 The Full-SAC Procedure
4.1.1 The Market Dominance Inquiry
The STB does not have jurisdiction to review the reasonableness of a rate unless the railroad is shown to
have and exercise “market dominance” over the shipper. To begin an examination of the question of
market dominance, the first issue to be examined is the level of the rate being charged in relation to the
railroad’s costs. Congress established that any rate with an R/VC ratio below 180% is not market
dominant.126
If a contested rate has an R/VC ratio greater than 180%, the railroad it is not automatically
presumed to be a result of market dominance.127
Rather, the shippers must demonstrate that the carrier is
in a market dominant position based on the absence of effective competition from other rail carriers or
modes of transportation for the shipment.128
The R/VC ratio compares the revenue derived from the rate to the railroad’s variable costs for the
movement. Prior to 2006, the ICC and the STB allowed parties to propose “movement-specific
adjustments” to URCS (the STB’s regulatory costing system) to reflect what they believe is the best
estimation of the true cost of the traffic at issue. For example, in Otter Tail v. BNSF, BNSF developed
126 49 U.S.C. § 10707(d)(1)(A). 127 49 U.S.C. § 10707(d)(2). 128 49 U.S.C. § 10707(a).
Project FY14 – STB - 157
Railroad rate regulation 35
variables cost using URCS and available movement specific data that BNSF incorporated in lieu of BNSF
system-average costs.129
However, in a rulemaking completed in October 2006, the STB discontinued the
use of movement specific adjustments when calculating the R/VC ratio. The total variable costs are
estimated using the system-average cost figures produced by URCS.130
4.1.2 The Rate Reasonableness Standard
To determine if a rate is reasonable under the Full-SAC test, shippers must determine the lowest cost at
which a hypothetical, fully efficient railroad could provide the service at issue, free from any costs
associated with inefficiencies or cross-subsidization. If the rate required to cover these costs (taking into
account a reasonable return for the railroad) is less than the disputed rate, then the disputed rate may be
considered to be unreasonable.131
To begin, the shipper has to define a hypothetical SARR which could serve the traffic if the market was
free from entry and exit barriers. This hypothetical SARR is designed to replicate the conditions of a
contestable market. By simulating a contestable market, the Full-SAC procedure approximates the
maximum rate that would be charged to the shipper in a competitive environment.
The Traffic Group and the Route
This hypothetical SARR is designed to serve a specific “traffic group”. The traffic group definition is a
crucial and often heavily contested component of a Full-SAC test presentation. The traffic group includes
the traffic at issue as well as other additional traffic (i.e., “cross-over traffic”) that could increase the
SARR’s revenues and profitability. The cross over traffic includes traffic that currently uses the tracks of
the defendant railroad, as well as traffic that could potentially be rerouted because of the new network
configuration of the SARR (rerouted traffic). But the Board will not accept the rerouting of the traffic
unless the complainant can demonstrate that the SARR will provide equivalent or better service.
To serve this traffic, the SARR must use optimal physical infrastructure (tracks, yards, interchange points,
motive power, etc.). These physical infrastructure elements are specified in a detailed operating plan that
includes the total investment needed as well as the total operating cost it would incur for the service. The
revenue expected from the SARR is then estimated, and the rates that the SARR would charge are
compared to those charged to the captive shipper. These computations are made for a long term period
of time, such as 10 to 20 years, and a discounted cash flow analysis is used to compute, by year, the rate
the shipper must pay.
In SAC cases, shippers have considerable flexibility in the selection of the traffic group to take advantage
of economies of scales, scope and of traffic density. While the traffic at issue cannot be modified,
shippers are authorized to adjust the traffic by adding cross-over traffic and/or rerouting certain traffic
using the parts of the hypothetical SARR.
129 See STB Docket No. 42071, Otter Tail Power Co. v. BNSF Railway Co., “Opening Evidence of The Burlington Northern and Santa Fe Railway Company,” II-1 (filed June 13, 2003). 130 Major Issues, slip op. at 59-61. 131 Major Issues, slip op. at 7-8.

Project FY14 – STB - 157
Railroad rate regulation 36
The traffic group takes into account the type of traffic, the amount of traffic, the density, the distance, the
speed, the terrain, the train length and frequency as well as all parameters needed to define the traffic.132
These parameters affect the physical infrastructure that is needed to support such traffic. The traffic group
definition is crucial to the complaining shipper because it allows the shipper to maximize the economies of
scope in its SARR and increase its operational revenues. Any changes in the scope of the traffic to be
included (specifically cross-over traffic) have a direct impact on the design of the SARR, and certain
errors in the definition of the traffic can lead to the dismissal of the case. In Otter Tail v. BNSF, the case
was eventually dismissed because one portion of the traffic was subsidizing another.133
Cross-over traffic
Cross-over traffic is the traffic that would not originate and terminate on the SARR but would be
interchanged with a residual portion of the railroad system. The ICC in Coal Rate Guidelines recognized
that complaining shippers could lower the costs of their SARRs by taking advantage of economies of
density.134
In the Xcel Energy v. BNSF case, the cross-over traffic was the predominant source of
revenue; it represented 90% of the traffic served by the SARR.135
While adding cross-over traffic allows
shippers to improve the efficiency of their SARRs, it also introduces complexity in the estimation of the
revenue effect of this traffic. The issue that arises with including cross-over traffic is how best to allocate
the revenue from the traffic between the on- and off-SARR segments, based on the cost of facilities
needed to serve the traffic. This issue is one of the major sources of dispute between the parties in SAC
cases.
When cross-over traffic was first permitted in a SAC analysis, there was no set method to allocate its
related revenue. Early cases used a mileage-based approach to allocate revenue, the “modified mileage
block prorate” method.136
Under this methodology, the carrier would be allocated revenue based on its
share of “blocks” (a carrier was given one block for every 100 miles it carried the traffic or part of the 100
miles), as well as an additional block for originating or terminating the traffic). The STB recognized there
were potential issues with this methodology though, and allowed parties to suggest other methods in their
analyses.137
In 2006, the STB introduced a new method to allocate revenues, which did not have the
inherent issues associated with the mileage-based method (i.e., the new method was able to take into
account a railroad’s economy of density). This new methodology was the “Average Total Cost” (ATC)
approach under which revenue from each segment of a movement would be allocated based on “the
132 Ibid., 8.
133 See Otter Tail Power Co. v. BNSF Ry., NOR 42071 (STB served Jan. 27, 2006), with technical corrections (STB served Mar. 27, 2006), http://www.stb.dot.gov/Decisions/readingroom.nsf/UNID/CA03AA0FD8AA1D208525713E006C97E1/$file/36798.pdf. 134Coal Rate Guidelines, 1 I.C.C.2d at 29. 135 Public Service Co. of Colo. D/B/A Xcel Energy v. The Burlington N. and Santa Fe Ry., NOR 42057, slip op. at 13 (STB served Jun. 8, 2004), http://www.stb.dot.gov/Decisions/readingroom.nsf/WEBUNID/751D1FCBAC1CF1DF852569D000726673?OpenDocument. 136 Duke Energy Corp. v. Norfolk S. Ry, NOR 42069, slip op. at 17 (STB served Nov. 6, 2003), http://www.stb.dot.gov/Decisions/readingroom.nsf/WEBUNID/1E47AD9DE3B66C9885256DE2006D9E73?OpenDocument. 137 One of the main issues was the inability to account for economies of density. Ibid.

Project FY14 – STB - 157
Railroad rate regulation 37
average total cost of the movement on- and off-SARR”. 138
The average total cost per segment would be
calculated using URCS.
In 2013, the STB adopted an alternative ATC method for revenue allocation. The aim of the modified
method was to ensure that economies of density were still accounted for when allocating revenue but
revenue allocated to a segment would not be below variable cost (addressing an issue with the original
ATC method). The first step was the same as the original ATC method (using URCS to calculate the
average total cost per segment, and then allocating revenue in proportion to the total average cost of the
movement). The modification was adding a second step to ensure revenue allocated was not below
variable cost. If that was the case, the allocation would be increased to match the URCS variable cost of
the defendant carrier on a given segment (the same for both on- and off-SARR segments).139
Rerouted traffic
A second type of traffic is rerouted traffic. This is traffic for which a shipper would change the route over
which the traffic currently moves. In Duke Energy v. Norfolk Southern, the Board defined general
guidelines to use rerouted traffic in a Full-SAC case.140
Rerouted traffic is an appropriate means of
removing inefficiencies from the SARR as existing routes may not be the most optimal routes to carry the
traffic. However, there is a risk that rerouted traffic does not remove inefficiencies but rather
inappropriately increases revenues of the SAAR network when that rerouted traffic is not part of the
SARR. The Board implemented criteria to analyze whether this rerouted traffic was appropriate. One of
these criteria was to check whether a rerouting shortens the distance. If it was effectively the case, the
Board would presume it is acceptable.
Operating Expenses and Road Property Investment
Once the traffic group is validated, the shipper can then estimate the capital expenditure and the
operating expenses required to move this traffic via the operating plan.
The operating plan simulates all the technical requirements needed by the SARR to support the traffic
group and must at least provide the same level of service to shippers as the existing service provided by
the incumbent railroad. It must be “realistic, i.e., consistent with real-world railroading”.141
The operating
plan takes into account the road facilities, single tracks, passing sidings, number of trains, number of
cars, type of cars, number of employees and crews, yards, etc. to permit carriage and interchange of
traffic.142
Once the technical and operating configuration of the SARR is defined, the investments and
138 Major Issues, slip op. at 26. 139 Rate Regulation Reforms, Ex Parte 715, slip op. at 28-30 (STB served Jul. 18, 2013). http://www.stb.dot.gov/Decisions/readingroom.nsf/WEBUNID/60A2C167BAAB1DB185257BAC005E6235?OpenDocument. 140 NOR 42069, slip op. at 25-26 (STB served Nov. 6, 2003). 141
Western Fuels Ass’n, Inc. and Basin Elec. Power Coop. v. BNSF Ry., NOR 42088, slip op. at 15 (STB served Feb. 18, 2009), http://www.stb.dot.gov/Decisions/readingroom.nsf/WEBUNID/3FE4193782B6435085257561006F3148?OpenDocument. 142 General Procedures for Presenting Evidence in Stand-Alone Cost Rate Cases, Ex Parte 347 (Sub No. 3), 5 S.T.B. 441 (Mar. 9, 2001).
Project FY14 – STB - 157
Railroad rate regulation 38
operating costs necessary to operate the SARR and accommodate the traffic at issue are estimated. The
complaining shipper and the railroad must provide sufficient evidence to support their choices and
estimates.
Operating expenses encompass train personnel, locomotive operation, maintenance, railcar, material and
supply, administrative costs, training, trackage rights, loss and damage and other costs. There is no
requirement that shippers use URCS in developing the SARR’s costs. Generally, they develop their
operating expenses using their own cost estimates and models.
The investment costs are generally presented as Road Property Investments (RPI), which includes land,
roadbed preparation, track, tunnels, bridges, signals and communications, buildings and facilities, public
improvements (such as fences, crossing protection, roadway signs, etc.), mobilization (i.e., movement of
people, equipment and supplies to various sites), engineering and contingencies.
Each party is expected to provide credible estimates of those costs, which can lead to very different
results. For example, in the Xcel Energy v. BNSF case, Xcel claimed that the road property investments
for the SARR would cost $900 million while BNSF claimed that it would cost $1.8 billion. The STB
eventually determined total construction cost of $1.3 billion. In the Duke Energy v. Norfolk Southern case,
Duke Energy estimated that the RPI would cost $2.2 billion while NS claimed that it would cost $5.1
billion. The Board decided that $3.6 billion would be required to build the SARR.143
The Full-SAC analyses requires that revenues be based on operations occurring over a multi-year period
(originally 20 years) to take into account deferred taxes; the period was subsequently shortened to 10
years.144
However, the SARR is assumed to operate over an indefinite period of time, and the recovery of
investment for infrastructure is often assumed to occur over the economic life of the assets considered.
The Revenue Requirement Analysis
Once the operational plan, operating expenses and capital expenditures have been estimated, the
complaining shipper can estimate the annual revenue requirements of the SARR using a discounted cash
flow (DCF) model. The model estimates the annual revenues of the SARR that would be necessary to
cover its annual total costs (capital and operation) including inflation, federal and state tax liabilities and a
reasonable rate of return for the SARR. A DCF model provides the total annual revenue cash flows of the
SARR, typically over a 10-year period, using projections based on the traffic forecast. Changes in costs
over the period are estimated based on the Rail Cost Adjustment Factor (RCAF), approved and published
quarterly by the Board.145
This required revenue amount is then compared to the expected revenues from the traffic group
considered over the 10-year period based on forecasted rates and traffic level trends. In order to account
http://www.stb.dot.gov/Decisions/readingroom.nsf/WEBUNID/BAEE4CEF5A4067BF85256A03006D0FF9?OpenDocument. 143 NOR 42069, slip op. at 86 (STB served Nov. 6, 2003). 144 Major Issues, slip op. at 61. 145 The index used is a combination of both the RCAF-A and RCAF-U (adjusted and unadjusted for industry productivity). See Major Issues, slip op. at 40-44.
Project FY14 – STB - 157
Railroad rate regulation 39
for the time value of money, both amounts are discounted to their present value using a cost of capital
determined by the Board.
The test compares:
the revenue that is needed to cover all costs of the SARR (RPI + operating expenses) with
the revenue that would be generated by the traffic group handled by the SARR, which includes
(a) the traffic at issue using the current carrier rate, and (b) any revenue from crossover traffic
moved by the SARR.
If the present value of the revenue that would be generated by the traffic group is greater than the present
value of the SARR’s revenue requirement, then the rate would be considered unreasonable.146
The Rate Prescription and Reparations
In Major Issues, the Board decided on the Maximum Markup Methodology to express the allowable SAC
rate. Under this method, the STB sets a maximum R/VC ratio rather than a specific set price.147
The
method involves determining the contribution of traffic’s variable cost towards the SAC costs. The rate will
be the higher of the SAC rate and the 180% R/VC, (as the Board cannot set a rate below this level).148
Another method used in past cases was one where “the Board calculated the percent reduction in the
current issue rate that would reduce the total revenues from the entire traffic group down to the total
revenue requirements of the SARR, and then required the defendant railroad to reduce the challenged
rates by that percentage.”149
The Maximum Markup Methodology has the advantage of allowing the
maximum rate to increase with inflation in variable costs, without the need for a new regulatory hearing.
4.1.3 Challenges in the Use of the Full-SAC
From the perspective of its use and practice, the main challenge of the Full-SAC is the complexity and
costs of preparing and litigating a case. While this procedure is considered to be precise as a mechanism
for determining the reasonableness of challenged rail rates, it is highly complex, requires considerable
time, and is often a multi-million dollar exercise.150
Beyond data collection, shippers are required to
analyze a huge amount of complex data (cost evidence, simulation of operating plan, construction costs,
expenses, macroeconomic data, industry data, etc.). There is also the time needed to assess the parties’
results and conclusions. Such complexity and regulatory cost have raised concerns among some
shippers, commentators and Congress.
146 See Major Issues, slip op. at 8. 147 Major Issues, slip op. at 14. 148 Arizona Elec. Power Coop., Inc. v. BNSF Ry. and Union P. R.R., NOR 42113, slip op. at 2 (STB served Nov. 22, 2011), http://www.stb.dot.gov/Decisions/readingroom.nsf/WEBUNID/B4B6654E5F913BC68525794F00735FB5?OpenDocument. 149 Xcel Energy v. BNSF, NOR 42057, slip op. at 36-37 (STB served Jun. 8 2004). 150 See Pittman, Russell, “Against the Stand-Alone –Cost Test in U.S. Freight Rail Regulation” Economic Analysis Group Competition Advocacy Paper, (2010), http://www.justice.gov/atr/against-stand-alone-cost-test-us-freight-rail-regulation.

Project FY14 – STB - 157
Railroad rate regulation 40
In 1996, Congress directed the STB to establish a simplified approach to the Full-SAC for those shippers
whose expected relief does not justify the high cost of litigation.151
In 1999, the U.S. GAO reported that:
“Of the shippers who expressed an opinion about the rate complaint process, … over 70 percent believe
that the time, complexity, and costs of filing complaints are barriers that often preclude them from seeking
rate relief.”152
In 2007, the GAO noted that despite several efforts undertaken by the STB, there was
“widespread agreement” that STB’s standard rate review process remained inaccessible to most
shippers, that the cost to pursue rate relief was approximately $3 million per litigant, which effectively
prevented all but large-volume shippers from being able to afford STB’s rate review process.153
To improve the efficiency of Full-SAC cases, STB issued procedural guidelines for the submission of
evidence in SAC cases. These guidelines were designed to better focus the evidence by standardizing
the format for written presentations, workpapers and electronic spreadsheets. This was intended to help
the agency more efficiently and effectively evaluate the records in these cases by introducing
standardization and predictability to the process.154
Further, the STB has sought to develop a consistent
body of precedent on key SAC case issues to reduce the number of contested issues and the time
necessary to bring cases to a final decision. But because of the complexity of the industry and important
nuances between individual shipments, STB has found that each case is unique and dependent on its
own individual facts (e.g., route, type, amount, land, and traffic). Consequently, the process of data
collection and analysis cannot be easily replicated in cases, and the extent to which the procedure’s
standardization is limited.
Complexity of the SAC -- Economies of Scope
Because the rail industry is a network industry, when trying to determine the reasonableness of rates
charged to captive shippers, an accurate cost analysis is necessarily a complex undertaking.
When presenting a case for rate relief to the STB, shippers are permitted to take into account in the
SARR all economies of scale and scope to minimize the cost of the traffic at issue. While it is in the
shippers’ interest to maximize the benefits of economies of scope in their SAC models, this practice is
one of the factors that have introduced increasing complexity in the SAC procedure.
151 See footnote 76 and related text.
152 U.S. General Accounting Office, “Railroad Regulation: Current Issues Associated With the Rate Relief Process” at 4. (February 1999). http://www.gao.gov/assets/160/156502.pdf 153 U.S. Government Accountability Office, “Freight Railroads, Preliminary Observations on Rates, Competition, and Capacity Issues, 21 (June 2006). http://www.gao.gov/new.items/d06898t.pdf 154 General Procedures, Ex Parte 347 (Sub. No. 3).

Project FY14 – STB - 157
Railroad rate regulation 41
The Coal Rate Guidelines anticipated that SAC cases could be complex and indicated the need to
evaluate each issue on a case-by-case basis rather than
a simple “one-size-fits-all” approach. The ICC outlined
the primary objective of the SAC procedure as follows:
“The purpose of a SAC analysis is to determine the least
cost at which an efficient competitor could provide the
service, because by so doing we are stimulating the
competitive price for the market. Hence, although many
different SAC calculations could be offered, we will be
guided in the individual cases by the least cost
(theoretically) feasible SAC model”.155
As acknowledged by the ICC and later the STB, there
are several ways to determine the least cost SAC model.
The first and most direct approach would be to define the
shortest route that serves the traffic at issue. As shown
in in Figure 4-1 below, this would be the approach as
defined by SARR A.
A second approach is to define the SARR that maximize the contribution of the cross-over traffic, shown
as SARR B in below.
155 Coal Rate Guidelines, 1 I.C.C.2d at 27.
When presenting a case for rate
relief, shippers are permitted to take
into account all economies of scale
and scope to minimize the cost of the
traffic at issue.
This practice has introduced
increasing complexity in the SAC
procedure.

Project FY14 – STB - 157
Railroad rate regulation 42
Figure 4-1: Comparison of Two Hypothetical Stand-Alone Railroad Configurations
Source: InterVISTAS Consulting Inc.
The lowest-cost SARR may not necessarily be the one that exhibits the lowest construction costs but the
one that can benefit from the contribution of cross-over traffic that is large enough to produce the lowest
average variable cost of the traffic at issue. In the figure above, the SARR B is defined so that the
revenue effect of the economies of scope from the cross-over traffic is maximized.156
This ambiguity is explicitly noted in the Coal Rate Guidelines:
The parties will have broad flexibility to develop the least costly, most efficient plant. The plant
should be designed to minimize construction (or acquisition) and operating costs and/or maximize
the carriage of profitable traffic. In selecting the route of a SAC railroad, for instance, an
overriding factor may be the effort to lower costs by taking advantage of economies of density.
Generally, a stand-alone railroad would attempt to fully utilize plant capacity, adding other
profitable traffic in order to reduce the average cost of operation. Thus the stand-alone railroad
156 Roughly speaking (economists have lots of subtleties and qualifications to the concept), economies of scope occur when it is cheaper per unit to produce two different products than to produce one.
Coal mine
Electric utility plant
Cross over traffic
Cross over traffic
Cross over traffic

Project FY14 – STB - 157
Railroad rate regulation 43
may not represent the shortest route for the captive shipper, but the one with the highest traffic
densities.157
By permitting shippers to propose a stand-alone railroad that maximizes the carriage of profitable traffic,
the Coal Rate Guidelines specifically recognized that shippers should benefit from the revenue effect of
the economies of scope enabled by a higher level of output. In practice, economies of scope arise from
cost complementarities. Cost complementarities represent a large source of economies of scope in a
multiproduct industry.158
Cost complementarities in the railroad industry refer to the marginal cost
reducing effect that may occur when a railroad serves additional traffic,159
giving rise to economies of
scope. The concept is central to the stand-alone cost test in its practical form as the complaining shipper
seeks to minimize the rate of the traffic at issue. The shipper may wish to add a very large amount of
cross-over traffic to its hypothetical stand-alone railroad to take advantage of large hypothetical
economies of scope. Coal Rate Guidelines specifically encourages the shipper to benefit from the
economies of scope when designing their hypothetical stand-alone railroad. The decision also anticipated
that an efficient competitor would seek to maximize economies of scope. It specifically noted that the ICC
at the time saw “no need for any restrictions on the traffic that may potentially be included in a stand-
alone group.”160
The benefit of the economies of scope was also supported by an analysis provided by Baumol, Panzar
and Willig.161
They described a situation in which a multiproduct firm had a monopoly for one product and
operated in a competitive market for another product. Customers of the monopoly market could benefit
through lower prices from the participation of the firm in the competitive market because of cost
complementarities:
When the monopoly market is not perfectly contestable, regulation may be desirable; but
regulatory policy should then be designed, insofar as possible, to replicate the results of a
contestable market, thereby encouraging the monopolist’s participation in the competitive market
as a socially efficient means to take advantage of economies of scope rather than adopting the
socially wasteful policy that denies the monopolist that opportunity or impedes its use.162
Thus, the theoretical basis of the SAC test supports the maximization of economies of scope. The cost
complementarities concept of the cost function ensures that adding cross-over traffic to the SARR would
decrease the marginal cost of the traffic at issue. A consequence is that the complexity of the procedure
is an inherent component of the Full-SAC cases as developed over the years. As Faulhaber noted: “The
157 Coal Rate Guidelines, 1 I.C.C.2d at 28-29.
158 Squires, Dale and James Kirkley, Production Quota in Multiproduct Pacific Fisheries, 21 J. of Environ. Econ. and
Management no. 2 (1991). 159
Additional traffic on the same line, but not necessarily for the same origin and destination. 160
Coal Rate Guidelines, 1 I.C.C. 2d at 29. 161 Baumol, Panzar and Willig, Contestable Markets. 162 Ibid., 355.

Project FY14 – STB - 157
Railroad rate regulation 44
extreme complexity is no accident and should be no surprise; it evolved as part and parcel of the
regulatory process.”163
The complexity of the procedure is a necessary exercise for those who want to estimate an economically
efficient rate for the traffic in a network industry. However, based on review of past Full-SAC cases, some
of the complexity can also be attributed to the effort of the shippers to develop increasingly complex
SARRs that maximize cross-over traffic and associated economies of scope, even if the traffic is only
tangentially related to the SARR.164
If shippers want a simpler, faster and less expensive procedure, they
can use the simplified procedures developed and made more accessible to shippers by the STB. The
Three-Benchmark and the Simplified-SAC tests provide the shipper the opportunity to challenge rates
they believe are unreasonable at a lower cost. While these procedures may be less comprehensive, they
may still provide reasonable and less expensive ways for shippers to seek relief on the rates they
challenge. For many cases, there is reason to believe that the simpler procedures will produce similar or
nearly identical outcomes as Full SAC. The following sections review these simplified procedures. Section
5 will examine the consequences of replacing Full SAC with the simpler procedures for two past rate
cases adjudicated by the STB.
4.2 The Three-Benchmark Procedure
4.2.1 Introduction
After the introduction of the CMP principles and the Full-SAC test and at the direction of the Congress (as
part of the ICC Termination Act of 1995), in 1996 the Board issued Simplified Guidelines to determine the
reasonableness of challenged rail rates charged on captive traffic where the CMP guidelines could not
practicably be applied.165
These were intended to provide medium and small shippers with access to
regulatory relief when they face potential unreasonable rates. The Board’s action recognized that a Full-
SAC proceeding could be quite expensive and thus not feasible where the amount of money at issue is
not great enough to justify the expense.
STB’s decision in Rate Guidelines–Non-Coal introduced the Three-Benchmark Procedure under which
three revenue-to-variable-cost measures are used as benchmarks to determine the reasonableness of
rates:
The first benchmark is the Revenue Shortfall Allocation Method (RSAM). The RSAM measures
“the uniform markup above variable cost that would be needed from every shipper of potentially
captive traffic (the R/VC>180 traffic group) in order for the carrier to recover all of its URCS fixed
costs.”166
163 Faulhaber, Gerald R, “Verified Statement – Stand-Alone Cost – Response to Comments,” Ex Parte No. 722 (Sub-No. 2) Railroad Revenue Adequacy and Ex Parte No. 664 (Sub-No. 2) Petition of the Western Coal Traffic League to Institute a Rulemaking Proceeding to Abolish the Use of the Multi-Stage Discounted Cash Flow Model in Determining the Railroad Industry’s Cost of Equity Capital, Reply Comments submitted by Concerned Shipper Associations, Exhibit A (filed Nov. 4, 2014). 164 See Otter Tail. 165 Simplified Guidelines, 1 S.T.B. 1004. 166 Ibid., slip op. at 19, 1 STB at 1027.

Project FY14 – STB - 157
Railroad rate regulation 45
The second benchmark is the Revenue to Variable Cost ratio for Comparable traffic (R/VC COMP),
based on movements sharing the same characteristics with the traffic at issue. This measure is
the markup paid by comparable traffic and is intended to “provide a means of reflecting demand-
based differential pricing principles.167
While the STB noted this test is “admittedly crude,” it
concluded that this “was the only simple means available to obtain even a rough measure of this
very important pricing factor.168
The third benchmark is the Revenue to Variable Costs over 180% ratio (R/VC >180). It measures
the average markup over variable cost earned from potentially captive shippers by the defendant
railroad (or being paid by all potentially captive shippers). This benchmark “measures the degree
of differential pricing actually being practiced by that carrier.169
The STB computes the RSAM
and the R/VC >180 every year.
These three measures were defined with the objective of providing small shippers access to the
regulatory process without sacrificing much of the theoretical basis of the CMP principles. Each
benchmark represents a simplified component of the CMP principles, and the combination of the three
can be linked to the theoretical basis of CMP and Ramsey Pricing.
Over time, the STB has offered successive updates to the guidance and application of its Three-
Benchmark approach to increase its accuracy and reliability. Figure 4-2 illustrates the four major changes
that STB adopted since the introduction of the Three-Benchmark method in 1996.
167 Ibid., slip op. at 25, 1 STB at 1034. 168 Ibid. 169 Ibid., slip op. at 28, 1 STB at 1038.

Project FY14 – STB - 157
Railroad rate regulation 46
Figure 4-2: Major Regulatory Changes to the Three-Benchmark Method
Source: InterVISTAS summary of information from STB Decisions EP 347 (Sub No. 2), EP 657 (Sub No. 1), EP 646 (Sub No. 1), EP 646 (Sub No. 3), EP 715
The first change occurred in 2006, restraining the ability of shippers and railroads to modify the URCS
variable costs in their estimation process.170
The Board adopted the proposal to no longer allow
“movement-specific” adjustment to URCS variable costs. The Board felt that the added costs of these
movement-specific adjustments were not justified.
The second change introduced major changes in the comparable group determination, the RSAM and
R/VC>180 calculations, and the rate relief cap.171
In this 2007 decision, the Board provided for:
Inclusion of a mandatory mediation period at the beginning of the case.
Access to unmasked waybill data once a complaint had successfully been filed; the data included
is only for the defendant carrier.
A Final Offer Arbitration (FOA) method to determine the comparable set to use in the Three-
Benchmark analysis.
Revision to the RSAM and R/VC>180 ratio calculations, including the removal of the RSAM range,
using unadjusted URCS figures to calculate the R/VC>180 ratio and adding the carrier’s revenue
shortfall/overage to the RSAM formula.
Comparison group movements will include only defendant traffic.
170 Major Issues, EP. 657 (Sub-no. 1) (STB served Oct. 30, 2006),
http://www.stb.dot.gov/Decisions/readingroom.nsf/WEBUNID/5C7E822CBDC68AD385257217005C5064?OpenDocument 171 Simplified Standards, http://www.stb.dot.gov/Decisions/readingroom.nsf/WEBUNID/CA4BB78C4CA56E5985257352006BC9DD?OpenDocument .

Project FY14 – STB - 157
Railroad rate regulation 47
Using a confidence interval to determine rate reasonableness.
Allowing either party to introduce evidence of other relevant factors (but not movement-specific
adjustments to URCS) that could increase or decrease the maximum allowable rate.
Maximum rate relief is set at $1 million over a five year period.
The third major revision occurred in 2012.172
This formalized the process for obtaining the necessary
confidential waybill data (i.e., “unmasked” waybill data) for the Three-Benchmark analysis. Once the
complaint had been filed, the parties would be allowed access to the four most recent years of data
matching the most recent year of the RSAM figure available. The parties could decide which years they
chose to include in their comparable groups.
Finally the 2013 revision raised the available rate relief from $1 million over five years to $4 million.173
The
increase in the limit was spurred by the removal of rate relief limits for Simplified-SAC cases and
additional information on the cost of litigating the simplified cases. Note that at present, shippers whose
revenue at stake exceeds $4 million would have their potential relief limited if they choose the Three-
Benchmark method, but not if they choose either the Simplified-SAC or Full SAC methods.
4.2.2 Three-Benchmark Link to CMP and Ramsey Pricing
The Board recognized that the Three-Benchmark “measures provide an appropriate frame of reference
for our rate reasonableness analysis.”174
When designing the Three-Benchmark procedure, the Board
ensured that the underlying concept of CMP and its Ramsey pricing basis were effectively embodied in
the three measures. Each of the Three-Benchmark measures reflects a conceptual component of CMP.
RSAM: Revenue Adequacy
As noted above, the Revenue Shortfall Allocation Method (RSAM) benchmark is a measure of “the
uniform markup above variable cost that would be needed from every shipper of potentially captive traffic
(the >180 traffic group) in order for the carrier to recover all of its URCS fixed costs.”175
In other words,
the RSAM benchmark is intended to approximate what the railroad needs to charge its potential captive
shippers to be revenue adequate. This benchmark addresses the revenue adequacy of the carrier, a key
component of Ramsey pricing. As well, it embraces the concept of differential pricing, by recognizing that
some traffic is very price sensitive (the below 180% R/VC traffic) and that other traffic is able to pay higher
mark-ups and may need to pay higher markups in order for the railroad to be revenue adequate.
172 Waybill Data Released in Three-Benchmark Rail Rate Proceedings, Ex Parte No. 646 (Sub-no. 3) (STB served Mar. 12, 2012), http://www.stb.dot.gov/Decisions/readingroom.nsf/WEBUNID/8A55681AC3A6AB11852579BF004D2B25?OpenDocument 173 Rate Regulation Reforms. 174 Simplified Guidelines, slip op. at 14, 1 STB at 1020. 175 Ibid., slip op. at 19, 1 STB at 1027.

Project FY14 – STB - 157
Railroad rate regulation 48
The RSAM benchmark is calculated by adding the carrier’s tax-adjusted revenue shortfall (or subtracting
the overage) to the numerator of the R/VC>180 benchmark.176
A carrier’s revenue shortfall reflects the
carrier’s inability to generate enough revenue from potentially captive traffic to be revenue adequate.
Such shortfall should then be taken into account to ensure that the traffic at issue is not cross-subsidizing
other traffic. Hence, by including railroad specific adjustments, the measure effectively takes into account
the managerial efficiency (or inefficiency) adjustments as required in the CMP. The RSAM benchmark is
computed based on URCS variable costs. Its mathematical formula is the following: 177
𝑅𝑆𝐴𝑀 =(𝑅𝐸𝑉>180 + 𝐴𝑑𝑗𝑢𝑠𝑡𝑒𝑑 𝑅𝐸𝑉𝑠ℎ𝑜𝑟𝑡/𝑜𝑣𝑒𝑟𝑎𝑔𝑒 )
𝑉𝐶>180
Prior to 2007, RSAM was published using a lower and upper band. The lower band excluded all the
<100% traffic (where the carrier priced below the URCS variable cost of the traffic). The upper band
included this traffic. “The upper end of the range reflects the average markup above variable cost that the
railroad would need if it were to replace all of its assets as they wear out. The lower end subtracts out any
shortfall related to movements priced below the 100% R/VC level. The lower end is an attempt to capture
managerial inefficiencies.”178
The Board used the range as it believed that the adjusted RSAM would
understate the revenue requirement whereas the unadjusted figure (upper band) would overstate the
revenue requirement.179
The RSAM is no longer reported as a range following the 2007 Simplified
Standards.180
R/VC >180: Differential Pricing Charged to Captive Shippers
The R/VC>180 benchmark estimates the average markup the railroads currently charge their potentially
captive shippers. Because it takes into account all traffic charged above the 180% threshold, the R/VC>180
benchmark measures the “degree of differential pricing actually being practiced by that carrier.”181
The
purpose of this measure is to ensure that the complaining shipper is not paying a disproportionate rate for
the traffic at issue. It compares the issue traffic with the average R/VC of all other potential captive
movements.
This embraces the Ramsey pricing concept of differential pricing, which is required to achieve the highest
economic efficiency (or highest economic benefit) from an enterprise that has substantial economies of
scale and/or common costs.
176 See Simplified Standards for Rail Rate Cases—Taxes in Revenue Shortfall Allocation Method, Ex Parte No. 646 (Sub-No. 2), slip op. at 2 (STB served May 11, 2009). See also Simplified Standards for Rail Rate Cases—2013 RSAM And R/VC>180 Calculations, Ex Parte No. 689 (Sub-No. 6) (STB served Jun. 16, 2015). 177 The STB adjusted the RSAM formula in 2008 to account for federal and state income taxes. The tax-adjusted shortfall or overage is equal to the REVshort/overage ÷ (1 - (State Tax Rate + (1 - State Tax Rate) × Federal Tax Rate)). Simplified Standards for Rail Rate Cases—Taxes in Revenue Shortfall Allocation Method, STB Ex Parte No.646 (Sub-No. 2), slip op. at 5 (STB served Nov. 21, 2008). 178
Simplified Standards, slip op. at 7, n.12 (STB served Jul. 28, 2006), http://www.stb.dot.gov/Decisions/readingroom.nsf/WEBUNID/40FB81344FF333CA852571B9004C7A82?OpenDocument 179 Simplified Guidelines, 1 STB at 1028. 180 Simplified Standards, slip op. at 21-22 (STB served Sept. 5, 2007). 181 Simplified Guidelines, slip op. at 28, 1 STB at 1038.

Project FY14 – STB - 157
Railroad rate regulation 49
The principle of fairness from CMP is taken into account in this measure. The R/VC>180 benchmark is
calculated based on URCS variable costs. Its basic mathematical formula is the following:
𝑅/𝑉𝐶>180 =𝑅𝐸𝑉>180
𝑉𝐶>180
𝑊𝑖𝑡ℎ 𝑅𝐸𝑉>180 = 𝑇𝑜𝑡𝑎𝑙 𝑟𝑒𝑣𝑒𝑛𝑢𝑒 𝑒𝑎𝑟𝑛𝑒𝑑 𝑏𝑦 𝑡ℎ𝑒 𝑐𝑎𝑟𝑟𝑖𝑒𝑟 𝑜𝑛 𝑝𝑜𝑡𝑒𝑛𝑡𝑖𝑎𝑙𝑙𝑦 𝑐𝑎𝑝𝑡𝑖𝑣𝑒 𝑡𝑟𝑎𝑓𝑓𝑖𝑐
𝑉𝐶>180 = 𝑇𝑜𝑡𝑎𝑙 𝑉𝑎𝑟𝑖𝑎𝑏𝑙𝑒 𝑐𝑜𝑠𝑡𝑠 𝑜𝑓 𝑡ℎ𝑒 𝑟𝑎𝑖𝑙𝑟𝑜𝑎𝑑 𝑡𝑜 ℎ𝑎𝑛𝑑𝑙𝑒 𝑡ℎ𝑎𝑡 𝑡𝑟𝑎𝑓𝑓𝑖𝑐
Initially, these calculations were adjusted to match the total revenue and cost information reported by the
carriers in their annual filings. The STB eventually decided to remove these adjustments because they did
not improve the accuracy of the estimate.182
R/VC COMP: Differential Pricing Charged to Comparable Traffic
The R/VC COMP benchmark provides an estimate of the average markup of comparable captive
movements. Thus, this benchmark measures the demand-based differential pricing of other comparable
movements charged by the same railroad.
Ramsey pricing principles would indicate that traffic with identical conditions and a common price
elasticity (price sensitivity) would pay similar markups on variable cost.
The Board recognized that comparable traffic, depending on how it is defined, may not have exactly the
same demand elasticity, but also noted that this was the only way to obtain an estimate of the differential
pricing in the market. The benchmark is calculated as follows:
𝑅/𝑉𝐶𝐶𝑂𝑀𝑃 =𝑅𝐸𝑉𝐶𝑂𝑀𝑃
𝑉𝐶𝐶𝑂𝑀𝑃
𝑊𝑖𝑡ℎ 𝑅𝐸𝑉𝐶𝑂𝑀𝑃 = 𝑇𝑜𝑡𝑎𝑙 𝑟𝑒𝑣𝑒𝑛𝑢𝑒 𝑒𝑎𝑟𝑛𝑒𝑑 𝑏𝑦 𝑡ℎ𝑒 𝑐𝑎𝑟𝑟𝑖𝑒𝑟 𝑜𝑛 𝑡ℎ𝑒 𝑐𝑜𝑚𝑝𝑎𝑟𝑎𝑏𝑙𝑒 𝑐𝑎𝑝𝑡𝑖𝑣𝑒 𝑡𝑟𝑎𝑓𝑓𝑖𝑐
𝑉𝐶𝐶𝑂𝑀𝑃 = 𝑇𝑜𝑡𝑎𝑙 𝑣𝑎𝑟𝑖𝑎𝑏𝑙𝑒 𝑐𝑜𝑠𝑡𝑠 𝑜𝑓 𝑡ℎ𝑒 𝑟𝑎𝑖𝑙𝑟𝑜𝑎𝑑 𝑡𝑜 ℎ𝑎𝑛𝑑𝑙𝑒 𝑡ℎ𝑒 𝑐𝑜𝑚𝑝𝑎𝑟𝑎𝑏𝑙𝑒 𝑡𝑟𝑎𝑓𝑓𝑖𝑐
The comparable group used to estimate the benchmark should reflect as much as possible the
characteristics of the traffic at issue because “markups applied to a similar commodity moving under
similar transportation conditions can provide some rough indication of the relative degree of demand
elasticity for that type of traffic…”.183
For dispersed traffic, it may not be possible for the STB to find
comparable movements.
182 Simplified Standards, slip op. at 20 (STB served Sept. 5, 2007). 183 Simplified Guidelines, 1 S.T.B. at 1035.
Project FY14 – STB - 157
Railroad rate regulation 50
4.2.3 Methodology, Procedure and Interpretation of the Three-Benchmark
Test
Determining Rate Reasonableness
Determining rate reasonableness begins by examining the ratio of RSAM to R/VC>180. This provides an
indicator of the railroad’s revenue adequacy.
If the RSAM (representing revenue required to achieve revenue adequacy) is greater than the R/VC>180
ratio (representing revenue actually being earned), it implies that the carrier is not revenue adequate
because what it charges its captive shippers is below what is needed to cover its fixed costs. Conversely,
if what the carrier actually collects (R/VC>180) is greater than what it needs to recover its total costs
(RSAM), then the ratio suggests that the railroad is revenue adequate.
𝑅𝑆𝐴𝑀 > 𝑅/𝑉𝐶>180 𝑡ℎ𝑒𝑛 𝑡ℎ𝑒 𝑟𝑎𝑖𝑙𝑜𝑟𝑎𝑑 𝑖𝑠 𝑢𝑛𝑑𝑒𝑟 𝑖𝑡𝑠 𝑟𝑒𝑣𝑒𝑛𝑢𝑒 𝑎𝑑𝑒𝑞𝑢𝑎𝑐𝑦 𝑡𝑎𝑟𝑔𝑒𝑡
𝑅𝑆𝐴𝑀 < 𝑅/𝑉𝐶>180 𝑡ℎ𝑒𝑛 𝑡ℎ𝑒 𝑟𝑎𝑖𝑙𝑜𝑟𝑎𝑑 𝑖𝑠 𝑎𝑏𝑜𝑣𝑒 𝑖𝑡𝑠 𝑟𝑒𝑣𝑒𝑛𝑢𝑒 𝑎𝑑𝑒𝑞𝑢𝑎𝑐𝑦 𝑡𝑎𝑟𝑔𝑒𝑡
As noted in the Simplified Standards, while this relationship has not strictly held true in the past due to
allowing adjustments to be made to variable cost estimates, the current disallowance of the adjustment
on the R/VC>180 ratio and the adjustment to the RSAM computation now ensures that the ratio reflects this
relationship.184
The previous step on the Three-Benchmark method addressed revenue adequacy of the carrier. The next
process is to assess whether rates are reasonable. To analyze the reasonableness of the rate at issue,
the Three-Benchmark test is based on a combination of the three measures.185
First, the markup on
comparable traffic is used as a starting point for rate reasonableness. This, however, must be adjusted up
if the carrier is not revenue adequate, and down if the carrier is more than revenue adequate.
𝑁𝑒𝑒𝑑𝑒𝑑 𝐴𝑑𝑗𝑢𝑠𝑡𝑚𝑒𝑛𝑡 𝐹𝑎𝑐𝑡𝑜𝑟 =𝑅𝑆𝐴𝑀
𝑅/𝑉𝐶>180
The purpose of this ratio is to “adjust the rates in the comparison movements to reflect better the
maximum lawful rates the carrier can charge captive traffic.”186
This factor would then be applied to each
of the movements in the comparable set.
The original Simplified Guidelines provided another interpretation of the measure.187
By simply
rearranging the terms of the equation, the measure offers a more direct link to the CMP and the
underlying Ramsey Pricing principles:
𝑇ℎ𝑟𝑒𝑒 𝐵𝑒𝑛𝑐ℎ𝑚𝑎𝑟𝑘 𝑀𝑒𝑎𝑠𝑢𝑟𝑒 =𝑅/𝑉𝐶𝐶𝑂𝑀𝑃
𝑅/𝑉𝐶>180
∙ 𝑅𝑆𝐴𝑀
184 Simplified Standards, slip op. at 19-20 (STB served Sept. 5, 2007). 185 Ibid. 186 Ibid., slip op. at 81. 187 Simplified Guidelines, 1 STB at 1044.

Project FY14 – STB - 157
Railroad rate regulation 51
The first part of this term is the ratio of R/VCCOMP to R/VC>180 which reflects the specific relative
elasticity of the traffic at issue to the average elasticity of all potentially captive traffic. This ratio
was called the “demand adjustment factor for differential pricing.” If the R/VCCOMP is greater than
the R/VC>180, the revenue need (estimated by the RSAM) is adjusted upward to account for the
“relatively greater inelasticity” of the traffic reflected in the higher R/VCCOMP.188
RSAM reflects the average markup needed by the carrier to achieve revenue adequacy.
This presentation demonstrates that the Three-Benchmark test reflects Ramsey Pricing: achieving but not
exceeding revenue adequacy and setting differential prices based on the elasticity of demand.
Upper Boundary for Three-Benchmark Test
As noted previously, each movement in the comparison group is adjusted by the RSAM-to-R/VC>180 ratio
to calculate what economists or statisticians call a “point estimate.” The STB recognizes that there is a
range of comparable rates in the comparison group and uses the point estimate to compute an upper
boundary for Three-Benchmark test of rate reasonableness. The Board calculates the mean and standard
deviation of all adjusted movements in the comparison group to estimate the upper boundary of a
reasonable confidence interval around the estimate of the mean:189
𝑈𝑝𝑝𝑒𝑟 𝐵𝑜𝑢𝑛𝑑𝑎𝑟𝑦 = 𝑅/𝑉𝐶𝐶𝑂𝑀𝑃 + 𝑡𝑛−1 ×𝑆
√(𝑛 − 1)
𝑊𝑖𝑡ℎ 𝑅/𝑉𝐶𝐶𝑂𝑀𝑃 = 𝑚𝑒𝑎𝑛 𝑜𝑓 𝑡ℎ𝑒 𝑎𝑑𝑗𝑠𝑢𝑡𝑒𝑑 𝑐𝑜𝑚𝑝𝑎𝑟𝑎𝑏𝑙𝑒 𝑚𝑜𝑣𝑒𝑚𝑒𝑛𝑡𝑠
𝑆 = 𝑠𝑡𝑎𝑛𝑑𝑎𝑟𝑑 𝑑𝑒𝑣𝑖𝑎𝑡𝑖𝑜𝑛 𝑜𝑓 𝑡ℎ𝑒 𝑎𝑑𝑗𝑢𝑠𝑡𝑒𝑑 𝑐𝑜𝑚𝑝𝑎𝑟𝑎𝑏𝑙𝑒 𝑚𝑜𝑣𝑒𝑚𝑒𝑛𝑡𝑠
If the challenged rate is above the upper boundary of the reasonable confidence interval, the rate may be
considered unreasonable.
Other Factors
The Three-Benchmark methodology is relatively straightforward to compute mathematically, but the STB
added some complexity by allowing railroads and shippers to propose increases or decreases in the
comparable rates based on “other relevant factors.” However, the STB imposed limits on what can be
presented as relevant factors by the parties: “We will not permit any evidence of product and geographic
competition as to specific movements or of movement-specific adjustments to URCS.”190
The STB also
retained the right to refuse to consider evidence, even if relevant, that would generate a significant
increase of the cost of the simplified approach.
188 Ibid. 189 Simplified Standards, slip op. at 21-22. 190 Simplified Standards, slip op. at 77-78.

Project FY14 – STB - 157
Railroad rate regulation 52
Final Determination
The maximum lawful rate will be fixed at the upper boundary level of the test previously described, taking
into account any relevant factors accepted by the Board.191
4.2.4 Challenges Raised With the Three-Benchmark Approach
Both shippers and railroads have raised issues with the Three-Benchmark approach.192
In particular, the
Three-Benchmark approach has been criticized for its lack of theoretical background and the potential for
inaccurate estimates. This report has already discussed the conceptual basis for the approach in the
context of Ramsey pricing principles. While the Three-Benchmark approach is not supported
mathematically by equations similar to Ramsey pricing, the approach does conform to the two key tenets
of Constrained Market Pricing: the carrier should have a reasonable opportunity to earn adequate
revenues from captive traffic, but no more; and greater economic efficiency is achieved if the carrier uses
differential pricing.
Regarding accuracy, the following claims have been offered:
One of the main criticisms was that the test was too simple to take into account the unique
demand characteristics of each movement. Therefore, a rate above a mean of comparable traffic
may not necessarily indicate that it is unreasonable but only that it has unique characteristics.
The Board replied that the Three-Benchmark procedure is based on adjustments that reflect the
different characteristics of the movements at issue and that it embodies a demand-based
differential adjustment factor.193
A similar criticism has been raised recently that questioned the applicability of the RSAM and
R/VC>180 ratio and whether the measures contain any information on the distribution of the rates
that are used to compute them.194
The Three-Benchmark has also been criticized because it relies entirely on URCS cost
estimation. URCS has been previously criticized for the inaccuracy of its estimations for individual
movements and for potential incomplete information. In addition, some criticized the use of URCS
data that are inevitably somewhat dated and reflect prior market conditions. Thus, the method
imposed a “regulatory lag” of one or two years, which might be particularly troublesome in periods
of rising rates.195
The issue with URCS was also highlighted in a 2015 report to the
Transportation Research Board. The report argued that rate regulation based on this cost system
would be flawed by the inaccuracy of the estimations because “[t]he methods used by STB to
191 Ibid.
192 For a summary of the issues raised, see Simplified Standards, slip op. at 72-84. 193 Ibid., 73. 194 Burton, Mark, The Economics of Evolving Rail Rate Oversight: Balancing Theory, Practice and Objectives, 81 J. of Transp. Law, Logistics & Policy no. 4 (2014). 195 Simplified Standards, slip op. at 84-85.
Project FY14 – STB - 157
Railroad rate regulation 53
assign variable costs to shipments by allocating portions of a railroad’s total expenses are
economically invalid and produce unreliable results…”196
The Three-Benchmark procedure has also been criticized for potential inadequacy for certain
commodities, particularly grain shipments. The Three-Benchmark procedure is designed to
protect individual shippers that are being singled out for market abuse. With grain, the
“comparable” group is composed of other grain shippers. Yet those shippers argued that
railroads have instituted across-the-board high rates, causing all comparison groups to face high
rates. As a result, rate relief would be unavailable.197
4.2.5 Analysis of Criticisms
There is some validity to these criticisms. Indeed, the STB has itself acknowledged shortcomings in
URCS, and already has made a number of changes to address concerns that have been raised. Beyond
these changes, the STB has identified three possible approaches to further refining URCS: a basic
option, a moderate option and a comprehensive option.198
The comprehensive would include updating
and possibly replacing the regression analyses as well as re-examining the engineering studies to get a
better understanding of the nature of rail costs today.
There is little doubt that the accuracy of URCS to determine variable cost can be improved, but it is
unlikely, based on the nature of rail costs, that URCS can ever be made perfect. In particular, the issue of
allocating common and fixed costs will remain problematic. Like in most cases, regulators are unlikely to
ever have access to perfect information.
It should be noted however, that the proposed alternative of benchmarking against competitive rates has
potential issues as well. The key is to compare the rates in question against rates that not only are
competitive rates, but are rates that are truly comparable. There is a need to get the right comparative
group with which to benchmark rates. For example, TIH chemicals have higher insurance and risk costs
and hence need to generate rates that are higher than if they would be for other chemicals. Comparing a
TIH rate to other chemicals with a lower risk profile would not be appropriate. There is also a need to
have all the service characteristics comparable (distance, volume, whether or not there are guarantees
regarding volume, shipper vs. railroad owned cars, service level, type of line used, time of year, handling
characteristics etc.). If the comparison is not done right, it could in effect result in the ratcheting down of
rates to some inappropriate “lowest common denominator” simply because someone elsewhere is paying
less for a shipment which is not truly comparable. Such an approach could threaten railroad viability.
If every shipment with a low price elasticity of demand were granted rates closer to LRMC on the basis of
some other, somewhat comparable, group enjoying lower rates, there would be a shortfall of revenue to
cover all the common/fixed costs.
196 Transportation Research Board, Committee for a Study of Freight Rail Transportation and Regulation, Special Report 318: Modernizing Freight Rail Regulation (Washington DC: Transportation Research Board, 2015), 4. 197 National Grain and Feed Association, Submission to the Surface Transportation Board, STB Docket No, 665 (Sub-No. 1), Rail Transportation of Grain, Rate Regulation Review, June 10, 2015. 198 Surface Transportation Board, Report to Congress Regarding the Uniform Rail Costing System, May 27, 2010.

Project FY14 – STB - 157
Railroad rate regulation 54
While not perfect, from either the perspective of economic theory or accounting accuracy, URCS does
provide a common basis for comparison of rates. Wilson and Bitzan note:
Currently, URCS represents a practical and transparent attempt to estimate the costs of individual
railroad movements. It strikes a compromise between theoretically correct aggregate cost functions
and measurement of costs based on individual movement characteristics.199
4.3 The Simplified-SAC
A decade after the STB introduced the Three-Benchmark procedure, the Board made available to
shippers a second alternative to Full-SAC. This new alternative – known as Simplified-SAC – was
intended to provide “medium-sized” shippers with a simplified, more affordable, procedure that gave them
better access to the rate relief regulation process.200
The Simplified-SAC retained the advantage of a Full-
SAC presentation, but in simplified form: the ability to detect abuses of market power whereby a railroad
forces a captive shipper to pay more than is necessary for the carrier involved to earn adequate revenues
and thereby forces the captive shipper to cross-subsidize parts of the defendant’s rail network it does not
use or benefit from.
The main simplification was that shippers were no longer required to design a hypothetical SARR, which
a Full-SAC approached mandated and was a costly part of the SAC methodology. Instead, the
Simplified-SAC methodology uses the existing route and infrastructure that serves the traffic at issue. This
simplification perhaps was not possible (or at least would have been considered inefficient) in the early
post-Staggers period because carriers were still using indirect routings and had excess capacity in their
networks. By 2007, however, the railroads’ networks were rationalized to a large extent and much more
efficient. Thus in many situations, it no longer may be necessary to design a hypothetical SARR to detect
and eliminate inefficiencies in the serving railroad’s investment or operations. In other words, in many
cases there would not be a significant enough difference between a newly designed SARR and the
existing lines to warrant the time and expense of designing a new hypothetical SARR. Rather, the
facilities of the SARR will consist of the existing facilities along the analyzed route, including all track,
sidings, and yards.201
The simplifications introduced by the Simplified-SAC have been criticized as being a less thorough
application of the CMP principles.202
The simplified procedure is basically limited to an inquiry as to
whether the captive shipper is being forced to cross-subsidize other portions of the infrastructure, and no
longer an inquiry into the additional issue as to whether the network the shipment uses is inefficient. STB
expected that that network design restriction (i.e., use the current network) would allow the application of
these standards to be simpler and less costly. The STB’s response to these criticisms is that simplifying
assumptions always involve a trade-off. Shippers that believe the serving railroad’s infrastructure or
operations are inefficient can elect the Full-SAC approach.
199 Wilson, Wesley W. and John D. Bitzan, “Costing Individual Railroad Movements,” Prepared for the Federal Railroad Administration, Department of Transportation, September 2003, p. 11. 200 Simplified Standards, EP 646 (Sub No. 1), slip op. at 5 (STB served Sept. 5, 2007). 201 Ibid., 15. 202 Ibid., 55-57.
Project FY14 – STB - 157
Railroad rate regulation 55
The original Simplified Standards have not been static. The STB has continued to issue revisions and
refinements to the methodology.203
In 2013, the STB approved major methodological changes including:
removing the rate relief limits for Simplified-SAC cases and raising the cap to $4 million in Three-
Benchmark cases,
requiring a full RPI analysis,
using Average Total Cost as the revenue allocation method for cross-over traffic (Full-SAC and
Simplified-SAC), and
changing the interest rate to the U.S. Prime rate from the previous T-Bill rate (which applies to the
Three-Benchmark test, the Simplified-SAC test and the Full-SAC test).
The STB recognized that requiring a full RPI analysis of the route would increase the cost of preparing a
Simplified-SAC case. Therefore, the Board proposed to remove the limit on rate relief to compensate for
the increased cost of litigating Simplified-SAC cases.204
4.3.1 Link to CMP
Simplified-SAC is based on the same process as the Full-SAC analysis and embodies the same
underlying CMP principles. The difference is that in Simplified-SAC, the efficiency of the railroad is
assumed, likely resulting in a significant reduction in the cost and time to litigate a case to a final STB
decision.
The STB acknowledged that the Simplified-SAC approach is “a less thorough application of CMP [than
Full SAC] in that it would not identify inefficiencies in the current rail operation”. This, of necessity, is a
compromise in order to lower the cost of litigation and increase the likelihood that a medium-sized shipper
might seek the regulatory protection offered by the STB. Simplified SAC still “allows the Board to
determine whether a captive shipper is forced to cross-subsidize parts of the defendant’s existing rail
network the captive shipper does not use. The Simplified-SAC method assures that a railroad does not
earn monopoly profits on its investments.”205
4.3.2 Methodology of the Simplified-SAC Procedure
The Simplified-SAC procedure is similar to Full-SAC, but with simplifying assumptions and
standardization of measures to streamline the process and decrease the litigation cost for shippers. As
outlined in Simplified Standards, they include:
Route: The analysis will examine the predominant route on the issue movements during the prior
12 months for the traffic at issue.
203 Two cases have been filed under the Simplified-SAC method, but were subsequently settled. See U.S. Magnesium, L.L.C. v. Union Pacific Railroad Company (Docket No. 42115) and U.S. Magnesium, L.L.C. v. Union Pacific Railroad Company (Docket No. 42116). 204 Rate Regulation Reforms, Ex Parte 715 (STB served Jul. 18, 2013). 205 Rate Regulation Reforms, slip op. at 9.
Project FY14 – STB - 157
Railroad rate regulation 56
Configuration: The facilities of the SARR will consist of the existing facilities along the analyzed
route (including all track, siding, and yards). If a shipper presents compelling evidence that some
facilities along the route have fallen into disuse by the railroad, and thus need not to be
replicated, those facilities will be excluded from the SAC analysis.
Test Year: The Simplified-SAC analysis will examine the reasonableness of the challenged rates
based on a 1-year analysis. The Test Year is the most recently completed 4 quarters preceding
the filing of the complaint. In contrast, full SAC does the analysis for 10 or more years.
Traffic Group: The traffic group will consist of all movements that traveled over the actual route in
the Test Year. No rerouting of traffic will be permitted.
Cross-Over Traffic: The revenues from cross-over traffic will be apportioned between the on-
SARR and off-SARR portion of the movement based on the revenue allocation methodology used
in Full-SAC proceedings.
The Operating Plan
Unlike the Full-SAC test, Simplified SAC requires that the shipper use URCS to estimate the operating
expenses of the SARR. Once again, the purpose of this requirement is to remove cost assumptions and
network configuration as contested issues.206
However, URCS is designed to estimate variable costs and not total costs. To estimate the total operating
expenses, the STB recognized that some adjustments would need to be made to the URCS data.207
The
STB stated that the adjustments included removing costs associated with RPI, removing costs that would
be included in the DCF analysis, and removing various other costs that would otherwise be included in a
Full-SAC analysis.
While the STB initially considered providing the adjusted URCS data for Simplified-SAC analysis, it
ultimately decided that the parties should make the necessary adjustments because doing so would
“subject the modifications to the rigorous scrutiny of litigation, where any issues in the implementation of
this approach can be fully aired before the Board endorses any particular approach.”208
In 2013, the STB decided in connection with removing the limit on rate relief that Simplified-SAC cases
should include a full RPI analysis to reinforce the accuracy of the Simplified-SAC.
The Revenue Requirement Analysis
The revenue requirement analysis is realized using a discounted cash flow model. Unlike the Full-SAC
analysis that uses a 10-year cash flow projection period, the Simplified-SAC only requires an analysis
based on one year:
206 Ibid., 16. 207 Ibid., 50. 208 Ibid., 51.
Project FY14 – STB - 157
Railroad rate regulation 57
Discounted Cash Flow Analysis: The DCF analysis will calculate the capital requirement of a
SARR in a customary fashion and then compare the revenues earned by the defendant railroad
against the revenue requirements of the SARR only for the Test Year.”209
Rate Prescription and Reparations
While the Full-SAC allows a rate prescription for a 10-year period, the Simplified Standards provide a
maximum rate prescription only for a 5-year period, which may be more appropriate given that one of the
simplifications is to only do calculations for a single, test year, rather than for 10 or more years :
Maximum Reasonable Rate: The SAC costs (i.e., the revenue requirements of the SARR) will be
allocated amongst the traffic group based on the methodology used in Full-SAC cases.
5-Year Rate Relief: The maximum lawful rate will be expressed as a ratio of revenue to variable
costs, with variable costs calculated using unadjusted URCS. This maximum R/VC ratio would
then be prescribed for a maximum 5-year period.210
4.3.3 No STB Final Adjudication of a Case with the Simplified-SAC
Notably, to date, there have been no cases that have had a final decision using the Simplified-SAC
method. Thus, there are no lessons that can be drawn from its applications. Five cases have been raised
for potential Simplified-SAC resolution, but all were settled before the methodology could be tested.211
4.3.4 Most Full SAC and Simplified-SAC Cases Have Been Brought by Coal
Shippers
A large majority of the Full-SAC cases has been filed by large coal shippers. By contrast, shippers that
move smaller tonnages over long distances such as grain shippers have not filed any cases,
notwithstanding the STB’s simplification efforts. Some argue that the high cost of litigation could not be
offset by any potential relief they might win. In 2012, agricultural shippers claimed that the Full-SAC
approach is not appropriate for their industry. They also claimed that even the Simplified-SAC and the
Three-Benchmark rate are too complex and too costly relative to the expected benefits.212
Chapter 5 examines whether the STB’s simplified alternatives can produce similar results to the
application of Full-SAC. If either the Three-Benchmark or Simplified-SAC method would appear to provide
equivalent outcomes to Full-SAC, shippers may be more willing to use these alternatives to Full-SAC.
When using the Three-Benchmark method, shippers have access to a relief as high as $4 million. When
using the Simplified SAC, they may win as much relief as they would using Full-SAC. The following
chapter examines the consistency of the three procedures based on the analysis of two past cases.
209 Ibid., 16.
210 Ibid., 15. 211 William Olefins v. GTC (NOR 42098); BP Amoco v. NS (NOR 42093); Shell Chemical v. NS (NOR 41670); U.S. Magnesium v. UP (NOR 42115); and U.S. Magnesium v. UP (NOR 42116). 212 “Comments of the U.S. Department of Agriculture,” Rate Regulation Reforms, Ex Parte 715 (filed Oct. 23, 2012), http://www.stb.dot.gov/Filings/all.nsf/WEBUNID/AFF36A4882B7329A85257A9F006DF432?OpenDocument

Project FY14 – STB - 157
Railroad rate regulation 58
5 Simplifying the SAC Procedure: Two Cases,
Two Procedures
5.1 Introduction
This chapter presents the results of the project team’s examination of two cases that the STB decided
based on Full-SAC analyses. The project team’s re-examination sought to determine whether use of
either the Three-Benchmark procedure or the Simplified-SAC would yield outcomes that were consistent
with the analyses and findings of a Full-SAC test. Two past cases were selected, each with a different
outcome concerning rate reasonableness. In Otter Tail Power Company v. BNSF Railway Company,
NOR 42071, the STB found that Otter Tail failed to demonstrate that the challenged rates were
unreasonably high. In Western Fuels Association, Inc. and Basin Electric Power Cooperative v. BNSF
Railway Company, NOR 42088, the Board determined that the challenged rates were unreasonable. To
compare the results of the three methods for these two cases, the Three-Benchmark and Simplified-SAC
methods were applied to data from Otter Tail and Western Fuels with necessary adaptations.
5.1.1 Case Summaries
Otter Tail Power Company v. BNSF Railway Company
Otter Tail Power Company v. BNSF Railway Company, NOR 42071, was originally filed in early 2002 and
the STB’s decision was served on January 27, 2006. Otter Tail filed its complaint over BNSF’s common
carrier rates for coal movements of approximately 2 million tons annually from mine origins in Wyoming’s
Powder River Basin (“PRB”) to the Big Stone Generating Station (“Big Stone”) located in South Dakota.
Prior to filing, Otter Tail transported coal from the PRB to Big Stone under confidential contracts with
BNSF; the common carrier rates came into effect following failed negotiations between the two parties.
Otter Tail sought to demonstrate the unreasonableness of those rates under the STB’s Full-SAC
methodology.
Over the course of the four-year proceeding, there were a number of disputes between the two parties in
relation to the SAC analysis. A highlight of Otter Tail was a contentious dispute over the cross-over traffic
that would be included in the traffic group of the SARR.213
The STB ruled that Otter Tail’s SARR
incorrectly relied on revenue from cross-over traffic that was utilizing only a small portion of the proposed
SARR and was unfairly cross-subsidizing the longer, less densely used portion of the SARR. Therefore,
the STB limited the amount of revenue from cross-over traffic that could be used to reduce the revenue
requirement of the core facilities on the longer segment. As a result, the STB dismissed the case, finding
that BNSF’s rate had not been shown to be unreasonably high.
213 Otter Tail, slip op. at 8 (STB served Jan. 27, 2006).

Project FY14 – STB - 157
Railroad rate regulation 59
Western Fuels Association, Inc., and Basin Electric Power Cooperative v. BNSF Railway
Company
Western Fuels Association, Inc. and Basin Electric Power Cooperative v. BNSF Railway Company, NOR
42088 (hereafter “Western Fuels” or “WFA”), was originally filed in October 2004, and the Board served
its final decision on February 29, 2009. WFA filed its complaint over BNSF’s common carrier rates for
transporting coal from mines in the PRB to its Laramie River Station utility plant (approximately 200
miles).214
Prior to the common carrier rates coming into effect, the parties had been shipping coal under a
20-year contract, with rates approximately half of the proposed common carrier rates. In its decision, the
Board noted that commercially, the common carrier rates were among the lowest for transporting PRB
coal over similar and even longer distances. The STB also noted that the common carrier rates were
twice the previous contract rates.
The Board issued an initial decision in September 2007, holding that WFA failed to demonstrate that they
were paying more than necessary to cover the costs of the infrastructure required for the 200-mile
shipment. However, during the course of the litigation, the Board, in Major Issues in Rail Rate Cases, EP
657, changed the methodology for allocating revenue from cross-over traffic on the SARR. The Board
held that WFA had been unfairly disadvantaged because it had designed its SARR based on the prior
method of allocating cross-over traffic revenue and the new method adopted in Major Issues would
materially change the design of the SARR. Therefore, the STB gave WFA the chance to redesign their
SARR to address the new revenue allocation procedure and to submit supplemental evidence based on
that redesign. On their second attempt, WFA was successful in showing that they were paying BNSF
rates that covered more than the cost of the infrastructure required for their short distance shipments. The
ruling resulted in WFA receiving a large rate reduction of the common carrier rates. For 2009, this was an
approximately 60% reduction, although the new rates were still roughly 240% of BNSF’s variable costs.215
5.2 Adapting the Three-Benchmark Test
The project team adapted and applied the Three-Benchmark method to assess whether the analysis
would provide the same outcome as the Full-SAC analysis or a similar outcome for the two test cases.
This analysis must be viewed as provisional as it has not undergone the rigorous scrutiny of an actual
rate case proceeding before the STB. For example, in an actual Three-Benchmark case, adjustments can
be made to the maximum allowable rate (by either the shipper or the carrier) if the party can show the
change is required to reflect a relevant factor. We have not applied any such adjustments here. The
details of this provisional analysis are discussed below, and conclusions are provided in section 5.3.
5.2.1 R/VC Ratio of Issue Traffic
The first step in all of the rate relief methodologies is to compute the R/VC ratio for the issue traffic. This
figure is used to determine whether or not the 180% jurisdictional threshold for market dominance has
214 The 200 miles is an approximation based on the loaded miles agreed on by the parties. The loaded miles for each of the mines included in the analysis ranged from 140 to 188 miles. Western Fuels, Opening Second Supplemental Evidence, 10-11 (filed Feb. 22, 2007), http://www.stb.dot.gov/Filings/all_2000s.nsf/WEBUNID/85257CA7006C955B8525728A0071BC4D?OpenDocument 215 NOR 42088, slip op. at 2 (STB served Feb. 18, 2009).

Project FY14 – STB - 157
Railroad rate regulation 60
been met. Prior to the methodology change in 2006, the parties would submit their estimates of the issue
traffic R/VC ratio, allowing for movement-specific adjustments (namely, substituting actual movements
costs for system averages provided by URCS). These movement-specific adjustments are no longer
allowed, and the estimates for the R/VC ratio of the issue traffic are calculated using URCS without
adjustments.216
For the purpose of the analysis, both methods were tested.
Adjusted R/VC (Pre-2006)
The adjusted R/VC ratios were available in the public case filings for the two cases, with the appropriate
indexing already completed. As expected, there is a large difference between the R/VC estimates
provided by the two parties. On the one hand, shippers tend to use a more aggressive approach to
estimate lower variable costs as the resulting higher R/VC ratio of the movement at issue is in their
interests; a higher R/VC ratio demonstrates market dominance and implies that a rate may be
unreasonable. On the other hand, railroads tend to adopt a more conservative approach leading to lower
R/VC ratios as it is in their interest to use adjustments that will show higher costs.
Unadjusted R/VC (Post-2006)
For the Otter Tail case, unadjusted ratios were computed using the STB’s Railroad Cost Program based
on URCS data for the relevant years of the case and the movement characteristics collected from the
various case filings. It was not necessary to index the variable cost estimates as we used the available
annual costs data. The unadjusted R/VC ratios were available in the WFA case filing and were already
indexed to the appropriate years and quarters.
5.2.2 RSAM and R/VC>180
The first two benchmarks needed to complete the Three-Benchmark analysis are the RSAM and R/VC>180
ratios computed annually by the STB.217
For comparative purposes, the results of our analysis are based
on RSAM markups and R/VC>180 ratios calculated using both the pre-2007 and 2007 methodology
changes noted in Section 4.
RSAM Pre-2007
As noted in Chapter 4, prior to 2007, the STB’s RSAM benchmark incorporated a range where the lower
estimate included adjustments for the any shortfall but the upper estimate was unadjusted. However,
using the range created some uncertainty in specific situations. As noted in Simplified Guidelines, if the
R/VC>180 figure falls within that range, the analysis would be considered inconclusive.218
The STB’s annual calculation of RSAM and R/VC R/VC>180 for Class I rail carriers served April 21, 2003
showed that BNSF’s 4-year average RSAM for 1998-2001 was between 213-289, and that BNSF’s 4-year
average R/VC>180 ratio was 265, which are clearly within the 4-year range. These calculations are
reproduced in Table 5-1.
216 Otter Tail predates the methodology change in Major Issues. Movement-specific adjustments are no longer allowed when computing the R/VC ratios. 217
Rate Guidelines – Non-Coal, (STB served Apr. 21, 2003 and Jun. 22, 2005) (computing annual RSAM and R/VC>180 for Class I rail carriers). 218 Simplified Guidelines, 1 S.T.B. at 1043.

Project FY14 – STB - 157
Railroad rate regulation 61
Table 5-1: RSAM and R/VC>180 Example Tables, 1998-2001
Railroad/ Region
4 - Year Average
2001 2000 1999 1998
Railroad/ Region
4 - Year Average
2001 2000 1999 1998
BNSF 213-289 258-354 222-296 185-248 188-258 BNSF 265 266 266 263 266
GTW 149-205 146-168 129-186 118-188 203-278 GTW 237 236 243 255 213
IC 200-247 182-233 231-287 228-283 159-184 IC 258 255 241 264 272
KCS 269-328 302-364 275-339 280-345 220-264 KCS 249 263 242 248 243
SOO 337-453 328-441 298-361 399-565 324-445 SOO 245 256 228 246 250
NS 195-245 186-235 208-272 191-227
NS 208 219 200 206
CSX 221-265 242-290 217-259 205-245
CSX 198 192 191 210
UP 262-379 213-299 254-369 231-322 349-527 UP 229 234 222 234 225
Eastern Region
208-254 211-258 213-265 201-240
Eastern Region
207 208 199 213
Western Region
241-338 233-326 243-341 217-298 270-388 Western Region
246 249 242 247 244
National 222-294 224-298 228-308 213-277
National 232 234 225 237
Source: Rate Guidelines – Non Coal Proceedings, STB Ex Parte No. 347 (Sub-No. 2) (STB served April 21, 2003), 2-
3.
RSAM 2007
Beginning in 2007, the Board changed the calculation of the RSAM to address issues in the previous
calculation by using confidential waybill data. The STB discontinued using a range for the RSAM markup
and provided only one figure.219
The new RSAM also takes into account a carrier’s revenue shortfall (or
overage) adjustment in the calculation as was previously done in the adjusted RSAM. The project team
also tested the Three-Benchmark approach using this calculation, since shippers would have applied this
RSAM in a Three-Benchmark case after 2007. STB staff provided the RSAM under the new methodology
for the years related to the cases.
5.2.3 R/VCComp and the Comparison Group
The R/VCComp ratio benchmark provides an estimate of the average markup of comparable captive
movements. To create the set, we examined movements with similar characteristics to the issue
movements. This included car type, car ownership, and distance among other factors. The team also
made adjustments to remove outliers and traffic that might not be considered comparable (e.g.,
specifically any movements with R/VC ratios below 180%).
In an actual case, the final comparable traffic group would be decided via a “final offer procedure”
whereby the Board decides between the final comparison groups submitted by each party. It is not
possible in this provisional analysis to determine exactly which movements would have been chosen by
219 The modification is detailed in Simplified Standards, EP 646 (Sub No. 1), slip op. at 19-21 (STB served Sept. 5, 2007) and in the Notice of Proposed Rulemaking, Simplified Standards, EP 646 (Sub No. 1), slip op. at 21-22 (STB served Jul. 28, 2006).

Project FY14 – STB - 157
Railroad rate regulation 62
the Board in the arbitration process. However, it is possible to test different combinations of comparable
movements to reflect the conservative approach of a railroad (lower R/VC) or an aggressive approach of
shippers (higher R/VC). Variations between the different sets included expanding the allowable distance
band, varying the rail car ownership type and limiting the rail car type.
For the Otter Tail case, the comparable movements were chosen based on the issue movement
characteristics for the two mines analyzed in the Full-SAC analysis.220
These characteristics included the
car type, car ownership and comparable distance band. As the movements to the two mines share similar
characteristics, the same set of comparable movements was used for both mines. As noted previously, in
an actual Three-Benchmark case, the STB would choose the comparable group through a final offer
procedure; in place of that, a total of six comparable groups were tested. The different groups were
determined by varying the restrictions on the movement characteristics. For example, expanding the
allowable distance band added 500 movements to the base comparable set.
All six comparable sets included a base filter removing movements with R/VC ratios below 180%. In
addition, they included specific criteria reflecting different level of restriction:
The first comparable set included all rail car types used in the issue movements, had no
restriction on the number of cars per train, included only privately owned cars, and ran distances
between 700 and 1,100 miles. (In subsequent discussions and in the accompanying figures, this
set is referred to as “Simulated 3B-1.”)
The second set added a restriction to include only movements using J311 car types, based on
the movement characteristics of the issue traffic. (“Simulated 3B-2.”)
The third set added a restriction to only include movements with 115-117 cars per train.
(“Simulated 3B-3.”)
The fourth set mimicked the first set, but expanded the distance band to range between 500 and
1,300 miles. (“Simulated 3B-4.”)
The fifth and sixth sets mimicked the 2nd
and 3rd
sets, respectively, allowing for the longer
distance band between 500 and 1,300 miles.221
(“Simulated 3B-5” and “Simulated 3B-6.”)
For the WFA case, the comparable group was also based on the issue movement characteristics. There
were five separate mine origin/destination pairs in this case, but all of the mines are located within 50
miles of each other; as well, the car types and movement characteristics are similar for these mines.
Accordingly, the project team chose to use one set of comparable movements for all five mines. Similar to
the Otter Tail analysis, as part of the sensitivity analysis, the team tested different variations of the
comparable group, adjusting restrictions on what was considered comparable (i.e., longer distance band,
car type, etc.):
220 While other mines were included under the tariff rate, R/VC ratios calculated by both parties were only available for the two mines. 221 Issue movement characteristics are sourced from NOR. 42071, BNSF Opening Evidence and Otter Tail Opening Evidence (both filed June 13, 2003).

Project FY14 – STB - 157
Railroad rate regulation 63
The first comparable set included all potentially comparable movements, filtering for movements
with R/VC ratios below 180% and outlier movements.
The second comparable set also included a restriction to include only movements using J311 car
types (based on the movement characteristics of the issue traffic).
The third set added an additional restriction to only include movements with privately owned rail
cars.
The fourth set included the additional restriction to include movements with distances between 90
and 240 miles (approximately plus/minus 50 miles from the shortest and longest issue
movements).
The fifth set relaxed the ownership restriction, and includes all distances,
The sixth set included the restricted distance band.222
The Three-Benchmark method also allows the parties to submit evidence on potential adjustments to the
calculated maximum R/VC ratio; these are referred to as “relevant factors.” The project team’s analysis
does not account for such potential adjustments.
5.3 Findings of the Three-Benchmark Adaptation
5.3.1 Otter Tail v. BNSF
Results Based on the Current (2007) Simplified Standards for Three-Benchmark
The Three-Benchmark adaptation computed here tend to provide similar outcomes to the actual Full-SAC
case when using the most recent methodology (based on new RSAM calculation and unadjusted R/VC).
Figure 5-1 summarizes the results of the Three-Benchmark approach using the 2007 RSAM calculation
for the traffic originating from the Belle Ayr mine.223
The bars in varying shades of grey represent the six
different comparable data sets calculated by the project team (described above), which vary by type of
rail car, car ownership, and distance traveled. The “BNSF adjusted R/VC ratio” was calculated by BNSF
for the issue traffic, adjusting for movement specific costs. The “Unadjusted R/VC (URCS)” was
computed by the project team using URCS data, averaging the R/VC ratios for 2002 and 2003, calculated
using the movement characteristics from the public case filings.224
The “Otter Tail Adjusted R/VC” is the
R/VC for the issue traffic, calculated by Otter Tail, but adjusting for movement specific costs.225
222 Issue movement characteristics are sourced from STB Docket No. 42088, Western Fuels Association, Opening Second Supplemental Evidence, 10-11 (filed Feb. 22, 2007). 223 Results for the traffic originating from Eagle Butte leads to the same results and is presented in Appendix A 224
Movement inputs are from NOR 42071, BNSF Opening Evidence, II-14-16 (filed Jun. 13, 2003). The calculations are consistent with the current methodology for calculating R/VC ratios (no movement specific adjustments allowed). 225 This ratio is the average of the first five quarters the issue traffic moved under the contested rates (2002:1 to 2003:1). NOR 42071, Otter Tail Opening Evidence, II-A-41 (filed Jun. 13, 2003). As noted previously, these adjustments are no longer allowed when calculating R/VC ratios.

Project FY14 – STB - 157
Railroad rate regulation 64
Figure 5-1: Results of the Three-Benchmark Analysis Using the 2007 RSAM
Source: InterVISTAS analysis of data from public filings.
These results allow for the following observation:
Based on the Otter Tail adjusted R/VC (281%), the adapted Three-Benchmark approach would
suggest that the rates are unreasonable, because the R/VC of the traffic at issue would be higher
than the Three-Benchmark test (the 6 grey bars shown in Figure 5-2). However, use of this ratio
would not be allowed under the current Three-Benchmark Simplified Standard, which no longer
authorizes adjustments beginning in 2007.
Based on the BNSF’s adjusted R/VC (226%), the adapted Three-Benchmark would suggest that
the rates are not unreasonable, because the R/VC of the traffic at issue would be lower than that
produced by the Three-Benchmark approach. Here again, the ratio would not be allowed under
the new Simplified Standard as adjustments
are no longer authorized after 2006.
Based on the unadjusted R/VC (216%) which
calculated from URCS data, the Three-
Benchmark test suggests that the challenged
rates are not unreasonable. This outcome
using the Three-Benchmark test, based on the
current 2007 RSAM standards, is consistent
with the outcome of the actual STB decision
using Full-SAC.
Results Based on the 2002 Simplified Standards for Three-Benchmark
The project team also re-examined what the outcome of the Otter Tail case might have been if the parties
had used the Three-Benchmark method in effect in 2002 rather than the revised Three-Benchmark
method adopted in Simplified Standards. At that time, shippers and railroads were authorized to adjust
226% 216%
262% 260% 262% 269% 266% 263% 281%
0%
50%
100%
150%
200%
250%
300%
BN
SF R
/VC
Ad
just
ed
Un
adju
sted
R/V
C(U
RC
S)
Sim
ula
ted
3B
- 1
Sim
ula
ted
3B
- 2
Sim
ula
ted
3B
- 3
Sim
ula
ted
3B
- 4
Sim
ula
ted
3B
- 5
Sim
ula
ted
3B
- 6
Ott
er T
ail R
/VC
Ad
just
ed
Belle Ayr mine
This outcome using the Three-
Benchmark test, based on the current
2007 RSAM standards, is consistent with
the outcome of the actual STB decisions
using Full-SAC

Project FY14 – STB - 157
Railroad rate regulation 65
the R/VC ratio of the traffic at issue. In addition, the RSAM was not a single measure but a range. The
lower band of the range was the RSAM measure adjusted for the revenue shortfall of traffic priced below
100% while the upper band was the non-adjusted RSAM. The lower band was considered to understate
the revenue requirement to be borne by shippers. The upper band was considered to overstate the
revenue requirement to be borne by shippers.
Figure 5-2 illustrates the results of the team’s adapting the Three-Benchmark approach with the pre-2007
RSAM calculations which allow for a lower and upper band. As can be seen in the left-hand graph below,
the six calculated R/VC ratios based on the RSAM lower band are below the 180% threshold.226
The
results shown here are for traffic originating at the Belle Ayr mine. Results for the traffic originating from
the Eagle Butte are similar and lead to the same conclusion.
Figure 5-2: Results of the Three-Benchmark Approach Using the Pre-2007 RSAM
Source: InterVISTAS analysis of data from public filings.
Under the pre-2007 methodology, BNSF’s adjusted R/VC and the URCS-unadjusted R/VC lie in the
RSAM range. In this particular case, it is not possible to reach a conclusion on rate reasonableness
because the formula does not tell whether the comparable should be adjusted upward or downward. As
the original Simplified Guidelines stated, “the formula was never intended to provide a final result, but only
a starting point for a more particular analysis.”227
However, the adjusted R/VC ratios are still higher than
the adapted Three-Benchmark upper boundary, suggesting that the rates are unreasonable.
While the pre-2007 methodology would not have provided a clear outcome for the Otter Tail case, the
results based on our application of the Three-Benchmark method adopted in Simplified Standards
226 The Three-Benchmark method usually sets the upper boundary for the allowable R/VC ratio. In this case, the lower band leads to allowable R/VC ratio below 180%. At a result, the allowable R/VC ratio would need to be set 180% because the Board cannot prescribe rates below the 180% regulatory floor. See Excel Energy v. BNSF, NOR 42057, slip op. at 39 (STB served Jun. 8, 2004). 227 Simplified Guidelines, 1 S.T.B. at 1043.
226% 216%
170% 169% 170% 175% 173% 171%
281%
0%
50%
100%
150%
200%
250%
300%
BN
SF R
/VC
Ad
just
ed
Un
adju
sted
R/V
C (
UR
CS)
Sim
ula
ted
3B
- 1
Sim
ula
ted
3B
- 2
Sim
ula
ted
3B
- 3
Sim
ula
ted
3B
- 4
Sim
ula
ted
3B
- 5
Sim
ula
ted
3B
- 6
Ott
er T
ail R
/VC
Ad
just
ed
Belle Ayr mine RSAM Lower-Band
180% 226% 216% 230% 229% 231% 237% 235% 231%
281%
0%
50%
100%
150%
200%
250%
300%
BN
SF R
/VC
Ad
just
ed
Un
adju
sted
R/V
C (
UR
CS)
Sim
ula
ted
3B
- 1
Sim
ula
ted
3B
- 2
Sim
ula
ted
3B
- 3
Sim
ula
ted
3B
- 4
Sim
ula
ted
3B
- 5
Sim
ula
ted
3B
- 6
Ott
er T
ail R
/VC
Ad
just
ed
Belle Ayr mine RSAM Upper-Band
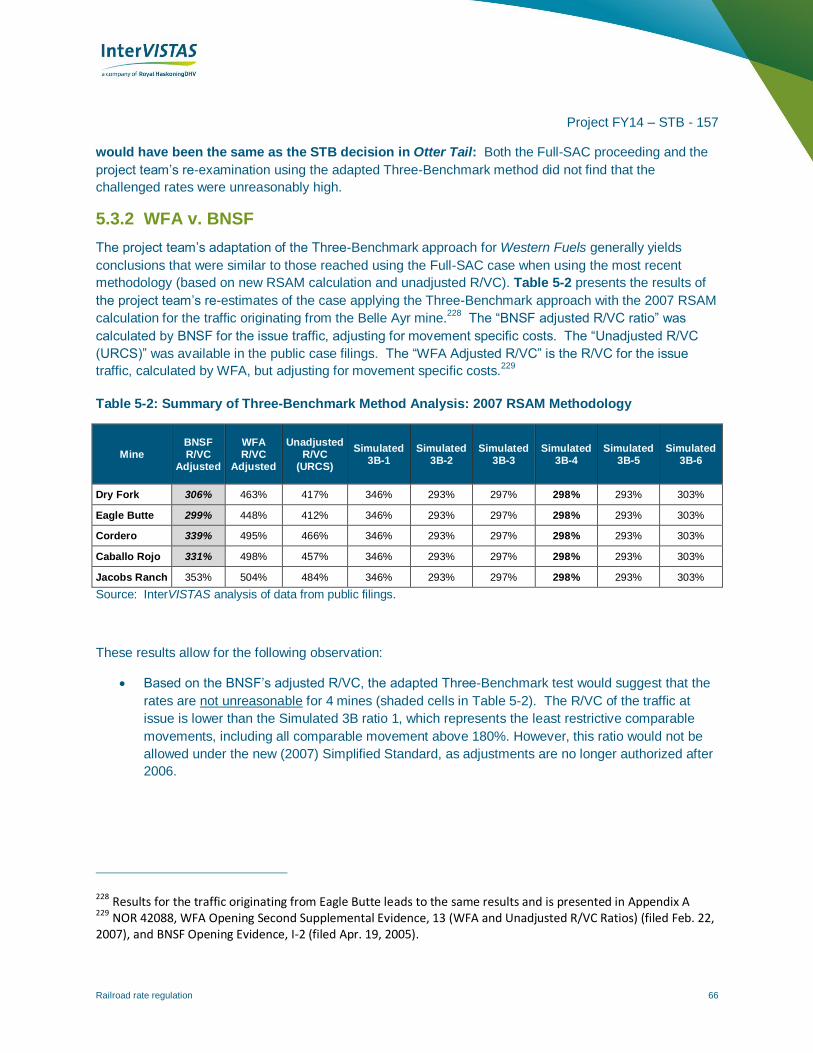
Project FY14 – STB - 157
Railroad rate regulation 66
would have been the same as the STB decision in Otter Tail: Both the Full-SAC proceeding and the
project team’s re-examination using the adapted Three-Benchmark method did not find that the
challenged rates were unreasonably high.
5.3.2 WFA v. BNSF
The project team’s adaptation of the Three-Benchmark approach for Western Fuels generally yields
conclusions that were similar to those reached using the Full-SAC case when using the most recent
methodology (based on new RSAM calculation and unadjusted R/VC). Table 5-2 presents the results of
the project team’s re-estimates of the case applying the Three-Benchmark approach with the 2007 RSAM
calculation for the traffic originating from the Belle Ayr mine.228
The “BNSF adjusted R/VC ratio” was
calculated by BNSF for the issue traffic, adjusting for movement specific costs. The “Unadjusted R/VC
(URCS)” was available in the public case filings. The “WFA Adjusted R/VC” is the R/VC for the issue
traffic, calculated by WFA, but adjusting for movement specific costs.229
Table 5-2: Summary of Three-Benchmark Method Analysis: 2007 RSAM Methodology
Mine BNSF R/VC
Adjusted
WFA R/VC
Adjusted
Unadjusted R/VC
(URCS)
Simulated 3B-1
Simulated 3B-2
Simulated 3B-3
Simulated 3B-4
Simulated 3B-5
Simulated 3B-6
Dry Fork 306% 463% 417% 346% 293% 297% 298% 293% 303%
Eagle Butte 299% 448% 412% 346% 293% 297% 298% 293% 303%
Cordero 339% 495% 466% 346% 293% 297% 298% 293% 303%
Caballo Rojo 331% 498% 457% 346% 293% 297% 298% 293% 303%
Jacobs Ranch 353% 504% 484% 346% 293% 297% 298% 293% 303%
Source: InterVISTAS analysis of data from public filings.
These results allow for the following observation:
Based on the BNSF’s adjusted R/VC, the adapted Three-Benchmark test would suggest that the
rates are not unreasonable for 4 mines (shaded cells in Table 5-2). The R/VC of the traffic at
issue is lower than the Simulated 3B ratio 1, which represents the least restrictive comparable
movements, including all comparable movement above 180%. However, this ratio would not be
allowed under the new (2007) Simplified Standard, as adjustments are no longer authorized after
2006.
228 Results for the traffic originating from Eagle Butte leads to the same results and is presented in Appendix A 229 NOR 42088, WFA Opening Second Supplemental Evidence, 13 (WFA and Unadjusted R/VC Ratios) (filed Feb. 22, 2007), and BNSF Opening Evidence, I-2 (filed Apr. 19, 2005).

Project FY14 – STB - 157
Railroad rate regulation 67
Based on the WFA’s adjusted R/VC, the adapted Three-Benchmark would suggest that the rates
are unreasonable, because the R/VC of the traffic at issue would be higher than the Three-
Benchmark test. Again, this ratio would not be
allowed under the new Simplified Standard.
Based on the unadjusted R/VC which is
calculated from URCS data, the Three-
Benchmark test also suggest that the
challenged rates are unreasonable.
Thus, using the current Simplified Standards, the
adapted Three-Benchmark provides similar results as
the actual STB decision using Full-SAC.
Results Based on the 2002 Simplified Standards
As with Otter Tail, the project team re-estimated what might have been the outcome under the RSAM
methodology available at the time of the case (i.e., using the RSAM Pre-2007 guidance). Table 5-3
presents the results of the Three-Benchmark analysis.230
The results are the same -- the rates are
generally found to be unreasonable. In the team’s re-examination, only two movements – the Simulated
3B-1, least restrictive comparable movements for the Dry Fork and Eagle Butte mines -- have different
outcomes when compared against the BNSF’s adjusted R/VC. All other estimations are found to be less
than the BNSF Adjusted R/VC and Unadjusted R/VC ratios.
Table 5-3: Summary of Three-Benchmark Method Analysis: Pre-2007 RSAM Methodology
Mine BNSF R/VC
Adjusted
WFA R/VC
Adjusted
Unadjusted R/VC
Simulated 3B-1
Simulated 3B-2
Simulated 3B-3
Simulated 3B-4
Simulated 3B-5
Simulated 3B-6
Dry Fork 306% 463% 417% 322% 272% 276% 277% 272% 282%
Eagle
Butte 299% 448% 412% 322% 272% 276% 277% 272% 282%
Cordero 339% 495% 466% 322% 272% 276% 277% 272% 282%
Caballo Rojo
331% 498% 457% 322% 272% 276% 277% 272% 282%
Jacobs Ranch
353% 504% 484% 322% 272% 276% 277% 272% 282%
Source: InterVISTAS analysis of data from public filings.
5.4 Adaptation of the Simplified-SAC Methodology
As noted, the STB thus far has not issued a final decision in a rate reasonableness case using the
Simplified-SAC approach. In each case brought forward under Simplified-SAC to date, the parties
230 Here, the results are based on the upper band of the RSAM range. We do not present the lower band as the results would lead to the same conclusion.
Thus, using the current most recent
Simplified Standards, the adapted Three-
benchmark provides similar results as the
actual STB decision using Full-SAC
case.

Project FY14 – STB - 157
Railroad rate regulation 68
eventually reached a settlement. In the absence of fully litigated Simplified-SAC cases, the project team
applied Simplified-SAC to the extent possible. The team could not replicate a “real” Simplified-SAC case
as some of the analysis (e.g., RPI, land valuation) would have required more in-depth analysis. To
approximate the outcome of the Simplified-SAC, in this report the study team made estimates and
simplifying assumptions as needed. This analysis must thus be viewed as provisional, as it has not
undergone the rigorous scrutiny of an actual STB proceeding.
This section presents the results of the adaptation of the Simplified-SAC test on the WFA case. An
adaptation of the Simplified-SAC on the Otter Tail case was not possible because of the lack of available
data in the case fillings. Sections 5.4.1 to 5.4.4 provide details of the computations. Section 5.4.5
provides the result of the analysis.
5.4.1 Defining the Traffic Group
Once the Board determines that the complainant has proven market dominance, the first step of a Full-
SAC or a Simplified-SAC case is to determine the traffic group to be analyzed. In a Full-SAC test, the
shipper has the choice of the traffic group and the issue can be subject to extensive litigation. For
Simplified-SAC, the traffic group is composed of the traffic at issue plus all traffic actually moving on the
issue traffic route. Rerouting traffic is not permissible. Instead of building a hypothetical stand-alone
railroad, the simplified-SAC test examines the real operations and services provided by the railroads to
judge the reasonableness of the rates.
For its re-examination of these cases under a Simplified-SAC test, the project team sought to determine
what the total traffic would have been at the time of the case. Because the team lacked access to the
carrier’s data, it estimated this traffic based on the case filings:
The total quarterly tonnage moved by the SARR was 15.4 million tons in 2004 (Q4).231
This
represents an annual tonnage of 61.3 million tons and annual revenues of $228.8 million.232
The SARR would move 19 million tons of rerouted traffic annually, which would account for 37%
of its total revenues.233
The revenue of the rerouted traffic was estimated at $84.6 million per
year.
To estimate the total traffic of the SARR under a Simplified-SAC presentation, the team
eliminated the rerouted traffic. Thus, the SARR would move an estimated 42.28 million tons of
total traffic, accounting for $144 million revenues in 2004.
In the WFA case, the traffic at issue was composed of 2.16 million tons of coal (fourth quarter
2004) moving from five mines in the Powder River Basin mines (Eagle Butte, Dry Fork, Caballo
231 Western Fuels, slip op. at 33. 232 To annualize, the traffic was multiplied by the (366/92) ratio as the SARR would have operate 92 days in the 2004 and the 2004 year had 366 days. 233 NOR 42088, Third Supplemental Reply Evidence of BNSF Railway Company, III-A-3 (filed Jul. 14, 2008).
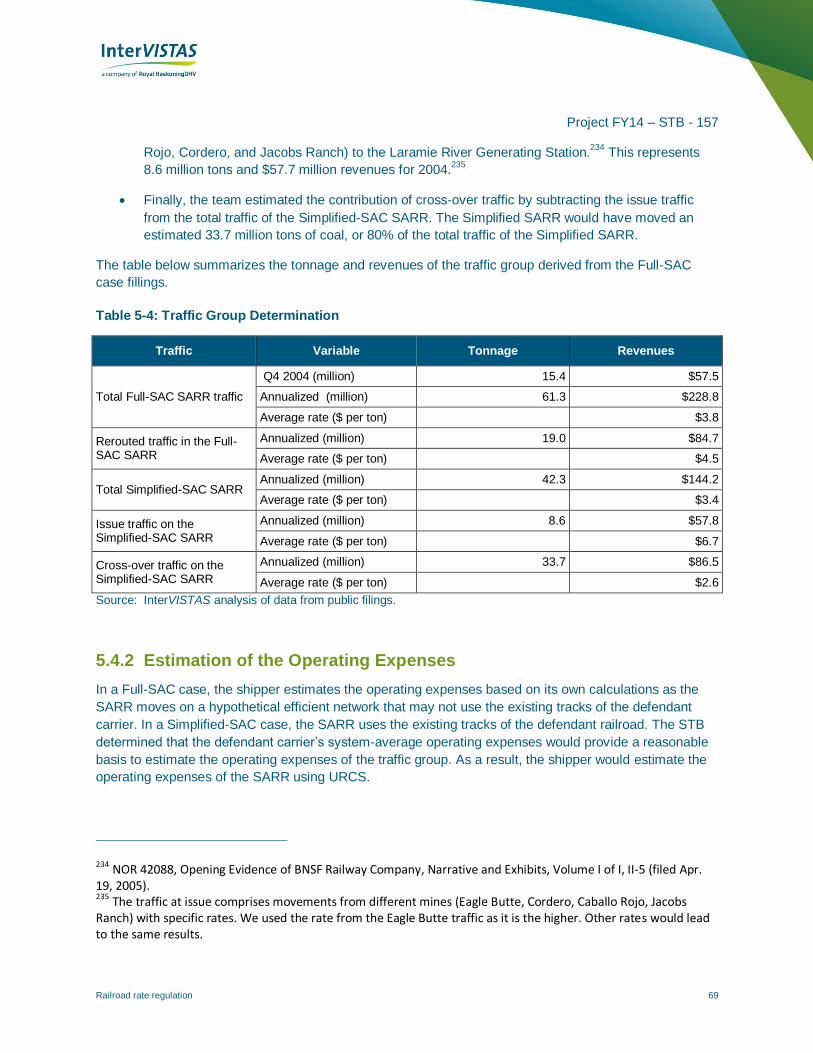
Project FY14 – STB - 157
Railroad rate regulation 69
Rojo, Cordero, and Jacobs Ranch) to the Laramie River Generating Station.234
This represents
8.6 million tons and $57.7 million revenues for 2004.235
Finally, the team estimated the contribution of cross-over traffic by subtracting the issue traffic
from the total traffic of the Simplified-SAC SARR. The Simplified SARR would have moved an
estimated 33.7 million tons of coal, or 80% of the total traffic of the Simplified SARR.
The table below summarizes the tonnage and revenues of the traffic group derived from the Full-SAC
case fillings.
Table 5-4: Traffic Group Determination
Traffic Variable Tonnage Revenues
Total Full-SAC SARR traffic
Q4 2004 (million) 15.4 $57.5
Annualized (million) 61.3 $228.8
Average rate ($ per ton) $3.8
Rerouted traffic in the Full-SAC SARR
Annualized (million) 19.0 $84.7
Average rate ($ per ton) $4.5
Total Simplified-SAC SARR Annualized (million) 42.3 $144.2
Average rate ($ per ton) $3.4
Issue traffic on the Simplified-SAC SARR
Annualized (million) 8.6 $57.8
Average rate ($ per ton) $6.7
Cross-over traffic on the Simplified-SAC SARR
Annualized (million) 33.7 $86.5
Average rate ($ per ton) $2.6
Source: InterVISTAS analysis of data from public filings.
5.4.2 Estimation of the Operating Expenses
In a Full-SAC case, the shipper estimates the operating expenses based on its own calculations as the
SARR moves on a hypothetical efficient network that may not use the existing tracks of the defendant
carrier. In a Simplified-SAC case, the SARR uses the existing tracks of the defendant railroad. The STB
determined that the defendant carrier’s system-average operating expenses would provide a reasonable
basis to estimate the operating expenses of the traffic group. As a result, the shipper would estimate the
operating expenses of the SARR using URCS.
234 NOR 42088, Opening Evidence of BNSF Railway Company, Narrative and Exhibits, Volume I of I, II-5 (filed Apr. 19, 2005). 235 The traffic at issue comprises movements from different mines (Eagle Butte, Cordero, Caballo Rojo, Jacobs Ranch) with specific rates. We used the rate from the Eagle Butte traffic as it is the higher. Other rates would lead to the same results.

Project FY14 – STB - 157
Railroad rate regulation 70
However, URCS data needs to be modified to be used in this context for two main reasons. First, URCS
includes both operating expenses and some portions of RPI. To reflect only the operating expenses and
to avoid any possible double counting, shippers would need to remove some components of URCS that
would be included in the RPI and DCF analyses. Second, URCS data needs to be modified to reflect the
total costs of moving the traffic rather than the variable costs. The Board detailed all these requirements
in the Simplified Standards.236
But because the Simplified-SAC has never been used, the modifications
were never tested.
For the purposes of the project team’s analyses, STB staff provided URCS phase II data so that the team
could apply the needed modifications. Using URCS and the characteristics of the traffic group, the team
derived the operating expenses per tons shown below in Table 5-5.
Table 5-5: Operating Expenses Estimation Using Modified URCS Data
2004 Average Dry Fork Eagle Butte
Cordero Caballo
Rojo Jacobs Ranch
Cross over
traffic
Railroad BNSF
Segment type Originate and Terminate
Distance (miles) (incl. loop track) 186 187.6 153.8 159.9 140.4 209. 5
Car type Plain gondolas
Number of cars per train 136
Car ownership Western Fuels
Commodity Coal
Tons per car 121.5 120.4 121.1 121.1 121 120
Shipment size Unit Train
Tons per car 121.5 120.4 121.1 121.1 121 120
Total cost per ton using modified URCS data 2004
$1.6 $1.7 $1.4 $1.5 $1.3 $1.8
Total annual tons in 2004 (million) $8.58 $33.7
Total estimated operating expenses (with modified URCS) (million)
$14.2 $14.3 $12.2 $12.5 $11.3 $61.7
Source: InterVISTAS analysis of data from public filings and using URCS Phase II Modified Data
The total amount was subsequently broken down by categories of operating expenses using the
percentage breakdowns from the Full-SAC cases.
5.4.3 Estimation of the Road Property Investment (RPI)
The Simplified-SAC test now requires that the shippers perform a full RPI analysis. However, the project
team did not perform such an exercise for this analysis, because of the lack of access to confidential
data. As an alternative, the team attempted to estimate the RPI of the Simplified-SAC based on past
cases. In the Xcel case, the STB developed a regression analysis based on the relationship between the
236 Simplified Standards, EP 646 (Sub No. 1), slip op. at Appendix B (STB served Sept. 4, 2007).

Project FY14 – STB - 157
Railroad rate regulation 71
road property investment and the tonnage and distance variable.237
While the STB recognized the limits
of that method’s accuracy based on the number of available observations, it is the only method available
to estimate the RPI of the Simplified-SAC in this current analysis. The project team applied the same
methodology to eight cases decided before 2006 (including the WFA Full-SAC examples).238
Based on the simple regression of the relationship between RPI and tonnage and distance, the following
parameters were estimated:
𝑅𝑜𝑎𝑑 𝑃𝑟𝑜𝑝𝑒𝑟𝑡𝑦 𝐼𝑛𝑣𝑒𝑠𝑡𝑚𝑒𝑛𝑡 = ($1.75 𝑚𝑖𝑙𝑙𝑖𝑜𝑛 × 𝑅𝑜𝑢𝑡𝑒 𝑚𝑖𝑙𝑒𝑠) + ($6.61 × 𝑇𝑜𝑛𝑠)239
By applying these parameters to the data available in the WFA case fillings; the team estimated the total
RPI of the Simplified-SAC test as $373,906,000 using Eagle Butte as point of origin. This value does not
account for the land value. Adding the land value increased the total RPI to $378,575,000. Table 5.6
presents the results after dividing the RPI by categories.
237 Xcel Energy v. BNSF, NOR 42057, slip op. at 31 (STB served Jun. 8, 2004). 238 The team eventually excluded the following cases:
• AEPCO v. BNSF (2005): No RPI analysis available; the STB did not complete the SAC analysis due to inadequate evidence.
• PPL v. BNSF (2002): The RPI analysis focused on an issue of cross-subsidies and the cost of a line expansion. • FMC v. UP (2000): This case involved minerals rather than coal and thus was not directly comparable. • McCarty Farms v. BNSF (1997): This case involved grain rather than coal and thus was not directly comparable.
239 The t-statistics for the mileage and tonnage parameters are 5.02 and 2.01, respectively. The estimated parameters are statistically significant at the 5% and 10% level.

Project FY14 – STB - 157
Railroad rate regulation 72
Table 5-6: Estimated Value of the Simplified-SAC RPI Category using Eagle Butte Point of Origin
Categories used the in DCF analysis
Value of the S-SAC based on regression to be used in the DCF
Engineering $29,902,000
Land $4,695,000
Grading $89,331,000
Tunnels $14,060,000
Bridges & Culverts $30,351,000
Ties $25,500,000
Rail and OTM $49,456,000
Ballast $30,071,000
Track Labor $46,157,000
Fences and Roadway Signs $5,005,000
Roadway Equipment $2,205,000
Roadway buildings $3,208,000
Fuel Stations $7,066,000
Shops and Enginehouses $4,025,000
Communication Systems $6,077,000
Signals & Interlockers $24,207,000
Public Improvements $7,259,600
TOTAL $378,575,000
Note: * The Land value was estimated using a simple scale ratio based on the mileage.
Source: InterVISTAS analysis based on data from public filings and STB.
5.4.4 Discounted Cash Flow Analysis
The Discounted Cash Flow (DCF) analysis was performed using the operating expenses and road
property investment presented above. For the purpose of the analysis, the team selected a single origin
point (Eagle Butte) and estimated what would have been the outcome of the Simplified-SAC test. The
DCF calculations were based on the DCF model used in the Full-SAC test. This allowed the project team
to replicate the exact parameters used at the time of the case (inflation, traffic projection, cost of capital,
depreciation schedule, etc.).
5.4.5 Results
Figure 5-3 summarizes the results of the team’s application of the Simplified-SAC compared against the
results produced in the Full-SAC test. While the magnitudes are different because of different cross-over
traffic in Simplified-SAC vs. Full SAC, the results are consistent. As with the full SAC, the estimated
Simplified-SAC results indicate that the shipper would pay more than is necessary to cover the Simplified

Project FY14 – STB - 157
Railroad rate regulation 73
SARR’s stand-alone costs. The Stand-Alone Revenues ($36.2 million) are higher than the Stand-Alone
Costs ($28.2 million).
Figure 5-3: Results of the DCF Analysis Using Eagle Butte as Point of Origin
Source: InterVISTAS analysis based on data from public filings and STB.
Both tests show that the shipper is overpaying for the
traffic at issue. In this particular case, the estimated
overpayment is higher when using the Simplified-SAC
case ($8 million) than in the Full-SAC case ($7.5
million). Interestingly, under the Simplified-SAC
scenario, WFA would benefit from all of the Powder
River Basin crossover traffic but would not have to build
some of the infrastructure farther down the line such as
the interchange yard in Northport that was built in the
Full-SAC test. Although the team’s estimations are
based on certain assumptions and projections rather
than actual data, the results suggest that WFA could
have reached the same outcome using Simplified-SAC
rather than Full-SAC.
$28,202,824
$49,989,248
$36,235,399
$57,516,506
$0
$10,000,000
$20,000,000
$30,000,000
$40,000,000
$50,000,000
$60,000,000
$70,000,000
S-SAC Test Full-SAC Test
2004 Q4 Stand-Alone Requirement 2004 Q4 Stand-Alone Revenues
While the magnitudes differ
because of different cross-over
traffic in Simplified-SAC vs. Full
SAC, the results are consistent.
As with the Full SAC, the
estimated Simplified-SAC results
indicate that the shipper would
pay more than what is necessary
to cover the Simplified SARR’s
stand-alone costs.

Project FY14 – STB - 157
Railroad rate regulation 74
5.5 Conclusions
The comparative analysis of the Full-SAC test with the Simplified SAC and Three-Benchmark methods
suggests that for these two cases (Otter Tail and WFA) all three methods would likely have led to similar
outcomes for both cases.
For WFA, both the Three-Benchmark and the Simplified-SAC found that the rate would have
been unreasonable, the same conclusion reached by the STB in its full SAC proceeding.
For Otter Tail, the Three-Benchmark procedure found that the rates were not unreasonable, the
same as the STB determined with the full SAC methodology. The Simplified-SAC was not tested
for Otter Tail as it would have required confidential data that was not available.
The project team recognizes that results from the comparison of the Simplified Standards to the Full-SAC
in only two cases is perhaps not sufficient to draw a general conclusion on the overall convergence of the
procedures. However, it provides a signal on the potential of the Simplified Standards to deliver similar
outcomes as a Full-SAC.
This key finding is perhaps not surprising, as all three methods derive from the core economic principles
of the STB’s Constrained Market Pricing.
It should also be noted that roughly thirty years after development of Full-SAC, many of the complexities
of the earlier era have evolved. Network rationalization may have reduced the importance of allowing
hypothetical routings of traffic for the Stand Alone Railroad as many of the indirect actual routings of the
past era are now more efficient. Railroads have continuously increased the efficiency of their
infrastructure and it may be more appropriate today to rely on existing efficient traffic routings rather than
on a complex hypothetical railroad. Thus the restriction on the traffic group definition in Simplified-SAC,
which limits the traffic to the existing route and does not allow rerouting of cross over traffic now may be
an effective way to further simplify a Full-SAC case. Findings of convergence of all SAC procedures to
similar outcomes would encourage small or medium shippers to use the Simplified Standards. Since the
STB removed the limits on rate relief in Simplified SAC cases, large shippers have the choice between
Simplified-SAC and a costly Full-SAC case. The latter may still be warranted when the subtle issues in
the specific case can affect the final determination. It is noted that the conclusions here are provisional
and based on only two cases. To have assurance of the convergence of the SAC procedure, it may be
useful to compare the Simplified Standards to other Full-SAC cases and identify whether they are
applicable in various situations.
Project FY14 – STB - 157
Railroad rate regulation 75
6 Alternatives to Maximum Rate Regulation:
Are There Lessons from Other Countries?
The U.S. Congress created a system of maximum rate regulation to protect captive shippers from
excessive exercise of market power by market-dominant railroads.240
This has been implemented by the
STB through its CMP regulatory framework to assess rate reasonableness, specifically the maximum
reasonable rate.241
The previous two sections of this report discussed issues associated with the implementation of CMP by
the STB, specifically the use of Full-SAC, Simplified-SAC, and the Three-Benchmark methodology. This
section examines whether there are relevant lessons from how other countries constrain excessive
exercise of market power by rail carriers. It also looks at methodologies used by regulators in other utility
sectors, including one concept that has been proposed but is not yet extensively implemented.
6.1 Constraining Rail Rates in Canada
Maximum Rate Regulation until 1987. Until 1987, Canada had a provision for maximum rate regulation
of railway services. However; over the decades, this provision was only used once by a shipper, and the
regulator never made a ruling in the case.
Final Offer Arbitration (FOA). The National Transportation Act of 1987 replaced the maximum rate
regulation provision with a regulatory system that relies primarily on commercial negotiation of contracts
between carriers and shippers to constrain rates backstopped by commercial arbitration of railway
rates.242
A shipper that is dissatisfied with a rate charged by a carrier may apply to the Agency (currently
the Canada Transportation Agency) to designate a third-party commercial arbitrator to choose the final
rate/service offer of either the carrier or the shipper. The arbitrator can choose one offer or the other but
cannot create any other rate (such as splitting the difference). Decisions made by the arbitrator are not
240 We use the term “excessive exercise of market power” as some use of pricing power will be required for a railroad to cover its fixed costs (unless government is willing to provide subsidy for the fixed costs, as is done frequently in Europe). 241
The statute uses the term “reasonable,” 49 U.S.C. § 10701(a). The statute refers to the STB prescribing a ‘maximum reasonable’ rate, and prohibits the railroad from charging the shipper any rate higher than the prescribed rate. 49 U.S.C. § 10704(a)(1). 242 Originally, certain shippers were excluded from access to the FOA remedy for rail shippers, primarily for shippers of certain grains in Western Canada which were covered by provisions of the Western Grain Transportation Act (WGTA). In 1996, these shippers received access to FOA when the WGTA was repealed and replaced with a volume-related revenue cap on payments to railways for shipments of these grains. The Act requires the arbitrator to assess whether the shipper in arbitration has “alternative, effective, adequate and competitive means of transport goods, implying that where markets work, they should be left to work.” Transport Canada, Vision and Balance: Report of the Canadian Transportation Act Review Panel (2001), 71, http://publications.gc.ca/site/eng/9.648223/publication.html. We note that there is some ambiguity here, as it is the arbitrator, not the Agency, who is to determine whether there is an effective alternative means of transport, yet the arbitrator is to choose one of the offers. Presumably this means that in such a case the arbitrator would choose the carrier’s offer, but as there are no reasons given by the arbitrator for her/his decision, this is not clear.

Project FY14 – STB - 157
Railroad rate regulation 76
made public, and reasons are not given by the arbitrator to either the parties (carrier and shipper) or to
the government.
Rates established by an FOA are set for one year, after which the carrier may establish a different rate,
which in turn could be subject to FOA. Repeated FOAs are not unknown in Canada rail transport.
It is our opinion that the non-transparent final offer
arbitration process used in Canada to constrain undue
exercise of any market power by railways provides no
guidance for alternatives to SAC. It may be that the
methodologies put forward by one party or the other in
the arbitrations could provide insight, but as the
process is confidential, no guidance can be provided.
Interswitching. Canada does have an access
provision which is reviewed here. In 1904, the
Canadian Parliament established an interswitching
regime, which required the originating carrier for a
specific shipper to pick up and switch a shipment to
another carrier’s line if the switching distance was four
miles (6.4 kilometers) or less.243
(A similar provision
applies for the terminating carrier.) This distance is
referred to as Zone 1 interswitching, In 1987 the
interswitching limit was increased to 18.6 miles (30
kilometers) by provision for Zones 2-4 interswitching.244
More recently, a 5th interswitching zone was
created,245
but is set to expire in August 2016.246
Zone 5 was created to deal with some challenges
affecting the transportation of certain western grains when there was a combination of an all-time record
grain crop and an artic vortex that had the effect of reducing system capacity in west.
The Canada Transportation Agency annually establishes rates for interswitching services. The current
methodology is based on a systemwide average variable cost per ton-mile,247
with a 20% mark-up. Some
important points can be made:
243 The distance is measured along the line of the originating or terminating carrier to an interchange point. 244 The National Transportation Act, 1987, s. 152 (2) established the 30 kilometer distance. S. 152 (4) of the Act gave the Agency the authority to set rates within this limit that varies by distance zone. The Agency established four zones in s. 7 (2) of the Railway Interswitching Regulations, SOR/88-41, 17 December 1987. 245 Fair Rail for Grain Farmers Act was granted Royal Assent on May 29, 2014. Zone 5 is defined only for the Provinces of Alberta, Saskatchewan and Manitoba, and covers shipping distances from 30 to 160 kilometers (18.6 to 99.4 miles). 246 The federal government elected in October 2015 indicated that it would seek to postpone the expiration of the extended interswitching provisions. (Government of Canada News Release, “Government of Canada intends to work with Parliament to extend certain provisions for rail in the Canada Transportation Act, April 22, 2016.) 247 In Canada, per tonne kilometer.
It is our opinion that the non-transparent
final offer arbitration process used in
Canada to constrain undue exercise of
any market power by railways provides
no guidance for alternatives to SAC. It
may be that the methodologies put
forward by one party or the other in the
arbitrations could provide insight, but as
the process is confidential, no guidance
can be provided.

Project FY14 – STB - 157
Railroad rate regulation 77
The distances for which the interswitching rate are short (only up to 18.6 miles except for the
temporary provision for Zone 5) and thus errors in establishing this rate will be proportionately
smaller than for the distance of an entire shipment being evaluated in the U.S. using SAC.
The Canada Transportation Act Review Panel described the interswitching provisions as “an
anomaly” and recommended against any extension of interswitching provisions. “In the Panel’s
view, extending the interswitching limits would worsen the market distorting aspects of the
interswitching rate regime and would be a
step backward.”248
This methodology is a distance-based rate. It
perhaps should not be described as a fully allocated
cost methodology since the rate is not compensatory
in that the mark-up is insufficient to cover the
average ratio of fixed to variable costs of the Class I
Railways.
Given that the STB rejected use of distance-based
fully allocated cost as a basis for maximum rate
regulation, it is our opinion that the Canadian
methodology used to establish short distance
interswitching rates provides no insight for the STB
on potential revision to or replacement of SAC.
Also note that the interswitching “rate” is not a rate paid by a shipper to a carrier. It is an access fee, paid
by one carrier to another, for services over a very short distance and a short portion of almost all origin-
destination traffic.
Competitive Line Rates (CLRs). One other provision that Canada put in place in 1986 was to allow a
shipper to seek a CLR. The distance over which interswitching access to another carrier is available to a
shipper is short. CLRs allow a shipper served directly by only one carrier and located outside the
interswitching zones, to obtain a regulated rate on the originating carrier over a longer distance from
origin to the closest interchange point with another railway (which would complete the origin-destination
movement).249
To be eligible for a CLR rate determination by the Agency, the shipper must first have a
service and rate agreement with the connecting carrier that will complete the movement. Very few CLR
cases have been heard by the Agency.
248 Transport Canada, Vision and Balance, 63. 249 There are some restrictions on access to CLRs. They are not applicable to containers, trailer-on-flatcar, and less- than-carload traffic unless originating/terminating with a maritime carrier. They can only be used when the originating carrier haul is less than half the total distance and is less than 1,200 kilometers (746 miles). The shipper using a CLR is not eligible for FOA.
Given that the STB rejected use of
distance-based fully allocated cost as a
basis for maximum rate regulation, it is
our opinion that the Canadian
methodology used to establish short
distance interswitching rates provides no
insight for the STB on potential revision
to or replacement of SAC.

Project FY14 – STB - 157
Railroad rate regulation 78
The methodology for establishing the CLR rate is not cost-based, but rather based on the originating
carrier’s system average revenue per ton-mile for similar traffic.250
The rate must cover variable costs, but
there is no requirement that the rate makes an adequate contribution to the carrier’s fixed cost. This is
especially problematic if the carrier is earning an inadequate return on invested capital, as the CLR will
then merely embed non-compensatory rate (in a total cost sense) onto additional traffic. CLRs are
effective for only one year.
It is our opinion that the Canadian methodology for
establishing a Competitive Line Rate for a portion of
a shipper’s movement provides no insight for the
STB on potential revision to or replacement of SAC.
It is a methodology based on system average
revenues, not costs, and will embed revenue
inadequacy, and conversely could embed above
normal returns for a carrier.
Efficient Component Pricing Rule and Access
Fees. Broadly speaking, the Efficient Component
Pricing Rule (ECPR) is a form of an access regime
in which a new entrant pays the incumbent only for
access to those components of the incumbent’s
network needed to establish service. The challenge
of pricing access to those components is to set the
price at a point that encourages and enables
competition while not unfairly penalizing the incumbent financially. (The next chapter discusses ECPR in
more detail as it has been applied to the U.S. telecommunications industry.)
Neither Canadian legislation nor the Canada Transportation Agency has used ECPR, but the 2001
Canada Transportation Act Review Panel did consider it. The Panel recognized ECPR as a methodology
to set an access fee paid by one carrier to another and not a rate paid by a shipper to a carrier.
Nevertheless it recognized the potential use of ECPR methodology, should Canada adopt a more
extensive access regime. As well, while not a specific recommendation, the Panel did indicate that stand-
alone cost is a possible maximum rate regulation
methodology.
The Panel stated “… competitive access must retain
elements of differential pricing while permitting
additional competition. Although it could be
complex, the Panel sees no alternative to requiring
a commodity- or traffic-based access charge, where
the access fee bears some relation to the existing
revenue contribution of the traffic that is subject to
competitive entry. This would approach the ECPR
250 The formula uses the interswitching rate for the first 30 kilometers and then uses the average revenue per ton-mile for the remaining distance.
It is our opinion that the Canadian
methodology for establishing a
Competitive Line Rate for a portion of a
shipper’s movement provides no insight
for the STB on potential revision to or
replacement of SAC. It is a methodology
based on system average revenues, not
costs, and will embed revenue
inadequacy, and conversely could embed
above normal returns for a carrier.
The Canada Transportation Act Review
Panel, while not a specific
recommendation, did indicate that stand-
alone cost is a possible maximum rate
regulation methodology.

Project FY14 – STB - 157
Railroad rate regulation 79
rule but need not conform exactly.”251
The panel then goes on to point out that the ECPR rate may be too
high as it does not consider whether the carrier is as efficient as possible. Note that the consideration of
efficiency is an important element of CMP and of SAC in particular. Interestingly, the Panel concludes by
stating: “The Agency could also make use of the stand-alone cost test to deal with the issue of excessive
mark-ups.”
6.2 The UK – Access Charges for Freight
In contrast to the structure of the industry in the U.S. and Canada where carriers are vertically integrated
(i.e., they build and maintain their own track and operate trains on those tracks), the situation in the
United Kingdom, and to a lesser extent Australia, is quite different. In both of those countries, the
industry is characterized by vertically separated track and train operations.
In the UK, there is a nationalized track company, Network Rail,252
and a number of competing “above-the-
rail” operators (i.e., train operators such as Great Western, Virgin Trains, London Midland, First ScotRail,
etc.). Rail regulation is the responsibility of the Office of Rail and Road (ORR), formerly the Office of Rail
Regulation.253
Network Rail is the owner, operator and infrastructure manager of Britain's main railway
network. It runs, maintains and develops the core physical infrastructure of the network and has to ensure
efficient management of the assets over the short, medium and long-term. Network Rail retains
responsibility for the ownership and stewardship of its network. It is accountable to its customers and
funded through a combination of access revenue paid by the train operating companies and government
grants. It operates under license to the U.K. government, and is accountable to the ORR, Parliament,
and the Secretary of State for Transport.254
The ORR conducts a review of Network Rail every five years
to determine the level of government subsidy for the following five years. In 2013-2014, Network Rail
incurred costs of £6.2 billion (about US$9.4 billion), of which £3.7 billion (US$5.6 billion) came from
government and the remaining £2.4 billion (US$3.7 billion) from operator access charges.255
The above the rail train operators seeking access to Network Rail track ‘windows’ to run freight trains
must apply to the ORR for a track access agreement. These agreements cover multiple issues, including
standards of performance, operation and maintenance of trains, liability, track charges, and other fees.
The complexity of these agreements leads to lengthy contracts, such as the redacted agreement between
251 Transport Canada, Vision and Balance, 84.
252 When British Rail was broken up into dozens of separate companies, the track was embodied in a private sector, for-profit company called Railtrack. This company experienced major financial difficulty and was eventually re-nationalized as Network Rail. The latter is heavily subsidized by the U.K. government and to some extent by local governments. 253 The ORR was renamed on 1 April 2015, absorbing both the responsibilities of the former Office or Rail Regulation (established on 5 July 2004 by the Railways and Transport Safety Act 2003) and responsibility for monitoring highways. The ORR replaced the earlier Rail Regulator. 254
The United Kingdom reclassified Network Rail as an “arm’s-length central government body” in 2014. As such, it retains the commercial and operational freedom to manage Britain’s railway infrastructure, but within government regulatory and control frameworks. 255 The remainder came from income from property, retail operations at stations, freight, and other customers. It should be noted that government also provides a small subsidy to the train operators as well. These amounts assume an exchange rate of 1.51 U.S. dollars per U.K. pound, as of December 6, 2015.

Project FY14 – STB - 157
Railroad rate regulation 80
the Chiltern Railway Company and Network Rail,256
dated February 5, 2004, which is 395 pages in length
and has subsequently been amended by 112 Supplemental Agreements.
ORR Determination of the Revenue Requirement. The ORR methodology first focuses largely on
determining:
A gross revenue requirement for Network Rail, based on its costs;
The amount to be contributed by government to the gross revenue requirement;
The residual, which is the revenue Network Rail may generate from access charges; and
The gross revenue requirement is forward looking, typically estimated based on expected costs
for the coming five years.
Note that there is similarity with several SAC principles: a revenue requirement based on costs and costs
estimated on a forward-looking basis.
Network Rail Access Charges for Freight Train Operators. For freight access charges, Network Rail
has some freedom to set charges on individual operators, but within a framework approved by ORR.
Some key aspects of the framework are:
Freight access charges must cover variable costs imposed on the system by a freight operation;
For freight operators, some contribution above variable cost is expected;
That contribution is demand-based and differential. Some operators will make smaller
contributions than others. A specific principle is that rates for a particular operator must not be so
high that the traffic moves off the system. (But traffic that cannot cover variable costs is not
expected to be retained); and
There is no expectation that revenues collected by Network Rail will cover its total costs.
The ORR and Network Rail use a complex two-part tariff for access charges. The above-the-rail freight
operator pays Network Rail:257
A fixed track access charge for each train slot used to run a train; and
A variable access charge that depends on weight and distance (charge is effectively per revenue
ton-mile) and where the rate varies by commodity type.258
256 Chiltern Railways is owned by Arriva UK trains, which owns another seven above-the rail-operators. Each is required to have its own access agreement with ORR. 257 This description generally characterizes the Network Rail charges. There are special charges for use of electricity (to distinguish from diesel-electric motive power), where the above the rail operator provides the fuel/energy, some premiums for peak time slots, special charges for locomotive gross ton miles, etc. 258 The complete list of Network Rail charges can be found at: http://www.networkrail.co.uk/using-our-network/cp5-access-charges/
Project FY14 – STB - 157
Railroad rate regulation 81
Thus, the UK uses a form of demand-based differential pricing for access by the above the rail operators.
This is a form of Ramsey pricing.259
ORR use of SAC. It is worth noting that in its early years, ORR did develop stand-alone cost measures
with the intent of judging track access charges against stand-alone cost. SAC was viewed as a maximum
rate level, above which any price of track access would be judged to be unreasonable. While the ORR
measured SAC, it was never actually used for a
regulatory determination. The SAC was found to be much
higher than the rates being charged by Network Rail’s
predecessor, Railtrack. Hence, there was no need to use
these rates as a maximum rate benchmark against
Railtrack.
Assessment. Our view is that the UK approach to
determining access charges is of limited relevance to the
U.S. It is for a regime where there is a nationalized track
operator which is heavily subsidized. There is no
regulation of rates paid by the shipper to the freight
carrier, only regulation of access charges. Stand-alone
cost was once used to assess maximum track access
rates, but found irrelevant as SAC rates were well above
the subsidized rates. There is no revenue adequacy
requirement. However; the regulator guides rail rates
based on Ramsey pricing principles, albeit with a large
subsidy. Demand- based differential prices are set with
different commodities paying different rates. Access rates
are two- part tariffs with one rate for access to network
‘window’ or slot, and a second rate paid based on gross
ton-miles.
The UK approach is overly prescriptive, involves a high
degree of government oversight and management, does
not seek to cover the full costs of the infrastructure, and
relies heavily on government subsidy to make the track
operator whole.
Note that the UK is currently considering a major reform of Network Rail. The Shaw Report, released in
November 2015, is considering what could be another major change in the structure of the UK rail
259 While Ramsey pricing is often characterized as setting economic welfare maximizing prices subject to a breakeven constraint, the methodology is also applicable for any revenue target. ORR sets a locked-in revenue target for Network Rail by forward estimating its total costs and then determining an amount of subsidy, with the remainder to be recovered from traffic.
Our view is that the U.K. approach to determining access charges is of
limited relevance to the U.S.
It is for a regime where there is a nationalized track operator which is
heavily subsidized.
There is no regulation of rates paid by the shipper to the freight carrier, only
regulation of access charges.
Stand-alone cost was once used to assess maximum track access rates,
but found irrelevant as SAC rates were well above the subsidized rates.
There is no revenue adequacy requirement.
Access rates are two-part tariffs with one rate for access to network ‘window’ or slot, and a second rate paid based
on gross ton-miles.

Project FY14 – STB - 157
Railroad rate regulation 82
industry, including the option of returning to the regime first put in place for Railtrack.260
The potential
regime would no longer subsidize Network Rail. Instead, above-the-rail train operators will be subsidized
to enable a major increase in access charges to allow Network Rail to become revenue-adequate (self-
sufficient). Details are lacking at this point, as the review is still underway as this report is written. In any
event, this is merely a possibility and not current UK policy.
6.3 Australia – Access Charges
The Regime. Australia, like the U.S. and Canada, has a rail industry largely focused on freight transport.
In terms of industry structure, Australia’s rail system is similar to that found in the UK. The majority of the
interstate rail network is owned or leased by the vertically separated Australian Rail Track Corporation
(ARTC), whose shares are owned by the Australian government. State owned railways or private above-
the-rail train operators lease train windows on ARTC to
operate trains. Access charges of ARTC can be
regulated by the Australia Competition and Consumer
Commission (ACCC) upon “declaration” of a specific rail
service by the minister responsible for Transport.261
The Australian situation, however, is complicated by the
fact that in addition to the federal access regime with
vertical separation of track from train operations, there
are separate access regimes operated by each
Australian state for access to publicly owned, vertically
integrated intra-state rail lines. State regulators are
responsible for regulation of access fees paid by above-
the-rail operators in such situations.
ARTC. Like Network Rail in the U.K., the ARTC sells
access to its network to above-the-rail train operators.
Operators are assessed a two-part access charge. The
first part is a fixed charge that gives operators access to the network. The second part is a variable
charge that is based on a distance-weight measure (thousand gross ton-miles operated). The pricing
principle is that charges (sum of a fixed access charge and variable charges) should not be above the
efficient total cost of providing the service, including a normal rate of return on efficient investment. This
becomes a stand-alone, maximum-rate threshold when a single shipper is involved in a dispute. The use
of a two-part tariff also allows the track owner to better achieve economic efficiency than would be
possible under a fully allocated cost approach. The fixed network access component contributes to fixed
costs of the network, potentially allowing a lower variable charge, closer to the incremental costs
associated with the operation of one additional train. There are operational advantages to the two-part
tariff as well: Because the fixed charge per train operated is relatively large, operators are incentivized to
260 One of the motivations for a major change is that Network Rail has recently been classified as a government corporation, meaning its debt is now part of the U.K. national debt. Re-privatization would remove Network Rail debt from the government tally. 261 Currently the transport portfolio is the responsibility of the Minister of Infrastructure and Regional Development.
Like the U.S. and Canada, Australia’s
rail industry is focused on freight
transport.
However, like the U.K. it has vertically
separated the interstate track network
into a federally owned track company.
Vertically integrated state railways
must provide access to their track.
Project FY14 – STB - 157
Railroad rate regulation 83
operate fewer, but longer, trains. This results in more efficient use of track than running numerous shorter
trains, and incentivizes the track provider to ensure the infrastructure can accommodate long trains.
Although ARTC operates on a commercial basis, Australia’s rail infrastructure is subsidized. For the year
ended 30 June 2015, direct government grants to ARTC amounted to about 6% of total revenues for the
year. In addition, federal and state governments frequently make investments in rail infrastructure that
flow through ARTC. Between 2013-14 and 2018-19 the Australian government budgeted almost AUS$2.2
billion (about US$1.6 billion) for rail infrastructure262
projects.263
While ARTC is subsidized, its rates are set with an expectation of reasonable profits on its investments.
Like the U.S. and Canada, regulation is applied only in cases of a specific dispute. It is not an all-
encompassing regulation of all the charges to all shippers served by ARTC. A complaining above-the-rail
operator must first obtain ‘designation’ from the Minister, after which the ACCC will investigate and
regulate. A rate dispute can involve a single above-the-rail transportation service or it may involve
several. For example, there is a current regulatory undertaking involving track access charges for track
used by most of the coal mines in the Hunter Valley in New South Wales.264
The maximum-rate concept is a stand-alone cost concept:
“…Access revenue from any Access Holders or group of Access Holders must not exceed the
Economic Cost of those Segments, on a stand-alone basis… ”265
The ACCC regulates via an arbitration process, with the goal being the execution of an undertaking
between the ARTC, the above the rail operator(s) and the ACCC. Undertakings typically have a five-year
life and are renewable upon review. The governing legislation posits that access charges should cover
the efficient costs of providing the track services, including a return on investment; allow multipart tariffs (a
fixed access plus a rate per ton-mile); and allow differential pricing when it aids economic efficiency.266
As
an example of the allowed differential pricing, in the Hunter Valley decision prices would be adjusted for
262 The list of rail investments can be found at: http://investment.infrastructure.gov.au/publications/policies/pdf/Infrastructure_Omnibus_May2015.pdf 263 These amounts assume an exchange rate of 1.36 Australian dollars per U.S. dollar, as of December 6, 2015. 264 See Australian Rail Track Corp., 2016 Hunter Valley Coal Network Access Undertaking, Application filed with Australian Competition & Consumer Comm’n, Dec. 23, 2015, https://www.accc.gov.au/regulated-infrastructure/rail/hunter-valley-access-undertaking-2016/undertaking-application . 265 Australian Rail Track Corp. “Hunter Valley Coal Network Access Undertaking 2014 Compliance Assessment Submission To Australian Competition & Consumer Commission by ARTC”, April 2015, Public Version, 22, https://www.accc.gov.au/regulated-infrastructure/rail/annual-compliance-assessment-2014/compliance-submission . 266 Australian Competition and Consumer Commission, “Decision In Relation to Australian Rail Track Corporation’s Hunter Valley Rail Network Undertaking” June 29, 2011, https://www.accc.gov.au/regulated-infrastructure/rail/hunter-valley-access-undertaking-2011 .

Project FY14 – STB - 157
Railroad rate regulation 84
coal exporters using the line, but other (especially non-coal) customers would not have their pricing
change. The non-coal prices were generally below cost recovery levels due to market conditions.267
A review of the Hunter Valley Undertaking indicates that the process took a little over two years to reach a
final decision by the ACCC. This does not count the time prior to the initial application where the parties
negotiated the draft undertaking. Like SAC, there is a long list of issues to be addressed from defining the
network and the level of investment required, determining efficient train configuration, attribution of
revenues from non-coal shippers not involved in the undertaking, etc. There are 12 major headings for
issues to be addressed, with the list of “other issues” comprising 88 individual assessments/decisions.
Access to track of vertically integrated state railways. For above-the-rail operations on the track of
the vertically integrated State-regulated railway companies, regulation of access charges paid by
competing above the rail operators is generally composed of:
A pricing floor that is based on incremental costs;
A pricing ceiling that is based on the full economic cost of providing access including a return on
capital; and
Market-based negotiations, which take place within this wide floor-ceiling band. 268
The band set by the floor and ceiling may be quite broad, allowing considerable room for negotiations.
The infrastructure provider has scope to utilize differential pricing and seek prices based on shippers’
willingness or ability to pay. Rates for bulk commodities (coal and ores) are generally closer to ceiling
prices, although the Australia Productivity Commission notes that there can be constraint from “sea
transport” (meaning source of supply competition).269
The Commission notes that there are differences in
access rate regulations between the individual states and that such inconsistency can have negative
consequences for economic efficiency. The Commission recommends flexibility between using
depreciated historical costs and replacement costs. The main reason is that if there are major cost
reducing technologies in development, use of the latter might lead to stranded assets and disincentives to
invest. The Commission noted that this has been a problem in the telecommunications sector. Price
discrimination is used in the federal and state regimes as a means to improve revenue adequacy so that
fixed costs are covered in the face of some rail shippers being price sensitive due to competitive
alternatives from road (i.e. trucking).
Comments on access regimes and revenue adequacy. It is worthwhile noting a comment made by the
Australian Productivity Commission regarding rail access pricing and its consequences.270
The
Commission cautions that access regimes could undermine economic efficiency and revenue adequacy.
It is supportive of differential pricing of track access.
267 See Australia Rail Track Corp, “ARTC Application – HVAU – Rate of Return Proposal (Public Version),” filed 23 June 2011, https://www.accc.gov.au/regulated-infrastructure/rail/hunter-valley-access-undertaking-2011/undertaking-application . 268 Bureau of Transport and Regional Economics (BTRE), Rail Infrastructure Pricing: Principles and Practice, Report 109 (Canberra ACT: BTRE, 2003), 134. 269 Ibid., 135. 270 The Productivity Commission is the Australian Government's independent research and advisory body on a range of economic, social and environmental issues affecting the welfare of Australians.

Project FY14 – STB - 157
Railroad rate regulation 85
Vertical separation and access regulation, designed to encourage above-rail competition, can
constrain scope for efficient price discrimination across users and impede efficient investment,
potentially reducing the long-run viability of some lines. While COAG’s decision to promote
national consistency and coordination in rail access regimes is a welcome advance, the
Commission considers that there is scope to wind back access regulation where vertically
separated below-rail operators face strong competition from road (or, indeed, sea) freight. Nor
should efficient price discrimination by below-rail operators be discouraged. Given the mixed
success of vertical separation in encouraging above-rail competition, there should be an
independent examination of whether allowing vertical reintegration of those rail lines or networks
which face strong intermodal competition would promote their commercial viability.271
The Commission went on to comment about the desirability of Ramsey pricing principles:
Prices set to recover each mode’s total costs, reflecting Ramsey pricing principles to the extent
possible, have the potential to promote efficient use of road and rail freight infrastructure, as well
as meeting a self-financing requirement. More specifically, while users should be required to
cover at least the attributable costs of their infrastructure use, their contribution to (unattributable)
fixed or common costs should be inversely related to the price responsiveness of their demand
for the services provided, so as to minimize efficiency losses from discouraged consumption.272
Assessment. Australia uses an access regime for rail rates. For interstate services, there is vertical
separation into a subsidized federal government-owned track company and competing independent
above-the-rail train operators. There is no regulation of rates paid by shippers, but there is provision to
regulate track access charges paid by the train operator to the track company. Maximum rate regulation
is guided by stand-alone cost principles for a single shipper or a group of shippers. The regulation
process is multiyear and involves a myriad of steps and decisions. Retrospective caution has been
offered about access regimes potentially undermining
revenue adequacy and investment.
It is our assessment that, if anything, the Australian
experience reinforces some of the key economic
principles underlying the STB’s CMP, while providing no
insight for simplification of the SAC methodology.
Note that, like the U.K., the Australian government has
announced it will be conducting a policy review of ARTC,
possibly including its privatization. At the time this report
was written, the review was underway, and no new policy
has been announced.
271 Productivity Commission, Road and Rail Freight Infrastructure Pricing, Inquiry Overview No. 41, 22 December 2006, xlvi, http://www.pc.gov.au/inquiries/completed/freight/report. COAG refers to the Council of Australian Governments. 272 Ibid., 60.
It is our assessment that the Australian
experience reinforces some of the key
economic principles underlying the
STB’s CMP, while providing no insight
for simplification of the SAC
methodology.

Project FY14 – STB - 157
Railroad rate regulation 86
7 Maximum Rate Methodologies from Other
Regulated Industries
Having considered how other nations limit rail freight rates, the report now turns to regulatory approaches
used in other sectors.
7.1 Rate-Base Rate-of-Return and Price Cap Regulation Are Not
Appropriate for U.S. Rail Transport
Comprehensive rate regulation approaches, such as rate-base rate-of-return (RBROR) or price cap, are
widely used in a number of utility sectors. These approaches regulate all rates paid by all customers of a
utility directly (for RBROR) or indirectly (for Price Cap). However, these approaches would not be
consistent with current U.S. rail legislation which regulates by exception, relying as much as possible on
market forces and commercial negotiation to establish freight rates.
This report instead focuses on methodologies used to determine a maximum rate threshold applicable to
a single customer upon complaint. Two potential approaches were identified. The first is a regulatory
approach sometimes used in the U.S. for telecommunications -- Total Element Long Run Incremental
Cost (TELRIC). The second approach considered is one that has been suggested for use in other sectors
as well as for rail: the Efficient Component Pricing Rule (ECPR).
Bothe TELRIC and ECPR are maximum rates methodologies for network industries, but they are
methodologies for limiting charges for access to the network. Neither is designed as a methodology for
limiting rates paid by end customers (the shipper in the railroad industry) to the service provider (the
railroad). Nevertheless, some have proposed use of one or the other of these methodologies as an
alternative for limiting rail rates.273
Nevertheless, ECPR, at least, has been touted as an alternative for
limiting rail rates. We consider in this chapter whether the underlying regulatory pricing principles could be
applied to rail rates paid by shippers as a simpler alternative to CMP.
7.2 Structural (Access) vs. Conduct (Rates) Regulation
When there is unreasonable exercise of market power, two forms of regulation are available: structural
regulation and conduct regulation.274
Structural Regulation – Access. Essentially, structural regulation seeks to address the market
power problem by creating or preserving competition. Competition can be preserved by regulating
mergers and acquisitions. New competition can be encouraged by breaking up large corporations
273 See, for example, Baumol, William J. and J. Gregory Sidak, The Pricing of Inputs Sold to Competitors, 11 Yale J. on
Regulation 171(1994); Kahn, Alfred E. and William E. Taylor, Pricing of Inputs Sold to Competitors: A Comment, 11 Yale J. of Regulation 225 (1994). 274 Valletti, Tommaso M. and Antonio Estache, “The Theory of Access Pricing: An Overview for Infrastructure Regulators,” World Bank Policy Research Working Papers 2133, (1999), http://elibrary.worldbank.org/doi/abs/10.1596/1813-9450-2097.

Project FY14 – STB - 157
Railroad rate regulation 87
into smaller ones, removing barriers to entry through government-mandated access or other
means(e.g., by providing access to a bottleneck resource), by limiting entry into different lines of
business (e.g., preventing rail track owners from operating trains as is the case in the U.K.,
Australia, and some other jurisdictions), etc.
Conduct regulation. Conduct regulation principally involves pricing levels and pricing structure.
The regulator accepts that there is limited competition for a particular service and sets rates, or
establishes maximum rates that can be charged by a carrier.
The STB’s CMP, including SAC, is a form of conduct regulation. It establishes maximum rates that a
carrier can charge an end user (a shipper) when the carrier is found to have market dominance. By
contrast, rail regulators in the U.K. and Australia do not regulate rates paid by shippers. Instead they use
structural regulation by providing access to track to competing above-the-rail train operators. In some
U.S. utility sectors, especially telecommunications, structural regulation is used, including provisions to
grant access to new competitors to an incumbent’s network.
While structural regulation removes the need to regulate prices paid by end users (shippers), there is still
a need to regulate the access price paid by a competing carrier for access to an incumbent’s network.
Thus, structural regulation involving government-mandated or voluntary access imposes two regulatory
tasks on the regulator: (a) establish regulations and processes for granting access, and (b) establishing a
regulated access price.
The balance of this chapter looks at the latter: what methodologies a regulator can use to set access
prices. The chapter examines the approaches used by the Federal Energy Regulatory Commission to set
rates for regulated electric transmission and natural gas transportation and offers opinions about the
suitability of these approaches to freight rail. The chapter also examines access regulation as
implemented by the Federal Communications Commission under the Telecommunications Act of 1996,
including the “TELRIC” access-costing methodology used to establish access rates and discusses an
alternative access pricing methodology known as ECPR – proposed by some for use in the US railroad
sector.
7.3 Overview of Federal Regulation of Electricity Transmission
and Gas Pipeline Transportation Rates and Service
The Congress determined that federal regulation of interstate electric energy transmission and its sale at
wholesale is necessary in the public interest in the Federal Power Act (FPA).275
The Federal Energy
Regulatory Commission (FERC or the Commission) is the independent federal agency that has exclusive
jurisdiction to regulate the "transmission of electric energy in interstate commerce,” the "sale of electric
energy at wholesale in interstate commerce,” and "all facilities for such transmission or sale of electric
energy.”276
Sales “at wholesale” historically were understood to be sales of electricity between electric
utilities across state lines, which the Supreme Court had held in 1927 were not subject to regulation by
275 Federal Power Act of 1935, § 201(a), 16 U.S.C. § 824(a). 276 16 U.S.C. §824(b)(1). FERC was established in 1977 in the Department of Energy Organization Act (91 Stat. 565; 42 U.S. §7101). The predecessor regulator was the Federal Power Commission, which had originally been established in 1920 to coordinate hydroelectric projects under federal control.

Project FY14 – STB - 157
Railroad rate regulation 88
the states as a direct burden on interstate commerce prohibited by the “Commerce Clause” of the U.S.
Constitution and could only be regulated by “the exercise of the power vested in Congress.”277
FERC’s authority to regulate interstate electricity transmission and jurisdictional “sales at wholesale” is
derived primarily from Sections 205 and 206 of the FPA.278
Section 205 provides that all rates and charges for the interstate transmission of electric energy
and for jurisdictional sales must be “just and reasonable” and that “any such rate or charge that is
not just and reasonable is hereby declared to be unlawful.” Further, “[n]o public utility shall, with
respect to any transmission or sale . . . subject any person to any undue prejudice or
disadvantage.”279
Further, Section 205 requires regulated companies to establish their rates,
terms and conditions for jurisdictional services in public tariffs. Regulated electric utilities must
file with the Commission to increase their rates or change other terms and conditions of service;
the Commission may order a hearing to determine whether the changes are just and reasonable,
suspend the changes for nine months, and permit them to go into effect subject to refund and the
outcome of the hearing.280
Section 206 permits FERC to make changes to existing utility rates, terms and conditions,
including transmission charges, either on its own initiative or upon complaint. In order to make
such changes, FERC must (1) find that the existing rates or practices are unjust, unreasonable,
unduly discriminatory, or preferential; and (2) show that its proposed changes are just and
reasonable.281
FERC’s authority to regulate interstate natural gas pipeline transportation rates and services stems from
the Natural Gas Act of 1938 (NGA).282
Federal regulation was deemed necessary due to concern over
the structure of the natural gas pipeline industry and its monopolistic tendencies to charge higher than
competitive prices due to market power.283
Similar to sections 205 and 206 of the Federal Power Act,
sections 4 and 5 of the Natural Gas Act gave the Commission the authority to regulate the rates, terms
and conditions of interstate “sales for resale” of natural gas and the transportation of natural gas in
interstate commerce under the “just and reasonable” standard.284
Unlike the Federal Power Act,
Congress also gave the Commission broad authority in section 7 of the NGA to approve the
commencement and termination of service contracts and the construction and abandonment of pipeline
facilities.285
Federal regulation under the NGA did not extend to the intrastate market. Unregulated intrastate markets
developed in Texas, Louisiana, Oklahoma and other gas producing states, especially after the Supreme
Court, in 1954, extended federal regulation to the wellhead by holding that gas sales by producers to
277 Pub. Util. Comm’n of R.I. v. Attleboro Steam Generating Co., 283 U.S. 83, 89-90 (1927). 278 16 U.S.C. §§ 824d, 824e 279 16 U.S.C. § 824d(a),(b). 280
16 U.S.C. § 824d(c)-(e). 281 See, for example, Atlantic City Electric Co. v. FERC, 295 F.3d 1, 9 (D.C. Cir. 2002). 282 Natural Gas Act, 15 U.S.C. § 717 et seq. 283 See “The History of Regulation,” September 20, 2013, http://naturalgas.org/regulation/history/ 284 15 U.S.C. §§ 717c, 717d. 285 15 U.S.C. § 717f.

Project FY14 – STB - 157
Railroad rate regulation 89
pipelines in the interstate market were subject to cost-based NGA regulation.286
The low wellhead prices
imposed by the FPC were a substantial factor in creating the shortages of natural gas in interstate
markets in the 1970s, which led Congress to relax and eventually remove wellhead price controls in the
Natural Gas Policy Act of 1978.287
FERC recognizes that its mandate to regulate the transmission of natural gas must be balanced with the
interests of the industry.
This [consumer protection] mission must be undertaken by balancing the interests of the
investors in the pipeline, to be compensated for the risks they have assumed, and the interests of
consumers, and in the light of current economic, regulatory, and market realities.288
7.3.1 Structure of the Electricity Market and Changes over Time
The electric power system consists of generating units where primary energy is converted into electric
power, transmission and distribution networks that transport this power, and industrial, commercial and
residential consumers’ equipment (also called “loads”) where power is used. Figure 7-1 illustrates the
basic structure of the electric grid. Electric power generation in the U.S. is dominated by the use of coal
and natural gas. Other sources include nuclear power, hydropower, solar power, and other renewables.289
Generally, electricity must be used as soon as it is produced because electricity cannot be easily stored.
286 Phillips Petroleum Co. v. Wisconsin, 347 U.S. 672 (1954).
287 See Joskow, Paul L., “Natural Gas: From Shortages to Abundance in the U.S.” 2-4 (Dec. 31, 2012): http://economics.mit.edu/files/8618. 288 Federal Energy Regulatory Commission, Final Rule, “Restructuring of Pipeline Services,” Order No. 636 (April 8, 1992), http://www.ferc.gov/legal/maj-ord-reg/land-docs/restruct.asp. 289 See U.S. Energy Information Agency, http://www.eia.gov/electricity/data.cfm#generation.

Project FY14 – STB - 157
Railroad rate regulation 90
Figure 7-1: Structure of the Electric Power System
Source: InterVISTAS Consulting Inc., based on Massachusetts Institute of Technology, The Future of the Electric Grid, 2001. When Congress enacted the FPA in 1935, electric utilities were mostly vertically integrated firms that
constructed and operated their own generation, transmission, and distribution facilities. The firms acted
as separate, local or regional monopolies, and consumers (households, commercial and industrial
businesses) in those areas paid a single “bundled” rate for electricity (“bundled” reflecting the costs of
generation, transmission, and delivery). Rates paid by consumers were subject to approval by local or
state public utility commissions.
With greater demand for electricity from a growing economy came the need for sharing generation
resources. To ensure the reliable provision of electricity to consumers, utilities needed reserve generation
capacity. However, building generating facilities is extremely expensive. The solution to high reserve
costs was to share reserves with adjacent utilities. Instead of building two large units, utilities could buy
power from their neighbors in times of need, and cut their costs significantly. To facilitate reserve sharing,
utilities built high-voltage interconnecting transmission lines large enough to deliver power in case of a
major generator outage.290
As utilities discovered the benefits of interconnecting to reduce reserve costs
and generate power from the lowest-cost sources, they formed voluntary power pools, which evolved into
the current regional transmission organizations.
290 FERC Division of Energy Market Oversight, “Energy Primer: A Handbook of Energy Market Basics,” Staff Report, 2015, http://www.ferc.gov/market-oversight/guide/energy-primer.pdf

Project FY14 – STB - 157
Railroad rate regulation 91
The market for electricity underwent significant changes during the 1960s and 1970s. During this period,
the construction of nuclear and other capital-intensive facilities contributed to cost increases and
uncertainties in the industry. These investments were undertaken under the assumption of continued
increases in demand. However, that expectation failed to materialize due to conservation efforts and an
economic downturn. As a result, expensive large power plants for which there was little or no demand
came onto the market or were in the process of being constructed. Between 1970 and 1985, average
residential electricity prices more than tripled in nominal terms, and increased by 25% after adjusting for
general inflation. Average electricity prices for industrial customers more than quadrupled in nominal
terms over the same period and increased 86% after adjusting for inflation.291
In 1992, Congress enacted the Energy Policy Act.292
A goal of that Act was to promote greater
competition in bulk power markets by encouraging new generation entrants and by expanding the
Commission’s authority to approve applications for transmission services.
The Commission independently undertook actions to facilitate the development of a more competitive
market. Among those was a 1994 proposed rule to provide greater access to transmission facilities that
ultimately led to the restructuring of the electric industry. FERC recognized that the trend toward greater
transmission access and the transition to a fully competitive bulk power market could cause some utilities
to incur “stranded costs” as customers used their incumbent electricity supplier’s transmission to
purchase power elsewhere.293
A utility may have built facilities or entered into long-term fuel supply
contracts with the reasonable expectation that its customers would renew their contracts and pay their
share of long-term investments and other incurred costs. If the customer subsequently obtained another
power supplier via a newly-competitive market, the utility may have stranded costs. If the utility could not
locate an alternative buyer or somehow mitigate the stranded costs, then ‘‘the costs must be recovered
from either the departing customer or the remaining customers or borne by the utility’s shareholders.’’294
Accordingly, the Commission proposed to establish provisions concerning the recovery of wholesale and
retail stranded costs by public utilities and transmitting utilities.295
In short, over time, the electric industry had experienced fundamental changes: Electric systems had
become increasingly interconnected, long distance transmission had become increasingly economical,
291 See Federal Energy Regulatory Commission, Final Rule, “Promoting Wholesale Competition through Open Access Non-Discriminatory Transmission Services by Public Utilities; Recovery of Stranded Costs by Public Utilities and Transmitting Utilities,” Federal Register 61, no. 92 (May 10, 1996): 21543-21544, https://www.gpo.gov/fdsys/pkg/FR-1996-05-10/pdf/96-10694.pdf. 292 Energy Policy Act of 1992, Public Law 102-486, U.S. Statutes at Large 106 (1992): 2776–3133. 293 Federal Energy Regulatory Commission, Notice of Proposed Rulemaking, “Recovery of Stranded Costs by Public Utilities and Transmission Utilities,” Federal Register 59, no.131 (July 11, 1994), 32,507, https://www.govinfo.gov/content/pkg/FR-1994-07-11/html/94-16626.htm 294 Ibid., 32,864. 295 Final Rule, Promoting Wholesale Competition through Open Access Non-Discriminatory Transmission Services by Public Utilities; Recovery of Stranded Costs by Public Utilities and Transmitting Utilities, Order No. 888, 75 FERC ¶ 61, 080 (1996), 61 Fed. Reg. 21450, 21549 (May 10, 1996): (Order No. 888), https://www.gpo.gov/fdsys/pkg/FR-1996-05-10/pdf/96-10694.pdf .

Project FY14 – STB - 157
Railroad rate regulation 92
and smaller, lower-cost power plants had begun to emerge as competitors to the vertically integrated
utilities.296
FERC Order 888: Promoting Wholesale Competition through Open Access Non-
Discriminatory Transmission Services
In 1996, FERC responded to these changes and market conditions by adopting reforms to the electric
industry. In Order No. 888, the Commission concluded that the economic self-interest of electric
transmission monopolists – particularly those with high-cost generation assets – lay in denying
transmission or offering it only on inferior terms to emerging competitors.297
Such behavior, the
Commission argued, was counter to the mandate in FPA section 205 regarding undue prejudice or
disadvantage. Given this defect in the market structure of the electric industry, FERC determined that
“non-discriminatory open access transmission services” and “stranded cost recovery” were the most
critical components of a successful transition to competitive wholesale electricity markets.298
Doing so
would best ensure that consumers have the benefits of competitively priced generation.
In Order 888, the Commission required each public transmission providers to functionally unbundle its
wholesale generation and transmission services and file an open-access transmission tariff (“OATT”)
containing minimum terms of non-discriminatory transmission service.299
By “functionally unbundle,”
FERC required that public utilities state separate rates for wholesale generation, transmission, and
ancillary services (among other things). Through these structural changes, the Commission sought to
open the electric grid to all sources of electric power.300
To promote development of competitive markets,
the Commission encouraged the formation of regional transmission organizations (“RTOs”) and
independent system operators (“ISOs”) to coordinate transmission planning, operation, and use on a
regional and interregional basis.301
FERC stopped short of requiring the formation of RTOs or ISOs, and decided to allow some time for the
market to adjust. “[W]e believe that the less intrusive functional unbundling approach … is all that we
must require at this time. Nevertheless, we see many benefits in ISOs, and encourage utilities to consider
ISOs as a tool to meet the demands of the competitive marketplace.”302
FERC Order 2000: Regional Transmission Organizations
By the end of 1999, having watched the market adjust to the requirements in Order 888, FERC
determined that additional changes were needed to promote efficiency in wholesale electricity markets
and to ensure that electricity consumers pay the lowest price possible for reliable service. Retail access
was adopted by approximately 25 states in the late 1990s. Trade in bulk power markets increased
296 See Order No. 888, 61 Fed. Reg. at 21543–46. 297 Ibid., 21567. 298
Ibid., 21550. 299 Ibid., 21541, 21551–52. 300 Ibid., 21550. 301 Ibid., 21552, 21666–67. The validity of Order No. 888 and related decisions were affirmed on appeal in Transmission Access Policy Study Group v. FERC, 225 F.3d 667 (D.C. Cir. 2000). 302 Ibid.

Project FY14 – STB - 157
Railroad rate regulation 93
significantly and the Nation's transmission grid was used more heavily and in new ways as customers
took advantage of open access and purchased power from competitive sellers. However, the
Commission concluded that “the continuing opportunity for undue discrimination [is] impeding competitive
markets.”303
Therefore, FERC issued Order No. 2000 to advance its objective that “all transmission-
owning entities in the Nation, including nonpublic utility entities . . . place their transmission facilities under
the control of appropriate RTOs in a timely manner.”304
The Commission’s proceedings in Orders Nos.
888 and 2000, along with the efforts of the states and the industry, led to the voluntary organization of
ISOs and RTOs. (See Figure 7-2) Each of the ISOs and RTOs subsequently developed a full scale
energy and ancillary service market in which buyers and sellers could bid for or offer generation. The
ISOs and RTOs used the bid-based markets to determine economic dispatch.305
FERC again relied on
the industry to adopt the structure voluntarily. It cautioned that it would resort to more directive regulatory
actions if the industry failed to do so.306
Figure 7-2: Regional Transmission Organizations / Independent System Operators
Source: http://www.ferc.gov/industries/electric/indus-act/rto.asp In February 2007, FERC adopted a final rule reforming its decade-old open-access transmission
regulatory framework intended to ensure transmission service is provided on a nondiscriminatory and just
and reasonable basis, as well as provide for more effective regulation and transparency in the operation
303 Final Rule, Regional Transmission Organizations Order No. 2000, 89 FERC ¶ 61,285 (1999), 65 Fed. Reg. 810, 825 (Jan. 6, 2000), https://www.gpo.gov/fdsys/pkg/FR-2000-01-06/pdf/00-2.pdf 304 Order No. 2000, 89 Fed. Reg. at 811. 305 FERC Division of Energy Market Oversight, “Energy Primer,” 40. 306 Order No. 2000, 89 Fed. Reg. at 811.

Project FY14 – STB - 157
Railroad rate regulation 94
of the transmission grid.307
The rule was designed to: (1) strengthen the pro forma open-access
transmission tariff to ensure that it achieves its original purpose of remedying undue discrimination; (2)
provide greater specificity to reduce opportunities for undue discrimination and facilitate the Commission's
enforcement; and (3) increase transparency in the rules applicable to planning and use of the
transmission system.
7.3.2 FERC’s Economic Regulatory Approach of Electricity Transmission
While FERC oversees the functioning of electric commodity markets to prevent market manipulation, the
focus here is on FERC’s regulation of interstate electric transmission facilities and services. Unless a
utility or other transmission service provider can show that the market for its services is competitive,
FERC requires the provider to establish cost-based maximum rates for its services. This type of cost-of-
service ratemaking is sometimes referred to as rate-base rate-of-return regulation (RBROR). Under this
method, FERC determines an annual cost of service for the utility including operating costs, depreciation,
taxes and a reasonable rate of return on the utility’s investment in transmission facilities based on original
cost less deprecation. Specific costs may be classified as fixed or variable and allocated to various types
of service. Rates are then designed to recover the annual cost of service over estimated annual units of
service. Regulated transmission companies, which are required to provide open access to their electric
grids, use various forms of pricing to recover their costs of providing service. Most rates for firm
transmission service include a fixed reservation rate that covers fixed costs and a volumetric component
based on projected usage. Rates can be zone specific (license plate pricing), depend on the distance
(point to point sensitive), or be the same whatever the distance (postage stamp pricing).308
Postage
stamp pricing is a form of uniform pricing method applied in a defined area.
As noted, utilities and other service providers may file with FERC to increase their rates or change their
terms and conditions under section 205 of the FPA, and existing rates, terms and conditions may be
subject to investigation under section 206 on complaint or on FERC’s own initiative. Rates are rejected if
they are found “unjust and unreasonable” or “unduly discriminatory and preferential.” If FERC finds a
proposed rate to be unjust and unreasonable, it may prescribe a reduced “just and reasonable” rate. A
proposed rate may be reduced for various reasons, including because the proposed operating or other
costs are too high, the deprecation is excessive or the rate of return on equity (ROE) is outside the upper
band of a ROE range computed using FERC’s preferred Discounted Cash Flow model.309
If FERC
receives a complaint, it can either institute an oral hearing procedure to gather more information or utilize
an alternative dispute resolution procedure. There is a simplified procedure that can be used if a dispute
involves less than $100,000.310
307 Final Rule, Preventing Undue Discrimination and Preference in Transmission Service, Order No. 890, 72 Fed. Reg. 12,266 (2007). 308
The Regulatory Assistance Project, “Electricity Regulation in the US: A Guide” (2010), 67, http://www.raponline.org/document/download/id/645 309 Ibid. 310 Greenfield, Lawrence R., “An Overview of the Federal Energy Regulatory Commission and Federal Regulation of Public Utilities in the United States,” Office of the General Counsel, Federal Energy Regulatory Commission, 2010, http://www.ferc.gov/about/ferc-does/ferc101.pdf

Project FY14 – STB - 157
Railroad rate regulation 95
FERC ratemaking accommodates some amount of differential pricing by transmission providers.
Transmission rates are stated as maximum rates, which can be discounted down to variable costs.
Discounting is recognized in estimating the units of service used to design rates. FERC also permits firm
service holders to sell their firm transmission rights in public secondary transmission markets.
7.3.3 Overview of the Structure of the Natural Gas Industry
The natural gas industry is composed of three major segments--production, transmission, and
distribution.
The production segment is made up of natural gas producers who explore for and extract gas
from the ground.
The transmission sector consists of pipelines, or transmission companies, that historically
purchased natural gas from producers or other suppliers, and delivered and resold the gas
primarily to state-regulated distributors and also to large end-users.311
Since the mid-1990’s,
interstate pipelines have “unbundled” their services under restructuring requirements imposed by
FERC and today primarily provide transportation services (i.e., delivery of gas for customers who
have purchased their supply from a separate producer). Pipelines may transport gas within the
boundaries of a single state (intrastate) or between states (interstate).
The distribution sector consists of local distribution companies (LDCs), primarily local public
utilities that make gas purchases and high pressure gas transmission arrangements then resell
and deliver the gas to residential, commercial, and industrial end-use customers.
Historically, the structure of the natural gas industry regulated under the NGA was simple. The producers
would sell their natural gas in the production area to the interstate pipelines at FERC-determined just and
reasonable rates. The pipelines would transport their purchased gas and their own production to the
LDCs at FERC-determined just and reasonable rates which recovered both the pipelines' cost of gas and
cost of transmission.312
About 302,000 miles of interstate and intrastate transmission pipelines transport natural gas from the
producing and processing areas to storage facilities and distribution centers. More than 300 companies
operate mainline transmission pipelines.313
7.3.4 Pricing of Natural Gas Services
Pipeline company gas transportation, storage and related services are sold on either a firm or interruptible
basis. Firm service, which is primarily purchased by LDCs on behalf of residential and commercial end-
311 In addition to producers, a supplier of natural gas can be a pipeline or a local distribution company that provides natural gas to an interstate pipeline company, local distribution company, or end-user. Shippers of gas can include producers, pipelines, or other entities. 312 Federal Energy Regulatory Commission, Final Rule, “Restructuring of Pipeline Services,” Order No. 636 (April 8, 1992), 13, http://www.ferc.gov/legal/maj-ord-reg/land-docs/restruct.asp. 313 U.S. Energy Information Administration, “Natural Gas Pipelines,” November 30, 2015, http://www.eia.gov/energyexplained/index.cfm?page=natural_gas_pipelines

Project FY14 – STB - 157
Railroad rate regulation 96
users and by electric generators for baseload generation, guarantees the delivery of gas, particularly
during periods of peak demand on the pipeline system, such as cold winter days. In contrast, interruptible
service, which is primarily purchased directly by industrial customers or by LDCs on behalf of industrial
end-users, is subject to curtailment or interruption. This kind of service is generally used by those who
can switch to other fuels when their gas deliveries are interrupted. Because firm service is more reliable, it
is generally priced higher than interruptible service.
From an economic viewpoint, the transportation of natural gas has both large fixed costs (from the initial
construction of the pipeline) and low marginal costs (compared to the fixed costs). The fixed costs,
combined with the long lifetime of pipeline infrastructure, require pipeline companies to search for long-
term contracts. Baseload electric generation plants and local distribution companies likewise often need
to have the certainty of long-term transportation and gas supply contracts to meet the commitments to
their customers.314
Pipeline companies assess two charges: (1) a commodity or usage charge -- a fee determined by the
volume of gas transported -- and (2) a demand or reservation charge -- a fee for the customer’s right to
reserve capacity on a pipeline company’s system. Customers with firm service pay both a usage fee and
a reservation charge because they have a right to service and essentially have reserved to themselves a
portion of the pipeline’s capacity. Customers with interruptible service pay only a commodity charge, since
they do not reserve pipeline capacity, but the maximum usage charge for interruptible service may be
higher than the volumetric charge for firm service depending on the rate design and allocation of costs to
the various services. The commodity and demand charges allow the pipeline company to recover its
costs of providing service and to earn a reasonable profit.
The method by which the company’s costs are assigned to either the commodity or demand charge is
commonly referred to as “rate design.” Technically, FERC may assign costs to either the commodity or
the demand charge. However, the variable costs associated with gas supplies and transportation are
always applied to the usage charge. Historically, pipeline companies’ fixed costs -- such as the
depreciation of the pipeline, operation and maintenance expenses, and return on equity -- have been
distributed between the commodity and demand charges in several ways, depending on FERC’s policy
goals.315
Currently, FERC requires pipelines to use the straight fixed-variable (SFV) rate design under
which all of the fixed costs assigned to firm service are recovered in the reservation charge. However, a
small portion of the fixed costs may be allocated to interruptible service and recovered along with variable
costs in the rate for interruptible service.
7.3.5 Evolution of the Industry and its Regulation
Federal regulation of the natural gas industry evolved in conjunction with changes in the nation’s policy
toward energy and changes in the industry’s structure.
314 Viscusi et al., Economics of Regulation, 672. 315 U.S. General Accounting Office, “Natural Gas: Costs, Benefits, and Concerns Related to FERC’s Oder 636,” GAO/RCED-94-11 (Washington, DC, 1993), 4-5, https://www.ferc.gov/legal/maj-ord-reg/land-docs/gao-636study-1993.pdf

Project FY14 – STB - 157
Railroad rate regulation 97
Interstate natural gas shortages in the 1970s were the catalyst for reform of the regulation of the natural
gas industry. Congress responded to the natural gas shortages by enacting the Natural Gas Policy Act of
1978 to increase the flow of gas into the interstate market.316
Among other things, this act removed much
of the pricing of the nation's natural gas supplies from the Commission's regulatory jurisdiction. The intent
was “to provide investors with adequate incentives to develop new sources of supply."317
Structural problems remained, however, because interstate pipelines controlled the interstate
transportation network and were unwilling to offer unbundled transportation and storage service to
existing customers to whom they were selling and delivering gas as part of a bundled service. Moreover,
FERC allowed interstate pipelines to “track” the cost of the gas commodity through a rate mechanism
known as a “purchased gas adjustment” (PGA) clause. Once wellhead price controls were lifted for “new”
gas supplies, many pipelines entered into contracts to purchase gas at excessively high prices believing
that gas shortages would persist and they would be able to recover the cost of this high-priced gas
through their PGA clauses. Local distribution companies balked at these high prices because their price-
sensitive industrial customers were switching from gas to other fuels and demanded the ability to make
their own gas supply arrangements. By 1992, FERC had determined that the pipeline companies
retained a competitive advantage over other gas sellers because of their ability to combine transportation,
storage, and other services.
FERC responded by issuing Order 636, known as the Restructuring Rule, which was designed to allow
more efficient use of the interstate natural gas transmission system by fundamentally changing the way
pipeline companies conduct business. Order 636 required interstate pipeline companies to unbundle, or
separate, their sales, storage, and transportation services. Unbundling increased competition among gas
sellers and diminished the market power of pipeline companies. Among other things, the order required
pipeline companies to:
Provide open-access transportation services that are equal in quality, whether the gas is
purchased directly from the pipeline or from another provider, such as from a producer or a
marketer.
Provide firm sales customers with “no-notice” transportation and storage services that would
allow them to have the same flexibility to meet unanticipated daily demand swings that they
previously had with unbundled sales service. Pipelines were allowed to retain some of storage
for supply and demand management, but they had to offer any additional storage as an
unbundled service. Storage is integral to the efficient and reliable distribution of natural gas and
provides the means to supply consumers' needs at times when their requirements exceed total
gas production and mainline transmission capability.
Redesign their transportation tariff rates so that the majority of fixed costs would be recovered
through the capacity reservation fee charged to firm customers. This reservation fee is charged
on a monthly basis to reserve daily capacity based on the maximum daily quantity included in the
customer’s firm service agreement. Thus, local distribution companies with temperature-sensitive
residential customers will contract for sufficient firm transportation and storage capacity to meet
317 Ibid., quoting Pub. Serv. Comm’n of N.Y. v. Mid-Louisiana Gas Co., 463 U.S. at 334.

Project FY14 – STB - 157
Railroad rate regulation 98
the peak period requirements of these seasonal demands. As noted, interruptible customers do
not reserve daily capacity and are not charged a reservation fee, although the maximum
interruptible rate may include recovery of some fixed costs. Variable costs are recovered through
a usage fee applied on a volumetric basis to the gas actually transported. The new rate design
(straight fixed-variable), which FERC continues to use, was intended to help promote competition
among gas suppliers by eliminating any price distortions inherent in the previously used rate
design (modified fixed-variable), which allocated certain fixed costs such as return on equity and
related taxes to a commodity (usage) charge. This charge was levied on a per unit basis and
applied to the volume of gas actually used, thus affecting costs for firm and interruptible
customers alike.318
FERC regulation of the rates for pipeline transportation and storage service under Sections 4 and 5 of the
Natural Gas Act is similar to FERC’s regulation of the rates for the interstate electric transmission
network. FERC treats pipelines as having market power requiring cost of service regulation unless the
pipeline can show that the market for the service is competitive. In the absence of competition, FERC
employs RBROR-type regulation, which involves determining the revenue requirement (including
operating expenses, taxes, depreciation, and a fair rate of return on investment), classifying the costs as
fixed or variable, allocating costs to services, and designing rates to recover the revenue requirement.
FERC’s regulation of pipeline rates permits a level of differential pricing because FERC approves
maximum rates, for firm transportation and storage services, which pipelines can then discount down to
variable costs. Moreover, the holders of firm transportation and storage service can resell their capacity
in secondary markets. FERC may initiate a review of existing rates under Section 5 of the NGA or review
a pipeline-initiated rate change under Section 4.
7.3.6 Assessment of the Suitability of FERC’s Regulation of Electricity and
Natural Gas to Freight Rail
We do not believe that FERC’s approach to regulating energy transmission – either electricity or natural
gas – represents a suitable alternative to the STB’s approach to freight rail rates. Adopting an approach
similar to FERC’s would be a departure from the principles underlying CMP and the current STB methods
of approximating CMP. Moreover, FERC’s regulatory format is intrusive and wide in scope. It requires the
regulation of all rates unless the regulated company can prove that the market for its services is
competitive and that regulation, therefore, is unnecessary. Unlike the Interstate Commerce Act, where
railroads are presumed not to have market dominance where the R/VC ratio of the rate is below 180%,
FERC grants market-based rate authority only to utilities that can demonstrate that they do not possess
horizontal or vertical market power based on market shares, market concentration, open-access
transmission filings and other factors. 319
FERC regulation also requires setting cost-based maximum rates rather than demand-based maximum
rates for every service that is not market-based. Even with discounting, this approach, if applied to rail,
318 “FERC Order 636: The Restructuring Rule (1992),” U.S. Energy Information Administration, http://www.eia.gov/oil_gas/natural_gas/analysis_publications/ngmajorleg/ferc636.html 319 See generally, Final Rule, Refinements to Policies and Procedures for Market-Based Rates for Wholesale Sales of Electric Energy, Capacity and Ancillary Services by Public Utilities, Order No. 816, 80 Fed. Reg. 67,056 (Oct. 30, 2015).

Project FY14 – STB - 157
Railroad rate regulation 99
would greatly restrict the flexibility to rail carriers to differentially price rail services Cost-based
ratemaking using the RBROR approach inevitably would under-price highly valuable services. This would
require higher mark-ups on the most price sensitive traffic, potentially leading to the loss of these shippers
and their contributions, even if modest, to railroad fixed costs.
Using the FERC’s approach, the STB’s regulatory tasks would become increasingly expensive to
administer and would create longer and inevitable regulatory delays. FERC regulates transportation,
storage and ancillary services related to largely homogenous commodities – natural gas and electricity.
In contrast, under an approach similar to that used by FERC, the Board would have to allocate the
railroad’s revenue requirement, allocate costs and design rates for the movement of multiple
heterogeneous products and commodities having vastly different market values, weights and densities,
and compositions that use different types of railcars. This form of regulation would not be a simplification
for STB, nor would it improve economic efficiency. Rather, it would be a return to the pre-Staggers Act
method of regulation that Congress rejected.
7.4 Experience in U.S. Telecommunications with TELRIC
Telecommunications Regulatory Reform. The historical regulatory approach for the U.S.
telecommunications industry was predicated on the belief that telecommunications services could be
provided at the lowest possible cost by a monopoly provider. The Federal Communications Commission
(FCC) and various state regulators thus were originally tasked with regulating the prices charged by the
various telephone monopolies. To pursue the goal of universal service, the regime included substantial
cross subsidies, by charging higher rates for some services (e.g., long distance, large urban phone
services) to allow lower prices for other services.
The Telecommunications Act of 1996320
ultimately changed this approach. As the FCC noted:
Rather than shielding telephone companies from competition, the 1996 Act requires telephone
companies to open their networks to competition.321
Congress gave the FCC a very different mandate with respect to the telecommunications industry than it
gave to the STB in ICCTA and the ICC in Staggers with respect to the rail industry. The intent of the
Telecommunications Act of 1996 was to open the industry to competition at the retail level. At the time,
local monopolization of the infrastructure for originating and terminating access (i.e., the local service
components for a long-distance service) was very lucrative as these were essentially bottleneck services.
The Telecommunications Act of 1996 sought to ensure that access to this infrastructure would be opened
up to competitors. Unlike the case of railroads, the objective of the telecommunications legislation did not
include a mandate to promote the financial viability of the existing providers of the bottleneck
infrastructure. The FCC’s mandate was to ensure competitive access by opening incumbent local
exchange carriers’ networks to competitors for these services.322
320 Pub. L. No. 104-104, 110 Stat. 56 (Feb. 8, 1996). 321 First Report and Order, Implementation of the Local Competition Provisions in the Telecommunications Act of 1996, FCC 96-325 para. 1, 11 FCC Rcd 15499 (FCC Released Aug. 7, 1996) (“First Report and Order”). 322 The FCC in effect is focused on the dynamic efficiency issue. The STB, with its foundation of Constrained Market Pricing based on Ramsey pricing, also considers allocative efficiency.
Project FY14 – STB - 157
Railroad rate regulation 100
Access prices based on incremental, not total cost. To make this open access regime work, the FCC
was required to develop a methodology for determining access prices that would promote entry. A
methodology that resulted in high access prices would likely lead to limited or no competitive entry. Thus,
the 1996 Act required that charges for interconnection and network elements:
[S]hall be – (i) based on the cost (determined without reference to a rate-of-return or other rate-
based proceeding) of providing the interconnection or network element (whichever is applicable),
and (ii) nondiscriminatory, and … may include a reasonable profit.323
The 1996 Act provided for compensation to existing network infrastructure providers on the basis of
“additional costs” which might be broadly viewed as the telecommunications equivalent of long run
variable costs in the railroad industry.324
TELRIC. The pricing concept the FCC developed to implement its access pricing mandate was the Total
Element Long Run Incremental Cost (TELRIC) approach. This was a version of what was known as Total
Service Long Run Incremental Cost (TSLRIC).
The FCC, in its First Order and Report, described the TELRIC approach:
We conclude that, under a TELRIC methodology, incumbent [local exchange carriers’] prices for
interconnection and unbundled network elements shall recover the forward-looking costs directly
attributable to the specified element, as well as a reasonable allocation of forward-looking
common costs. Per-unit costs shall be derived from total costs using reasonably accurate “fill
factors” (estimates of the proportion of a facility that will be “filled” with network usage); that is, the
per-unit costs associated with a particular element must be derived by dividing the total cost
associated with the element by a reasonable projection of the actual total usage of the element.
Directly attributable forward-looking costs include the incremental costs of facilities and
operations that are dedicated to the element. Such costs typically include the investment costs
and expenses related to primary plant used to provide that element. Directly attributable forward-
looking costs also include the incremental costs of shared facilities and operations. Those costs
shall be attributed to specific elements to the greatest extent possible.325
The basic steps in conducting a TELRIC assessment are:
1. Determine the incremental demand for the service (or group of services) over the period in
question;
2. Determine the network to meet this incremental demand based on the most efficient technology
that would be deployed in the incumbent’s current wire center locations during the period in
question;
323 47 U.S.C. § 252(d)(1). 324 47 U.S.C. § 252(d)(2)(A). The key text states “(ii) such terms and conditions determine such costs on the basis of a reasonable approximation of the additional costs of terminating such calls.” (emphasis added) 325 First Report and Order, para. 682.

Project FY14 – STB - 157
Railroad rate regulation 101
3. Determine the time frame in which this hypothetical network is built to deal with the incremental
demand (i.e., all at once, or spread out over time);326
4. Determine the existing base of assets/services to which the incremental new network is to be
added;
5. Specify provisioning rules and capacity/demand balance;
6. Determine the operating and maintenance cost of the modelled network;
7. Determine common costs (e.g., overhead) that cannot be specifically attributed to a particular
service and determine a reasonable share of these costs that should be allocated to each
service;
8. Determine capital costs, including rate of return; and
9. Allocate the total costs to the services in question.327
FCC allocation of common costs. The FCC acknowledged that, in setting access rates, there will be
some common costs that need to be allocated in a “reasonable” manner and determined that allocating
common costs as a fixed percentage mark-up over the directly attributable costs would be a reasonable
approach. Another reasonable approach, according to the FCC, would be to allocate a small share of
common costs to critical network elements.328
The FCC does not allow demand-based allocation of common costs. It explicitly cites as unacceptable the
allocation of common costs based on “inverse proportion to the sensitivity of demand” (i.e., Ramsey
pricing).329
This follows from its mandate to promote competitive entry. The FCC has no mandate to
ensure the financial viability of the incumbents, much less to encourage the use of differential pricing to
achieve that financial viability with maximum economic efficiency. Stimulating competition is the driver.
Forward-looking costs based on best-available technology. According to Beshers, the long-run
incremental cost definition in the TELRIC approach is no different, in principle, from the concept of
incremental cost in the ECPR (discussed later in this chapter):
What is different is that the TELRIC definition of incremental cost is based not on the costs of the
equipment or facilities an entrant would be using, but on the costs of a hypothetical network. The
hypothetical network would “employ the most efficient technology for reasonably foreseeable
capacity requirements.330
326 Note that the “hypothetical” network under TELRIC assumes the most efficient technology available would be deployed at the incumbent’s current wire center locations. (First Report and Order, para. 685). It is not hypothetical in the sense of being a completely different network from what currently exists, but it is hypothetical in the sense that it builds on the existing centers using better technology. It thus differs from the Full-SAC process, where a stand-alone railroad could be entirely hypothetical (i.e., completely different from the existing network) but has similarity with the Simplified-SAC process that uses the existing network of the incumbent. 327
This list is based in part on Ergas, Henry, “TSLRIC, TELRIC and Other Forms of Forward-Looking Cost Models in Telecommunications: A Curmudgeon’s Guide,” Center for Research in Network Economics and Communications, the University of Auckland, 1998. 328 First Report and Order, para. 696. 329 Ibid. 330 Beshers, “Efficient Access Pricing,” 25.

Project FY14 – STB - 157
Railroad rate regulation 102
In other words, with TELRIC, it is necessary to forecast future demand and decide what the network
would consist of, and what it would cost if it were built today with the “most efficient technology.” Those
costs are then to be used as the basis for setting prices for use of the existing elements.”331
The need to estimate forward-looking costs based on a future network that uses the best technology of
that time has led to some criticisms of the approach. Beshers summarizes Kahn, Tardiff, and Weisman‘s
criticisms as being “largely concerned with TELRIC’s requirement that incremental costs be based on a
hypothetical network. Kahn asserts that basing costs on a hypothetical plant with the best available
technology cannot reflect real-world costs, because real firms do not continually scrap their plants and
invest in new ones as soon as a new, improved technology becomes available.”332
Some stakeholders maintain that the use of historic or sunk costs is the more appropriate basis for
determining costs. The FCC, however, has concluded that, even where there are significant sunk costs, it
is the forward-looking costs that are still relevant. It notes:
The TELRIC of an element has three components, the operating expenses, the depreciation cost,
and the appropriate risk-adjusted cost of capital. We conclude that an appropriate calculation of
TELRIC will include a depreciation rate that reflects the true changes in economic value of an
asset and a cost of capital that appropriately reflects the risks incurred by an investor. Thus even
in the presence of sunk costs, TELRIC-based prices are an appropriate pricing methodology.333
In Verizon Communications, Inc. v. FCC, 535 U.S, 467 (2002), the Supreme Court held that TELRIC’s
forward-looking cost approach was reasonable and did not violate the Telecommunications Act of 1996.
TELRIC access prices potentially may not result in coverage of total infrastructure costs. Beshers
notes that Sidak and Spulber point out that TELRIC, as established by the FCC, “prevents incumbents
from recovering costs. They argue that the ban on Ramsey pricing, plus a requirement that most prices
should be below SAC, make it impossible for an incumbent to recover total costs.”334
A number of stakeholders have argued that any pricing rules that do not enable service providers to
recover total costs, including historic and embedded costs, constitute an “unlawful taking.” However, the
Supreme Court concluded in Verizon that there was no evidence to support the contention that TELRIC
constituted a taking. The Court noted that it was not provided with any actual TELRIC prices and proof
that they were confiscatory, but only with some network level comparisons of historical costs versus a
TELRIC evaluation. It found some errors in the numbers being compared, and noted: “What the best
331 Ibid. 332 Ibid., 27. 333
First Report and Order, para. 703. The FCC goes on to define depreciation as “the method of recognizing as an expense the cost of a capital investment. Properly calculated economic depreciation is a periodic reduction in the book value of an asset that makes the book value equal to its economic or market value.” (footnote 1711) 334 Beshers, “Efficient Access Pricing,” 27. Beshers references Sidak, J. and D. Spulber, The Tragedy of the Telecommons: Government Pricing of the Unbundled Network Elements under the Telecommunications Act of 1996, 97 Colum. L. Rev. 1081 (1997).

Project FY14 – STB - 157
Railroad rate regulation 103
numbers may be we are in no position to say: The point is only that the numbers being thrown out by the
incumbents are no evidence that TELRIC lease rates would be confiscatory, sight unseen.”335
A potentially problematic criticism appears in Gans and King, who examined the difference between
TELRIC and the TSLRIC model (from which TELRIC was derived). They concluded:
While many consider the two approaches to be practically the same, this report demonstrates that
this is not the case on both a conceptual and practical level. We consider both the conceptual and
the practical differences between TSLRIC and TELRIC. At a conceptual level, the two measures
will differ whenever there are shared network elements and part of the cost of these elements is a
common cost and part is an incremental cost of the services that use the shared element. There
are likely to be many such elements in a fixed line telecommunications network. For example,
most switches that are engineered to cope with total service flows have both common and
incremental cost aspects.
In such situations, TELRIC modelling can potentially lead to inappropriate service pricing. We
show that TELRIC pricing, when applied to services, cannot guarantee that service prices do not
fall below the economically appropriate price floor set by long run incremental cost, and TELRIC
pricing cannot guarantee that service prices do not rise above the economically appropriate
ceiling set by stand alone cost. If TELRIC prices for services violate relevant price floors or price
ceilings, then this implies that there are inappropriate economic service prices and that some
services may be artificially cross subsidizing other services.336
7.5 Is TELRIC Applicable to the Railroad Industry?
For the railroad industry, with its high proportion of unattributable common costs, use of TELRIC could be
quite problematic. While TELRIC may be an appropriate approach for the telecommunications industry,
we do not believe it is appropriate for use by the STB in executing its mandate under ICCTA for several
reasons:
TELRIC is a methodology to establish access prices.
It might have some relevance in a rail transport regime with open access, or in exceptional cases
where the access price needs to be established. It was not intended to be used to establish
prices for the end customer (the shipper).
Forward-looking cost estimates must be developed.
As implemented by the FCC, both the entrant and the incumbent carriers are expected to develop
forward-looking costs for the various elements of the network based on assumptions of the nature
of the hypothetical network and demand for each element. The regulatory agency (FCC) then
adjudicates and sets prices element by element. This is similar in nature to the SAC process,
which allows the shipper to incorporate the best existing technology. If anything, the TELRIC
335 535 U.S. at 526. 336 Gans, Joshua and Stephen King (CoRE Research Pty Ltd), “Comparing TSLRIC and TELRIC: A Report on Behalf of AAPT Ltd.” Melbourne, Australia, 2003, https://www.accc.gov.au/system/files/AAPT%20CoRE%20TSLRIC%20%26%20TELRIC-%20July%202003.pdf

Project FY14 – STB - 157
Railroad rate regulation 104
approach may be even more administratively burdensome than the existing maximum rate
regulation procedures utilized by the STB due to uncertainties about the cost of future
technologies in the rail industry.
Economic efficiency is not the goal.
The prices that would be set for each element are not necessarily constrained by a SAC ceiling or
average variable cost (or marginal cost) floor. This introduces the risk of economically inefficient
prices being established – either prices too high or too low. It likely would still be necessary to
conduct a SAC analysis to ensure the TELRIC price does not exceed SAC, and use URCS or
some other method to ensure the TELRIC price is not below LRVC.
The full recovery of common costs is a significant issue.
Ramsey pricing is explicitly rejected by the FCC in its application of TELRIC pricing in favor of
some other “reasonable” distribution of common costs. As a result, this approach could place a
greater cost burden on those with the greatest sensitivity to rail charges (i.e., higher charges for
those with highest price elasticity of demand than is currently the case in the U.S. railroad
industry). This would undoubtedly drive a significant proportion of traffic away from rail, leaving a
smaller traffic base to cover the common costs. Thus, TELRIC could produce access prices that
result in lower overall traffic levels than is what is economically efficient and leave the host carrier
uncompensated for a portion of fixed costs.
This would be a new regime that Congress would have to authorize through new legislation.
The combination of access to the rail network by competing carriers and the removal of focus on
carrier revenue adequacy could potentially lead to a restructuring of the U.S. rail industry. Given
that the U.S. rail industry is viewed as one of the most efficient, if not the most efficient, rail
systems in the world, this would be a dramatic change for an industry that has undergone a
significant revival since deregulation.
Eric Beshers made note of TELRIC’s inappropriateness for pricing rail bottlenecks, citing many of the
above issues, among others. His rejection of TELRIC for rail is summarized in this comment: “The
TELRIC methodology much more nearly resembles traditional, cost-based rate-of-return, rate regulation
than it does constrained-market pricing. TELRIC embodies inefficient pricing principles and could not
work in the current framework of railroad regulation or anything close to it.”337
Adapt TELRIC to establish shipper prices? While TELRIC was designed to establish access prices,
conceptually it could be adapted to establish maximum prices for shippers, and thus be an alternative to
SAC. Earlier, TELRIC was characterized as having nine steps to complete. It is the first step (determine
the new demand on the network from the entrant carrier) and the fifth (balancing competing demands on
capacity) that focus on access to the network. Eliminating those steps would leave a methodology that
might be appropriate for maximum shipper rates.
However the remaining seven steps look very similar to SAC. An optimal network has to be designed,
forward looking costs must be estimated for an appropriate time frame, and operating, maintenance and
capital costs (including a reasonable return on capital) likewise must be determined.
337 Beshers, “Efficient Access Pricing,” iii-iv.

Project FY14 – STB - 157
Railroad rate regulation 105
There are some steps unique to TELRIC, but they seek to achieve the same objective as SAC. TELRIC
seeks to allocate common costs to the traffic in dispute as well as a share to all other traffic, although no
theoretical guidance is given as to how those costs should be allocated. The FCC cost allocation
methodology (e.g., use a constant percent mark-up over variable costs) would not ensure revenue
adequacy, would drive some traffic off the rail network, and would not necessarily be economically
efficient. In applying TELRIC in the rail context, however, it could be possible to use a different definition
of a “reasonable” approach to allocating common costs to the traffic in dispute other than a fixed
percentage mark-up or small allocation to critical network elements.(This would be similar to what the
FCC had proposed with allocating common costs. See above.) If alternative definitions of “reasonable”
are adopted that incorporate demand-based factors
(such as price sensitivity) then one could protect
revenue adequacy. This however, would require
elements of Ramsey pricing (I.e. knowledge of
elasticities of demand for all users). The FCC TELRIC
implementation avoids this, but at the cost of revenue
adequacy and economic efficiency.
SAC deals with the common cost allocation issue
indirectly by netting from the total costs of the
hypothetical network the contribution that could be
obtained from other traffic. This achieves the same
end as TELRIC.
In the end, it seems that while TELRIC, an access
pricing methodology, could be adapted to replace
SAC for determination of maximum allowable rates to
be paid by a rail shipper, the resulting adaptation
would have similar complexity to SAC. Simplifying
TELRIC would require use of a simplistic cost
allocation formula, such as the FCC uses, but with the
consequence of abandoning revenue adequacy and
economic efficiency goals.
7.6 Application of TELRIC to Allocate Common Costs for the Two
Rail Cases
Despite questions about the appropriateness of applying the TELRIC approach as generally adopted by
the FCC to the U.S. freight rail industry, this section illustrates what TELRIC rates might look like if
applied to the U.S. railroad industry. The two case studies used are the Western Fuels Association (WFA)
and Otter Tail cases first described in Chapter 4.
For WFA, the unadjusted variable costs (calculated using URCS data) were available in the public case
filings. In the Otter Tail case, unadjusted variable cost estimates were not available in the public case
In the end, it seems that while TELRIC,
an access pricing methodology, could
be adapted to replace SAC for
determination of maximum allowable
rates to be paid by a rail shipper,
the resulting adaption would have
similar complexity to SAC.
The means to simplify TELRIC require
use of a simplistic cost allocation
formula such as the FCC uses, but with
the consequence of abandoning
revenue adequacy and economic
efficiency goals

Project FY14 – STB - 157
Railroad rate regulation 106
filings. This report used URCS to estimate the unadjusted variable costs,338
although we point out that the
URCS costs estimates are untested. Both cases estimated the variable costs of the crossover traffic
based on the total operating expenses of the SARR less the variable costs of the traffic at issue.
As the fixed costs of the actual railroad were not available, as a proxy, the fixed cost of the SARR was
used in each case.339
Three allocation methods computed. As previously indicated, a major problem with TELRIC is that the
methodology provides no guidance as to how to allocate unattributable costs. The FCC has no revenue
adequacy legislative objective and TELRIC advocates have arbitrarily proposed a number of possible
methods. Here three different approaches to allocate the unattributable costs were considered, each of
which has been proposed for possible use in TELRIC:
A uniform mark-up percentage approach based on the average percentage mark-up that would
be needed to cover the fixed and common costs;
A mark-up based on the traffic’s tonnage share of total carrier traffic; and
A mark-up based on the traffic’s revenue share of total carrier traffic.
For the uniform mark-up percentage approach, the mark-up was the ratio of fixed costs to total variable
costs. The mark-up does not vary across the movements; it is the average needed to cover the fixed and
common costs of the railroad.
To estimate the mark-up based on tonnage, the total fixed cost per ton of the railroad was computed.340
From this, we estimated the total fixed cost of the issue traffic. The mark-up was then calculated using the
URCS variable costs and the estimated fixed cost of the issue traffic. While the specific assumptions
made might legitimately be challenged, as will be seen the main point on the range of outcomes is
unlikely to be changed.
A similar methodology was employed to calculate the mark-up based on revenue, which was estimated
using the tonnage and rate information available in the case documents for both cases. The
unattributable costs were estimated using the estimate of total fixed cost per dollar revenue, again, with
total fixed costs for the SARR as a proxy for the actual railroad. Figure 7-3 summarizes the results.
338 This use is consistent with the adaptation methodology applied to our Three-Benchmark analysis. The
movement characteristics inputs for the program were based on the issue traffic found in the case filings. 339 Although this is a limitation of our analysis (and hence, an adaptation of the TELRIC approach), the purpose of the TELRIC analysis is to inform the STB of lessons that can be learned from other forms of regulation. 340 As noted previously, we relied on the costs and traffic of the SARR as a proxy for the actual railroad in each case.

Project FY14 – STB - 157
Railroad rate regulation 107
Figure 7-3: Estimates of Percentage Markups from Applying Different TELRIC Methodologies to Two Rail Cases
Case
Full SAC markups TELRIC Markup (Uniform %age)
TELRIC Markup (Tonnage Ratio)
TELRIC Markup (Revenue Ratio)
Otter Tail vs. BNSF
STB found BNSF rate not shown to be unreasonable. InterVISTAS estimates the markup on BNSF to be 117% (RVC of 217%)
341
70% 91% 157%
Western Fuels vs BNSF
STB found BNSF rate to be unreasonable. Final decision allowed rates with RVC of 230-269%
342 [markup of 130-
169%]
Disputed rate was claimed by BN to have a 226% markup (RVC 336%) and by WFA as a 382% markup
88% 18% 94% (Unadjusted SARR
revenue)
102% (Adjusted SARR
Revenue)
Source: InterVISTAS Analysis using publicly available case file data.
It is noted that while Figure 7-3 summarizes the estimates of the adapted TELRIC mark-ups to the mark-
ups from the Full-SAC analysis, they are not directly comparable. The STB markups are for the final rate
paid by the shipper to the railroad. In contrast, the TELRIC methodology sets the markup for the access
fee to be paid by the competing carrier to the incumbent carrier. The actual markup on the rate paid by
the shipper to competing carrier could be higher or lower.
Comparing the mark-ups, the TELRIC mark-ups are mostly below the SAC mark-ups. This result is not
surprising, as the purpose of TELRIC is to generate competition, and not ensure revenue adequacy.
Another important observation is that the three methods for allocating unattributable costs vary quite
largely, yet all might be considered “reasonable” under the TELRIC approach. The TELRIC methodology
does not ensure revenue adequacy for the carrier nor inform the regulator as to which cost allocation
methodology is appropriate.
341 At the time of this case, the STB allowed the shipper and carrier to adjust URCS variable costs estimates and BNSF’s figure was RVC of 228%, while Ottertail’s figure was 284%. Subsequently the STB prohibited such movement-specific adjustments. InterVISTAS estimated that the unadjusted RVC would be 217%, although this has not been reviewed or established by the STB and is only a rough estimate. 342 Depending on the year, since the STB’s rate prescription covers 20 years.

Project FY14 – STB - 157
Railroad rate regulation 108
7.7 Efficient Components Pricing Rule (ECPR) - Concepts
Another proposed approach to access pricing is the Efficient Component Pricing Rule (ECPR). The
ECPR requires that the price of access to a bottleneck segment to be paid by a competing tenant carrier
include an amount for the net contribution the vertically integrated carrier had previously received toward
common costs plus all relevant costs of providing access. This ensures that the common costs of the
carrier controlling the bottleneck segment are covered, thus preserving revenue adequacy of the landlord
carrier.
ECPR can be conceptualized for the case where an incumbent railroad (RR #1) carries a shipper’s traffic
from point A to point C, via Point B. A competing carrier (RR #2) is able to carry the traffic from A to B, but
cannot get the shipment the final distance from B to C, as only RR #1 has track from B to C. The
monopoly segment B to C is referred to as a “bottleneck.” This is depicted in the often duplicated diagram
from a 2000 Volpe National Transportation Systems Center paper by Eric Beshers.343
Figure 7-4: Railroad Bottleneck
Source: InterVISTAS representation of figure from Beshers, Eric, "Efficient access pricing for rail bottlenecks."
The job for ECPR is to establish an access price, to be paid by RR #2 to RR #1, for use of the latter’s B to
C bottleneck track. This is an access regime. If an appropriate access price can be establish for the B to
C bottleneck track, then there would be no need to regulate the maximum price RR #1 charges to the
shipper for moving traffic from A to B. Competition from RR #2 (or retaliatory pricing from RR #1) would
constrain the A to C price charged by RR #1. Of course, there is still a regulatory job, that of establishing
the appropriate access price.
The challenge for ECPR is to set the access price so that competition is encouraged and enabled, while
not undermining the revenue adequacy of RR #1. If RR #1 has only the one customer, and if it is revenue
adequate on the B to C segment, without earning any profit above revenue adequacy, then the ECPR
challenges is straightforward: the access price must cover the contribution to RR #1’s B to C common
costs that it had been earning (plus any new costs, such as administrative costs, involved in facilitating
RR #2’s use of the B to C track). Things get complicated for ECPR if RR #1 is earning more contribution
343 Beshers, “Efficient Access Pricing,” 8.

Project FY14 – STB - 157
Railroad rate regulation 109
from the customer than is required for revenue adequacy, and/or if there are more customers on the
segment.
Development of ECPR and resulting criticisms. Appendix III reviews the development of the ECPR
and potential advocacy to U.S. railroads. In brief:
ECPR was first referred to (1983) as the parity principle by W.J. Baumol.
The ECPR access price must cover:
o All the variable costs incurred by RR #1 to provide trackage rights service to RR #2;344
o Contribute enough to RR #1 for replacement of the incremental capital used in the
process, where these costs are valued at replacement cost, not historical cost.
o Contribute a fair return on RR #1’s capital costs;
o Compensate RR #1 for any net earnings which it must forego as a result of the tenant’s
use of trackage rights.
The ECPR is viewed as being cost based and simpler than Ramsey pricing, which would, in
principle, require knowledge of all demand elasticities.
One method for determining the ECPR access rate is relatively simple: Take the current rate paid
by the shipper to the incumbent railroad. Subtract the long run variable costs of the movement on
the incumbent railroad. Add any new incremental costs that the incumbent railroad would have to
bear to accommodate access by a competing railway that is authorized to use the track of the
incumbent. The result would be the ECPR access rate. This method does not involve computing
the common costs of the incumbent railway, nor the contribution from other traffic that uses the
same track. It is much simpler than the standalone cost method.
However, ECPR can perpetuate the unreasonable exercise of market power by the incumbent
carrier.345
If the existing contribution by the shipper to RR #1 embodies an unreasonably high
contribution to the latter’s common costs, the ECPR access rate will embody the contribution
rather than reducing it. The ECPR approach assumes that the existing contribution is no more
than a reasonable contribution. Thus, ECPR, by itself, does not protect a shipper against
unreasonable rates. The ECPR access rate merely enables competition on the A to B portion of
the shipment, while preserving any potential unreasonable compensation on the B to C segment.
344 Other mechanisms of shared access, such as haulage or reciprocal switching, may also be deployed, and appropriate variable costs must be included. 345 See, for example, Kahn and Taylor, “Pricing of Inputs Sold to Competitors,” 230.

Project FY14 – STB - 157
Railroad rate regulation 110
Some researchers recognize the potential of an ECPR access rate to protect an incumbent
carrier’s opportunity cost (the contribution to common costs), while at the same time it can enable
competition for the shipper.346
M-ECPR. A 1996 paper advanced the concept of a “market determined efficient pricing rule” (M-
ECPR).347
This could be used where there is an existing or a potential alternative to using RR #1. This
might be, for example,
An intermodal movement or an indirect railroad routing from A to C.
However, it could also be a potential new market alternative, such as RR #2 building-in a new line
from B to C.
o This introduces a hypothetical railroad concept, similar to SAC.
o The M-ECPR in this case would estimate the A to C rate, including both RR #2 price for A
to B plus the costs of the build-in from B to C. This would be used to reverse engineer an
access charge to be paid to RR #1 on B to C; The M-ECPR starts to embrace concepts
of SAC, including specifying a hypothetical railroad line, estimating future costs and
requiring coverage of the total costs of the hypothetical railroad line.
FCC rejection of ECPR/M-ECPR, acceptance in New Zealand. The FCC considered, but rejected, use
of ECPR for setting access prices in the telecommunications industry, because ECPR enables incumbent
carriers to recover their full opportunity costs, including any monopoly profits.348
Critics argued that “the
FCC’s arguments hold equally for the M-ECPR.”349
In a different jurisdiction with different legislation, the
High Court of New Zealand supported use of ECPR for pricing access to bottleneck network components.
This was later reversed by New Zealand’s Court of Appeal because ECPR would include “monopoly profit
in the opportunity-cost component of the access charge.” That second ruling was reversed and ECPR
revalidated with a subsequent decision by the Privy Council.350
Summary commentary. The key points of the ECPR methodology are that it is intended to preserve the
revenue adequacy of the incumbent carrier while potentially injecting actual competition or a meaningful
threat of competition for a shipper’s traffic. However, the ECPR methodology could embody continuation
of the earning of unreasonable contributions by the incumbent railroad and thus not offer the shipper the
full range of competitive opportunities. A maximum rate reasonableness methodology such as SAC may
be needed to make a rate reasonableness assessment for ECPR access charges.
346 For example, Armstrong, Mark, Chris Doyle and John Vickers, The Access Pricing Problem: A Synthesis, 44 J. of Indus. Econ. 149 (1996); Dewenter, Ralf and Haucap, Justus, editors, Access Pricing—Theory and Practice (Amsterdam: Elsevier, Amsterdam, 2007). 347 Sidak and Spulber, The Tragedy of the Telecommons. 348
Proposed Rule, Implementation of the Local Competition Provisions in the Telecommunications Act of 1996, 61 Fed. Reg. 18,311, para. 147 (April 25, 1996): https://www.gpo.gov/fdsys/pkg/FR-1996-04-25/pdf/96-10128.pdf. 349 Economides, Nicholas, "The tragic inefficiency of M-ECPR," New York University, Center for Law and Business, Working Paper 98-003 (1997): 151. 350 Sidak, J. Gregory, and William J. Baumol, The Pricing of Inputs Sold to Competitors: Rejoinder and Epilogue, 12 Yale J. on Regulation 180-181 (1995).

Project FY14 – STB - 157
Railroad rate regulation 111
7.8 Using URCS Data to Illustrate ECPR Access Pricing for Two
Cases
To illustrate the ECPR method, the WFA and Otter Tail cases discussed in the earlier chapters on SAC,
Simplified-SAC, and TELRIC are used. The two cases were discussed in Chapter 5, both of which
involved unit train coal originated on the Joint Line in Wyoming. The ECPR methodology involves
subtracting the variable costs of the incumbent carrier from the actual rate. It is emphasized that our
computations are hypothetical for purposes of illustrating the methodology. Actual computations in an
actual access rate determination may differ.
Western Fuels. In this case, BNSF is the incumbent carrier, and UP is hypothesized as a potential
competing carrier that would need track access rights on BNSF to complete the move.351
This analysis
assumes BNSF would perform a haulage service for the bottleneck segment, and BNSF thus would be
compensated for two products: (1) access to its track plus (2) its variable costs of haulage. Figure 7-5
illustrates existing and proposed routings. Computations for the analysis are summarized in Figure 7-6.
The project team used URCS data to estimate variable costs.
351 The hypothesized competing route for the WFA case makes use of Union Pacific’s ability to compete for Joint Line coal originations at the Cordero Mine. A UP unit train would travel 96 miles on the Joint Line and be given to the BNSF to terminate under a haulage agreement.

Project FY14 – STB - 157
Railroad rate regulation 112
Figure 7-5: Alternative Routings for WFA Traffic on Incumbent (BNSF) and Hypothetical Entrant (UP)
Source: InterVISTAS, using data from DeskMap Systems, Inc. 2004. Professional railroad atlas of North America: United States, Canada, Mexico. 1st ed. Austin, TX: DeskMap Systems, Inc.
Figure 7-6: Computation of ECPR Access Charge for WFA Case ($ per Trainload)
Computation of BNSF contribution
Computation of ECPR access
rate
Potential Shipper rate under haulage
Incumbent carrier Price per Trainload
$106,725
Subtract estimated BNSF Operating Cost A-C (ORL, DRL and ROI)
21,794
BNSF Contribution A-C 84,931 $84,931
Incremental costs incurred by BNSF when it provides access: Charge for haulage from B to C (ORL, DRL and ROI)
8,214
Access charge 93,145 $93,145
UP Operating Cost A-B (ORL, DRL and ROI), estimated using URCS
16,027
Shipper cost $109,172
Source: InterVISTAS calculations based on URCS data and public filings.

Project FY14 – STB - 157
Railroad rate regulation 113
The ECPR methodology sets the access charge as the contribution currently earned by the incumbent
railroad, plus any incremental costs incurred by the latter under the access regime. In this hypothetical
example, there would be haulage costs, assuming the access regime is one where the incumbent carrier
is required to haul the competitor’s traffic on the bottleneck route segment that only the incumbent serves.
Some observations can be made:
In this hypothetical case, the variable costs are low resulting in the ECPR access charge
embodying a relatively high contribution that is currently earned by the incumbent carrier. The
ECPR access charge preserves the contribution (or potential over contribution) to revenue
adequacy of the incumbent.
The hypothetical case provides no margin for the competitive carrier.
Even so, because of the high access charge, the resulting rate to the shipper is higher than the
existing rate.
While our computations are hypothetical we note that in the Western Fuels decision, the STB ruled that
the incumbent’s rates were unreasonable.352
The Full-SAC methodology thus found the existing rates
embodied unreasonable exercise of market power. The ECPR access rate would have preserved that
unreasonable market power, highlighting the key problem of ECPR as an access price methodology.
Otter Tail. A hypothetical competitive routing for Otter Tail Power is conceptualized consisting of 1,230
total miles with 1,046 of those on UP mainlines and 184 on the regional railroad Twin Cities & Western
(TC&W), the last 24 miles of which would be over BNSF using existing (what were then) trackage rights.
While the competing route is longer than that of the incumbent (See Figure 7-7), it was judged to be
potentially feasible as the competitive route was over Union Pacific’s principal mainlines where speed and
density would be optimized, whereas half of the BNSF route is over secondary lines (formerly part of the
Milwaukee Road). Figure 7-7 illustrates the existing and potential routings.
352 There are subtleties due to how variable costs can be computed, but in rough terms the Revenue to Variable Cost ratio of the disputed rates was around 447% percent (InterVISTAS computation). BNSF estimated R/VC as 326% whereas WFA estimated R/VC as 482%. The STB decision had R/VC that varies over 20 years in a range of 230% to 269%.
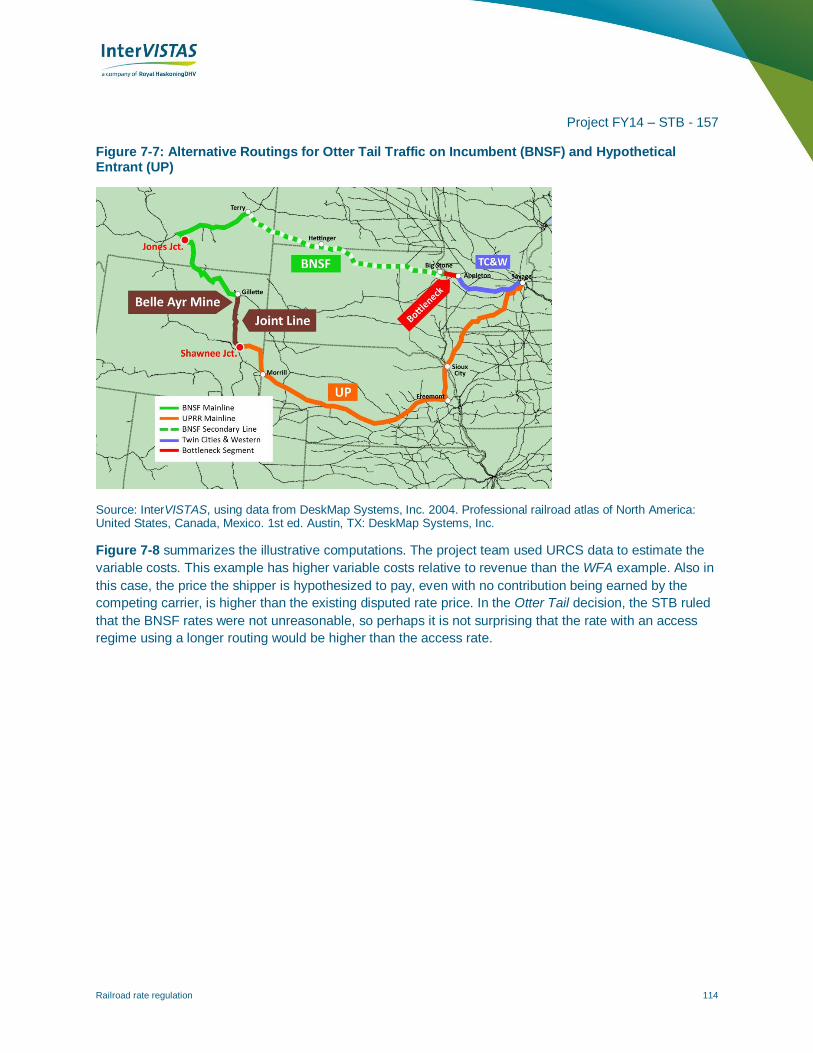
Project FY14 – STB - 157
Railroad rate regulation 114
Figure 7-7: Alternative Routings for Otter Tail Traffic on Incumbent (BNSF) and Hypothetical Entrant (UP)
Source: InterVISTAS, using data from DeskMap Systems, Inc. 2004. Professional railroad atlas of North America: United States, Canada, Mexico. 1st ed. Austin, TX: DeskMap Systems, Inc.
Figure 7-8 summarizes the illustrative computations. The project team used URCS data to estimate the
variable costs. This example has higher variable costs relative to revenue than the WFA example. Also in
this case, the price the shipper is hypothesized to pay, even with no contribution being earned by the
competing carrier, is higher than the existing disputed rate price. In the Otter Tail decision, the STB ruled
that the BNSF rates were not unreasonable, so perhaps it is not surprising that the rate with an access
regime using a longer routing would be higher than the access rate.
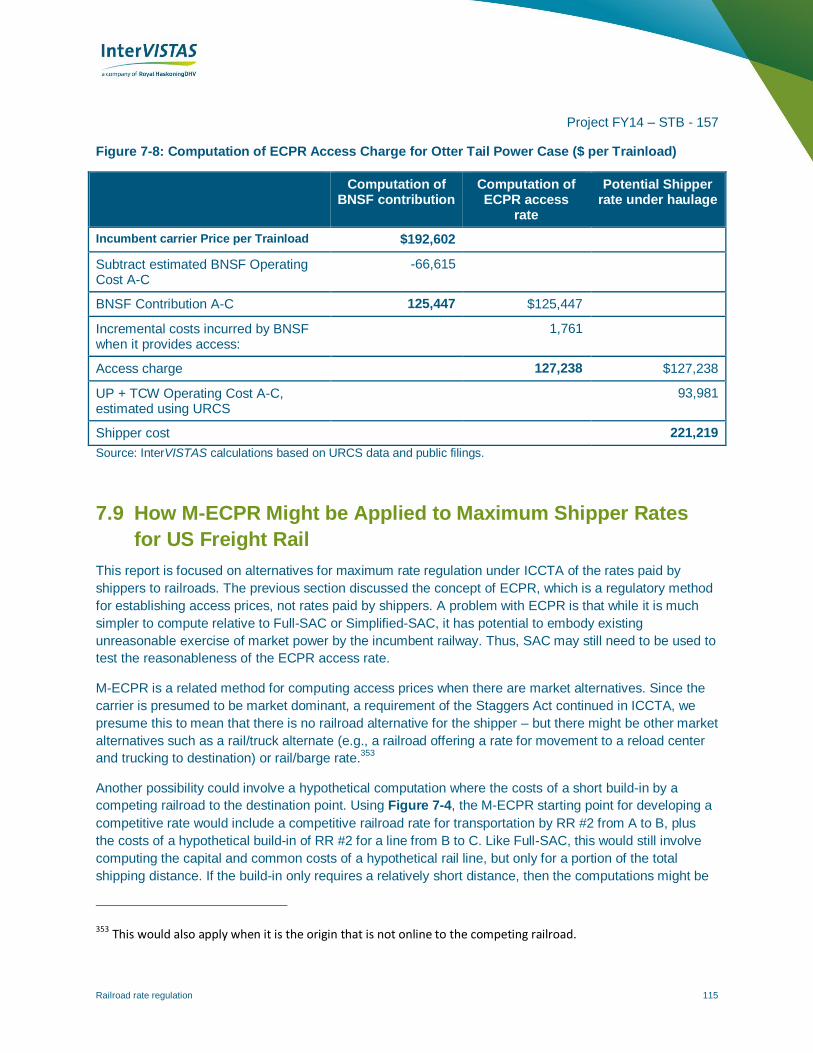
Project FY14 – STB - 157
Railroad rate regulation 115
Figure 7-8: Computation of ECPR Access Charge for Otter Tail Power Case ($ per Trainload)
Computation of BNSF contribution
Computation of ECPR access
rate
Potential Shipper rate under haulage
Incumbent carrier Price per Trainload $192,602
Subtract estimated BNSF Operating Cost A-C
-66,615
BNSF Contribution A-C 125,447 $125,447
Incremental costs incurred by BNSF when it provides access:
1,761
Access charge 127,238 $127,238
UP + TCW Operating Cost A-C, estimated using URCS
93,981
Shipper cost 221,219
Source: InterVISTAS calculations based on URCS data and public filings.
7.9 How M-ECPR Might be Applied to Maximum Shipper Rates
for US Freight Rail
This report is focused on alternatives for maximum rate regulation under ICCTA of the rates paid by
shippers to railroads. The previous section discussed the concept of ECPR, which is a regulatory method
for establishing access prices, not rates paid by shippers. A problem with ECPR is that while it is much
simpler to compute relative to Full-SAC or Simplified-SAC, it has potential to embody existing
unreasonable exercise of market power by the incumbent railway. Thus, SAC may still need to be used to
test the reasonableness of the ECPR access rate.
M-ECPR is a related method for computing access prices when there are market alternatives. Since the
carrier is presumed to be market dominant, a requirement of the Staggers Act continued in ICCTA, we
presume this to mean that there is no railroad alternative for the shipper – but there might be other market
alternatives such as a rail/truck alternate (e.g., a railroad offering a rate for movement to a reload center
and trucking to destination) or rail/barge rate.353
Another possibility could involve a hypothetical computation where the costs of a short build-in by a
competing railroad to the destination point. Using Figure 7-4, the M-ECPR starting point for developing a
competitive rate would include a competitive railroad rate for transportation by RR #2 from A to B, plus
the costs of a hypothetical build-in of RR #2 for a line from B to C. Like Full-SAC, this would still involve
computing the capital and common costs of a hypothetical rail line, but only for a portion of the total
shipping distance. If the build-in only requires a relatively short distance, then the computations might be
353 This would also apply when it is the origin that is not online to the competing railroad.

Project FY14 – STB - 157
Railroad rate regulation 116
much simpler than Full-SAC. The computations would also be simpler than Full-SAC, because there is no
allowance for contribution from other traffic on the short build-in segment.354
The rate for transportation by
RR #2 from A- to C would be equal to its charge for the competitive segment from A to B plus the M-
ECPR-determined build-in cost.
Put simply, an alternative to Full-SAC could be to use a multi-modal market shipper rate, or to compute a
hypothetical shipper rate using a rate quoted by a competing carrier to the bottleneck point, and add the
hypothetical cost for the competing carrier to build in to the destination.
M-ECPR method 1: Multi-modal shipper rate. The first of these alternatives could be quite simple. The
current Full-SAC (as well as Simplified-SAC) involves estimating the costs of full origin to destination
single mode (rail only) movement. If a shipper can obtain a quote from a competing rail carrier for an
origin-destination movement using the competing rail carrier for most of the distance and a truck
movement for part of the distance, then that multi-modal rate becomes the M-ECPR shipper rate.
There is no need for the shipper to have a single quote for the traffic. M-ECPR would accept a rate which
adds a rail rate on a competing railroad from A to B and a trucking (or barge) rate from B to C, plus the
costs of handling at B to change modes (referring again to the segments shown in Figure 7-4).
While this method is much simpler than Full-SAC or Simplified-SAC, there are limitations:
The multi-modal rates for many commodities, especially but not confined to coal, are likely to be
very high and not suitable as a maximum rate methodology for such cases.355
The shipper may be unable to obtain a rate quote from a competing carrier for the movement
from A to B. If the competing carrier perceives that there is little prospect of winning the traffic and
its role is merely to enable a regulated maximum rate on another carrier it may decide to not
cooperate. We note that in Canada, the need for a shipper to obtain a partial distance rate on a
competing carrier has been problematic according to some shippers, with carriers not being
willing to quote such rates. On the other hand, game theorists might view that a competing carrier
would be motivated to quote low rates for such traffic in order to reduce revenue to a competing
carrier.
M-ECRP method 2: Build-in rates. Like M-ECPR method 1, this method would require a rate quote from
a competing carrier for the A to B segment in Figure 7-4. It then would require computation of the costs
354 Making allowance for contribution from other traffic would violate a key tenet of ECPR, which is to keep the incumbent railroad revenue adequate without raising rates on its other shippers. The ECPR access rate does this tautologically. The M-ECPR rate could leave the incumbent railroad worse off financially, but without the need to increase charges on other shippers since the resulting compensation to the incumbent is based on a competitive rate that includes the fixed and common costs needed. In other words, the M-ECPR access charge would squeeze out any unreasonable contribution currently reaped by the incumbent railroad, but providing an adequate contribution. 355 There are some cases of heavy haul multimodal movements using rail/truck. For example, BNSF has moved Alaska zinc concentrate from Vancouver to Trail BC using a rail movement for most of the distance and trucking for few miles from the railhead to the smelter. CP Rail is able to move the traffic on-line, although both carriers require use of interswitching on CN at the origin point. While on-line, the CP Rail distance is longer.

Project FY14 – STB - 157
Railroad rate regulation 117
for a hypothetical build-in of a (presumably) short line from B to C. This exercise would be similar to parts
of the SAC methodology in that the capital and operating costs of the B to C segment would need to be
computed and then converted to an annual rate supplement (supplemental to the A to B rate). Like SAC,
there would be contentious issues regarding the potential route, although presumably this would be less
onerous since it involves only a portion of the total shipment distance. As indicated earlier there would be
no need to estimate contribution from other traffic on the short build-in segment.356
The regulated
maximum rate to be paid by the shipper from A to C would then become the sum of the competitive rate
from A to B from another carrier, plus the annualized amount of the build-in cost from B to C.
Some disadvantages of this method are:
The build-in rates require a competitive rate from A to B. Competing carriers may be unwilling to
provide such a rate, or alternatively might ‘game’ such a rate to reduce revenues to a competitor.
The method requires an exercise not dissimilar to SAC to estimate the cost of build-in and
annualizing such costs to construct the rate.
An alternative that might be considered is for the STB to merely establish a rate from B to C on the
incumbent railroad, and leave the shipper to find a suitable rate (from the incumbent or a competing
carrier) on the A to B segment. This becomes a regulated interline rate. It is not dissimilar conceptually
(although not computationally) to the Competitive Line Rate regulatory provision in Canada. The Canada
Transportation Agency establishes a B to C rate on the incumbent carrier which the shipper then
combines with a competitive A to B rate.357
This provision is seldom used in Canada.
7.10 Illustrative Example of an M-ECPR Method 2 (Build-in)
Regulated Rate
Gainesville Regional Utilities. To illustrate the concept of the M-ECPR, method 2 (build-in) regulated
rate, a 1990 example is used where Gainesville Regional Utilities (GRU) in Florida threatened to build a
21-mile spur to connect with Norfolk Southern Railway.358
Figure 7-9 illustrates the existing route on
CSX, and shows an alternative using Norfolk Southern to Lake Butler, FL, and then the 21-mile spur for
delivery. NS is able to get close to the final destination but the final gap prevents it from offering service.
GRU opened discussions with NS and completed certain advanced work on the capital and operating
costs of a build-out, including purchasing right of way, completing wetlands surveys, submitting permitting
applications for construction design, and other matters. It appeared that the utility and the competing
carrier were willing to commit to the build-in, but the incumbent carrier offered a lower rate that satisfied
356 The ECPR principles would preclude diverting other revenue from the incumbent shipper; hence no contribution from other traffic would be appropriate if such traffic would be diverted from the incumbent. If there was totally new traffic, perhaps diverted from another mode, then contribution from such traffic could be considered by the M-ECPR methodology. 357 There are a number of subtleties to the CLR provisions in Canada which are not covered here, where only a conceptual discussion is being provided. 358 This case is discussed in Brandenburger, Adam M. and Barry J. Nalebuff, Co-Opetition (New York: Crown Business, 2011) 76-80.

Project FY14 – STB - 157
Railroad rate regulation 118
GRU. In this instance, the threat to CSX’s market dominance of the traffic resulted in the carrier reducing
GRU’s rate by nearly 24 percent. This was estimated to cost CSX a present value of $34 million over the
life of the contract,359
but CSX prevented the build-in and preserved some contribution to fixed costs.
Notably, CSX argued it would have had little reason to continue operating and maintaining the line to
GRU’s Deerhaven Generating Station if the build-in occurred, and thus if the utility constructed the build
in and moved the traffic to NS, the line would have been abandoned.360
In this case, it appears that threat
of the build in resulted in a reduced shipper rate but preserved a contribution to the carrier’s costs
sufficient to prevent line discontinuance. However it should perhaps also be noted that the market worked
out a solution without the need for maximum rate regulation. The case would have involved the need to
use another regulatory provision, an authorization to build-in a new 21 mile rail line, as well as various
environmental hurdles, but it did not need regulatory rate intervention to obtain a lower rate for the GRU.
Figure 7-9: Threatened Build-Out by Gainesville Regional Utilities
Source: InterVISTAS, using data from Brandenburger, Adam M., and Barry J. Nalebuff. Co-opetition. Crown Business, 2011, and DeskMap Systems, Inc. 2004. Professional railroad atlas of North America: United States, Canada, Mexico. 1st ed. Austin, TX: DeskMap Systems, Inc.
359 Ibid. 360 Ibid.
Project FY14 – STB - 157
Railroad rate regulation 119
8 Summary and Conclusions
8.1 Context
The regulatory reform of the U.S. railway industry in the 1970s-1980s was a dramatic development, not
only in the economics of the railroad industry in the U.S., but also more generally. Often attributed to the
Staggers Rail Act of 1980, rail regulatory reform began earlier with the 3R Act (Regional Rail
Reorganization Act of 1973), followed by the 4R Act (Regulatory Reform and Revitalization Act of 1976).
Collectively, these pieces of legislation set the stage for a dramatic recovery of the financial health of the
U.S. railroad industry, an equally dramatic reduction in real rates paid by shippers, and improvements in
the level of service offered.
At the core of the 1976-1980 regulatory reform was deregulation of rail rates where competitive forces of
various types would generally be sufficient to constrain carriers’ market power. It was recognized that
there were various types of competition acting upon rail carriers, including competition from other rail
carriers and competition from other modes (primarily truck, barge and pipeline). The deregulated regime
generally allows carriers and shippers to reach mutually agreed rates without any need for regulatory
oversight.
At the same time, Congress recognized that not all shipments would have market conditions that could
constrain potential undue exercise of market power by rail carriers, and it made provision for regulation of
rail rates in such cases. The new regulatory provisions had a number of important dimensions. Among
these were:
Regulation would not be ex ante, but rather would originate upon complaint of the shipper.
Market dominance of the carrier would need to be established for the specific traffic in dispute.
A cost-based threshold (180% of URCS variable costs) would be established, under which rates
would be conclusively presumed to not be unreasonable.
An ability to designate certain types of commodities or shipment types as facing sufficiently
competitive conditions that they could be exempted from regulatory review.
By themselves, these provisions positively changed the regulatory dynamic of shipping products by rail
for a large portion of shipments, and for many shipments ended what had been a rate regulation process
sometimes lasting a decade.
In implementing the post-Staggers regulatory regime, the primary rate regulation methodology utilized by
the ICC and now the STB is the Stand Alone Cost (SAC) test. It is part of a general regulatory approach
referred to as Constrained Market Pricing (CMP), discussed in Section 2.4 and Chapter 4. The SAC
methodology has at its core the concept that the shipper should never pay more than it would cost to self-
provide the rail services it needs. However, the methodology does not naively assume that there would
be no other traffic contributing to the fixed and variable costs of operating the rail service. Instead, the
methodology recognizes that there can be revenues and resulting contributions above variable costs from
other traffic that would use the shipper’s rail operation. But this contribution is confined to traffic that

Project FY14 – STB - 157
Railroad rate regulation 120
would use the line needed by the complaining shipper. The methodology does not allow cross subsidy of
the shipper’s operation from other parts of the network not used by the shipper.
Within the framework of CMP, the STB has complemented the Full-SAC test with both a Simplified-SAC
process and for even smaller shipments the Three-Benchmark test, based on comparing the contested
rate against the rates paid by comparable traffic and the financial need of the carrier.
Over time, however, the STB has become increasingly concerned about the high costs and other
difficulties that shippers face in bringing complaints for rate relief from the STB. Thirty-five years after the
Staggers Act, when the financial condition of the rail industry was abysmal, U.S. Class I railroads are now
generally profitable. Shippers have raised concerns about whether the regulatory structure established
by the STB, even with the introduction of the Three-Benchmark and Simplified-SAC alternatives, now
fairly balances their interests in reasonable rates and services against the goal of helping the carriers
return to financial stability and viability. This report is part of its examination of the STB’s methodologies
and procedures for rate relief complaints.
8.2 Objectives of the Study
Against this broad backdrop, the STB sought an independent assessment of its approach to reviewing rail
rate reasonableness. The STB initiated this study to examine the academic and scholarly literature that
addresses proposed alternatives to all or part of the STB’s current rate regulation methodologies. The
general research questions that this report sought to answer were:
What methodologies do other national regulatory agencies apply to examine the reasonableness
of rates levied by railroads, utilities, natural monopolies, or other network industries, and are any
of those approaches suitable for the STB’s purposes, given its statutory responsibilities and
limitations?
Is SAC still a valid instrument to determine the reasonableness of rates?
Can that procedure be simplified?
8.3 Review of Regulatory Methods Applied to Network Industries
The project team analyzed a large body of literature and practices of rail regulators in other countries to
identify potential alternative methodologies to the existing maximum rate regulation used in the U.S. rail
industry. The literature review encompassed economics, business and law journals and books to identify
relevant material to provide the STB with detailed recommendations on potential alternative rate
regulation approaches and methodologies. As well, we looked at regulatory documents in other countries
and in other regulated sectors. The team organized the literature review by category to cover a wide
range of rate regulation aspects.
The first category of papers analyzed dealt with the theoretical foundation of the concepts of
Ramsey-Boiteux prices, cross-subsidization, rate reasonableness and the stand-alone cost test.
This category encompassed the original work of Marcel Boiteux, Gerald R. Faulhaber, William J.
Baumol, and Robert D. Willig and subsequent publications related to these concepts.
The second category of papers described the existing rail regulatory regimes in other countries
and identified the use of the SAC concepts by rail regulators in other jurisdictions. While

Project FY14 – STB - 157
Railroad rate regulation 121
European rail regulation is mainly passenger-oriented, the team identified some relevant
experiences with freight rail in the UK and in Australia. These countries have applied a similar
concept to stand-alone cost in their respective rail industries. The regulatory context differs from
the U.S. industry, as the rail industry in these countries is regulated by an open access regime.
Canada uses a final offer arbitration procedure to constrain potential exercise of market power in
lieu of regulation, and because reasons for decisions are not provided by the arbitrator we make
no inference.
A third category of papers deals with rate regulation used in other industries such as electric
utilities, natural gas and telecommunications. These industries have largely adopted access
regimes to constrain rates paid by end users, and the regulatory process focuses not on end
rates paid by customers but on rates paid by independent competing service providers for access
to the network facilities of another service provider. The railroad equivalent would be a regulatory
system governing the rates paid by one operating railroad to another railroad whose track is
used, and not the rates paid by the shipper to operating railway. Regulatory approaches in these
industries are often very specific. For example the telecommunication industry developed the
concept of Total Element Long Run Incremental Cost (TELRIC) to determine the rates to access
the network.
Theoretical Foundations
Ramsey Pricing. Ramsey pricing allows the railroads to use differential pricing based on the willingness
of the shippers to pay for the service, thus generating the needed revenue to cover costs and a
reasonable return but with the minimum traffic or economic efficiency loss.361
None of the papers we
analyzed propose changing this fundamental view. At the same time, however, there is general
agreement that determining Ramsey prices are difficult because the pricing entity must solve for all of the
prices the railroad charges or all the prices it charges on a particular line. The pricing entity would have
to know the price elasticity of demand of other products and shippers as well as the marginal costs to
serve these products. Such information is generally not disclosed by the industry and needs to be
estimated based on statistical analysis of different sources of information. Doing so would be a
challenging exercise.
Stand-Alone Cost. The stand-alone cost (SAC) is a maximum rate that should not be exceeded. The
price the railroads charge could be lower than this amount, but in no case should it exceed this amount.
There are two ways to view the SAC test.
One is to view the SAC test as a proxy for the Ramsey prices. Indeed, a price ceiling that may be
proposed for a service is one based on the Ramsey pricing principles (i.e., prices that maximize the
economic welfare from railroad services when firms cannot charge at marginal cost – because they would
be non-compensatory-- as it is the case in the railroad industry) and are based on a mark-up inversely
361 Ramsey pricing allows the service provider to charge differential rates to different shippers, based in part on their willingness to pay (but always covering all variable costs), but constraining the railroad to no more than covering its total costs (including fixed costs and a reasonable return on invested capital). Conceptually, the set of Ramsey prices (railroad rates) are the ones that maximizes the economic value of rail services to shippers, and hence the nation, without subsidizing the rail carrier.
Project FY14 – STB - 157
Railroad rate regulation 122
proportionate to the elasticity of demand.362
Because the SAC test, as implemented by the STB,
considers contribution from other shippers to line fixed costs, it is “Ramsey-like”.
A second way to view the test is to conceptualize the SAC independently from Ramsey prices and simply
say that no shipper should ever pay a price higher than the one it would incur if it had to build and operate
its own (efficient) railroad. The origin of this approach can be found in Faulhaber’s concept of stand-alone
cost. Faulhaber defined the stand-alone cost of a service or of a group of services as the minimum
amount per unit it would cost to provide the service or group of services if it were offered by a single-
product supplier.
Implications of Revenue Adequacy. Achieving Enterprise Level Revenue Adequacy (ELRA) by the
U.S. railroads does not necessarily mean the SAC test needs to change. Baumol and Willig anticipated
this condition; they said that the revenue adequacy of railroad does not change the stand-alone cost. That
is partly true but there are some subtleties to that conclusion.
First, a railroad might be profitable, but may not be earning a market return on the replacement cost of the
assets the railroad will need to maintain and replace to provide future service. The SAC test is based on
providing revenue adequacy to an efficient railroad so that it earns a reasonable (but no more) return on
their efficient assets, recognizing that replacement costs of actual track and equipment might be more
(e.g., due to inflation and value appreciation) or less (e.g., replacement by more efficient technology) than
historical book costs. Optimal economic decision-making should be based on current values of assets,
not outdated values from perhaps decades ago. Shippers should not be expected to compensate
railroads for overbuilding or overpaying in earlier years or for obsolete/stranded assets, nor should
railways be expected to provide efficient assets for shipper services at rates below what those assets can
command in current markets.
Second, the Staggers Act made it easier for railroads to abandon individual lines that were uneconomic.
In doing so, Congress indicated that valuation should be determined on a rail-line-specific basis and not
on a network-system basis. This means that a railroad can be ELRA but still need to charge higher rates
on a particular line to cover the specific costs of that line. Otherwise, shippers on some routes would need
to cross-subsidize traffic on other routes. This would be to the detriment of those shippers and would
reduce overall economic welfare. As a consequence, a shipper (e.g., a coal shipper) on a low traffic line
may have to pay a very high rate on the line it uses even if the railroad makes some profit someplace
else. Even if the railroad is making overall profit, shippers should make appropriate contributions to the
costs of the line being used. Likewise, a railroad that is revenue inadequate at the enterprise level cannot
defend charging rates that are higher than the SAC level on the ground that the shippers on the market-
dominant segment should cross-subsidize the railroad’s other routes.
362 The phrase “markup inversely proportionate to the elasticity of demand” is the economist’s way of saying that
those with a higher ability to pay should pay more than shippers who can only tolerate small markups before either shipping products by another means or not shipping at all. It is the retention of such price sensitive shippers on the rail network that increases social welfare. And it is in the interest of a price-insensitive shipper to pay to retain the price sensitive shipper on the system. Any contribution from the latter to the railroad’s fixed costs reduces the rates that the former would pay.

Project FY14 – STB - 157
Railroad rate regulation 123
Rail Regulation Applied by Other Countries
The project team reviewed the regulatory frameworks applied to freight rail in several other countries.
These included the United Kingdom, Australia, and Canada. In general, these were not found to be
particularly applicable to the STB’s regulation of the U.S. rail industry because of unique characteristics or
circumstances that were found in those nations.
In Canada, rate relief is available via a commercial final offer arbitration process, in which the
arbitrator selects either the rate offer of the shipper or the carrier, with no allowance for
compromise. Because arbitration decisions are confidential and reasons for decision are not
provided by the arbitrator, the Canadian regime provided no insight on the issue of the STB’s use
of the SAC criteria.
The U.K. has a very different rail transport regime, where the track has been separated into a
nationalized, government-owned infrastructure company and “above the rail” companies operate
trains (freight or passenger) for their customers. There is no maximum rate regulation available to
shippers. The regulator sets prices for access to the rail system. The nationalized track company
in the U.K. is subsidized and its predecessor failed. The U.K. rail regulator did use stand-alone
costing as a methodology for regulating track access charges, but dismissed it as the resulting
charges far exceeded the subsidized rates that the track company used.
Australia also has an access regime and shippers have no recourse to maximum rate regulation.
There is a nationalized track company for the intercity network. Within states, there are vertically
integrated (track and train) railways, but state regulators oversee rates for track access to other
operators on the state tracks. In setting access charges, both federal and some state regulators
have used stand alone cost as a methodology.
While both the U.K. and Australia have made some use of stand-alone costing, because these regimes
subsidize track investments and have no regulatory provision for shippers to appeal rates, there are few
lessons for shipper rate regulation in the U.S.
Regulatory Mechanisms Applied to Other Network Industries
The project team surveyed the regulatory approaches applied to other network industries, focusing on
that used on electricity transmission and telecommunications. Some utilities are regulated via traditional
rate-base rate-of-return or ‘modern’ price cap regulation. However, these are methodologies for setting
(or limiting) all rates for all customers. As such, they are not appropriate for use in the U.S. railroad
industry, where regulatory relief is intended as an exception, with market forces used for rates wherever
possible.
Federal regulators of the telecommunications, electricity and natural gas transmission industries use
some forms of access regulation. The Federal Energy Regulatory Commission (FERC) regulates the
rates for electric transmission, wholesale sales, and related ancillary services in interstate commerce,
principally under the Federal Power Act. It also regulates the rates for interstate natural gas pipeline,
storage and related services under similar provisions of the Natural Gas Act.
The Federal Communications Commission (FCC) regulates the U.S. telecommunications industry. The
mandate given by the Congress to the FCC is fundamentally different from that given to the STB:
facilitate competition at the retail level. In contrast to the Staggers Act, little regard was given to

Project FY14 – STB - 157
Railroad rate regulation 124
promoting the industry’s financial health. Unlike the railroad industry in the 1970s when regulatory reform
legislation was enacted, the major telecommunications companies were not financially challenged. Thus,
telecommunications reform legislation is focused on promoting competition, with little weight given to
revenue adequacy. To make its access regime work, the FCC developed a methodology, TELRIC, for
determining access prices that would promote entry, even if non-compensatory to the host network
owner.
TELRIC is not suitable for US freight rail. To begin with, it is a methodology for access rates not for
shipper rates. The shipper would lose the ability to complain about a carrier’s rate and seek regulatory
relief. TELRIC is motivated solely by injecting competition into existing networks and is not guided by a
legislative revenue adequacy concern. This was perhaps justifiable when the telecommunications was
‘deregulated’ as the existing telecoms had high rates of return, but railroads have a history of revenue
inadequacy, and revenue inadequacy could become a major concern for US freight railroads in such a
regime. TELRIC provides no guidance as to what specific cost allocation methodology should be used
and the investigation showed that the even simple cost allocation methodologies such as a common
percent markup to contribute to fixed costs, or markups based on the shipper’s traffic shares of tons or
revenues (revenue shares involve some circular reasoning) give wildly different results. Because the
TELRIC method provides no guidance between these alternative cost allocation methods, is not
concerned with revenue adequacy, and is an access charge and not a shipper charge, we find no basis
substitute TELRIC for CMP for assessing whether a rail carrier’s rates are unreasonable. In light of these
deficiencies, TELRIC would still be an unacceptable methodology, even if Congress decided to radically
transform rail regulation by enabling widespread access, with or without separation of track from train
operations.
8.4 Is the SAC Test Still Valid?
There have been a number of criticisms about the appropriateness of the STB’s stand-alone cost test as
a rate ceiling in the U.S. rail industry.
The SAC concept might be said to have begun with Faulhaber’s 1975 work on cross-subsidies. Faulhaber
showed that under specific conditions (a natural monopoly situation, economies of joint production, zero
profit constraint, and no cross-elasticities), the price of providing a set of services to a group of customers
is lower than the cost of providing each service individually. The stand-alone cost is then the upper limit
above which each individual has an incentive to provide the service itself. Below the stand-alone cost,
there is no incentive for a particular customer to break the joint economy and to go it alone because the
benefits of the joint economy are redistributed to each customer in the form of lower rates. Faulhaber’s
work was refined and advanced by several papers in the 1970s and 1980s, including most notably in
1982 by Baumol, Panzar and Willig in Contestable Markets and the Theory of Industry Structure. In this
book, the authors showed that in a monopolistic situation, the multi-product incumbent is constrained in
its pricing by the threat of competitor entry. This became the theory of contestable markets.
Baumol and Willig further articulated these concepts in the context of the U.S. rail industry. Their 1983
paper aimed to provide sound economic principles behind the regulation of rate setting in the case of
unsubsidized railroads (i.e., railroads that needed to achieve revenue adequacy on a line based solely on
rates charged to shippers). The authors demonstrated that there are economic principles that promote
economic efficiency and ensure rail carriers can earn adequate revenues when traffic is subject to
Project FY14 – STB - 157
Railroad rate regulation 125
competition in the railroad industry experiencing economies of density. These principles lead to Ramsey
pricing.
Faulhaber subsequently criticized the SAC test, arguing that the original concept was based on the
assumption that the firm is a profit constrained firm with economies of scale and scope and that the
benefits of these economies was being shared between the individual services served by the firm. Thus,
the measure of the SAC for an isolated piece of rail line (the Stand Alone Railroad) would not take into
account the fact that a line is part of a bigger network and hence that the cost for operating that line as
part of a large network may be lower because of economies of scope with the other lines.
In rebuttal, Willig argued that Faulhaber was incorrect because the SAC test actually accounts for the
economies of scope through the revenue contribution from the cross-over traffic.
Having reviewed Faulhaber’s argument and the Willig response, the project team believes that Faulhaber
may have raised a point not considered by Willig. Effectively the bridge traffic contribution is a contribution
to the fixed costs of the stand Alone Railroad (SARR). This is an economy of scope benefit. But the issue
being raised by Faulhaber is whether the marginal cost (the long run variable cost) of the SARR is lower
in the context of a network larger than the SARR. In general, practitioner cost functions (such as URCS)
have equations which have factors that allow costs to be lower at higher traffic volumes, but they do not
have factors that shift the cost relationship down due to the overall network being larger and more
efficient. Econometric enterprise level cost functions that allowed such relationships appeared in the
academic literature in the 1970s and 1980s. That is, there were second order interaction terms between
the network size (and investment in network) and the other factors of production. Unfortunately, such cost
functions are not useful for estimating variable costs of specific traffic movements. A review of the cost
function results from the literature found ambiguous results in this regard. The second order interaction
terms between network size and the other production function (or cost function) terms found both
insignificant coefficients in many cases, or results that were not robust and changed (e.g., changed sign
or magnitude) in different specifications.
We reach the following conclusions in this regard.
First, the existing stand-alone cost methodology does recognize economies of scope with respect
to total costs via the contribution of bridge traffic to the fixed costs of the SARR.
Second, conceptually there could be an additional economies-of-scope effect in reducing the
marginal/variable costs of the traffic in dispute. The STB’s guidance on SAC submissions allows,
and even encourages shippers to consider such economies.
Third, at least one observer has recommended that the SAC methodology should allow shippers
to reflect economies of scope between the SARR and all the other lines in the carrier’s network,
even if in different regions. This is not a recipe for simplification of the SAC methodology, quite
the opposite. It also seems to be at odds with the current provisions for line rationalization and
abandonment originally added by the Staggers Act. By allowing rail carriers to abandon
uneconomic rail lines, these provisions imply a policy that requires rail lines to stand on their own
financially; thus introducing revenue contribution from other lines seems inconsistent with the
legislative provisions.

Project FY14 – STB - 157
Railroad rate regulation 126
8.5 Testing Two Variants of CMP and an Alternative
Methodology, ECPR
This report attempted to examine whether greater use by shippers of Simplified SAC or the Three-
Benchmark method would yield fundamentally different or similar outcomes to those produced by the
more expensive and time-consuming Full-SAC method. Also considered was a variant of an access
pricing regime known by the acronym ECPR. This study applied the four different regulatory schemes
(SAC, Simplified SAC, Three-Benchmark, ECPR variant) to two cases – Western Fuels and Otter Tail - to
examine whether different approaches would yield the same general results, and to provide observations
from those exercises.
The STB’s CMP approach to assessing whether a contested rail rate should be deemed to reflect an
undue exercise of market power allows three methodologies. The choice among these methodologies is
left to the complainant:
Full-SAC
For the shipment in question, a Stand Alone Railroad (SARR) is conceptualized, and the costs of
providing service are estimated. This includes both the capital costs (track, rolling stock) and
operating costs. Capital costs are based on current dollar replacement costs. This is to ensure
that the most efficient means of providing the transportation service needed by the shipper is
adopted. E.g., rather than use existing, potentially aged motive power units (locomotives) that are
in a carrier’s fleet, the SARR would envision using modern, efficient power units. These would be
valued at current cost as the exercise will estimate the cost of providing service in the long term
and this contemplates new equipment that will be employed in service over that span of time.
Two key questions arise in the SAC methodology. The first is the routing for the traffic. In the
early days following the Staggers Act, the industry was fragmented into more than forty Class I
railroads and the carrier hauling the shipper’s traffic often was using indirect routings. SAC allows
the shipper to define a more efficient routing that would result in lower long term total costs
(capital and operating costs) than might be the case for the actual routing. This exercise can be
cumbersome and requires considerable analysis to define the routing and estimate all the costs.
The second key question is what other traffic could utilize the SARR and thus contribute revenue
that would offset the costs of building and operating the hypothetical rail system. The STB allows
the complaining shipper considerable leeway in designing the SARR’s route so that the shipper
can propose a SARR with a somewhat longer or more indirect routing that can attract more
potential traffic (and hence revenue). Note that these two key questions are interrelated – the
routing of the SARR depends not only on the traffic of the complaining shipper, but also on the
potential for capturing other traffic. Issues also arise as to how much revenue should be attributed
to the SARR, as the other shipments typically would only use the SARR for a part of the
shipments’ journeys. More importantly, recent cases have seen attempts by shippers to define
complex SARRs with extensive networks to maximize potential contribution from other traffic.
Netting the contribution from the other traffic from the total costs of the SARR thus left the costs
that would need to be recovered from the complaining shipper’s traffic. Discounted cash flow

Project FY14 – STB - 157
Railroad rate regulation 127
analysis is used in setting the rate for the complaining shipper’s traffic that just covers the total
costs (including a reasonable return on capital) of the SARR. This is, of course, a rough
generalization of the SAC methodology and there are a range of important issues (e.g., the
appropriate cost of capital) to be determined.
Simplified-SAC
To reduce costs to the shipper (and carrier and STB) of the regulatory methodology, Simplified-
SAC makes the key simplification that the existing routing of the disputed traffic is to be used. No
case has been heard to conclusion under this standard, as cases have been initiated and then
settled. Another simplifying assumption is that the analysis is also confined to a single year,
rather than the ten or more years required in Full-SAC.
Three-Benchmark
Relief under this methodology is capped at $4 million.
The Three-Benchmark method is part of the constrained market pricing program and like Full-
SAC and Simplified-SAC is focused on determining the amount of revenue required for the
railroad to cover its costs (including a reasonable return on capital) on the line used by the
disputed traffic. The benchmarks are linked and two of them are determined annually by the STB
for a given carrier. These focus on the mark-up above variable cost required by the railroad to
cover its costs from potentially market dominant traffic (i.e., traffic with a revenue to variable cost,
R/VC, ratio of 180% or higher). The third benchmark is specific to the traffic in dispute and is a
comparable rates method, which determines the average R/VC for comparable traffic.
The Three-Benchmark method embraces the key concepts of Ramsey pricing contained in CMP.
First, revenues are only to be enough to allow the railroad to be revenue adequate. Second, the
use of the comparable rates benchmark embraces the concept of demand based differential
pricing at the core of Ramsey pricing and CMP.
An ECPR alternative
An alternative methodology that has been suggested for use in the rail industry is ECPR. This is a
method for establishing an access price for another railroad to use the tracks of the incumbent
carrier for part of the transportation route. ECPR is a much simpler methodology to compute,
requiring only the existing rate and a measure of variable cost for the incumbent and entrant.
While this establishes an access price, the report looked at how it might be used to estimate the
full shipper rate. The report notes that this methodology, while easy to compute, is not a test of
rate reasonableness, and thus may still require use of SAC or another CMP method.
Testing the alternative methodologies against Full SAC findings
Two past STB Full-SAC cases were selected to test the alternative methodologies. The examples
showed that in one case where the complainant chose full SAC and the Board determined that the carrier

Project FY14 – STB - 157
Railroad rate regulation 128
rates were unreasonable by a large magnitude (Western Fuels) the Simplified-SAC and Three-
Benchmark methods likely would have reached the same conclusion.363
In another case (Otter Tail),
where the STB did not find rates to be unreasonable, Simplified-SAC and Three-Benchmark likely would
have resulted in the same conclusion. This may not always be the case. While the three methods all arise
from the same key principles of CMP, the computational differences could lead to different results in more
complex cases with subtleties.
These results support the choice that the STB currently offers the shipper between full SAC, Simplified
SAC or Three-Benchmark, with the shipper deciding whether full SAC is worth the cost.
The ECPR computations for the same two cases resulted in shipper rates that would be as high as
existing rates. This is because the ECPR method protects the revenue adequacy of the incumbent carrier
by setting an access price for a competing carrier to the tracks of the incumbent that embodies the
existing contribution that the shipper makes. Hence it should not be surprising that ECPR does not
appear to offer rates lower than the shipper’s existing rates. However, the report emphasized a criticism
of ECPR, that it is not a test of rate reasonableness. While ECPR can easily establish an access price to
the tracks of the incumbent carrier that protects the contribution to the fixed and common costs of the
incumbent, the methodology may simply be maintaining any unreasonable exercise of market power by
the incumbent.
8.6 Can the SAC Test Be Simplified?
8.6.1 On the Simplification and Modification of the Three-Benchmark
Approach
The Three-Benchmark test is already relatively simple. The test compares the R/VC markup of the
traffic at issue with the average markup of comparable traffic using Three-Benchmark measures.
Shippers and the railroad only need to compute one of these benchmark measures – STB has already
calculated the other two and made them publicly available.
Shippers and the railroads must first determine whether the rate at issue exceeds the jurisdictional
threshold using the URCS costing program. Then, the shippers and the railroads have to estimate the
average markup of a comparable group that the STB would have determined via final offer arbitration
after each party has submitted its own comparable group. In practice, the only quantitative analysis
required is the selection of the comparable traffic. The computation of the upper boundary of the R/VC is
facilitated by using a template provided by STB’s staff. With available analytical software able to run
different simulations of comparable groups and rail expertise, such a task should be relatively simple for
363 Although the simplified methods adapted would have likely reached the same conclusions, the magnitude of the relief would likely not have been the same. The adapted Three-Benchmark method would result in a smaller rate relief amount than that found using the Full-SAC method (though there would still be rate relief). The results of the adapted Simplified-SAC method would have likely led to a similar magnitude of rate relief.

Project FY14 – STB - 157
Railroad rate regulation 129
shippers. The cost of such an exercise is likely to be below the $4 million relief limit the shipper can seek
over a 5-years period.364
Further simplifications to the Three-Benchmark test would likely reduce its adherence to the CMP
principles. The test was designed to embody the concept of CMP—that is, revenue adequacy and
differential pricing within a range of reasonable prices capped by the stand-alone cost of providing an
efficient service. Using the RSAM and the distribution of the markup on comparable traffic, the test
effectively captures key characteristics of the CMP. Any additional simplification would, in our opinion,
deviate further from these characteristics of CMP and would compromise the nature of the test and its
adherence to the CMP principles.
Initial empirical analyses suggest that the Three-Benchmark test is consistent with Simplified-SAC
and Full-SAC. One reason shippers appear to be reluctant to use the Three-Benchmark test may be the
perceived inability of the test to capture unique characteristics that can be addressed by a Simplified-SAC
or a Full-SAC test. However, the project team’s empirical analysis of two past cases indicates that the
Three-Benchmark test results are consistent with the results of the Simplified-SAC and the Full-SAC test.
Another reason why some may be reluctant to use the Three-Benchmark test is that the comparable rates
are similar to those of the contested traffic, thus not justifying an application. However, this may also be
an indication that the contested rate is consistent with market outcomes. The project team only analyzed
two completed cases; further analysis might be necessary to confirm these initial results. However, this
analysis indicates that the Three-Benchmark test is appropriate to provide some relief at lower cost. If
shippers want to obtain a higher relief, or if they believe that other nuances concerning their shipments
need to be captured to get a more precise result, they can choose the Simplified SAC or the Full-SAC
test.
8.6.2 On the Simplification and Modification of Simplified-SAC
Further simplification of the Simplified SAC could undermine the reliability of the test. The
Simplified-SAC is considered by some to be too complex and expensive, even though it is significantly
simpler than Full SAC as described previously. Two aspects of Full-SAC that add a fair bit of complication
(and hence cost) – the design of the railroad and the determination of cross-over traffic – have already
been simplified in the current Simplified-SAC through requiring the use of the existing line and cross-over
traffic. In the past, the Simplified-SAC test used a benchmark approach to estimate the RPI cost of a
railroad. This approach was considered to provide inaccurate results. The STB thus decided to require a
Full-RPI analysis for the simplified test and removed the limit on the relief. While shippers may want an
approach simpler than the current Simplified-SAC, they may not be ready to make simplifications that
compromise the accuracy of the test.
SAC is the only available test that allows the shippers to avoid cross-subsidization. One reason
why the SAC test is considered to be complex and expensive is because it allows the shippers to benefit
from the economies of scope in the network when determining the appropriate ceiling price. To our
knowledge, this is the only procedure that allows shippers to obtain economy of scope benefits. With an
364 Presumably, a shipper would only want to pursue a rate complaint if the shipper’s cost of the proceeding is less than the potential benefit. Here, the key observation is that the cost of Three-Benchmark method is less than the cost of Simplified-SAC and thus more likely to elicit a complaint.

Project FY14 – STB - 157
Railroad rate regulation 130
access regime such as those used in the freight railroad industry in Australia, the shippers would not have
the opportunity to get such accurate measures. Worse, some of these regimes would allow cross-
subsidization in the network by using uniform pricing approach or would set ceiling that do not take into
account economies of scope and would therefore be higher than the SAC computed in the U.S. railroad
rate cases. The avoidance of cross subsidy in rates paid by railway shippers is one of the key foundations
of CMP and we are of the view that it should continue to be a core principle in rail rate reasonableness
assessment.
Further simplification of Simplified SAC would not necessarily incent shippers to use it. Shippers
would lose the accuracy of the SAC test. Simplification is only possible through a standardized approach
of determining the SAC. A standardized model to estimate the RPI is unlikely to capture the specificities
of each rate case. The current standardized cost system is for example criticized by shippers and the
profession. Shippers are unlikely to use a standardized method that they know provides inaccurate
results.
8.7 Are There Methodologies Other Than CMP that are Simpler?
Rate-base rate-of-return regulation is neither simpler nor appropriate for the U.S. railroad
industry.
Price cap regulation conceptually can be simpler as it involves only periodic reviews and does not
set individual prices. But in practice many price cap regulators have developed increasingly
complicated, lengthy and expensive review processes. More important, price cap methodology
generally would apply to all rates by the carrier and this is not appropriate for the U.S. railroad
industry.
TELRIC is an access price methodology. It is simpler, but it provides no specific guidance on how
to allocate fixed/common costs to shipments. It is not consistent with achieving economic
efficiency.
ECPR is another access price methodology. It too is simpler to compute. However, it is not a
methodology for assessing rate reasonableness and thus is not appropriate for use in maximum
rate regulation of shipper rates.
The research has not pointed to a simpler methodology than the three CMP methods that assess rate
reasonableness consistent with the statutory requirement to take into account carrier revenue adequacy
and encourage achievement of the highest possible level of economic efficiency/economic welfare.
Another question that could be raised is whether Full-SAC is worth the expense, time and effort.
Our evaluation is that in general it is not, but there may be circumstances where it would be appropriate.
The most time-consuming and expensive elements of the Full-SAC are the definition of the route, the
identification of potential cross-over traffic, and the assignment of revenue from such traffic. These are
also the primary differences with Simplified-SAC. Prior to the consolidation of the railroad industry via
mergers (and some railroad bankruptcies/failures) and the extensive rationalization of track and
equipment assets, the route definition and cross-over traffic identification/quantification were important
steps in CMP to ensure the shipper was not paying for assets and operating costs that were inefficient
due to historical evolution of the rail network and asset base. As the decades passed, much of the

Project FY14 – STB - 157
Railroad rate regulation 131
historical inefficiencies of the carriers have been addressed and either eliminated or substantially reduced
in magnitude.
To us, the issue becomes one of whether Full-SAC will identify actual inefficiencies of significant
magnitude to justify the cost of adjudication, or whether it merely creates opportunities to design indirect
routes that seek opportunities to capture traffic that would not move over a more direct line. The latter
option carries the potential of designing in new inefficiencies.
Our re-analysis of two settled cases suggests that the simpler methods led to the same outcome
regarding whether the carrier’s rate is unreasonable, at least for these two cases. We expect that when
the difference is close between a rate that is reasonable versus one that may be unreasonable, the
difference in outcome can be explained via the use of different methodologies. Where the difference is
more decisive, it is likely that the methodologies will yield different results. In the former case, the shipper
will have to weigh the cost of using the more thorough methodology. The existing but more complex
methodology is still available.
We endorse the decision of the STB that no longer requires the use of Full-SAC and removes the limit on
rate relief for the Simplified-SAC method. We recommend that the STB should ensure that when the
shipper does choose the Full-SAC approach, the critical elements of identifying a more efficient route,
relevant cross-over traffic and revenue assignment from the cross-over traffic reflect genuine
inefficiencies in the existing operations and route.

Project FY14 – STB - 157
Railroad rate regulation 132
9 Synopsis of Key Conclusions
Is the time and expense of Full-SAC justifiable?
More so than was the case in the 1980s, the management efficiency constraint of CMP is
embodied in a rationalized rail network and much more productive railroad operations. This
supports increasing use of the Simplified-SAC rather than Full-SAC.
Thus, our observation is that use of Full-SAC generally is difficult to justify, although it may be
important in certain cases, where there are clear indications of management inefficiency. In such
cases, the magnitude of revenue difference may more than offset the costs of the Full-SAC
proceeding, especially when there are unique factors of the shipment or rail line that need to be
fully considered.
The research indicates that some large revenue cases could be done using the Simplified-SAC or
Three-Benchmark methods. Our examples showed that in one case where the STB used Full-
SAC and determined that the carrier rates were unreasonable by a large magnitude (Western
Fuels), it likely would have reached the same conclusion using Simplified-SAC or Three-
Benchmark. In another case (Otter Tail), where the STB found rates to reasonable, both
Simplified-SAC and Three-Benchmark likely would have resulted in the same conclusion.
Can STB’s SAC tests be further simplified or modified?
The Three-Benchmark test is already relatively simple and straightforward. The Team’s initial
empirical analyses of two cases found that the Three-Benchmark test results are consistent with
the results of the Simplified-SAC and the Full-SAC test. Further simplifications to the Three-
Benchmark test would likely reduce its adherence to the CMP principles. Further analyses of
other settled cases may be warranted to increase the confidence of our findings and conclusions.
Similarly, the Team is skeptical of any further simplification of the Simplified-SAC, which could
undermine the test’s reliability. In addition, further simplification of Simplified-SAC would not
necessarily incentivize shippers to use it.
Are there alternatives to CMP?
The research examined some alternatives to SAC and found that they would not satisfy the goal of the
research, i.e., to reduce the time, complexity and expense historically involved in the litigation and
resolution of rate reasonableness complaints in a way that is consistent with the Board’s governing
statute.
The other nations with modern freight railways (Canada, the UK, and Australia) either do not have
maximum rate regulation (e.g., Canada, which uses commercial arbitration to resolve rate
disputes) or have separated track and train operation (the UK and Australia) and confine
regulation to access charges. In the UK and Australia, shippers do not have any access to
maximum rate regulation. Interestingly, the latter two have made some use of SAC, but because
they subsidise their track operators, the use of SAC is complicated and in some cases irrelevant
(because the SAC rates far exceed the subsidised cost of track access). Unless Congress wishes
to make a fundamental regime change to track separation and/or access, the UK and Australian
approaches provide little guidance to the STB regarding maximum shipper rate regulation.

Project FY14 – STB - 157
Railroad rate regulation 133
The study looked at maximum rate regulation in utility sectors, where either rate-base rate-of-
return or price cap regulation is used. These are not suitable for US railroad freight rate
regulation, as these methods either directly or indirectly regulate all rates of the utility, which is
not the intent of Congress under the Staggers Act as carried forth in ICCTA. As well, rate-base
rate-of- return regulation is not a simpler methodology, and price cap regulatory proceedings
have become increasingly complex, time consuming and expensive.
The study looked at a simpler methodology used in telecommunications, TELRIC. While simpler
to implement than SAC, TELRIC is not suitable for US freight rail. To begin with, it is a
methodology for access rates and not for shippers’ rates. A shipper would lose the ability to
complain about a carrier’s rate and seek regulatory relief. The FCC adopted TELRIC to meet the
legislative requirement of the Telecommunications Act of 1996 to inject competition into existing
telecommunications networks and was not guided by a revenue adequacy concern. This was
perhaps justifiable as part of telecommunications industry “deregulation,” as the existing
telecomm companies already had high rates of return. But the revenue inadequacy of the U.S.
freight rail industry was a major concern that animated the Staggers Act and could become so
again under TELRIC. TELRIC provides no guidance as to what methodology should be used to
allocate common and unattributable costs, and our analysis demonstrates that the simple cost
allocation methodologies -- such as a common percent mark-up to contribute to fixed costs, or
mark-ups based on the shipper’s traffic shares in tons or revenues -- give wildly different results.
Since the TELRIC method provides no guidance between these alternative cost allocation
methods, because it is not concerned with revenue adequacy, and because it sets an access
charge and not a shipper’s charge, we find no basis for it to be a substitute for CMP for assessing
whether a rail carrier’s rates are unreasonable. Further, in light of these deficiencies, TELRIC
would not be an acceptable methodology even if the Congress decided to transform railroad
policy radically by enabling widespread access, with or without separation of track from train
operations.
The study also looked at ECPR, an easy-to-use access rate methodology proposed by some for
use in rail transport. However, ECPR too is not a methodology for shipper-level maximum rate
regulation. The core principle of ECPR is to protect the contribution to the fixed costs of the
incumbent railroad, with no provision for assessing whether existing revenues for the movement
embody unreasonable monopoly profits. The authors of this methodology acknowledge this
limitation and nevertheless recommend use of SAC to make such an assessment. Hence, ECPR
is neither acceptable as a maximum shipper rate methodology nor as an access rate
methodology.
The study also examined M-ECPR. Its main difference from ECPR is that it uses a ‘market rate’
rather than the incumbent carrier’s existing rate as its starting point. This is a paradox for freight
rail, as the key issue is the lack of a competitive alternative; hence, there is no ‘market rate’
available to consider. However, there may be cases where a market rate could be constructed,
such as a truck-to-reload rate, or a competitive rate for part of the distance, with an add-on rate
constructed for a hypothetical build-in for the final distance. The build-in rate would have to be
constructed using a methodology that is the same or similar to SAC. However, this may be more
straightforward than full SAC for two reasons. First, the distance of the hypothetical build-in rail
segment would be short and easier to cost than full SAC. Second, the ECPR methodology

Project FY14 – STB - 157
Railroad rate regulation 134
specifically rejects use of revenue from cross over traffic, eliminating that expensive aspect of Full
SAC.
The project team’s research found that M-ECPR could be adjusted and potentially used as a
basis for shipper rate regulation in a few cases, such as where truck-to-reload is economically
feasible, or where there is a competitive rail alternative for much of the shipment distance with a
hypothetical build-in for a short distance. The main challenge for this approach to assessing
reasonableness of shipper rates charged by an incumbent carrier is the need to obtain a rate
from a competing carrier for part of the routing. Carriers may be unwilling to provide such rate
quotes knowing that ultimately they are unlikely to get the business unless the shipper is willing to
actually do a line build-in. The study observed one such case, where the threat of a build-in led
the incumbent carrier to lower its rate yet not abandon the line. However, this example of
contestability in the market was resolved commercially by the parties and did not require
regulatory intervention.
In sum, the STB’s Full-SAC method has stood the test of time as a maximum rate reasonableness
methodology and is a justifiable complaint choice in some cases. However, the less expensive Simplified-
SAC and Three-Benchmark approaches are available to shippers and may be a better option for shippers
in many cases.
An access regime could be an alternative to full SAC, but (a) the shipper would lose access to maximum
rate regulation, (b) there would still need to be a regulator to set carrier-to-carrier access prices, and (c)
unless Congress is willing to abandon carrier revenue adequacy as a major objective, the rate
reasonableness methodology for access charges will still be SAC or some equivalent for the most
common disputes, such as coal rates.

Project FY14 – STB - 157
Railroad rate regulation 135
Appendices
Appendix I: Comments on the Debate on the Boundaries of
Economies of Scope
This appendix turns to a debate between the original proponents of the SAC test regarding the scope or
boundaries of economies of scope. This involves a discussion regarding the different calculations of stand
alone cost that were discussed in Chapter 3. For ease of reference, Figure 3.2 is reproduced here and
key terms are restated.
Figure I-1: Different Measures of Rate Reasonableness
Source: InterVISTAS representation
Stand-alone cost SAC1 is the cost incurred by a shipper if it were to form its own company
providing the transportation service for the traffic at issue but no other traffic would use the line. In
the STB’s parlance, SAC1 does not offset the costs of the SARR using potential revenue from
“cross-over traffic”. This SAC is considered unreasonably high as it does not allow the shippers to
benefit from any economies of scope.
SAC2 is the point where the revenue contributions from the other traffic utilizing the line are taken
into account. SAC2 recognizes the benefits of economies of density/scope by modeling the
SARR with traffic other than the complainant shipper. Any rate above SAC2 is unreasonably high.
SAC3 is similar to SAC2 but is further offset by any marginal-cost-reducing effects from
economies of scope. Indeed, economies of scope should reduce variable costs because there
are certain costs that could be partially allocated across the entire enterprise because the railroad

Project FY14 – STB - 157
Railroad rate regulation 136
actually operates in the context of an entire network. Economies of scope would not only produce
a revenue benefit from cross over traffic, it could also reduce the unit cost of providing service.
The argument in this report is that any rate above SAC3 should also be deemed to be
unreasonably high.
As this is a very technical and abstract (although important) discussion in economic theory, a quick
summary is offered.
There were two major proponents of a SAC test: (a) Faulhaber and (b) Baumol (later with Willig).
The debate involves whether the STB’s SAC test considers all sources of economies of scope.
Both Faulhaber and Baumol/Willig agree to use the first type: revenue from cross over traffic on
the SARR. This is what was earlier described as SAC2.
Faulhaber claims there are two additional benefits to the issue traffic of the shipper from
economies of scope. Both are cost reducing effects (distinguished from the revenue offsetting
effect of SAC2). One effect from the presence of other traffic (bridge traffic) on the SARR, the
other from traffic on other lines of the railroad company, potentially in totally different regions.
The first cost reducing benefit (SAC3) is not discussed by Baumol/Willig, but, as explained earlier
in this report, our view is that the presentation of evidence of the cost-reducing effects of
economies of scope on the SARR would be consistent with the STB’s analysis of CMP and SAC.
The second cost reducing benefit (which could be called “SAC 4”) is not shown on the diagram
and, in our view, should not be included in the SAC test for several reasons:
o it would greatly add to the cost and complexity of the SAC test,
o there is ambiguity as to what constitutes the rest of the network, and
o In theory, it could induce the railroad to reorganize in a way that would make it difficult to
attribute economies of scope from other lines to the line at issue.
What follows is a more detailed discussion.
The difference between SAC2 and SAC3 described above is similar to what Gerald Faulhaber described
in a Verified Statement in 2014.365
One of his arguments was that the SAC test does not include any
allowance for economies of scope.366
Our interpretation of Faulhaber’s statement is that there are two
effects that reduce the cost responsibility of the issue traffic: The first is the revenue effect from the cross-
over traffic and the second is the cost reducing effect from the entire network (the entire company). While
he agreed that the revenue effect is taken into account by the STB’s SAC test, we read Faulhaber to be
saying that the cost reducing effect from the entire network may not be taken into account in the
computation. That is, the STB’s test is a SAC2 construct and not a SAC3 concept. Thus, the STB’s SAC
365 Faulhaber, “Verified Statement – Stand-Alone Cost – Response to Comments,” Ex Parte No. 722 (Sub-No. 2) et
al, supra, n. 119. 366 Ibid.

Project FY14 – STB - 157
Railroad rate regulation 137
test would not be able to test appropriately for cross-subsidization of the issue traffic to other traffic on the
SARR.
In his criticism of the stand-alone cost test, Faulhaber recalled that the original concept underlying his
SAC test was that the firm is profit-constrained with economies of scale and scope and that the benefits
of these economies were being shared between the firm’s individual services:
The model of Faulhaber (and later BPW) of a profit-constrained enterprise assumed that the
monopoly firm possessed economies of scale and of scope, thus justifying its monopoly status.
Should the individual services (or group of services) be offered on their own ("stand-alone"), the
total cost to the economy would be greater than if the services were offered by a single
monopolist; this is the meaning of economies of scale and scope. The benefits of realizing these
economies via monopoly could well be shared among the individual services. In fact, the subsidy-
free condition that all services (and subsets thereof) be priced no higher than their stand-alone
cost ensures that all services share in the benefits of economies of scale and scope. Different
services may receive a greater or lesser share of these benefits than others, but all services
might be expected to share to some extent. However, if a particular service is priced exactly at
standalone cost, then by definition, it is sharing none of the benefits of scale and scope. In the
context of cross-subsidy and contestable markets, then, stand-alone costs are an absolute upper
limit on pricing, which in themselves do not permit the sharing of the benefits of the scale and
scope of the firm, and by no means a prescription for rate-setting.367
In essence, Faulhaber was saying that the SAC test does not take into account the potential economies
of scope in the U.S. rail industry. The measure of the SAC for an isolated piece of a railroad company’s
network (the stand-alone railroad) does not take into account the fact that a line is part of a bigger
network and hence that the cost for operating that line as part of a large network may be lower because
of economies of scope with other lines.368
As noted previously, we view Faulhaber as proposing yet another concept, which might be labelled as
SAC4, which has three aspects to economies of scope:
The issue traffic would pay a lower rate due to the revenue contribution from other traffic that
could use the SARR (SAC2).
The issue traffic could pay a lower rate because the presence of other traffic on the SARR
reduces unit cost of traffic (SAC3). We previously stated our view that CMP and SAC principles
should allow the shipper to include such benefits in its SAC submission.
The additional concept is that the issue traffic could pay a lower rate because economies of
scope between the rest of the railroad company’s network and the SARR (SAC4).
Our understanding of what we call Faulhaber’s SAC4 is that the issue traffic can benefit not only from the
revenue contribution and cost reductions created by other traffic that could use the SARR, but also can
367 Ibid., 8.
368 There is also the potential for cost savings related to economies of scale, although Faulhaber focuses his discussion on economies of scope.

Project FY14 – STB - 157
Railroad rate regulation 138
benefit from cost reductions created by traffic elsewhere on the railroad company’s network that does not
have any contact with the SARR line. The concept is that a railroad company that operates many different
lines has lower costs on any given line because of that company’s other lines in other regions.
While the STB has not ruled on the issue, in our judgment SAC4 is not an appropriate maximum rate
under the Full SAC test because of the difficulty of capturing the type of off-SARR cost reductions under
the CMP and SAC principles articulated by the STB. The shipper would now need to develop and put
forward evidence not only on the costs of operating the line needed for its own traffic, but also for the
entire system. Alternatively, this might be done as a simpler cost reduction allowance afforded the shipper
from the cost reducing benefit from the rest of the railroad company’s system. This then raises the issue
as to whether this benefit derives from the actual system, or whether the shipper could construct a
hypothetical railroad company’s network. Further, an effort to impute to the SARR cost reducing
economies of scope from other parts of the incumbent carrier’s network theoretically could induce
railroads to restructure into separate operating companies with separate lines for each license.
Robert Willig’s response to Faulhaber369
Is that Faulhaber erred because the SAC test already accounts
for the economies of scope through the revenue contribution from the cross-over traffic:
The stand-alone cost test empowers a complaining shipper over whom the railroad has market
dominance to include in its test any and all the additional traffic that the shipper believes
contributes economies of scale or scope to the railroad’s provision of its services. Through this
process, the shipper can assure that it shares in the benefits of the railroad’s economies of scale
and scope, since the amount of the stand-alone costs that the complaining shipper’s revenues
may be called upon to cover decreases whenever more traffic can be added to the stand-alone
railroad such that the traffic’s incremental revenue exceeds the additional costs incurred by the
stand-alone railroad to access and handle that additional traffic. The addition to the cost of the
stand-alone railroad due to adding additional traffic is lower, and thus the added traffic is more
beneficial to the complaining shipper, the stronger are the economies of scale and scope.370
But, as we have noted, there is a difference between the concepts described by Faulhaber and Willig.
Faulhaber is saying that there are two effects: the cost-reducing effect of operating the rail line and the
revenue-enhancing effect (i.e., the revenue that can be earned from this asset by adding additional cross-
over traffic). Willig focusses only on the revenue effect. We also interpret Faulhaber as saying that there
are two cost reducing effects from economies of scope: one from the SARR and one from the rest of the
railroad company’s network. The cost-reducing effect of operating the rail line refers to the fact that
because the rail line is part of a bigger network, some common and joint costs are shared at an enterprise
level and that the SAC, in its current form, does not enable the shippers to share the benefits of these
economies of scope.
369 Willig, Robert, “Reply Verified Statement,” Ex Parte No. 722 Railroad Revenue Adequacy, Reply Comments of
the Association of American Railroads, (2014, November 4). 370
Ibid.

Project FY14 – STB - 157
Railroad rate regulation 139
To make the point clearer we present a basic form of the SAC computation:
𝑆𝑡𝑎𝑛𝑑 𝐴𝑙𝑜𝑛𝑒 𝐶𝑜𝑠𝑡 = 𝐹𝐶 + 𝑉𝐶(𝑠ℎ𝑖𝑝𝑝𝑒𝑟′𝑠 𝑡𝑟𝑎𝑓𝑓𝑖𝑐, 𝑜𝑡ℎ𝑒𝑟 𝑡𝑟𝑎𝑓𝑓𝑖𝑐 𝑚𝑜𝑣𝑖𝑛𝑔 𝑜𝑛 𝑡ℎ𝑒 𝑆𝐴𝑅𝑅, 𝑟𝑒𝑠𝑡 𝑜𝑓 𝑡ℎ𝑒 𝑛𝑒𝑡𝑤𝑜𝑟𝑘)
−𝑛𝑒𝑡 𝑟𝑒𝑣𝑒𝑛𝑢𝑒𝑠 𝑜𝑓 𝑡ℎ𝑒 𝑏𝑟𝑖𝑑𝑔𝑒 𝑡𝑟𝑎𝑓𝑓𝑖𝑐
𝑊𝑖𝑡ℎ 𝐹𝐶 = 𝐹𝑖𝑥𝑒𝑑 𝐶𝑜𝑠𝑡 𝑎𝑛𝑑 𝑉𝐶 = 𝑡ℎ𝑒 𝑣𝑎𝑟𝑖𝑎𝑏𝑙𝑒 𝑐𝑜𝑠𝑡 𝑜𝑓 𝑡ℎ𝑒 𝑡𝑟𝑎𝑓𝑓𝑖𝑐 𝑎𝑡 𝑠𝑡𝑎𝑘𝑒
The issue that Faulhaber identified is that there is a cost-reducing effect from the rest of the network that
is not taken into account in the revenues from the cross-over traffic. Since the incumbent railroad
operates a more expansive network, traffic on this network shares common production factors and costs
with the traffic at issue and consequently generates economies of scope on the cost side of the equation.
Willig seemed to suggest that there is only one effect, the revenue effect, and that it covers the cost
effect. That is, the fixed costs are being shared amongst a larger traffic base when the cross-over traffic is
accounted for. While this revenue effect is properly accounted for in the SAC case, it does not take into
account either of the cost reducing effects described by Faulhaber. The STB’s approach to SAC does
allow the shipper to take into account one of Faulhaber’s cost reducing effects, that from other traffic on
the SARR.
As discussed, Faulhaber’s second cost reducing effect, from the rest of the network, must be viewed as
problematic. Including it will only increase the cost of a SAC proceeding, adding considerably to the
shipper’s burden of evidence. There is ambiguity as to what constitutes the network – if the efficient
SARR is a hypothetical construct, could the network also be hypothetical? Where does this end?
Econometric Evidence of the Cost Reducing Effect of Economies of Scope
Having reviewed Faulhaber’s argument and the Willig response, our view is that Faulhaber has raised a
point not considered by Willig: cross-over traffic may have a cost reducing effect/benefit due to
economies of scope. Faulhaber goes further to claim that unrelated traffic on other parts of the railroad
company’s network of routes may also have a cost reducing benefit.
These two cost reducing benefits are conceptual issues raised by Faulhaber. Empirically they might or
might not be relevant. To our knowledge, no detailed study of the cost reducing effects of the network has
been made, but some of the academic empirical cost function work may shed light on the issue.
Econometric enterprise-level cost functions such as appeared in the academic literature in the 1970s and
1980s did allow such relationships. Some of the cost functions shown in the research included second
order interaction terms between the network size (and investment in network) and the other factors of
production. A review of the cost function results from the literature found ambiguous results in this regard.
The second order interaction terms between network size and the other production function (or cost
function) terms found both insignificant coefficients in many cases, or results that were not robust and
changed (e.g., changed sign) in different specifications. These results do not provide strong support for
Cost Reducing Effect
Revenue Effect
Project FY14 – STB - 157
Railroad rate regulation 140
Faulhaber’s conceptual concern. However, these academic studies were not designed to specifically look
at the Faulhaber issues. Perhaps this is an area for further research. In the meantime, the limited
evidence does not point to this being such a major concern that the STB should reconsider its SAC test
and introduce even greater complexity and cost.

Project FY14 – STB - 157
Railroad rate regulation 141
Appendix II: Three-Benchmark Adaptation for Otter Tail v. BNSF
using Eagle Butte as Point of Origin
This appendix provides the results of the Three-Benchmark test adaptation for the Otter Tail case using
Eagle Butte as the point of origin. Results are similar to those presented in the report based on Bel Ayr as
the point of origin.
Results Based on the Current (2007) Simplified Standards for Three-Benchmark
Error! Reference source not found. summarizes the results of the Three-Benchmark approach using
the 2007 RSAM calculation for the traffic originating from the Eagle Butte mine. The bars in varying
shades of grey represent the six different comparable data sets calculated by the project team (described
above), which vary by type of rail car, car ownership, and distance traveled. The “BNSF adjusted R/VC
ratio” was calculated by BNSF for the issue traffic, adjusting for movement specific costs. The
“Unadjusted R/VC (URCS)” was computed by this study’s project team using URCS data, averaging the
R/VC ratios for 2002 and 2003, and calculated using the movement characteristics from the public case
filings.371
The “Otter Tail Adjusted R/VC” is the R/VC for the issue traffic, calculated by Otter Tail, but
adjusting for movement specific costs.
Figure II-1: Results of the Three-Benchmark Using the 2007 RSAM
Source: InterVISTAS calculations based on URCS data and public filings
371 Movement inputs from STB Docket No. 42071, BNSF Opening Evidence, pp. II-14-16 (filed Jun. 13, 2003). The calculations are consistent with the current methodology for calculating R/VC ratios (no movement specific adjustments allowed).
230% 217%
262% 260% 262% 269% 266% 263% 286%
0%
50%
100%
150%
200%
250%
300%
350%
BN
SF R
/VC
Ad
just
ed
Un
adju
sted
R/V
C (
UR
CS)
Sim
ula
ted
3B
-1
Sim
ula
ted
3B
-2
Sim
ula
ted
3B
-3
Sim
ula
ted
3B
-4
Sim
ula
ted
3B
-5
Sim
ula
ted
3B
-6
Ott
er T
ail R
/VC
Ad
just
ed
Eagle Butte

Project FY14 – STB - 157
Railroad rate regulation 142
The results are similar to those using Bel Ayr as point of origin. Based on the unadjusted R/VC (217%)
which is calculated from URCS data, the Three-Benchmark test suggests that the challenged rates are
not unreasonable. This outcome using the Three-Benchmark test, based on the current 2007 RSAM
standards, is consistent with the outcome of the actual STB decision using the Full-SAC methodology.
Results Based on the 2002 Simplified Standards for Three-Benchmark
Similarly, we re-examined what the outcome of the Otter Tail case might have been had the parties used
the Simplified Standards available in 2002. At that time, shippers and railroads were authorized to adjust
the R/VC ratio of the traffic at issue. In addition, the RSAM was not a single measure but a range. The
lower band of the range was the RSAM measure adjusted for the revenue shortfall of traffic priced below
100% while the upper band was the non-adjusted RSAM. The lower band was considered to understate
the revenue requirement to be borne by shippers. The upper band was considered to overstate the
revenue requirement to be borne by shippers:
Error! Reference source not found. illustrates the results of the team’s adapting the Three-Benchmark
approach in effect in 2002, but applying the pre-2007 RSAM calculations which allow for a lower and
upper band. As can be seen in the left-hand graph below, the six calculated Three-Benchmark allowable
R/VC ratios based on the RSAM lower band are below the 180% threshold. The results shown here are
for traffic originating at the Eagle Butte mine.
Figure II-2: Results of the Three-Benchmark Approach Using the Pre-2007 RSAM
Source: InterVISTAS estimates.
Results are similar to those obtained with the Bel Ayr mine. Under the pre-2007 methodology, BNSF’s
adjusted R/VC and the URCS unadjusted R/VC lie in the RSAM range, but Otter Tail’s adjusted R/VC are
above the range. In this particular case, it is not possible to reach a conclusion on the rate
230% 217%
170% 169% 170% 175% 173% 171%
286%
0%
50%
100%
150%
200%
250%
300%
350%
BN
SF R
/VC
Ad
just
ed
Un
adju
sted
R/V
C (
UR
CS)
Sim
ula
ted
3B
- 1
Sim
ula
ted
3B
- 2
Sim
ula
ted
3B
- 3
Sim
ula
ted
3B
- 4
Sim
ula
ted
3B
- 5
Sim
ula
ted
3B
- 6
Ott
er T
ail R
/VC
Ad
just
ed
230% 217%
230% 229% 231% 237% 235% 231%
286%
0%
50%
100%
150%
200%
250%
300%
350%
BN
SF R
/VC
Ad
just
ed
Un
adju
sted
R/V
C (
UR
CS)
Sim
ula
ted
3B
- 1
Sim
ula
ted
3B
- 2
Sim
ula
ted
3B
- 3
Sim
ula
ted
3B
- 4
Sim
ula
ted
3B
- 5
Sim
ula
ted
3B
- 6
Ott
er T
ail R
/VC
Ad
just
ed
Project FY14 – STB - 157
Railroad rate regulation 143
reasonableness because the formula does not indicate whether the comparable should be adjusted
upward or downward. As a result, we cannot reach unambiguous conclusions on the results using the
pre-2007 methodology. As the original Simplified Guidelines stated, “the formula was never intended to
provide a final result, but only a starting point for a more particular analysis.”372
372 Simplified Guidelines, 1 STB at 1043.

Project FY14 – STB - 157
Railroad rate regulation 144
Appendix III: Development of the ECPR Concept for Freight Rail
As discussed in Section 7, as an alternative to direct regulation of rates paid by shippers (i.e. conduct
regulation), Congress could expand the STB’s existing authority to order trackage rights and reciprocal
switching to create an access regime for railroads, a form of structural regulation. The access regime
requires the regulator to not only enable the access by appropriate rules and regulations; it must also
establish the access charges. TELRIC is one methodology for access pricing. ECPR is another, and has
specifically been recommended by some for use in the U.S. railroad industry.373
The concept of ECPR as applied to railroads was first articulated by W.J. Baumol in 1983. In that
analysis, the ECPR was referred to as the “Parity Principle.” Baumol wrote:
The price of trackage rights must, of course, at least cover, among other things, the long-run
incremental cost of the use of the track and facilities by the tenant railroad. This long-run
incremental cost figure must:
Include all the pertinent variable costs caused by the use of trackage rights;
Contribute enough for replacement of the incremental capital used in the process
(i.e., depreciation), where replacement costs must not be valued at the initial (or
historical) cost of the item, but at its cost at the time it will need replacement;
Contribute a fair return on all the landlord’s capital valued at its economic
replacement cost, regardless of the degree of its durability, at the current cost of
capital as given by the earnings against which the landlord railroad must compete for
funds;
Compensate the landlord railroad for any net earnings which it must forego as a
result of the tenant’s use of trackage rights.374
The concept was expanded and rebranded in a 1994 article by Baumol and J Gregory Sidak, which
provides the first use of the term ECPR.375
Some authors have cited the simplicity of ECPR, examples of which are:
The simplicity of this apparently ‘cost-based’ rule seems to be a significant advantage over
Ramsey pricing rules, which require knowledge of various elasticities.376
The well-known ECPR achieves efficient entry by equalizing the access price that an entrant
should pay to the incumbent with the sum of the cost of providing the access and the latter’s
373 See for example, Baumol and Sidak, "The Pricing of Inputs,” 185-186.
374 Baumol, William J., “Some Subtle Pricing Issues in Railroad Regulation,” In Railways, ed. Chris Nash, Mark Wardman, Kenneth Button and Peter Nijkamp, 175-189 (Massachusetts: Edward Elgar Publishing, 2002), Originally published in International Journal of Transport Economics, 10 (1983), 341-355: 349-350. 375 Baumol and Sidak, "The Pricing of Inputs,” 171-202. 376 Armstrong, Doyle, and Vickers, "The Access Pricing Problem,” 131-150.

Project FY14 – STB - 157
Railroad rate regulation 145
opportunity cost (i.e., the incumbent’s retail price mark-up) when the incumbent’s retail price
is regulated”377
The basic logic of efficient component pricing appears to be a robust starting point for policies
to encourage competition and dynamic efficiency while preserving the natural monopoly
efficiencies of the local delivery network.378
Criticisms of ECPR. However, ECPR has also received criticism from economists and regulators,
principally because it could preserve any existing unreasonable exercise of market power by an
incumbent operator in a non-competitive situation.
For example, in Verizon Communications, Inc. v. FCC, 535 U.S. 467 (2002), the Supreme Court upheld
the FCC’s rejection of ECPR (in favor of TELRIC) as a means of determining appropriate access prices to
network bottlenecks:
The FCC rejected ECPR because its calculation of opportunity cost relied on existing retail
prices in monopolistic local-exchange markets, which bore no relation to efficient marginal
cost. We conclude that ECPR is an improper method for setting prices of interconnection and
unbundled network elements because the existing retail prices that would be used to
compute incremental opportunity costs under ECPR are not cost-based. Moreover, the ECPR
does not provide any mechanism for moving prices towards competitive levels; it simply takes
prices as given. In effect, the adjustment for opportunity cost, because it turns on pre-existing
retail prices generated by embedded costs, would pass on the same inefficiencies and be
vulnerable to the same asymmetries of information in ratemaking as a straightforward
embedded-cost scheme.379
The Court further noted:
ECPR advocates have since responded that the FCC was wrong to assume a static tether to
uncompetitive retail prices, because ECPR, properly employed, would dynamically readjust
the opportunity-cost factor as retail prices drop. But this would not cure the distortions caused
by passing any difference between retail price and most efficient cost back to the incumbents
as a lease premium.380
Two prominent critics of ECPR were Nicholas Economides and Lawrence J. White, who authored
numerous articles with titles such as “Access and Interconnections Pricing: How Efficient is the Efficient
Component Pricing Rule?” and “The Inefficiency of the ECPR Yet Again – A Reply to Larson.” The
authors begin by providing faint praise for ECPR.
377 Jeon, Doh‐Shin, and Sjaak Hurkens, "A Retail Benchmarking Approach to Efficient Two‐Way Access Pricing: No
Termination‐Based Price Discrimination," The Rand Journal of Economics 39, no. 3 (2008): 822-849. 378 Crew, Michael A., and Paul R. Kleindorfer, The Economics of Postal Service: A Research Study Supported by WIK (New York: Springer Science & Business Media, 1992). 379 535 U.S. at 514. 380 Ibid., note 32.

Project FY14 – STB - 157
Railroad rate regulation 146
The ECPR has a seductive logic: It insures that a rival producer of the complementary
component can provide service only if that producer is at least as efficient as the monopolist
in the production of the complementary component; i.e., the ECPR insures that production
will not be diverted to the inefficient producer.381
However; the thrust of the Economides and White argument is embodied in the following quotation.
The ECPR … would prescribe that the monopolist's markup or overcharge be a component of
the access fee. Thus, the ECPR would deter inefficient rivals (those with marginal costs that
are higher than the monopolist's MC) and prevent inefficient production. But the ECPR also
protects the monopolist from any competitive challenge by these rivals and thus protects the
monopolist's profits; and the ECPR preserves the allocative or consumption inefficiency that
results from the monopolist's excessively high price for through service.382
Other critics recognize the weakness of protecting monopoly profits, while still acknowledging ECPR’s
strength as a possible regulatory tool. Alfred E. Kahn and William E. Taylor argued that ECPR is a
mechanism for ensuring access of competitors to bottleneck facilities controlled by incumbent
monopolists. They wrote that ECPR could enable competition to achieve “first-order technical efficiency.”
Yet they also recognized ECPR’s potential harm in preserving an incumbent provider’s opportunity cost.
The absolute level of the interconnection charge and the opportunity costs or contribution it
contains are, however, of genuine economic importance. It is this other side of the coin that
we wish Baumol and Sidak had emphasized more than they do. True, as they observe, the
fact that a firm subject to intense competition will seek to recover the net profits that it loses
as a result of making any of its facilities available to competitors means that such a charge
cannot be regarded in itself as monopolistic. But a monopolist too, will seek to recover those
“opportunity costs,” and by so doing recoup in its charges for the essential input such
monopoly profits as it was previously earning from its direct retail sales.383
M-ECPR. In 1996, Sidak collaborated with Daniel F. Spulber, writing about ECPR’s preservation of
inordinately high access prices.384
The paper advanced the concept of a “market determined efficient
pricing rule” (M-ECPR).
When market alternatives are present … the price of those alternatives determines the
opportunity costs of unbundled network services. This constraint on the magnitude of
opportunity costs was not recognized in the earlier literature on the ECPR, perhaps because
Baumol and Willig developed the ECPR in the context of trackage rights in railroading and
interconnection in local telephony – both instances where competition for the bottleneck input
was by definition completely foreclosed.385
381 Economides, Nicholas, and Lawrence J. White, Access and Interconnection Pricing: How Efficient is the Efficient
Component Pricing Rule, 40 Antitrust Bulletin 557 (1995). 382 Ibid. 383 Kahn and Taylor, "Pricing of Inputs Sold to Competitors,” 225. 384 Sidak and Spulber, "The Tragedy of the Telecommons.” 385 Ibid., 1094.

Project FY14 – STB - 157
Railroad rate regulation 147
M-ECPR could be used whether there is an existing or a potential alternative to using the incumbent
carrier (RR #1 in Figure 7-1). This might be, for example, an intermodal movement or an indirect railroad
routing from A to C. However, it could also be a potential new market alternative, such as RR #2 building-
in a new line from B to C. The latter introduces a hypothetical railroad concept, similar to SAC. The M-
ECPR would estimate the A to C rate, including the costs of the build-in, and use that to reverse engineer
an access charge to be paid to RR #1 on B to C. The M-ECPR starts to embrace concepts of SAC,
including specifying a hypothetical railroad line, estimating future costs and requiring coverage of the total
costs of the hypothetical railroad line.
New Zealand supports use of ECPR in Telecommunications Sector. Other nations however have not
rejected ECPR. In 2008, The High Court of New Zealand heard a case brought by New Zealand’s
Commerce Commission against Telecom Corporation of New Zealand Limited and Telecom New Zealand
regarding access prices.386
The Court ruled against the defendant and supported use of ECPR as a
measure for establishing an appropriate price for access to the bottleneck network component.
What does the ECPR rate cover? In a 2000 paper, Beshers developed a set of equations to depict the
components that the ECPR rate must cover and how to compute it.387
Beshers developed the formula in
the context of a movement from A to C, as depicted in Figure 7-4, reproduced below, and discussed in
Section 7.7.
Figure III-1: Railroad Bottleneck
Beshers decomposes the total price charged by an existing monopoly railroad,388
handling a unit of a
commodity between origin (A) and destination (C), as
(IC1) - The incremental cost of operating over the “competitive” segment, plus
(IB) - The incremental cost of operating over the bottleneck segment which it controls , plus
386 ICT Regulation Toolkit. New Zealand Commerce Comm’n v. Telecom Corp. of New Zealand Limited and Telecom
New Zealand Limited, http://www.ictregulationtoolkit.org/en/toolkit/notes/PracticeNote/3277. 387 Beshers, “Efficient Access Pricing,” 21-22. 388 The carrier is a monopoly in the sense that it is the only carrier that is able to transport the shipment by rail the entire journey from A to C. The discussion abstracts from the possibility of competition from another mode (truck) or a multimode operation (rail to B, then truck), or from source of supply or product competition.

Project FY14 – STB - 157
Railroad rate regulation 148
(C1) - The net contribution to fixed costs389
that the incumbent railroad achieves from the entire
move from origin A to destination C
Note that (IC1), the contribution to fixed costs includes not only the contribution to the
fixed costs of track segment from B to C, but also the fixed costs for the track from A to B.
Thus, the total price of a movement (PF1) is as follows:
PF1 = IC1 + IB + C1
Beshers envisioned that the contribution to fixed costs could be computed as a residual by deducting
"incremental costs" per unit from the price or rate charged by RR #1.390
C1= PF1 – (IC1 + IB)
Note that the incumbent carrier controlling the bottleneck segment (RR #1) may be charging an
extraordinarily high rate, which consequently implies a similarly high contribution to fixed cost from the
move from A to C. Assuming, as Beshers does, that the incumbent’s contribution is equivalent to its
opportunity cost, the resulting ECPR access charge would likewise be over-estimated.
For the price that a new entrant carrier would charge under an access regime (RR #2), the notation is
comparable, but with one distinction. A term for the access price for use of the bottleneck segment (PB) is
substituted for the term for the incremental cost of operating over the bottleneck segment (IC1). In
addition, (i) the price that the new entrant would charge to the shipper would also need to reflect some
contribution to the new entrant’s overall operations, C2., and (ii) the term IC2 would include the
incremental costs for RR #2 for hauling the shipment from A to B and from A to C.
PF2 = IC2 + PB + C2
As characterized by Beshers, under ECPR the access price (PB) would be equal to any incremental
bottleneck cost incurred by the incumbent monopolist (e.g., any additional administrative or insurance
costs), plus the opportunity cost of foregone contribution (C1):
PB = IB + C1
The potential to compute SAC with ECPR. Baumol and Sidak391
contended that ECPR’s efficiency “is
confirmed indirectly by the fact that it yields a price level set in precisely the same way it would be in a
perfectly competitive or contestable market.” They say that if the appropriate ECPR-based price is
established for access, rail traffic will assign itself to the more efficient of the two carriers.
389 Beshers envisioned contribution to fixed costs as a residual after deducting "incremental costs" from revenue.
Contribution would necessarily include economic opportunity costs but the latter could be reduced by redeploying resources to other ends. 390 He qualifies his equation by stating that the contribution, the economic opportunity costs to RR #1 if it loses the business to another carrier, could be reduced if it is possible for RR #1 to redeploy fixed resources to other uses. 391 Beshers, “Efficient Access Pricing,” 182.

Project FY14 – STB - 157
Railroad rate regulation 149
An often-cited shortcoming of ECPR is if the
incumbent’s price (PF1 in the above formulae)
provides monopoly profits, then the implied
opportunity cost will also be high, thus ensuring
continued monopoly earnings of the incumbent.392
The solution, according to Baumol and Sidak, is to
impose a “ceiling upon final-product prices” based on
stand-alone cost.393
Therefore, ECPR is not a substitute for stand-alone
cost as a determinant of rate reasonableness, as
ECPR has the ability to preserve an incumbent’s
unacceptably high rates by their inclusion in the
access rate calculation. Consequently, ECPR-based
rates must remain subject to SAC or some other
means of limiting excessive access prices. If ECPR
rates must first satisfy the requirements of SAC, then
it does not represent an easier, more affordable, and
more efficient alternative to STB’s existing full SAC
processes.
392 Ibid., 195-196. 393 Beshers observed that, while final prices cannot exceed SAC, that measure does not encourage the efficiency that is available with ECPR. Ibid., 21-22.
ECPR is not a substitute for stand-alone
cost as a determinant of rate
reasonableness, as ECPR has the ability
to preserve an incumbent’s unacceptably
high rates by their inclusion in the access
rate calculation.
Consequently, ECPR-based rates must
remain subject to SAC or some other
means of limiting excessive access
prices.
If ECPR rates must first satisfy the
requirements of SAC, then it does not
represent an easier, more affordable, and
more efficient alternative to STB’s
existing full SAC processes.

Project FY14 – STB - 157
Railroad rate regulation 150
Appendix IV: Bibliography
Alexandersson, Gunnar and Staffan Hultén. “Competitive Tendering of Railway Services in Sweden:
Extent and Effects 1989-1999.” International Conference Series on Competition and Ownership in
Land Passenger Transport, Thredbo 6 (1999): 1-15. http://www.thredbo-conference-
series.org/downloads/thredbo6_papers/thredbo6-theme1-Alexandersson-Hulten.pdf
Armstrong, Mark, Chris Doyle and John Vickers. “The Access Pricing Problem: A Synthesis.” The Journal
of Industrial Economics 44, no. 2 (1996): 131-150.
Baumol, William J. “Minimum and Maximum Pricing Principles for Residual Regulation.” Eastern
Economic Journal 5, no. 1/2 (1979): 235-248.
Baumol, William J. “Some Subtle Pricing Issues in Railroad Regulation.” In Railways, ed. Chris Nash,
Mark Wardman, Kenneth Button and Peter Nijkamp, 175-189. Massachusetts: Edward Elgar
Publishing, 2002. Originally published in International Journal of Transport Economics, 10 (1983):
341-355.
Baumol, William J., John C. Panzar and Robert D. Willig. Contestable Markets and the Theory of Industry
Structure. New York: Harcourt Brace Jovanovich, Inc., 1982.
Baumol, William J. and J. Gregory Sidak. “The Pricing of Inputs Sold to Competitors.” Yale Journal on
Regulation 11, no.1 (1994): 171-202.
Baumol, William J. and Robert D. Willig. “Pricing Issues in the Deregulation of Railroad Rates.” In
Economic Analysis of Regulated Markets, ed. Jörg Finsinger, 11-47. London: McMillan,1983.
Baumol, William J. and Robert D. Willig. “Price Caps: A Rational Means to Protect Telecommunications
Consumers and Competition.” Review of Business 10, no. 4 (1989): 3-8.
Baumol, William J. and Robert D. Willig. “Competitive Rail Regulation Rules: Should Price Ceilings
Constrain Final Products or Inputs?” Journal of Transportation Economics and Policy 33, no. 1
(1999): 43-53.
Brandenburger, Adam M. and Barry J. Nalebuff. Co-Opetition. New York: Crown Business, 2011.
Bereskin, C. Gregory. “Railroad Economies of Scale, Scope, and Density Revisited.” Journal of the
Transportation Research Forum 48, no. 2 (2009): 23-38.
http://ageconsearch.umn.edu/bitstream/207130/2/2261-4266-1-PB.pdf
Beshers, Eric. “Efficient Access Pricing For Rail Bottlenecks.” Report Prepared for Volpe National
Transportation Systems Center in Support of Federal Railroad Administration, U.S. Department of
Transportation, 2000. https://www.fra.dot.gov/eLib/details/L03017#p1_z5_gD_kbeshers
Bitzan, John D. and Theodore E. Keeler. “The Evolution of U.S. Rail Freight Pricing in the Post-
Deregulation Era: Revenues Versus Marginal Cost for Five Commodity Types.” Transportation
41, no. 2 (2014): 305-324.

Project FY14 – STB - 157
Railroad rate regulation 151
Bleich, Alisa Levin. “Regional Rail Reorganization Act of 1973: Was Congress on the Right Track?” St.
John’s Law Review 49, no. 1 (1974) (republished online 2012): 98-136,
http://scholarship.law.stjohns.edu/lawreview/vol49/iss1/5/
Borrmann, Jörg and Klaus G. Zauner. “Cross-Subsidization When Firms Are Allowed to Make Non-Zero
Profits.” International Journal of the Economics of Business 11, no. 2 (2004): 241-247.
Bradshaw, Bill. “The Privatization of Railways in Britain.” Japan Railway & Transport Review, (September
1996): 15-21.
Braeutigam, Ronald R. “Consequences of Regulatory Reform in the American Railroad Industry.”
Southern Economic Journal 59, no. 3 (1993): 468-480.
Bureau of Transport and Regional Economics (BTRE). Rail Infrastructure Pricing: Principles and Practice.
Report 109. Canberra ACT: BTRE, 2003.
Burton, Mark. “The Economics of Evolving Rail Rate Oversight: Balancing Theory, Practice and
Objectives.” Journal of Transportation Law, Logistics & Policy 81, no. 4 (2014): 267-293.
Campos, Javier and Pedro Cantos. “Rail Transport Regulation.” Economic Development Institute of the
World Bank, 1999.
Cantos, Pedro and Joaquín Maudos. “Regulation and Efficiency: The Case of European Railways.”
Transportation Research Part A 35 (2001): 459-472.
Carlson, L. and J. Nolan. “Pricing Access to Rail Infrastructure in Canada.” Canadian Journal of
Administrative Services 22, no. 1 (2005): 45-57.
Casavant, Ken, Eric Jessup, Marvin E. Prater, Bruce Blanton, Pierre Bahizi, Daniel Nibarger, Johnny Hill
and Issac Weingram. “Rail Rate and Revenue Changes Since the Staggers Act.” Journal of the
Transportation Research Forum 50, no. 1 (2011): 55-77. http://ses.wsu.edu/wp-
content/uploads/2015/03/RailRate.pdf
Church, Jeffery and Roger Ware. Industrial Organization: A Strategic Approach. New York: McGraw-Hill,
2000.
Competition Economists Group Asia Pacific. “Regulatory Framework Post-2020: TSLRIC vs. Building
Block Model.” Report for Chorus, September 2013.
Crew, Michael A. and Paul R. Kleindorfer. The Economics of Postal Service: A Research Study
Supported by WIK. New York: Springer Science and Business Media, 1992.
Crum, Michael R. and Allen, Benjamin J., "U.S. Transportation Merger Policy: Evolution, Current Status,
and Antitrust Considerations" (1986). Supply Chain and Information Systems Publications. Paper
9.
Dempsey, Paul Stephen. “The Rise and Fall of the Interstate Commerce Commission: The Tortuous Path
From Regulation to Deregulation of America’s Infrastructure.” Marquette Law Review 95, no. 4
(2012): 1151-1189.

Project FY14 – STB - 157
Railroad rate regulation 152
Drew, Jeremy. “Rail Freight: The Benefits and Costs of Vertical Separation and Open Access.”
Proceedings of the European Transport Conference 2006: Strands, Association for European
Transport (2006): 1-18.
Drury, George H. The Historical Guide to North American Railroads: Histories, Figures and Features of
more than 160 Railroads Abandoned or Merged since 1930. Waukesha, Wisconsin: Kalmbach
Publishing, 1994.
Economides, Nicholas. "The Tragic Inefficiency of M-ECPR." New York University, Center for Law and
Business, Working Paper 98-003 (1997).
Economides, Nicholas and Lawrence J. White. “Access and Interconnection Pricing: How Efficient is the
Efficient Component Pricing Rule.” The Antitrust Bulletin 40, no. 3 (1995): 557-579.
Edison Electric Institute. “Transmission Investment: Adequate Returns and Regulatory Certainty are Key”
(2013). http://www.eei.org/issuesandpolicy/transmission/Documents/transmission_investment.pdf
Ergas, Henry. “TSLRIC, TELRIC and Other Forms of Forward-Looking Cost Models in
Telecommunications: A Curmudgeon’s Guide.” Center for Research in Network Economics and
Communications, University of Auckland, 1998.
Fagan, Mark. “Introducing Competition into Natural Monopoly Industries: An Evaluation of Mandated
Access to Australian Freight Railroads.” Working Paper 2008-01, A. Taubman Centre for State
and Local Government, John F. Kennedy School of Government, Harvard University, 2008.
Faulhaber, Gerald. “Verified Statement – Railroad Rates for Captive Shipper: Time for Reset.” Ex Parte
No. 722 (Sub-No. 2) Railroad Revenue Adequacy and Ex Parte No. 664 (Sub-No. 2) Petition of
the Western Coal Traffic League to Institute a Rulemaking Proceeding to Abolish the Use of the
Multi-Stage Discounted Cash Flow Model in Determining the Railroad Industry’s Cost of Equity
Capital, Comments submitted by Concerned Shipper Associations, Exhibit A. (2014, September
5): 1-14.
Faulhaber, Gerald R. “Verified Statement – Stand-Alone Cost – Response to Comments.” Ex Parte No.
722 (Sub-No. 2) Railroad Revenue Adequacy and Ex Parte No. 664 (Sub-No. 2) Petition of the
Western Coal Traffic League to Institute a Rulemaking Proceeding to Abolish the Use of the
Multi-Stage Discounted Cash Flow Model in Determining the Railroad Industry’s Cost of Equity
Capital, Reply Comments submitted by Concerned Shipper Associations, Exhibit A. (2014,
November 4): 1-10.
Faulhaber, Gerald R. “Cross-Subsidization: Pricing in Public Enterprises.” The American Economic
Review 65, no. 5 (1975): 966-977.
Faulhaber, Gerald R. “Cross-Subsidy Analysis with More Than Two Services.” Journal of Competition
Law and Economics 1, no. 3 (2005): 441-448.
FERC Division of Energy Market Oversight. “Energy Primer: A Handbook of Energy Market Basics.” Staff
Report, 2015. http://www.ferc.gov/market-oversight/guide/energy-primer.pdf
Fluet, Claude and Yannick Gabuthy. “Conventional versus Final-Offer Arbitration.” Université du Québec
á Montréal and CIRPEE, 2010.
Project FY14 – STB - 157
Railroad rate regulation 153
Gans, Joshua and Stephen King (CoRE Research Pty Ltd). “Comparing TSLRIC and TELRIC: A Report
on Behalf of AAPT Ltd.” Melbourne, Australia, 2003.
https://www.accc.gov.au/system/files/AAPT%20CoRE%20TSLRIC%20%26%20TELRIC-
%20July%202003.pdf
Gillen, David and Francois Tougas. “Transportation Policy, Competition and Economic Growth.”
Proceedings of the Canadian Transportation Research Forum, 46th Annual Conference (2011): 1-
13.
Greenfield, Lawrence R. “An Overview of the Federal Energy Regulatory Commission and Federal
Regulation of Public Utilities in the United States.” Office of the General Counsel, Federal Energy
Regulatory Commission, 2010. http://www.ferc.gov/about/ferc-does/ferc101.pdf
Grimm, Curtis and Clifford Winston. “Competition in the Deregulated Railroad Industry: Sources, Effects
and Policy Issues.” In Deregulation of Network Industries: What’s Next?, ed. Sam Peltzman and
Clifford Winston, 41-71. Washington, D.C.: AEI-Brookings Joint Center for Regulatory Studies,
2000.
Grimm, Curtis M. and Robert G. Harris. “Competition Access Policies in the Rail Freight Industry, with
Comparisons to Telecommunications.” In Opening Networks to Competition: The Regulation and
Pricing of Access, edited by David Gabel and David F. Weiman, 137-157. Boston: Kluwer
Academic Publishers, 1998.
Guetschow, Gregg. “The Creation of Conrail and Its Impact on Railroad Regulation.” Policy Perspectives
8, no. 1 (2009): 13-29.
Hauge, Janice A. and David E. M. Sappington. “Pricing in Network Industries.” In The Oxford Handbook
of Regulation, edited by Robert Baldwin, Martin Cave and Martin Lodge, 462-499. Oxford: Oxford
University Press, 2010.
Heaver, Trevor. “Canadian Railway Service Issues in 2009.” Proceedings of the Canadian Transportation
Research Forum, 44th Annual Conference (2009): 626-640.
Heaver, Trevor D. and James C. Nelson. Railway Pricing Under Commercial Freedom: The Canadian
Experience. Vancouver, British Columbia: The Centre for Transportation Studies, University of
British Columbia, 1977.
Hogan, William W. “Multiple Market-Clearing Prices, Electricity Market Design and Price Manipulation.”
The Electricity Journal 25, no. 4 (2012): 18-32.
The ICT Regulation Toolkit. New Zealand Commerce Commission v. Telecom Corporation of New
Zealand Limited and Telecom New Zealand Limited.
http://www.ictregulationtoolkit.org/en/toolkit/notes/PracticeNote/3277
Interstate Natural Gas Association. “How Are Pipelines Regulated.” http://www.ingaa.org/cms/143.aspx
Jeon, Doh-Shin and Sjaak Hurkens. “A Retail Benchmarking Approach to Efficient Two-Way Access
Pricing: No Termination-Based Price Discrimination.” The Rand Journal of Economics 39, no. 3 (2008):
822-849.

Project FY14 – STB - 157
Railroad rate regulation 154
Joskow, Paul L. “Restructuring, Competition and Regulatory Reform in the U.S. Electricity Sector.”
Journal of Economic Perspectives 11, no. 3 (1997): 119-138.
Joskow, Paul L. “Incentive Regulation in Theory and Practice: Electricity Distribution and Transmission
Networks.” In Economic Regulation and Its Reform: What Have We Learned?, edited by Nancy L.
Rose, 291-344. Chicago: University of Chicago Press, 2014.
Joskow, Paul L. and Catherine F. Wolfram. “Dynamic Pricing of Electricity.” American Economic Review
Papers and Proceedings 102, no. 3 (2012): 381-385.
Kahn, Alfred E. and William E. Taylor. “Pricing of Inputs Sold to Competitors: A Comment.” Yale Journal
of Regulation 11, no. 1 (1994): 225-240.
Keeler, Theodore E. Railroads, Freight, and Public Policy. Washington, D.C.: The Brookings Institution,
1983.
Klevorick, Alvin K. “The Oversight of Restructured Electricity Markets.” In Electricity Deregulation: Choices
and Challenges, edited by James M. Griffin and Steven L. Pullen, 297-316. Chicago: University of
Chicago Press, 2005.
Koa, Tina, Flavio M. Menezes and John Quiggin. “Optimal Access Regulation with Downstream
Competition.” Journal of Regulatory Economics 45, no. 1 (2014): 75-93.
Laquet, Andrew. “The Role of Government in Energy Markets: A Look at the Market-Based Rates
Process, the FERC, and the Future of Energy Markets in America.” Southern Illinois University
Law Journal 37, no. 2 (2013): 395-417.
Macher, Jeffrey T., John W. Mayo and Lee F. Pinkowitz. “Revenue Adequacy: The Good, the Bad and
the Ugly.” Center for Business and Public Policy, Georgetown University, Washington, D.C.
(2014): 1-55.
McCormick, Patrick J. and Sean B. Cunningham. “The Requirements of the ‘Just and Reasonable’
Standard: Legal Bases for Reform of Electric Transmission Rates.” Energy Law Journal 21, no. 2
(2000): 389-446.
Messulam, Pierre and Matthias Finger. “Rail Access Charges.” In Rail Economics, Policy and Regulation
in Europe, edited by Matthias Finger and Pierre Messulam, 323-340. Cheltenham, UK: Edward
Elgar Publishing, 2015.
Miller, Deb. “Testimony of Acting Chairman, STB.” Before the Subcommittee on Railroads, Pipelines, and
Hazardous Materials, Committee on Transportation and Infrastructure, U.S. House of
Representatives, May 13, 2015.
Monteiro, Joseph. “The Competitive Line Rates/Competitive Connection Rates Provision as a Form of
Railway Competitive Access.” Proceedings of the Canadian Transportation Research Forum, 42nd
Annual Conference (2007): 784-798.
Monteiro, Joseph. “Is the Running Rights Provision as a Form of Railway Competition Dead? Competitive
Access -III.” Proceedings of the Canadian Transportation Research Forum, 43rd
Annual
Conference (2008): 177-192.

Project FY14 – STB - 157
Railroad rate regulation 155
Monteiro, Joseph and Benjamin Atkinson. “Final Offer Arbitration – Does it Provide Shippers with More
Competitive Rates.” Proceedings of the Canadian Transportation Research Forum, 44th Annual
Conference (2009): 656-669.
Monteiro, Joseph and Gerald Robertson. “Railways in Canada and the Experience with Regulatory
Reform – with Emphasis on the Competitive Provisions.” Proceedings of the Canadian
Transportation Research Forum, 45th Annual Conference (2010): 487-502.
Monteiro, Joseph and Gerald Robertson. “Grain Transportation in Canada – Deregulation.” Proceedings
of the Canadian Transportation Research Forum, 46th Annual Conference (2011): 1-15.
Montero, Juan Pablo. “A Model of Arbitration in Regulation.” Working paper, Catholic University of Chile,
2003.
Nash, Chris. “Europe: Alternative Models for Restructuring.” In Competition in the Railway Industry: An
International Comparative Analysis, edited by José A. Gómez-Ibáñez and Ginés de Rus, 25-48.
Cheltenham, UK: Edward Elgar Publishing Limited, 2006.
National Grain and Feed Association. “Submission to the Surface Transportation Board.” STB Docket No.
665 (Sub-no. 1), Rail Transportation of Grain, Rate Regulation Review. June 10, 2015.
Nilsson, Jan-Eric. “Restructuring Sweden’s Railways: The Unintentional Deregulation.” Swedish
Economic Policy Review 9, (2002): 229-254.
Office of Electricity Delivery & Energy Reliability. “Learn More About Interconnections.”
http://energy.gov/oe/services/electricity-policy-coordination-and-implementation/transmission-
planning/recovery-act-0
O’Sullivan, Siobhan and Francois Tougas. “Running Rights and the Public Interest.” Proceedings of the
Canadian Transportation Research Forum, 47th Annual Conference (2012): 1-15.
Perritt Jr., Henry H. “Ask and Ye Shall Receive: The Legislative Response to the Northeast Rail Crisis.”
Villanova Law Review 28, no. 2 (1983): 271-377.
Pittman, Russell. “Against the Stand-Alone –Cost Test in U.S. Freight Rail Regulation” Economic Analysis
Group Competition Advocacy Paper, (2010). http://www.justice.gov/atr/against-stand-alone-cost-
test-us-freight-rail-regulation
Productivity Commission. Road and Rail Freight Infrastructure Pricing. Report no. 41, Canberra, 2006.
http://www.pc.gov.au/inquiries/completed/freight/report.
Public Administration Select Committee. “Who’s Accountable? Relationships between Government and
Arm’s-Length Bodies.” United Kingdom House of Commons. First Report of Session 2014-15,
Nov. 10, 2014.
http://www.publications.parliament.uk/pa/cm201415/cmselect/cmpubadm/110/110.pdf
The Regulatory Assistance Project. “Electricity Regulation in the US: A Guide” (2010).
http://www.raponline.org/document/download/id/645

Project FY14 – STB - 157
Railroad rate regulation 156
Rosellón, Juan. “Different Approaches Towards Electricity Transmission Expansion.” Review of Network
Economics 2, no. 3 (2003): 238-269.
Samrout, R., K. Kobia, R. Dallaway, R. Manhas, T. O’Hearn, V. Prakash and W. Wong. “A Comparison of
the Rail Regulatory Regimes in Canada and the United States.” Proceedings of the Canadian
Transportation Research Forum, 44th Annual Conference (2009): 670-684.
Sappington, David E. M. and Dennis L. Weisman. “Price Cap Regulation: What have we Learned from
Twenty-Five Years of Experience in the Telecommunications Industry?” Journal of Regulatory
Economics 38, no. 3 (2010): 227-257.
Schulman, Joseph F. “Dispute Resolution Options in Canadian Freight Transportation.” Proceedings of
the Canadian Transportation Research Forum, 47th Annual Conference (2012): 1-14.
Scott, W.G. Canadian Railway Freight Pricing: Historical and Current Perspectives, 1836-1983. Toronto:
The Ciggit Railway Library Series; Canadian Institute of Guided Ground Transport, Queen’s
University, 1985.
Senate Committee on Commerce, Science, and Transportation, Office of Oversight and Investigations.
“Update on the Financial State of the Class I Freight Rail Industry.” Majority Staff Report,
November 2013.
Sidak, J. Gregory, and William J. Baumol. "The Pricing of Inputs Sold to Competitors: Rejoinder and
Epilogue." Yale Journal on Regulation 12 (1995): 177-186.
Sidak, J. Gregory and Daniel F. Spulber. “The Tragedy of the Telecommons: Government Pricing of
Unbundled Network Elements Under the Telecommunications Act of 1996.” Columbia Law
Review 97, no. 4 (1997): 1081-1161.
Squires, Dale and James Kirkley. “Production Quota in Multiproduct Pacific Fisheries.” Journal of
Environmental Economics and Management 21, no. 2 (1991): 109-126.
Stittle, John. “Accounting for UK Rail Freight Track Charges: Privatisation, Politics and the Pursuit of
Private Sector Vested Interests.” Accounting Forum 28, no. 4 (2004): 403-425.
Tougas, Francois. “Shippers and Railroads: A Canadian Perspective.” Journal of Transportation Law,
Logistics and Policy 73, no. 2 (2006): 220-246.
Tougas, Francois. “Responding to the Market Power of Federal Freight Railways.” Proceedings of the
Canadian Transportation Research Forum, 41st Annual Conference (2006): 344-358.
Tougas, Francois. “Regulatory Efficiency and Equity for Federal Freight Rail Pricing and Service.”
Proceedings of the Canadian Transportation Research Forum, 43rd
Annual Conference (2008):
165-177.
Transport Canada. Vision and Balance: Report of the Canadian Transportation Act Review Panel. 2001.
http://publications.gc.ca/site/eng/9.648223/publication.html.

Project FY14 – STB - 157
Railroad rate regulation 157
Transportation Research Board, Committee for a Study of Freight Rail Transportation and Regulation.
Special Report 318: Modernizing Freight Rail Regulation. Washington DC: Transportation
Research Board, 2015. http://onlinepubs.trb.org/onlinepubs/sr/sr318.pdf
U.S. Department of Agriculture, Comments of the U.S. Department of Agriculture, Before the U.S. Surface
Transportation Board. STB Ex Parte No. 715, Rate Regulation Reforms, October 23, 2012.
U.S. Energy Information Administration. “FERC Order 636: The Restructuring Rule (1992).”
http://www.eia.gov/oil_gas/natural_gas/analysis_publications/ngmajorleg/ferc636.html
U.S. General Accounting Office. “Natural Gas: Costs, Benefits, and Concerns Related to FERC’s Oder
636.” GAO/RCED-94-11. Washington, DC, 1993. https://www.ferc.gov/legal/maj-ord-reg/land-
docs/gao-636study-1993.pdf
U.S. General Accounting Office. “Railroad Regulation: Changes in Railroad Rates and Service Quality
since 1990.” GAO/RCED-99-93. Washington, DC, 1999.
http://www.gao.gov/products/GAO/RCED-99-93.
U.S. General Accounting Office. “Railroad Regulation: Current Issues Associated with the Rate Relief
Process.” GAO/RCED-99-46. Washington, DC, 1999. http://www.gao.gov/products/GAO/RCED-
99-46.
U.S. Government Accountability Office. “Freight Railroads: Industry Health has Improved, but Concerns
about Competition and Capacity Should be Addressed.” GAO-07-94. Washington, DC, 2006.
http://www.gao.gov/new.items/d0794.pdf
U.S. Library of Congress. Congressional Research Service. Electricity Transmission Cost Allocation, by
Richard J. Campbell and Adam Vann. R41193. 2012.
U.S. Library of Congress. Congressional Research Service. “Railroad Access and Competition Issues,”
by John Fritelli. RL34117. 2007.
http://www.publicpower.org/files/PDFs/CRSReportoRailCompetitio80307.pdf
Valletti, Tommaso M. and Antonio Estache. “The Theory of Access Pricing: An Overview for Infrastructure
Regulators.” World Bank Policy Research Working Papers 2133, (1999).
http://elibrary.worldbank.org/doi/abs/10.1596/1813-9450-2097
Viscusi, W. Kip, Joseph E. Harrington, Jr. and John M. Vernon. Economics of Regulation and Antitrust
(Fourth Edition). Cambridge, Massachusetts: The MIT Press, 2005.
Vogelsang, Ingo. “Incentive Regulation and Competition in Public Utility Markets: A 20-Year Perspective.”
Journal of Regulatory Economics 22, no.1 (2002): 5-27.
Vogelsang, Ingo. “Price Regulation of Access to Telecommunications Networks.” Journal of Economic
Literature 41, no. 3 (2003): 830-862.
Willig, Robert. “Reply Verified Statement.” Ex Parte No. 722 Railroad Revenue Adequacy, Reply
Comments of the Association of American Railroads, (2014, November 4): 1-19.

Project FY14 – STB - 157
Railroad rate regulation 158
Wilson, James F. (LECG). “Raising the Stakes on Capacity Incentives: PJM’s Reliability Pricing Model
(RPM).” Report Prepared for The American Public Power Association, 2008.
Winston, Clifford. “The Success of the Staggers Rail Act of 1980.” AEI-Brookings Joint Center for
Regulatory Studies Publication 05-24, 2005.
http://www.brookings.edu/~/media/research/files/papers/2005/10/railact-
winston/10_railact_winston.pdf
Court and Agency Decisions
Atlantic City Electric Co. v. Federal Energy Regulatory Commission, 295 F.3d 1(D.C. Cir. 2002).
Arizona Electric Power Coop., Inc. v. BNSF Railway and Union Pacific Railroad, NOR 42113 (STB served
Nov. 22, 2011).
Australian Rail Track Corporation, Hunter Valley Coal Network Access Undertaking 2014 Compliance
Assessment Submission to Australian Competition & Consumer Commission. April 2015.
Accessible at https://www.accc.gov.au/regulated-infrastructure/rail/artc-hunter-valley-access-
undertaking
Australian Competition and Consumer Commission, Decision In Relation to Australian Rail Track
Corporation’s Hunter Valley Rail Network Undertaking. June 29, 2011. Accessible at
https://www.accc.gov.au/regulated-infrastructure/rail/hunter-valley-access-undertaking-2011
Duke Energy Corp. v. Norfolk Southern Railway, NOR 42069 (STB served Nov. 6, 2003).
Federal Communications Commission, Proposed Rule, “Implementation of the Local Competition
Provisions in the Telecommunications Act of 1996,” 61 Federal Register no. 81 (April 25, 1996):
18311. https://www.gpo.gov/fdsys/pkg/FR-1996-04-25/pdf/96-10128.pdf.
Federal Communications Commission, First Report and Order, FCC 96-325, (Adopted Aug. 1, 1996).
Federal Energy Regulatory Commission, Final Rule. “Pipeline Service Obligations and Revisions to
Regulations Governing Self-Implementing Transportation Under Part 284 of the Commission’s
Regulations; and Regulation of Natural Gas Pipelines After Partial Wellhead Decontrol,” Order
No. 636 (April 8, 1992), 57 Federal Register 13,267 (April 16, 1992),
http://www.ferc.gov/legal/maj-ord-reg/land-docs/restruct.asp
Federal Energy Regulatory Commission, Final Rule, “Promoting Wholesale Competition through Open
Access Non-Discriminatory Transmission Services by Public Utilities; Recovery of Stranded
Costs by Public Utilities and Transmitting Utilities.” 61 Federal Register no. 92 (May 10, 1996):
21540, https://www.gpo.gov/fdsys/pkg/FR-1996-05-10/pdf/96-10694.pdf.
Federal Energy Regulatory Commission, Final Rule, “Regional Transmission Organizations,” 65 Federal
Register 810-959 (January 6, 2000), https://www.gpo.gov/fdsys/pkg/FR-2000-01-06/pdf/00-2.pdf
Project FY14 – STB - 157
Railroad rate regulation 159
Federal Energy Regulatory Commission, Notice of Proposed Rulemaking, “Recovery of Stranded Costs
by Public Utilities and Transmission Utilities,” 59 Federal Register no.131 (July 11, 1994).
https://www.govinfo.gov/content/pkg/FR-1994-07-11/html/94-16626.htm
Federal Energy Regulatory Commission, Notice of Proposed Rulemaking, “Preventing Undue
Discrimination and Preference in Transmission Services,” 71 Federal Register no.108 (June 6,
2006), https://www.gpo.gov/fdsys/pkg/FR-2006-06-06/pdf/06-4904.pdf
Interstate Commerce Commission, Coal Rate Guidelines – Nationwide Ex Parte No. 347 (Sub-no. 1). 1
I.C.C.2d 520 (served Sep. 3, 1985).
Otter Tail Power Co. v. BNSF Railway, NOR 42071 (STB served Jan. 27, 2006), with technical
corrections (STB served Mar.28, 2006).
Phillips Petroleum Co. v. Wisconsin, 347 U.S. 672 (1954).
Public Service Co. of Colorado D/B/A Xcel Energy v. The Burlington Northern and Santa Fe Railway,
NOR 42057 (STB served Jun. 8, 2004).
Public Utility Commission of Rhode Island v. Attleboro Steam Generating Co., 283 U.S. 83 (1927).
Surface Transportation Board, Rate Guidelines – Non-Coal Proceedings, Ex Parte No. 347 (Sub-no. 2). 1
S.T.B. 1004 (Dec. 27, 1996) (“Simplified Guidelines”).
Surface Transportation Board, General Procedures for Presenting Evidence in Stand-Alone Cost Rate
Cases Ex Parte No. 347 (Sub-no. 3), 5 S.T.B. 441(Mar. 9, 2001).
Surface Transportation Board, Simplified Standards for Rail Rate Cases, Ex Parte No. 646 (Sub-no. 1)
(Notice of Proposed Rulemaking, STB served Jul. 26, 2006), (Final Rule, STB served Sept. 5,
2007), (Decision Denying Reconsideration, STB served Mar. 17, 2008).
Surface Transportation Board, Major Issues in Rail Rate Cases, Ex Parte No. 657 (Sub-no. 1). (STB
served Oct. 30, 2006).
Surface Transportation Board, Simplified Standards for Rail Rate Cases – Taxes in Revenue Shortfall
Allocation Method, Ex Parte No. 646 (Sub-no. 2) (STB served May 11, 2009).
Surface Transportation Board, Competition in the Rail Industry, Ex Parte No. 705 (Notice of Request for
Comments, STB served Jan. 11, 2011).
Surface Transportation Board, Rate Regulation Reforms, Ex Parte No. 715 (STB served Jul. 18, 2013).
Surface Transportation Board, 2014 Tax Information for Use in the Revenue Shortfall Allocation Method,
Ex Parte No. 682 (Sub-no. 6) (STB served Jun. 8, 2015).
Surface Transportation Board, Rail Transportation of Grain, Rate Regulation Review, Ex Parte No. 665
(Sub-no. 1) (Notice of Hearing, STB served Jun. 4, 2015).
Surface Transportation Board, Simplified Standards for Rail Rate Cases – 2013 RSAM and R/VC>180
Calculations, Ex Parte No. 689 (Sub-no. 6) (STB served Jun. 16, 2015).

Project FY14 – STB - 157
Railroad rate regulation 160
Transmission Access Policy Study Group v. Federal Energy Regulatory Commission. 225 F.3d 667 (D.C.
Cir. 2000).
US Magnesium v. Union Pacific Railroad Co., NOR 42114 (STB served Jan. 28, 2010).
Verizon Communications, Inc. v. Federal Communications Commission, 535 U.S. 467 (2002).
Western Fuels Association Inc., and Basin Electric Power Coop. v. BNSF Railway, NOR 42088 (STB
served Feb.18, 2009), with technical corrections (STB served Jun.5, 2009).
Statutes and Legislation
Energy Policy Act of 1992, Public Law 102-486,106, 2776–3133 (1992).
Federal Power Act, 16 U.S. Code § 824 et seq.
Interstate Commerce Act, as amended, 49 U.S. Code § 10101 et seq., including references to 49 U.S.C.
§§ 10704(a), 10707(a).
ICC Termination Act of 1995, Public Law 104-88, 109 U.S. Statutes at Large 803-959 (1995).
Natural Gas Act, 15 U.S. Code § 717 et seq.
Natural Gas Policy Act of 1978,15 U.S. Code §§ 3301-3432.
Rail Passenger Service Act of 1970, Public Law 91-518, 84 U.S. Statutes at Large 1327-1342 (1970).
Railroad Revitalization and Regulatory Reform Act of 1976, Public Law 94-210, 90 U.S. Statutes at Large
31-150 (1976).
Staggers Rail Act of 1980, Public Law 96-448, 94 U.S. Statutes at Large 1895-1966 (1980).

Prepared by
InterVISTAS Consulting Inc.
1150 Connecticut Ave, NW
Suite 601
Washington, DC 20036
Telephone: +1-202-688-2220
Facsimile: +1-202-688-2225
www.intervistas.com