surface water assessment of the upper finniss catchment
TRANSCRIPT
Surface Water Assessment of the
Upper Finniss Catchment
Kumar Savadamuthu
Knowledge and Information Division Department of Water, Land and Biodiversity Conservation
October 2003
Report DWLBC 2003/18

Knowledge and Information Division Department of Water, Land and Biodiversity Conservation Level 11, 25 Grenfell Street, Adelaide GPO Box 2834, Adelaide SA 5001 Telephone National (08) 8463 6946 International +61 8 8463 6946 Fax National (08) 8463 6999 International +61 8 8463 6999 Website www.dwlbc.sa.gov.au
Disclaimer
Department of Water, Land and Biodiversity Conservation and its employees do not
warrant or make any representation regarding the use, or results of the use, of the information contained herein as regards to its correctness, accuracy, reliability, currency or otherwise. The Department of Water, Land and Biodiversity Conservation and its employees expressly disclaims all liability or responsibility to any person using the information or advice. © Department of Water, Land and Biodiversity Conservation 2002This work is copyright. Apart from any use as permitted under the Copyright Act 1968 (Cwlth), no part may be reproduced by any process without prior written permission from the Department of Water, Land and Biodiversity Conservation. Requests and inquiries concerning reproduction and rights should be addressed to the Director, Knowledge and Information Division, Department of Water, Land and Biodiversity Conservation, GPO Box 2834, Adelaide SA 5001.
ISBN 0 9751462 4 6
Kumar Savadamuthu, 2003. Surface Water Assessment of the Upper Finniss Catchment. South Australia. Department of Water, Land and Biodiversity Conservation. Report ,DWLBC 2003/18. Cover Photographs
DWLBC, Upper Finniss Catchment
Government
of South Australia

Foreword
South Australia’s water resources are fundamental to the economic and social wellbeing of the State. Water resources are an integral part of our natural resources. In pristine or undeveloped situations, the condition of water resources reflects the equilibrium between rainfall, vegetation and other physical parameters. Development of surface and groundwater resources changes the natural balance and causes degradation. If degradation is small, and the resource retains its utility, the community may assess these changes as being acceptable. However, significant stress will impact on the ability of a resource to continue to meet the needs of users and the environment. Degradation may also be very gradual and take some years to become apparent, imparting a false sense of security.
Management of water resources requires a sound understanding of key factors such as physical extent (quantity), quality, availability, and constraints to development. The role of the Knowledge and Information Division of the Department of Water, Land and Biodiversity Conservation is to maintain an effective knowledge base on the State’s water resources, including environmental and other factors likely to influence sustainable use and development, and to provide timely and relevant management advice.
Bryan Harris Director, Knowledge and Information Division
Department of Water, Land and Biodiversity Conservation
Surface Water Assessment of the i Report DWLBC 2003/18 Upper Finniss Catchment

EXECUTIVE SUMMARY
This technical report describes the methodology and outcomes of a hydrological study of the Upper Finniss catchment of the eastern Mount Lofty Ranges of South Australia. The study examines the impact of farm dams on the surface water resources of the catchment. The study was undertaken under the Mt Lofty Ranges Initiatives Program of the Department of Water, Land and Biodiversity Conservation (“DWLBC”) in conjunction with the River Murray Catchment Water Management Board (“RMCWMB”). This report will be used as a technical foundation for the State Government’s consideration of water resources management measures required for this catchment.
The high level of farm dam development in the Eastern Mount Lofty Ranges (“EMLR”) has raised considerable concerns of its possible impacts on the flow regimes and ecosystems within its catchments. This led to the Catchment Water Management Plan for the River Murray in South Australia (“the Catchment Plan”) setting development limits for catchments in the EMLR based on rainfall and an estimated average runoff coefficient. While the estimate of runoff rate used in the Catchment Plan is realistic and conservative for the entire EMLR region, it varies with individual catchments. The DWLBC was assigned by the RMCWMB to carry out a series of detailed hydrological studies of the individual catchments in the EMLR. This study, of the Upper Finniss catchment forms a part of that series of studies.
The study focuses on the analysis of hydrological data, modelling the rainfall-runoff processes in the catchment and estimation of impact of farm dams on streamflows. The main findings are:
Hydrology The Upper Finniss catchment is one of the high rainfall catchments in the EMLR, with an average annual rainfall of 850 mm. Long-term rainfall records from the catchment indicate an overall decreasing trend in annual rainfall, with the decline being more pronounced in the last 20 years. They also indicate a trend of decrease and/or delay of rainfall in the month of June. Similar trends of decreasing annual and June rainfall were observed in previous studies in the Barossa Valley, the Onkaparinga Catchment, and the Marne Catchment.
Runoff from the Upper Finniss catchment is highly variable and dependent on rainfall. The catchment has a runoff coefficient of 0.17 (17%), which is relatively high in comparison to other catchments in the EMLR.
Farm Dams The catchment’s farm dam density is one of the highest in the EMLR with around 1246 farm dams with an estimated total storage capacity of 5822 ML. The current levels of farm dam development in the Meadows Creek and the Finniss River sub-catchments have exceeded the allowable development limits set in the Catchment Plan. Farm dam development in the third (Blackfellow Creek) sub-catchment has reached 90% of the Catchment Plan’s allowable limit.
Surface Water Assessment of the ii Report DWLBC 2003/18 Upper Finniss Catchment

Executive Summary
Streamflow records from the Upper Finniss catchment indicate a higher runoff coefficient than the one used in the Catchment Plan. This is confirmed by simulated streamflows from the model. The development limits set in the Catchment Plan are the initial basis for setting development limits for the entire EMLR. The runoff values generated from the model and presented in this report should be used in the preparation of Water Allocation Plans to set limits for individual catchments/sub-catchments and also during the next review of the Catchment Plan.
Impact of The rainfall-runoff model constructed and calibrated for the catchment was Farm Dams run for three major scenarios, viz., (i) Current – with 1999 levels of farm on dam development, (ii) Pre-farm dam development – dams removed from Streamflow the catchment, and (iii) Future – water use from current dams increased
from 30% to 70%. The results of the three modelling scenarios indicate that: The current level of farm development has potentially reduced the median annual adjusted runoff (runoff simulated with the impact of farm dams removed) from the catchment by 10%. The reduction is estimated to have been higher during drier years (> 25% flow reduction during 1980, 82 and 1994) and marginal during wetter years (< 5% reduction during 1981, 1992). A further reduction of 8% to the current median annual runoff was estimated if water usage from the existing dams was increased to 70% under the higher usage scenario. The impact of dams was potentially highest in the Meadows sub-catchment (which also has the highest farm dam development) followed by Finniss and Blackfellow sub-catchments.
The dams have potentially reduced the median summer flows by 72% and median winter flows by 7%. Though summer flows constitute only 2% to 3% of the annual flows, they are critical to the water dependent ecosystems as the late autumn / early winter is the period when the ecosystems are likely to be highly stressed. Results of future scenarios indicate that increasing the water usage to 70% would result in summer flows ceasing in dry years.
Results of modelling also indicate that the current farm dams have significantly reduced the low and medium daily flows. The current low flows from the catchment are generated from the few existing “free-to-flow” catchments. The duration of low and medium daily flows that are critical in sustaining catchment ecosystems, have been reduced significantly. For instance, flows up to 10 ML/day would have occurred for around 77 more times per year if the dams did not exist. The duration of the “no-flow” or the “dry” periods have been extended during late autumn / early winter, when runoff generated after the initial wetting-up period was captured by dams. Increase in water usage rates from existing dams will further reduce the duration of low flows, but not by as much as the initial impact of dam construction. For instance, there would be 13 less days of flow up to 10 ML/day, in comparison with the 77 less days estimated to have been
Surface Water Assessment of the iii Report DWLBC 2003/18 Upper Finniss Catchment
Executive Summary
caused by the existing dams. However, increased used from dams will further extend the duration of “no-flow” periods.
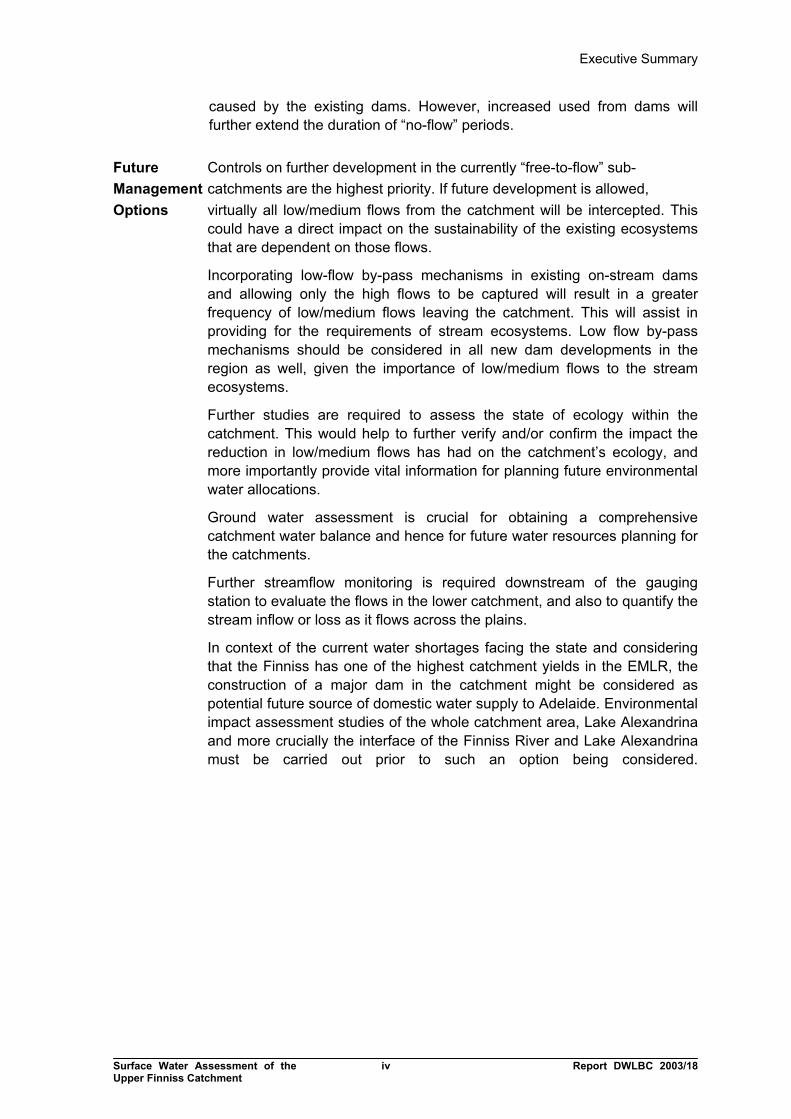
Future Controls on further development in the currently “free-to-flow” sub- Management catchments are the highest priority. If future development is allowed, Options virtually all low/medium flows from the catchment will be intercepted. This
could have a direct impact on the sustainability of the existing ecosystems that are dependent on those flows.
Incorporating low-flow by-pass mechanisms in existing on-stream dams and allowing only the high flows to be captured will result in a greater frequency of low/medium flows leaving the catchment. This will assist in providing for the requirements of stream ecosystems. Low flow by-pass mechanisms should be considered in all new dam developments in the region as well, given the importance of low/medium flows to the stream ecosystems.
Further studies are required to assess the state of ecology within the catchment. This would help to further verify and/or confirm the impact the reduction in low/medium flows has had on the catchment’s ecology, and more importantly provide vital information for planning future environmental water allocations.
Ground water assessment is crucial for obtaining a comprehensive catchment water balance and hence for future water resources planning for the catchments.
Further streamflow monitoring is required downstream of the gauging station to evaluate the flows in the lower catchment, and also to quantify the stream inflow or loss as it flows across the plains.
In context of the current water shortages facing the state and considering that the Finniss has one of the highest catchment yields in the EMLR, the construction of a major dam in the catchment might be considered as potential future source of domestic water supply to Adelaide. Environmental impact assessment studies of the whole catchment area, Lake Alexandrina and more crucially the interface of the Finniss River and Lake Alexandrina must be carried out prior to such an option being considered.
Surface Water Assessment of the iv Report DWLBC 2003/18 Upper Finniss Catchment

CONTENTS FOREWORD ........................................................................................................................ I
EXECUTIVE SUMMARY..................................................................................................... II
CONTENTS........................................................................................................................ V List of Tables .................................................................................................................. vi List of Figures ................................................................................................................. vi List of Appendices ......................................................................................................... vii
INTRODUCTION .................................................................................................................1 Purpose and Scope of the Study .....................................................................................1 Background......................................................................................................................1 Study Approach ...............................................................................................................3
CATCHMENT DESCRIPTION ............................................................................................6 Overview..........................................................................................................................6 Catchment Sub-Division ..................................................................................................7
Major Sub-Catchments ................................................................................................7 Minor Sub-Catchments ................................................................................................9
Landuse .........................................................................................................................10 Landuse Classification...............................................................................................10
Farm Dams ....................................................................................................................13 Environment...................................................................................................................17
RIVER MURRAY CATCHMENT WATER MANAGEMENT PLAN - DEVELOPMENT LIMITS...............................................................................................................................18
CATCHMENT HYDROLOGY............................................................................................21 Rainfall ...........................................................................................................................21
Data Availability .........................................................................................................21 Data Processing ........................................................................................................21 Data Analysis .............................................................................................................22
Streamflow.....................................................................................................................25 Data Availability & Processing ...................................................................................25 Data Analysis .............................................................................................................25
Rainfall-Runoff Relationship ..........................................................................................28
SURFACE WATER MODELLING.....................................................................................30 Overview........................................................................................................................30 Methodology ..................................................................................................................32 Model Construction........................................................................................................32 Model Calibration...........................................................................................................33 Results of Modelling ......................................................................................................37
Current Impact of Farm Dams ...................................................................................37 Future Scenario - 70% water usage from dams .......................................................43
CONCLUSIONS ................................................................................................................47
REFERENCES ..................................................................................................................51
Surface Water Assessment of the v Report DWLBC 2003/18 Upper Finniss Catchment

List of Tables
Table 1. Major Sub-Catchments in the Upper Finniss Catchment......................................7 Table 2. Minor Sub-Catchments in the Upper Finniss Catchment.......................................9 Table 3. Landuse Classification for Upper Finniss Catchment ..........................................10 Table 4. Farm Dams in the Upper Finniss Catchment - Size Classification .....................14 Table 5. Farm Dam Density of Catchments in the Eastern Mount Lofty Ranges .............14 Table 6. Farm Dam Information for Finniss Sub-Catchments ..........................................16 Table 7. Catchment Plan's Development Limits for Sub-Catchments in the Upper Finniss
Catchment.......................................................................................................18 Table 8. Rainfall stations in the Finniss River Catchment U/S of AW426504....................21 Table 9. Runoff Coefficients for Catchments in the Eastern Mount Lofty Ranges (McMurray,
2001)..................................................................................................................28 Table 10. Model Calibration Results..................................................................................34 Table 11. Potential Impact of Dams on Annual Sub-Catchment Flows (1969 to 1999)....38 Table 12. Daily Flow Exceedance Values of Current and Pre-farm dam development
Scenarios ........................................................................................................41 Table 13. Comparison of Flow Percentiles of Current and Pre-farm dam development
Daily Flows......................................................................................................41 Table 14. Comparison of Allowable Development Limits .................................................42 Table 15. 70% Use Scenarios - Reduction in Annual Flows (1969 – 1999) .....................44 Table 16. 70% Use Scenarios – Impact on Seasonal Flows (1969 – 1999).....................44 Table 17. 70% Use Scenario - Impact on Daily Flows......................................................45 Table 18. 70% Use Scenario - Impact on Daily Flow Percentiles.....................................46 Table 19. Details of Sections in the Monthly Double Mass Curve ....................................56
List of Figures Figure 1. Finniss River Catchment - Location Map..........................................................2 Figure 2. Finniss River Catchment - Major Streams..........................................................5 Figure 3. Upper Finniss - Major Sub-Catchments ..............................................................8 Figure 4. Upper Finniss Catchment - Land Use ...............................................................12 Figure 5. Farm Dam Density of Minor Sub-Catchments in the Upper Finniss..................15 Figure 6. Upper Finniss Catchment - Topography............................................................20 Figure 7. Annual Rainfall at Meadows ..............................................................................23 Figure 8. Deviation of Decadal Mean Rainfall from Long-Term Mean Annual Rainfall ....23 Figure 9. Monthly Rainfall at Meadows.............................................................................24 Figure 10. Monthly Residual Mass Curve for Meadows ...................................................24 Figure 11. Annual Runoff from Upper Finniss Catchment ................................................26 Figure 12. Daily Flow Duration Curve for Upper Finniss Catchment ................................26 Figure 13. Rainfall-Runoff Curve for the Upper Finniss Catchment .................................28 Figure 14. Model Construction - Representation of Sub-Catchments and Farm Dams....31
Surface Water Assessment of the vi Report DWLBC 2003/18 Upper Finniss Catchment

Figure 15. Daily Flow Frequency Curves for Measured and Modelled Flows ..................34 Figure 16. Monthly Flows - Correlation Between Measured and Modelled Data..............35 Figure 17. Correlation between Measured and Modelled Daily Flows on an Annual Basis
........................................................................................................................36 Figure 18. Reduction in Annual Runoff by 1999 Farm Dams ...........................................38 Figure 19. Reduction in Monthly Runoff by Farm Dams for the Period 1969 to 1999 ......39 Figure 20. Comparison of Daily Flow Frequency Curves for Current and Pre
Development Scenarios ..................................................................................40 Figure 21. Impact of Increased Farm Dam Water Usage on Annual Flows (1969- 1999) ...........43 Figure 22. Double Mass Curve for Monthly Rainfall Records...........................................55 Figure 23. Concept of WC-1 Model......................................................................................59 Figure 24. Contributing Catchment calculated from Soil Moisture ............................................60 Figure 25. Contributing Catchment calculated from Soil Moisture ............................................60 Figure 26. Contributing Catchment calculated from Soil Moisture ............................................61
List of Appendices Appendix A: Methodology used by Sinclair Knight Merz (“SKM”) for disaggregation of
accumulated rainfall data and in-filling of missing rainfall records 53 Appendix B: Methodology used in this study for in-filling missing rainfall records 54 Appendix C: Check for Homogeneity of Rainfall Records 55 Appendix D. Trend Test (Grayson, 1996) 57 Appendix E. Tanh Function 58 Appendix F: WC1 – Model Description (Cresswell, 2002) 59 Appendix G: Upper Finnis Catchment – Model Layout 64 Appendix H: Upper Finnis Catchment – Sub-Catchment and Dam Nodes Details 65
Surface Water Assessment of the vii Report DWLBC 2003/18 Upper Finniss Catchment

INTRODUCTION
Purpose and Scope of the Study
This technical report describes the methodology and outcomes of a hydrological study of the Upper Finniss catchment and examines the impact of farm dams on the surface water resources within the catchment. The study was undertaken under the Mt Lofty Ranges Initiatives Program of the Department of Water, Land and Biodiversity Conservation (“DWLBC”) in conjunction with the River Murray Catchment Water Management Board (“RMCWMB”).
The scope of work of this study covers the following:
• Quantification of the surface water resources within the Upper Finniss catchment
• Construction and calibration of a computer Rainfall-Runoff model for the catchment
• Assessment of the impact of current levels of farm dam development on streamflow
• Assessment of model case scenarios to study future impacts, for facilitation of future catchment management decisions
• Identification of data deficiencies and recommendations of future monitoring requirements
Background
Surface water use in the highlands and groundwater use in the plains are vital to the economics of the Mount Lofty Ranges region, but in recent years concerns have been raised by the community and other stakeholders as to the appropriateness of the high volumes of development in the region. The rapid development of farm dams over the last two decades in this region has raised considerable concern on the sustainability of water resources and the impacts seen in the ecosystems dependent on them.
The Finniss River is one of the very few historically perennial rivers that originate from the eastern side of the Mount Lofty Ranges (Figure 1). The river and its catchment are a major source of water for irrigation (through water stored in farm dams), for the ecosystems within the catchment and for the ecosystems of the Lake Alexandrina. Intensive farm dam development directly affects natural flow regime of the catchment and hence the ecosystems dependent on that flow regime.
Surface Water Assessment of the 1 Report DWLBC 2003/18 Upper Finniss Catchment

Bremer-Barker
Finniss River Catchment
Saundergrove
Angas River
Tookayerta
Currency Creek Long Marsh
Double Bridges
YUNDIYUNDI
MILANGMILANG
MYPONGAMYPONGA
FINNISSFINNISS
ALDINGAALDINGA
SEAFORDSEAFORDMEADOWSMEADOWS
NANGKITANANGKITA
WILLUNGAWILLUNGA
TOOPERANGTOOPERANG
ASHBOURNEASHBOURNE
BLETCHLEYBLETCHLEY
RED CREEKRED CREEKKANGARILLAKANGARILLA
STRATHALBYNSTRATHALBYN
WOODCHESTERWOODCHESTER
ALDINGA BAYALDINGA BAY
SPRING MOUNTSPRING MOUNT
MYPONGA HILLMYPONGA HILL
SILVER SANDSSILVER SANDS
MASLIN BEACHMASLIN BEACH
MCLAREN VALEMCLAREN VALE
MOUNT WILSONMOUNT WILSON
MACCLESFIELDMACCLESFIELD
MOUNT COMPASSMOUNT COMPASS
PORT WILLUNGAPORT WILLUNGA
CURRENCY CREEKCURRENCY CREEK
SELLICKS BEACHSELLICKS BEACH
MOUNT TERRIBLEMOUNT TERRIBLE
PORT NOARLUNGAPORT NOARLUNGA
BLEWITT SPRINGSBLEWITT SPRINGS
CHRISTIES BEACHCHRISTIES BEACH
Figure 1. Finniss River Catchment - Location Map
ADELAIDE
Eastern Mt Lofty Ranges CatchmentsEastern Mt Lofty Ranges Catchments
Surface Water Assessment of the Upper Finniss Catchment Report DWLBC 2003/182
Eastern Mount Lofty Ranges Catchments
Finniss River Catchment
Main Streams
Farm dams (1999)
Towns and Localities
Main Roads
Projection: Map Grid of Australia 1994 (UTM)Datum: Geocentric Datum of Australia 1994 Date: June 2003
0 4 82 km
Produced by the Surface Water Group,Information and Knowledge Division, DWLBC
Data Sources:CLIMATE STATIONS AND RAINFALL: Bureau of MeteorologyTOWNS AND LOCALITIES: Information and Data Analysis, Planning SA

Introduction
The River Murray Catchment Water Management Board, established under the Water Resources Act 1997, is responsible for protection of the water resources and associated ecosystems in the River Murray Catchment in the State. The Catchment Water Management Plan (prepared by the RMCWMB), in its policy on development has set limits for development on a regional basis for the entire Eastern Mount Lofty Ranges (“EMLR”).
The DWLBC, under its initiative “The Mt Lofty Ranges Water Resources Assessment Program” has been carrying out detailed technical studies to quantify and assess the condition of surface and groundwater resources of the Mt Lofty Ranges. Surface and groundwater assessments of the Marne Catchment (2002) and the surface water assessment of the Onkaparinga Catchment (2003) are some of the studies that have been completed under the program in the recent past. The DWLBC in association with the RMCWMB board identified Finniss as a high priority catchment in the EMLR for assessment, due to its high level of farm dam development. These studies provide an important technical foundation and hence basis for consideration for policy decisions to be made on future management of water resources in the region.
Study Approach
The basis of this study and the results presented in this report are based on a rainfall-runoff model constructed by using the surface water management platform WaterCress (Cresswell, 2000). The Upper Finniss Catchment was first sub-divided (using GIS package ArcMap) into 6 major sub-catchments based on main streams, rainfall and landuse pattern. These were further sub-divided into 124 minor sub-catchments based on size, location and intensity of farm dams. A catchment model was then constructed as a series on 124 catchment/farm dam nodes representing the whole Upper Finniss Catchment (Appendix G).
The catchment model constructed was then calibrated for the period 1960 to 2000 (“Current Scenario”) using observed daily rainfall data, observed streamflow data and 1999 levels of estimated farm dam capacities. Streamflow data was then generated for the period 1887 to 2000 using observed rainfall data. Farm dams were then removed from the model (“Pre-farm dam development Scenario”) and streamflow data was simulated for that period. The difference in runoff generated from the two scenarios was then calculated to estimate catchment runoff that would have occurred if the dams did not exist.
Since farm dam development in two of the three sub-catchments have already exceeded the allowable development limits set in the catchment plan it was assumed that no further development would be allowed in those sub-catchments. However, limits on further farm dam development could lead to more water use from the existing dams. Hence, prediction of impacts of increased water usages from farm dams was carried out. In the ”Future Scenarios” modelling, water usages from farm dams were assumed to increase to 50% Surface Water Assessment of the 3 Report DWLBC 2003/18 Upper Finniss Catchment

Introduction
and 70% (from the assumed rate of 30% used for calibration). Streamflow generated from these scenarios were then compared to current scenario streamflows to obtain an estimate of the impact of increased usage rates on streamflows.
Results for each case scenario are presented in this report on a sub-catchment level, and also, on annual, monthly and daily basis. This provides better understanding of not only the impacts of dams on catchment yields, but also the impacts on flow regimes that are critical for environmental flows assessment. This leads to assessment of the potential risks to the sustainability of the overall surface water resources and the water dependent ecosystems, which provides a basis for consideration for future water management options.
Surface Water Assessment of the 4 Report DWLBC 2003/18 Upper Finniss Catchment

Meadows CreekMeadows Creek
Blackfellows CreekBlackfellows Creek
Bull CreekBull Creek
Wattle Flat CreekWattle Flat Creek
Finnis RiverFinnis River
Streamflow Gauging Station (AW426504)
725
700
675
650
625
600
575
750 77
5
800
825
85087
5
550
900
525
500
475
450
925
825
850
550
Figure 2. Finniss River Catchment - Major Streams
Surface Water Assessment of the Upper Finniss Catchment Report DWLBC 2003/18
Farm Dams (1999)
Rainfall Isohyets (mm)
Main Streams
Upper Finniss Catchment
Subcatchments
Blackfellow Creek
Bull Creek
Finnis River
Meadows Creek
Wattle Flat
0000
Projection: Map Grid of Australia 1994 (UTM)Datum: Geocentric Datum of Australia 1994 Date: June 2003
5
Produced by the Surface Water Group,Knowledge and Information Division, DWLBC
Data Sources:CLIMATE STATIONS AND RAINFALL: Bureau of Meteorology
TOWNS AND LOCALITIES: Information and Data Analysis, Planning SA

Catchment Description
CATCHMENT DESCRIPTION
Overview
The Finniss River catchment is located approximately 50 kilometres south of Adelaide in the Eastern Mount Lofty Ranges. Meadows, Ashbourne, Yundi and Finniss are the major towns in the catchment. The main river in this catchment is the Finniss River, which originates in the eastern side of the Mount Lofty Ranges and flows in a south-easterly direction. Meadows Creek, Blackfellow Creek, Bull Creek and Wattle Flat Creek are the major tributaries that feed into the Finniss River (Figure 2) before it flows into the Lake Alexandrina .
Rainfall in the catchment varies from 850 mm in north-western highlands to less than 450 mm on the south-eastern side at the confluence with Lake Alexandrina. Streamflow has been measured since 1969 at the streamflow gauging station (AW426504) located 4 Km east of Yundi. The catchment area of 193 Km2 upstream of this gauging station has been considered for this study. Hence, “Upper Finniss Catchment” in this study refers to the portion of the Finniss catchment upstream of the gauging station AW426504.
The topography of the Upper Finniss Catchment ranges from around 480m in north-eastern highlands to 210m near the gauging station. The annual rainfall ranges from 750mm on the western side to 850mm on the north-eastern slopes, which is quite high compared to the other catchments in the EMLR. Due to this, it is a high runoff catchment with median annual runoff for the period between 1970 and 2000 being 27673 ML, and a runoff co-efficient of 0.17. For this reason, the catchment remains under consideration as a potential storage site to supply domestic water to Adelaide and/or to the southern Flerieu peninsula.
Major landuse in the catchment includes broad scale grazing (64% of the total area), intensive grazing (12%), forestry & protected areas (21%, the majority of which is Kuitpo Forest), Vines (2.6%), Horticulture and Floriculture. Extensive irrigation (from farm dams and from ground water bores) is assumed to be predominantly for viticulture and horticulture and to a lesser degree for intensive grazing purposes.
Based on 1999 aerial surveys, there are around 1250 farm dams with an estimated total capacity of 5800 ML within the catchment.
Surface Water Assessment of the 6 Report DWLBC 2003/18 Upper Finniss Catchment

Catchment Description
Catchment Sub-Division
MAJOR SUB-CATCHMENTS
Division of catchment into sub-catchments based on rainfall, major streams and land use enhances the understanding of the variable nature of catchment behaviour of the different sub-catchments. This also increases efficiency of the catchment rainfall-runoff modelling process and, in the case of this study, the variable impact of farm dams on different sub-catchments. This is achieved by a unique set of catchment parameters being input onto the model for each sub-catchment rather than one set of catchment parameters being used for the whole catchment area under consideration.
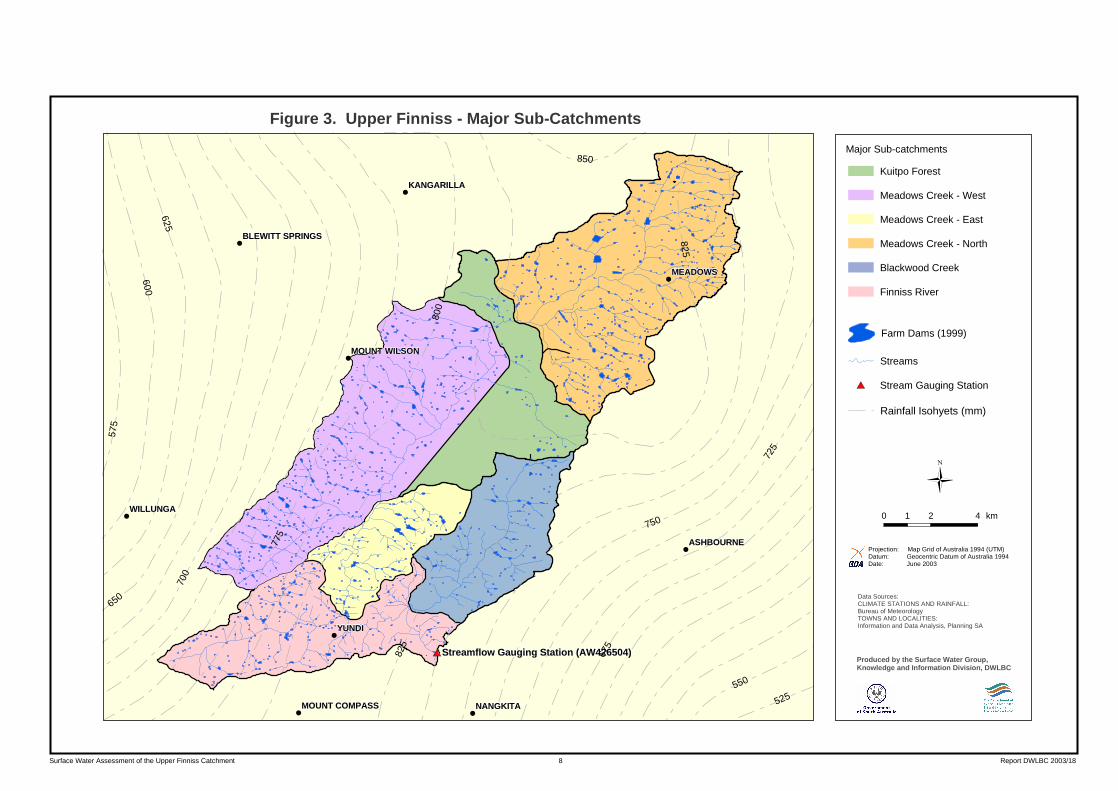
For this study, the Upper Finniss Catchment was divided into six major sub-catchments based on major streams in the catchment, rainfall variation and varying land use pattern (Figure 3). Rainfall was not a major factor in the catchment sub-division process due to the limited variation in rainfall pattern. The six sub-catchments and their areas are listed in Table 1.
Table 1. Major Sub-Catchments in the Upper Finniss Catchment
No. Major Sub-Catchments
Area (Km2)
1 Meadows North 51.8 2 Meadows West 52.3 3 Meadows East 15.3 4 Kuitpo Forest 23.3 5 Blackfellow Creek 22.6 6 Finniss River 27.7
The method used for the sub-division is briefed in the following lines. As mentioned in the previous section there are three major streams in the catchment viz., the Meadows Creek, Blackfellow Creek and the Finniss River. The Meadows creek, which traverses the catchment, was divided into four sections. Two of these being Meadows North and Meadows East sub-catchments that has intensive grazing as the second predominant land use (as broad scale grazing in the predominant land use throughout the catchment). The section of the Meadows creek traverses through the forested areas and hence a catchment area including all the forested areas was created. The fourth section is the Meadows West catchment area, which has almost all the vineyards present in the whole catchment. Blackfellow creek is a separate creek and hence its catchment area was created as an individual sub-catchment. A catchment area for just the Finniss River U/S of the gauging station was the created as the sixth individual sub-catchment. These two sub-catchments have a combination of broad scale grazing, intensive grazing and forestry/protected areas as their land use.
Surface Water Assessment of the 7 Report DWLBC 2003/18 Upper Finniss Catchment
Streamflow Gauging Station (AW426504)Streamflow Gauging Station (AW426504)
575
600
625
65067
5
700
725
750
775
800
825
850
550
525
825
YUNDIYUNDI
MEADOWSMEADOWS
NANGKITANANGKITA
WILLUNGAWILLUNGA
ASHBOURNEASHBOURNE
KANGARILLAKANGARILLA
MOUNT WILSONMOUNT WILSON
MOUNT COMPASSMOUNT COMPASS
BLEWITT SPRINGSBLEWITT SPRINGS
Figure 3. Upper Finniss - Major Sub-Catchments
Surface Water Assessment of the Upper Finniss Catchment Report DWLBC 2003/18
0 2 41 km
Projection: Map Grid of Australia 1994 (UTM)Datum: Geocentric Datum of Australia 1994 Date: June 2003
Farm Dams (1999)
Streams
Stream Gauging Station
Rainfall Isohyets (mm)
Produced by the Surface Water Group,Knowledge and Information Division, DWLBC
Data Sources:CLIMATE STATIONS AND RAINFALL: Bureau of MeteorologyTOWNS AND LOCALITIES: Information and Data Analysis, Planning SA
8
Major Sub-catchments
Finniss River
Meadows Creek - North
Kuitpo Forest
Meadows Creek - West
Meadows Creek - East
Blackwood Creek

Catchment Description
MINOR SUB-CATCHMENTS The next stage was to further sub-divide the major sub-catchments into smaller catchments. The primary criterion for this sub-division was the presence of a significant on-stream dam (‘controlling dam’), which is deemed to control or block the flow from the upstream catchment area. In the absence of major on-stream dams other factors were used in the sub-division of catchments. In general, based on all the factors used, each sub-catchment is either:
1. a catchment area of a controlling dam with other smaller dams upstream, if any, or 2. a catchment area of a series of controlling dams with other smaller dams
upstream, if any, or
3. a catchment area of a well defined stream with off-stream dams, or
4. a catchment area of a well-defined stream with no dams. The sub-division process was initially done manually on a map, which was followed by digitizing of the sub-catchments in ArcMap. The area of each of these sub-catchments and the cumulative farm dam capacity in each of those sub-catchments were then calculated. The total number of minor sub-catchments within each major sub-catchment and the total number of minor sub-catchments within the entire Finniss catchment are tabulated in Table 2. Further details of the minor sub-catchments are listed Appendix H.
Table 2. Minor Sub-Catchments in the Upper Finniss Catchment
No. Major Sub-Catchment
Area (Km2) Number of Minor Sub-Catchments
1 Meadows North 51.8 41 2 Meadows West 52.3 27 3 Meadows East 15.3 10 4 Kuitpo Forest 23.3 7 5 Blackfellow Creek 22.6 15 6 Finniss River 27.7 24
Total Finniss catchment 193 124
Surface Water Assessment of the 9 Report DWLBC 2003/18 Upper Finniss Catchment

Catchment Description
Landuse
LANDUSE CLASSIFICATION Landuse data for the catchment area was obtained from the land status data set that was an outcome of the land status mapping exercise for the Mt Lofty Ranges Watershed carried out by the Department for Environment and Heritage in the year 2001. (Bradley, 2002) The exercise involved interpretation of 1:20,000 aerial photographs with field verification and the provision of access through a spatial data format that can be interpreted through Geographical Information Systems. The land cover categories available from the data set were grouped into ten main categories. They are: 1. Livestock / Broadscale grazing – this includes grazing land for Sheep, Horse, Beef
and Goats. 2. Livestock / Intensive grazing – this includes grazing land for Dairy, Deer, Alpacas,
Free-range Hens, Horses, Ostriches and Emus. 3. Forestry / Exotic vegetation - this includes Pines, Paulownia, Willows and Ash. 4. Forestry & Protected / Native Vegetation – this includes areas of native revegetation,
remnant vegetation and forestry 5. Protected / Recreation – this includes Conservation parks, Reserves, National parks,
Wetlands, Road/water reserves and Parklands/open spaces. 6. Vines – this includes Grapes, Hop, Kiwifruit and Passion fruit 7. Horticulture / Floriculture – this includes Orchards, Berries, Vegetables and
Floriculture. 8. Residential / Industrial – this includes residential, industrial, commercial, cultural and
transport/storage areas. 9. Mining – this includes mining and extractive industries 10. Water Bodies – this includes Dams, Reservoirs, Sewage Ponds, Wetlands and
Lakes. The land use categories as shown above were then mapped for the catchment area (Figure 4), the details of which are shown in the table below.
Table 3. Landuse Classification for Upper Finniss Catchment
No. Landuse Category Area (Km2) % of total area
1 Livestock – Broad scale grazing 119.0 64% 2 Livestock – Intensive grazing 21.2 11.4% 3 Forestry – Exotic vegetation 17.8 9.6% 4 Forestry / Protected – Native
Vegetation 13.5 7.3%
5 Protected / Recreation 6.2 3.4% 6 Vines 4.8 2.6% 7 Horticulture / Floriculture 0.4 0.22% 8 Residential / Industrial 0.6 0.33% 9 Mining 0.04 0.02% 10 Water Bodies 2.40 1.3%
Surface Water Assessment of the 10 Report DWLBC 2003/18 Upper Finniss Catchment

Catchment Description
As shown in Table 3 around 75% of the catchment area is used for livestock grazing (both intensive and broad scale) and around 20% of the area is under forest / protected areas with the Kuitpo forest forming a major part of the forest area. Only 2.6% of the catchment area has vineyards, and they are all located on the western side of the catchment. The remaining 2.4% are distributed among the other land use categories. Most of the major farm dams in the catchment are located in areas with vineyards and intensive grazing land use.
Surface Water Assessment of the 11 Report DWLBC 2003/18 Upper Finniss Catchment

Surface Water Assessment of the Upper Finniss Catchment Report DWLBC 2003/18
Streamflow Gauging Station (AW426504)Streamflow Gauging Station (AW426504)
YUNDIYUNDI
MEADOWSMEADOWS
NANGKITANANGKITA
WILLUNGAWILLUNGA
ASHBOURNEASHBOURNE
KANGARILLAKANGARILLA
MOUNT WILSONMOUNT WILSON
MOUNT COMPASSMOUNT COMPASS
BLEWITT SPRINGSBLEWITT SPRINGS
Figure 4. Upper Finniss Catchment - Land Use
Land Use
Forestry - Exotic Vegetation
Forestry/Protected Area - Native Vegetation
Protected/Recreation
Vine
Horticulture
Livestock - Broadscale Grazing
Livestock - Intensive Grazing
Mining/Extraction
Residential/Urban/Accomodation/Misc.
Towns
Road
Stream
Stream Gauging Station
Farm Dams (1999)
Produced by the Surface Water Group,Knowledge and Information Division, DWLBC
Data Sources:CLIMATE STATIONS AND RAINFALL: Bureau of MeteorologyTOWNS AND LOCALITIES: Information and Data Analysis, Planning SA
0 4 82 km
Projection: Map Grid of Australia 1994 (UTM)Datum: Geocentric Datum of Australia 1994 Date: June 2003
12

Catchment Description
Farm Dams
Farm dams are water storage structures generally constructed in regional areas (rural areas) for capturing the runoff generated from the catchment area above them. The water stored in the dams is then used for domestic, stock and irrigation purposes during summer. While water stored in the farm dams provide an additional source of water (in addition to rainfall and water pumped from groundwater bores) for agriculture, they also act as barrier for the runoff generated from the catchment area upstream of the dam, until the dam spills. This directly impacts the availability of water to users (including the environment) downstream of the dam, particularly when the dam is large. The other negative impact of this is the change in the flow regime of the stream, which directly affects the riverine and other water dependent ecosystems. One of the main purposes of this study is to estimate this impact of farm dam development of the flow regime in the catchment.
The constant increase of more land being brought into intensive agricultural use in the Mount Lofty Ranges has necessitated the construction of more water storage facilities, and hence the inevitable situation of construction of a large number (and higher storage capacity) of farm dams. This increase in construction farm dams has been more predominant and rapid in the highlands of the Mount Lofty Ranges due to intense vineyard development. A few cases for this are,
• a 10 fold increase in total farm dam storage capacity being observed in the Barossa Valley since the early 1970’s (Cresswell, 1991).
• the total farm dam capacity in the Upper Marne catchment being observed to have more than doubled between 1991 and 1999 (Savadamuthu, 2002),
Similar trends in farm dam development have been observed in most of the other catchments in the Mount Lofty Ranges.
Farm dam information for this study was obtained from the 1999 aerial survey, which was then digitised by the Department of Environment and Heritage and stored in a format to be used by Geographic Information System packages. Farm dam volumes were then calculated using the dam surface area – volume relationship developed by Pikusa (Pikusa, 1999), which is
Volume (ML) = 0.0002 x Surface Area (m2)1.2604. Based on this survey, the total number of farm dams in the study area in the year 1999 was 1246 with an estimated storage capacity of 5822 Ml. The number of dams and their storage capacity based on size classification is shown in Table 4.
Surface Water Assessment of the 13 Report DWLBC 2003/18 Upper Finniss Catchment
Catchment Description
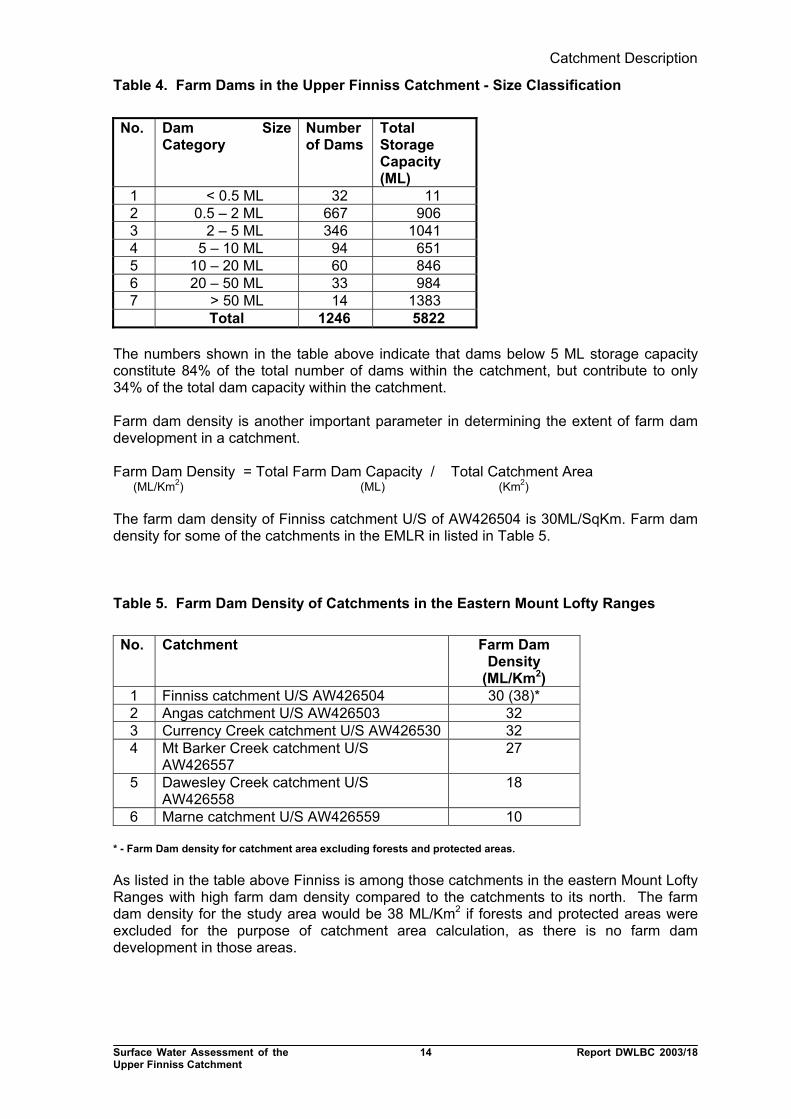
Table 4. Farm Dams in the Upper Finniss Catchment - Size Classification
No. Dam Size Category
Number of Dams
Total Storage Capacity (ML)
1 < 0.5 ML 32 11 2 0.5 – 2 ML 667 906 3 2 – 5 ML 346 1041 4 5 – 10 ML 94 651 5 10 – 20 ML 60 846 6 20 – 50 ML 33 984 7 > 50 ML 14 1383
Total 1246 5822 The numbers shown in the table above indicate that dams below 5 ML storage capacity constitute 84% of the total number of dams within the catchment, but contribute to only 34% of the total dam capacity within the catchment. Farm dam density is another important parameter in determining the extent of farm dam development in a catchment. Farm Dam Density = Total Farm Dam Capacity / Total Catchment Area (ML/Km2) (ML) (Km2) The farm dam density of Finniss catchment U/S of AW426504 is 30ML/SqKm. Farm dam density for some of the catchments in the EMLR in listed in Table 5.
Table 5. Farm Dam Density of Catchments in the Eastern Mount Lofty Ranges
No. Catchment Farm Dam Density
(ML/Km2) 1 Finniss catchment U/S AW426504 30 (38)* 2 Angas catchment U/S AW426503 32 3 Currency Creek catchment U/S AW426530 32 4 Mt Barker Creek catchment U/S
AW426557 27
5 Dawesley Creek catchment U/S AW426558
18
6 Marne catchment U/S AW426559 10 * - Farm Dam density for catchment area excluding forests and protected areas. As listed in the table above Finniss is among those catchments in the eastern Mount Lofty Ranges with high farm dam density compared to the catchments to its north. The farm dam density for the study area would be 38 ML/Km2 if forests and protected areas were excluded for the purpose of catchment area calculation, as there is no farm dam development in those areas.
Surface Water Assessment of the 14 Report DWLBC 2003/18 Upper Finniss Catchment

FINNISS RIVER @ 4 km East Of Yundi - AW426504FINNISS RIVER @ 4 km East Of Yundi - AW426504
YUNDIYUNDI
MEADOWSMEADOWS
WILLUNGAWILLUNGA
ASHBOURNEASHBOURNE
KANGARILLAKANGARILLA
MOUNT WILSONMOUNT WILSON
BLEWITT SPRINGSBLEWITT SPRINGS
800
775
750
725
700
675
65062
5
825
600
575
850
550
525
725
675
775
800
700
600
750
625650
825
775
Figure 5. Farm Dam Density of Minor Sub-Catchments in the Upper Finniss Catchment
Surface Water Assessment of the Upper Finniss Catchment Report DWLBC 2003/18
Produced by the Surface Water Group,Knowledge and Information Division, DWLBC
Data Sources:CLIMATE STATIONS AND RAINFALL: Bureau of Meteorology
TOWNS AND LOCALITIES: Information and Data Analysis, Planning SA
0000
Projection: Map Grid of Australia 1994 (UTM)Datum: Geocentric Datum of Australia 1994 Date: June 2003
0 2 41 km
Stream Gauging Station
Stream
Dams-1999
Towns
Rainfall Isohyets (mm)
Farm Dam Density (ML/sq. km)
0 - 10
11 - 20
21 - 35
36 - 50
51 - 100
101 - 500
15

Catchment Description
A better understanding of the extent of farm dam development is obtained when analysed on a sub-catchment level. The farm dam details for the individual sub-catchments are shown in Table 6.
Table 6. Farm Dam Information for Finniss Sub-Catchments
Sub-Catchment
Catchment Area (Km2)
Dam Size Classification Number of dams (Cumulative Dam Capacity in ML)
Total No. of Dams
Total Dam Capacity (ML)
Dam Density (ML/Km2)
< 0.5 ML
0.5 – 2 ML
2 – 5 ML
5 – 10 ML
10 – 20 ML
20 – 50 ML
> 50 ML
Meadows North
51.8 17 (5.3)
191 (235)
115 (351)
31 (218)
21 (286)
10 (296)
7 (849)
392 2241 43.3
Meadows East
15.3 1 (.49)
56 (79)
20 (59)
5 (28)
3 (28)
5 (145)
3 (314)
93 663 43.3
Meadows West
52.3 10 (4)
209 (289)
133 (400)
36 (250)
18 (253)
9 (297)
3 (166)
418 1659 32.3
Finniss River
27.7 2 (0.68)
139 (200)
50 (150)
9 (61)
8 (114)
3 (100)
1 (54)
212 679 24.5
Blackfellow Creek
22.6 0 (0)
51 (77)
16 (48)
8 (59)
5 (77)
5 (119)
0 (0) 85 379 16.8
Kuitpo Forest
23.3 2 (.62)
21 (26)
6 (20)
4 (29)
5 (78)
1 (27)
0 (0) 39 180 7.7
While the farm dam density for the whole catchment is 30 ML/Km2, development is not evenly distributed across the catchment. Meadows North and Meadows East sub-catchments have the highest level of farm dam development with farm dam density of 43 Km2, with Kuitpo forest sub-catchment having the least development. The farm dams in this catchment are all located in the grazing areas in and around the forests. All except for one, of the larger dams (capacity > 50 ML) are located in the sub-catchments of Meadows Creek. The farm dam density of the individual minor sub-catchments is shown in Figure 5. The level of impact of farm dam developments is based on the farm dam densities of sub-catchments. The actual magnitude of development and their impact on the catchment’s water resources and its ecosystems and hence the limits on development are determined by the:
1. comparison of current levels of farm dam development to “allowable development limits” set for sustainable management of water resources in a catchment. The development limits defined in the River Murray Catchment Water Management Plan was used in this report to evaluate the existing level of development in the catchment.
2. assessment of impact of current levels of farm dam development on the
catchment runoff and the estimation of probable future impacts if development continued. This was carried out by modelling the catchment Rainfall-Runoff process and is explained in detail in the next chapter.
Surface Water Assessment of the 16 Report DWLBC 2003/18 Upper Finniss Catchment

Catchment Description
Environment
Since its establishment in 1997, the River Murray Catchment Water Management Board has carried out investigations related to water resources and associated ecosystems in the Eastern Mount Lofty Ranges (“EMLR”), including the Finniss Catchment. The results of these investigations have identified the EMLR streams as providing valuable habitats for many species. For example, the Tookayerta and Nangkita Creeks and the Finniss River support 19 threatened species of flora and rare fauna (River Murray Catchment Water Management Plan, 2003).
The Southern Pygmy Perch (Nannpperca australis) is a native fish, and one species identified in the Catchment Plan that was historically found all over the Lower Murray, EMLR and Lake Alexandrina. They can now only be found in some of the EMLR streams including the Finniss River. The fish is considered to be an endangered species in South Australia and is also a protected species. Living in cool, clean water (usually pools and swamps), their presence is a good indicator of the health of the stream and ground water systems that sustain them (Hammer, 2002).
The Finniss River drains into Lake Alexandrina, which is listed as a Ramsar wetland in international treaties for the protection of migratory birds. The Finniss River estuary is a potential habitat for the Mt Lofty Southern Emu Wren (Stipiturus malachurus) (Duffield, 2001), a nationally endangered species listed under the EPBC Act. While it has been stated that their habitat is located entirely within the artificially regulated freshwater pool of the Murray Lakes and Lower Murray, further studies need to be carried out to assess the impact of reduced flows from the Finniss River on the estuary and hence the habitat.
This study does not directly assess the status of or impacts on the habitats of the Southern Pygmy Perch, Mt Lofty Southern Emu Wren or other water dependent ecosystems. However, the main outcomes of the study, that is, the impact of farm dams on the flow regime, will be useful to further assess the status and effect on water dependent ecosystems within the catchment.
Surface Water Assessment of the 17 Report DWLBC 2003/18 Upper Finniss Catchment

Surface Water Assessment of the 18 Report DWLBC 2003/18 Upper Finniss Catchment
RIVER MURRAY CATCHMENT WATER MANAGEMENT PLAN - DEVELOPMENT LIMITS The Finniss is one of the streams that drain into the River Murray in South Australia. The River Murray Catchment Water Management Board, established under the Water Resources Act 1997, is responsible for protection of the water resources and associated ecosystems in the River Murray Catchment in the state. To meet this responsibility the Board undertook various investigations and prepared the River Murray Catchment Water Management Plan (“the Catchment Plan”). The Plan defines farm dam development limits in a catchment as:
“The surface water sub-catchment zone limit of all dams (megalitres) = 0.3 (30% of) X area of the surface water sub-catchment zone (sq km) X long term average rainfall between the months of May and November (mm) X runoff coefficient; where the runoff coefficient is 0.1 (10%), unless otherwise specified in a relevant Water Allocation Plan.” (River Murray Catchment Water Management Plan, 2003. pp 182).
In the Catchment Plan, the Finniss catchment upstream of the gauging station AW426504 is divided into three major sub-catchments F1, F2 and F3 (River Murray Catchment Water Management Plan, 2003. pp 243), which are the Finniss River Sub-catchment, Meadows Stream sub-catchment and the Blackfellow Creek sub-catchment. For this report’s analysis, the Meadows sub-catchment, F2, was divided into Meadows North, Meadows West, Kuitpo Forest and Meadows East sub-catchments. Each of these catchments has a significantly different rainfall, which influences the calculation of allowable farm dam storage. Further details on sub-division of catchments are explained in the earlier section “Catchment Sub-Division”.
The 1999 levels of farm dam development in the Finniss River Sub-catchment (F1) and the Meadows Stream sub-catchment (F2) have already exceeded the Catchment Plan’s allowable limits (Table 7) (River Murray Catchment Water Management Plan, 2003. pp 244). Farm dam development in the Blackfellow Creek sub-catchment is yet to reach the Catchment Plan’s allowable development limits.
Table 7. Catchment Plan's Development Limits for Sub-Catchments in the Upper Finniss Catchment
Sub-Catchment Cat
chm
ent A
rea
(Km
2 )
Ave
rage
Ann
ual
Rai
nfal
l (m
m)
Ave
rage
Ann
ual
Run
off (
10%
of
Rai
nfal
l) (m
m)
May
-Nov
Run
off
30%
of M
ay-N
ov
Run
off (
mm
)
Allo
wab
le F
arm
Dam
Vo
lum
e (M
L)
1999
leve
ls o
f es
timat
ed F
arm
Dam
Vo
lum
es (M
L)
1999
leve
ls o
f de
velo
pmen
t di
vide
d by
allo
wab
le
volu
me
Finniss River (F1) 28 806 81 63 19 526 669 127%
Meadows Creek (F2) 142 813 81 63 19 2701 4765 176%
Blackfellow Creek (F3) 23 804 80 63 19 431 388 90%
Total 193 3658 5822 159%

RWCWM Plan Development Limits
Surface Water Assessment of the 19 Report DWLBC 2003/18 Upper Finniss Catchment
The allowable limits calculation in Table 7 is based on annual rainfall data, as they are the most consistent data available across the whole region. The average May-November rainfall in the region was found to constitute 78% of the average annual rainfall and this factor was used to calculate winter rainfall for all the regions examined.
While the runoff coefficient of 0.10 used in the Catchment Plan is the average runoff coefficient across the entire Eastern Mount Lofty Ranges, it varies widely with individual catchments, as does rainfall. It was found in this study that the runoff coefficient varies from 0.06 for the Marne catchment in the North, to 0.09 for the Bremer catchment in the middle of the ranges, to 0.17 for the Finniss catchment U/S of the gauging station in the south. Furthermore, the streamflow data from the Upper Finniss catchment shows that the average May-November runoff for the period 1969 to 2000 is 24665 ML. The winter flow recorded is therefore almost double the amount estimated by the Catchment Plan. Hence, the 1999 levels of farm dam development (5822 ML) is below the allowable limit (7400 ML) based on actual streamflow records observed between 1969 and 2000 for the Upper Finniss catchment. Development limits for the individual sub-catchments F1, F2 and F3 were modelled and the results are presented in the next section of this report.

Figure 6. Upper Finnis Catchment - Topography & Hydrological Stations
Surface Water Assessment of the Upper Finniss Catchment Report DWLBC 2003/18
825
825
YUNDI (M023808)YUNDI (M023808)
MEADOWS (M023730)MEADOWS (M023730)
WILLUNGA (M023753)WILLUNGA (M023753)
ASHBOURNE (M023701)ASHBOURNE (M023701)
BULL CREEK 2 (M023789)BULL CREEK 2 (M023789)
WILLUNGA HILL (M023857)WILLUNGA HILL (M023857)
KUITPO FOREST HQ (M023818)KUITPO FOREST HQ (M023818)MEADOWS (HAREWOOD) (M023819)MEADOWS (HAREWOOD) (M023819)
KUITPO FOREST RESERVE M023887KUITPO FOREST RESERVE M023887
MCLAREN FLAT (BELTUNGA) (M023861)MCLAREN FLAT (BELTUNGA) (M023861)
MEADOWS (OAKLAND HILLS) (M023799)MEADOWS (OAKLAND HILLS) (M023799)
BULL CREEK (MARBLE HOUSE)(M023772)BULL CREEK (MARBLE HOUSE)(M023772)
KANGARILLA SECTION 6, (M023358)KANGARILLA SECTION 6, (M023358)
800
750
775
725
700
650
600
825
850
550
525
825
700
750
775
800
60065
0FINNISS RIVER @ 4 km East Of Yundi - AW426504FINNISS RIVER @ 4 km East Of Yundi - AW426504
(metres)
20
Produced by the Surface Water Group,Knowledge and Information Division, DWLBC
Data Sources:CLIMATE STATIONS AND RAINFALL: Bureau of Meteorology
TOWNS AND LOCALITIES: Information and Data Analysis, Planning SA
0 2 41 km
Projection: Map Grid of Australia 1994 (UTM)Datum: Geocentric Datum of Australia 1994 Date: June 2003
Finnis Subcatchment
Rainfall Isohyet (mm)
Stream
BoM Rain Station
Stream Gauging Station
Elevation
210- 280
280 - 320
320 - 360
360 - 400
400 - 480

Surface Water Assessment of the 21 Report DWLBC 2003/18 Upper Finniss Catchment
CATCHMENT HYDROLOGY
Rainfall
Rainfall data in South Australia is collected by the Bureau of Meteorology (BoM), DWLBC and by private landholders. The data is stored in the DWLBC’s database.
DATA AVAILABILITY
Within the catchment area daily read rainfall records are available from five BoM stations. The stations, the period of records and the mean and median annual rainfall are listed in Table 8. Rainfall records from these 5 stations and from rainfall isohyets for the catchment indicate that the rainfall in the catchment area ranges of 750mm to 850mm (Figure 6). Almost 80% of the rainfall is seen to occur during the period between May to November.
Table 8. Rainfall stations in the Finniss River Catchment U/S of AW426504
No. Station Name (Code) Period of Record Mean (Median) Annual Rainfall (mm)
1 Meadows (BoM023730) 1887 – 2001 871 (861) 2 Meadows, Oakland Hills
(BoM023799) 1967 – 2001 792 (810)
3 Kuitpo Forest HQ (BoM023818) 1971 – 2001 822 (828) 4 Meadows, Harewood (BoM023819) 1972 – 1980 812 (745) 5 Yundi (BoM023808) 1969 – 2001 840.3 (839.7)
DATA PROCESSING
Daily read rainfall records usually have periods when rainfall during weekends and public holidays are accumulated and recorded on the next working day, and missing records are not uncommon. Hence, disaggregation of accumulated data and infilling of data for periods of missing records was carried out to obtain complete data sets. Data disaggregation and infilling for stations 1, 2, 3, and 5 in Table 8 were done by Sinclair Knight Merz (SKM, 2000) for DLWBC. Data in-filling and verification for homogeneity at Meadows (station 4 in Table 8) was done as part of this study. The mean and median annual rainfall values listed in Table 8 were calculated from the disaggregated and in-filled data sets.
Meadows is the only station in the catchment area that has long-term rainfall records (from 1887 till current). Hence rainfall data from this station was used to extend the short-term rainfall records of stations 2,3 and 4 back to 1887, for further modelling purposes. Rainfall records at Yundi were extended using the records from another daily read BoM station at Willunga (BoM23753) as it provided a correlation.

Catchment Hydrology
Regional homogeneity checks of rainfall records of Meadows and Willunga were carried out prior to using them for extension of rainfall records of other stations. Double mass curve analysis of monthly rainfall data was performed between the station being verified against the average of six other stations for this purpose. The curve for Meadows (Appendix C) indicates that the rainfall in Meadows is homogenous with the regional average for most of the 112 years of record (1887 to 1998), except for a short period of two years (May 1917 to June 1919). The rainfall records for these two years was then adjusted for homogeneity using the average of the slopes of the sections of the curve on either side of this two-year duration. The rainfall records from Willunga were not adjusted as the slope changes in the double mass curve plotted were considered to be within reasonable limits.
The methodology involved in disaggregation, infilling and verification for homogeneity of rainfall data is outlined in Appendix A and Appendix B.
DATA ANALYSIS
Annual Rainfall
The long-term (1887 to 2000) annual rainfall records at Meadows (BoM023730) indicate a decreasing trend in annual rainfall as shown by the trendline in Figure 7. Comparison of mean rainfall on a decadal basis (Figure 8) indicates that in the last five decades only one decade (1970s) was above the long-term mean annual rainfall. The data also indicate that during the last 25 years (1975 –2000) sixteen years were below average rainfall years, with the period between 1980 and 1990 having the highest number (7 years) of below average rainfall years in the whole data set. This trend was also observed in the data sets from the rainfall stations at Mt Compass in Tookeyarta Catchment, Willunga in Willunga catchment and Macclesfield in the Angas catchment. To verify the decreasing trend in annual rainfall further analysis was carried out using residual mass curve analysis and trend analysis methodologies.
A residual mass curve is a plot of the cumulative deviation of a set of data from the mean value of the data. In a residual mass curve plotted for annual rainfall data, a distinctive upward slope above the mean indicates a wetter than average period for that section of the curve and vice versa. Some of the wetter than average periods from Figure 7 are 1915 to 1924 and 1968 to 1974. Some of the drier than average periods are from 1957 to 1967 and from 1975 to 1991.
Trend Analysis methodologies are used to determine the existence of a trend in a long-term data set and also the level of statistical significance of the trend. Results of the trend analysis of annual rainfall data from Meadows for the period 1887 to 2000 indicate a decreasing trend, statistically significant at 92.7% using the Mann’s test (Grayson, 1996) (Appendix D) and statistically significant at 95.8% using the “t” and “F” tests (Draper, 1998).
Surface Water Assessment of the 22 Report DWLBC 2003/18 Upper Finniss Catchment

Catchment Hydrology
Annual Rainfall at Meadows (BoM23730)(1887 - 2000)
400
600
800
1000
1200
1400
1600
1885 1895 1905 1915 1925 1935 1945 1955 1965 1975 1985 1995
Year
Ann
ual R
ainf
all (
mm
)
-500
0
500
1000
1500
2000
2500
Rei
dual
Mas
s (m
m)
Annual Rainfall (mm)Series3
Mean Annual Rainfall = 875 mmTrendline
Residual Mass Curve
Figure 7. Annual Rainfall at Meadows
Decadal Mean Rainfall at Meadows(1890 - 2000)
700
750
800
850
900
950
1000
1890 1900 1910 1920 1930 1940 1950 1960 1970 1980 1990 2000Year
Deca
dal M
ean
Rain
fall (
mm
) Mean Annual Rainfall (875 mm)
Figure 8. Deviation of Decadal Mean Rainfall from Long-Term Mean Annual Rainfall
Monthly Rainfall
The monthly rainfall data at Meadows (Figure 9) indicates that around 80% of the annual rainfall occurs in winter (between May and November). Further analysis was done to detect the presence of any trends in long-term data of individual months. Residual mass curves were plotted for June rainfall along with winter and annual rainfall for the period 1887 to 2000 (Figure 10). The residual mass curve for the month of June follows the same pattern as that of the annual residual mass curve. This suggests that the decreasing trend of annual rainfall could be attributed to the decrease and/or delay in June rainfall. Plots for the other months do not indicate any definite pattern except for the months of May and September.
Surface Water Assessment of the 23 Report DWLBC 2003/18 Upper Finniss Catchment

Catchment Hydrology Monthly Rainfall (mm) at Meadows (BoM023730)
0.0
20.0
40.0
60.0
80.0
100.0
120.0
140.0
Jan Feb Mar Apr May Jun Jul Aug Sep Oct Nov Dec
Month Figure 9. Monthly Rainfall at Meadows
Similar trends of decreasing annual and June rainfall were observed in previous studies in the Barossa valley (Cresswell, 1991), Onkaparinga Catchment (Teoh, 2001) and Marne catchment (Savadamuthu, 2002). Further analysis of annual and monthly rainfall data from more stations in the region is required for further definite conclusions regarding rainfall trends.
Monthly Residual Mass Curves - Meadows, Finniss Catchment
-500
0
500
1000
1500
2000
2500
1887 1897 1907 1917 1927 1937 1947 1957 1967 1977 1987 1997Year
Res
idua
l Mas
s (m
m)
June RainfallAnnual RainfallMay to November Rainfall
* Refer Appendix Y for Residual Mass Curves for other months
Figure 10. Monthly Residual Mass Curve for Meadows
Surface Water Assessment of the 24 Report DWLBC 2003/18 Upper Finniss Catchment

Catchment Hydrology
Streamflow
Streamflow gauging, of catchments in South Australia is carried out by DWLBC of Water, Land and Biodiversity Conservation. The streamflow gauging station (AW426504) (Figure 2) for the study area (Finniss catchment U/S of gauging station AW426504) is located 4 Km east of Yundi, upstream of Meadows and Blackfellow creeks and on the Finniss River.
The three major streams in the catchment are Meadows Creek, Blackfellow Creek and the Finniss River. The Meadows creek originates from the northern boundary of the catchment before joining the Finniss River on the south-central boundary of the catchment. The Finniss River then traverses towards the east where it is joined by the Blackfellow Creek, which originates from the eastern highlands. The station is located downstream of the confluence of the three major streams in the study area. The river then flows in the south-east direction. The Bull Creek and the Wattle Flat Creek drain into the Finniss as it flows southeast through the plains before joining the River Murray. The Bull Creek catchment receives rainfall ranging between 825 mm in the north to around 675mm in the south. The Wattle Flat Creek catchment lies in the lower rainfall region, with rainfall ranging from 725 mm in the north to around 500mm in the south.
DATA AVAILABILITY & PROCESSING
Streamflow records from the gauging station are available from April 1969 onwards. Missing records (for 34 days) during this period were infilled on a monthly basis using records from Currency Creek gauging station, as they were the best correlated in comparison to records from 11 other gauging stations. Double Mass Curve methodology was used for the infilling process.
Regional homogeneity checks of monthly streamflow records were performed using Double Mass Curve methodology, with records from Scott Creek and Myponga gauging stations. While the plot indicated quite a few inconsistencies, the average slope of the plot was consistent. The streamflow records were then checked for those periods when the kinks occurred in the plot. Most of those periods had records with quality code 150, which is “Caution – Rating Table Extrapolated.” This indicates that the streamflow for those periods were higher than any of the measured flow ratings carried out by DWLBC and therefore were derived from extrapolation of the rating curve. Those periods will be further assessed during the rainfall-runoff modelling process. The methodology for infilling and verification of homogeneity of streamflow records are the same as adopted for rainfall data.
DATA ANALYSIS
The mean and median annual runoffs from the catchment for the period 1970 to 2000 are 26470 ML and 27673 ML. Years 1971 and 1992, received high rainfall and had the highest flows. The years 1980, 1982, 1994, 1997, 1998 and 1999 received low rainfall and hence produced very low streamflow (Figure 11). More than 95% of the annual streamflow occurs during the period between May and November, with the highest streamflow during the month of August.
Surface Water Assessment of the 25 Report DWLBC 2003/18 Upper Finniss Catchment

Catchment Hydrology
A n n u a l F lo wF in n is s G a u g in g S ta tio n AW 4 2 6 5 0 4
0
1 0 0 0 0
2 0 0 0 0
3 0 0 0 0
4 0 0 0 0
5 0 0 0 0
6 0 0 0 0
1 9 7 0 1 9 7 2 1 9 7 4 1 9 7 6 1 9 7 8 1 9 8 0 1 9 8 2 1 9 8 4 1 9 8 6 1 9 8 8 1 9 9 0 1 9 9 2 1 9 9 4 1 9 9 6 1 9 9 8 2 0 0 0
Y e a r
Ann
ual F
low
(ML)
M e d ia n = 2 7 6 7 3 M L
Figure 11. Annual Runoff from Upper Finniss Catchment
Figure 12 shows the flow duration curve for the daily flows at the gauging station AW426504. The flow durations are defined as the percentages of time during the total period of record for which the flow exceeded various rates.
Flow D uration C urve (1970 - 2000)(Finniss R iver Catchm ent U /S AW 426504)
0.01
0.1
1
10
100
1000
10000
0 10 20 30 40 50 60 70 80 90 10
% of tim e flow greater than indicated
Dai
ly F
low
(ML)
0
M edian Daily F low = 7.73 M L
Figure 12. Daily Flow Duration Curve for Upper Finniss Catchment
The current flow-duration characteristics of the catchment indicate that in an average year:
• the catchment flows almost throughout the year (98% of the year);
• a flow of 1 ML/day will be available on 290 days in a year (78% of the year);
• a flow of 10 ML/day will be available on 165 days in a year (46% of the year);
• a flow of 50 ML/day will be available on 75 days in a year (20% of the year);
• a flow of 100 ML/day will be available on 45 days in a year (12% of the year).
Surface Water Assessment of the 26 Report DWLBC 2003/18 Upper Finniss Catchment

Catchment Hydrology
One of the main objectives of this study is to evaluate if the duration of the any of the flow ranges have been impacted by farm dam development in the upstream catchment, and also the extent of the impact on the flow ranges. These issues are addressed in the later sections of the report.
Surface Water Assessment of the 27 Report DWLBC 2003/18 Upper Finniss Catchment

Rainfall-Runoff Relationship The rainfall-runoff relationship curve indicates the annual runoff that can be expected from the catchment for various annual rainfalls. Rainfall-runoff curves can be used as a tool for comparing the characteristics and efficiencies of different catchments. The runoff coefficient is the average annual runoff divided by the average annual rainfall for the catchment. This can be used for comparing runoffs generated from catchments in a region. The runoff co-efficient for this study area is 0.17 for the period 1970 to 1998, or in simpler terms, on an average 17mm of runoff leaves the catchment for every 100mm of rainfall. The runoff coefficient of 0.17 for the Upper Finniss catchment is higher than many other catchments in Eastern Mount Lofty Ranges (Table 9).
Table 9. Runoff Coefficients for Catchments in the Eastern Mount Lofty Ranges (McMurray, 2001)
No. Catchment Name Period of Record
Mean Annual Rainfall (mm)
Mean Annual Runoff (mm)
Runoff Coefficient
1 Finniss Catchment U/S of AW426504 1970-98 854 144 0.17 2 Marne Catchment U/S of AW426529 1973-96 535 33 0.06 3 Currency Creek U/S of AW426530 1973-96 726 108 0.15 4 Bremer River U/S of AW426533 1974-96 492 42 0.09 5 Mt Barker Creek U/S of AW426557 1980-96 703 82 0.12 6 Dawesley Creek U/S of AW426558 1976-96 642 76 0.12
Rainfall - Runoff Curve for Finniss Catchm ent(1970 - 2000)
0
50
100
150
200
250
300
350
400
0 100 200 300 400 500 600 700 800 900 1000 1100 1200 1300
Annual Catchm ent Rainfall (m m )
Ann
ual C
atch
men
t Run
off (
mm
)
Tanh Curve
Figure 13. Rainfall-Runoff Curve for the Upper Finniss Catchment
Surface Water Assessment of the 28 Report DWLBC 02/12/000X Upper Finniss Catchment

Catchment Hydrology
The Rainfall-Runoff curve shown in Figure 13 was plotted using a Tanh function (Appendix E). Inspecting the curve shows that little or no runoff occurs for annual rainfall values below 550 mm. The curve can also be used to estimate flows for years with missing flow data. For example, a year with missing flow data and rainfall of 850 mm would have generated a runoff of around 135 mm, which is equivalent to 25920 ML.
The Rainfall-Runoff curve can also be used for initial estimates of runoff for ungauged neighbouring catchment. In this case, the rainfall-runoff curve for Finniss catchment could be used for initial runoff estimates (from rainfall records in the catchment) for the Tookayerta Creek catchment, which is the neighbouring catchment of Finniss and does not have streamflow records.
Surface Water Assessment of the 29 Report DWLBC 2003/18 Upper Finniss Catchment

SURFACE WATER MODELLING
Overview Surface water models are conceptual models that are constructed using computer programs and are used to simulate catchment conditions for assessment of their current, past and future conditions. They provide a good tool for better understanding of the long-term hydrological behavior of catchments, and also for further assessment of impacts on the catchment hydrology due to various changes. In the case of this study, long-term daily rainfall data was used to calibrate and simulate long-term runoff data for the Finniss catchment using recorded rainfall data. This was further used to model scenarios to study the impact of farm dams on catchment runoff. Surface water modelling involves the following processes: • Model Construction is the process of formulation of a series of mathematical
equations that represent the relationships between the various processes involved in the hydrological cycle viz, rainfall, interception storage, evaporation, transpiration, infiltration, percolation, baseflow, etc.
• Model Calibration is an iterative process of solving the above-mentioned set of mathematical equations. Some of the main steps involved in this process are:
- Input data to the model - one or more measured sets of hydrological
parameters (eg, daily rainfall data set)
- Iteratively vary the other unobserved hydrological and catchment characteristics parameter sets (eg, pan factor for soil, interception storage, ground water discharge, etc.,) to mathematically simulate one or more hydrological parameters that have been measured (eg, simulation of catchment runoff)
- Compare the simulated values to the measured values and continue the
iteration process until a ‘good correlation’ is obtained between the simulated and measured values.
- Use the estimated set of unobserved hydrological and catchment
characteristics parameter sets obtained at this stage of ‘good correlation’ for modelling further scenarios.
The level of efficiency of the calibration process depends on the availability and accuracy of the number of hydrological parameter data sets. Since the hydrological cycle involves a large number of parameters that are not measured, efficient calibration of hydrological models requires good knowledge of the catchment conditions.
• Modelling Scenarios is the process of running the calibrated model with measured
long-term hydrological parameter data set(s) to obtain long-term estimates of the other hydrological parameter set(s) that were not measured (eg, to generate long-term runoff from 100 years of measured rainfall data). This provides a historical insight of the hydrological condition of the catchment and also the probable impacts on the catchment hydrology of the various changes (natural & human-influenced) that had occurred in the past. Furthermore, this can be used as a good
Surface Water Assessment of the 30 Report DWLBC 02/12/000X Upper Finniss Catchment

340 m
350
m
330 m
360 m
320 m
340 m
350m360
m
Figure 14. Model Construction - Representation of Sub-Catchments and Farm Dams
Sub-Catchment MN32
Sub-Catchment MN33
Catchment Node representingSub-Catchment MN32
Catchment Node representingSub-Catchment MN33
Off-Stream Dam Node representingcumulation of dams in MN32
Off-Stream Dam Node representingcumulation of dams in MN33
Str
eam
flow
D
irect
ion
Setup of Catchment and Dam Nodes in the ModelSub-division of Catchments in GIS
Surface Water Assessment of the Upper Finniss Catchment Report DWLBC 2003/18
Produced by the Surface Water Group,Knowledge and Information Division, DWLBC
0 0.5 10.25 km
Sub-catchments
Streams
Dams
Height (m)
320330340350360
31

Surface Water Modelling
tool for prediction of impacts on catchment hydrology of possible future developments and changes.
Methodology WaterCress (Cresswell, 2000), a PC based water-balance modelling platform was used for construction of the model in this study. This modelling platform incorporates some of the most widely used water-balance models in Australia viz., AWBM, SFB, HYDROLOG, and WC1. WC1 (Appendix F) is a water balance model that was used to construct and calibrate models for various catchments in South Australia and hence was used in this study. WaterCress allows the incorporation of different components in its water balance models. The components that can be incorporated are:
1. Demand Components, which includes town and rural demands 2. Catchment Components, which includes rural and urban catchments 3. Storage Components, which includes reservoir, aquifer, tank, and off-stream dam 4. Treatment components, which include sewage treatment works and wetlands 5. Transfer Components, which includes weir and routing component.
A model is then constructed as a series of “nodes”, each node being one of the components mentioned above. The nodes are then linked based on the drainage direction to form one major catchment.
Model Construction The Upper Finniss Catchment was subdivided into major and minor sub-catchments as explained in the earlier section on catchment sub-division. The model was then set up as a series of rural catchment nodes followed by off-stream dam nodes, with a routing node added to the end of the catchment. Each rural catchment node in the model represents a minor sub-catchment within the whole of Finniss catchment (Figure 14). Each off-stream dam node in the model represents the accumulation of dams within that minor sub-catchment. The input data for each rural catchment node were:
1. Area of the minor sub-catchment, 2. Corresponding measured daily rainfall and monthly evaporation data files, 3. Runoff model to be used, which was WC1 in this case and initial estimated values
for the catchment parameter set, viz., median soil moisture content, interception storage, catchment distribution, ground water discharge, soil moisture discharge, pan factor, fraction ground water loss, storage reduction coefficient, ground water loss and creek loss, and
4. Calibration file, which is the set of measured daily rainfall and corresponding runoff data for the node that has the gauging station.
Surface Water Assessment of the 32 Report DWLBC 2003/18 Upper Finniss Catchment

Surface Water Modelling
Each sub-catchment node with farm dams was then linked to an off-stream dam node (Figure 14). The input data for each off-stream dam nodes were:
1. Dam storage volume, which in this case, was the cumulative storage capacity of all
the dams in the minor sub-catchment, 2. Corresponding measured daily rainfall and monthly evaporation data files, 3. Dam capacity to dam surface area relationship, 4. Maximum daily diversion to the dam, which in this case was the maximum capacity
of the dam, 5. Fraction of total catchment runoff diverted to the dam. This is dependent on the
location of the dam(s) and the probable catchment runoff captured by the dam(s). For example, this fraction was 1.0 if there were an on-stream dam located on the downstream end of the catchment, as it would be a controlling dam that is deemed to control or block the runoff from the entire sub-catchment. This fraction was reduced when the total catchment storage was made up of numerous smaller dams spread throughout the catchment or when the dams were truly off-stream.
6. Water usage from the dams, which, due to lack of further information was assumed to be 30% of the total dam capacity, on an annual basis. This rate of water usage was found to allow for some carry over of storage to following years in previously calibrated models for other catchments in the Mount Lofty Ranges. A recent study of over 700 dams across the Mt Lofty Ranges supports this figure of 30% as an average water use from farm dams. (McMurray, 2003)
The whole of Finniss catchment was hence represented as a series of rural catchment nodes and off-stream dam nodes, followed in the end by a routing node, that were all connected based on the catchment’s drainage pattern. Refer Appendix G for details on the setup of catchment and off-stream dam nodes in the model.
Model Calibration Once the water balance model for the catchment was constructed, the model was calibrated with daily rainfall data, daily runoff data, monthly evaporation data and farm dams capacity data as recorded inputs. The model was calibrated for 32 years (1969 to 2000) to the daily runoff data recorded at the Finniss Gauging Station (AW426504). Rainfall data input to the model was in the form of daily rainfall data from four Bureau of Meteorology (“BoM”) rainfall stations (Table 8), to account for the variation in rainfall within the Finniss catchment. The variation in rainfall within each of the major sub-catchments was calculated as the ratio of value of the isohyet passing through corresponding BoM station to the value of the isohyet passing through that minor sub-catchment. For example, rainfall data recorded from the BoM station at Yundi was used for the entire Finniss River sub-catchment. The mean annual rainfall at Yundi is 890mm. The minor sub-catchment F7 within the Finniss River sub-catchment has the 875mm isohyet passing through its center. Hence, the rainfall for the F7 minor sub-catchment was calculated as: Rainfall data set for minor sub-catchment F7 = 875/890 * Yundi Rainfall Data = 0.98 * Yundi Rainfall Data The rainfall data used for all the sub-catchments are listed in Appendix H.
Surface Water Assessment of the 33 Report DWLBC 2003/18 Upper Finniss Catchment

Surface Water Modelling
Once the input data was finalized, the model was calibrated by keeping recorded data (daily rainfall, daily streamflow, monthly evaporation, dam capacities) as constants and iteratively varying the data for the catchment parameter set until a ‘good correlation’ was obtained between the measured and the simulated runoff. A ‘good correlation’ meant visual comparison of the actual runoff events and statistical evaluation, which is evaluating Correlation Coefficient (R-Squared) and the Co-efficient of Efficiency (Ce) for each iteration. These comparisons were done for daily, monthly and annual data. The model was calibrated for the period between 1969 and 2000,with the following statistical results:
Table 10. Model Calibration Results
Period R-Squared
Coefficient of
Efficiency
Mean Flow (ML) Measured / Modelled
% Volume difference
Annual 0.95 0.9 25420 / 25018 1.6 Monthly 0.97 0.92 2163 / 2147 0.8 Daily 0.84 0.71 7.4 / 69.9 0.67
As shown in Table 10 better calibration was obtained on a monthly and annual time scale than for daily time scale. This is expected in a daily time step model but as shown in Figure 15 the model still provides an accurate fit for the daily flow frequency curve.
Daily Flow Frequency Curves for the period 1969 to 2000
0.01
0.1
1
10
100
1000
10000
0 50 100 150 200 250 300 350Number of Days Flow Exceeded
Daily
Flow
(ML)
M odelled Flow Observed Flow
R2 = 0.83Cv = 0.71
Figure 15. Daily Flow Frequency Curves for Measured and Modelled Flows
Calibration of daily flows of less than 2 ML was less accurate than the rest of the flow range as shown in Figure 15. Further investigation of these low flows revealed that a large proportion of them were from low flow events during the months of October, March and November. The model overestimated flow during these months. This could be due to variety of reasons, some identifiable reasons being:
- The control section at the water level gauging site is a stepped broad-crested rectangular weir that was built in 1969, when measurement of low flows for
Surface Water Assessment of the 34 Report DWLBC 2003/18 Upper Finniss Catchment

Surface Water Modelling
environmental flows assessment was probably not a high priority in design on the control section.
- The water usage rate from the farm dams was assumed to be 30% of the dam
capacity during the calibration process. In reality the usage rate probably could be much higher during the dry months. Hence, the model could be overestimating the flow during those dry months.
- Summer events are mostly rainfall intensity driven. Since rainfall records were
available only on a daily time scale as inputs for the model, it limits the model’s capability to simulate summer events.
Analysis of results of model calibration on a monthly time scale (Figure 16) revealed a good correlation (R-Squared values > 0.95) between the measured and modelled flows for the most of winter months (May to September). The poorest calibration was for the month of March (R-Squared of 0.39). This confirms the discussion in the previous paragraphs of the inability to simulate the break-of-season flows and also the flow events during summer months as accurately as the simulation of the flow events during winter.
Monthly Flows for the period 1969 to 2000
0
1000
2000
3000
4000
5000
6000
7000
8000
9000
Jan Feb Mar Apr May Jun Jul Aug Sep Oct Nov Dec
Media
n Mon
thly F
lows (
ML)
0.2
0.4
0.6
0.8
1
Modelled Observed R-Squared
Co
rrelat
ion (R
-Squ
ared)
betw
een
obse
rved a
nd m
odell
edFigure 16. Monthly Flows - Correlation Between Measured and Modelled Data
Figure 17 illustrates the annual rainfall and the corresponding correlation between the measured and modelled flows. In general, better calibration was obtained for average and above average rainfall in comparison to the drier years (eg, 1982 - 550 mm rainfall, 1997 – 693 mm, 1998 – 710 mm). As with most hydrological models, modelling in general, and more specifically simulation of low flow events, high flood events, summer events and late season base flows could probably be improved by using: • Hourly rainfall data rather than daily rainfall data, as runoff hydrographs (the start,
duration, peak and volume of runoff events) can be more accurately simulated using rainfall intensity data rather than daily rainfall data,
• Daily evaporation data rather than mean monthly evaporation
• More accurately recorded low flow data, which would require the current control section
at the gauging site to be modified to measure a better range of low flows
Surface Water Assessment of the 35 Report DWLBC 2003/18 Upper Finniss Catchment

Surface Water Modelling
Daily Flow Correlations on an Annual Basis
400
500
600
700
800
900
1000
1100
1200
1969 1971 1973 1975 1977 1979 1981 1983 1985 1987 1989 1991 1993 1995 1997 1999
Year
Annu
al Rain
(mm)
0
0.2
0.4
0.6
0.8
1
Rain Daily R2
Median Annual Rain
Corre
alation
betwe
en Ac
tual an
d Mo
delled
Flow
s
Figure 17. Correlation between Measured and Modelled Daily Flows on an Annual Basis
• More accurate range of high flow data. In the current rating curve used for calculating
runoff from water level, the high flows are calculated from the extrapolated part of the rating curve. More flow ratings at high flow at the gauging site would further refine this extrapolated part of the rating curve and hence better high flow data.
All of these factors would lead to better-input data and hence, possibly better calibration of the runoff events. But such data, particularly rainfall and evaporation, are limited in availability, which in turn would limit the ability to assess the long-term sustainability of all catchment resources. As the primary objective of this study was to assess the sustainability of water resources of the catchment, the potential errors at the extremes of the flow range are not critical and modelled results should be considered acceptable for this purpose.
Surface Water Assessment of the 36 Report DWLBC 2003/18 Upper Finniss Catchment
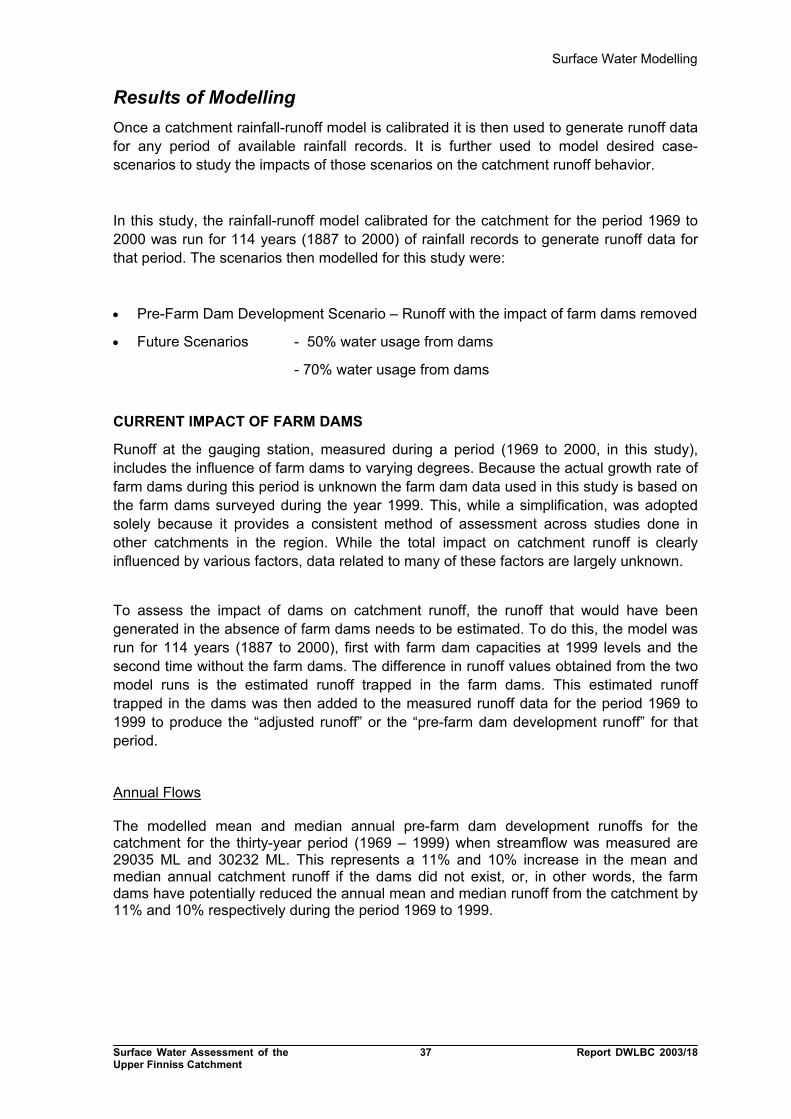
Surface Water Modelling
Results of Modelling Once a catchment rainfall-runoff model is calibrated it is then used to generate runoff data for any period of available rainfall records. It is further used to model desired case-scenarios to study the impacts of those scenarios on the catchment runoff behavior.
In this study, the rainfall-runoff model calibrated for the catchment for the period 1969 to 2000 was run for 114 years (1887 to 2000) of rainfall records to generate runoff data for that period. The scenarios then modelled for this study were:
• Pre-Farm Dam Development Scenario – Runoff with the impact of farm dams removed
• Future Scenarios - 50% water usage from dams
- 70% water usage from dams
CURRENT IMPACT OF FARM DAMS
Runoff at the gauging station, measured during a period (1969 to 2000, in this study), includes the influence of farm dams to varying degrees. Because the actual growth rate of farm dams during this period is unknown the farm dam data used in this study is based on the farm dams surveyed during the year 1999. This, while a simplification, was adopted solely because it provides a consistent method of assessment across studies done in other catchments in the region. While the total impact on catchment runoff is clearly influenced by various factors, data related to many of these factors are largely unknown.
To assess the impact of dams on catchment runoff, the runoff that would have been generated in the absence of farm dams needs to be estimated. To do this, the model was run for 114 years (1887 to 2000), first with farm dam capacities at 1999 levels and the second time without the farm dams. The difference in runoff values obtained from the two model runs is the estimated runoff trapped in the farm dams. This estimated runoff trapped in the dams was then added to the measured runoff data for the period 1969 to 1999 to produce the “adjusted runoff” or the “pre-farm dam development runoff” for that period. Annual Flows The modelled mean and median annual pre-farm dam development runoffs for the catchment for the thirty-year period (1969 – 1999) when streamflow was measured are 29035 ML and 30232 ML. This represents a 11% and 10% increase in the mean and median annual catchment runoff if the dams did not exist, or, in other words, the farm dams have potentially reduced the annual mean and median runoff from the catchment by 11% and 10% respectively during the period 1969 to 1999.
Surface Water Assessment of the 37 Report DWLBC 2003/18 Upper Finniss Catchment

Surface Water Modelling
Reduction in Annual Runoff by 1999 Dams
0
10000
20000
30000
40000
50000
60000
70000
1969 1971 1973 1975 1977 1979 1981 1983 1985 1987 1989 1991 1993 1995 1997 1999Year
Annu
al Ru
noff
(ML)
Pre-Development RunoffRunoff-1999 DamsRunoff Reduction by 1999 Dams
0%
5%
10%
15%
20%
25%
30%
35%
% Re
ducti
on in
Ann
ual
Flows
Figure 18. Reduction in Annual Runoff by 1999 Farm Dams
Figure 18 illustrates the variability in the reduction of annual runoffs due to farm dams. The impact of dams is high during years with lower than average rainfall and vice versa. The highest impacts (more than 25% reduction in annual runoff) were observed during 1980, 1982 and 1994, which were the driest years during the thirty-year period. The annual rainfall in those years was 640mm, 500mm and 600mm respectively, which are more than 200mm below the average annual rainfall for the catchment.
Table 11. Potential Impact of Dams on Annual Sub-Catchment Flows (1969 to 1999)
No. Sub-Catchment Area (Km2)
Dam Capacity (ML)
Dam Density (ML/SKm2)
Mean Annual Observed Runoff (ML)
Mean Annual Pre-farm dam development Runoff (ML)
Reduction in Mean Annual Runoff (%)
1 Meadows 142.7 4743 33.2 18772 21277 12% 2 Finniss River 27.7 679 25 3927 4317 9% 3 Blackfellow Creek 22.6 379 17 3229 3441 6% Total Catchment 193 5801 30 25928 29035 11%
Table 11 lists the varying impact of dams on a sub-catchment level. The impacts are high on the sub-catchments of Meadows stream, with the lowest impact on the Blackfellow Creek sub-catchment. This is directly linked to the farm dam density of the sub-catchments as shown in the table. While the overall reduction in the mean annual runoff from the sub-catchments vary between 6% and 12%, the reduction on an annual basis varies with rainfall. The highest impacts were during the drier years viz., 1980, 1982 and 1994. For example, during those three years, the reductions in median annual runoffs from the Meadows sub-catchment were 31%, 37% and 38% respectively, while the average reduction in mean annual runoff for the period between 1969 and 1999 was only 12%. The same pattern was observed in all of the sub-catchments. Monthly Flows Analysis of flows on a monthly time scale provides a better interpretation of the varying impact of dams on a seasonal basis. The potential reduction in mean monthly flows during
Surface Water Assessment of the 38 Report DWLBC 2003/18 Upper Finniss Catchment

Surface Water Modelling
the period between 1969 and 1999 due to farm dams varies between 1% in September to 82% in February. As shown in Figure 19, the estimated reduction in flows due to dams is significantly higher during summer months than during winter months. The mean winter (May to November) flow for the period between 1969 and 2000 would have been 27612 ML if the dams did not exist. This is 7% (2000 ML) higher than the actual observed flow for the same period. The reduction in mean flows during the summer months (December, January to April) for the same period is 60% (1100 ML). This percentage varies with months and goes as high as 98% during some months. While summer flows constitute to only 2% to 3% of the annual flows, they are important for the various water-dependent ecosystems. Hence a considerable reduction in flows during this period could play a crucial role in the survival of those ecosystems.
Figure 19. Reduction in Monthly Runoff by Farm Dams for the Period 1969 to 1999
Figure 19 illustrates the comparison of mean monthly flows from the pre-farm dam development scenario and the current observed data, and also shows the monthly reduction in runoff due to farm dams. The impact of dams on monthly flows and their significance are: • July, August and September – the impact of dams on flows is the lowest during these
months. The reductions in runoff due to farm dams during these months are 5%, 2% and 1% respectively. This decreasing impact is due to dams being progressively filled-up, ensuring more catchments are free to flow. While the percentage reduction is low, the actual reduction in volume is quite high as these are the high rainfall/runoff months.
• October to March – the impact of dams is the highest during these late winter /
summer months. The percentage reduction in mean monthly flows during October increases to 10% due to the assumed pumping of water occurring from this month onwards. This reduction jumps to 48% in November and progressively increases during December, January and February to 51%, 77% and 82%. These are the late winter/summer flows when there is progressive reduction in rainfall and runoff,
Surface Water Assessment of the 39 Report DWLBC 2003/18 Upper Finniss Catchment

Surface Water Modelling
increase in evaporation, and increase in water usage from dams. Any additional flow available during this period would extend the duration of the flow events leading to water being available to the environment for an extended period.
• April, May and June – While the reduction in flows due to dams decreases during
these months in comparison to summer months they are quite significant with respect to start of flow. The reductions in modelled mean runoffs due to farm dams during these months are 48%, 28% and 22% respectively. The reduction in flows during these months is likely to be due to the farm dams being relatively empty following the summer months and the runoff generated from the catchment after the initial wetting-up period being trapped by the dams. Reduction in early winter flows could possibly delay the start of the flow events or, in other words, delay the start of the season.
Daily Flows While changes in monthly flows are useful for examination of changes in seasonal flows, they provide little useful information about actual streamflow behavior that is ecologically relevant. Changes in flow regimes that are relevant to impact on the ecology are generally on a daily-basis, and hence analysis of daily flows are crucial for ecological assessment. The impact of farm dams on daily flows can be assessed by comparing the frequencies of flows with and without dams.
Daily Flow Frequency Curves for the period 1969 to 2000
0.01
0.1
1
10
100
1000
10000
0 30 60 90 120 150 180 210 240 270 300 330 360
Number of Days Flow Exceeded
Daily
Flo
w (M
L)
Pre-Development FlowCurrent Flow - Observed
Current Observed Median Daily Flow = 7.72 ML
Modeled Pre-Farm Dam Development Median Daily Flow = 18.21 ML
( modelled low flows to be used with caution. Refer text for further details.)
Figure 20. Comparison of Daily Flow Frequency Curves for Current and Pre Development Scenarios
Comparison of daily flows from the two scenarios (Figure 20) indicates a significant increase in the duration of flows in the flow range between 1 ML/day to 50 ML/day, if the dams did not exist. For example, daily flows up to 10 ML would have occurred for 77 days more per year during the period 1969 to 2000 if the dams did not exist. The difference between the flow durations start reducing for flow ranges higher than 50 ML/day. This indicates that the high flows (≥ 100ML/day) have not been much affected by the construction dams. The model indicates that the dams are substantially full at the time when such flows occur.
Surface Water Assessment of the 40 Report DWLBC 2003/18 Upper Finniss Catchment

Surface Water Modelling
Table 12. Daily Flow Exceedance Values of Current and Pre-farm dam development Scenarios
Flow (ML/day) Pre-farm dam development Scenario – No. of days of flow equaled or exceeded
Current Scenario – No. of days of flow equaled or exceeded
Difference in flow exceedance days
0.1* 364 355 9 1.0* 356 288 68 5.0 312 211 101 10.0 244 167 77 50.0 85 75 10 100.0 49 43 6 500.0 13 12 1 1000.0 5.6 5.5 0.1
* modelled low flows to be used with caution. Refer text for further details. Caution is required when comparing low flows (< 1 ML/day) from the two scenarios due to the limitations in modelling the low flows. These limitations are discussed further in the “Calibration” section. Table 13 lists the daily flow for different flow percentiles for both scenarios. The impact of dams as a percentage difference in flows deceases with flow percentiles, with only 9% difference for high flows (90th percentile) and more than 50% difference for medium and low flows. The median daily flow (50th percentile) would have been more than twice that of the current median daily flows from the catchment during the period between 1969 to 2000 if the dams did not exist.
Table 13. Comparison of Flow Percentiles of Current and Pre-farm dam development Daily Flows
Flow Percentile
Pre-farm dam development Scenario Modelled Flow (ML/day)
Current Scenario Observed Flow (ML/day)
Difference in Flow (ML)
Percentage Difference in Flow
10% 193 126 13 9% 20% 63 52 11 17% 50% 18.21 7.72 10 58% 80% 6.2 0.9 5.3 85% 90% 3.75 0.44 3.31 88%
The reasoning for the reduction in medium / low flows during the thirty-year period of progressive farm dam development are: • Progressive reduction in the free-to-flow areas within the entire catchment due to
streams being blocked by dams, and hence • Progressive reduction in the low and medium flow events, as those flows would be
required to fill up the dams. The highest impact caused would occur during late autumn / early winter when the rainfall season begins and low / medium flow events occur after the initial wetting period. This is
Surface Water Assessment of the 41 Report DWLBC 2003/18 Upper Finniss Catchment

Surface Water Modelling
also the period when ecosystems may need the flows most, following the dry summer months without flow. Further construction of farm dams could, in future, result in slow but progressive degradation of ecosystems, starting from the downstream side and progressing to the upstream parts of the catchment.
River Murray Catchment Water Management Plan - Development Limits As mention in the earlier section on farm dams, two of the three major sub-catchments in the Upper Finniss Catchment have exceeded the development limits defined in the Catchment Plan. The Catchment Plan uses a constant (for all catchments in the Eastern Mount Lofty Ranges) runoff coefficient of 0.10 (10%) and average annual rainfall for individual catchments to estimate runoffs, and hence the allowable development limits for the catchments. While 10% is the estimated average runoff coefficient across the whole Eastern Mount Lofty Ranges and was used in the initial plan for developing a consistent policy on limits for farm dam development, the coefficient varies with individual catchments, as does rainfall. One of the objectives of this study was to carry out detailed analysis on a sub-catchment level to obtain their runoff coefficients. This was achieved by: • analysis of actual streamflow and rainfall records for catchments that are monitored, • using modelling techniques to estimate runoff from individual sub-catchments within the
monitored catchments. In this section of the report are presented the estimates of modelled streamflow from the individual sub-catchments and the allowable development limits based on them.
Table 14. Comparison of Allowable Development Limits
Sub-Catchment Cat
chm
ent
Are
a (K
m2 )
Ave
rage
Ann
ual
Rai
nfal
l (m
m)
Ave
rage
M
ay-N
ov
Obs
erve
d R
unof
f (M
L)
1999
le
vels
of
es
timat
ed F
arm
Dam
Vo
lum
es (M
L)
Allo
wab
le F
arm
Dam
Vo
lum
e (M
L)
– ba
sed
on O
bser
ved
Flow
s A
llow
able
Far
m D
am
Volu
me
(ML)
-
base
d on
Cat
chm
ent
Plan
Finniss River (F1) 28 806 3802 669 1141 526
Meadows Creek (F2) 142 813 18259 4765 5478 2701
Blackfellow Creek (F3) 23 804 3102 388 931 431
Total 193 25163 5822 7549 3658
A comparison of allowable development limits indicate that the average May-November flow for the period 1969 – 1999 is 25163 ML. Flows from each of the sub-catchments were modelled from the observed flow from the whole catchment. As shown in Table 14, the existing (1999) level of farm dam development in all three sub-catchments have not
Surface Water Assessment of the 42 Report DWLBC 2003/18 Upper Finniss Catchment

Surface Water Modelling
exceeded the allowable development limits based on the observed flows, while they have exceeded the Catchment Plan’s development limits in sub-catchments Finniss and Meadows. The adoption of 10% rule in the initial Catchment Plan was necessary to set development limits for the entire Eastern Mount Lofty Ranges to ensure the development rules were conservative in light of limited information being available. The results obtained from modelling provides a better understanding of streamflow and farm dam impacts, and will be useful for the preparation of Water Allocation Plans for the individual sub-catchments, and also during the next review of the Catchment Plan.
FUTURE SCENARIO - 70% WATER USAGE FROM DAMS
Since farm dam development in two of the three major sub-catchments (Meadows and Finniss) in the Upper Finniss catchment has already exceeded the allowable development limits set in the catchment plan (refer earlier section on Catchment Plan Development Limits for further details) it was assumed in this study that no further farm dam construction would be allowed in those sub-catchments. Such limits on further farm dam development could lead to more water use from the existing dams. Hence, prediction of impacts of increased water usages from existing farm dams was carried out in the ”Future Scenarios” modelling. The future scenarios examines the impacts on catchment runoff if annual water usage from farm dams were increased from the current assumed usage rate of 30% to 50% and 70% of the total dam capacity, to irrigate more areas. The model was then run with the new usage rates and the resulting flows and impacts were assessed. In the following section the results and discussions of water usage rates of 70% are discussed.
Annual Flows The percentage reduction of annual flows varies (Figure 21), with higher reduction during drier years and vice versa, as (a) more water would be pumped from the dams in summer during drier years and (b) the dams would be comparatively emptier at the beginning of winter and hence capturing more winter flows.
Reduction in Annual Runoff by Increased Water Usage
0
10000
20000
30000
40000
50000
60000
1969 1971 1973 1975 1977 1979 1981 1983 1985 1987 1989 1991 1993 1995 1997 1999
Year
Annu
al Ru
noff
(ML)
30% Use - Current Scenario50% Use Scenario70% Use ScenarioReduct ion by 50% UseReduct ion by 70% Use
0%
2%
4%
6%
8%
10%
12%
14%
16%
18%
20%
% Re
ducti
on in
Ann
ual
Flows
Figure 21. Impact of Increased Farm Dam Water Usage on Annual Flows (1969- 1999)
Surface Water Assessment of the 43 Report DWLBC 2003/18 Upper Finniss Catchment
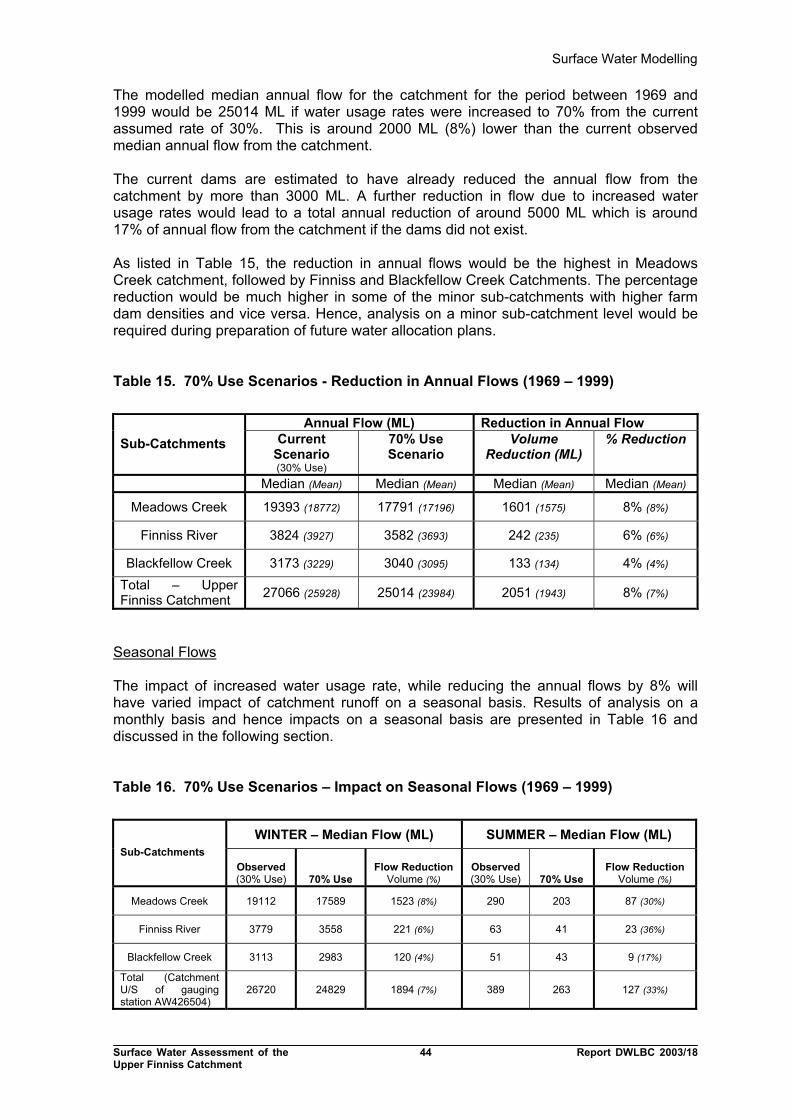
Surface Water Modelling
The modelled median annual flow for the catchment for the period between 1969 and 1999 would be 25014 ML if water usage rates were increased to 70% from the current assumed rate of 30%. This is around 2000 ML (8%) lower than the current observed median annual flow from the catchment. The current dams are estimated to have already reduced the annual flow from the catchment by more than 3000 ML. A further reduction in flow due to increased water usage rates would lead to a total annual reduction of around 5000 ML which is around 17% of annual flow from the catchment if the dams did not exist. As listed in Table 15, the reduction in annual flows would be the highest in Meadows Creek catchment, followed by Finniss and Blackfellow Creek Catchments. The percentage reduction would be much higher in some of the minor sub-catchments with higher farm dam densities and vice versa. Hence, analysis on a minor sub-catchment level would be required during preparation of future water allocation plans.
Table 15. 70% Use Scenarios - Reduction in Annual Flows (1969 – 1999)
Annual Flow (ML) Reduction in Annual Flow Sub-Catchments Current
Scenario (30% Use)
70% Use Scenario
Volume Reduction (ML)
% Reduction
Median (Mean) Median (Mean) Median (Mean) Median (Mean) Meadows Creek 19393 (18772) 17791 (17196) 1601 (1575) 8% (8%)
Finniss River 3824 (3927) 3582 (3693) 242 (235) 6% (6%)
Blackfellow Creek 3173 (3229) 3040 (3095) 133 (134) 4% (4%) Total – Upper Finniss Catchment 27066 (25928) 25014 (23984) 2051 (1943) 8% (7%)
Seasonal Flows The impact of increased water usage rate, while reducing the annual flows by 8% will have varied impact of catchment runoff on a seasonal basis. Results of analysis on a monthly basis and hence impacts on a seasonal basis are presented in Table 16 and discussed in the following section.
Table 16. 70% Use Scenarios – Impact on Seasonal Flows (1969 – 1999)
WINTER – Median Flow (ML) SUMMER – Median Flow (ML) Sub-Catchments
Observed (30% Use) 70% Use
Flow Reduction Volume (%)
Observed (30% Use) 70% Use
Flow Reduction Volume (%)
Meadows Creek 19112 17589 1523 (8%) 290 203 87 (30%)
Finniss River 3779 3558 221 (6%) 63 41 23 (36%)
Blackfellow Creek 3113 2983 120 (4%) 51 43 9 (17%)
Total (Catchment U/S of gauging station AW426504)
26720 24829 1894 (7%) 389 263 127 (33%)
Surface Water Assessment of the 44 Report DWLBC 2003/18 Upper Finniss Catchment
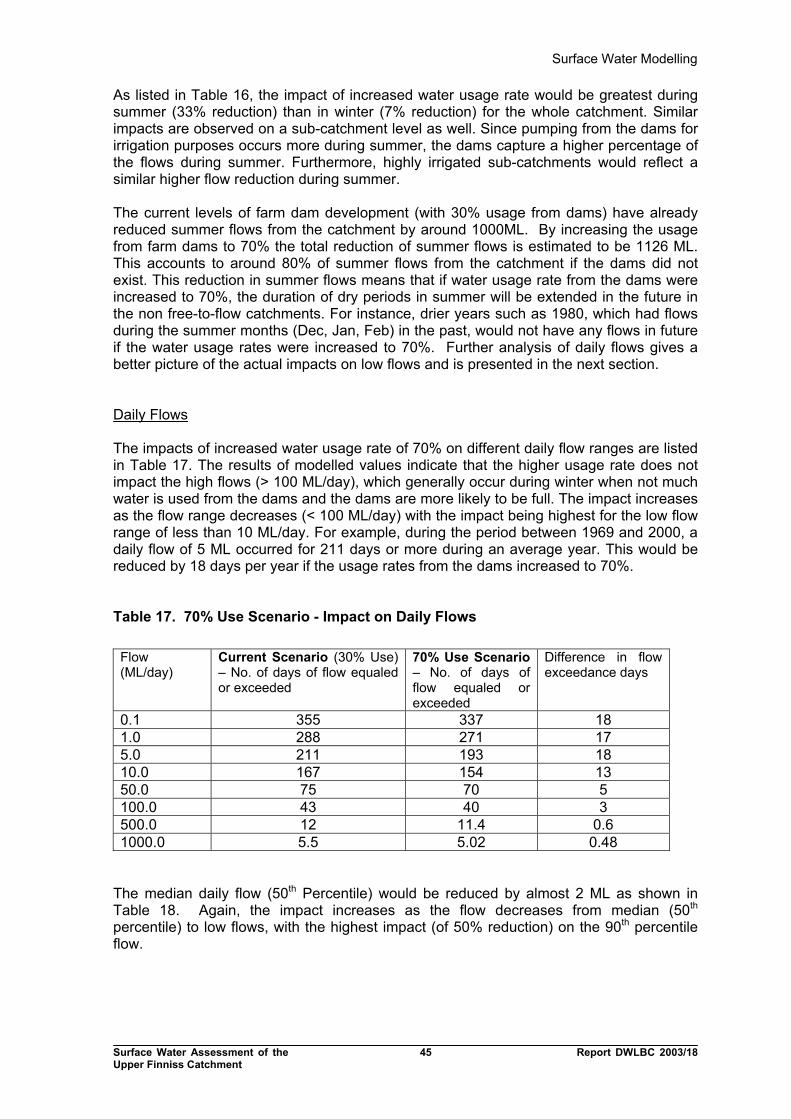
Surface Water Modelling
As listed in Table 16, the impact of increased water usage rate would be greatest during summer (33% reduction) than in winter (7% reduction) for the whole catchment. Similar impacts are observed on a sub-catchment level as well. Since pumping from the dams for irrigation purposes occurs more during summer, the dams capture a higher percentage of the flows during summer. Furthermore, highly irrigated sub-catchments would reflect a similar higher flow reduction during summer. The current levels of farm dam development (with 30% usage from dams) have already reduced summer flows from the catchment by around 1000ML. By increasing the usage from farm dams to 70% the total reduction of summer flows is estimated to be 1126 ML. This accounts to around 80% of summer flows from the catchment if the dams did not exist. This reduction in summer flows means that if water usage rate from the dams were increased to 70%, the duration of dry periods in summer will be extended in the future in the non free-to-flow catchments. For instance, drier years such as 1980, which had flows during the summer months (Dec, Jan, Feb) in the past, would not have any flows in future if the water usage rates were increased to 70%. Further analysis of daily flows gives a better picture of the actual impacts on low flows and is presented in the next section. Daily Flows The impacts of increased water usage rate of 70% on different daily flow ranges are listed in Table 17. The results of modelled values indicate that the higher usage rate does not impact the high flows (> 100 ML/day), which generally occur during winter when not much water is used from the dams and the dams are more likely to be full. The impact increases as the flow range decreases (< 100 ML/day) with the impact being highest for the low flow range of less than 10 ML/day. For example, during the period between 1969 and 2000, a daily flow of 5 ML occurred for 211 days or more during an average year. This would be reduced by 18 days per year if the usage rates from the dams increased to 70%.
Table 17. 70% Use Scenario - Impact on Daily Flows
Flow (ML/day)
Current Scenario (30% Use) – No. of days of flow equaled or exceeded
70% Use Scenario – No. of days of flow equaled or exceeded
Difference in flow exceedance days
0.1 355 337 18 1.0 288 271 17 5.0 211 193 18 10.0 167 154 13 50.0 75 70 5 100.0 43 40 3 500.0 12 11.4 0.6 1000.0 5.5 5.02 0.48
The median daily flow (50th Percentile) would be reduced by almost 2 ML as shown in Table 18. Again, the impact increases as the flow decreases from median (50th percentile) to low flows, with the highest impact (of 50% reduction) on the 90th percentile flow.
Surface Water Assessment of the 45 Report DWLBC 2003/18 Upper Finniss Catchment

Surface Water Modelling
Table 18. 70% Use Scenario - Impact on Daily Flow Percentiles
Flow Percentile
Current Scenario, (30% Use) - Observed Flow (ML/day)
70% Use Scenario – Modelled Flow (ML/day)
Difference in Flow (ML)
Percentage Difference in Flow
10% 126 113 13 10% 20% 52 46 6 12% 50% 7.72 5.92 1.8 23% 80% 0.9 0.59 0.31 34% 90% 0.44 0.29 0.29 50%
Water usage from farm dams are generally during the summer months, and greater during drier years. Increasing the usage rate would lead to a greater proportion of late winter flows being trapped by dams, which otherwise would flow downstream. This will decrease the duration of low flow occurrences and hence increase the “no-flow” period. Continued and increased levels of pumping through summer leads to lesser carry-over storage. This leads to delay in the start of flow events during autumn / early winter due to more water being required to fill-up the dams. This also is the period when the ecosystems may need the water most and could, in future, result in their slow but progressive degradation. While there is a reduction in the low flows due to increased water usage rates, they appear to be lower than the reduction caused by the existing dams. This could be due to the reason that the existing dams are already capturing majority of the low flows, and the current low flows leaving the catchment are from the “free-to-flow” sub-catchments.
Surface Water Assessment of the 46 Report DWLBC 2003/18 Upper Finniss Catchment

CONCLUSIONS 1. Representivity of Hydrological Data Rainfall: Rainfall data from 5 Bureau of Meteorology stations were used in this study. The data set provides a good representation of spatial distribution (Figure 6) of the rainfall in the catchment as the stations are well distributed (geographical /topographical) through the catchment. The data set also provides a good temporal distribution with the longest data set being for 115 years. These two factors provided a good representative basis for usage of the rainfall records for further rainfall-runoff analysis. Streamflow: Streamflow records available for the Upper Finniss Catchment for more than 30 years (from 1969 onwards) represent a period of highly variable catchment runoff ranging from 4337 ML in 1982 to 56423 ML in 1971. The rainfall-runoff relationship also indicates a high degree of dependency of runoff on rainfall, and hence, consistency in the rainfall-runoff relationship. These two factors provided a good representation basis for usage of streamflow data for further analysis and modelling purposes. Evaporation: Mt Bold Reservoir, Myponga and McLaren Vale are three nearby stations to the Upper Finniss Catchment with evaporation data. Data from Mt Bold was used in this study due its to topographic similarity and the availability of long-term data. However, it is considered that data collected from within the catchment would better represent the catchment characteristics. Furthermore, due to lack of daily data, only average monthly evaporation was used in calibration of the daily rainfall-runoff model used in this study. Usage of daily evaporation data would probably result in a better calibration of the model. 2. Calibration of Rainfall-Runoff Model A rainfall-runoff model was used to calibrate runoff from observed streamflow records and estimate long-term runoff from the long-term rainfall data. The model provided good calibration for annual and monthly data and less accurate calibration for daily flow ranges less than 2 ML/day. On a seasonal basis, a good calibration was obtained for most of the winter months, with lesser accuracy during late winter and early summer, and the least accurate calibration being for the months of March. As with most hydrological models, calibration and simulation of low flow events during early summer, late winter base flows and high flood events could be improved by using, as inputs to the model: • More accurate low-flow input data; this could be achieved by incorporating mechanisms
to the existing control section at gauging site to better measure the low-flow ranges. The existing control section is a stepped broad-crested rectangular weir constructed in 1969 for the primary purpose of measuring catchment yields. Measurement of low flows for environmental flows assessment was probably not a high priority in design of the control section in 1969.
• More accurate high-flow input data; this could be achieved by more gauging during high
flood events rather than extrapolation of the rating curve. Manual gauging of high-flow events for rating purposes is generally found lacking due to the risks involved during flood events.
Surface Water Assessment of the 47 Report DWLBC 02/12/000X Upper Finniss Catchment

Conclusions
• Daily evaporation data rather than mean monthly evaporation data. While daily evaporation data could improve the capability for better calibration, prediction of long-term runoff requires long-term daily evaporation data, which is not available.
3. Scenario Modelling The rainfall-runoff model constructed and calibrated for the Finniss catchment upstream of the gauging station was run for two different scenarios to study the impact of farm dams on streamflow measured at the gauging station AW426504 for the period 1969 to 1999. The results of the case scenarios are: i. Pre-Farm Dam Development Scenario: The model was run, first with the 1999 levels
of farm dam development (“Current Scenario”), and next with the impact of farm dams removed (“Pre-Farm Dam Development Scenario”). The results indicate that:
• The farm dams, at 1999 levels of farm dam development intercepted on average
3100 ML/year of runoff generated from the catchment during the period 1969 to 1999. This represents an 11% and 10% reduction in mean and median annual runoff generated from the pre-farm dam development scenario.
• The percentage reduction in annual runoff varies in individual years, the impact
being marginal during wetter years (5% reduction during 1981, 1991) and very high during drier years (more than 25% reduction during 1980, 82 and 1994).
• On a sub-catchment level, the estimated annual flow reductions are 12%, 9% and
6% for Meadows Creek, Finniss Stream and Blackfellow Creek sub-catchment respectively, during the period 1969 to 1999. These are directly linked to the levels of farm dam development in the sub-catchments, with Meadows creek sub-catchment having the highest farm dam density (33.2 ML / Km2) and Blackfellow creek sub-catchment having the lowest (17 ML / Km2).
• On a seasonal basis, the impact of farm dams is significantly higher during
summer months (estimated reduction of 1132 ML or 60% reduction during the months of December and January to April) in comparison to the 7% (1947 ML) during winter (May to November). While summer flows constitute to only 2% to 3% of the annual flows, they are very critical to the water dependent ecosystems as late summer / early winter is the period when the ecosystems are highly stressed.
• The major impact of farm dams is reduction in the duration of low and mid flow
events (< 100 ML/day). For example, flows of up to 10 ML/day would have occurred for 77 days more per year during the period 1969 to 1999 if the dams did not exist. One of the main consequences of this would be extension of the “no-flow” period during late summer / early winter when the rainy season starts and the low /medium flow events occur after the initial wetting-up period. This is also the period when the ecosystems need the flows most, following the dry summer months with minimum or no flows at all.
To summarise, the 1999 levels of farm dam development, though progressive through the last two decades, is estimated to have significantly reduced the low and medium flow (< 100 ML/day) events that may be critical for the water dependent ecosystems and other downstream water requirements. Further surveys and studies of water dependent ecosystems in the catchment are required to evaluate their condition and the extent of impact the change in the flow regimes have had on them.
Surface Water Assessment of the 48 Report DWLBC 2003/18 Upper Finniss Catchment

Conclusions
ii. Future Scenario: Since current level of farm dam development in the Meadows Creek and Finniss River sub-catchments have exceeded the limits set in the Catchment Plan, it was assumed that some form of development control would be put in place in those sub-catchments. While no further construction of farm dams is allowed, the water usage rate from the existing farm dams could increase for expansion of irrigation areas. Hence, the water usage rate from the existing dams were increased from the initial assumed rate of 30% to 70% (and 50%) and runoff data was simulated using the model. The results of increasing the water usage rates to 70% indicate that:
• The farm dams would capture on an average 5050 ML/year of the runoff generated
from the catchment. On an average year this represents 5000 ML (17%) reduction to the pre-farm dam development flows and an additional 2000 ML (7%) reduction to the current flows from the entire catchment. On a sub-catchment level, the reduction in flows reflects the level of development in the sub-catchment, with the highest impact on Meadows Creek catchment (an additional reduction to the current flows by 1576 ML or 8% reduction) and lowest impact on Blackfellow Creek catchment (an additional reduction to the current flows by 134 ML or 4% reduction).
• On a seasonal basis, the impact of increased usage would be greater during the
summer months than during winter. Analysis of daily flows indicates a higher impact on the low and medium flows, with reduction of the current median daily flows by around 2 ML (23% reduction). Flows of 5 ML/day or lower would occur for 18 days less per year in comparison to the current conditions, if the water usage rates were increased to 70%. This is lower than the 101 days reduction already caused by the existing dams. This could be interpreted as, the current level of farm dam development with 30% assumed water usage rate already captures most of the low and medium flows.
To summarise, while the current levels of farm development already capture a significant proportion of the low and medium flows from the catchment, increased water usage from those dams would further deteriorate the situation by further reducing the low and medium flows. This would have a direct consequence on water availability for downstream water users, and more importantly risk a further change to the already impacted flow regime. This change in flow regime will have direct impact on the water dependent ecosystems downstream of the gauging station, as well as those within the Finniss Catchment upstream of gauging station AW426504.
4. Technical Conclusions
Rainfall data used in this study were from 5 rainfall stations, out of which only had long-term records. The stations are topographically well distributed to represent the rainfall in the catchment. Hence, gauging at all these stations should be continued in the future to ensure the maintenance of a representative set of rainfall records for the catchment. Good streamflow records are available from the gauging station from 1969 onwards. Additional streamflow monitoring requirements in the catchment are: • Upgrading the existing streamflow gauging station to enable better measurement at
low-flow ranges.
Surface Water Assessment of the 49 Report DWLBC 2003/18 Upper Finniss Catchment
• Additional streamflow gauging the Meadows Creek just upstream of where it drains into the Finniss River would better define the flows from that catchment. The streamflow currently gauged represents combined flows from the Meadows Creek, Blackfellow

Conclusions
Creek and the Finniss River. It is assumed that the Meadows Creek contributes to a majority of the flows currently gauged.
• An additional streamflow gauging or water level monitoring site on the stream draining
from the Kuitpo Forests into the Meadows Creek is highly recommended. This would determine the flows from the Kuitpo forest sub-catchment and will be useful in analysing the effects of forests on streamflow.
• Further streamflow or water level monitoring sites would be useful in lower Finniss
catchment to assess the surface water resources generated in that section of the catchment. This will also enable assessment of any potential losses that occur before the stream’s confluence with Lake Alexandrina.
DWLBC is currently: • Undertaking a review of the hydrological monitoring network in the State. Consultations
are also being held with the relevant catchment water management boards regarding further monitoring of rainfall and runoff in priority catchments.
• Undertaking a review of the methods used for estimation of farm dam capacities. Field
surveys are also currently being undertaken in other priority catchments to obtain better estimation of farm dam capacities. Results of these surveys would further determine the necessity of surveys in other catchments in the region.
5. Environmental Considerations
This study did not directly assess the status of water dependent ecosystems or the impacts of farm dams on them. It also did not consider increased number and volumes of farm dams as a future scenario due to the controls already placed under the current Catchment Plan. However,
• the main outcomes of the study, that is, the quantification of the impact of farm dams on the flow regime will be useful to further assess the impacts on water dependent ecosystems and
• the model constructed in this study will be an appropriate tool for the assessment of policy for future water allocation planning.
Hence, future reviews of the Catchment Plan will need to assess the flow requirements of the catchments’ ecosystems and balance them with the water availability within the catchments. The ability of the catchments to sustain greater surface and ground water extractions depends on such flow requirements being met.
Surface Water Assessment of the 50 Report DWLBC 2003/18 Upper Finniss Catchment

REFERENCES
Boughton, W.C., 1996. A mathematical model for relating runoff to rainfall with daily data. Civil Engineering Transactions, I.E.Aust, CE8(1).
Bradley Jane, Billington Karla., 2002. Land status data mapping for the Mount Lofty Ranges Watershed. Watershed Protection Office, Environment Protection Agency, Department for Environment and Heritage, South Australia.
Cresswell, D.J., 2002. “WaterCress, Water – Community Resource Evaluation and Simulation System. The Department of water, Land and Biodiversity Conservation, Adelaide, South Australia.
Cresswell, D.J., 1991. Integrated Management of Farm Dams in the Barossa Valley. Engineering and water Supply Department, South Australia. EWS 91/7
Department of Natural Resources and Environment, The State of Victoria, February 2002. “FLOWS – a method for determining environmental water requirements in Victoria”.
Draper, N.R., Smith, H., 1998. Applied Regression Analysis. Fourth Edition, JOHN WILEY & SONS, INC., New York.
Duffield. 2001. Revegetation for the Mount Lofty Ranges Southern Emu-wren and Flerieu Peninsula Swamps. CCSA Adelaide.
Grayson, R.B., Argent, R.M., Nathan, R. J., McMahon, T. A., Mein, G.R., 1996. Hydrological Recipes – Estimation Techniques in Australian Hydrology. Cooperative Research Centre for Catchment Hydrology. pp. 63-64, pp. 81-83.
Hammer, M. 2002. Recovery Outline for the Southern Pygmy Perch in the Mount Lofty Ranges, South Australia. Department of Environmental Biology, Adelaide University and Native Fish Australia (SA) Inc.
Kendal, M.G.,1970. Rank Correlation Methods. 4th Edition, Griffen, London, 202pp.
Ladson, A.R. and Porter J.W., 1993. An Application for Fixed-Area Rainfall Reduction Factors. Hydrology and Water Resources Symposium Newcastle, June30-July2, 1993.
Surface Water Assessment of the 51 Report DWLBC 02/12/000X Upper Finniss Catchment

McMurray, D., 2001. Current and Potential Future Farm Dam Development in the Central Mount Lofty Ranges, South Australia. Department for Water Resources, South Australia. DWR 01.11.0001.
McMurray, D. 3003. Assessment of Water Use from Farm Dams in the Mount Lofty Ranges South Australia. Department of Water, Land and Biodiversity Conservation. Draft Report.
Pikusa, E., 1999. Untitled paper on the suitability of farm dam surface area - volume relationships for modelling surface water resources in the Barossa Valley. Department for Environment, Heritage and Aboriginal Affairs, Adelaide.
River Murray Catchment Water Management Board, 2003. Catchment Water Management Plan for the River Murray in South Australia, 2003 - 2008.
Department for Water Resources. September, 2000. State Water Plan, Volume 1, pp 49-50
Savadamuthu, K., 2002. Impact of Farm Dams on Streamflow in the Upper Marne Catchment. Department for Water Resources, South Australia. DWR 02/01/0003.
Sinclair Knight Merz Pty Ltd., 2000. South Australian Daily Rainfall Data – Explanation of Infilled and Disaggregated Data Sets. Version 1
Teoh, K.S., 2001. Estimating the impact of current farm dams development on the Onkaparinga River catchment Streamflow. Department for Water, Land and Biodiversity Conservation (to be published)
Surface Water Assessment of the 52 Report DWLBC 2003/18 Upper Finniss Catchment

APPENDIX A: METHODOLOGY USED BY SINCLAIR KNIGHT MERZ (“SKM”) FOR DISAGGREGATION OF ACCUMULATED RAINFALL DATA AND IN-FILLING OF MISSING RAINFALL RECORDS Rainfall data is collected at 09:00 on a daily basis in the BoM stations. Rainfall collected during weekends and public holidays is recorded at 09:00 on the next working day. This necessitated disaggregation of the accumulated rainfall for those days when rainfall was not recorded. The methodology used by SKM for disaggregation of rainfall data is based on the method outlined by Porter and Ladson (1993).
The method assumes that the influence of nearby stations, where records are complete, is inversely proportional to their distance from the gauged station. That is if a gauged station S has its rainfall accumulated over m days, and complete data is available from n rainfall stations nearby, on day j precipitation at S station is given by:
∑
∑ ∑
=
= == n
kk
m
j
n
kkjkjS
jS
d
dp
1
1 1
}/1{
}/{.PP
where is total rainfall accumulated over m days for the gauged station S, ∑=
m
jiS
1P
is the distance from a rainfall station k to the gauged station S, and kd
jkp is that proportion of rainfall fell on day j at k station over the total rainfall accumulated over m days at the same k station. That is,
∑=
= m
j
jkjkp
1jkP
P
To this effect, an automated procedure was developed to redistribute the data. The procedure limits the search to only 15 rainfall stations closest to the station of interest. If no reference can be made from these 15 stations, then it is recommended that redistribution be carried out manually from other nearby stations closest to the station of interest. If no such reference station can be found, then redistribution may be carried out evenly over the period of accumulation.
For in-filling the missing rainfall records, the correlation method was used. The annual rainfall of a station S of interest was correlated with that of other nearby stations. The station with the highest correlation factor with S that had data concurrent with the missing period was used for in-filling the records. Again, the Consultants developed an automated procedure for in-filling the data and it was limited to a search of 15 closest rainfall stations only.
Surface Water Assessment of the 53 Report DWLBC 2003/18 Upper Finniss Catchment
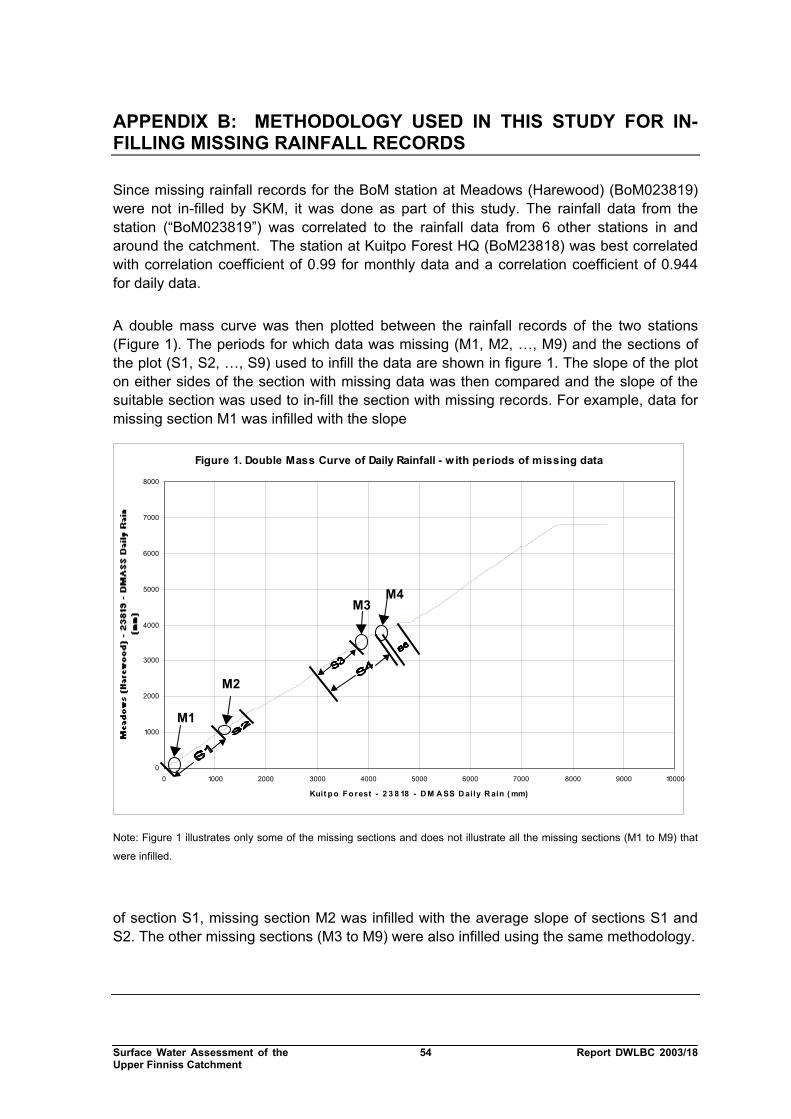
APPENDIX B: METHODOLOGY USED IN THIS STUDY FOR IN-FILLING MISSING RAINFALL RECORDS Since missing rainfall records for the BoM station at Meadows (Harewood) (BoM023819) were not in-filled by SKM, it was done as part of this study. The rainfall data from the station (“BoM023819”) was correlated to the rainfall data from 6 other stations in and around the catchment. The station at Kuitpo Forest HQ (BoM23818) was best correlated with correlation coefficient of 0.99 for monthly data and a correlation coefficient of 0.944 for daily data. A double mass curve was then plotted between the rainfall records of the two stations (Figure 1). The periods for which data was missing (M1, M2, …, M9) and the sections of the plot (S1, S2, …, S9) used to infill the data are shown in figure 1. The slope of the plot on either sides of the section with missing data was then compared and the slope of the suitable section was used to in-fill the section with missing records. For example, data for missing section M1 was infilled with the slope
Figure 1. Double Mass Curve of Daily Rainfall - w ith periods of missing data
0
1000
2000
3000
4000
5000
6000
7000
8000
0 1000 2000 3000 4000 5000 6000 7000 8000 9000 10000
Kuit p o F o rest - 2 3 8 18 - D M A SS D aily R ain ( mm)
M1
M2
M3M4
Note: Figure 1 illustrates only some of the missing sections and does not illustrate all the missing sections (M1 to M9) that
were infilled.
of section S1, missing section M2 was infilled with the average slope of sections S1 and S2. The other missing sections (M3 to M9) were also infilled using the same methodology.
Surface Water Assessment of the 54 Report DWLBC 2003/18 Upper Finniss Catchment

APPENDIX C: CHECK FOR HOMOGENEITY OF RAINFALL RECORDS Changes in instrument exposure at a measurement site often leads to difference in the actual rainfall at the site and the rainfall recorded at that site. Comparison of long-term rainfall records from this site with the regional rainfall average assists in detection of this discrepancy and hence the non-homogenous nature of the data being considered.
Double mass curve analysis is one methodology used to check the homogeneity of rainfall records of stations in a region. A double mass plot of rainfall records of a station against average rainfall of the region would ideally be a straight line if the data were homogenous. If the plot were not a straight line but a line with sections of varying slopes it would indicate non-homogeneity of the rainfall records of the station being considered. In that case the data is adjusted to obtain a consistent slope and hence homogeneity in data across the region being considered.
Homogeneity checks for the long-term rainfall records from Meadows (BoM023730) were undertaken by comparing it to six other stations in the region with long-term rainfall records. These stations were:
1. Macclesfield (BoM023728)
2. Willunga (BoM23735)
3. Echunga Golf Course (BoM023713)
4. Ashbourne (BoM023701)
5. Hahndorf (BoM023720)
6. Mt Barker (BoM023733)
Double Mass Curve of Monthly Rainfall - PreCorrection
0
10000
20000
30000
40000
50000
60000
70000
80000
90000
100000
0 10000 20000 30000 40000 50000 60000 70000 80000 90000
A v e ra ge o f 6 s t a t io ns - M a s s M o nt hly R a in ( m m )
Figure 22. Double Mass Curve for Monthly Rainfall Records
Surface Water Assessment of the 55 Report DWLBC 2003/18 Upper Finniss Catchment

A double mass curve was plotted (Figure 22) between the monthly rainfall at Meadows and the average monthly rainfall of six stations listed above. Slope changes were observed in the plot leading to five sections (S1, S2, …, S5) with varying slopes being identified. The details of these sections are listed in Table 19. Section Duration Correlation
Coefficient Slope Change
in Slope S1 Jan 1887 to Apr 1917 0.971 1.166 S2 May 1917 to Jun 1919 0.977 1.361 14% S3 Jul 1919 to Jul 1956 0.981 1.168 <= 5% S4 Aug 1956 to Apr 1974 0.972 1.123 <= 5% S5 May 1974 to Nov 1998 0.970 1.096 <= 5%
Average slope of the curve for the whole duration: 1.166 Table 19. Details of Sections in the Monthly Double Mass Curve
A change in slope of 5% or more is generally considered to be a non-homogenous data set. Sections that are non-homogenous are then adjusted by using the average slope of the sections on either side of the curve. In this case, S2 was the only section considered being non-homogenous (as change in slope > 5%) and hence was adjusted by a factor of 0.867, which is ratio of the slope of Section2 (1.361) to average slope of the section on either side of the curve (1.167).
Surface Water Assessment of the 56 Report DWLBC 2003/18 Upper Finniss Catchment

APPENDIX D. TREND TEST (GRAYSON, 1996) Mann’s Test (Kendall, 1970)
Given a time series (X1, X2, X3, …..Xn ), Mann’s test statistic tests the null hypothesis H0 that the observations are randomly ordered versus the alternative of a monotonic trend over time. Let R1, R2, R3, …Rn be the ranks of the corresponding X values and define the function sgn(x) as follows:
sgn(x) = 1 for x > 0, sgn(x) = 0, for x = 0 and sgn(x) = -1 for x < 0
If the null hypothesis is true, the statistic:
∑<
−=ji
j iRRS )sgn(
has a mean of zero and a variance of: Var(S) = (n (n-1) (2n+5)) / 18
and is asymptotically normal. The normal Z-test statistic is, u(n) = S / [Var(S)]0.5 The statistic u(n) can be computed for any values of i to detect whether there is a trend in the data up to i at the chosen level of significance using the z-test. A positive value of u(n) indicates that there is an increasing trend and vice versa.
Surface Water Assessment of the 57 Report DWLBC 02/12/000X Upper Finniss Catchment
APPENDIX E. TANH FUNCTION
The Tanh function (Grayson, 1996) is a standard hyperbolic function and was used by Boughton (1996) as simple rainfall-runoff relationship.
Calculation
( ) ( )[ ]FLPFLPQ /tanh −×−−=
where
Q is runoff [mm]
P is rainfall [mm]
L is notional loss [mm]
F is notional infiltration [mm]
The equation can be applied to any data but should be used for data where average storage of soil water is approximately constant i.e. where the notional loss and infiltration might be expected to be similar. Annual data satisfies this requirement but monthly data will need to be separated into data for each month or at least for season and a different L and F derived for each month’s (or season’s) set.
Determination of F and L
The values of the notional loss, L, and infiltration, F, are determined by plotting monthly flow sets, seasonal flow sets or annual flow sets against the associated rainfall. A preliminary value of L is chosen from the data and F fitted either by trial and error or with a curve fitting technique. Similarly the preliminary estimate of L can be changed to improve the fit. It is often simplest to just plot the data in a spreadsheet and visually fit the parameters.
Surface Water Assessment of the 58 Report DWLBC 2003/18 Upper Finniss Catchment

Surface Water Assessment of the 59 Report DWLBC 02/12/000X Upper Finniss Catchment
APPENDIX F: WC1 – MODEL DESCRIPTION (CRESSWELL, 2002)
WC-1 is water balance model developed by David Cresswell based on experience with South Australian rainfall / run-off calibration in the Mt Lofty Ranges, Barossa Valley and Mid North. The program was developed in 1988 to estimate the impact of farm dams in the Barossa Valley when it was found most of the existing models tried were not able to reproduce the recorded runoff of South Australia’s drier catchments. When annual rainfall lies in the range 450 to 650mm the estimation of run-off becomes a tricky exercise.
Model Concept
The model is a 10 parameter model using 3 storages as shown in Figure 23 to track interception, soil moisture and groundwater. The soil store is generally the main runoff producing component requiring 4 parameters for calibration.
Rain in rf(t)
sStream
Outflow = if + fr + sf + bf - SL
Baseflow bf(t)= GWD x gm(t-1)
Surface f low sf(t) = fact x d x (1-GWR)
Impervious if(t) = PDD x ( rf(t) - 5)d = rf(t) + im(t-1) - IS
im -->
sm -->
gm -->
Interflow if l(t) = s x SMD x sm(t-1)
Flow to ground fg(t) = fact x d x GWR
Seepage s(t) = ( 1 - SRC ) x im(t-1)
sf
fg
s
d
ifl
bf
V
V
>
>
Vd - sf s - ifl
>SL
WC - 1 ModelD J Cresswell
>if
>
V^ ^^
Ev aporation (e)
V Interception Store
Soil Store
V
>>
sm(t) = d - sf + s - fr - e - fg(t)
gm(t) = gm(t-1) +fg(t) - bf(t)Groundw ater Store
fact = function { CD , sm(t-1) } (refer text)e = meanmonthly evap x PF
Los
IS -->
MSM -->
Maximum intercept store
Median soil capacity
Figure 23. Concept of WC-1 Model
Surface runoff (not including the groundwater contribution) is calculated with both a hortonian and saturated surface area component. The hortonian component is generally small and is calculated as the runoff from an impervious area that has a daily loss rate of 5 mm. The parameter PDD is used to input the fraction of the catchment contributing.
By far the greatest proportion of surface flow is by calculating the saturated surface area of the catchment. To do this, the model tracks the soil storage and calculates the area

Appendix F
Surface Water Assessment of the 60 Report DWLBC 2003/18 Upper Finniss Catchment
saturated based on the assumption that the soil moisture holding capacity is normally distributed across the catchment. This is shown in Figure 24.
To calibrate such a model, two parameters are required, the median soil moisture of the catchment (MSM) and the catchment standard distribution (CD). Typically these values are found to lie between 150 to 250 mm (MSM) and 20 to 80 mm (CD).
When dry the soil moisture lies > 3 standard deviations to the left of the median centre and as the catchment wets up moves toward the fully saturated catchment which occurs at median soil moisture plus 3 standard deviations. At any point on the axis, the proportion of catchment assumed to be saturated is calculated as the area under the normal distribution curve.
For example, Figure 24 indicates that when the soil moisture of the soil store reaches MSM – 1.6 x CD the area shaded is the proportion of the catchment contributing to the runoff. From normal distribution tables this is 5.5% of the catchment.
00.005
0.010.015
0.020.025
0.030.035
0.040.045
3
2.5 2
1.5 1
0.5 0
0.5 1
1.5 2
2.5 3
Soil Moisture Holding Capacity (Standard Deviations from Median Catchment Soil
Moisture)
Prop
ortio
n of
Cat
chm
ent
Figure 24. Contributing Catchment calculated from Soil Moisture
When the median soil moisture is reached the catchment contributing is 50% as shown in Figure 25.
00.005
0.010.015
0.020.025
0.030.035
0.040.045
3
2.5 2
1.5 1
0.5 0
0.5 1
1.5 2
2.5 3
Soil Moisture Holding Capacity (Standard Deviations from Median Catchment Soil
Moisture)
Prop
ortio
n of
Cat
chm
ent
Figure 25. Contributing Catchment calculated from Soil Moisture

Appendix F
Surface Water Assessment of the 61 Report DWLBC 2003/18 Upper Finniss Catchment
The shape of this relationship, (Figure 26), is similar to a power curve but asymptotic to Y = 0 and Y = 1. Intuitively this is what is expected and overcomes the problem of the power curve that is required to be silled at 1.0.
00.10.20.30.40.50.60.70.80.9
1
3 2.5 2 1.5 1 0.5 0 0.5 1 1.5 2 2.5 3
Standard Deviations from Median Soil Moisture
Satur
ated C
atchm
ent (f
act)
Figure 26. Contributing Catchment calculated from Soil Moisture
The volume of water running off the catchment is then the product of the contributing area and the effective rainfall. Catchments in semi-arid areas show a capacity to retain quite significant rainfall events requiring the use of an interception store for accurate simulation.
The effective rainfall is defined as the volume of water spilling the interception store.
The maximum interception store (IS) may typically range from zero to 30 mm and is tracked continuously within the model. Water may leave the interception storage either by overtopping the storage thus becoming effective rainfall or it may percolate slowly into the soil store where it contributes to an interflow component of flow. This percolation occurs at a rate calculated in a similar way to the Annual Precipitation Index (API).
The transfer rate is independent of season and is set by the soil wetness multiplier (SWM) typically to a value of 0.9. The value set is the proportion of the water held in the store (im(t)) which is retained to the next day. Seepage is calculated equal to
• S = ( 1 – SWM) x im(t)
During the wet season the baseflow of the streams are seen to rise but the duration of such flow remains dependent on relatively continuous rainfall falling on the catchment. It is proposed that this baseflow return occurs due to the over saturated areas of the catchment returning a fraction of this moisture back to the streams. As the catchment dries or during long spells of no rain it is expected that this return will drop to zero.
This interflow is assumed in the model to equal
• Ifl = s x SMD x sm(t)
SMD is the parameter defining the proportion returned to the stream.

Appendix F
Surface Water Assessment of the 62 Report DWLBC 2003/18 Upper Finniss Catchment
The catchment response is therefore defined by the six parameters mentioned above but evaporation can potentially override all of these. In semi-arid catchments choosing the correct evaporation rate is critical.
Models use various formulas ranging from linear to power functions to estimate the moisture loss from soils. Experimentation with the linear model was not found to improve the estimate of runoff and was discarded for the simpler constant model. Here evapo-transpiration is assumed to equal the pan factor times recorded daily evaporation. Typically a value of 0.6 to 0.7 is used for class A pan recordings.
Groundwater is simulated within the model using two parameters GWR (recharge) and GWD (discharge). Both operate in a simple linear fashion.
Groundwater recharge is seen to have a greater relationship with streamflow than total rainfall. This suggests that groundwater recharge requires similar conditions to streamflow, hence the wetting up of the catchment, to occur. Tying recharge to streamflow simulates this, which assumes the greater saturated catchment-generated streamflow occurring the more recharge occurs from the soil to groundwater store.
The parameter GWF is used to define the proportion passing to ground and often this may be up to 20 to 30 percent.
Baseflow discharging from the groundwater store is simply a linear relationship defined by parameter GWD. No loss is assumed to occur from the groundwater store to external basins. Summary of WC-1 Parameters
Medium soil moisture (MSM) - represents the field capacity of the soil. Usually in the range 150-300 mm. Increasing this value delays the early season initiation of runoff, decreases runoff by providing greater opportunity for evapo-transpiration and assist in keeping late season groundwater flows up.
Interception store (IS) - represents the maximum initial abstraction from rainfall before any runoff can occur. The normal range is 10-25 mm. A larger value will inhibit runoff after dry spells and reduce the total amount of runoff.
Catchment distribution (CD) - sets the range of soil moisture values about MSM. Usual values are 25-60 mm. A larger value will initiate runoff earlier and more often.
Ground Water Discharge (GWD) - is the proportion of the groundwater store that discharges as baseflow to the stream. This is a simple linear function;
Baseflow = groundwater store x GWD
Usual values are small 0.001 to 0.0001
Appendix F
Surface Water Assessment of the 63 Report DWLBC 2003/18 Upper Finniss Catchment
Soil moisture discharge (SMD) - As soil moisture increases there is a rise in the baseflow that occurs due to the saturation of the soil storage. Values are usually small 0.0001.
Pan factor for soil (PF) - This factor is applied to the daily evaporation calculated from the monthly pan evaporation data. The usual range is 0.6 to 1.0. The higher the value, the less the runoff. The higher the value, the earlier runoff ceases after winter.
Proportion direct drainage (PDD) - This is the proportion of the catchment that can be considered relatively impervious. After an initial loss of 5mm, rainfall on this area will be discharged as surface flow. Usual values for this are zero.
Store wetness multiplier (SWM) - This value determines the rate that water from the interception store moves to the soil store. The transfer rate is independent of season and ensures that the amount of water retained in the interception store follows a similar power recession curve of the API. Usual values are around 0.9
Groundwater Recharge (GWR) - is the proportion of rainfall that recharges the groundwater store. Usual values are 0.05 to 0.3 indicating that 5% to 30% of the flow running off the catchment is entering the groundwater system.
Creek Loss (CL) - is a reduction factor used to decrease runoff. It is generally set to zero.

Streamflow Gauging Station (AW426504)Streamflow Gauging Station (AW426504)
Appendix G. Upper Finniss Catchment - Model Layout
Surface Water Assessment of the Upper Finniss Catchment Report DWLBC 2003/18
Catchment Node
Farm Dam Node
Finniss RiverSub-catchmentFinniss RiverSub-catchment
Meadows-East Sub-CatchmentMeadows-East Sub-Catchment
Blackfellows Creek Sub-CatchmentBlackfellows Creek Sub-Catchment
Meadows-NorthSub-CatchmentMeadows-NorthSub-Catchment
Meadows-WestSub-CatchmentMeadows-WestSub-Catchment
Kuitpo Sub-CatchmentKuitpo Sub-Catchment
Minor sub-catchment (MN32) and it's dams represented in the Model as
Upper Finniss - Major & Minor Sub-CatchmentsRepresentation of Minor Sub-catchments
and Farm Dams as Nodes in the Model
0 2 41 km
Projection: Map Grid of Australia 1994 (UTM)Datum: Geocentric Datum of Australia 1994 Date: June 2003
Major Sub-Catchments
Kuitpo
Meadows - West
Meadows - East
Meadows - North
Finniss Subcatchment
Blackwood Creek
Streams
Farm Dams (1999)
Stream Gauging Station
Minor subcatchments
64
Produced by the Surface Water Group,Knowledge and Information Division, DWLBC
Data Sources:CLIMATE STATIONS AND RAINFALL: Bureau of MeteorologyTOWNS AND LOCALITIES: Information and Data Analysis, Planning SA

APPENDIX H: UPPER FINNIS CATCHMENT – SUB-CATCHMENT AND DAM NODES DETAILS Upper Finniss Catchment - WaterCress Details
* Rainfall Stations : Y - Yundi(BoM23808), M - Meadows(BoM23730), K- Kuitpo (BoM23818), H - Meadows Harewood (BoM23819)
Finniss Stream Sub-catchment NO. Sub-
Catchment WaterCress Catchment Node
Catchment Area (SqKm)
WatercressDam Node
Dam Volume (ML)
Dam surface Area (m2)
Diversion Rate
Dam Density (ML/SqKm)
Rainfall Station *
1 F1 1 1.73 2 12.59 9205.0 20% 7.3 0.91Y 2 F2 3 0.90 4 62.80 35229.0 70% 69.8 0.93Y 3 F3 5 0.69 6 22.06 15586.0 50% 32.0 0.96Y 4 F4 7 0.40 8 40.03 18139.0 80% 100.1 0.93Y 5 F5 9 0.66 10 45.50 23744.0 80% 68.9 0.94Y 6 F6a 87 4.50 12 136.40 74719.0 100% 30.3 0.96Y 7 F6 11 0.60 0.00 0.96Y 8 F7 13 0.53 14 15.20 8686.0 100% 28.7 0.98Y 9 F8 15 1.46 16 14.35 10832.0 50% 9.8 Y
10 F9 17 4.60 18 147.88 99108.0 80% 32.1 0.97Y 11 F10 19 0.57 20 9.46 7359.0 50% 16.6 Y 12 F11b 250 0.80 251 11.25 100% 14.1 Y 13 F11 21 0.15 249 3.90 100% 25.5 Y 14 F11a 88 0.60 22 24.00 100% 40.0 Y 15 F12 23 0.31 24 35.90 16460.0 70% 115.8 Y 16 F13 25 0.44 26 5.68 4215.0 100% 12.9 Y 17 F14 27 0.43 28 4.26 3076.0 100% 9.9 Y 18 F15 29 0.36 30 9.66 6363.0 40% 26.8 Y 19 F16 31 0.29 32 5.38 3958.0 80% 18.6 0.98Y 20 F17 33 0.60 34 4.13 3321.0 20% 6.9 Y 21 F18 35 0.49 36 8.48 6395.0 70% 17.3 Y 22 F19 37 0.44 38 14.70 9441.0 90% 33.4 0.96Y 23 F20A 89 1.20 90 45.84 35047.0 100% 38.2 Y 24 F20 39 5.00 40 2.2 100% 0.4 Y
27.8 681.7 24.6
Blackwood Creek Catchment
NO. Sub-
Catchment WaterCress Catchment Node
Catchment Area (SqKm)
WatercressDam Node
Dam Volume (ML)
Dam surface Area (m2)
Diversion Rate
Dam Density (ML/SqKm)
Rainfall Station
1 B1 41 0.88 42 46.34 23369.00 80% 52.6 0.97Y 2 B2 43 0.41 44 27.54 14476.00 95% 66.4 0.97Y 3 B3 45 1.06 46 34.23 17363.00 100% 32.2 0.97Y 4 B4 47 1.45 48 16.63 12167.00 20% 11.5 0.97Y 5 B5 49 0.69 50 1.31 1071.00 1.9 0.97Y 6 B6 51 0.94 52 38.25 18419.00 60% 40.5 0.98Y 7 B7 53 0.40 54 2.48 2036.00 35% 6.2 0.97Y 8 B8 55 0.22 56 1.22 1010.00 30% 5.5 0.97Y 9 B9 57 1.16 58 58.80 30535.00 100% 50.7 0.96Y
10 B10 59 0.82 60 5.83 4635.00 70% 7.1 0.94Y 11 B11 61 2.70 62 62.68 34582.00 100% 23.2 0.94Y 12 B12 63 1.30 64 18.02 12070.00 50% 13.9 0.94Y 13 B13 65 0.49 66 22.91 14190.00 30% 47.0 0.96Y 14 B14a 92 2.10 68 43.06 31582.00 100% 20.5 0.97Y 15 B14 67 8.00 0.97Y
22.6 379.3 16.8
Meadows East Catchment
NO. Sub-
Catchment WaterCress Catchment Node
Catchment Area (SqKm)
WatercressDam Node
Dam Volume (ML)
Dam surface Area (m2)
Diversion Rate
Dam Density (ML/SqKm)
Rainfall Station
1 ME1 69 0.41 70 65.89 3971.00 100% 159.9 0.97Y 2 ME2 71 3.32 72 41.61 42582.00 100% 12.5 0.97Y 3 ME3 73 0.65 74 113.86 15133.00 100% 175.7 0.98Y 4 ME4 75 0.55 76 146.85 9271.00 100% 269.0 Y 5 ME5 77 0.51 78 37.64 53136.00 100% 73.7 Y 6 ME6 79 0.88 80 11.60 40440.00 100% 13.2 Y 7 ME7 81 2.03 82 114.41 29429.00 100% 56.4 Y 8 ME8 83 0.79 84 28.10 16382.00 90% 35.8 0.98Y 9 ME9a 91 1.80 86 102.61 94230.00 100% 57.0 0.97Y
10 ME9 85 4.30 0.00 0.97Y 15.2 662.6 43.5
40%
Surface Water Assessment of the 65 Report DWLBC 02/12/000X Upper Finniss Catchment
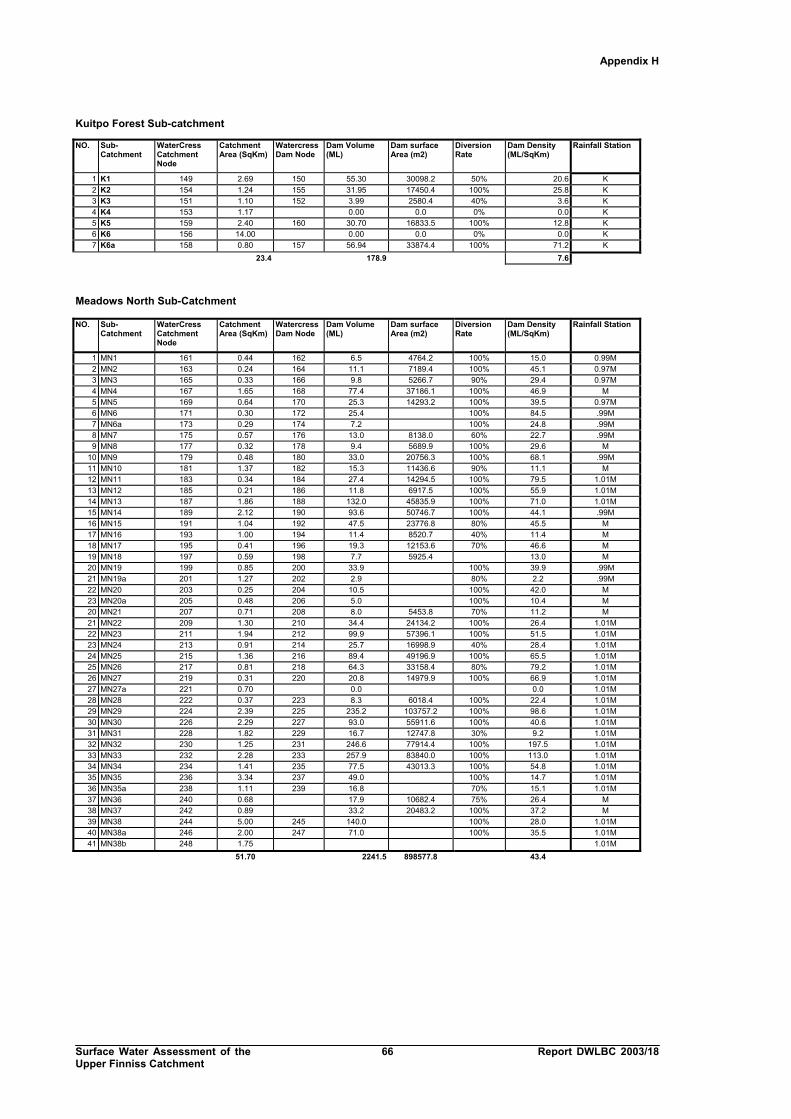
Appendix H Kuitpo Forest Sub-catchment
NO. Sub-
Catchment WaterCress Catchment Node
Catchment Area (SqKm)
WatercressDam Node
Dam Volume (ML)
Dam surface Area (m2)
Diversion Rate
Dam Density (ML/SqKm)
Rainfall Station
1 K1 149 2.69 150 55.30 30098.2 50% 20.6 K 2 K2 154 1.24 155 31.95 17450.4 100% 25.8 K 3 K3 151 1.10 152 3.99 2580.4 40% 3.6 K 4 K4 153 1.17 0.00 0.0 0% 0.0 K 5 K5 159 2.40 160 30.70 16833.5 100% 12.8 K 6 K6 156 14.00 0.00 0.0 0% 0.0 K 7 K6a 158 0.80 157 56.94 33874.4 100% 71.2 K
23.4 178.9 7.6
Meadows North Sub-Catchment
NO. Sub-
Catchment WaterCress Catchment Node
Catchment Area (SqKm)
WatercressDam Node
Dam Volume (ML)
Dam surface Area (m2)
Diversion Rate
Dam Density (ML/SqKm)
Rainfall Station
1 MN1 161 0.44 162 6.5 4764.2 100% 15.0 0.99M 2 MN2 163 0.24 164 11.1 7189.4 100% 45.1 0.97M 3 MN3 165 0.33 166 9.8 5266.7 90% 29.4 0.97M 4 MN4 167 1.65 168 77.4 37186.1 100% 46.9 M 5 MN5 169 0.64 170 25.3 14293.2 100% 39.5 0.97M 6 MN6 171 0.30 172 25.4 100% 84.5 .99M 7 MN6a 173 0.29 174 7.2 100% 24.8 .99M 8 MN7 175 0.57 176 13.0 8138.0 60% 22.7 .99M 9 MN8 177 0.32 178 9.4 5689.9 100% 29.6 M
10 MN9 179 0.48 180 33.0 20756.3 100% 68.1 .99M 11 MN10 181 1.37 182 15.3 11436.6 90% 11.1 M 12 MN11 183 0.34 184 27.4 14294.5 100% 79.5 1.01M 13 MN12 185 0.21 186 11.8 6917.5 100% 55.9 1.01M 14 MN13 187 1.86 188 132.0 45835.9 100% 71.0 1.01M 15 MN14 189 2.12 190 93.6 50746.7 100% 44.1 .99M 16 MN15 191 1.04 192 47.5 23776.8 80% 45.5 M 17 MN16 193 1.00 194 11.4 8520.7 40% 11.4 M 18 MN17 195 0.41 196 19.3 12153.6 70% 46.6 M 19 MN18 197 0.59 198 7.7 5925.4 13.0 M 20 MN19 199 0.85 200 33.9 100% 39.9 .99M 21 MN19a 201 1.27 202 2.9 80% 2.2 .99M 22 MN20 203 0.25 204 10.5 100% 42.0 M 23 MN20a 205 0.48 206 5.0 100% 10.4 M 20 MN21 207 0.71 208 8.0 5453.8 70% 11.2 M 21 MN22 209 1.30 210 34.4 24134.2 100% 26.4 1.01M 22 MN23 211 1.94 212 99.9 57396.1 100% 51.5 1.01M 23 MN24 213 0.91 214 25.7 16998.9 40% 28.4 1.01M 24 MN25 215 1.36 216 89.4 49196.9 100% 65.5 1.01M 25 MN26 217 0.81 218 64.3 33158.4 80% 79.2 1.01M 26 MN27 219 0.31 220 20.8 14979.9 100% 66.9 1.01M 27 MN27a 221 0.70 0.0 0.0 1.01M 28 MN28 222 0.37 223 8.3 6018.4 100% 22.4 1.01M 29 MN29 224 2.39 225 235.2 103757.2 100% 98.6 1.01M 30 MN30 226 2.29 227 93.0 55911.6 100% 40.6 1.01M 31 MN31 228 1.82 229 16.7 12747.8 30% 9.2 1.01M 32 MN32 230 1.25 231 246.6 77914.4 100% 197.5 1.01M 33 MN33 232 2.28 233 257.9 83840.0 100% 113.0 1.01M 34 MN34 234 1.41 235 77.5 43013.3 100% 54.8 1.01M 35 MN35 236 3.34 237 49.0 100% 14.7 1.01M 36 MN35a 238 1.11 239 16.8 70% 15.1 1.01M 37 MN36 240 0.68 17.9 10682.4 75% 26.4 M 38 MN37 242 0.89 33.2 20483.2 100% 37.2 M 39 MN38 244 5.00 245 140.0 100% 28.0 1.01M 40 MN38a 246 2.00 247 71.0 100% 35.5 1.01M 41 MN38b 248 1.75 1.01M
51.70 2241.5 898577.8 43.4
Surface Water Assessment of the 66 Report DWLBC 2003/18 Upper Finniss Catchment

Appendix H
Surface Water Assessment of the 67 Report DWLBC 2003/18 Upper Finniss Catchment
Meadows West Sub-Catchment
NO. Sub-
Catchment WaterCress Catchment Node
Catchment Area (SqKm)
WatercressDam Node
Dam Volume (ML)
Dam surface Area (m2)
Diversion Rate
Dam Density (ML/SqKm)
Rainfall Station
1 W1 93 1.93 94 94.60 62355.6 100% 49.0 0.93H 2 W2 95 0.95 96 79.90 35002.2 100% 83.9 0.94H 3 W3 97 0.42 98 37.70 18361.5 100% 90.4 0.94H 4 W4 99 0.32 100 44.30 20013.0 100% 138.9 0.94H 5 W5 101 1.14 102 61.50 42222.3 100% 54.2 0.96H 6 W6 103 0.52 104 99.90 40635.4 100% 190.6 0.96H 7 W7 105 0.84 106 14.40 10869.9 100% 17.1 0.97H 7 W8 107 0.23 108 20.55 10796.0 100% 89.0 0.97H 8 W9 109 0.92 110 55.97 34212.0 100% 60.7 0.97H 9 W10 111 1.03 112 59.36 33643.0 100% 57.4 0.96H
10 W11 113 1.04 114 16.87 12285.0 30% 16.2 H 11 W12a 117 3.70 116 114.60 82571.6 100% 31.0 H 12 W12 115 1.80 H 13 W13 118 1.76 119 61.30 40005.0 90% 34.8 H 14 W14 120 0.68 121 46.20 25661.8 100% 67.5 0.97H 15 W15 122 2.04 123 46.40 33685.3 90% 22.8 H 16 W16 124 0.99 125 16.50 12210.6 80% 16.7 0.97H 17 W17 126 0.76 127 28.80 17448.5 100% 37.7 0.97H 18 W18 128 2.36 129 26.50 18273.1 60% 11.2 H 19 W19 130 1.29 131 53.90 31093.8 100% 41.7 0.97H 20 W20 132 1.37 133 69.40 31362.1 100% 50.5 H 21 W21 134 2.00 135 102.96 51342.0 100% 51.5 H 22 W22 136 1.42 137 61.24 30855.1 100% 43.1 H 23 W23 138 0.37 139 0.52 517.8 5% 1.4 H 24 W24 140 0.66 141 12.02 9178.3 90% 18.3 1.01H 25 W25 142 4.00 143 87.76 57394.5 90% 22.0 H 26 W26 144 3.25 145 103.93 51947.1 100% 32.0 H 28 W27a 146 9.50 148 256.23 160079.6 100% 27.0 1.01H 27 W27 147 4.00 1.01H
51.3 1673.3 32.6