surveillance of antimicrobial use and resistance in ... · background background antibiotics have...
TRANSCRIPT
Surveillance of Antimicrobial Use andResistance in Northern Ireland,
Annual Report, 2017
CONTENTS
Contents
Executive summary 3
Background 5
Method 7Antibiotic resistance . . . . . . . . . . . . . . . . . . . . . . . . . . . . . . . . . . 7
Data sources . . . . . . . . . . . . . . . . . . . . . . . . . . . . . . . . . . . 7Definitions . . . . . . . . . . . . . . . . . . . . . . . . . . . . . . . . . . . . . 7
Antibiotic consumption . . . . . . . . . . . . . . . . . . . . . . . . . . . . . . . . . 8Data sources . . . . . . . . . . . . . . . . . . . . . . . . . . . . . . . . . . . 8Definitions . . . . . . . . . . . . . . . . . . . . . . . . . . . . . . . . . . . . . 8Denominator . . . . . . . . . . . . . . . . . . . . . . . . . . . . . . . . . . . 8
Results 9Antibiotic resistance . . . . . . . . . . . . . . . . . . . . . . . . . . . . . . . . . . 9
E. coli bacteraemia . . . . . . . . . . . . . . . . . . . . . . . . . . . . . . . . 9K. pneumoniae bacteraemia . . . . . . . . . . . . . . . . . . . . . . . . . . . 12Pseudomonas species bacteraemia . . . . . . . . . . . . . . . . . . . . . . 15S. aureus bacteraemia . . . . . . . . . . . . . . . . . . . . . . . . . . . . . . 17Enterococcus species bacteraemia . . . . . . . . . . . . . . . . . . . . . . . 19S. pneumoniae bacteraemia . . . . . . . . . . . . . . . . . . . . . . . . . . . 21Acinetobacter species bacteraemia . . . . . . . . . . . . . . . . . . . . . . . 23Voluntary Carbapenamse Producing Organisms surveillance . . . . . . . . 25
Antibiotic consumption . . . . . . . . . . . . . . . . . . . . . . . . . . . . . . . . . 28Rates of antibiotic consumption by healthcare setting . . . . . . . . . . . . . 28Antibiotic consumption by key agents . . . . . . . . . . . . . . . . . . . . . . 31Antibiotic consumption by class and individual antibiotics . . . . . . . . . . 33Antibiotic consumption of key agents by healthcare setting . . . . . . . . . . 42Antibiotic guardians . . . . . . . . . . . . . . . . . . . . . . . . . . . . . . . 47
Discussion 48Antimicrobial resistance . . . . . . . . . . . . . . . . . . . . . . . . . . . . . . . . 48Antibiotic consumption . . . . . . . . . . . . . . . . . . . . . . . . . . . . . . . . . 50
Actions to reduce antimicrobial use and resistance 52Public communication . . . . . . . . . . . . . . . . . . . . . . . . . . . . . . . . . 52
1

CONTENTS
Changing prescribing behaviour . . . . . . . . . . . . . . . . . . . . . . . . . . . 52
Appendix 1: AMR surveillance categories 54
Appendix 2: AMC data categories 56
Appendix 3: Testing data 59
References 60
2

EXECUTIVE SUMMARY
Executive summary
3
EXECUTIVE SUMMARY
Authors
Lynsey Patterson, MSc, PhD, MFPHDeclan Bradley, MB ChB, MA, MPH, PhD, MRCP(UK), FFPH
Acknowledgements
The information produced in this report is based on information derived from data submittedby Health and Social Care Trust microbiology and pharmacy staff, and we thank them forthe time and effort involved in producing these data.
We also thank the members of the Epidemiology Subgroup of the Healthcare-associatedInfection and Antimicrobial Stewardship Improvement Board for their advice on the devel-opment of the report, noting in particular the assistance of David Farren, Derek Fairley andSara Hedderwick.
Image credits
• Hospital bed: Created by Wojciech Zasina• Bacteria: Created by Maurizio Fusillo• Doctor Consultation: Created by Esther Se Kim• Pill: Created by Travis Bird
All icons used under License CC BY 3.0 US
Date generated: 09/11/2017
4
BACKGROUND
Background
Antibiotics have been one of the most important life-saving medical developments of thelast century. When a course of antibiotics is prescribed, they will only work against certaintypes of bacteria and not others (so-called intrinsic resistance). In addition, some bacteriacan develop tolerance to certain antibiotics or develop ways to break them down (so-calledextrinsic resistance). In either case, if these go on to cause an infection it can be muchmore difficult to treat. This is called “antimicrobial resistance”. There is a risk of selectingfor the survival of antimicrobial resistant organisms any time that antibiotics are used.Being prescribed a single course of antibiotics increases a person’s chance of acquiringresistant bacteria[1]. If the use of antibiotics remains unchecked, common infections willbecome more dangerous, and surgical procedures that require antibiotics will becomemore difficult to perform safely. Antimicrobial-resistant infections already cause illness anddeath for patients, and also disrupt care in hospitals. Reducing the use of antibiotics wherethey are not necessary now will help keep antibiotics working in the future. In recognitionof this, the Department of Health (then the Department of Health, Social Services andPublic Safety) published a five year Strategy for Tackling Antimicrobial Resistance (STAR2012-2017) in 2012[2]. One of the key objectives of STAR was “to establish and maintainsystems to monitor antimicrobial usage and surveillance of resistance”. This report is aproduct of the systems that have been established in response to this goal.
The tasks of preventing and reducing antimicrobial resistant infections, and reducing an-timicrobial consumption are led at a policy level in Northern Ireland by the Departmentof Health-chaired Strategic Antimicrobial Resistance and Healthcare-associated Infection(SAMRHAI) group, which includes representatives responsible for animal and environmen-tal as well as human health. For translating policy and strategy into action for human health,the Public Health Agency leads a multi-agency group, the Healthcare-associated Infectionand Antimicrobial Stewardship Improvement Board, which has a number of themed sub-groups that are responsible for regional efforts to reduce harm from antimicrobial use andresistance in different settings. This report is issued under the auspices of the ImprovementBoard. The report is divided into two major sections. The first describes trends in antibioticresistance in Northern Ireland. We selected combinations of bacteria and antibiotics inline with those identified as key indicators as part of the UK Antimicrobial Resistance strat-egy[3]. In addition, we have made reference to additional bacteria-antibiotic combinationsincluded in the English surveillance programme for antimicrobial utilisation and resistance(ESPAUR) report[4].
5

BACKGROUND
The second section describes the trends in antibiotic consumption in Northern Ireland.Antibiotic consumption is the key driver for the emergence of resistance. Antibioticsare prescribed across a range of settings including primary care (GP), secondary care(hospitals) and by dentists. In this inaugural report, we provide information for primary andsecondary care. We aim to provide more detailed information about different healthcaresettings and clinical specialities in future reports.
The aim of the report is to describe trends in antimicrobial resistance and antibioticconsumption in Northern Ireland. As surveillance data is information for action this reportwill inform and drive best practice in antimicrobial prescribing.
6

METHOD
Method
Antibiotic resistance
Data sources
Testing for bacteria in human biological specimens and their susceptibility to antibioticsis conducted in laboratories in five Health and Social Care Trusts in Northern Ireland.Infections that meet certain criteria, usually the most severe that occur in the blood(bacteraemias), are reported voluntarily to the Public Health Agency’s CoSurv InformationSystem from each Trust’s microbiology and/or virology laboratories. The resistance dataincluded in this report includes selected bacteraemias that were reported to the PHA during2009 - 2016 (presented by calendar year).
The data for carbapenemase producing organisms (CPO) has been collected as part of avoluntary reporting service. In cases where a microbiology laboratory suspects a CPO,the specimen is submitted to Public Health England’s (PHE) Antimicrobial Resistance andHealthcare Associated Infections (AMRHAI) reference unit for investigation. The referencelab then notifies the PHA of positive results. Confirmed isolates include both colonisationsand infections.
Definitions
Hospital microbiology laboratories report antimicrobial susceptibility test results “suscepti-ble”, “intermediate” or “resistant”. For the purpose of this report, antibiotic susceptibilitytest results reported as “intermediate” or “resistant” were combined and presented as “non-susceptible”. For analysis of resistance to more than one antibiotic, multidrug resistance(MDR) was defined as acquired non-susceptibility to at least one agent in three or moreantimicrobial classes.
7
METHOD
Antibiotic consumption
Data sources
Consumption data for primary and secondary care was obtained using the data submittedto the European Antimicrobial Consumption Surveillance Network (ESAC-Net). Theprimary care antimicrobial consumption data were extracted from the Electronic PrescribingDatabase by the Health and Social Care Board. The data includes all Health and SocialCare (HSC; equivalent to National Health Service) general practitioner prescribing inpractices and out-of-hours centres; all nurse, pharmacy and allied health professional HSCprescribing; and all HSC dental prescribing. The secondary care antimicrobial consumptiondata were extracted by each Trust’s JAC Medicines Management System and aggregatedfor all five Trusts to give Northern Ireland totals. It was not possible to analyse at the levelof hospital departments or systems, such as inpatient or outpatient. The data for bothsettings are available from 2014 - 2016 and are presented by calendar year.
Definitions
The classification of antibiotic used is based on the anatomical therapeutic chemical (ATC)classification system, using the WHO defined daily doses (DDD) for each drug and wheregrouped, this has been done according to Kucer’s “The Use of Antibiotics” (6th edition)[5].It is important to note that in England, hospitals usually dispense outpatient medications,whereas in Northern Ireland these are usually prescribed by general practitioners at therequest of secondary care specialists. A significant proportion of outpatient prescribing istherefore counted under primary care in Northern Ireland and secondary care in England.There is currently no way of separating these prescriptions from the rest of primary careprescribing in Northern Ireland. In England, outpatient prescribing accounts for 6% ofsecondary care antimicrobial prescribing [4].
Denominator
Mid-year population estimates for 2014-2016 were obtained from the Northern IrelandStatistics and Research Agency (NISRA) and used to express DDD’s per 1,000 inhabitantsper day. Hospital activity and occupancy statistics were obtained from the Department ofHealth published data.
8

RESULTS
Results
Antibiotic resistance
E. coli bacteraemia
Figure 1: The total number of E. coli bacteraemias reported to the Public Health Agency,2009 - 2016
Figure 2: The proportion of E. coli bacteraemias resistant to selected antibiotics in NI,2009 - 2016
9

RESULTS
The number of E. coli bacteraemias has increased between 2009 and 2016, from 980cases to 1487 cases (Figure 1). The proportion of isolates tested against key antibioticsduring 2016 is shown in Appendix 3.
Resistance to piperacillin/tazobactam and co-amoxiclav has increased over the time period(8.8% to 15.6% and 32.9% to 38.1% respectively). The proportion of isolates resistant togentamicin has remained relatively stable during 2009 - 2016 (9.8% to 8.6%). Resistanceamong E. coli to carbapenems has remained negligible (no isolates detected in 2016).Resistance to third generation cephalosporins and ciprofloxacin has decreased (9.8% to6.3% and 22.6% to 15.1% respectively (Figure 2).
Despite the reduction in the proportion of resisant isolates reported for the chosen an-tibioitics it should be noted that in absolute terms, the number of resistant isolates haveincreased. For example, while the proportion resistant to ciprofloxacin decreased during2009 - 2016 (22.6% to 15.1%), the number of infections increased (182 to 190 episodes).The number of isolates resistant to three or more classes also increased (34 to 48 episodes)
Figure 3: The proportion of E. coli bacteraemias reported to the Public Health Agency withmulti-drug resistance, 2009 - 2016
The proportion of E. coli bacteraemias showing multi-resistance remained stable between
10

RESULTS
2009 and 2016 and varied in the range of 1-4%. Resistance to at least three or moreclasses has fluctuated around 4%. Within the named combination of antibiotic classes, thehighest proportion of resistance was seen for combinations of aminoglycosides, quinolonesand piperacillin/tazobactam and the lowest for third-generation cephalosporins, aminogly-cosides and piperacillin/tazobactam (Figure 3).
11

RESULTS
K. pneumoniae bacteraemia
Figure 4: The total number of K. pneumoniae bacteraemias reported to the Public HealthAgency, 2009 - 2016
Figure 5: The proportion of K. pneumoniae bacteraemias resistant to selected antibioticsin NI, 2009 - 2016
In 2016, the two most common species among blood culture isolates of the genus Klebsiellawere K. pneumoniae (208/269; 77%) and K. oxytoca (60/269; 22%). The following
12

RESULTS
describes trends and resistance for K. pneumoniae.
The number of K. pneumoniae bacteraemias has increased between 2009 and 2016, from143 cases to 208 cases (Figure 4). The proportion of isolates tested against key antibioticsduring 2016 is shown in Appendix 3.
There has been an increase in the proportion of K. pneumoniae bacteraemias resistantto selected antibiotics over the 5 year period: ciprofloxacin (6.3% to 10.7%); gentamicin(2.2% to 10.9%); co-amoxiclav (8.1% to 15.6%) and piperacillin/tazobactam (8.6% to 19%).There was a smaller increase in the proportion of isolates resistant to third generationcephalosporins (8.7% to 10.4%). Resistance to carbapenems remained relatively stableover the period 2009 - 2016 (0% in 2016; Figure 5).
Figure 6: The proportion of K.pneumoniae bacteraemias reported to the Public HealthAgency with multi-drug resistance, 2009 - 2016
The proportion of K. pneumoniae bacteraemias showing multi-resistance has increasedslightly between 2009 and 2016 across all antibiotic combinations. Multi-resistance variedbetween 0 - 8%. The proportion of K. pneumoniae bacteraemias exhibiting resistanceto three or more classes has increased over time. Within the named combinations ofantibiotic classes, the highest proportions were seen for combinations of aminoglycosides,
13
RESULTS
quinolones and piperacillin/tazobactam and the lowest for third generation cephalosporins,aminoglycosides and piperacillin/tazobactam (Figure 6).
Unlike E. coli both the proportion and absolute numbers of K. pneumoniae bacteraemiashave increased. For example, the proportion of K. pneumoniae resistant to ciprofloxacinincreased by 4% during 2009 - 2016 (6.3% to 10.7%), the number of infections doubled (8to 19 episodes). The number of isolates resistant to three or more classes also increased(2 to 14 episodes).
14

RESULTS
Pseudomonas species bacteraemia
Figure 7: The total number of Pseudomonas species bacteraemias reported to the PublicHealth Agency, 2009 - 2016
Figure 8: The proportion of Pseudomonas species bacteraemias resistant to selectedantibiotics in NI, 2009 - 2016
The number of Pseudomonas species bacteraemias has remained relatively stable overthe last 5 years, with a slight decrease from 2015 to 2016 (109 cases to 106 cases;
15

RESULTS
Figure 7). The proportion of isolates tested against key antibiotics during 2016 is shown inAppendix 3.
There has been a slight increase in the proportion of Pseudomonas species bacteraemiasresistant to piperacillin/tazobactam over the 5 year period (8.5% to 12.1%). Resistanceamong selected antibiotics has decreased: ciprofloxacin (18.2% to 7.1%); third generationcephalosporins (15.7% to 4.3%); gentamicin (3.2% to 1%) and; carbapenems (14.3% to7.1%; Figure 8).
16

RESULTS
S. aureus bacteraemia
Figure 9: The total number of S. aureus bacteraemias reported to the Public Health Agency,2009 - 2016
Figure 10: The proportion of S. aureus bacteraemias resistant to selected antibiotics in NI,2009 - 2016
During the last five years, the number of S. aureus bacteraemias had been decreasingbut has increased year on year from 2014 to 2016 (338, 393 and 411 cases respectively;
17
RESULTS
Figure 9). The proportion of isolates tested against key antibiotics during 2016 is shown inAppendix 2. The proportion of S. aureus that are resistant to meticillin (MRSA) has beendecreasing over the last 5 years, with a low of 14.6% in 2016. The proportion of S. aureusthat are resistant to glycopeptides has remained low (Figure 10).
18
RESULTS
Enterococcus species bacteraemia
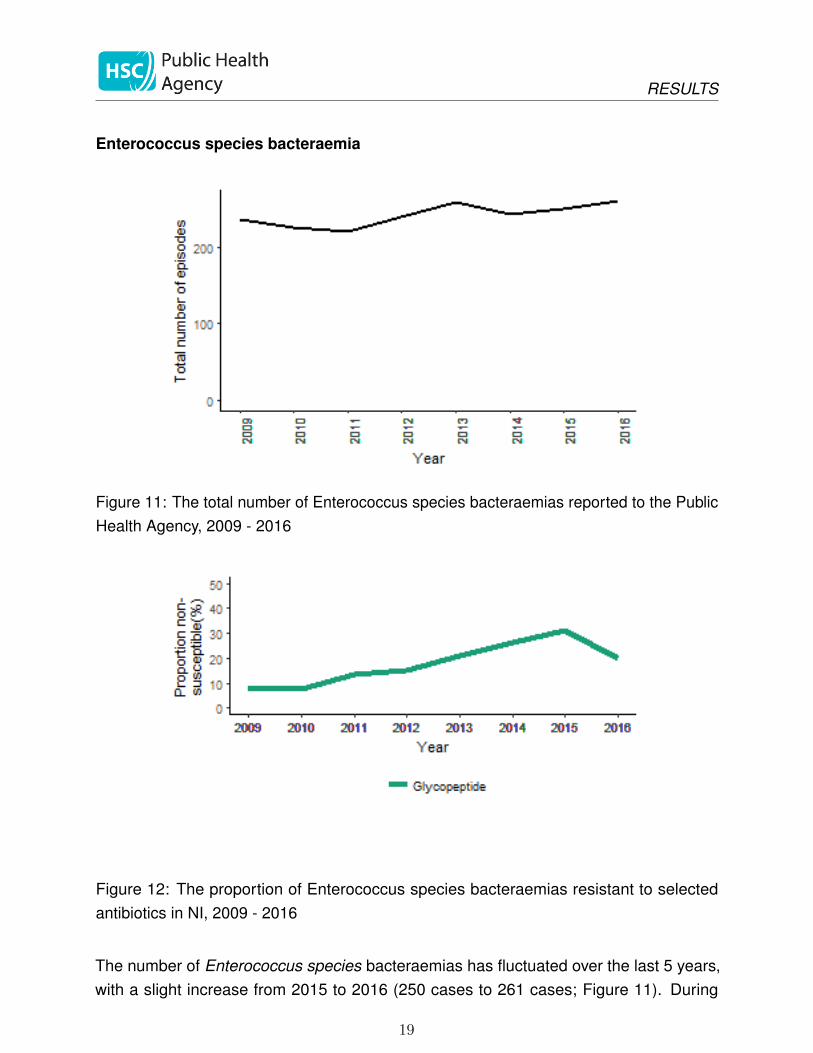
Figure 11: The total number of Enterococcus species bacteraemias reported to the PublicHealth Agency, 2009 - 2016
Figure 12: The proportion of Enterococcus species bacteraemias resistant to selectedantibiotics in NI, 2009 - 2016
The number of Enterococcus species bacteraemias has fluctuated over the last 5 years,with a slight increase from 2015 to 2016 (250 cases to 261 cases; Figure 11). During
19

RESULTS
2016, 90.8% were tested against glycopeptides. Resistance to glycopeptides has beenincreasing over the last 5 years, but decreased from 2015 to 2016 where 19.8% wereresistant (Figure 12).
20

RESULTS
S. pneumoniae bacteraemia
Figure 13: The total number of S. pneumoniae bacteraemias reported to the Public HealthAgency, 2009 - 2016
Figure 14: The proportion of S. pneumoniae bacteraemias resistant to selected antibioticsin NI, 2009 - 2016
There has been a general increase in the number of S. pneumoniae bacteraemias duringthe time period, with a slight decrease reported from 2015 to 2016 (138 cases to 130 cases;
21

RESULTS
Figure 13). The proportion of isolates tested against key antibiotics during 2016 is shownin Appendix 3. While the proportion of S. pneumoniae that are resistant to macrolidesincreased between 2009-2013, it has been decreasing since (6.7% to 5.1% during 2009 -2016) while resistance to penicillin has increased slightly (2.9% to 4.5%; Figure 14).
22

RESULTS
Acinetobacter species bacteraemia
Figure 15: The total number of Acinetobacter species bacteraemias reported to the PublicHealth Agency, 2009 - 2016
Figure 16: The proportion of Acinetobacter species bacteraemias resistant to selectedantibiotics in NI, 2009 - 2016
The total number of Acinetobacter species bacteraemias has decreased during 2015 to2016 from 33 cases to 31 cases (Figure 15). During 2016, 29 were tested against colistin.
23
RESULTS
Resistance to colistin among Acinetobacter species has remained at zero (Figure 16).
24
RESULTS
Voluntary Carbapenamse Producing Organisms surveillance
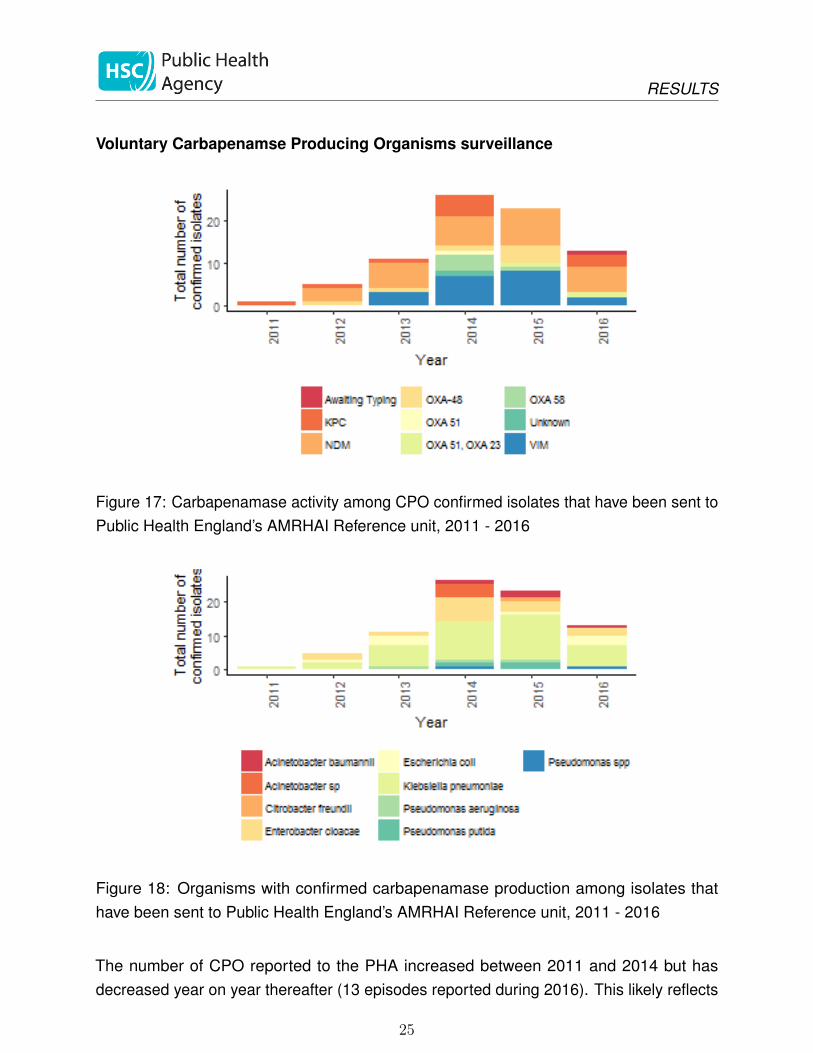
Figure 17: Carbapenamase activity among CPO confirmed isolates that have been sent toPublic Health England’s AMRHAI Reference unit, 2011 - 2016
Figure 18: Organisms with confirmed carbapenamase production among isolates thathave been sent to Public Health England’s AMRHAI Reference unit, 2011 - 2016
The number of CPO reported to the PHA increased between 2011 and 2014 but hasdecreased year on year thereafter (13 episodes reported during 2016). This likely reflects
25

RESULTS
the voluntary nature of reporting (case ascertainment) as well as local developments inthe ability to test for CPO. The most common reported resistance mechanism is New DelhiMetallo-Beta-lactamase (NDM) (31 episodes during 2011-2016; Figure 17). The mostcommonly reported CPO over the time period was K. pneumoniae (Figure 18).
26

RESULTS
Antibiotic resistance in Neisseria gonorrhoeae
Gonorrhoea has been identified as at risk of becoming an untreatable disease due tothe emergence of antimicrobial resistance to successive standard treatments. This hasnecessitated changes to recommended antibiotic prescribing. In the UK, current recom-mended treatment guidelines include ceftriaxone with azithromycin, along with routinetest of cure[6]. Third-generation cephalosporins are the last remaining effective antibioticsbut reports of treatment failures and increasing minimum inhibitory concentrations (MIC)levels have raised concerns that they will no longer be a suitable treatment option[7].Since 2015, NI has participated in the European Gonococcal Antimicrobial SurveillanceProgramme(Euro-GASP)[8] through the Royal Victoria Hospital, Belfast. This GUM cliniccaptured 62% of all gonorrhoea diagnoses made during 2016.
In 2016, gonorrhoea diagnoses accounted for 10% (592/5,719) of all new STI diagnosesmade in NI GUM clinics. During the study period, 20 isolates were cultured and sentto Public Health England for inclusion in EuroGASP. Of these, N. gonorrhoeae wassuccessfully retrieved from 13 isolates (65%).
During 2015 and 2016, 49 isolates were tested within the EuroGASP programme andshowed similar resistance pattern to the UK overall with 12% resistant to azithromycin and0% resistant to ceftriaxone.
The full report for this surveillance programme will be published on the PHA website.
27

RESULTS
Antibiotic consumption
Rates of antibiotic consumption by healthcare setting
Figure 19: Total antibiotic consumption, expressed as DDD per 1000 inhabitants per day,NI, 2014-2016
In 2016, the total consumption of antibiotics in primary and secondary care was 32 per1000 inhabitants per day (32.12 and 32.21 per 1000 inhabitants per day in 2014 and 2015respectively).
The majority of antibiotic prescribing took place in primary care (85% during 2016; Fig-ure 19). In primary care, rates have been stable since 2014 (during 2016 the overall rateof prescribing in primary care was 27.22 per 1000 inhabitants per day). There has alsobeen no change in the overall rate of antibiotic prescribing in secondary care (4.79 per1000 inhabitants per day during 2016; Figure 19).
28

RESULTS
Rates of antibiotic consumption in Secondary care
Figure 20: Total antibiotic consumption, expressed as DDD per 1000 admissions, NI,2014-2016
There has been a year on year increase in the rate of antibiotic consumption expressedas DDD per 1000 admissions: 9772 in 2014 to 10728 DDD per 1000 admissions in 2016(Figure 20).
Figure 21: Total antibiotic consumption, expressed as DDD per 1000 occupied bed days,NI, 2014-2016
29

RESULTS
Like the admissions data, the rate of antibiotic consumption per 1000 occupied bed dayshas been increasing year on year: 1643 in 2014 to 1787 DDD per 1000 occupied beddaysin 2016 (Figure 21).
Figure 22: Total antibiotic consumption by key agents in secondary care, expressed asDDD per 1000 admissions, NI, 2014-2016
This figure shows the top 6 key agents prescribed in secondary care. During 2016, thehighest rates for antibiotic consumption were penicillins (3331 DDD per 1000 admissions),Penicillin/beta lactamase inhibitor combinations (2247 DDD per 1000 admissions) andtetracyclines and related drugs (1058 DDD per 1000 admissions; Figure 22).
30
RESULTS
Antibiotic consumption by key agents
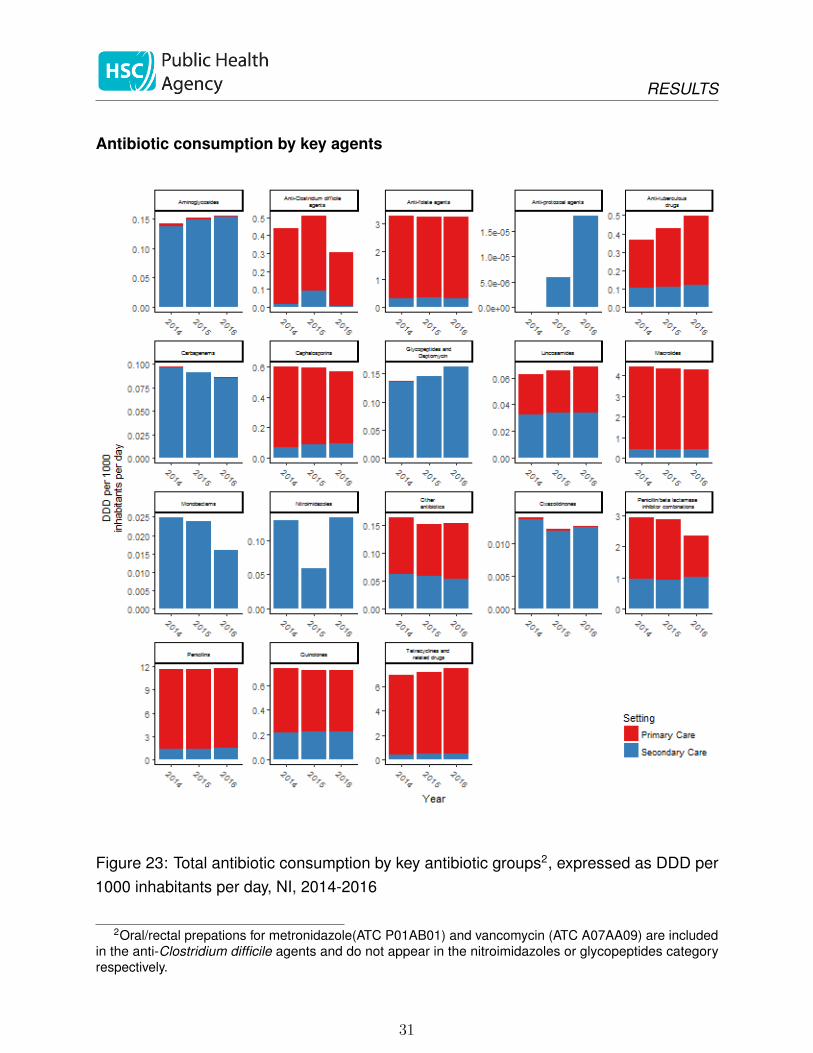
Figure 23: Total antibiotic consumption by key antibiotic groups2, expressed as DDD per1000 inhabitants per day, NI, 2014-2016
2Oral/rectal prepations for metronidazole(ATC P01AB01) and vancomycin (ATC A07AA09) are includedin the anti-Clostridium difficile agents and do not appear in the nitroimidazoles or glycopeptides categoryrespectively.
31

RESULTS
Note: differing scales on y-axis
During 2016, the most frequently used antibiotics in both primary and secondary care in NIwere Penicillins (37.7% and 31.1% respectively), tetracyclines and related drugs (25.8%and 9.9% respectively) and macrolides (14.3% and 8.5% respectively). Overall, the rate ofantibiotic prescribing has remained relatively stable across all groups (Figure 23).
32

RESULTS
Antibiotic consumption by class and individual antibiotics
Penicillins
Table 1: Total rate of Penicillins DDD per 1000 inhabi-tants per day, NI, 2014-2016.
Year Class DDD Population rate
2014 Penicillins 7839445 1840500 11.672015 Penicillins 7865333 1851600 11.642016 Penicillins 7986684 1862100 11.75
Figure 24: Consumption of most commonly used penicillins expressed per 1000 inhabitantsper day, NI, 2014 - 2016
The figure represents the top six antimicrobial agents used in the Penicillins class. Peni-cillins accounted for 36.7% of antibiotic consumption in 2016. The rate of penicillinconsumption has remained relatively stable with a rate of 11.75 per 1000 inhabitants perday during 2016. The highest rate was for amoxicillin (8.74 DDD per 1000 inhabitants perday in 2016; Figure 24).
33

RESULTS
Cephalosporins
Table 2: Total rate of Cephalosporins DDD per 1000inhabitants per day, NI, 2014-2016.
Year Class DDD Population rate
2014 Cephalosporins 403786 1840500 0.602015 Cephalosporins 403585 1851600 0.602016 Cephalosporins 386092 1862100 0.57
Figure 25: Consumption of most commonly used cephalosporins expressed per 1000inhabitants per day, NI, 2014 - 2016
The figure represents the top six agents used in the Cephalosporins class. The rate ofcephalosporin consumption has remained relatively stable with a rate of 0.57 DDD per1000 inhabitants per day during 2016. The highest rate was for cefalexin, the rate of whichhas decreased over time (0.45 DDD per 1000 inhabitants per day during 2016; Figure 25).
34
RESULTS
Tetracyclines and related drugs
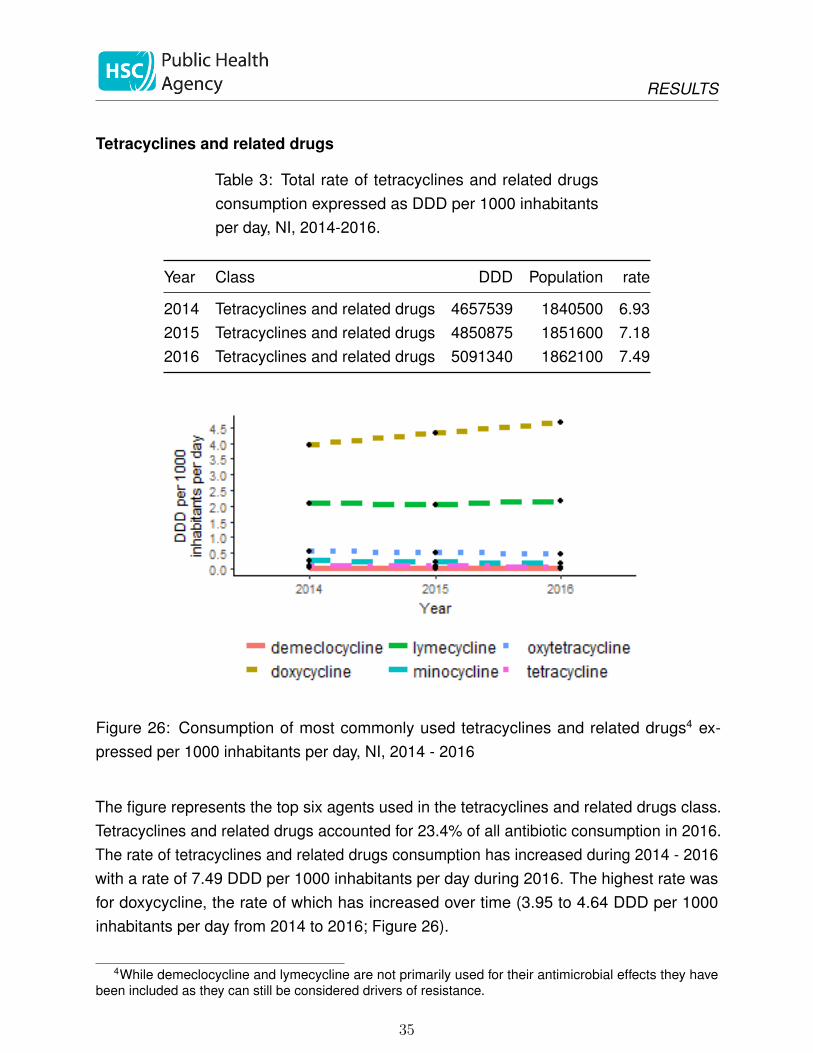
Table 3: Total rate of tetracyclines and related drugsconsumption expressed as DDD per 1000 inhabitantsper day, NI, 2014-2016.
Year Class DDD Population rate
2014 Tetracyclines and related drugs 4657539 1840500 6.932015 Tetracyclines and related drugs 4850875 1851600 7.182016 Tetracyclines and related drugs 5091340 1862100 7.49
Figure 26: Consumption of most commonly used tetracyclines and related drugs4 ex-pressed per 1000 inhabitants per day, NI, 2014 - 2016
The figure represents the top six agents used in the tetracyclines and related drugs class.Tetracyclines and related drugs accounted for 23.4% of all antibiotic consumption in 2016.The rate of tetracyclines and related drugs consumption has increased during 2014 - 2016with a rate of 7.49 DDD per 1000 inhabitants per day during 2016. The highest rate wasfor doxycycline, the rate of which has increased over time (3.95 to 4.64 DDD per 1000inhabitants per day from 2014 to 2016; Figure 26).
4While demeclocycline and lymecycline are not primarily used for their antimicrobial effects they havebeen included as they can still be considered drivers of resistance.
35

RESULTS
Quinolones
Table 4: Total rate of Quinolones consumption ex-pressed as DDD per 1000 inhabitants per day, NI, 2014-2016.
Year Class DDD Population rate
2014 Quinolones 493831 1840500 0.742015 Quinolones 488642 1851600 0.722016 Quinolones 490773 1862100 0.72
Figure 27: Consumption of most commonly used quinolones expressed per 1000 inhabi-tants per day, NI, 2014 - 2016
The rate of Quinolones consumption has remained stable during 2014 - 2016 with arate of 0.72 DDD per 1000 inhabitants per day during 2016. The highest rate was forciprofloxacin which has been stable over time (0.61 DDD per 1000 inhabitants per day in2016; Figure 27).
36
RESULTS
Macrolides
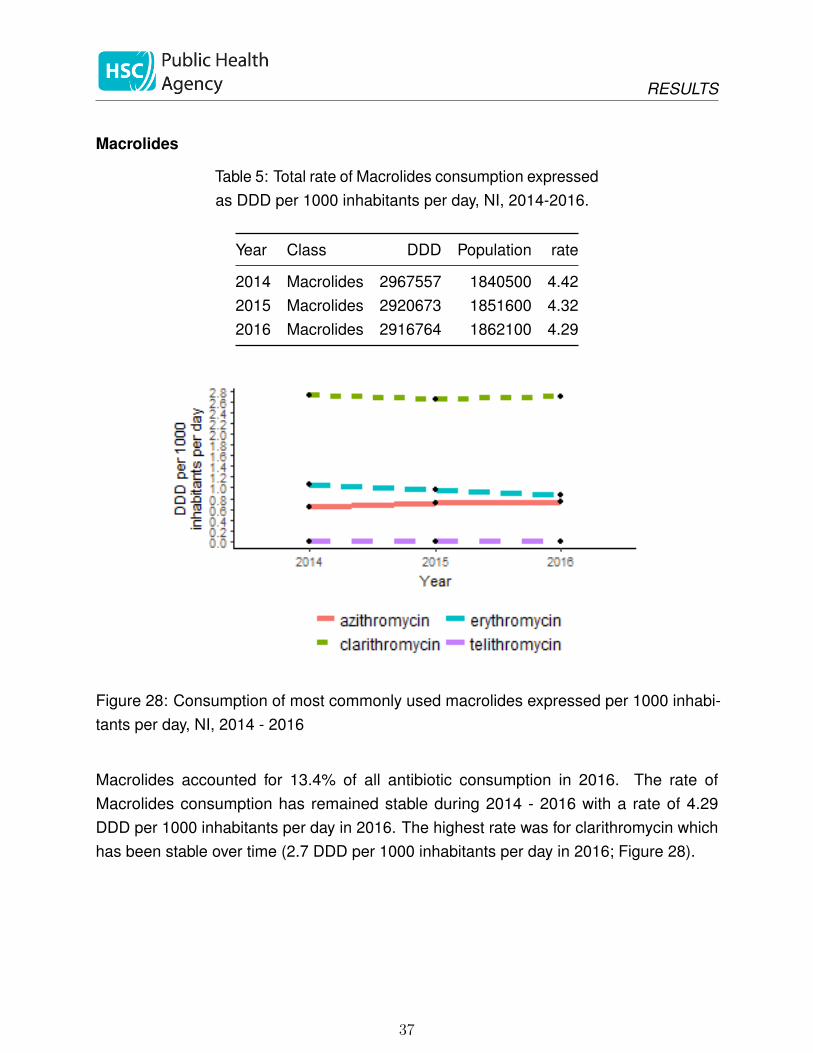
Table 5: Total rate of Macrolides consumption expressedas DDD per 1000 inhabitants per day, NI, 2014-2016.
Year Class DDD Population rate
2014 Macrolides 2967557 1840500 4.422015 Macrolides 2920673 1851600 4.322016 Macrolides 2916764 1862100 4.29
Figure 28: Consumption of most commonly used macrolides expressed per 1000 inhabi-tants per day, NI, 2014 - 2016
Macrolides accounted for 13.4% of all antibiotic consumption in 2016. The rate ofMacrolides consumption has remained stable during 2014 - 2016 with a rate of 4.29DDD per 1000 inhabitants per day in 2016. The highest rate was for clarithromycin whichhas been stable over time (2.7 DDD per 1000 inhabitants per day in 2016; Figure 28).
37

RESULTS
Carbapenems
Table 6: Total rate of Carbapenems consumption ex-pressed as DDD per 1000 inhabitants per day, NI, 2014-2016.
Year Class DDD Population rate
2014 Carbapenems 65191 1840500 0.102015 Carbapenems 61799 1851600 0.092016 Carbapenems 58255 1862100 0.09
Figure 29: Consumption of most commonly used carbapenems expressed per 1000inhabitants per day, NI, 2014 - 2016
The rate of Carbapenems consumption has remained stable during 2014 - 2016 with a rateof 0.09 DDD per 1000 inhabitants per day in 2016. The highest rate was for meropenemwhich has decreased slightly over time (0.09 in 2014 to 0.07 DDD per 1000 inhabitants perday in 2016; Figure 29).
38

RESULTS
Penicillin/beta lactamase inhibitor combinations
Table 7: Total rate of Penicillin/beta lactamase inhibitorcombinations consumption expressed as DDD per 1000inhabitants per day, NI, 2014-2016.
Year Class DDD Population rate
2014 Penicillin/beta lactamase inhibitor combinations 1961833 1840500 2.922015 Penicillin/beta lactamase inhibitor combinations 1932974 1851600 2.862016 Penicillin/beta lactamase inhibitor combinations 1594932 1862100 2.35
Figure 30: Consumption of most commonly used Penicillin/beta lactamase inhibitor combi-nations expressed per 1000 inhabitants per day, NI, 2014 - 2016
The rate of Penicillin/beta lactamase inhibitor combinations consumption has decreasedduring 2014 - 2016 with a rate of 2.35 DDD per 1000 inhabitants per day in 2016. Thehighest rate was for co-amoxiclav which has decreased over time (2.72 to 2.13 DDD per1000 inhabitants per day from 2014 to 2016). The use of piperacillin/tazobactam has beenstable over time (0.21 DDD per 1000 inhabitants per day in 2016; Figure 30).
39

RESULTS
Glycopeptides and daptomycin
Table 8: Total rate of glycopeptides and daptomycinconsumption expressed as DDD per 1000 inhabitantsper day, NI, 2014-2016.
Year Class DDD Population rate
2014 Glycopeptides and Daptomycin 91354 1840500 0.142015 Glycopeptides and Daptomycin 98695 1851600 0.152016 Glycopeptides and Daptomycin 110211 1862100 0.16
Figure 31: Consumption of most commonly used glycopeptides and daptomycin expressedper 1000 inhabitants per day, NI, 2014 - 2016
The rate of glycopeptide and daptomycin consumption has remained stable during 2014 -2016 with a rate of 0.16 DDD per 1000 inhabitants per day in 2016. The highest rate wasfor teicoplanin which has been stable over time (0.12 DDD per 1000 inhabitants per day in2016; Figure 31).
40

RESULTS
Anti-folate agents
Table 9: Total rate of Anti-folate agents consumptionexpressed as DDD per 1000 inhabitants per day, NI,2014-2016.
Year Class DDD Population rate
2014 Anti-folate agents 2198383 1840500 3.272015 Anti-folate agents 2202642 1851600 3.262016 Anti-folate agents 2203877 1862100 3.24
Figure 32: Consumption of most commonly used anti-folate agents expressed per 1000inhabitants per day, NI, 2014 - 2016
Anti-folate agents accounted for 10.1% of all antibiotic consumption in 2016. The rate ofAnti-folate agents consumption has remained stable during 2014 - 2016 with a rate of 3.24DDD per 1000 inhabitants per day in 2016. The highest rate was for trimethoprim whichhas decreased slightly over time (1.62 to 1.53 DDD per 1000 inhabitants per day from2014 to 2016; Figure 32).
41

RESULTS
Antibiotic consumption of key agents by healthcare setting
Trimethoprim
Table 10: Total rate of trimethoprim consumption ex-pressed as DDD per 1000 inhabitants per day, NI, 2014-2016.
Year Antibiotic DDD Population rate
2014 trimethoprim 1090980 1840500 1.622015 trimethoprim 1053447 1851600 1.562016 trimethoprim 1038717 1862100 1.53
Figure 33: Consumption of trimethoprim by prescriber location expressed per 1000 inhabi-tants per day, NI, 2014 - 2016
Overall, the rate of trimethoprim consumption has decreased slightly during 2014 - 2016with a rate of 1.53 DDD per 1000 inhabitants per day during 2016. This trend is influencedby stable rates of trimethopim consumption in primary care during 2014 - 2016 (1.47 to 1.37DDD per 1000 inhabitants per day) with no change in secondary care during 2014-2016(0.15 to 0.15 DDD per 1000 inhabitants per day; Figure 33).
42

RESULTS
Nitrofurantoin
Table 11: Total rate of nitrofurantoin consumption ex-pressed as DDD per 1000 inhabitants per day, NI, 2014-2016.
Year Antibiotic DDD Population rate
2014 nitrofurantoin 812684 1840500 1.212015 nitrofurantoin 817469 1851600 1.212016 nitrofurantoin 840255 1862100 1.24
Figure 34: Consumption of nitrofurantoin by prescriber location expressed per 1000inhabitants per day, NI, 2014 - 2016
Overall, the rate of nitrofurantoin consumption has remained stable during 2014 - 2016with a rate of 1.24 DDD per 1000 inhabitants per day in 2016. Rates in both primaryand secondary care have not changed during 2014 - 2016 (1.13 to 1.14 DDD per 1000inhabitants per day in primary care and 0.08 to 0.1 DDD per 1000 inhabitants per day insecondary care; Figure 34).
43

RESULTS
Aminoglycosides
Table 12: Total rate of Aminoglycosides consumptionexpressed as DDD per 1000 inhabitants per day, NI,2014-2016.
Year Class DDD Population rate
2014 Aminoglycosides 95301 1840500 0.142015 Aminoglycosides 102535 1851600 0.152016 Aminoglycosides 105419 1862100 0.16
Figure 35: Consumption of aminoglycosides by prescriber location expressed per 1000inhabitants per day, NI, 2014 - 2016
Overall, the rate of Aminoglycosides consumption has remained stable during 2014 - 2016with a rate of 0.16 DDD per 1000 inhabitants per day in 2016. This trend is influenced bystable rates in primary care during 2014 - 2016 (0 DDD per 1000 inhabitants per day during2016) and a slight increase in secondary care (0.14 to 0.15 DDD per 1000 inhabitants perday; Figure 35).
44
RESULTS
Glycopeptides and daptomycin
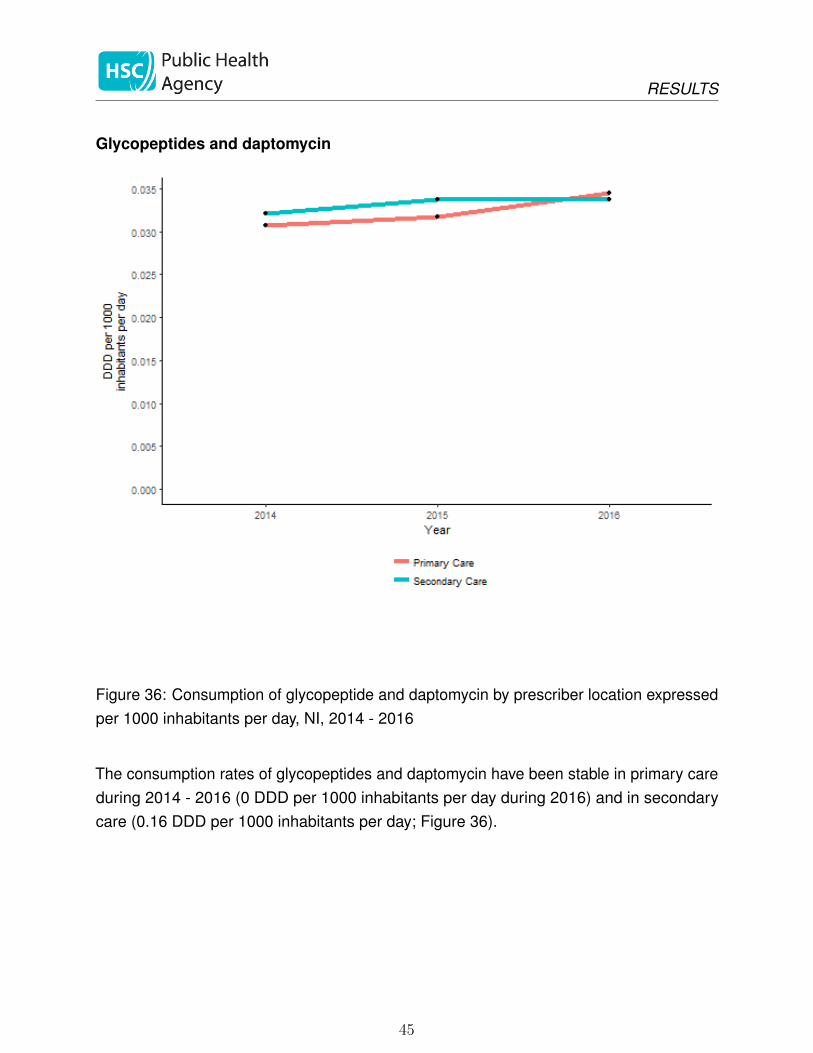
Figure 36: Consumption of glycopeptide and daptomycin by prescriber location expressedper 1000 inhabitants per day, NI, 2014 - 2016
The consumption rates of glycopeptides and daptomycin have been stable in primary careduring 2014 - 2016 (0 DDD per 1000 inhabitants per day during 2016) and in secondarycare (0.16 DDD per 1000 inhabitants per day; Figure 36).
45
RESULTS
Colistin
Table 13: Total rate of colistin consumption expressedas DDD per 1000 inhabitants per day, NI, 2014-2016.
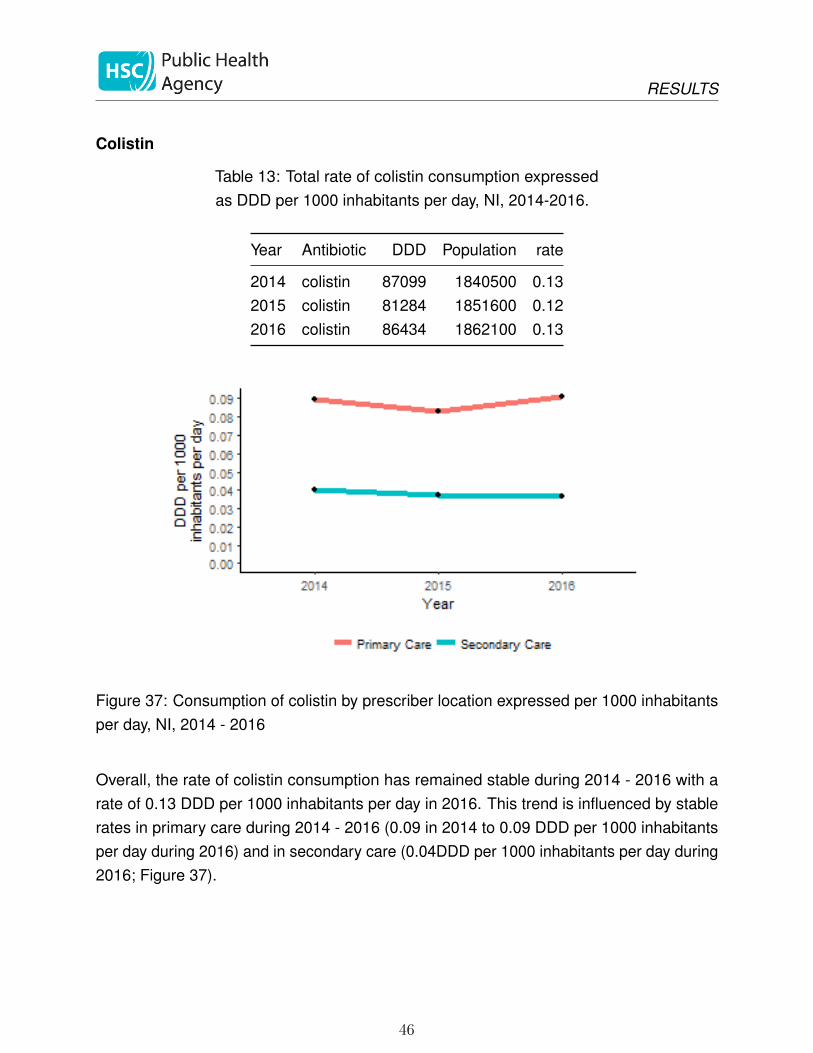
Year Antibiotic DDD Population rate
2014 colistin 87099 1840500 0.132015 colistin 81284 1851600 0.122016 colistin 86434 1862100 0.13
Figure 37: Consumption of colistin by prescriber location expressed per 1000 inhabitantsper day, NI, 2014 - 2016
Overall, the rate of colistin consumption has remained stable during 2014 - 2016 with arate of 0.13 DDD per 1000 inhabitants per day in 2016. This trend is influenced by stablerates in primary care during 2014 - 2016 (0.09 in 2014 to 0.09 DDD per 1000 inhabitantsper day during 2016) and in secondary care (0.04DDD per 1000 inhabitants per day during2016; Figure 37).
46
RESULTS
Antibiotic guardians
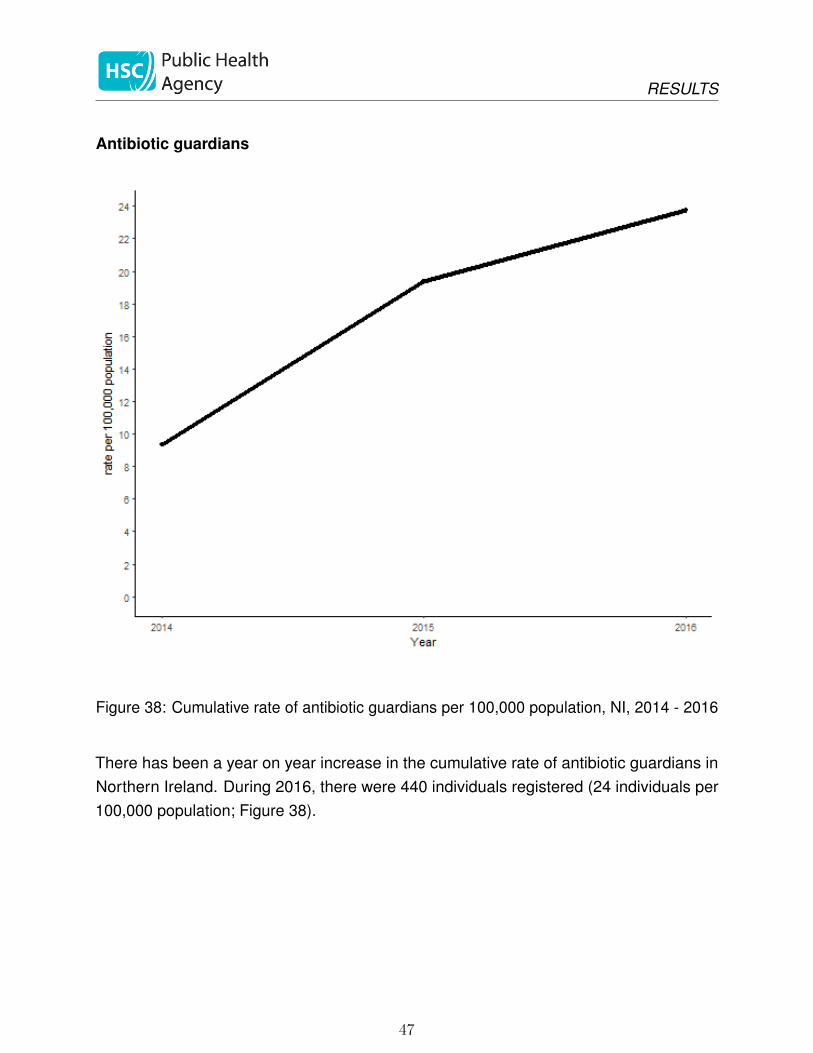
Figure 38: Cumulative rate of antibiotic guardians per 100,000 population, NI, 2014 - 2016
There has been a year on year increase in the cumulative rate of antibiotic guardians inNorthern Ireland. During 2016, there were 440 individuals registered (24 individuals per100,000 population; Figure 38).
47
DISCUSSION
Discussion
This is the first report of antimicrobial resistance and antimicrobial consumption in NorthernIreland. We have aimed to make the content generally comparable with the ESPAUR reportfor England[4]. In future reports, we aim to be able to access, analyse and report moredetailed information about antimicrobial use and resistance in specific healthcare settings.
Antimicrobial resistance
The focus for the antimicrobial resistance section was the organism-antibiotic combinationsthat were identified as part of the UK AMR strategy[3]. In NI, surveillance for theseorganisms is not mandatory and is based on the voluntary reporting by the microbiologylaboratories to the PHA. Therefore, underreporting of the organisms is a possibility.
The information presented in this report demonstrates increasing incidence and increasingresistance of many bloodstream infections, particularly E. coli and K. pneumoniae. Asteady increase in infections caused by glycopeptide-resistant enterococci was only brokenby a decline in 2016.
E. coli and K. pneumoniae bloodstream infections have been targeted as part of theUK governments ambition to reduce healthcare-associated gram-negative bloodstreaminfections by 50% by 2020. In order to reduce the number of these infections, local teamswill need timely information about the characteristics of the patients who are affected, therisk factors that contributed to the infection and which healthcare settings were responsible.We are working towards implementing a harmonised, enhanced healthcare-associatedinfection surveillance programme that will capture information on existing mandatorysurveillance organisms (Staphylococcus aureus, Clostridium difficile and Pseudomonasspecies from augmented care settings) and extend this to include enhanced informationabout E. coli, K. pneumoniae, Pseudomonas species from all settings and carbapenamase-producing organisms (CPOs). These new data will be an important source of businessintelligence for Health and Social Care Trusts as they aim to improve the quality and safetyof the care that they provide. The success of this new programme will require Trusts totake steps to implement new data collection arrangements quickly for the benefit of theirpatients.
Antimicrobial resistance in most of the selected organisms has remained relatively stablesince 2009. The resistance trends for the gram negative bacteraemias are similar to
48
DISCUSSION
that observed in England and, for the most part, the proportions resistant are lower inNI. There are higher proportions of E. coli, K. pneumoniae and Pseudomonas speciesresistant to piperacillin/tazobactam in NI compared to England (15.6%, 19% and 12% inNI during 2016 compared to 11.8%, 17.8% and 10.3% in England). For K. pneumoniae,the proportion resistant to gentamicin was also higher in NI than in England during 2016(10.9% compared to 8.9% respectively). While the proportion of isolates that are resistantto key antibiotics has not changed very much over time, the absolute number of resistantinfections has increased because of the overall rising number of infections.
As antimicrobial resistance is a transmissible global problem, PHA will collaborate withPublic Health England and the Scottish, Welsh and Irish public health organisations, tocontribute to the European Antimicrobial Resistance Surveillance Network (EARS-Net)and the World Health Organisation’s Global Antimicrobial Resistance Surveillance System(GLASS). This will ensure standardised information on antimicrobial resistance is availableto inform comparisons and drive improvement.
49

DISCUSSION
Antibiotic consumption
Total antibiotic consumption in Northern Ireland has remained unchanged for three yearsat 32 DDD per 1,000 inhabitants, with little overall change in primary or secondary care.Despite this, the rate of antimicrobial consumption in secondary care per admission or peroccupied bed day has steadily increased over time, perhaps suggesting that the case-mixof hospital inpatients has become more severe over time. This stasis is in contrast withthe situation in England, where antibiotic consumption has fallen, and is now measured at21 DDD per 1,000 inhabitants per day. By this measure, Northern Ireland’s total antibioticconsumption is 52% higher than that of England.
Penicillins, tetracyclines and macrolides were the most commonly prescribed antibioticsin both settings, and there has been little change in these in either setting. There weresome welcome reductions in the use of specific antibiotics. The use of carbapenems, andmeropenem in particular, declined over time in Northern Ireland, which is an encouragingtrend. Use of co-amoxiclav also fell markedly in 2016, and trimethoprim use fell slightly. Ingeneral, however, comparison with antimicrobial use in England highlights substantiallyhigher use in Northern Ireland. Piperacillin/tazobactam consumption remained unchangedin 2016 at 0.21 DDD per 1,000 inhabitants per day, which is more than twice the decliningrate in England (0.1 DDD per 1,000 inhabitants per day). The rate of cephalosporinuse was steady at 0.57 DDD per 1,000 inhabitants per day, which is nearly twice thedeclining English rate of 0.33 DDD per 1,000 inhabitants per day. The use of tetracyclines,particularly doxycycline, increased in Northern Ireland to 7.49 DDD per 1,000 inhabitantsper day, which was much higher than the English rate of 4.7 DDD per 1,000 inhabitantsper day. The use of quinolones and macrolides has remained unchanged over the last 3years in Northern Ireland, during which time use has decreased in England.
Colistin is an antibiotic of last resort that is used for multidrug-resistant infections and alsoas an inhaled therapy for people with cystic fibrosis. Colistin consumption in NorthernIreland has been steady for the last three years, but rates are higher than in England (0.13DDD per 1,000 inhabitants per day in 2016 in NI and 0.073 DDD per 1,000 inhabitants perday in 2016 in England).
The amount of antimicrobial use in Northern Ireland is markedly higher than England.Understanding the reasons for the difference is a complex task. Most antibiotics wereprescribed in the primary care setting. In order to understand and address the factors thatlead to antibiotic consumption, we need information about the characteristics of the peoplewho are prescribed them. There is currently no publicly available information about the
50

DISCUSSION
factors that influence antibiotic prescribing in Northern Ireland. It is a priority for PHA towork with the Health and Social Care Board and other primary care stakeholders to fill thisinformation gap. In the secondary care setting, investigating the reasons for differences isvastly more difficult because antimicrobial consumption is measured at ward level, not atpatient level, and therefore there is no routine source of information that links antibiotic useto individual patient details. Health and Social Care Northern Ireland has committed todeveloping a new electronic health care record (“Encompass”), which will ultimately includeelectronic prescribing, which will provide a rich source of information about the factorsinfluencing antimicrobial consumption. However, over-use of antibiotics is already causingharm to patients, and we cannot afford to wait years before addressing the challengesof inappropriate antimicrobial prescribing. Reducing antimicrobial consumption safely isthe complex challenge that faces all of us. One way of engaging clinicians (as well asother professionals and the public) in this challenge, is to encourage them to sign up toan Antibiotic Guardian pledge. There were fewer new Antibiotic Guardians in 2016 thanin previous years, and we have put in place new measures to promote this campaign,particularly to professionals.
51

ACTIONS TO REDUCE ANTIMICROBIAL USE AND RESISTANCE
Actions to reduce antimicrobial use and resistance
Public communication
The O’Neill report recommended a major global information campaign to raise awarenessabout the future harms likely to occur if antibiotic use was not reduced. PHA has developeda communications plan to communicate with people in Northern Ireland about the potentialharms related to inappropriate antibiotic use. This will involve running engagement events,social media and news releases at key points. Highlights include:
• Significant press and social media activity planned around World Antibiotic AwarenessWeek (13-18 November 2017)
• A public engagement event about antimicrobial resistance on European AntibioticAwareness Day in the W5 science education centre in Belfast (18 November 2017)
• PHA is working with Council for the Curriculum, Examinations and Assessment tomap the learning outcomes from the PHE-produced e-Bug materials against the NIprimary and secondary curricula and to promote the materials to schools
• PHA is working with the Northern Ireland STEM Ambassador Hub and Centre ofExcellence in Public Health, QUB, to deliver classes about antimicrobial resistanceto pupils in 2017 and 2018 using the e-Bug materials
Changing prescribing behaviour
Safely reducing antimicrobial use is a complex challenge that will require an understandingof the capacity, opportunity and motivation of prescribers to decide when not to prescribeantibiotics. PHA is working closely with behavioural scientists in the Innovation Lab (basedin the Department of Finance) to learn more about prescribing behaviour and how tosafely bring about circumstances that change it. Recent initiatives to reduce antimicrobialconsumption include:
• Endorsement of the TARGET toolkit for GPs by the Improvement Board and promotionof this to GPs through the Royal College of General Practitioners. Workshops forGPs will be delivered in 2018.
• A survey of GPs about the factors that influence their antibiotic prescribing decisionswas conducted by the Innovation lab in September and October 2017, with preliminaryresults due to be presented on 13 November 2017.
52

ACTIONS TO REDUCE ANTIMICROBIAL USE AND RESISTANCE
• A systematic review of behavioural science interventions for antimicrobial stewardshipis underway between the Innovation Lab and PHA.
• A guest editorial was published in the Ulster Medical Journal in September 2017aimed at promoting awareness of antibiotic stewardship, the Antibiotic Guardianpledge and events occurring around World Antibiotic Awareness Week[9].
• A letter using behaviour change techniques was written from the Chief Medical Officer,Dr Michael McBride, to GPs in the 20% highest antibiotic prescribing practices inOctober 2017, based on one that was shown to be effective in a randomised controlledtrial[10].
• A pilot of point-of-care CRP testing for respiratory infections in primary care isunderway in five general practices, with one in each LCG area. Evaluation of the pilotwill be used to inform decisions about wider adoption.
53

APPENDIX 1: AMR SURVEILLANCE CATEGORIES
Appendix 1: AMR surveillance categories
Table 14: Antibiotic names (trade and generic) andassigned surveillance group for the antimicrobial resis-tance data
Antibiotic surveillance group Individual antibiotic name
3rd Generation Cephalosporin cefotaxime3rd Generation Cephalosporin claforan3rd Generation Cephalosporin ceftazidime3rd Generation Cephalosporin fortum3rd Generation Cephalosporin cefpodoxime3rd Generation Cephalosporin ceftizoxime3rd Generation Cephalosporin ceftriaxoneCarbapenem meronemCarbapenem meropenemCarbapenem imipenemCarbapenem ertapenemCiprofloxacin ciprofloxacinCiprofloxacin low level ciprofloxacinCiprofloxacin ciproxinCo-amoxiclav co-amoxiclavCo-amoxiclav amoxicillin/clavulanateCo-amoxiclav augmentinColistin colistinColistin colomycinGentamicin gentamicinGentamicin lugacinGentamicin cidomycinGentamicin genticinGentamicin garamycinGentamicin high_level gentamicinGlycopeptide vancocinGlycopeptide vancomycinGlycopeptide teicoplaninMacrolides clarithromycin
54
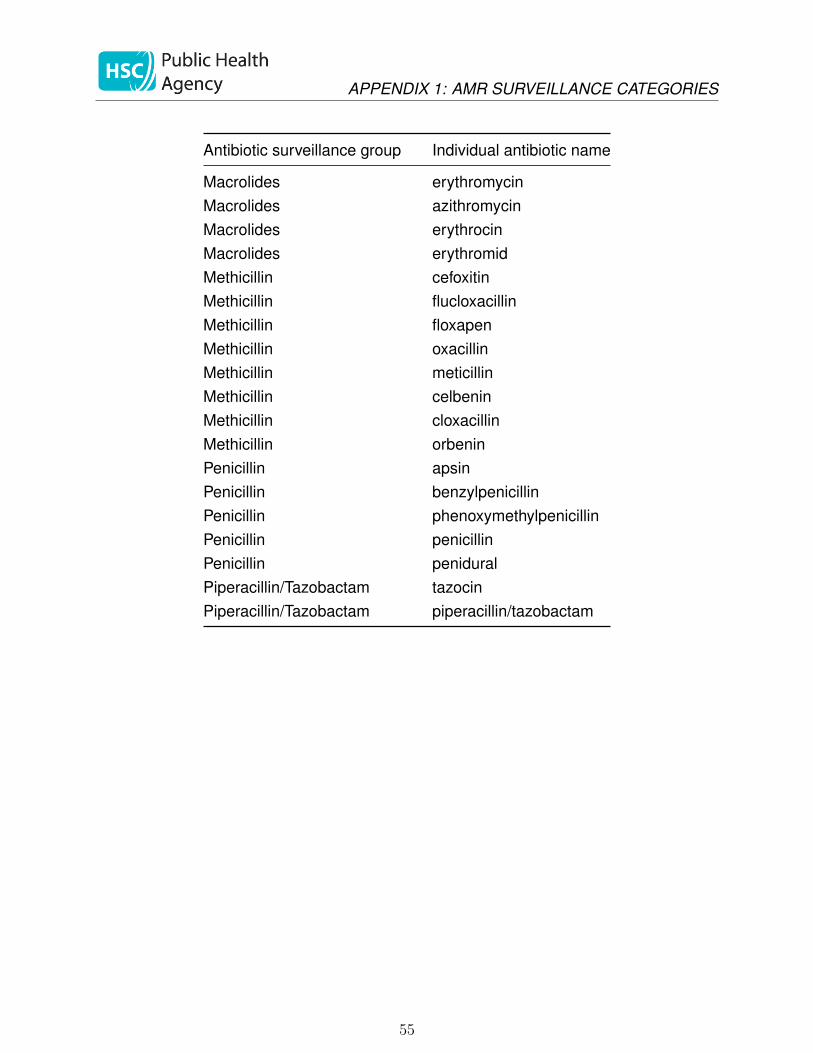
APPENDIX 1: AMR SURVEILLANCE CATEGORIES
Antibiotic surveillance group Individual antibiotic name
Macrolides erythromycinMacrolides azithromycinMacrolides erythrocinMacrolides erythromidMethicillin cefoxitinMethicillin flucloxacillinMethicillin floxapenMethicillin oxacillinMethicillin meticillinMethicillin celbeninMethicillin cloxacillinMethicillin orbeninPenicillin apsinPenicillin benzylpenicillinPenicillin phenoxymethylpenicillinPenicillin penicillinPenicillin peniduralPiperacillin/Tazobactam tazocinPiperacillin/Tazobactam piperacillin/tazobactam
55

APPENDIX 2: AMC DATA CATEGORIES
Appendix 2: AMC data categories
Table 15: Antibiotic names, ATC codes and assignedsurveillance group for the antimicrobial consumptiondata
Antibiotic surveillance group Individual antibiotic name ATC codes
Aminoglycosides amikacin J01GB06Aminoglycosides gentamicin J01GB03Aminoglycosides neomycin A07AA01Aminoglycosides neomycin J01GB05Aminoglycosides tobramycin J01GB01Anti-Clostridium difficile agents fidaxomicin A07AA12Anti-Clostridium difficile agents metronidazole P01AB01Anti-Clostridium difficile agents vancomycin A07AA09Anti-folate agents co-trimoxazole J01EE01Anti-folate agents dapsone J04BA02Anti-folate agents methenamine J01XX05Anti-folate agents nitrofurantoin J01XE01Anti-folate agents sulfadiazine J01EC02Anti-folate agents sulfapyridine J01EB04Anti-folate agents sulphamethoxypyridazine J01ED05Anti-folate agents trimethoprim J01EA01Anti-protozoal agents paromomycin A07AA06Anti-tuberculous drugs capreomycin J04AB30Anti-tuberculous drugs cycloserine J04AB01Anti-tuberculous drugs ethambutol J04AK02Anti-tuberculous drugs isoniazid J04AC01Anti-tuberculous drugs prothionamide J04AD01Anti-tuberculous drugs pyrazinamide J04AK01Anti-tuberculous drugs rifabutin J04AB04Anti-tuberculous drugs rifampicin J04AB02Anti-tuberculous drugs rifampicin + isoniazid J04AM02Anti-tuberculous drugs rifampicin+isoniazid+pyrazinamide J04AM05Anti-tuberculous drugs rifaximin A07AA11Anti-tuberculous drugs streptomycin J01GA01
56
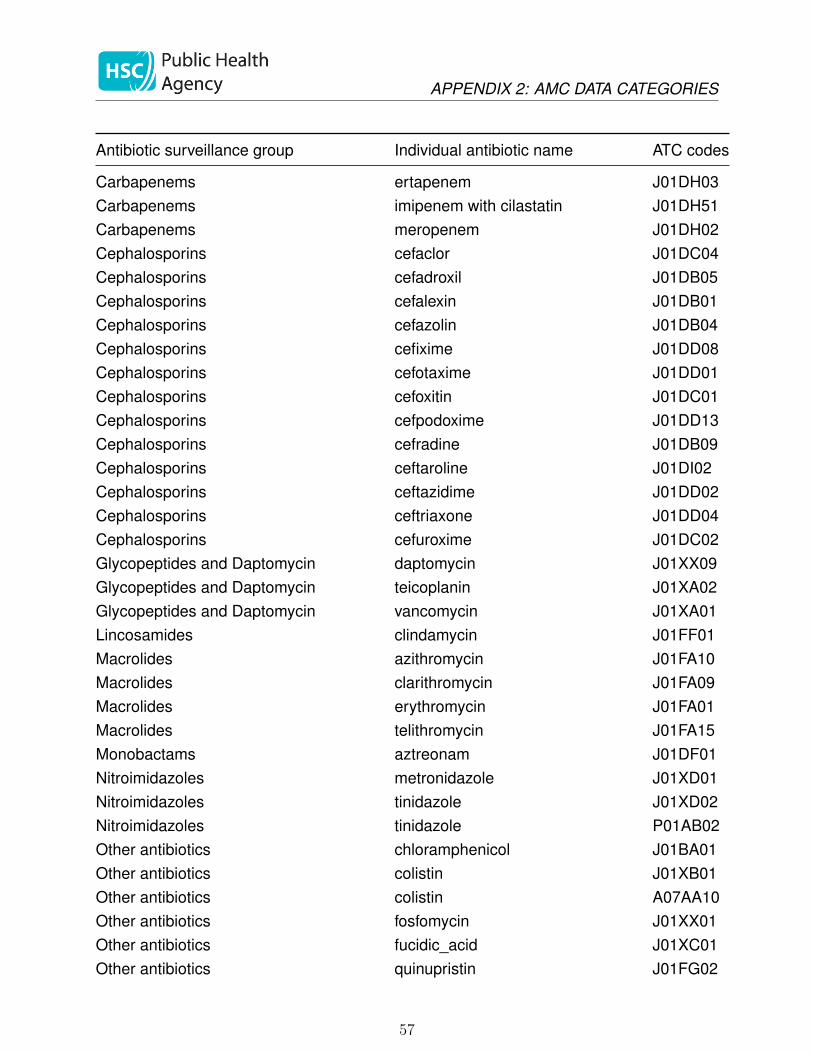
APPENDIX 2: AMC DATA CATEGORIES
Antibiotic surveillance group Individual antibiotic name ATC codes
Carbapenems ertapenem J01DH03Carbapenems imipenem with cilastatin J01DH51Carbapenems meropenem J01DH02Cephalosporins cefaclor J01DC04Cephalosporins cefadroxil J01DB05Cephalosporins cefalexin J01DB01Cephalosporins cefazolin J01DB04Cephalosporins cefixime J01DD08Cephalosporins cefotaxime J01DD01Cephalosporins cefoxitin J01DC01Cephalosporins cefpodoxime J01DD13Cephalosporins cefradine J01DB09Cephalosporins ceftaroline J01DI02Cephalosporins ceftazidime J01DD02Cephalosporins ceftriaxone J01DD04Cephalosporins cefuroxime J01DC02Glycopeptides and Daptomycin daptomycin J01XX09Glycopeptides and Daptomycin teicoplanin J01XA02Glycopeptides and Daptomycin vancomycin J01XA01Lincosamides clindamycin J01FF01Macrolides azithromycin J01FA10Macrolides clarithromycin J01FA09Macrolides erythromycin J01FA01Macrolides telithromycin J01FA15Monobactams aztreonam J01DF01Nitroimidazoles metronidazole J01XD01Nitroimidazoles tinidazole J01XD02Nitroimidazoles tinidazole P01AB02Other antibiotics chloramphenicol J01BA01Other antibiotics colistin J01XB01Other antibiotics colistin A07AA10Other antibiotics fosfomycin J01XX01Other antibiotics fucidic_acid J01XC01Other antibiotics quinupristin J01FG02
57

APPENDIX 2: AMC DATA CATEGORIES
Antibiotic surveillance group Individual antibiotic name ATC codes
Oxazolidinones linezolid J01XX08Oxazolidinones linezolid J01XX10Oxazolidinones tedizolid J01XX11Penicillins amoxicillin J01CA04Penicillins ampicillin J01CA01Penicillins benzathine-benzylpenicillin J01CE08Penicillins benzylpenicillin J01CE01Penicillins co-fluampicil J01CA51Penicillins co-fluampicil J01CR50Penicillins flucloxacillin J01CF05Penicillins phenoxymethylpenicillin J01CE02Penicillins pivmecillinam J01CA08Penicillins procaine J01CE09Penicillins temocillin J01CA17Penicillins with beta lactamase inhibitors co-amoxiclav J01CR02Penicillins with beta lactamase inhibitors piperacillin/tazobactam J01CR05Penicillins with beta lactamase inhibitors ticarcillin with clavulanic_acid J01CR03Quinolones ciprofloxacin J01MA02Quinolones levofloxacin J01MA12Quinolones moxifloxacin J01MA14Quinolones norfloxacin J01MA06Quinolones ofloxacin J01MA01Tetracyclines and related drugs demeclocycline J01AA01Tetracyclines and related drugs doxycycline J01AA02Tetracyclines and related drugs lymecycline J01AA04Tetracyclines and related drugs minocycline J01AA08Tetracyclines and related drugs oxytetracycline J01AA06Tetracyclines and related drugs tetracycline J01AA07Tetracyclines and related drugs tigecycline J01AA12
58
APPENDIX 3: TESTING DATA
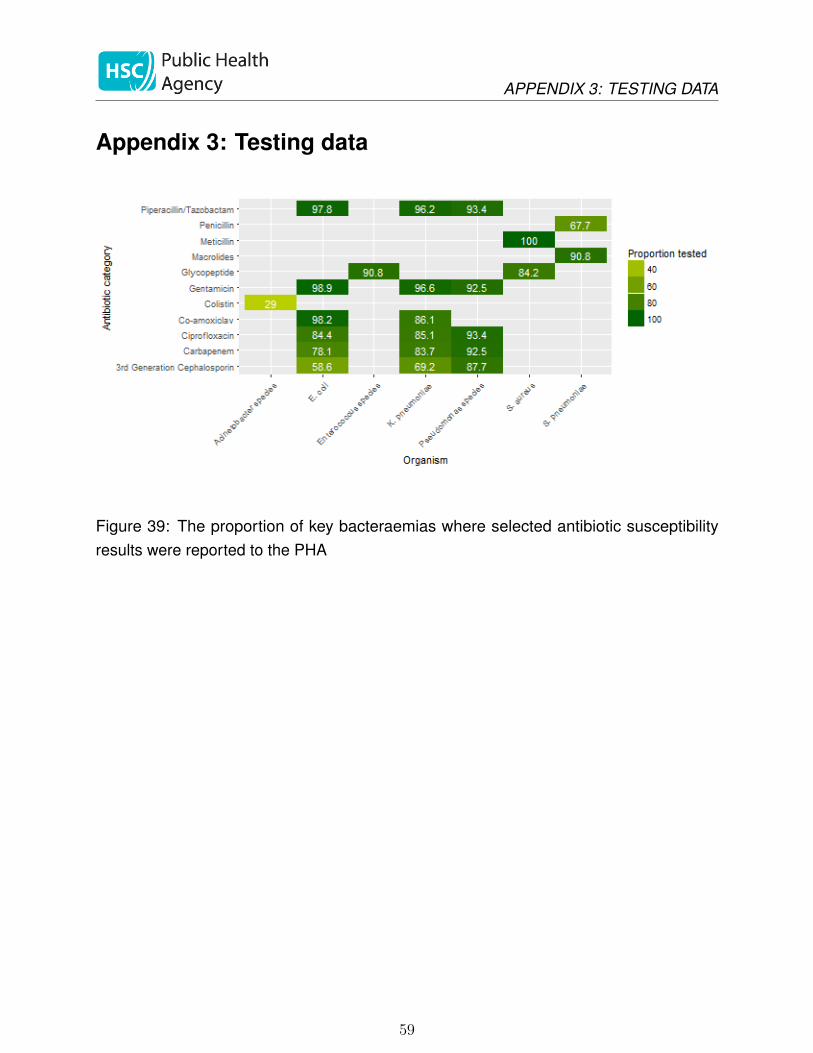
Appendix 3: Testing data
Figure 39: The proportion of key bacteraemias where selected antibiotic susceptibilityresults were reported to the PHA
59

APPENDIX 3: TESTING DATA
References
1 Costelloe C, Metcalfe C, Lovering A et al. Effect of antibiotic prescribing in primary careon antimicrobial resistance in individual patients: systematic review and meta-analysis.British medical journal 2010;340:c2096–6. doi:10.1136/bmj.c2096
2 Department of Health Social Services and Public Safety Northern Ireland. Strategy forTackling Antimicrobial Resistance (STAR) 2012 to 2017. 2012.https://www.health-ni.gov.uk/sites/default/files/publications/dhssps/star-doc.pdf
3 Department of Health. UK Five Year Antimicrobial Resistance Strategy 2013 to 2018.2013.https://www.gov.uk/government/uploads/system/uploads/attachment_data/file/244058/20130902_UK_5_year_AMR_strategy.pdf
4 Public Health England. English surveillance programme for antimicrobial utilisationand resistance (ESPAUR). 2017.https://www.gov.uk/government/uploads/system/uploads/attachment_data/file/653443/ESPAUR_report_2017_.pdf
5 Grayson M. Kucers’ The Use of Antibiotics Sixth Edition: A Clinical Review of Antibacterial,Antifungal and Antiviral Drugs. London:: Hodder Arnold 2010.
6 Bignell C, FitzGerald M. UK national guideline for the management of gon-orrhoea in adults, 2011. International Journal of STD & AIDS 2011;22:541–7.doi:10.1258/ijsa.2011.011267
7 Spiteri G, Cole M, Unemo M et al. The European Gonococcal AntimicrobialSurveillance Programme (Euro-GASP)–a sentinel approach in the European Union(EU)/European Economic Area (EEA). Sexually transmitted infections 2013;89 Suppl4:iv16–8. doi:10.1136/sextrans-2013-051117
8 European Centre for Disease Prevention and Control. European Gonococcal An-timicrobial Surveillance Programme (Euro-GASP). https://ecdc.europa.eu/en/about-us/partnerships-and-networks/disease-and-laboratory-networks/euro-gasp
9 Bradley D, Doherty L. Guest Editorial. Time for a new resistance against antibiotics.Ulster Med J 2017;86:157–8.http://www.ums.ac.uk/umj086/086(3)157.pdf
10 Hallsworth M, Chadborn T, Sallis A et al. Provision of social norm feedback to highprescribers of antibiotics in general practice: a pragmatic national randomised controlledtrial. The Lancet 2016;387:1743–52. doi:10.1016/S0140-6736(16)00215-4
60