survey of pay & work rights helpline callers - gov.uk
TRANSCRIPT

EMPLOYMENT RELATIONS RESEARCH SERIES 113
Survey of Pay & Work Rights Helpline callers
Ian Rutherford & James Achur
SEPTEMBER 2010

About EMAR Employment Market Analysis and Research (EMAR) is a multi-disciplinary team of economists, social researchers and statisticians based in the Employment Relations Directorate of the Department for Business, Innovation and Skills (BIS).
Our role is to provide the evidence base for good policy making in employment relations, labour market and equality and discrimination at work. We do this through:
• conducting periodic benchmark surveys
• commissioning external research reports
• conducting in-house research and analysis
• assessing the regulatory impact of new employment laws
• monitoring and evaluating the impact of government policies
We publicly disseminate the results of this research through the BIS Employment Relations Research Series and other publications. For further details of EMAR's work, including PDF versions of all our publications, please see our web pages at: http://www.bis.gov.uk/policies/employment-matters/research
About this publication The project manager for this report was Ian Rutherford, Statistical Advisor in the EMAR branch. This report can be viewed online.
URN: 10/1128 ISBN: 978-0-85605-760-1
Enquiries should be addressed to [email protected] or to:
Employment Market Analysis and Research Department for Business, Innovation and Skills 3rd Floor, Abbey 2 1 Victoria Street London SW1H 0ET UNITED KINGDOM
The views expressed in this report are the authors’ and do not necessarily reflect those of the Department or the Government.
i

Foreword The Department for Business, Innovation and Skills (BIS) leads work to create the conditions for business success through competitive and flexible markets that create value for businesses, consumers and workers. It drives regulatory reform, and works across Government and with the regions to raise levels of UK productivity. It is also responsible for ensuring an improved quality of life for workers and promoting choice and quality for consumers.
As part of that work the Employment Market Analysis and Research (EMAR) branch of the Department manages an extensive research programme to inform policy making and promote better regulation on employment relations, labour market and equality and discrimination at work issues.
This report presents findings from the first survey of callers to the Pay & Work Rights helpline (a helpline set-up to deal with enquiries and problems with the five Government enforced employment rights). The results show that although the helpline fields a wide range of calls with many enquiries covering more than the five enforced rights, the high satisfaction reported suggests that it performs a valued role in resolving enquiries related to the five enforced rights, and where necessary passing them to an enforcement body or in many cases efficiently signposting callers to a more appropriate organisation to deal with their enquiry.
We hope you find it of interest. Electronic copies of this and all other reports in our Employment Relations Research Series can be downloaded from the BIS website. Printed copies can be ordered online, by phone or by email. A complete list of our research series can be found at the back of this report.
Please contact us at [email protected] if you wish to be added to our publication mailing list, or would like to receive regular email updates on EMAR’s research, new publications and forthcoming events.
Bill Wells
Director, Employment Market Analysis and Research
ii

Acknowledgements The authors would like to thank Siân Llewellyn-Thomas and Luke Taylor from TNS-BMRB who managed the questionnaire development, fieldwork and post-collection. Thanks also for the time callers took to participate.
iii

Contents Executive summary......................................................................................... 1
1. Introduction ................................................................................................. 4
1.1 Employment rights, enforcement and the helpline ............................................ 4
1.2 Helpline management statistics......................................................................... 5
1.3 Helpline survey methodology ............................................................................ 8
1.4 Report structure................................................................................................. 9
2. Perceptions and preferences .................................................................... 10
2.1 Caller satisfaction ............................................................................................ 10
2.2 Caller preferences ........................................................................................... 12
2.3 Summary ......................................................................................................... 13
3. Caller journey ............................................................................................ 14
3.1 Common enquiries to the helpline................................................................... 14
3.2 Helpline response............................................................................................ 18
3.3 Post-call activity............................................................................................... 20
3.4 Summary ......................................................................................................... 25
4. Caller characteristics ................................................................................. 27
4.1 Workplace characteristics ............................................................................... 27
4.2 Job characteristics........................................................................................... 30
4.3 Individual characteristics ................................................................................. 31
4.4 Summary ......................................................................................................... 33
5. Conclusions............................................................................................... 35
5.1 Has the helpline raised awareness and knowledge of rights? ........................ 35
5.2 Has the helpline increased employer compliance with current regulations?... 35
5.3 Has the helpline reduced worker vulnerability and encouraged action on problems? ................................................................................................ 35
iv

References.................................................................................................... 37
A: Technical Annex ....................................................................................... 38
B: Supplementary tables ............................................................................... 40
v

vi
List of figures
Chart 1.1: Call levels to the Pay & Work Rights helpline 11
Chart 1.2: PWR caller satisfaction 16
Chart 3.1: Callers and workers by main problem area 22
Chart 4.1: Worker callers and Workers with a problem by sector 33
Chart 4.2: Worker callers and Workers with a problem by industry 34
Chart 4.3: Worker callers and Workers with a problem by region 35
Chart 4.4: Worker callers and Workers with a problem by occupation 36
Chart 4.5: Worker callers and Workers with a problem by age band 37
Chart 4.6: Worker callers and Workers with a problem by gender 37
List of tables
Table 1.1: Government enforcement bodies 10
Table 3.1: Callers enquiries by main area 20
Table 3.2: Caller enquiry by issue area 23
Table 3.3: Caller enquiry by helpline outcome 24
Table 3.4: Callers enquiry by post call activity 26
Table 3.5: Outcome of callers enquiries recorded by the helpline by post-call activity 28
Table 3.6: Caller enquiry by post-call activity 29
Table A1: Caller enquiry by PWR helpline management information classification 43
Table A2: Mapping FTWS problem categories onto PWR helpline enquiry issues 44
Table B1: Characteristics of PWR helpline callers and those from Fair Treatment at Work Survey 2008 45

Executive summary This report presents findings from the first survey of callers to the Pay & Work Rights helpline (a helpline set-up to deal with enquiries and problems with the five Government enforced employment rights). The survey was conducted almost five months after the helpline was launched on 22nd September 2009.
The survey shows the helpline fields a wide range of calls with many enquiries covering more than the five enforced rights. However judging by the high satisfaction levels from callers and the activity callers undertook post-call, the helpline seems to perform a valued role in resolving enquiries related to the five enforced rights, passing them to an enforcement body; or in many cases efficiently signposting callers to a more appropriate organisation to deal with their enquiry. Levels of satisfaction are in line with those from the more established Acas helpline, which deals with a wider set of employment rights issues.
There is also evidence the helpline is succeeding in attracting calls from ‘vulnerable’ workers, who are more likely to experience employment problems as well as small businesses, who tend to struggle with the detail of existing regulations.
Aims and objectives The aim of the survey was to measure how employers and workers (together comprising of about 80 per cent of callers) who called the helpline had benefited in terms of:
• Reducing worker vulnerability and encouraging workers to take action on problems
• Increasing awareness and knowledge of rights in both workers and employers • and increasing employer compliance with current regulations.
The report presents evidence on whether these aims were achieved using the survey of employers and workers who called the helpline along with matched helpline management information from the call, comparisons with BIS’ Fair Treatment at Work Survey (FTWS), a representative sample of problems in the workplace, and other secondary research and sources (i.e. Acas helpline survey).
Background The survey process began by collecting callers’ details for four weeks from 18th January to 13th February 2010. During this period the helpline recorded around 6,250 calls and was able to help 5,650 (90 per cent) of these callers in some way (i.e. in-scope). Employers or workers made up about 4,500 of these calls, the potential population a sample might be drawn from, but because fewer details were obtained than originally envisaged contact details were finally collected from 1,405 callers. In total 754 interviews were achieved from these callers, a 54 per cent response rate. The fieldwork was conducted by TNS-BMRB between the 8th February and 7th March 2010. The survey data was matched to the helpline management information and weighted accordingly.
1

Headline Findings Perceptions and preferences
• Caller satisfaction was generally high, 89 per cent of callers surveyed were extremely, very or fairly satisfied. A similar proportion would recommend the service to someone they knew.
• Over half of callers (56 per cent) had searched the internet before calling the helpline, while almost half of callers (48 per cent) accessed ‘direct.gov’ specifically.
Caller journey
• Pay and working time issues were most often cited by callers at 53 per cent and 27 per cent respectively. A range of other issues followed from redundancy, dismissal and disciplinary action (10 per cent) to tax and benefits issues (6 per cent). It was difficult to ascertain how many calls related specifically to the five enforced rights, but management information suggests around 46 per cent of in-scope calls at the time of the survey.
• More than half (56 per cent) of in-scope enquiries were signposted to Acas or another organisation. Enquiries where pay or agency regulations were not cited were more likely to be signposted. However management information showed over the year (Sep 2009 – Aug 2010), 42 per cent of in-scope calls from employers or employees were signposted.
• When asked what they would or had done next following their call, employers were split almost equally between the problem or enquiry was now resolved (27 per cent), the call had sought to verify information they were uncertain of (27 per cent), they were seeking advice from another organisation (26 per cent) and finally they had taken action to ensure compliance or implemented a new policy (24 per cent). There was some overlap between these categories.
• Due to the short length of time between a call made to the helpline and interview for the survey; the majority of workers surveyed were still seeking advice from external body or enforcement action as suggested by the helpline (40 per cent). This was followed by discussing the issue with their employer (28 per cent), the problem being solved (14 per cent) and seeking advice from another organisation (13 per cent). Again, there was some overlap between these categories.
Caller characteristics
• Small businesses (less than 50 employees) made up 86 per cent calls from employers, and almost three quarters did not have a HR or personnel department. Small businesses are known to struggle with employment regulations.
• For workers the main characteristics like age, gender, region, industry sector and employment status were mainly in line with the working population. However, callers were more likely to be newer in their jobs, in smaller workplaces or work mainly at home or through an agency, lack proficiency in
2

English and not have a HR or personnel department at work compared with the working population with a most serious employment rights problem in the last 5 years as defined by BIS’ 2008 Fair Treatment at Work Survey (FTWS).
• More significantly as characteristics generally more likely to experience problems at work with their employment rights (Fevre et al 2008, Bewley & Forth 2010). More than twice the proportion of callers have more than one job (9 per cent) or work in a business without an equal opportunities policy (29 per cent) than are found in those with a problem in the worker population. There was no statistically significant difference between the proportion of callers who reported they had a long-standing illness or disability (16 per cent) compared with those with a problem in the worker population, but this was still higher than found in the working population and therefore a common indicator of vulnerability in the literature.
3

1. Introduction 1.1 Employment rights, enforcement and the helpline In the UK, the enforcement of individual employment rights is mainly predicated upon employees’ and workers’ awareness and knowledge of their employment rights and their preparedness to take action to maintain and enforce those rights. However, whilst most rights are for the individual to take forward, government takes a direct role in enforcing the following five rights and related legislation:
• The National Minimum Wage (NMW) • The equivalent NMW for the agricultural sector • The right not to have to work more than 48 hours a week (on average) • Rules governing the conduct of employment agencies • Rules governing the conduct of licensed gangmasters.
Enforcement of this subset of rights and related protections is the responsibility of the five enforcement bodies set out in the table below:
Table 1.1 Government enforcement bodies Enforcement body Rights and legislation enforced
HM Revenue and Customs National Minimum Wage (on behalf of BIS) Department for Food and Rural Affairs (Defra) Agricultural Minimum Wage Employment Agency Standards Inspectorate
(part of BIS) Employment agency standards
Gangmasters Licensing Authority – an NDPB1 sponsored by Defra
Gangmaster licensing standards
Health and Safety Executive – an NDPB sponsored by DWP
Working time2
Source: BIS’s Vulnerable Worker enforcement forum – Final report and Government conclusions Note: 1 Non-departmental public body 2 Enforcement shared with local authorities and specialist regulators for some sectors
In 2007, the Vulnerable Workers Enforcement Forum with representation from the main business and worker groups (CBI, REC, TUC) and practitioners (CAB, Acas, enforcement bodies) was set-up to look at the nature of employment rights abuses, assess the effectiveness of the current enforcement arrangements and identify possible improvements. Recommendations from the Forum were to raise awareness of basic employment rights; streamline vulnerable worker access to the enforcement bodies; create closer working between the enforcement bodies; that enforcement and compliance is not just for government; that there should be improved advice and guidance for business; and further research on these issues.
4

In keeping with these recommendations, a consolidated Pay and Work Rights (PWR) helpline based in Manchester was launched in September 2009 to take calls from employers, workers and third parties on the five enforced rights and, where appropriate, escalate problems to the appropriate enforcement body. This role was previously undertaken by separate helplines maintained by each enforcement body. Publicity for the new helpline was generated through a number of different media events, across radio, newspapers and the internet. DirectGov (payandworkrightscampaign.direct.gov.uk) has a main page devoted to the helpline.
To assess the success of the Pay & Work Rights helpline, the department commissioned a survey of the two main types of callers, workers and employers. The aim was to measure how the helpline had benefited callers in terms of:
• Increasing awareness and knowledge of rights in both workers and employers • Increasing employer compliance with current regulations, and • Reducing worker vulnerability and encouraging workers to take action on
problems.
1.2 Helpline management statistics As part of regular management and monitoring of the PWR helpline, the call centre collects administrative data (management information) from each call it receives. This data includes information such as the caller type, enquiry type, caller’s gender and age, nationality and some details of their business or workplace. The chart of call volumes below shows how calls to the helpline rose just after the service was launched but fell to just over 6,000 calls in December 2009 and January 2010, and picked up in February and March to about 8,000 calls. Since the end of the active marketing campaign in March, calls have eased back to around 5,000 calls per month. The further fall in call volumes in August probably reflects the onset of the quieter summer period.
5

Chart 1.1: Call levels to the Pay & Work Rights helpline
0
2,000
4,000
6,000
8,000
10,000
12,000
14,000
16,000
Sep-09
Oct Nov Dec Jan-10
Feb Mar Apr May Jun Jul Aug
Total Calls PresentedTotal Calls Answered
Source: PWR Management Information
Key headline statistics for the helpline taken from management information over the last year (September 2009 – August 2010) are presented below.
• The helpline was employing 9 advisors with a budget of around £950k a year, and recorded about 73,500 calls in its first year to August 2010 which the following statistics are based.
• Almost two thirds of callers were calling as workers, of which 5 per cent were
agency workers. 16 per cent called as employer and 12 per cent as third parties either on behalf of an employer or workers. The remainder were listed as unknown or other.
• 48 per cent of calls were resolved by the helpline and 4,500 complaints (6 per
cent of calls) were referred to enforcement agencies. The helpline was unable to help the caller at all (i.e. out of scope) in 8 per cent of calls and the remaining 38 per cent were signposted to Acas or another organisation.
• Over the last year, 85 per cent of calls were from England, then Scotland (8 per
cent), Wales (5 per cent) and Northern Ireland (2 per cent).
• The 5 most common industries callers were working in were administrative /office work (16 per cent); health, social work and child care (9 per cent); wholesale and retail trade (including garages) and construction and related trades (e.g. painting, decorating, electricians) (8 per cent each); and hospitality - hotels, bars, catering etc (7 per cent).
• Slightly more women (53 per cent) called the helpline than men (47 per cent).
However, when just considering worker callers slightly more men (51 per cent)
6

called the helpline than women. Almost 10 per cent were not UK-nationals but only 1 per cent of calls went to the language line.
• Over 46 per cent of callers had first heard of the helpline through the internet
either from direct.gov or another source. Other notable sources of awareness were Acas/CAB (9 per cent), radio (5 per cent), other media (7 per cent) and word of mouth (5 per cent).
• Calls related to HMRC and the NMW accounted for 32 per cent of these calls,
but 53 per cent were not allocated to any of the five agency/ issue categories according to management information. The remainder of calls were split roughly by HSE/Working time issues (6 per cent), EAS/Agency regulations (5 per cent) and DEFRA/Agricultural NMW (4 per cent).
• The average length of a call is about 6 minutes 32 seconds with average
waiting times of about 14 seconds. About 16 per cent of calls are made from mobile phones.
7

1.3 Helpline survey methodology In January 2010 the Department for Business, Innovation and Skills (BIS) commissioned TNS-BMRB to run a telephone survey of up to 800 ‘in-scope’ callers1 to the consolidated Pay & Work Rights Helpline. The survey was designed to provide a representative and statistically robust sample of the two main types of callers, workers and employers (81 per cent of callers over September 2009 – August 2010). It was originally intended that a sample of representative ‘in-scope’ callers would be drawn from the sample collected by the helpline and a period of about 4 weeks allowed to elapse between the call to the helpline and the timing of the interview in order to provide time for the problem or issue to have been progressed. However, as fewer details were obtained than originally envisaged and it took longer to collect a large enough sample neither of these options was feasible. Instead to maximise the sample available, all callers that had provided contact details were included in the sample frame. As a result, a small number of third parties and people who had details missing who would originally have counted as being out of scope were included in the survey.
The sample frame was collected by the call centre supplier (BSS) running the helpline in Manchester. Callers’ details were collected for four weeks from 18th January to 13th February 2010. During this period the helpline recorded 6,250 calls, of which 5,650 (90 per cent) of these calls the helpline was able to help the caller in some way. About 4,500 of these calls were made by employers or workers, the potential size of the population that a sample might be drawn from. The sample frame of agreeing participants was de-duplicated as some people had rung the helpline more than once over the recruitment period. In total contact details for all the 1,405 people who had provided this information formed the sampling frame, as fewer details were obtained than originally envisaged. The telephone survey was run using CATI (Computer Assisted Telephone Interviewing). In total 754 interviews were achieved from all contact details collected, a 54 per cent response rate. The fieldwork was conducted by TNS-BMRB between the 8th February and 7th March 2010 by a total of 13 different interviewers.
The Pay and Work Right helpline management information, described in the previous section, was supplied to TNS-BMRB and relevant data fields were matched through a unique identifier to the survey data for all of the respondents interviewed. The management information provided was sometimes not complete for all data fields and 18 respondents (2 per cent) from the survey could not be matched at all.
1 Originally callers were defined as being in-scope and eligible to take part in the survey if their query related to one of the five enforced rights and they were calling as a worker or employer. The limited number of calls recorded as related to the 5 enforced rights meant this definition was later amended to the helpline definition, where enquiries were in-scope if the helpline was able to offer information, advice and help including signposting to other helplines and Acas transfers. People calling on behalf of a third party, including callers from intermediary organisations, were still considered to be out of scope for survey purposes.
8

The management information for all callers over the sample frame period was also supplied and used to assess to what extent the survey of callers was representative of all the in-scope callers in the survey period, the population. Few differences between the sample and population were found but weighting was applied to rectify small differences in the sample like employer respondents (10 per cent in the survey compared with 16 per cent in the population), respondents with ‘non-classified’ enquiries (42 per cent in the survey compared with 54 per cent in the population). There were also a small number of suspected third party callers2 who managed to get into the sample (5 per cent in the sample) which were retained as workers but not included in the weighting schema.
1.4 Report structure The main findings from the telephone survey are presented in three chapters covering:
Chapter 2: Perceptions and preferences, where general satisfaction with the helpline in a number of areas is explored along with the route taken to contacting the helpline.
Chapter 3: Caller journey, where the relationship between a caller’s enquiry, the helpline response and post-call activity is investigated using not only data from the survey but also helpline management information and BIS’ Fair Treatment at Work Survey, a representative sample of problems in the workplace.
Chapter 4: Callers characteristics, briefly looks at the type of employer who called the helpline and in more detail the kind of workers; with again reference to BIS’ Fair Treatment at Work Survey to understand what level of ‘vulnerable’ workers are attracted to call the helpline.
The report will tend to focus on workers as so few employers were interviewed in the survey to make many robust statements about their results, but as far as is possible, employer results are included. Throughout the report, survey respondents who did not state a response to a question are excluded from the analysis and only statistically significant results are presented unless otherwise stated.
2 These were identified as third party callers in matched data from the helpline management information used to weight the dataset, but these survey respondents identified themselves as ‘workers’ in the survey.
9

2. Perceptions and preferences This chapter begins to look at the caller’s experience of the Pay & Work Rights Helpline through a number of attitudinal questions asked in the survey ranging from callers’ general satisfaction with the service to how they rated the information they received and the agent they spoke with on the phone. The chapter continues to use the survey data to understand the preferences of callers in going about answering their enquiry; especially as almost half of callers (46 per cent) who had first heard of the helpline through the internet.
2.1 Caller satisfaction The satisfaction levels of callers interviewed was generally very high. Of the 754 callers sampled, 89 per cent were extremely (24 per cent), very (37 per cent) or fairly satisfied (28 per cent) with the service they received from the helpline. There was no significant difference between workers and employer survey respondents. There were also very few significant differences between other characteristics of the workers and employers sampled, except:
• women workers were more likely to be satisfied than men, 93 per cent compared with 85 per cent.
• workers with a disability or long-term illness were also more likely to be satisfied than those without such a condition, 94 per cent compared with 88 per cent.
• Workers and employers of smaller workplaces (less than 50 people), 91 per cent compared with 85 per cent in larger workplaces.
• Finally, those who heard about the helpline from the radio were less likely to be satisfied (77 per cent) compared with those callers who heard about the helpline from another source.
These results are illustrated in Chart 1.2 with two other results worth mentioning:
• Both workers and employers with enquiries related to pay or working time, the main focus of the helpline, were almost equally satisfied with the helpline at 90 per cent and 93 per cent respectively
• Those who were signposted to another organisation (i.e. Acas) were also similarly satisfied with the helpline at 87 per cent.
The sample was smaller for employers (80 completed interviews) so it was difficult to say whether any differences found were truly significant.
10
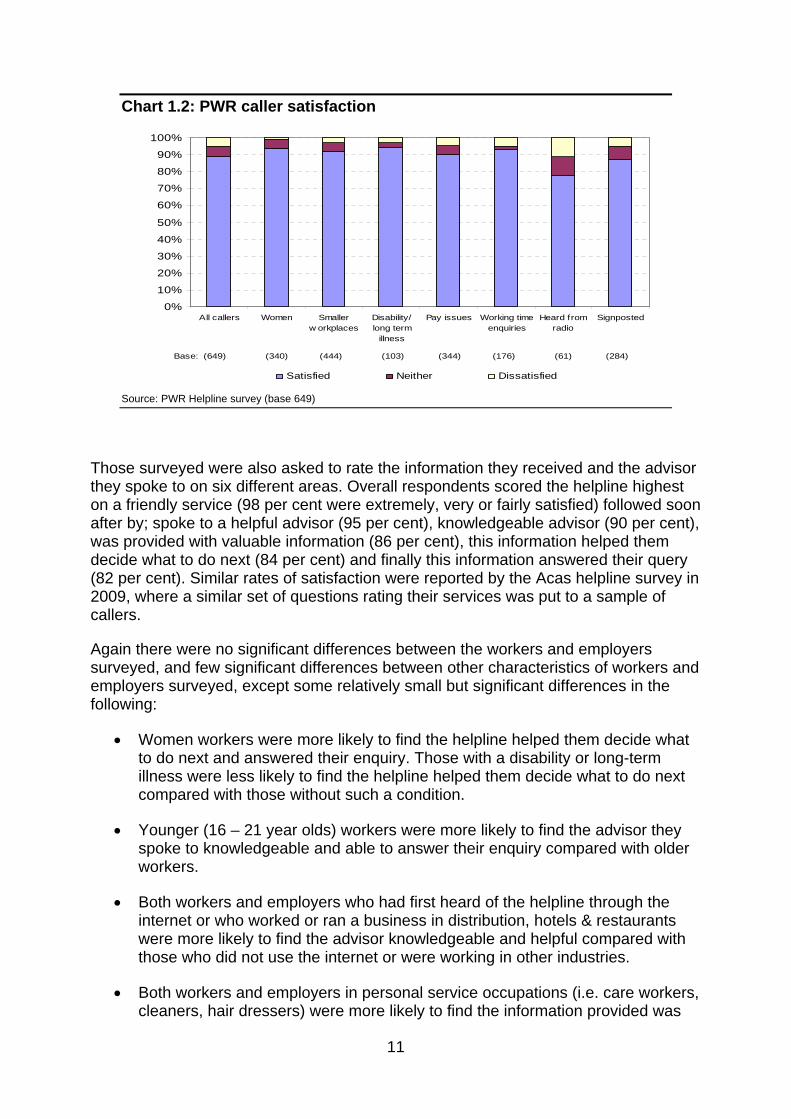
Chart 1.2: PWR caller satisfaction
0%
10%
20%
30%
40%
50%
60%
70%
80%
90%
100%
All callers Women Smallerw orkplaces
Disability/long term
illness
Pay issues Working timeenquiries
Heard fromradio
Signposted
Satisfied Neither Dissatisfied
Base: (649) (340) (444) (103) (344) (176) (61) (284)
Source: PWR Helpline survey (base 649)
Those surveyed were also asked to rate the information they received and the advisor they spoke to on six different areas. Overall respondents scored the helpline highest on a friendly service (98 per cent were extremely, very or fairly satisfied) followed soon after by; spoke to a helpful advisor (95 per cent), knowledgeable advisor (90 per cent), was provided with valuable information (86 per cent), this information helped them decide what to do next (84 per cent) and finally this information answered their query (82 per cent). Similar rates of satisfaction were reported by the Acas helpline survey in 2009, where a similar set of questions rating their services was put to a sample of callers.
Again there were no significant differences between the workers and employers surveyed, and few significant differences between other characteristics of workers and employers surveyed, except some relatively small but significant differences in the following:
• Women workers were more likely to find the helpline helped them decide what to do next and answered their enquiry. Those with a disability or long-term illness were less likely to find the helpline helped them decide what to do next compared with those without such a condition.
• Younger (16 – 21 year olds) workers were more likely to find the advisor they spoke to knowledgeable and able to answer their enquiry compared with older workers.
• Both workers and employers who had first heard of the helpline through the internet or who worked or ran a business in distribution, hotels & restaurants were more likely to find the advisor knowledgeable and helpful compared with those who did not use the internet or were working in other industries.
• Both workers and employers in personal service occupations (i.e. care workers, cleaners, hair dressers) were more likely to find the information provided was
11

valuable to them and answered their enquiry compared with other occupations. Those workers and employers in small workplaces (less than 50 people) were also more likely to find the information provided was valuable to them compared with those in larger workplaces.
The sample was smaller for employers so it was difficult to say whether any differences found were truly significant.
All the employers surveyed said they would use the helpline again if they had other enquiries related to employment issues. No information on this was collected from workers, but 90 per cent of workers said they would recommend the helpline to a friend or work colleague, again women (93 per cent), those in personal service occupations (i.e. care workers, cleaners, hair dressers) and small workplaces were more likely to say so. Similarly, 89 per cent of employers said they would recommend the Pay & Work Rights helpline to a friend, colleague or another employer.
2.2 Caller preferences The survey asked a number of questions about whether the callers had accessed the internet to search for their enquiry before calling the helpline, in particular whether they had visited the direct.gov or businesslink.gov websites. We know from the management information around 46 per cent had first heard of the helpline from the internet (Section 1.2) and the survey probed in more detail the reasons for calling the helpline after searching online.
Of the 754 callers interviewed for the survey, 86 per cent said they had access to the internet either at home (84 per cent) or at work (38 per cent). There was little difference between employers and workers access, except employers were more likely to have internet access at work (60 per cent) compared with workers (34 per cent).
Of the callers interviewed with internet access, 65 per cent had looked on the internet to try and resolve their query (56 per cent of all respondents). Clearly more than just those who had first heard of the helpline through the internet went online to search for their query. Of those who had internet access but did not make use of it for their enquiry, 10 per cent of callers said they preferred to speak to someone when possible and the remainder had ‘another reason’ for calling the helpline instead of searching on the internet first.
Additionally 85 per cent of those who looked on the internet to try and resolve their query visited the ‘direct.gov’ website or almost half of all respondents (48 per cent). The most common reason given for why respondents called the helpline after visiting the ‘direct.gov’ website was they wanted additional information not available on the website (73 per cent). Other reasons given were respondents visited the website to get the helpline’s phone number (68 per cent), wanted to double check the website information with the helpline (58 per cent) and that they couldn’t find the information on ‘direct.gov’ (39 per cent). There were no significant differences between the workers and employers surveyed or any significant differences between other characteristics of these groups; partly due to the small sample sizes involved.
12

2.3 Summary Caller satisfaction
• Overall caller satisfaction is very high, 89 per cent of callers surveyed were extremely, very or fairly satisfied with the service they received from the helpline
• Certain groups reported better satisfaction than others, in particular women workers and small business employers and workers employed in smaller workplaces.
• A similar proportion of both employers and workers (90 per cent) said they would recommend the service to a friend or colleague. All the employers surveyed said they would use the helpline again if they had other enquiries related to employment issues
Caller preferences
• 86 per cent of callers said they had access to the internet.
• Over half of callers (56 per cent) had searched the internet before calling the helpline, while almost half of callers (48 per cent) accessed ‘direct.gov’ specifically.
• Most rang the helpline after visiting the website because they wanted additional information not available there (73 per cent) and other reasons given were to get the helpline’s number (68 per cent), double check website information (58 per cent) and when they couldn’t find the information there (39 per cent).
13

3. Caller journey This chapter characterises the common enquiries callers come to the helpline with and contrasts this to type of problems found in the general worker population, as surveyed by BIS’ Fair Treatment at Work Survey. This is followed by how the helpline deals with these common enquiries and finally what callers said they planned to do or did with this information and advice.
3.1 Common enquiries to the helpline As described in Chapter 1, the helpline is set-up to deal with issues related to five specific employment rights and related regulations; the National Minimum Wage (NMW), the agricultural NMW, rights related to working time, employment agency and gangmasters regulations. Nevertheless the helpline attracts callers with issues touching on a range of other employment rights. Within the survey, respondents were asked ‘…tell me briefly why you rang the Pay and Work Rights helpline?’ These responses were categorised into common areas and are presented in Table 3.1.
Even when using the survey, answering what proportion of calls fell specifically within the 5 enforced rights covered by the helpline is difficult to ascertain. Helpline management information at the time, in Section 1.2, reported 54 per cent of in-scope enquiries were labelled ‘unclassified’, i.e. only 46 per cent of calls related to the 5 areas. If the management information is to be believed, even looking at enquiries in the survey closely matching the five areas shows a significant amount of ‘unclassified’ cases when matched back to this management information. For example, enquiries related to minimum wage issues (17 per had ‘unclassified’ status according to management information), not working 48+ hours a week (45 per cent) and the working time directive (29 per cent). In most instances the proportion of enquiries with ‘unclassified’ status was over 50 per cent. For this reason the enquiry categories presented in Table 3.1 were not constructed with the five enforced rights in mind. But how these enquiry categories maps onto the way the helpline management information classifies them is discussed further in Annex A.
Table 3.1 shows 53 per cent of caller’s enquiries were related to pay which was by far the largest grouping of issues. This was followed by working time issues (27 per cent), then a range of issues not so closely related to the five enforced rights like redundancy, dismissal and disciplinary (10 per cent), contractual issues, tax and benefits (both 6 per cent) and issues related to other rights or laws (9 per cent); and finally one related more closely to the helpline’s remit, agency regulations (4 per cent). Interestingly there are few significant differences between enquiries from employer and workers, except more workers than employers called about redundancy, dismissal and disciplinary action and agency regulations, while employers tended to call more about tax and benefits and other issues related to rights or laws. It is worth noting only one survey respondent mentioned health and safety in their description of their enquiry (as part of their main enquiry on breaks at work); and no survey respondent mentioned gangmasters, which is hardly surprising as according to helpline management information there were only 13 related enquiries during the survey period.
14

Table 3.1: Callers enquiries by main area Percentage of all survey respondents
Helpline enquiries1 Problems
Category All Employers Workers Workers2 Pay 53 50 54 37Minimum wage issues 12 16 12 -Non-receipt of pay 9 - 10 -Salary / pay issues (other mentions) 7 8 7 -Reduction/deductions in pay 6 - 7 -Sickness/ sick pay 6 14 4 -Other pay issues 17 15 18 - Working time 27 21 27 25Holiday entitlement/ pay 11 12 11 -Working hours issues 10 5 11 -Not working 48+ hours 6 6 6 -Other working time issues 5 5 5 - Redundancy, dismissal & disciplinary 10 1 12 23 Other 9 17 7 24Information about rights / laws 5 7 5 -Other rights issues 4 10 3 - Contractual issues 6 5 6 11 Tax & benefits 6 10 5 -Tax and National Insurance issues 5 10 4 -Other tax & benefits issues 1 - 1 - Agency regulations 4 1 4 - Misc. / don’t know / not listed 6 8 6 - Note: Totals do not sum to 100 because survey respondents enquiries or problems could be classified under more than one category. '-' = data not available. Source: (1) PWR Helpline survey, Q1 2010; (2) BIS’ Fair Treatment at Work Survey, Q6.1 2008. Base: (1) All UK respondents (unweighted base = 754); (2) GB workers experiencing the most serious problem with their employment rights in the last 5 years excluding Health & Safety issues (unweighted base=862)
15

To put these calls into context, we choose as a comparator the 2008 Fair Treatment at Work Survey (FTWS)3 which measures the most serious employment problem experienced by workers, i.e. currently in paid work or had been in the last 2 years, across Great Britain. Of the 4,000 current or recent workers interviewed as part of this survey, 21 per cent with a problem at work selected one involving employment rights as the most serious instance of a problem experienced in the last 5 years. The distribution of these problems is presented in the final column of Table 3.1. Unfortunately no appropriate dataset comparator of employer problems or issues with employment rights is available.
While the comparison between helpline enquiries and problems reported in the FTWS is by no means perfect, it is considered worthwhile to try to understand what enquiries are attracted to the helpline in contrast to the general pool of employment problems, especially when considering the five enforced rights. There are a couple of methodological points to note in making this comparison. First, the FTWS sought to measure a most serious instance of a problem in the workplace over a 5 year period as at Sep - Dec 2008 when the survey was run. While the helpline survey represents callers at a particular snapshot in time with enquiries during Jan – Feb 2010 that were not necessarily problems. There is also the different geographical coverage the PWR survey covered the UK whilst the FTWS just covered Great Britain. For convenience, this minor difference (only 2 per cent of sample) is ignored in this chapter but accounted for in analysis presented in Chapter 4.
Second, the FTWS was designed to systematically check through specific employment rights (including health and safety) and ask whether a problem had been experienced in each with a most serious instance later being selected, while the helpline survey represents callers with enquiries by their nature meeting a more open definition of employment rights (i.e. tax and benefits) with the classification of the enquiry captured in a less structured way. To ensure a better match between the two surveys, problems with health & safety (outside of working time) were excluded from the FTWS data presented in the table; as clearly callers were not calling the helpline with such enquiries and this area is generally outside the remit of the helpline, but no other adjustments were made. How the categories of employment rights asked in FTWS were grouped to compare with the helpline survey data is presented in Annex A.
Finally, in the FTWS only about a third of respondents with a most serious problem sought advice from an external provider (i.e. Acas, CAB etc.) so differences between the two surveys should not be completely judged as the potential demand/supply gap for helpline services. The main reason those with a problem who sought external advice is not chosen as a closer comparator to helpline callers is it would mean looking at a much smaller sample. However separate analysis shows little difference in which problems survey respondents did or didn’t choose to seek external advice on. The only exceptions being that those with a problem with working time were less likely to seek external advice (21 per cent with this problem) and those with redundancy, dismissal and disciplinary problems more likely (59 per cent).
3 Fevre, R., Nichols, T., Prior, G., Rutherford, I. (2009) Fair Treatment at Work Report: Findings from the 2008 survey. Employment Relations Research Series No. 103. http://www.berr.gov.uk/files/file52809.pdf
16

With the caveats listed above in place, we find the distribution between helpline enquiries and problems in the worker population are naturally different, but in terms of rank pay and working time issues come to the fore in both sources. As we might expect enquiries to the helpline on issues outside of the five enforced rights like redundancy, dismissal and disciplinary action, contractual and other rights are far fewer in scale than problems with these issues found in the worker population. While there were too few cases in the FTWS with a most serious problem related to agency regulations to make a comparison with helpline enquiries, one might expect these enquiries and those related to pay to be over represented in helpline calls as the previous helplines taking those enquiries were well-established, and in the latter better publicised.
Chart 3.1 shows the distribution of callers and those workers with a problem by main problem areas. The majority of callers had enquiries on pay and working time and these accounted for around 75 per cent of all calls. This was higher than the wider worker population with a problem (almost 60 per cent). Callers had a higher proportion of pay related problems (54 per cent) compared with those in the worker population (37 per cent) and working time related problems with callers accounting for 27 per cent whilst the worker population had 25 per cent.
Chart 3.1: Callers and workers by main problem area
0
10
20
30
40
50
60
Pay
Wor
king
time
Red
unda
ncy,
dism
issa
lan
ddi
scip
linar
y
Oth
er
Con
tract
ual
issu
es
Age
ncy
regu
latio
ns
Mis
c. /
don’
tkn
ow /
not
liste
d
Per
cen
t
PWR FTWS
Source: PWR Helpline survey (GB base 649) and Fair Treatment at Work survey 2008 (GB base 862)
Table 3.2 looks at the data in the last table slightly differently by separating single issue (i.e. relates to one category only) and multiple issue enquiries and problems. Clearly most enquiries relate to a single issue (82 per cent) and more so for employers than workers. The most common multiple issue enquiries relate to pay and working time issues (6 per cent) or pay with another issue involved (7 per cent). A more efficient and coherent approach to dealing with multiple issue enquiries was one of the stated benefits of bringing the enforcement bodies own helplines together into this single helpline. A comparison with problems in the worker population shows a similar story to the previous table. The split between single and multiple issue enquiries was very close to that observed with problems in the worker population from the FTWS.
17

Table 3.2: Caller enquiry by issue area Percentage of all survey respondents
Enquiries1 Problems
Category All Employers Workers worker
population2 Single issue 82 87 81 85of which: Pay 40 40 40 29 Working time 17 18 17 17 Redundancy, dismissal & disciplinary 7 - 8 15 Other 7 14 6 16 Contractual issues 4 4 4 7 Misc. / don’t know / not listed 4 5 3 - Tax & benefits 3 5 3 -
Multi-issue 18 13 19 15of which: Includes pay and working time 6 4 7 3 Includes pay but NOT working time 7 6 7 5 Includes working time but NOT pay 3 - 4 4 Any other combination 2 - - 2 '-' = not available or unreliable Source: (1) PWR Helpline survey, Q1; (2) BIS’ Fair Treatment at Work Survey, Q6.1 2008. Base: (1) All respondents (unweighted base = 754); (2) GB workers experiencing the most serious problem with their employment rights in the last 5 years excluding Health & Safety issues (unweighted base=862)
Despite the methodological differences between the two sources, what does this tell us? Pay and working time are clearly the most common problem experienced but despite the Pay & Work Rights helpline’s name and remit, it’s difficult to judge from this evidence whether it is best placed to deal with the many issues relating to pay or working time identified in the survey as many appear to be outside the margins of the National Minimum Wage and the right not to work more than 48 hours a week (on average). Clearly problems with other employment rights are important and while the helpline is not targeted specifically to deal with these, there is evidence of a large number of callers are contacting the helpline for assistance. We explore in the next section how the helpline deals with these calls.
3.2 Helpline response In the last section we categorised the common enquiries callers made to the helpline, we move to understand how the advisor dealt with the call, matching the survey data to the helpline’s management information. Table 3.3 shows this information.
The first point to note is despite the survey design a small number of out of scope callers were interviewed for the survey, but less than 2 per cent (9 respondents of the sample) compared with the 8 per cent level recorded in the management information (Section 1.2). There were also a small number of survey respondents who could not be matched back to the helpline’s management information shown in the table.
18

The second point is the high level of signposting, in our sample 53 per cent of all enquiries get signposted to Acas or another organisation; or 56 per cent of in-scope calls i.e. excluding out of scope and non-matched cases. By excluding these calls this arguably creates a more valid definition, as out of scope calls can’t be signposted and additionally this removes the main difference between the survey and management information. Indeed the rate over the year is lower than the survey suggests between Sep 2009 – Aug 2010 the management information shows 42 per cent of in-scope calls were signposted. While the management information covering the survey period shows signposting was at 53 per cent of in-scope calls (just 3 per cent difference from the survey), suggesting the timing of the survey had an effect on the signposting rate observed.
Table 3.3: Caller enquiry by helpline outcome Percentage of all survey respondents
Outcome recorded by the helpline Signposted to
Category
Resolved by the
helpline
Passed to an enforcement
body Another organisation ACAS
Out of scope
Non-match Total
Pay 40 12 33 12 - - 100 Working time 35 3 43 12 - - 100 Redundancy, dismissal & disciplinary 15 5 56 23 - - 100 Other 42 3 43 6 - - 100 Contractual issues 22 2 42 24 - - 100 Tax & benefits 22 2 68 7 - - 100 Agency regulations 39 39 18 0 - - 100 Misc. / don’t know / not listed 33 6 40 17 - - 100 Total 34 8 40 13 - - 100 Unwgt. counts (320) (86) (238) (82) (9) (18) '-' = not reliable Source: PWR Helpline survey / BSS administrative data Base : All respondents that were asked Q1 (unweighted base = 754)
Clearly however you look at the figures a significant proportion of callers to the helpline are signposted to another organisation to resolve their enquiry. More interestingly is how this varies by category of enquiry, clearly issues not entirely covering the five enforced rights are more likely to be signposted elsewhere, calls related to redundancy, dismissal and disciplinary (79 per cent); tax & benefit (75 per cent) and contractual issues (66 per cent) the most likely. Calls related to pay, working time and other information or rights issues follow with 45 per cent, 55 per cent and 49 per cent respectively being signposted elsewhere. Although based on a small number of calls, only 18 per cent of calls on agency regulations are signposted elsewhere and these enquiries were more likely to be referred to an enforcement body (39 per cent).
19

Other noticeable results are calls related to redundancy, dismissal and disciplinary (23 per cent) and contractual issues (24 per cent) are more likely to be signposted specifically to Acas. This is not surprising as these are areas Acas tends to specialise in, according to their own helpline survey in 2009 the most common enquiry to their helpline involved discipline, dismissal and grievance issues (41 per cent), contractual (41 per cent) and redundancy, lay-offs and business transfers (35 per cent). While enquiries to the Acas helpline on wages and NMW (16 per cent) and holidays and working time (22 per cent) were lower.
What is interesting from these results is the fact that a call is more likely than not to end in a signpost to another organisation, makes the satisfaction levels discussed in Section 2.1 seem very high. Could it be that callers genuinely appreciate a single point of contact for their employment related enquiries, even if it is only to be directed to another reputable source of advice? This is something we will explore further in the next section.
3.3 Post-call activity From understanding what happened during the call, we look to what the callers did next. The survey asked respondents, “following your call to the Pay and Work Rights helpline, what further options have you pursued or are planning to pursue?” Employer and worker responses were coded separately and the main activities are presented in Table 3.4 below.
For employers, the most common response was either the problem or enquiry was now resolved as a result of the helpline call (27 per cent) or they had verified information they were uncertain of (27 per cent) with 19 per cent with this purpose alone and 8 per cent doing this in conjunction with other activities listed. This was followed closely by the response that they sought or were seeking advice or assistance from another body (26 per cent), and 10 per cent were doing this along with another activity. The remainder was made up of 24 per cent who took action to ensure compliance or implement a new policy and 11 per cent had done something else. Unfortunately the sample size was too small to robustly present how these activities differed by any of the employers’ characteristics.
Blackburn and Hart (2002) in their survey of small employers’ awareness and detailed knowledge of individual employment rights found most small employers approached compliance with employment rights on a need to know basis. They argued under certain structural conditions employers will be more at risk to having to deal with employment rights, i.e. if they employed women more likely to deal with family friendly rights like flexible working. They found the most important sources of advice and information for employers on employment rights were accountants, solicitors and then government departments. In this context the verification that the helpline was able to provide or the signposting to other organisation becomes an important activity in helping small businesses ensure they are compliant. Interestingly the research also found no relationship in use of or satisfaction with sources whether or not firms had to pay for this advice. The helpline currently uses a free phone number.
20

Table 3.4: Callers enquiries by post call activity Percentage of worker/employer survey respondents
Enquiries1
Post-call activity Employers Workers Single activity 88 83of which:
Problem or enquiry was solved 27 14Verified information 19 -Took action to ensure compliance 13 -Other 11 5
Seeking advice from external body suggested or enforcement/ further guidance from helpline - 25Discussed or being dealt with by employer - 18Seeking advice from another external body 16 6Discouraged from action or left employer - 8Still waiting or researching information - 7
Mutiple activity3 12 17of which includes (i.e. overlapping groups):
Took action to ensure compliance 11 -Seeking advice from another external body 10 7Verified information 8 -Seeking advice from external body suggested or enforcement/ further guidance from helpline - 15Discussed or being dealt with by employer - 10
'-' = not applicable
Source: (1) PWR Helpline survey (Q9 & 10a. + b.) Base : All respondents (unweighted workers=674, unweighted employers=80)
For workers, the most common response was 40 per cent said they were seeking advice or enforcement action as suggested by the helpline (i.e. usually with an external body), with 25 per cent pursuing this activity alone and 15 per cent doing this in conjunction with another activity like discussing with their employer or seeking information from an external body not suggested by the helpline; which were the next most popular activities stated at 28 per cent and 13 per cent respectively. In comparison with employers, only 14 per cent of worker callers stated the problem or enquiry was solved as a result of the call. Finally, 10 per cent of workers were discouraged in some way from taking further action (or had left their employer) post-call and 8 per cent were still waiting for or researching additional information.
Making comparisons as we did in the last section with respondents with a most serious problem with their employment rights from the Fair Treatment at Work survey is more difficult here. The helpline survey was designed to give a view of the enquiry and further steps the caller was taking at a snapshot in time, whilst the FTWS looked more systematically at what kinds of advice/information had been sought and what
21

actions taken to resolve a most serious problem experienced in the last 2 years. While we know only about a third of those with a most serious employment rights problem in the FTWS sought advice from an external provider (like Acas, CAB), we know most had already started their search for information or advice from a workplace source or even taken some action to resolve the problem. This is demonstrated by 94 per cent reported to have discussed the problem with their employer, compared with 75 per cent who had not sought external advice. A quarter of those who sought external advice also sought further advice from a second external provider. Regardless of whether they had or hadn’t sought external advice, the current status of problems was roughly split into three equal shares; the problem either being ongoing, successfully resolved or those discouraged from action or had left their employer.
Most likely because of the short length of time between a call made to the helpline and being interviewed for the survey, the FTWS figures clearly differ from the helpline survey where the majority (47 per cent) are still seeking advice from another external body or further guidance / enforcement action from the helpline. By far the majority of problems were ongoing and only 28 per cent had or were planning to discuss the problem with their employer after their call.However, they may have done this before the call. Nevertheless in terms of activity, there are clear differences between the surveys.
Again unfortunately the small sample size of employers in the survey makes it difficult to proceed with further analysis. At this stage we switch to focus on workers and compare what kind of activities went with the call outcomes and enquiry type that were discussed in the last section.
The next table, Table 3.5 looks at the relationship between the way the call to the helpline was left and the activity taken afterwards. Looking across the rows, there are some noticeable trends. Note the columns do not sum to 100, as callers were able to say they were pursuing or had pursued more than one action (apart from the problem being solved as a result of the helpline call). Calls signposted to another organisation or Acas are more likely to be seeking advice from an external body or enforcement action as suggested by the helpline (46 per cent) and less likely to discouraged from action or had left their employer (6 – 7 per cent). In particular, those signposted to Acas were more likely to be discussing the issue with their employer (43 per cent). A similar result was found in Acas’ own helpline survey in 2009 where callers were most likely to discuss the problem with management post-call followed by applied/ implemented changes recommended by Acas and seeking advice or assistance from another body.
Whilst those callers whose enquiry was passed to an enforcement body were more likely to be waiting for additional information (25 per cent) and the enquiry was less likely to be solved (3 per cent). Finally for calls said to be resolved within the helpline call, while such callers were more likely to say their enquiry had been solved (20 per cent), the majority were still taking some form of action to resolve their problem and some were more likely to feel discouraged from taking further action or had left their employer as a result of the issue (16 per cent).
22

Table 3.5: Outcome of callers enquiries recorded by the helpline by post-call activity
Percentage of worker respondents Outcome recorded by the helpline
Signpost to
Post-call activity
Resolved by the
helpline
Passed to an
enforcement body
Another organisation ACAS
Out of
scope Other All Seeking advice or enforcement action as suggested by helpline 29 37 46 46 - - 40 Discussed or being dealt with by employer 25 17 27 43 - - 28 Problem or enquiry was solved 20 3 11 13 - - 14 Seeking advice from another external body 11 11 18 11 - - 13 Discouraged from action or left employer 16 10 6 7 - - 10 Still waiting for or researching additional information 8 25 6 2 - - 8 Other 6 8 7 3 - - 6 Total1 115 111 119 125 - - 118
Unweighted counts (268) (81) (220) (81) (8) (16) (674)
'-' = not available or unreliable
Note: (1) Total do not sum to 100 because respondents were able to list multiple actions they had taken or were planning to take after their call to the helpline Source: PWR Helpline survey (Q9a. & b.) / Helpline administrative data Base : All worker respondents (unweighted=674, weighted=642)
The final table in this chapter, Table 3.6 looks at whether the enquiry category makes any difference to what activity was pursued after the call to the helpline. Again looking across the rows, there are some noticeable trends. Note neither the rows nor columns sum to 100, as callers were able to say they were pursuing or had pursued more than one action (apart from the problem being solved as a result of the helpline call) and their enquiry could fall into more than one category.
23

Table 3.6: Caller enquiry by post-call activity Percentage of worker respondents
Category
Post-call activity Pay Working
time
Redund-ancy,
dismissal &
disciplinary Other
Contract-ual
issues Tax &
benefits Agency
regulation
Misc. / don’t
know / not
listed Seeking advice from external body suggested or enforcement/ further guidance from helpline 41 40 49 36 47 44 34 33 Discussed or being dealt with by employer 25 31 27 33 26 13 17 31 Problem or enquiry was solved 14 17 10 10 17 6 7 14 Seeking advice from another external body 15 10 11 15 9 25 12 27 Still waiting or researching information 9 5 4 3 6 18 12 4 Discouraged from action or left employer 8 9 15 10 5 3 18 9 Other 6 8 7 10 0 0 12 3 Total 118 120 122 117 110 109 112 120 Unweighted counts (383) (193) (65) (48) (35) (25) (29) (39) Source: PWR Helpline survey (Q1 and Q9a. + b) Base : All worker respondents (unweighted=674, weighted=642)
Enquiries with agency regulations and tax and benefits stand out as having different patterns of post-call activity than the other enquiry categories. There is of course the issue that both are based on relatively small sample sizes that make the data more volatile, nevertheless one can make an informed view that something else is driving these differences. For example, agency regulations have more callers either still waiting for information, and more discouraged from taking action or who had already left their employer. We know more of these enquiries fall into the enforcement action category than other enquiries from the last section, so these activities are more likely. Add to this, people with these enquiries are less likely to discuss the issue with their employer or state the enquiry is now resolved.
24

The same is almost true for tax and benefit enquiries, except they are less likely to be discouraged from taking action or leaving their employer and more likely to be seeking advice from an external body not suggested by the helpline. Other noticeable patterns are that people with enquiries about contractual issues are less likely to be discouraged from action or left their employer but enquiries with redundancy, dismissal and disciplinary are more likely because the nature of problem meant they would have left their employer. Both enquiries have greater numbers seeking advice from an external body as suggested by the helpline. Finally, pay enquiries shows greater number of callers still waiting for or researching information.
Ultimately timing comes into play with these results; we know from the Fair Treatment at Work that problems related to pay take a shorter time to resolve than problems with a contract, disciplinary issues and working time. The survey interviewed callers perhaps too soon after a call for the issue to be sufficiently progressed, which is why 72 per cent were either currently discussing this issue with an employer, in contact with an external organisation about the issue or waiting for some information to progress the issue. This should be borne in mind when interpreting these results.
3.4 Summary Common enquiries to the helpline
• Over half of enquiries (53 per cent) to the helpline are related to pay. Other issues involved are:
o Working time (27 per cent),
o Redundancy, dismissal and disciplinary (10 per cent),
o Other information or right issues (9 per cent)
o And contractual (6 per cent), tax & benefits (6 per cent) and agency regulations (4 per cent).
• A similar ranking is observed in the problems of worker population, as provided by BIS’ 2008 Fair Treatment at Work Survey (FTWS); but with helpline calls overrepresented in pay and agency regulations enquiries but underrepresented in other areas.
• One of the expected benefits of the helpline was that it could deal efficiently and coherently with multiple issue enquiries. In practice, 18 per cent of enquiries include more than one of the categories listed above. This is a result also observed in the problems of the worker population from FTWS 2008.
Helpline response
• More than half (56 per cent) of in-scope enquiries were signposted to Acas or another organisation. While the survey seems have run at a slightly higher time for signposted cases than normal (rate of signposting in-scope calls across the year was about 42 per cent).
25

• Enquiries not related to pay and agency regulations are more likely to signposted. Contractual enquiries and those related to redundancy, dismissal and disciplinary are more likely to be signposted to Acas than are other types of enquiry. About 8 per cent of calls were passed to an enforcement body.
Post-call activity
• Employer post-call activity was split almost equally between the problem or enquiry was now resolved (27 per cent), the call had sought to verify information they were uncertain of (27 per cent), they were seeking advice from another organisation (26 per cent) and finally they had taken action to ensure compliance or implemented a new policy (24 per cent). There being some overlap between these categories.
• Due to the short length of time between a call made to the helpline and interview for the survey; workers were still seeking advice from external body or enforcement action as suggested by the helpline (40 per cent). This was followed by discussing the issue with their employer (28 per cent), the problem was solved (14 per cent) and seeking advice from another organisation (13 per cent). Additionally, 10 per cent were discouraged from taking action or had left the employer and 8 per cent were still waiting for or researching additional information. There again being some overlap between these categories.
26

4. Caller characteristics This final chapter explores in detail the individual, job and workplace characteristics of the worker respondents to the helpline survey. The focus of this chapter is on workers rather than employers as they represent the majority of callers to the helpline. As a result, fewer characteristics are available to describe the employers surveyed and the sample was smaller than workers. Additionally, like in Chapter 3, comparisons are made where possible with the 2008 Fair Treatment at Work Survey (FTWS) which measures the most serious employment problem experienced by workers, i.e. currently in paid work or had been in the last 2 years, across Great Britain. Unfortunately there is no equivalent source for employers.
The biggest benefit of making comparisons with the FTWS is to understand whether the ‘vulnerable’ workers, in terms of those who are more likely to experience problems at work, are being attracted to call the helpline. Some of the vulnerable workers identified in the main report and the recent analysis of the survey by Bewley and Forth (2010) are young people, those with a disability or long-standing health problems, with more than one job, workplaces without an equal opportunities policy and gay/lesbian or bisexual workers. Most of these additional characteristics, except for the last, were collected in the survey when not available in the matched management information. These characteristics and more are explored in the following sections.
As described in Chapter 1, the management information matched to the survey responses sometimes includes missing values but analysis is presented here in terms of valid responses. Additionally, 18 survey respondents (2 per cent of the sample) could not be matched to this information and these cases are excluded from the comparisons in this chapter. And in order to ensure a better match with FTWS which relates only to workers in Great Britain, those callers sampled from Northern Ireland (2 per cent) were also excluded.
4.1 Workplace characteristics We begin by focusing on the workplace characteristics of the callers surveyed. Here some additional characteristics were collected from employer respondents and the main findings were:
• 86 per cent of employer callers were businesses with less than 50 workers;
• 78 per cent were in managerial/ professional or intermediate occupations
• 35 per cent were in administrative and support services or health and social services
• about 60 per cent had been in operation more than 5 years;
• 74 per cent did not have a HR or personnel department
• and 33 per cent did not have an equal opportunities policy.
27

Blackburn and Hart (2002) in their survey of small employers’ awareness and detailed knowledge of individual employment rights found only one-fifth of employers felt confident or very confident about their knowledge of employment rights. Their analysis showed that most, if not all, employers address employment regulations and their detail on a need to know basis. They found there was only little indication that a raised awareness was a result of the higher prevalence of a dedicated personnel function in the larger enterprises. Some of the characteristics above match the kind of businesses known to struggle with employment regulations.
For worker respondents, Chart 4.1 shows the distribution of callers and workers with problems from the helpline by sector. Nearly three quarters (72.1 per cent) of callers work in the private sector. This is similar to those in the worker population who had experienced a most serious problem at work in the last 5 years as defined by the FTWS 2008; and this is also in line with the working population generally. Although the proportion of callers who work in the third sector were small in both surveys, the share of those in the worker population with a problem were nearly double those of callers.
Chart 4.1: Worker callers with a problem by sector
0
10
20
30
40
50
60
70
80
Private Public Third sector
PWR FTWS
Source: PWR Helpline survey (base 620) and Fair Treatment at Work survey 2008 (base 840)
Chart 4.2 shows the proportion of workers who called the helpline and who experienced a problem by industry. The highest proportion of callers was in distribution, hotels and restaurants (22.8 per cent) and this was followed by public administration, education and health (18.6 per cent) and the financial services (16.6 per cent). Workers with problems were also concentrated in the same top three sectors (accounting for around 60 per cent) albeit in a slightly different order. In both surveys, respondents who experienced employment rights problems were least likely to be working in the energy and agricultural sectors. However these results are hardly surprising as they are in line with the distribution of the GB working population across industries generally. It is worth noting that around two thirds of callers who were classified as working in the public administration, education and health sector saw themselves as private sector workers compared to only a third for workers with a problem.
28

Chart 4.2: Worker callers and Workers with a problem by industry
0
5
10
15
20
25
30
Agr
icul
ture
and
fishi
ng
Ban
king
,fin
ance
and
insu
ranc
e
Con
stru
ctio
n
Dis
tribu
tion,
hote
ls a
ndre
stau
rant
s
Ene
rgy
and
wat
er
Man
ufac
turin
g
Pub
licad
min
istra
tion,
educ
atio
n an
dhe
alth
Tran
spor
t and
com
mun
icat
ion
Oth
er s
ervi
ces
PWR FTWS
Source: PWR Helpline survey (base 621) and Fair Treatment at Work survey 2008 (base 862)
Table B1 sets out selected workplace, job and individual characteristics for both callers and those workers with a problem in the population. This shows the proportion of callers who worked in an organisation that did not have a HR or personnel department was nearly double (49.1 per cent of) compared to workers with a problem (27.6 per cent) – these results were also higher compared with the overall GB worker population.
Fewer callers did not have an equal opportunities policy at their workplace (28.8 per cent); this excludes the 19 per cent who didn’t know. This was also almost double compared to workers with a problem (14.5 per cent) – again these results were also higher compared with the GB worker population. It is encouraging that a greater proportion of callers without an equal opportunities policy in their workplace are calling the helpline as this was identified as a characteristic of those more likely to experience problems with employment rights (Fevre et al., 2009). The vast majority callers (over 80 per cent) working in an organisation with a HR or personnel department had an equal opportunities policy in their workplace and around 40 per cent of those without a HR or personnel department also had such a policy in their workplace. This relationship is also valid for those in the worker population.
29
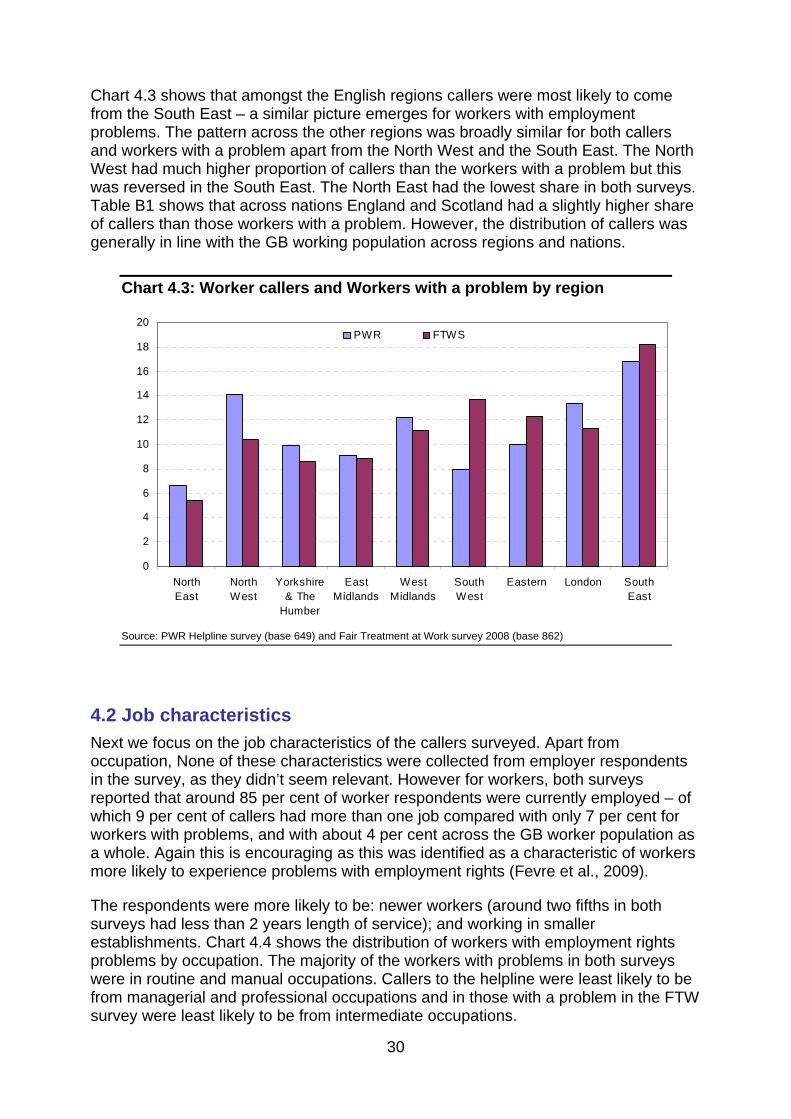
Chart 4.3 shows that amongst the English regions callers were most likely to come from the South East – a similar picture emerges for workers with employment problems. The pattern across the other regions was broadly similar for both callers and workers with a problem apart from the North West and the South East. The North West had much higher proportion of callers than the workers with a problem but this was reversed in the South East. The North East had the lowest share in both surveys. Table B1 shows that across nations England and Scotland had a slightly higher share of callers than those workers with a problem. However, the distribution of callers was generally in line with the GB working population across regions and nations.
Chart 4.3: Worker callers and Workers with a problem by region
0
2
4
6
8
10
12
14
16
18
20
NorthEast
NorthWest
Yorkshire& The
Humber
EastMidlands
WestMidlands
SouthWest
Eastern London SouthEast
PWR FTWS
Source: PWR Helpline survey (base 649) and Fair Treatment at Work survey 2008 (base 862)
4.2 Job characteristics Next we focus on the job characteristics of the callers surveyed. Apart from occupation, None of these characteristics were collected from employer respondents in the survey, as they didn’t seem relevant. However for workers, both surveys reported that around 85 per cent of worker respondents were currently employed – of which 9 per cent of callers had more than one job compared with only 7 per cent for workers with problems, and with about 4 per cent across the GB worker population as a whole. Again this is encouraging as this was identified as a characteristic of workers more likely to experience problems with employment rights (Fevre et al., 2009).
The respondents were more likely to be: newer workers (around two fifths in both surveys had less than 2 years length of service); and working in smaller establishments. Chart 4.4 shows the distribution of workers with employment rights problems by occupation. The majority of the workers with problems in both surveys were in routine and manual occupations. Callers to the helpline were least likely to be from managerial and professional occupations and in those with a problem in the FTW survey were least likely to be from intermediate occupations.
30

Chart 4.4: Worker callers and Workers with a problem by occupation
0
10
20
30
40
50
60
70
Managerial and professionaloccupations
Intermediate occupations Routine and manualoccupations
PWR FTWS
Source: PWR Helpline survey (base 642) and Fair Treatment at Work survey 2008 (base 852)
Table B1 sets out selected workplace, job and individual characteristics for both callers and those with a problem in the worker population. Just under four fifths (79.3 per cent) of callers were employed and this was slightly lower than in the worker population with a problem at 84.4 per cent, but employment rates have changed in the time between the two sources. Although the sample sizes are small, the survey found that significantly more agency workers (6.2 per cent) called the helpline than would have been anticipated by looking at the proportion of agency workers in the worker population reporting a most serious workplace problem (3.7 per cent). This suggests that the helpline is having some success in attracting calls from one of its key target sectors. Around seven per cent of callers worked in their own homes or used their homes as a base compared with just over four per cent in the worker population with a problem.
4.3 Individual characteristics Finally we look at the individual characteristics of the callers surveyed; none of these characteristics were collected from employer respondents as they didn’t seem relevant. Chart 4.5 presents a profile of callers and those in the worker population with problems by age band. This shows that the highest proportion of callers were in the 41-50 age bracket at 24.8 per cent and this was closely followed by those in the 22-30 and 31-40 age groups at 24.0 and 22.9 per cent respectively. This was broadly similar to those in the worker population with a problem. Amongst the over 50 year olds, there were slightly more callers (20.3 per cent) compared with those in the worker population with a problem at 18.9 per cent; and despite the small sample size amongst those under 22 years olds, there were slightly fewer callers (9.9 per cent) compared with the worker population with a problem at 12.0 per cent. While the difference is not statistically significant, if fewer young workers are calling than those who report a problem with their rights in the worker population it may be a group to target in the future as young workers are identified as more likely to experience problems with employment rights (Bewley & Forth, 2010).
31

Chart 4.5: Worker callers and Workers with a problem by age band
0
5
10
15
20
25
30
Under 18 19-21 22-30 31-40 41-50 51-60 61+
PWR FTWS
Source: PWR Helpline survey (base=647) and Fair Treatment at Work survey 2008 (base=862)
Chart 4.6 shows that helpline callers were slightly more likely to be male (51.4 per cent). Those in the worker population with employment problems were more evenly split but this was not a statistically significant result.
Chart 4.6: Worker callers and Workers with a problem by gender
0
10
20
30
40
50
60
PWR FTWS
Male Female
Source: PWR Helpline survey – base (649 respondents) and Fair Treatment at Work survey 2008 – base (862)
32

Table B1 sets out selected workplace, job and individual characteristics for both callers and those with a problem in the worker population. The proportion of callers who described their ethnic group as non-white was slightly higher, but not statistically significant, than in the worker population with a problem. However, that around seven per cent of callers had some difficultly with their proficiency in English compared with just under three per cent in the worker population, suggests minority ethnic groups were overrepresented in calls to the helpline compared with the worker population.
There was no statistically significant difference between proportion who reported they had a long term illnesses/ disability in the caller (16.1 per cent) and worker population with a problem (17.4 per cent). Nevertheless, these figures were higher than the GB working population and as a group workers with a long term illnesses/ disability are more likely to experience problems with employment rights (Bewley & Forth, 2010 and Fevre et al. 2008).
4.4 Summary Workplace characteristics
• Small businesses (less than 50 employees) made up 86 per cent calls from employers, with almost three quarters not having an HR or personnel department. These are the kind of businesses known to struggle with employment regulations.
• For workers many of their workplace characteristics, i.e. sector, industry and region, were in line with trends in the working population. However, callers were more likely to work in smaller workplaces compared with the worker population with a most serious problem. Also about twice the proportion of callers worked in a business without an HR or personnel department and without an equal opportunities policy compared with the worker population with a problem.
Job characteristics
• No job characteristics were collected for employers in the survey, except for occupation.
• For workers more significant differences appeared in job characteristics between callers in the helpline survey and the worker population with a problem taken from the FTWS. Callers were more likely to be newer in their jobs, work at home or through an agency and almost twice as likely to have more than one job. This suggests that the helpline is having some success in attracting calls from key target sectors and other vulnerable groups.
33

Individual characteristics
• No individual characteristics were collected for employers in the survey.
• For workers some of their individual characteristics, i.e. age and gender were in line with trends in the working population. There was evidence to suggest young workers (under 22 years old) were underrepresented in calls to the helpline, and non-white callers were overrepresented in comparison with the worker population with a problem but these were not statistically significant results. However far more callers lacked English proficiency compared with those in the worker population with a problem.
• Additionally there was no statistically significant difference between callers and the worker population with a problem who reported they had a long term illnesses/ disability, but this was still higher than found in the working population and therefore a common indicator of vulnerability in the literature.
34

5. Conclusions This final chapter reflects on the findings presented in the previous three chapters and reviews whether the helpline can be considered effective in terms of the three research aims identified in Chapter 1.
5.1 Has the helpline raised awareness and knowledge of rights? The survey of callers showed satisfaction levels with the helpline were high and similarly the proportion who recommend or would reuse the service. This was equally true for both workers and employers. The helpline was also rated well on the information it provided, and judging by the activity respondents had taken or were planning to take, the helpline had indeed informed a large proportion of callers. Therefore in itself, it can be argued the helpline has raised awareness and knowledge of employment rights. Even where callers have been signposted, they have been directed to an appropriate source of information which is itself a valuable service. In effect, an employer or worker unaware, prior to the call, of where to go for particular advice has been accurately signposted to a reputable source. This does not answer whether there was a more effective way of dispensing this information, especially considering the flow of traffic to the helpline from the internet.
5.2 Has the helpline increased employer compliance with current regulations? There was evidence from the survey that employers used the helpline to verify information, take action to ensure compliance or consult with another external body. Most of the employer callers were small businesses without an HR function. Other research, Blackburn and Hart (2002), tells us most small employers were uncertain about employment rights and approached compliance on a need to know basis. The most important sources of advice and information were accountants, solicitors and then government departments. Therefore the verification of information the helpline was able to provide or the signposting to other organisation becomes an important activity as taking action to ensure compliance. However calls from employers only made up a relatively small proportion of calls to the helpline and they were not considered a target audience in any of the publicity leading to the launch of the helpline.
5.3 Has the helpline reduced worker vulnerability and encouraged action on problems? There is good evidence the helpline has attracted calls from workers with ‘vulnerable’ characteristics as defined by the literature, Fevre et al (2009) and Bewley & Forth (2010). For example, more than twice the proportion of callers have more than one job (9 per cent) or work in a business without an equal opportunities policy (29 per cent) than are found in those with a problem in the worker population. A not statistically different proportion of callers have a long-standing illness or disability (16 per cent) as is found in those with a problem in the worker population, but this was still higher than found in the working population. All of these are characteristics likely to make a worker more likely to experience problems at work with their employment rights. Young
35

people, however, might be under-represented in callers compared with the population with problems and this may need to be addressed in future promotional and awareness-raising work. Worker callers showed positive signs of taking action to resolve their problems and mainly were seeking additional information and advice suggested by the helpline or progressing the problem with their employer. Further the helpline had referred a number of callers’ issues for enforcement action. Ultimately how effective this information was in eventually resolving a caller’s enquiry is more difficult to assess as the survey was run only shortly after the call was made.
36
References Bewley, H., Forth, J. (2010) Vulnerability and adverse treatment in the workplace, Employment Relations Research Report No. 112, London: Department for Business Innovation and Skills.
Blackburn, R. Hart, M. (2002) Small firms' awareness and knowledge of individual employment rights, Employment Relations Research Report No. 14, London: Department for Trade and Industry
Fevre, R., Nichols, T., Prior, G. and Rutherford, I. (2009) Fair Treatment at Work Report: Findings from the 2008 Survey, Employment Relations Research Report No. 103, London: Department for Business Innovation and Skills.
Hooker, H., Usher, T., Robinson, D. (2007) Acas Helpline Survey 2007, Acas Research Paper, London: Acas.
Thornton, A., Fitzgerald, N. (2010) Acas Helpline Evaluation 2009, Acas Research Paper, London: Acas.
37
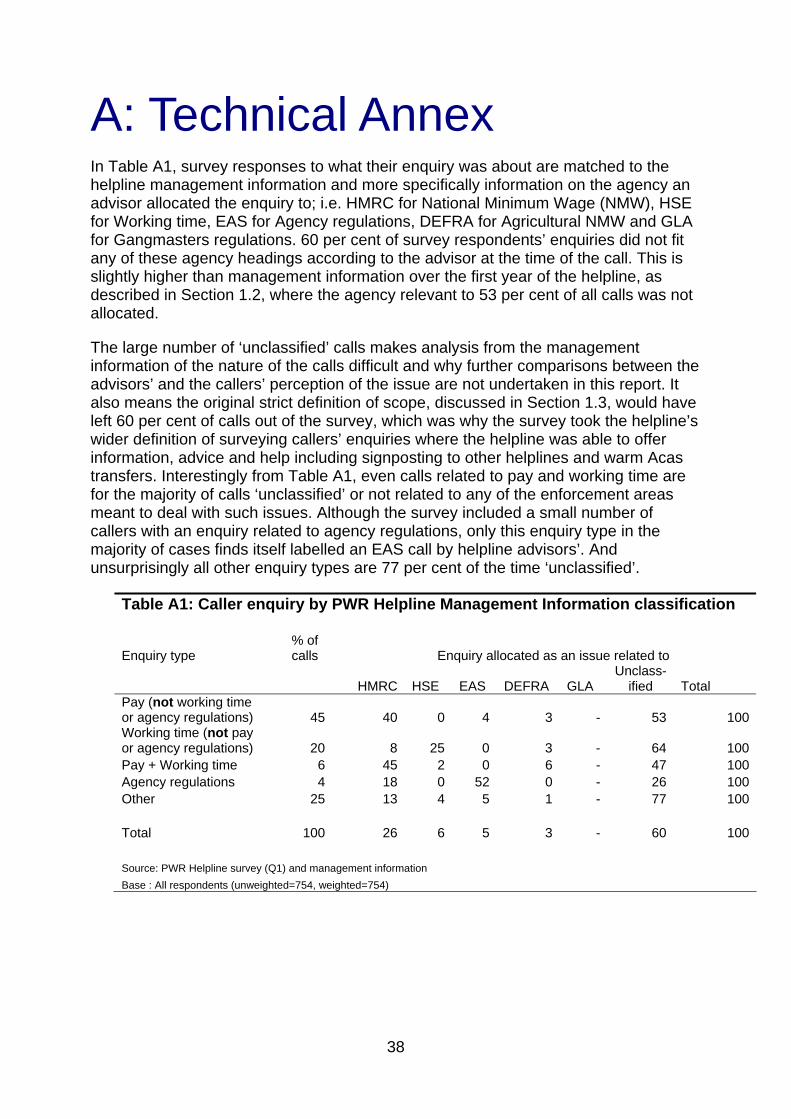
A: Technical Annex In Table A1, survey responses to what their enquiry was about are matched to the helpline management information and more specifically information on the agency an advisor allocated the enquiry to; i.e. HMRC for National Minimum Wage (NMW), HSE for Working time, EAS for Agency regulations, DEFRA for Agricultural NMW and GLA for Gangmasters regulations. 60 per cent of survey respondents’ enquiries did not fit any of these agency headings according to the advisor at the time of the call. This is slightly higher than management information over the first year of the helpline, as described in Section 1.2, where the agency relevant to 53 per cent of all calls was not allocated.
The large number of ‘unclassified’ calls makes analysis from the management information of the nature of the calls difficult and why further comparisons between the advisors’ and the callers’ perception of the issue are not undertaken in this report. It also means the original strict definition of scope, discussed in Section 1.3, would have left 60 per cent of calls out of the survey, which was why the survey took the helpline’s wider definition of surveying callers’ enquiries where the helpline was able to offer information, advice and help including signposting to other helplines and warm Acas transfers. Interestingly from Table A1, even calls related to pay and working time are for the majority of calls ‘unclassified’ or not related to any of the enforcement areas meant to deal with such issues. Although the survey included a small number of callers with an enquiry related to agency regulations, only this enquiry type in the majority of cases finds itself labelled an EAS call by helpline advisors’. And unsurprisingly all other enquiry types are 77 per cent of the time ‘unclassified’.
Table A1: Caller enquiry by PWR Helpline Management Information classification
Enquiry type % of calls Enquiry allocated as an issue related to
HMRC HSE EAS DEFRA GLA Unclass-
ified Total Pay (not working time or agency regulations) 45 40 0 4 3 - 53 100Working time (not pay or agency regulations) 20 8 25 0 3 - 64 100Pay + Working time 6 45 2 0 6 - 47 100Agency regulations 4 18 0 52 0 - 26 100Other 25 13 4 5 1 - 77 100 Total 100 26 6 5 3 - 60 100 Source: PWR Helpline survey (Q1) and management information Base : All respondents (unweighted=754, weighted=754)
38

Table A2 shows how the employment rights categories mentioned in the 2008 Fair Treatment at Work survey (FTWS) to systematically check for specific employment problems were allocated to the main enquiry headings derived from the helpline survey responses. Most are fairly straight forward mappings, most family friendly (i.e. flexible working) and maternity, paternity and adoption issues were grouped into other, as it was clear from the verbatim answers to ‘…tell me briefly why you rang the Pay and Work Rights helpline?’ in the helpline survey were not about these issues. However, maternity or paternity leave/pay was grouped into pay, as some maternity pay/ right issues (4 per cent) featured in calls to the helpline.
Table A2: Mapping FTWS problem categories onto PWR Helpline enquiry issuesFTWS employment rights category PWR helpline enquiry issue
Problems to do with pay Pay Problems to do with Health and Safety at work -1
Receiving a contract or written statement of the terms and conditions of your job Contractual issues Problems to do with taking time off sick or sick pay Pay
Your employer not following a set procedure when dealing with a grievance or other work related problem which you had
Redundancy, dismissal & disciplinary
The number of hours or days you were required to work Working time Asking your employer if you could work more flexible hours Other
Taking rest breaks Working time Your employer not following a set procedure when dealing with a complaint against
you or a problem with your performance at work Redundancy, dismissal & disciplinary
Holiday entitlement/ holiday pay Working time Being unfairly dismissed Redundancy, dismissal & disciplinary
Taking time off to look after a dependent child or relative in an emergency Other Your rights as a part-time worker Other Maternity or paternity leave/ pay Pay
Your rights as an agency worker/temp Agency regulations Taking parental leave – that is taking a set amount of unpaid time off work to spend
with your children Other
Problems to do with retirement Other Adoption leave or pay Other
Other problems with rights at work Other
1 Respondents with a most serious problem with Health & safety issues were excluded as it was clear no one in the helpline survey had enquiries related to this issue.
39

B: Supplementary tables Table B1: Characteristics of PWR helpline callers and those from Fair Treatment at Work Survey 2008 Unweighted base PWR FTWS PWR FTWSAll 100 100 649 862Individual characteristics Age bands Under 18 2.8 4.0 21 2519-21 7.1 8.0 51 4822-30 24.0 21.2 162 16231-40 21.0 23.3 132 21441-50 24.8 23.8 153 21051-60 14.6 15.9 94 15261+ 5.7 3.8 34 51Gender Male 51.4 50.3 340 406Female 48.6 49.7 309 456Ethnicity White 88.5 92.3 575 798BME 11.5 7.7 68 62Long standing illness/ disability Yes 16.1 17.4 103 161No 83.9 82.6 544 699English proficiency Yes 92.6 97.4 600 843No 7.4 2.6 49 19Job characteristics Occupation Managerial and professional occupations 16.7 34.4 99 286Intermediate occupations 24.0 20.6 150 169Routine and manual occupations 59.3 45.0 393 397Employment status Employed 79.3 84.4 512 717An agency worker 6.2 3.7 40 33Unemployed 14.5 11.9 94 108Number of jobs One job 90.7 94.6 500 694More than one 9.3 5.4 51 39Home worker No 92.7 95.7 597 823Yes 7.3 4.3 47 37
Source: BIS's Pay and Work Rights Helpline Survey (PWR) and FTWS 2008 Base: PWR callers - all respondents excluding callers from Northern Ireland (8), employers (80) and unmatched calls (18). FTWS - all GB respondents who experienced a most serious problem in the last 5 years involving their employment rights excluding Health & Safety issues
40

Table B1: Characteristics of PWR helpline callers and those from Fair Treatment at Work Survey 2008 (cont’d) Unweighted base PWR FTWS PWR FTWSJob characteristics Length of service (years) Up to 1 32.7 18.7 224 1531 to 2 15.6 21.2 102 1733 to 5 24.3 18.5 156 157Over 5 27.5 41.6 164 372Workplace characteristics Ownership Private 72.1 68.2 447 571Public 25.6 27.5 159 232Third sector 2.4 4.3 14 37Industry (SIC) Agriculture and fishing 2.1 1.2 17 11Banking, finance and insurance 16.6 20.9 104 173Construction 6.3 4.3 34 38Distribution, hotels and restaurants 22.8 17.4 142 154Energy and water 2.1 2.9 13 24Manufacturing 10.6 5.3 63 47Public administration, education and health 18.6 28.1 115 252Transport and communication 10.8 10.7 66 81Other services 10.1 9.2 67 82Workplace size (workers) Less than 50 67.7 48.7 444 426More than 50 32.3 51.3 205 436Personnel/ HR department Yes 50.9 72.4 301 588No 49.1 27.6 298 248Equal opportunities policy Yes 71.2 85.5 371 653No 28.8 14.5 151 112Nation/ region England 85.8 84.1 553 738Wales 4.0 7.2 27 46Scotland 10.2 8.7 68 78North East 6.6 5.4 34 35North West 14.1 10.4 78 88Yorkshire & The Humber 9.9 8.6 57 62East Midlands 9.1 8.9 54 67West Midlands 12.2 11.1 66 87South West 7.9 13.7 47 97Eastern 10.0 12.3 56 84London 13.4 11.3 69 68South East 16.8 18.2 92 150 See footnote, source and base details on previous page.
41

Employment Relations Research Series Reports published to date in the BIS Employment Relations Research Series are listed below. Adobe PDF copies can be downloaded either from the Employment Market Analysis and Research web pages or via the BIS Publications pages:
• http://www.bis.gov.uk/publications • http://www.bis.gov.uk/policies/employment-matters/research
115 International Review of Leave Policies and Related Research 2010. Peter Moss, Institute of Education University of London. URN 10/1157 – September 2010
114 Review of the default retirement age: summary of stakeholder evidence. URN 10/1018 - July 2010
112 Vulnerability and adverse treatment in the workplace. URN 10/1127 – September 2010
111 Union Modernisation Fund – Round 2 Evaluation Report URN 10/1084 – July 2010
110 Second survey of employers’ policies, practices and preferences relating to age, 2010. URN 10/1008 - July 2010
109 The Fair Treatment at Work - Age Report Findings from the 2008 Survey. URN 10/813. March 2010
108 Evaluation of the Vulnerable Workers Pilots Year 2 (Final) report. Katie Shearn, Ben Knight and Ashvinder Kaur Matharoo, Opinion Leader Research. URN 10/775. March 2010
107 Findings from the Survey of Employment Tribunal Applications 2008. Mark Peters, Ken Seeds, Carrie Harding and Erica Garnett. March 2010
106 Implementing information and consultation: developments in medium-sized organisations. Mark Hall, Sue Hutchinson, John Purcell, Michael Terry, Jane Parker. URN 09/1544. December 2009
105 Implementing information and consultation: evidence from longitudinal case studies in organisations with 150 or more employees. Mark Hall, Sue Hutchinson, John Purcell, Michael Terry, Jane Parker. URN 09/1543. December 2009
104 The Union Modernisation Fund - Round One: Final Evaluation Report. Mark Stuart, Miguel Martinez, Lucio and Andy Charlwood. URN 09/1346. October 2009
42

103 Fair treatment at work report: findings from the 2008 survey Ralph Fevre, Theo Nicholas, Gillian Prior and Ian Rutherford. URN 09/P85. September 2009
102 International Review of Leave Policies and Related Research 2009. Peter Moss, Institute of Education University of London. URN 09/1175. September 2009
101 Something for nothing? Employment Tribunal claimants’ perspectives on legal funding. Richard Moorhead and Rebecca Cumming. URN 09/813. June 2009
100 International review of leave policies and related research 2008. Peter Moss and Marta Korintus. URN 08/1057. July 2008
99 Citizens Advice Client Research: Final Report. Derek Mitchell, Alpha Research. URN 08/1056. September 2008
98 Vulnerable Workers Pilots’ Evaluation: Interim findings from the evaluation of the vulnerable worker pilots at the end of Year 1. Liz Griffin. URN 08/1055. October 2008
97 Implementing information and consultation in medium-sized organisations. Mark Hall, Sue Hutchinson, Jane Parker, John Purcell and Michael Terry. URN 08/969. October 2008
96 Characteristics of Rejected Employment Tribunal Claims: Paul L. Latreille. URN 09/812. June 2009
92 The Union Modernisation Fund: an interim progress report. Mark Stuart, Andy Charlwood, Miguel Martinez Lucio and Emma Wallis. URN 08/639. March 2008
91 Offshoring and wage inequality in the UK, 1992-2004. Claudia Canals. URN 07/1667. December 2007
88 Implementing information and consultation: early experience under the ICE Regulations. Mark Hall, Jane Parker, John Purcell, Michael Terry and Sue Hutchinson. URN 07/1388. September 2007
87. The impact of employee representation upon workplace industrial relations outcomes. Sian Moore, Ali Tasiran and Steve Jefferys. URN 08/1037. September 2008
86. The Third Work-Life Balance Employer Survey: Main findings. Bruce Hayward, Barry Fong and Alex Thorton. URN 07/1656. December 2007
85 Developing an Index of Labour Market Adaptability. David Tinsley and Vassilis Monastiriotis. URN 07/1144. November 2007
84 The influence of legal representation at Employment Tribunals on case outcome. Geraldine Hammersley, Jane Johnson and David Morris. URN 07/1150. July 2007
43

83 The costs and benefits of Employment Tribunal cases for employers and claimants. Kathy Armstrong and David Coats. URN 07/1151. July 2007
81 Doing the right thing? Does fair share capitalism improve workplace performance?. Alex Bryson and Richard Freeman. URN 07/906. May 2007
80 International Review of Leave Policies and Related Research. Peter Moss and Karin Wall, eds.URN 07/1232. July 2007
78 Mapping the recruitment agencies industry. Experian Business Strategies. URN 07/1259. October 2007
77 Work-life policies in Great Britain: What works, where and how? Sadia Nadeem and Hilary Metcalf. URN 07/826. July 2007
76 Reassessing the ‘family-friendly workplace’: trends and influences in Britain, 1998-2004. Gillian Whitehouse, Michele Haynes, Fiona Macdonald and Dionne Arts. URN 07/827. July 2007
74 2006 Compendium of Regulatory Impact Assessments. Employment Market Analysis and Research. URN 07/669. April 2007
73 Patterns of information disclosure and joint consultation in Great Britain – determinants and outcomes. Riccardo Peccei, Helen Bewley, Howard Gospel and Paul Willman. URN 07/599. February 2007
72 Embedding the provision of information and consultation in the workplace: a longitudinal analysis of employee outcomes in 1998 and 2004. Annette Cox, Mick Marchington and Jane Suter. URN 07/598. February 2007
70 Changing job quality in Great Britain 1998 – 2004. Andrew Brown, Andy Charlwood, Christopher Forde and David Spencer. URN 06/2125. December 2006
69 Employee representation in grievance and disciplinary matters – making a difference? Richard Saundry and Valerie Antcliff. URN 06/2126. December 2006
68 Union modernisation fund: interim evaluation of first round. Mark Stuart, Andy Charlwood, Miguel Martinez Lucio and Emma Wallis. URN 06/1803. September 2006
67 1997-1998 Compendium of Regulatory Impact Assessments. Employment Market Analysis and Research. URN 06/1840. September 2006
66 Labour market flexibility and sectoral productivity: a comparative study. Vassilis Monastiriotis. 06/1799. December 2006
65 Employment flexibility and UK regional unemployment: persistence and macroeconomic shocks. Vassilis Monastiriotis. 06/1799. December 2006
44

64 Review of judgments in race discrimination Employment Tribunal cases. Alison Brown, Angus Erskine and Doris Littlejohn. URN 06/1691. September 2006
63 The First Fair Treatment at Work Survey: Executive summary – updated. Heidi Grainger and Grant Fitzner. URN 07/803 (replacing June 2006 version, URN 06/1380). March 2007
61 The settlement of Employment Tribunal cases: evidence from SETA 2003. Paul L. Latreille. URN 07/1149. July 2007
60 2000 Compendium of Regulatory Impact Assessments. Employment Market Analysis and Research. URN 06/1164. July 2006
59 The right to request flexible working: a review of the evidence. Grant Fitzner and Heidi Grainger. URN 07/840. March 2007
58 The Third Work-Life Balance Employee Survey: Main findings. Hülya Hooker, Fiona Neathey, Jo Casebourne and Miranda Munro. URN 07/714. March 2007
57 International review of leave policies and related research. Peter Moss and Margaret O'Brien (editors). URN 06/1422. June 2006
56 How have employees fared? Recent UK trends. Grant Fitzner. URN 06/924. June 2006
55 The Experience of Claimants in Race Discrimination Employment Tribunal Cases. Jane Aston, Darcy Hill and Nil Djan Tackey. URN 06/1060. April 2006
54 Findings from the Survey of Claimants in Race Discrimination Employment Tribunal Cases. URN 06/1059. Mark Peters, Ken Seeds and Carrie Harding. September 2006
53 1999 Compendium of Regulatory Impact Assessments. Employment Market Analysis and Research. URN 06/955. July 2006
52 2001 Compendium of Regulatory Impact Assessments. Employment Market Analysis and Research. URN 06/927. July 2006
51 Employment Rights at Work: Survey of Employees. Jo Casebourne, Jo Regan, Fiona Neathey, Siobhan Tuohy. URN 06/ 837. April 2006.
50 Maternity and paternity rights and benefits: survey of parents 2005. Deborah Smeaton and Alan Marsh. URN 06/836. March 2006.
49 Survey of employers’ policies, practices and preferences relating to age. Hilary Metcalf and Pamela Meadows. URN 05/674. April 2006
48 2005 Compendium of Regulatory Impact Assessments. Volume 1 and Volume 2. Employment Market Analysis and Research. URN 06/627 (Volume 1) and 06/669X (Volume 2). March 2006
47 ‘Small, flexible and family friendly’ – work practices in service sector businesses. Lynette Harris and Carley Foster. URN 05/1491. October 2005
45

46 People, Strategy and Performance: Results from the Second Work and Enterprise Business Survey. The Work Foundation. URN 05/1392. September 2005
45 Review of research into the impact of employment relations legislation. Linda Dickens, Mark Hall and Professor Stephen Wood. URN 05/1257. October 2005
44 Employment Relations monitoring and evaluation plan 2005, Employment Market Analysis and Research. URN 05/1019. July 2005
43 The content of new voluntary trade union recognition agreements 1998-2002. Volume two – Findings from the survey of employers. Dr Sian Moore, Dr Sonia McKay and Helen Bewley. URN 05/1020. May 2005
42 The age dimension of employment practices: employer case studies. Stephen McNair and Matt Flynn. URN 05/863. June 2005
41 2004 Compendium of Regulatory Impact Assessments. Employment Market Analysis and Research. URN 05/1018. April 2005
40 2002 Compendium of Regulatory Impact Assessments. Employment Market Analysis and Research. URN 05/582. April 2005
39 Results of the Second Flexible Working Employee Survey. Heather Holt and Heidi Grainger. URN 05/606. April 2005
38 Equal opportunities, employee attitudes and workplace performance: Findings from WERS 1998. John Forth and Ana Rincon-Aznar. URN 08/575. March 2008
37 Job separations: A survey of workers who have recently left any employer. Volume one – Main analysis report. Tania Corbin. URN 04/1920. December 2004
36 Employment attitudes: Main findings from the British Social Attitudes Survey 2003. Harjinder Kaur. URN 04/1868. December 2004
35 Findings from the 1998 survey of representatives in Employment Tribunal cases. P.L.Latreille, J.A. Latreille and K.G. Knight. URN 04/1530. August 2004
34 Employment relations monitoring and evaluation plan 2004. Employment Market Analysis and Research. URN 04/1256. September 2004
33 Findings from the Survey of Employment Tribunal Applications 2003. Bruce Hayward, Mark Peters, Nicola Rousseau and Ken Seeds. URN 04/1071. August 2004
32 The evaluation of the Work-Life Balance Challenge Fund. Adrian Nelson, Kathryn Nemec, Pernille Solvik and Chris Ramsden. URN 04/1043. August 2004
46

31 A survey of workers’ experiences of the Working Time Regulations. BMRB Social Research. URN 04/1165. November 2004
30 Equal opportunities policies and practices at the workplace: secondary analysis of WERS98. Tracy Anderson, Neil Millward and John Forth. URN 04/836. June 2004
29 Trade union recognition: statutory unfair labour practice regimes in the USA and Canada. John Godard. URN 04/855. March 2004
28 2003 Compendium of Regulatory Impact Assessments. Employment Market Analysis and Research. URN 04/743. April 2004
27 The Second Work-Life Balance Study: Results from the Employees’ Survey. Jane Stevens, Juliet Brown and Caroline Lee. URN 04/740. March 2004
26 The content of new voluntary trade union recognition agreements 1998-2002: Volume one – An analysis of new agreements and case studies. Dr Sian Moore, Dr Sonia McKay and Helen Bewley. URN 04/1084. August 2004
25 How employers manage absence. Stephen Bevan, Sally Dench, Heather Harper and Sue Hayday. URN 04/553. March 2004
24 Age matters: a review of the existing survey evidence. Dr. Peter Urwin. URN 03/1623. February 2004
23 The business context to long hours working. T, Hogarth, W.W. Daniel, A.P.Dickerson, D. Campbell, M.Wintherbotham, D. Vivian. URN 03/833. November 2003
22 The Second Work-Life Balance Study: Results from the Employer Survey. Stephen Woodland, Nadine Simmonds, Marie Thornby, Rory Fitzgerald and Alice McGee. URN 03/1252. October 2003
21 Employee voice and training at work: analysis of case studies and WERS98. Helen Rainbird, Jim Sutherland, Paul Edwards, Lesley Holly and Ann Munro. URN 03/1063. September 2003
20 The impact of employment legislation on small firms: a case study analysis. Paul Edwards, Monder Ram and John Black. URN 03/1095. September 2003
19 Implementation of the Working Time Regulations: follow-up study. Fiona Neathey. URN03/970. July 2003
18 Retirement ages in the UK: a review of the literature. Pamela Meadows. URN 03/820. July 2003
17 Evaluation of the Partnership at Work Fund. Mike Terry and Jill Smith. URN 03/512. May 2003
16 Working long hours: a review of the evidence. Volume 1 – Main report. Volume 2 – Case studies (and appendices). J Kodz et al. URN: 03/1228. November 2003
47

48
15 Awareness, knowledge and exercise of individual employment rights. Nigel Meager, Claire Tyers, Sarah Perryman, Jo Rick and Rebecca Willison. URN 02/667. February 2002
14 Small firms' awareness and knowledge of individual employment rights. Robert Blackburn and Mark Hart. URN 02/573. August 2002
13 Findings from the 1998 Survey of Employment Tribunal Applications (Surveys of Applicants and Employers). URN 03/999. February 2004
12 Collective bargaining and workplace performance: an investigation using the Workplace Employee Relations Survey 1998. Alex Bryson and David Wilkinson. URN 01/1224. November 2001
11 Implementation of the Working Time Regulations. Fiona Neathey and James Arrowsmith. URN 01/682. April 2001
10 Explaining the growth in the number of applications to Industrial Tribunals, 1972-1997. Simon Burgess, Carol Propper and Deborah Wilson. URN 00/624. April 2001
9 Costs and benefits of European Works Councils Directive. Tina Weber, Peter Foster and Kursat Levent Egriboz. URN 00/630. February 2000
8 Trends in earnings inequality and earnings mobility 1977-1997: the impact of mobility on long-term inequality. Abigail McKnight. URN 00/534. February 2000
7 Partnership at work. John Knell. URN 99/1078. September 1999 6 The employment status of individuals in non-standard employment.
Brendan Burchell, Simon Deakin and Sheila Honey. URN 99/770. July 1999
5 Redundancy consultation: a study of current practice and the effects of the Regulations. Jill Smith, Paul Edwards and Mark Hall. URN 99/512. July 1999
4 The individualisation of employment contracts in Britain. William Brown, Simon Deakin, Maria Hudson, Cliff Pratten and Paul Ryan. URN 98/943. February 1999
3 The dynamics of union membership in Britain – a study using the Family and Working Lives survey. Richard Disney, Amanda Gosling, Julian McCrae and Stephen Machin. URN 98/807. January 1999
2 Industrial Tribunals, workplace disciplinary procedures and employment practice. Jill Earnshaw, John Goodman, Robin Harrison and Mick Marchington. URN 98/564. February 1998
1 Involving employees in Total Quality Management: employee attitudes and organisational context in unionised environments. Margaret Collinson, Chris Rees, Paul Edwards with Linda Inness. URN 98/507. June 1998

Department for Business, Innovation and Skills www.bis.gov.uk
First published September 2010 © Crown Copyright URN 10/1128 ISBN 978-0-85605-760-1