survey on the pedagogical use of the general …€¦ · african union. by . prof. abdoul sow ....
TRANSCRIPT

African Union
By
Prof. Abdoul Sow
2013
SURVEY ON THE PEDAGOGICAL USE OF THE
GENERAL HISTORY OF AFRICA
i
Table of contents Initials and acronyms ................................................................................................................. ii
List of figures ........................................................................................................................ iii List of tables .......................................................................................................................... iv
I. GENERAL INTRODUCTION ...................................................................................... 1
II. GLOBAL ANALYSIS OF THE ANSWERS TO THE QUESTIONNAIRE ................ 4
1. Identification ....................................................................................................................... 4
2. The current situation regarding the teaching of history in higher education. ..................... 4
3. Access to and availability of GHA ...................................................................................... 5
4. Use of GHA......................................................................................................................... 7
III. CONCLUSIONS AND RECOMMENDATIONS ......................................................... 9
IV. ASSESSMENT OF ANSWERS TO THE QUESTIONNAIRE .................................. 11

ii
Initials and acronyms
CD: Compact Disc
CURDHACA: Centre Universitaire de Recherche et de Documentation en Histoire et Central
African Archaeology
DVD: Digital Versatile Disc
FASTEF: Faculté des Sciences et Technologies de l’Education et de la Formation
GHA: General History of Africa
INRA: Institut National de Recherche et d’Action Pédagogique
LMD: Licence, Master, Doctorat: 3-tier university degree system
NA: No Answer
CU: Course unit
UNESCO: Organisation des Nations Unies pour l'éducation, la science et la culture.
USB: Universal Serial Bus

iii
List of figures
Figure 1 Presentation of the countries surveyed................................................................ 12 Figure 2 What is the status of your Institution? ................................................................ 28 Figure 3 What is the status of the informant? ................................................................... 29 Figure 4 Gender of the informant ...................................................................................... 30 Figure 5 Eligibility of history in Institutions ..................................................................... 30 Figure 6 The form of history taught .................................................................................. 32 Figure 7 Teaching of history in the institutions ................................................................ 33 Figure 8 Status of the teaching .......................................................................................... 34 Figure 9 Type of aid used for the teaching of the history of Africa .................................. 42 Figure 10 Favoured historical approach in the institutions ................................................ 43 Figure 11 Familiarity with GHA published by UNESCO .................................................. 44 Figure 12 Published format ................................................................................................ 45 Figure 13 Medium .............................................................................................................. 46 Figure 14 Availability of GHA in academic institutions .................................................... 47 Figure 15 Availability of the book format of GHA in institutions ..................................... 48 Figure 16 Availability of the abridged volume in institutions ............................................ 49 Figure 17 Availability of the electronic version in institutions .......................................... 52 Figure 18 Individual ownership of GHA ............................................................................ 53 Figure 19 Personal ownership of GHA in book form......................................................... 54 Figure 20 Number of volumes in book form ...................................................................... 55 Figure 21 Individual ownership of the abridged version of GHA ...................................... 56 Figure 22 Number of volumes in the abridged version ...................................................... 57 Figure 23 Personal possession of the online/electronic version of GHA ........................... 58 Figure 24 Private ownership of GHA in electronic edition/ CD/DVD .............................. 59 Figure 25 Use of GHA in programs for the teaching of research ....................................... 60 Figure 26 Expectations of GHA ......................................................................................... 61 Figure 27 Use of GHA ........................................................................................................ 62 Figure 28 Frequency of use of GHA .................................................................................. 63 Figure 29 Purposes of using GHA ...................................................................................... 64 Figure 30 Number of GHA volumes consulted .................................................................. 65 Figure 31 The three volumes which best meet expectations .............................................. 66 Figure 32 Satisfaction with the current format ................................................................... 67 Figure 33 Typographical legibility ..................................................................................... 68 Figure 34 Illustrations in GHA ........................................................................................... 69 Figure 35 Legibility of the illustrations .............................................................................. 70 Figure 36 Appreciations of the contents ............................................................................. 71 Figure 37 Expectations regarding GHA contents ............................................................... 72

iv
List of tables
Table I: Countries having participated ................................................................................ 11 Table II Questions 2 to 5. .................................................................................................... 14 Table III List of Institutes, Centres, Higher Institutes .......................................................... 25 Table IV List of other structures ........................................................................................... 27 Table V Number of CUs devoted to the history of Africa in the first two-year cycle ......... 35 Table VI Number of modules devoted to the history of Africa in the first two-year cycle .. 37 Table VII Number of CUs devoted to the history of Africa in the second cycle ................... 37 Table VIII Number of modules devoted to the history of Africa in the second cycle ............. 39 Table IX Number of CUs devoted to the history of Africa in the third/Doctorate cycle ...... 40 Table X Number of modules devoted to the history of Africa in the third cycle ................ 41 Table XI Number of volumes in book form .......................................................................... 49 Table XII Number of volumes in abridged version ................................................................ 51

1
I. GENERAL INTRODUCTION This study on the evaluation of the pedagogical use of the General History of Africa (GHA)
constitutes a framework for UNESCO’s ambitious project involving the renovation of the
teaching of African history in Africa.
With that in mind, the focus has been to:
- Identify the current use of the eight volumes of the General History of Africa in higher
education institutions on the African continent;
- Collate the opinions of users of the General History of Africa;
- Enable the publishing institution, namely UNESCO, to have the relevant elements to
improve further additions and better to adapt them to the quality standards.
In this study, UNESCO has chosen to conduct a survey in the form of a questionnaire as most
of the studies available within the context of the GHA have remained general in nature on this
matter in so far as they do not provide precise and comprehensive data covering the continent
as a whole. This method is both a tool for observation, quantification, comparison and
analysis of information. It is particularly suitable for measuring the degree of satisfaction
among the actors surveyed. In order to have more precise data in quantitative and qualitative
terms, regarding the teaching of history, and particularly the use of GHA in higher education
institutions, it was decided to have recourse to questions that were both open and closed so as
to make it possible to proceed in a methodical manner in the collation of relevant and precise
information.
Accordingly, the assessment of answers obtained through the questionnaire constitutes a tool
for prospective reflection of a very valuable quality which should help players at this level of
education in the decision-making processes.
UNESCO entrusted the devising of the questionnaire to an international expert, a professor of
history, former dean of the faculty of sciences and technologies of education and training and
former head of the department of history amounting to over 35 years of experience in the
teaching of history, 28 of which in higher education and seven in secondary education.
For the purposes of this survey, the questionnaire was devised by a team composed of three
historians and a geographer from the Cheikh Anta Diop university (UCAD), a professor from
2
the University of Thies and a former administrator at the Directorate of Higher Education
(DES). This task necessitated several meetings at the Faculty of Sciences and Technologies of
Education and Training (UCAD).
The scientific committee, in charge of the scientific and intellectual orientation of the project,
subsequently reviewed and validated the questionnaire. This made it possible to cover every
aspect of the problem under consideration and to arrive at a questionnaire that was easy to
use. Once it had been validated, the survey questionnaire was sent to approximately 350
contacts throughout 51 African countries out of 54. These contacts were given the task of
administering the questionnaires among the various higher education and research institutions
in both the public and private sectors. The survey was targeted at the academic authorities,
teachers, researchers, students and other users.
List of 51 countries: South Africa; Algeria; Angola; Benin; Botswana; Burkina Faso;
Burundi; Cameroon; Cape Verde; Central African Republic; Comoros; Republic of Congo;
Democratic Republic of Congo; Ivory Coast; Djibouti; Egypt; Eritrea; Ethiopia; Gabon;
Gambia; Ghana; Guinea; Guinea Bissau; Kenya; Lesotho; Liberia; Libya; Madagascar;
Malawi; Mali; Morocco; Mauritius; Mauritania; Mozambique; Namibia; Niger; Nigeria;
Uganda; Rwanda; Senegal; Sierra Leone; Somalia; Sudan; South Sudan; Swaziland;
Tanzania; Chad; Togo; Tunisia; Zambia and Zimbabwe.
Answers to the questionnaires distributed were collected by UNESCO. Only 120 usable
answers had been received from 34 countries after several reminders had been launched, over
a period of five months, between November 2012 and March 2013. The reception of these
questionnaires was followed by a data capture of the answers through the use of the Sphinx
V5 software. For handling the answers, the database was transferred to Excel Excel 2007
(MS Office). This enabled us to devise tables and graphs for the analysis. For certain
questions, we had to resort to manual sorting.
For assessment of the results, we organized two residential seminars at Saly bringing together
eight people. Subsequently, a group of three people, entrusted with finalizing the task, met on
several occasions.
Nevertheless, a number of difficulties were met in the conduct of this survey. The limits
observed in the conduct of the survey have been established as follows:
3
- Problem of targetting in the distribution of the questionnaire. The very high score of
NA (No Answer) would confirm this.
- Problem of comprehension of certain terms “Course Unit”, “Module”, “Study
Project”, etc.
- Problem related to the distribution of questionnaires by email. As an illustration, we
observed that one informant filled in several questionnaires. Other respondents even
reconfigured the questionnaire, thereby changing the order of the questions. Two
questionnaires from two countries were sent twice, one questionnaire from another
country, five times. Some answers were sent to us in a disordered fashion, according
to the IPEG format, page by page.
- Problems related to the very limited number of answers obtained in relation to the
number of questionnaires, in spite of several reminders.
The current final report is structured according to four chapters:
(i) General Introduction;
(ii) Global analysis of answers;
(iii) Conclusions and recommendations;
(iv) Detailed presentation of the answers.

4
II. GLOBAL ANALYSIS OF THE ANSWERS TO THE QUESTIONNAIRE
1. Identification
Of the 34 African countries which responded to the questionnaires, 15 answered in French
and 19 in English. The assessment of the 120 questionnaires which we received has shown
that the number of questionnaires per country varies from 1 to 17.
In all, answers to the questionnaire came from;
- 48 African universities,
- 47 faculties plus four unspecified,
- 36 history departments, five other departments, institutes and schools and 12
unspecified departments,
- 14 institutes, centres and Ecole Normale Superieure,
- Four other establishments including three administrative and one library.
These institutions belong to the public and private sectors, respectively 86% and 8%. No
indication was given of their institution from 6% of respondents.
The status of the informants revealed a predominance of teachers (40%) and academic
authorities (20.8%). Students only accounted for 14% and “Others” 7.5%.
The distribution according to gender of our informants showed a predominance of men with
72.5% as opposed to 20% for women; 7.5% did not specify their gender.
2. The current situation regarding the teaching of history in higher education.
According to 86% of those surveyed, history is present in their institutions in the form of
course units amounting to 56%, and also modules and research projects.
Eight five percent of the countries surveyed stated that the history of Africa was taught in
their institutions. For slightly over half of the answers (59.2%), the teaching of African
history is compulsory. It is therefore a major component in the pedagogical plans of African
university institutions.

5
The number of teaching units declared in the first cycle varies from one to 50. As regards the
number of modules for the first cycle, 17 informants replied to the question with figures
varying from one to 19, as opposed to four informants who did not provide a reply (NA).
The number of course units devoted to the history of Africa in the second cycle varies from
one to 96.
The number of modules allocated to the teaching of the history of Africa in the second cycle
is 1.3 and 10 modules according to the three respondents.
Both for course units and for modules, some answers have raised difficulties: some figures
provided are inaccurate. In the three-tier university degree system, there are two semesters to
be validated; for each semester the student must choose a speciality which comprises three
compulsory CUs and two optional CUs according to the level.
In view of the operating rules of the three-tier university degree system (pedagogical plan of
the departments and possible choice of their modules offered to students), it is difficult to
ascertain how many modules are devoted to GHA to ensure that an «ideal» grasp of this
problem is achieved.
For the third doctorate/cycle, the number of CUs varies from one to 20. The number of
modules devoted to the history of Africa in the third cycle varies from one to 20. These
answers raise a problem as the third doctorate/cycle organizes seminars on research and the
drafting of theses whch constitute main activities.
3. Access to and availability of GHA
The most commonly used teaching aids for teaching the history of Africa are general and
specialized works amounting respectively to 87.1% and 82.5%. Aids in electronic format are
less commonly used than other aids.
A combined chronological-thematic approach is preferred by 72.5%, followed by specific
chronological and thematic approaches. Most of the respondents were familiar with GHA as
published by UNESCO (83.3%). Familiarity with GHA in its various versions shows a
relative preference over the book volume. This can be explained by the fact that it has been
the most widely diseminated version for many years.

6
As for the media through which GHA has become more familiar, the library/documentation
centre and bibliography recorded the highest scores with respectively 48.3% and 39.2%. The
relatively high cost of a volume might be the cause of these scores below 50%. Attention
shoud be drawn to the comparative success of the internet with 28.3%.This maybe linked to
the online presentation of GHA volumes. Nevertheless, familiarity with GHA does not come
via the press (4.2%)
A little over half of the respondents (56.7%) claimed that GHA was available in their
institution. Fifty four percent stated that it was available in book form in their institutions as
opposed to 3% and 43% of those who did not answer.
It is somewhat paradoxical to observe just how many teachers and students, even academic
authorities, who did not know that the libraries of their institutions possessed GHA in book
form.
Forty percent of respondents were in possession of the whole eight-volume GHA collection.
The high cost of the volumes has certainly reduced access to and dissemination of GHA.
Only 20.8% of respondents stated that the abridged version was available in their institutions.
This particular version would not seem to have popularized GHA among students, researchers
and teachers.
Out of the 25 answers focusing on the abridged version volumes, 40% stated that their
institutions had all eight volumes. The score of answers obtained remains very limited which
suggests that the abridged version is still unfamiliar.
As regards the electronic version, out of 120 answers, 13.3% stated that GHA was available
online in their institutions, 9.2% in its CD/DVD version and 77.5% did not answer the
question. This result could be attributed to a problem of access or the recent nature of the
electronic dissemination of GHA.
Out of 120 answers, 56% of the informants, largely teachers, had their own copy of GHA in
all formats combined.
Out of 44 respondents in possession of GHA in book format, only 29.5% owned the entire
eight-volume collection, which is relatively small. Fourteen percent had GHA in its abridged
version; out of 17 respondents, 10 persons (58.8%) had all eight volumes of GHA in its
abridged version.

7
A limited proportion of informants (14%) actually owned their electronic version of GHA.
This may be due to a lack of information on its availability in its online version.
Conversely, 75% of informants actually owned an electronic (CD/DVD) version of GHA.
This high proportion (75%) was certainly attributable to the fact that it was available free of
charge. If that is the case, it would be advisable to focus the action of partners on the
development of the funding of this electronic version. If access is to be promoted more
adequately, preference must be given to the CD/DVD version of GHA and/or USB key which
is more convenient, takes up less space and does not require any connection.
4. Use of GHA As regards the level of use of GHA in the teaching and research programmes, a « Yes »
answer came from 61% of respondents. Accordingly the use of GHA is almost universal in
the teaching programmes in most of the institutions involved. For slightly less than 75% of
informants, GHA accordingly meets their concerns. The majority, mainly 76% (largely
teachers), stated that they used GHA. Among the latter, 49.2% used GHA regularly. The most
frequent uses are largely due to the research fields (87.5%), training (70%) and teaching
(69%). They also concern regular users. It’s remarkable to observe that almost half of the
informants (45.8%) also use GHA for their general knowledge. Those who use it for personal
reasons represent 3.3%.
Use of these volumes of the history of Africa corresponds to the aims of the GHA collection.
The consultation in terms of the number of volumes produced limited results. Consultation of
eight volumes barely reached 35%. For all the other (1 to 7) volumes, the result amounted to
between 1.7 and 12.5%.
The main GHA users are teacher-cum-researchers. The others are leading academic figures
who are often in charge of teaching courses. Volumes 1 (58%), 2 (43%), and 7 (38%) would
seem best to respond to the needs of the informants as they deal respectively with
Methodology and African prehistory, ancient Africa and Africa under colonial domination
(1880 to 1935). This can be accounted for by the limited availability or unavailability of
documentary resources in the form of textbooks.
Most of the informants (62.5%), largely teachers, were satisfied with the current GHA format.

8
Sixty percent of informants stated that they were satisfied with its typographical legibility.
Nevertheless, the very poor percentage of “very satisfied” (10%) and hardly satisfied (7.5%)
combined with that of the NA (22.5%) have shown that the current GHA edition must be
improved.
Slightly less than half (42.5%) claim that there are enough illustrations; hence the need to
increase the number of illustrations. Fifty six percent find that the legibility of illustrations is
satisfactory; a tiny proportion claim that it is “very satisfactory” (3.3%) and 16.7% “hardly
satisfactory”; these results suggest that efforts need to be made in this regard.
Fifty two and a half percent of informants found the current content « very satsifactory ». The
combined scores of the “very satisfactory” and “satisfactory” reached 65.8%. The content met
expectations for 57.5% of the respondents, whereas 5% stated the opposite and 42.5% did not
express any opinion.

9
III. CONCLUSIONS AND RECOMMENDATIONS In all, the study covered 34 African countries out of 54, ie a rate of cover of 63%. With the
exception of West Africa, all the other regions were well represented.
Essentially, the informants were teacher-cum-researchers; conversely, students only achieved
limited representation, which is also true of women.
The history of Africa is taught in the form of CUs and/or modules in virtually all of the
African higher education institutions consulted for the purposes of this survey. A
chronological-thematic approach enjoys private place in this particular teaching. The
importance given to the teaching of African history reveals a certain awareness of the stakes
and their relevance for Africans.
There were very few institutions that stated that they possessed all of the volumes in the
collection. Among the four versions of GHA, the most accessible is the CD/DVD version.
General works (in book form), having for many years been the only available version to these
institutions, are the aids that are most used. Evidence suggests nevertheless a comparative
progress for so-called “soft” aids such as the CD/DVD version. The limited use of “soft” aids,
particularly in their online version, maybe linked to a question of equipment and connection
in certain higher education institutions.
These conclusions have led us to set out the following recommendations, mainly to:
- improve, for this type of survey, the composition of the sample and the method of
administration of the survey forms;
- produce a thematic history that would take account of the concerns of other
institutions/faculties (African history of medicine, law, military matters, clothing and
food, etc);
- setting up a communication strategy with the support of the network of African
journalists specialized in education;
- develop a petition strategy aimed at development partners for equipping African
universities with the eight volumes of GHA;
- reduce the cost of each GHA volume;
- devise a policy for promoting GHA and making it more readily available to users;

10
- develop a strategy for greater awareness of the existence of the online version among
university institutions (flyers, posters, etc) and on the UNESCO websites through, for
example, a bannière de defilement;
- focus the action of development partners in the funding of this electronic version;
- give priority to the CD/DVD version and particularly the USB key version of GHA;
- improve the publication of GHA;
- increase the number of illustrations in GHA;
- improve the legibility of illustrations;
- update the content;
- revise the cartography;
- enrich the bibliography thanks to new publications;
- develop local history;
- develop the focus on Africa’s current problems;
- draft history textbooks (for all teaching levels) that will be more accessible and less
costly.

11
IV. ASSESSMENT OF ANSWERS TO THE QUESTIONNAIRE Question 1 Country
Table I: Countries having participated
N° Country Number of questionnaires
1 Algeria 5
2 Angola 1
3 Botswana 1
4 Burundi 9
5 Cameroon 2
6 Côte d'Ivoire 1
7 Egypt 1
8 Ethiopia 5
9 Gambia 2
10 Ghana 7
11 Guinea 1
12 Guinea Bissau 2
13 Kenya 10
14 Lesotho 1
15 Madagascar 6
16 Morocco 1
17 Mozambique 2
18 Namibia 1
19 Niger 6
20 Nigeria 6
21 Central African Republic 2
22 Democratic Republic of Congo 2
23 Senegal 17
24 Seychelles 1
25 Somalia 1
26 Sudan 1
27 South Africa 4

12
28 Tanzania 6
29 Chad 1
30 Togo 2
31 Tunisia 2
32 Uganda 8
33 Union of the Comoros 2
34 Zimbabwe 1
Total 120 Source: UNESCO survey 2013
Figure 1 Presentation of the countries surveyed
The questionnaires were responded to by 34 African countries, 15 of which replied in French
and 19 in English. Out of the 15 French replies, there were three Arab countries: Algeria,
Morocco, Tunisia and one Portuguese-speaking country, Guinea Bissau. Among the 19
13
countries which answered in English, there were two Arab countries (Egypt, Sudan), two
Portuguese-speaking countries (Angola, Mozambique) and countries such as Ethiopia and
Somalia.
Cameroon sent two answers: one in French and one in English. The answer from Djibouti
arrived after the data had been processed and it was not possible to integrate the information
supplied. (see Map of countries having responded to the questionnaire). When 120
questionnaires sent by UNESCO were assessed, the number of responses varied from 1 to 17.
The distribution of the number of answers per country is as follows:
- Countries having provided the largest number of answers:
o Senegal (17)
o Kenya (10)
o Burundi (9);
- Uganda and Ghana respectively sent eight and seven answers
- Four countries = six answers: Madagascar, Niger, Nigeria and Tanzania
- Two countries = five answers: Algeria and Ethiopia
- One country = four answers: South Africa
- Nine countries = two answers: Cameroon, Gambia, Guinea Bissau, Mozambique,
Central African Republic, Democratic Republic of Congo, Togo, Tunisia and the
Union of the Comoros.
- Thirteen other countries provided (1) answer: These included: Angola, Botswana, Côte
d’Ivoire, Egypt, Guinea, Lesotho, Morocco, Namibia, Seychelles, Somalia, Sudan,
Chad and Zimbabwe
The countries of central, eastern and southern Africa were the best-represented in the survey.
The very limited rate of participation among the west African countries is also to be noted.
Several countries in that region did not take part in the survey: Mauritania, Mali, Burkina
Faso, Benin, Sierra Leone and Liberia. In other parts of Africa, a number of absences were
recorded such as Libya in northern Africa, Eritrea in northeastern Africa, Gabon and
Equatorial Guinea in central Africa, Zambia and Malawi in southern Africa.
It should be observed that in spite of the low rate of participation, these countries of western
Africa provided the largest number of answers: Senegal alone provided 17 answers, Ghana
seven and Niger and Nigeria 6.

14
This disparity can be accounted for through the poor dissemination or sharing of information
on the questionnaire whereby the various targets were to respond.
Questions 2 to 5. Table II Questions 2 to 5.
COUNTRY TOWN UNIVERSITY FACULTY DEPARTMENT
Botswana Gaborone University of
Botswana
Humanities History
Burundi Bujambura Université
Espoir
d’Afrique
Burundi Bujambura Université
Lumiere de
Bujambura
Burundi Bujambura Université
Martin Luther
King
Burundi Bujambura University of
Burundi
Lettres et des Sciences
Humaines
History
Burundi Bujambura University of
Burundi
Faculté des Lettres et Sciences
humaines
History
Burundi Bujambura University of
Burundi
Faculté des Lettres et Sciences
humaines
History
Burundi Bujambura University
National of
Burundi
Faculté des Lettres et des
Sciences Humaines
History
Burundi Mwaro University of
Mwaro
Burundi Bujambura University of
Burundi
Faculté des Lettres et Sciences
humaines
Cameroon Yaoundé University
Yaoundé 1
Faculty of Arts, Letters and
Social Sciences
History Department
Cameroon Yaoundé University
Yaoundé 1
Faculté of Arts, Letter and
Social Sciences
Humanities
Egypt Alexandria University of Faculty of Education Modern and

15
Alexandria Contemporary
History
Ethiopia Makele Makele
University
College of Social Sciences and
Language
History and
Heritage
Management
Ethiopia Makele Makele
University
Social Science History and
Heritage
management
Ethiopia Makele Makele
University
College of Social Sciences and
Languages
History and
Cultural Studies
Ethiopia Dire-Dawa Dire-Dawa
University
Social Science
Ethiopia Dire-Dawa Dire-Dawa
University
Social Science and Humanities History
Gambia Ebo Town University of
Gambia (UTG)
Arts and Sciences Humanities and
Social
Sciences/History
Unit
Ghana Legon
Accra
University of
Ghana
Social Science Institute of African
Studies
Ghana Accra University of
Ghana
Social Science Institute of African
Studies
Ghana Kumasi Kwame
Nkrumah
University of
Science et
Technology
Social Science History and
Political Studies
Ghana Kumasi Kwame
Nkrumah
University of
Science et
Technology
FASTEF History and
Political Studies
Ghana Cape
Coast
University of
Cape Coast
Arts and Sciences History
Ghana Accra University of History

16
Ghana, Legon
Kenya Nakuru Egerton
University
Faculty of Arts and Social
Sciences
Philosophy, History
and Religion
Kenya Kisumu Maseno
University
Arts and Social Sciences History and
Archaeology
Kenya Kisumu Bondo
University
College
Arts and Social Sciences History
Kenya Kisumu Bondo
University
College
Arts and Social Sciences History
Kenya Kisumu Bondo
University
College
Arts and Social Sciences History
Kenya Nairobi University of
Nairobi
Faculty Arts Department of
History and
Archeology
Kenya Kisumu Bondo
University
College
Bondo and Social Sciences History
Lesotho Meseru National
University of
Lesotho
Education Language and
Social Education(
LASED)
Madagascar Antananari
vo
University of
Tananarive
(ANKATSO)
Madagascar Antananari
vo
University of
Antananarivo
Faculty of Humanities History
Madagascar Antananari
vo
University of
Antananarivo
Faculty of Humanities History
Madagascar Antananari
vo
University of
Antananarivo
History and
Geography
Madagascar Madagasca
r
University of
Antananarivo
Faculty of Humanities
Mozambique Maputo University Humanities

17
Eduardo
Mondiane
(UEM)
Mozambique Maputo Pedagogical
University
Faculty of Social Sciences
Namibia Windhoek Humanities and
Social Sciences
Geography, History and
Environment Studies
Niger Niamey University
Abdou
Moumouni
Djoffo of
Niamey
Niger Niamey Islamic
University in
Niger
Faculty of arab language and
literature
Arab language
Niger Niamey University
Abdou
Moumouni
Djoffo of
Niamey
Faculty of Humanities History
Niger Niamey University
Abdou
Moumouni
Djoffo of
Niamey
History
Nigeria Logos University of
Lagos
Arts and Sciences History and
Strategic Studies
Nigeria Port
Harcourt
University of
Port Harcourt
Humanities History and
Diplomatic Studies
Nigeria Ibadan University of
Ibadan
Arts and Sciences History
Nigeria Keffi Nasarawa State
University,
Arts and Sciences History

18
Keffi
Central African
Republic
Bangui University of
de Bangui
Faculty of Humanities History
Democratic
Republic of
Congo
Kinshasa University of
Kinshasa
Humanities History
Democratic
Republic of
Congo
Butembo University
Devina Gloria
of Butembo
Political and Administrative
Sciences
Senegal Dakar UCAD
Senegal Dakar UCAD FASTEF History and
Geography
Senegal Dakar UCAD FASTEF History and
Geography
Senegal Dakar UCAD FASTEF History and
Geography
Senegal Commune
d'Arrondis
sement de
Mbao
(Départem
ent de
Pikine)
UCAD FASTEF History and
Geography
Senegal Dakar UCAD Humanities History
Senegal Dakar UCAD-
FASTEF
Faculty of Humanities
History
Senegal Dakar UCAD Sciences de l'Education et de la
Formation
History and
Geography
Senegal Dakar UCAD FASTEF History and
Geography
Senegal Dakar UCAD FASTEF F2B
Senegal Dakar UCAD FASTEF In charge of
training senior
administrative staff

19
Senegal Dakar UCAD FASTEF In charge of
training senior
administrative staff
Senegal Dakar UCAD FASTEF
Senegal Commune
d'Arrondis
sement de
Mbao
(Départem
ent de
Pikine)
UCAD FASTEF
Senegal Dakar UCAD FASTEF
Seychelles Victoria University of
Seychelles
Faculty of Sciences School of
Education
Somalia Garowe Puntland State
University
Communication & ODeL
South Africa Johanesbur
g
University of
the
Witwatersrand
Humanities History
South Africa Pretoria University of
Pretoria
Humanities Historical and
Heritage Studies
South Africa Thohoyan
dou
University of
Venda
Humanities and Social Sciences Development
Studies/History
Tanzania Zanzibar The State
University of
Zanzibar
School of National and Social
Sciences
Social Sciences
Tanzania Dar es
Salaam
The Open
University of
Tanzania
Arts and Social Sciences History, Philisophy
and Religious
Studies
Tanzania Dar es
Salaam
The open
University of
Tanzania
Faculty of Arts and Social
Sciences
History,
Archeology and
Heritage Studies
Tanzania Dar es
Salaam
University of
Dar es Salaam
Arts and Social Sciences History and
Archeology

20
Tanzania Dar es
Salaam
University
College of
Education
Faculty of Humanities and
Social Sciences
History
Chad Ndjamena University of
Ndjamena
Faculty of Humanities History
Togo Kara University of
Kara
Faculty of Humanities History
Togo Kara University of
Kara
Faculty of Humanities History
Tunisia Tunis University of
Tunis
Faculté des Sciences Humaines
et Sociales de Tunis et Ecole
Normale Supérieure de Tunis
History
Tunisia Tunis University of
Tunis
Faculty of Humanities of Tunis
Uganda Kampala Makerere
University
Uganda Kampala Makerere
University
Liberal and Performing Arts History,
Archaeology and
Heritage Studies
Uganda Kampala Makerere
University
Liberal and Performing Arts History,
Archaeology and
Heritage Studies
Uganda Kampala Kampala
International
University
Academic Affairs Curriculum
Development and
Innovation
Uganda Kampala Makerere
University
Liberal and Performing Arts
Uganda Kampala Makerere
University
History, Archaeology and
Heritage Studies
Uganda Kampala Makerere
University
Education
Uganda Kampala Kampala
International
University
College of Education, Open,
Distance and E-Learning
Zimbabwe Gweru Midlands State Arts and Sciences History
21
University
Source: UNESCO survey 2013
Question 2. Cities
In approximately 47.05% of the targetted countries, the participation of only one city was
recorded, namely the capital hosting a university. The rest can be distributed as follows:
- Ghana: 4 cities.
- Kenya and South Africa: 3 cities
- Burundi, Ethiopia and Tanzania: 2 cities
In most of the countries, only one city was involved in the questionnaire except for the six
countries below.
Question 3. Name of the University
1 university per country
Algeria: Oran Es Senia; Botswana: Botswana university; Egypt: university of Alexandria;
Gambia: university of Gambia; Lesotho: National University of Lesotho; Madagascar:
University of Tananarive (ANKATSO); Namibia: Humanities and Social Sciences; CAR:
university of Bangui; Senegal: Ucad; Seychelles: university of Seychelles; Somalia: Puntland
State University; Chad: university of Ndjamena; Togo: university of Kara; Tunisia: university
of Tunis; Zimbabwe: Midlands State University
The distribution for the other countries is as follows:
5 universities per country
- Burundi: University of Mwaro, University Espoir of Africa, University Lumiere of
Bujambura, Martin Luther King university, University of Burundi.
4 universities per country
- Kenya: University of Nairobi, Egerton University, Maseno University, Bondo
University College.
- Nigeria: University of Lagos, University of Port Harcourt, University of Ibadan,
Nasarawa State University, Keff.
- Tanzania: University College of Education, Open University of Tanzania, University
of Dar es Salaam, State University of Zanzibar.
3 universities per country.
- Ghana: Kwame Nkrumah University of Science and Technology, University of Cape
Coast, University of Ghana.

22
- South Africa: University of Venda, University of Pretoria, University of the
Witwatersrand.
2 universities per country.
- Ethiopia: Dire-Dawa University, Makele University
- Mozambique: Pedagogic university, Universidade Eduardo Mondiane (UEM)
- Niger: University Abdou Moumouni Djoffo of Niamey, Islamic University of Niger.
- DRC: University Devina Gloria of Butembo, University of Kinshasa.
- Uganda: Kampala International University, Makerere University
Question 4. Faculties
Out of 48 universities, there were 47 answers the names of which are indicated and six
answers the names of which were not indicated. This distribution of answers is structured as
follows:
The faculty of Arts and Sciences is the dominant factor in 13 answers out of 47. The
universities concerned include: Midlands State University (Zimbabwe), University of
Dar es Salaam (Tanzania), The Open University of Tanzania (Tanzania), University of
Lagos (Nigeria), University of Ibadan (Nigeria), Nasarawa State University Keffi
(Nigeria), University of Nairobi (Kenya), Maseno University (Kenya), Egerton
University (Kenya), Bondo University College University of Cape Coast (Kenya),
University of Gambia (UTG) (Gambia), University Yaounde 1(Cameroon);
The Faculties of Humanities, Humanities and Sciences and Social Sciences account
for 11 of the answers. As regards the Faculty of Humanities, the universities
concerned are those as follows: University of Botswana (Botswana), University of
Port Harcourt (Nigeria), University of Pretoria (South Africa) and University of the
Witwatersrand (South Africa).
The faculty of Humanities and Sciences is represented by the University of Venda
(South Africa).
Lastly, as regards the Faculty of Sciences and Social Sciences, included are universities such
as the Pedagogical University (Mozambique), Dire-Dawa University (Ethiopia), Kwame
Nkrumah University of Science and Technology (Ghana), Makele University (Ethiopia),
State University of Zanzibar (Tanzania) and University of Ghana.
The Faculty of Lansssssguage, Literature and Human Sciences is mentioned in 10
answers and refers to: the University of Burundi, the University of Antananarivo

23
(Madagascar), the University Abdou Moumouni Djoffo of Niamey (Niger), the
University of Bangui (CAR), the University Cheikh Anta Diop of Dakar (Senegal), the
University of Ndjamena (Chad), the University of Kara (Togo), the University of
Kinshasa (DRC) and the University of Tunis (Tunisia).
The Education Faculty provided four answers identifying: the University of
Alexandria (Egypt), the National University of Lesotho, the Faculty of Sciences and
Technologies of Education and Training (UCAD-Dakar, Senegal), and the Makerere
University (Uganda).
The other remaining faculties comprise:
• Geography, History and Environment Studies (Humanities and Social Sciences
de Namibia);
• Academic Affairs (Kampala International University);
• History, Archaeology and Heritage Studies (Makerere University of Uganda);
• Liberal and Performing Arts (Makerere University of Uganda);
• Communication & ODeL (Puntland State University of Somalia);
• School of National and Social Sciences (The State University of Zanzibar in
Tanzania);
• Political and Administrative Sciences, International Relations (Devina Gloria
of Butembo university in DRC);
• Faculty of Sciences (University of Seychelles);
• Faculty of arabic language and literature (Université islamique au Niger).
Question 5. Departments
Among the 42 answers, the majority, namely 83.3%, are departments of history (21) and
associated subjects (14): Geography, Archaeology and Heritage Studies, Heritage
Management, Cultural Contemporary, Cultural Studies, Heritage Studies, Political Studies,
Diplomatic Studies, Sciences, Philosophy and Religious, Anthropology, Strategic Studies,
Development Studies, Didactics.
The remaining answers were made up of departments of:
• Arts and Humanities;
• Humanities and Social Sciences/ History unit;
• Institute of African Studies;
• Language and Social Education;

24
• Arabic language;
• School of Education;
• Social Sciences;
• Curriculum, Development and Innovation.

25
Questions 6 to 14.
Table III List of Institutes, Centres, Higher Institutes
COUNTRY CITY INSTITUTE/SCHOOL
DEPARTMENT
S SECTIONS
Algeria Oran Unité de Recherche en Histoire
History of
Algeria, Africa
and the western
Mediterranean
Angola Luanda
Instituo Superior de Ciencias da
Educaçao (ISCED) Social Sciences
Sénégal Dakar
Institut Fondamental d’Afrique Noire
(IFAN) Humanities
Archaeology
Cote d'Ivoire Abidjan
Ecole Normale Supérieure d’Abidjan History and
Geography
Gambia Banjul National Centre for Arts and Culture
Research and
Documentation
Guinea Bissau Bissau Centre de Documentation et de
Recherche
Institut Nationale
des Études et de
la Recherche
History,
Memory and
Literature
Guinea Conakry
Institut National de Recherche et
d’Action Pédagogique (INRAP)
Division
Recherche t
innovation
Pédagogique
Research
Institute
Morocco Rabat
Centre de formation des inspecteurs de
l’enseignement
Didactique de
l’histoire et
géographie
Teaching of
History
Nigeria Lagos
Adeniran Ogunsanya College of
Education.Otto/Lijanikin.Lagos
Education
Foundation and
Administration
Central African
Republic Bangui
Centre Universitaire de Recherche et de
Documentation en Histoire et
Archéologie Centrafricaines
(CURDHACA).
Anthropology
History
General
Knowledge of
Africa

26
Sudan Alduem
National Centre for Curriculum and
Educational Research
Educational
Research
History and
Social Studies
Tanzania
Dar es
Salaam
Tanzanian Institute of Education Centre For
Curriculum
Training
Continuing
Education
Union des
Comores Moroni
Centre National de Documentation et
de Recherche (CNDRS) History
Comorian
Studies
Sénégal Dakar
Centre Régional de Formation du
Personnel de l'Education
Source: UNESCO Survey 2013
Questions 6-14. Higher education institutes
Records show 14 higher education establishments as follows:
7 Centres: Documentation and Research Centre (Guinea Bissau); Education inspectors
training centre (Morocco); Centre Universitaire de Recherche et de Documentation en
Histoire et Archéologie Centrafricaines (CURDHACA); National Centre for
Curriculum and Educational Research (Sudan); Centre National de Documentation et
de Recherche (CNDRS) Union of the Comoros; Centre Régional de Formation du
Personnel de l'Education (Sénégal); National Centre for Arts and Culture (Gambia)
1 College of Education: Adeniran Ogunsanya College of Education. Otto/Lijanikin
Lagos (Nigeria)
4 Institutes: Instituo Superior de Ciencias da Educaçao (ISCED) Angola; Institut
Fondamental d’Afrique Noire (IFAN) Sénégal; Institut National de Recherche et
d’Action Pédagogique (INRAP) Institut National de Recherche et d’Action
Pédagogique (INRAP) Guinea; Tanzanian Institute of Education
1 History Research Unit (Algeria)
1 Ecole Normale Supérieure d’Abidjan (Côte d’Ivoire)
All of these establishments have a history/social sciences department or a section for history,
archaeology, anthropology or social studies with the exception of the Centre Régional de
Formation du Personnel de l'Education (Sénégal). Algeria, Angola, Sénégal, Côte d’Ivoire,
Gambia and Nigeria made no mention of the sections in their departments.
Eight establishments are specialized in Education, the Didactics of History and Research and

27
Pedagogy.
Question 15. Others
Table IV List of other structures
COUN
TRY CITY OTHERS DEPARTMENTS SECTIONS
Kenya
Nairobi
Ministry of
Education:
Directorate of Quality
Assurance and Standarts
South
Africa Pretoria
Department of Basic
Education
Branch.S: Social
Mobilisation and Support
Services
Social Inclusion and
Partnership in
Education
Ghana Accra Library
Guinea
Bissau Bissau
Direction Générale
de l'Enseignement
Supérieur
/Université Amilcar
Cabral
Faculty of Arts and
Humanities
Source: UNESCO Survey 2013
Four other structures can be listed:
- Ministry of Education,
- Department of Basic Education,
- Library
- Direction Générale de l’Enseignement Supérieur d’une Faculté des Lettres et Sciences
Humaines/ Université Amilcar Cabral
NB: In all, response to the questionnaire involved:
- 48 African universities
- 47 faculties plus 4 others unidentified
- 36 history departments, 5 other departments, institutes or schools and 12 unidentified
departments.
- 14 institutes, Centres and Ecole Normale Supérieure
- 4 other establishments including three administrative and one library.
16. What is the status of your Institution?

28
Figure 2 What is the status of your Institution?
* NA Private Public (translation of words in graph)
Source: UNESCO Survey 2013
As regards the status of the institution, there were 120 answers, 103 of which were public,
namely 86%, 10 were private (8%) and 7 respondents did not specify the status of their
institution, namely 6%.
The graph shows a marked imbalance regarding the status of the institutions targetted. In fact,
in Africa, there is a predominance of public higher education. The low representation of
private institutions is linked to the emergence and belated recognition of private education
institutions in certain African countries.

29
17. What is the status of the informant? Figure 3 What is the status of the informant?
* NA Acadamic Others Teacher Student authority (specify)
(translation of words in graph)
Source: UNESCO Survey 2013
The survey revealed a marked imbalance between the status of informants and that of the
institutions. There was a predominance of teachers numbering 48 (40%) and academic
authorities numbering 25 (20.8%). There were 17 students (14%) and 9 « others » (7.5%): 1
academic authority, 1 assistant lecturer, 1 head of department, 1 doctor and senior lecturer in
history, 1 teacher-cum-researcher, 1 lecturer, 1 university lecturer and 1 non-identified.
However, there was evidence of a high ratio of non respondents with 21 (17.5%) including 1
researcher, 1 teacher-cum-researcher, 1 assistant professor, 1 senior lecturer, and 1 assistant
professor.
30
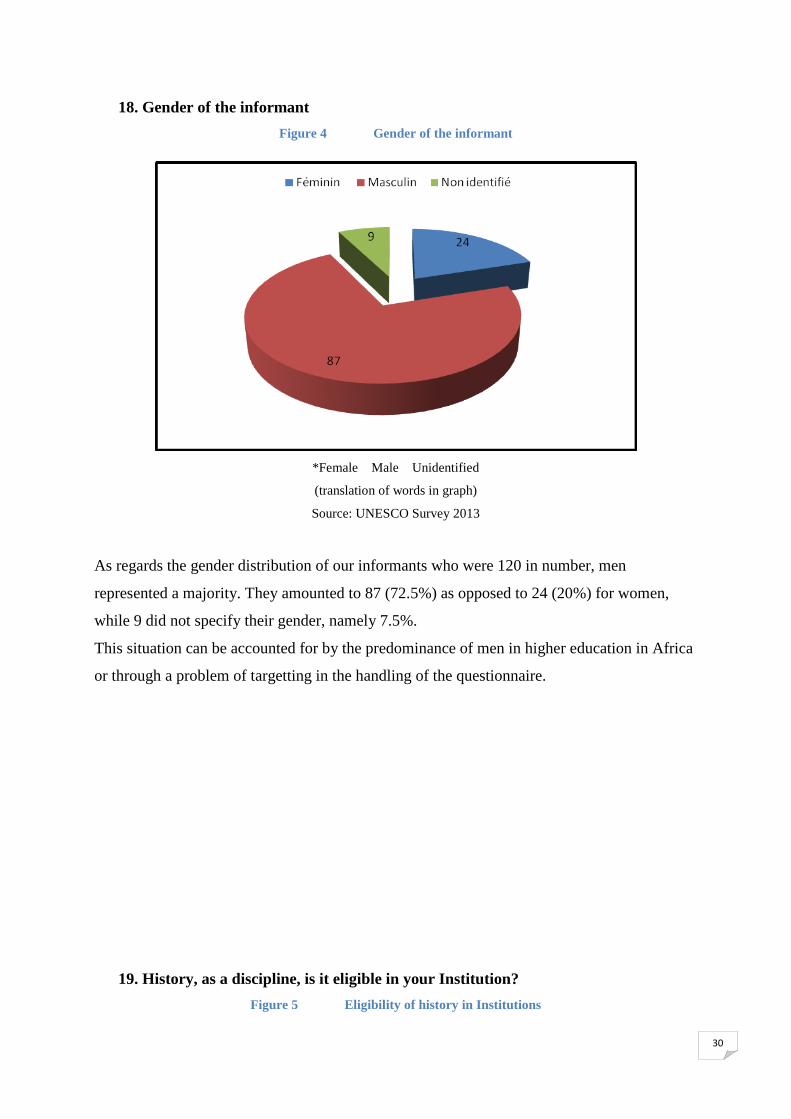
18. Gender of the informant Figure 4 Gender of the informant
*Female Male Unidentified
(translation of words in graph)
Source: UNESCO Survey 2013
As regards the gender distribution of our informants who were 120 in number, men
represented a majority. They amounted to 87 (72.5%) as opposed to 24 (20%) for women,
while 9 did not specify their gender, namely 7.5%.
This situation can be accounted for by the predominance of men in higher education in Africa
or through a problem of targetting in the handling of the questionnaire.
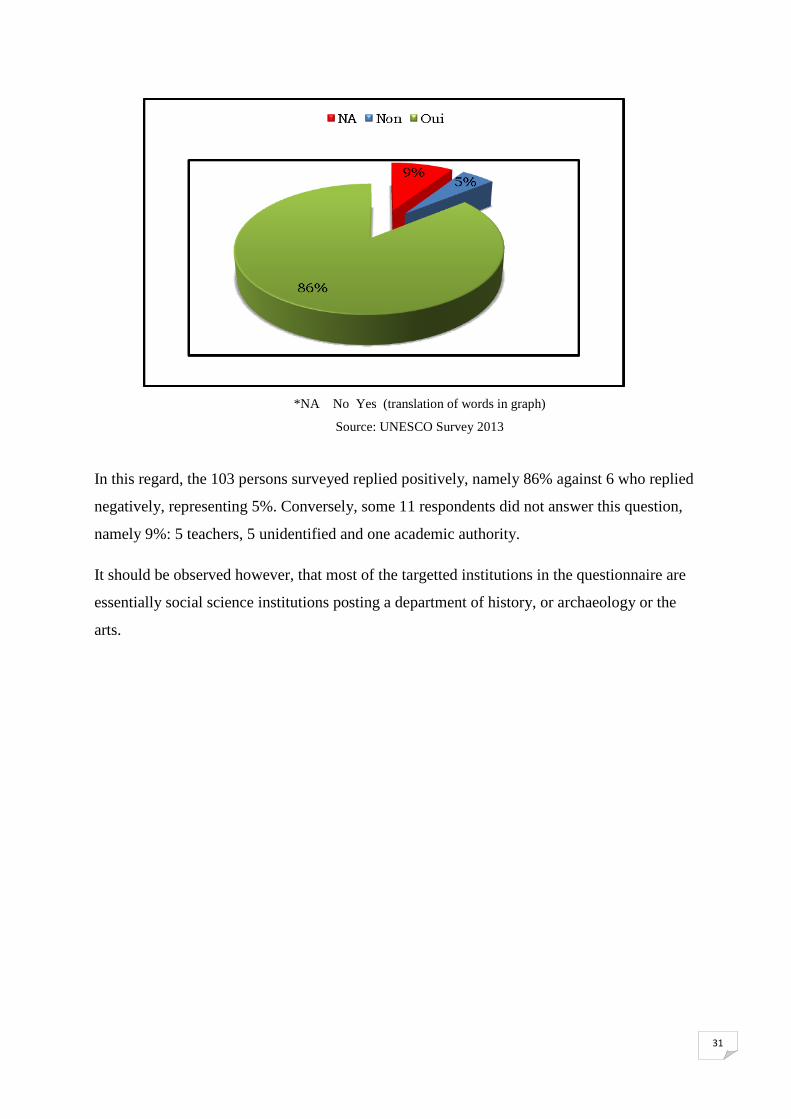
19. History, as a discipline, is it eligible in your Institution? Figure 5 Eligibility of history in Institutions
31
*NA No Yes (translation of words in graph)
Source: UNESCO Survey 2013
In this regard, the 103 persons surveyed replied positively, namely 86% against 6 who replied
negatively, representing 5%. Conversely, some 11 respondents did not answer this question,
namely 9%: 5 teachers, 5 unidentified and one academic authority.
It should be observed however, that most of the targetted institutions in the questionnaire are
essentially social science institutions posting a department of history, or archaeology or the
arts.

32
20. If so, in what form? Figure 6 The form of history taught
*Unidentified Didactic history Module NA Research project Syllabus Course unit
(translation of words in graph)
Source: UNESCO Survey 2013
Answers reveal that:
- 68 of the respondents questioned out of 120 replied “course unit” namely 56.7%. This
predominance would reflect the changes that had occurred in higher education through
the transition from the traditional system to the three-tier, university degree system.
- 17 persons answered “module” namely 14.2%
- 11 persons: “Research project” namely 9.2%.
- As regards the teaching of history in the form of a syllabus, only 2 persons answered,
namely 1.7%.
- Only 1 person for teaching in the form of “didactic history”, namely 0.8%.
In contrast, we received 4 NA (3.3%) and 17 (14.2%) who did not identify themselves.
33
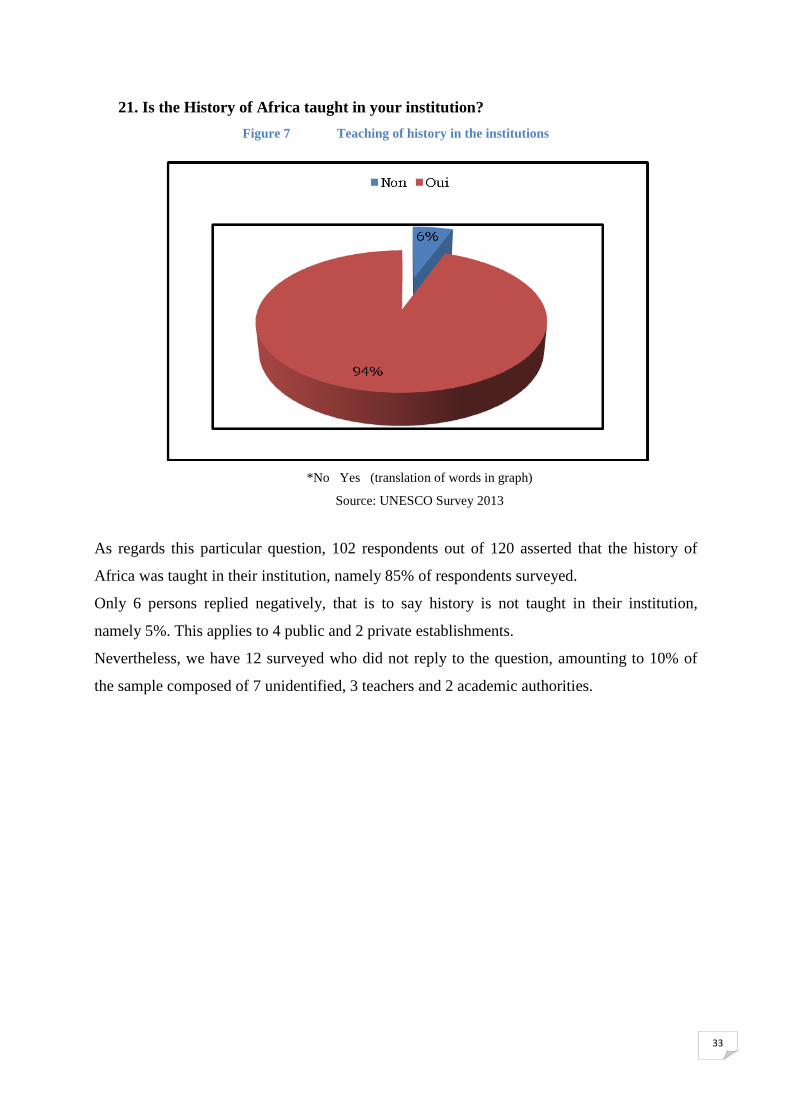
21. Is the History of Africa taught in your institution? Figure 7 Teaching of history in the institutions
*No Yes (translation of words in graph)
Source: UNESCO Survey 2013
As regards this particular question, 102 respondents out of 120 asserted that the history of
Africa was taught in their institution, namely 85% of respondents surveyed.
Only 6 persons replied negatively, that is to say history is not taught in their institution,
namely 5%. This applies to 4 public and 2 private establishments.
Nevertheless, we have 12 surveyed who did not reply to the question, amounting to 10% of
the sample composed of 7 unidentified, 3 teachers and 2 academic authorities.
34
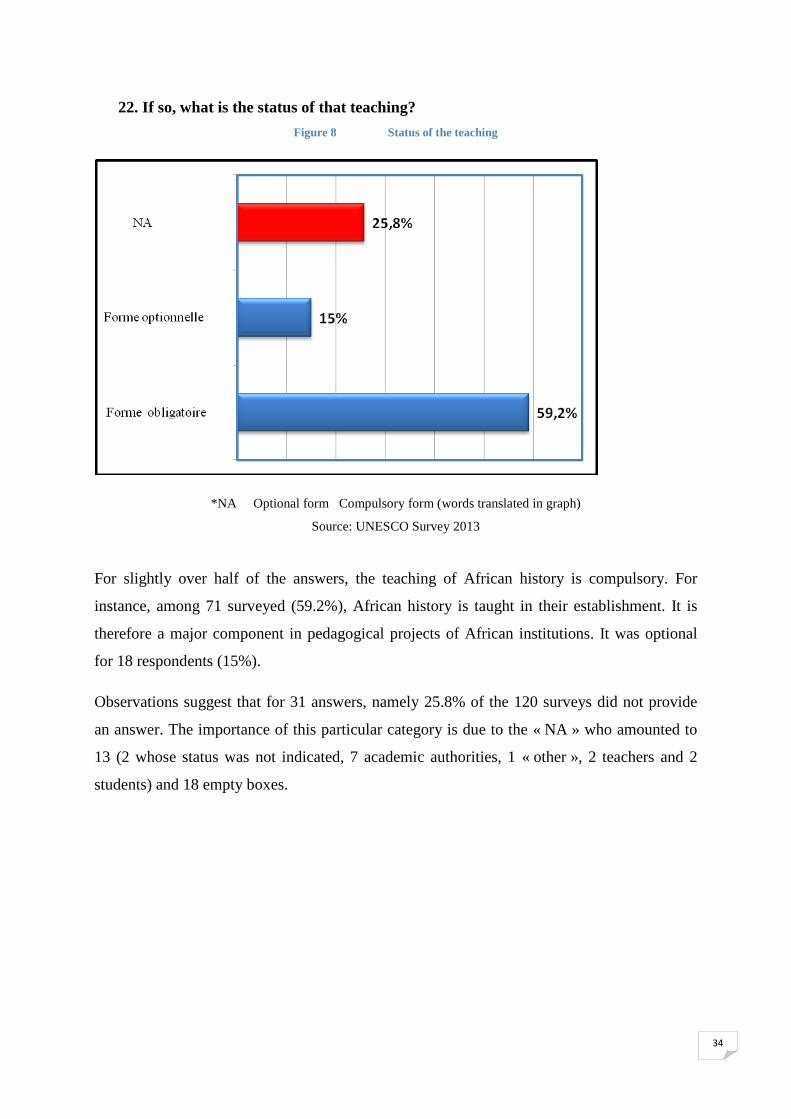
22. If so, what is the status of that teaching? Figure 8 Status of the teaching
*NA Optional form Compulsory form (words translated in graph)
Source: UNESCO Survey 2013
For slightly over half of the answers, the teaching of African history is compulsory. For
instance, among 71 surveyed (59.2%), African history is taught in their establishment. It is
therefore a major component in pedagogical projects of African institutions. It was optional
for 18 respondents (15%).
Observations suggest that for 31 answers, namely 25.8% of the 120 surveys did not provide
an answer. The importance of this particular category is due to the « NA » who amounted to
13 (2 whose status was not indicated, 7 academic authorities, 1 « other », 2 teachers and 2
students) and 18 empty boxes.

35
23. If the ticked form (N° 20) is “course unit”, what is the number of course units
devoted to the history of Africa in the first two-year cycle? Table V Number of CUs devoted to the history of Africa in the first two-year cycle
Number of CUs Students %
1 4 5,9%
2 2 2,9%
3 1 1,5%
4 6 8,8%
6 6 8,8%
7 3 4,4%
8 2 2,9%
9 1 1,5%
10 1 1,5%
11 1 1,5%
12 6 8,8%
14 2 2,9%
15 4 5,9%
16 2 2,9%
19 1 1,5%
23 1 1,5%
24 1 1,5%
25 1 1,5%
28 1 1,5%
30 3 4,4%
50 1 1,5%
NA 18 26,5%
Total 68 100,0%
Source: UNESCO Survey 2013
The aim of this table is to establish the number of course units devoted to the history of Africa
in the first two-year cycle on the basis of the 68 replies per teaching unit received for our
questionnaire.
The number of course units in the first two-year cycle varied from 1 to 50 according to the
answers pçrovided by the informants according to the following variations:

36
(4 informants answered with 1 CU), (2 informants with 2 CUs), (1 informant with 3 CUs), (6
informants with 4 CUs), (6 informants with 6 CUs), (3 informants with 7 CUs), (2 informants
with 8 CUs), (1 informant with 9 CUs), (1 informant with 9 CUs), (1 informant with 9 CUs),
(1 informant with 9 CUs), (1 informant with 10 CUs), (1 informant with 11 CUs), (6
informants with 12 CUs), (2 informants with 14 CUs), (4 informants with 15 CUs), (2
informants with 16 CUs), (1 informant with 19 CUs), (1 informant with 23 CUs), (1
informant with 25 CUs), (1 informant with 28 CUs), (3 informants with 30 CUs), (1
informant with 50 CUs).
The 68 respondents surveyed provided the following answers:
- The highest number was 6, which occurred on three occasions, which means it had the
highest frequency and represented 8.8% of the total number with respectively 4 CUs,
6 CUs and 12 CUs.
- It was followed by the number 4 which twice produced a relative value of 5.9% and
gave respectively 1 CU and 15 CUs.
- Group 3 appeared on two occasions with a relative value of 4.4%, with respective
scores of 7CUs and 30CUs.
Nevertheless, it has to be recognized that out of the 68 persons that opted for the course units,
18 of them did not indicate how many CUs represented 26.5% of the surveyed.
In all, out of 50 informants, some listed as many as 50 CUs. This can be accounted for by
incomprehension of the term “course unit” attributable to the linguistic versions, that is
French and English.
A problem of clarification and sharing of concepts is raised in this instance as informants who
operate in several countries with different languages may inevitably have varying
comprehension of such and such a concept. Disparities in answers illustrate this quite clearly.
Those who offered more than 10 course units are in this particular group. Accordingly, 17
answers out of 68 would strike us as being erroneous for the three-tier university system
which used CUs. A CU corresponds to a particular subject and each CU has a value of 6
credits: A credit is equal to 20 hours, namely 120 hours per CU. The manual processing of
data revealed, for example, that the figure of 50 is expressed as a percentage (50%).
24. If the ticked form (N° 20) is “Module”, what is the number of modules devoted to
the history of Africa in the first two-year cycle?

37
Table VI Number of modules devoted to the history of Africa in the first two-year cycle
Number of modules Numbers %
1 1 5,9%
2 6 35,3%
3 2 11,8%
4 1 5,9%
8 2 11,8%
19 1 5,9%
NA 4 23,5%
Total 17 100,0%
Source: UNESCO Survey 2013
As regards the number of modules for the first two-year cycle, 17 informants answered the
question with figures which varied from 1 to 19 as opposed to 4 informants who did not
provide any answer (NA).
The number of modules equal to 2 is the largest number (6), respresenting 35.3%. This is
followed by numbers of modules 3 to 8 with respectively figures of 2 and a relative value of
11.8% for each of them.
It should be noted that 4 out of the 17 who referred to « Module », did not provide any
answer, namely 23.5%.
One respondant provided a mistaken answer with 19 modules. It should be borne in mind that
there is a degree of incomprehension of the concepts facing informants. This may explain
why some answers (19 modules) which seem excessive for the teaching of history in the first
two-year cycle as a module is a unit comprising four different subjects. It is semestrial and
amounts to 75 hours of teaching and evaluation. For example, if one were to apply to the 19
modules indicated, that would result in 19 modules multiplied by 75 equals 1475 hours, which
is hardly plausible.
25. If the ticked form (N° 20) is « Course Unit », what is the number of course units
devoted to the history of Africa in the second two-year cycle? Table VII Number of CUs devoted to the history of Africa in the second cycle
Answers Number %

38
1 3 7,0%
2 5 11,6%
3 2 4,7%
4 9 20,9%
5 1 2,3%
6 8 18,6%
8 3 7,0%
10 3 7,0%
11 2 4,7%
13 1 2,3%
14 1 2,3%
15 2 4,7%
16 1 2,3%
35 1 2,3%
96 1 2,3%
Total 43 100,0%
Source: UNESCO Survey 2013
The number of answers regarding « course units » devoted to the history of Africa in the
second cycle was 43. Among the latter, 9 persons surveyed answered 4 CUs, namely 20.9%, 8
others referred to 6 CUs amounting to 18.6% of the sample. 5 others gave an answer of 2
CUs, namely 11.6%. The rest can be identified as follows: 3 informants referred to 1 CU, 2 by
3 CUs, 1 by 5, 3 by 8, 3 by 10, 2 by 11, 1 by 13, 1 by 14, (2 by 15, 1 by 1), 1 by 35 and 1 by
96.
It must be observed that those who answered with 35 and 96 units did not necessarily
understand the question. It is unthinkable that 35 course units would be required for one
specific subject, and 96 units still less so. The problem of information regarding targets comes
to the fore once again for the second cycle of university education.
As underlined in the commentary on the first two-year cycle, some respondents answered
with percentages while others gave specific figures in order to determine the number of
course units for the second cycle.
Accordingly, some answers may perhaps refer or rather refer to a number of hours rather than
a number of course units. For example 35CU x 120h= 4200 hours. In point of fact, manual
processing has revealed that the figure of 96 was actually expressed as a percentage.

39
26. If the ticked form (N° 20) is “Module”, what is the number of modules devoted to
the history of Africa in the second cycle? Table VIII Number of modules devoted to the history of Africa in the second cycle
Number %
1 1 33.3%
3 1 33.3%
10 1 33.3%
Total 3 100.0%
Source: UNESCO Survey 2013
Only three answers regarding « Module », featured in the survey. Among the three
respondents, each provided an answer referring respectively to 1, 3 and 10 modules. This
meant a relative value for each respondent of 33.33%. 10 modules do not strike us as being a
reasonable figure.

40
27. If the ticked form (N° 20) is “Course Unit”, what is the number of course units
devoted to the history of Africa in the third/Doctorate cycle? Table IX Number of CUs devoted to the history of Africa in the third/Doctorate cycle
Number CUs Number %
1 1 10
2 2 20
4 2 20
5 1 10
8 1 10
10 1 10
19 1 10
20 1 10
Total 10 100% Source: UNESCO Survey 2013
This particular group is comprised of 10 persons. 2 persons estimated it at 2 CUs and 2 at
4 CUs, namely each would be 20%. But the rest of the group, namely six persons, adopted
individual judgements as shown in the following distribution: 1 CU, 5 CUs, 8 CUs, 10 CUs,
19 CUs and 20 CUs.
These answers raised a particular problem as the third/doctorate cycle organizes seminars on
research and the drafting of theses which constitute the main activities.

41
28. If the ticked form (N° 20) is “Module”, what is the number of modules devoted to
the history of Africa in the third cycle? Table X Number of modules devoted to the history of Africa in the third cycle
Number of
modules Number %
1 1 7%
2 4 29%
3 2 14%
4 1 7%
5 1 7%
6 1 7%
8 2 14%
19 1 7%
20 1 7%
Total 14 100% Source: UNESCO Survey 2013
Answers came from 14 people with regard to the module on the history of Africa in the third
cycle. Among the 14 respondents, 4 referred to 2 modules, namely 29% of the total quantity,
followed by two persons who quoted 3 modules and 2 others who quoted 8 modules, each
accounting for 14%. The rest of the group was composed of 6 other respondents, each of
whom provided his/her own estimate: 1 module, 4 modules, 5 modules, 6 modules, 19
modules and 20 modules.
The remark on question 27 is valid for question 28.

42
29. What type of aid in general do you prefer to use for teaching the history of
Africa? (you may tick several boxes…) Figure 9 Type of aid used for the teaching of the history of Africa
General works Specialised works CD/DVD Website
(translation of words in graph) Source: UNESCO Survey 2013
The most commonly-used aids are general works together with specialized ones accounting
for respectively 87.1% and 82.5%. Conversely, respondents who ticked CD/DVD amounted
to 31.2%. This suggests that the aid in this form is less used than other aids. Recourse to the
website is estimated at 39.8%.
It is difficult to determine true numbers as respondents ticked several answers, the question
having provided multiple choice.

43
30. What historical approach would you prefer in your institution? Figure 10 Favoured historical approach in the institutions
*Chronological-Thematic Approach Thematic Approach Chronological Approach NA
(translation of words in graph)
Source: UNESCO Survey 2013
Out of the sample of 120 persons, 87 of them gave their preference to the chronological-
thematic approach, namely 72.5 percent. Only 7 persons surveyed out of the 120 expressed a
preference for a chronological approach, namely 5.8% while for the so-called thematic
approach, respondents were no more numerous than 6, namely 5%.
Conversely, 20 out of the 120 persons surveyed, namely 16.7%, did not respond to this
question: 7 unidentified, 6 academic authorities, 5 teachers, 1 other and 1 student.
44
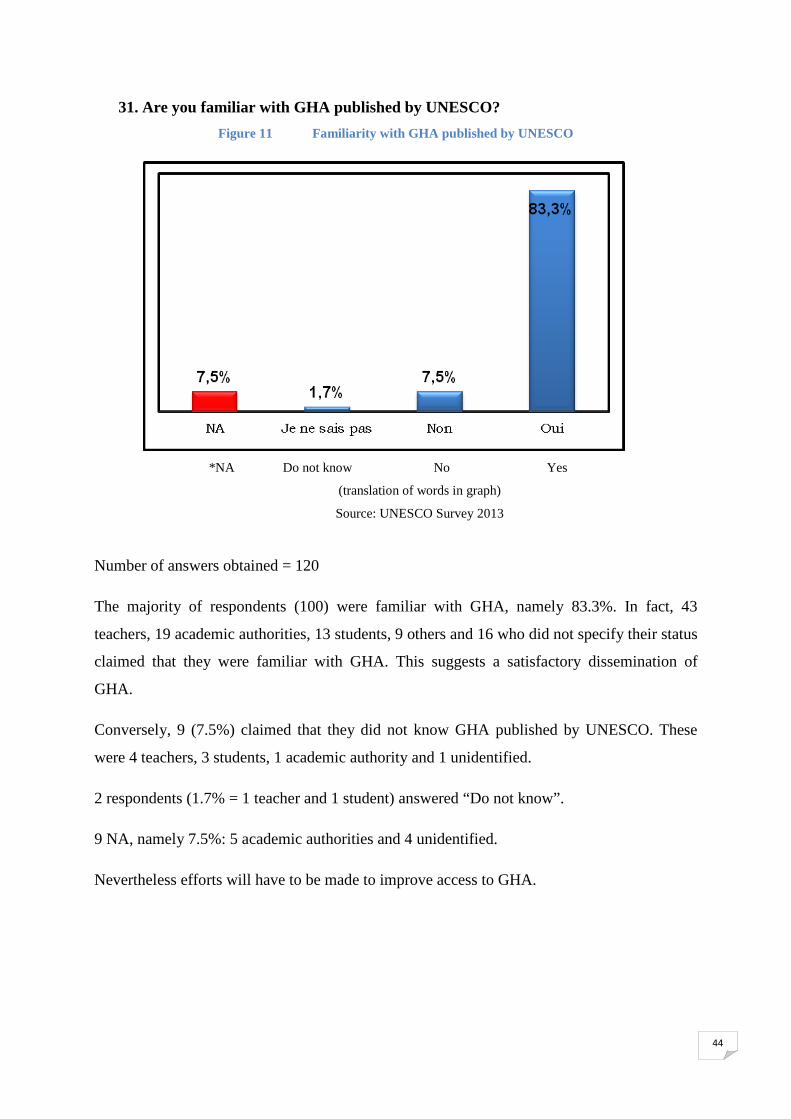
31. Are you familiar with GHA published by UNESCO? Figure 11 Familiarity with GHA published by UNESCO
*NA Do not know No Yes
(translation of words in graph)
Source: UNESCO Survey 2013
Number of answers obtained = 120
The majority of respondents (100) were familiar with GHA, namely 83.3%. In fact, 43
teachers, 19 academic authorities, 13 students, 9 others and 16 who did not specify their status
claimed that they were familiar with GHA. This suggests a satisfactory dissemination of
GHA.
Conversely, 9 (7.5%) claimed that they did not know GHA published by UNESCO. These
were 4 teachers, 3 students, 1 academic authority and 1 unidentified.
2 respondents (1.7% = 1 teacher and 1 student) answered “Do not know”.
9 NA, namely 7.5%: 5 academic authorities and 4 unidentified.
Nevertheless efforts will have to be made to improve access to GHA.
45
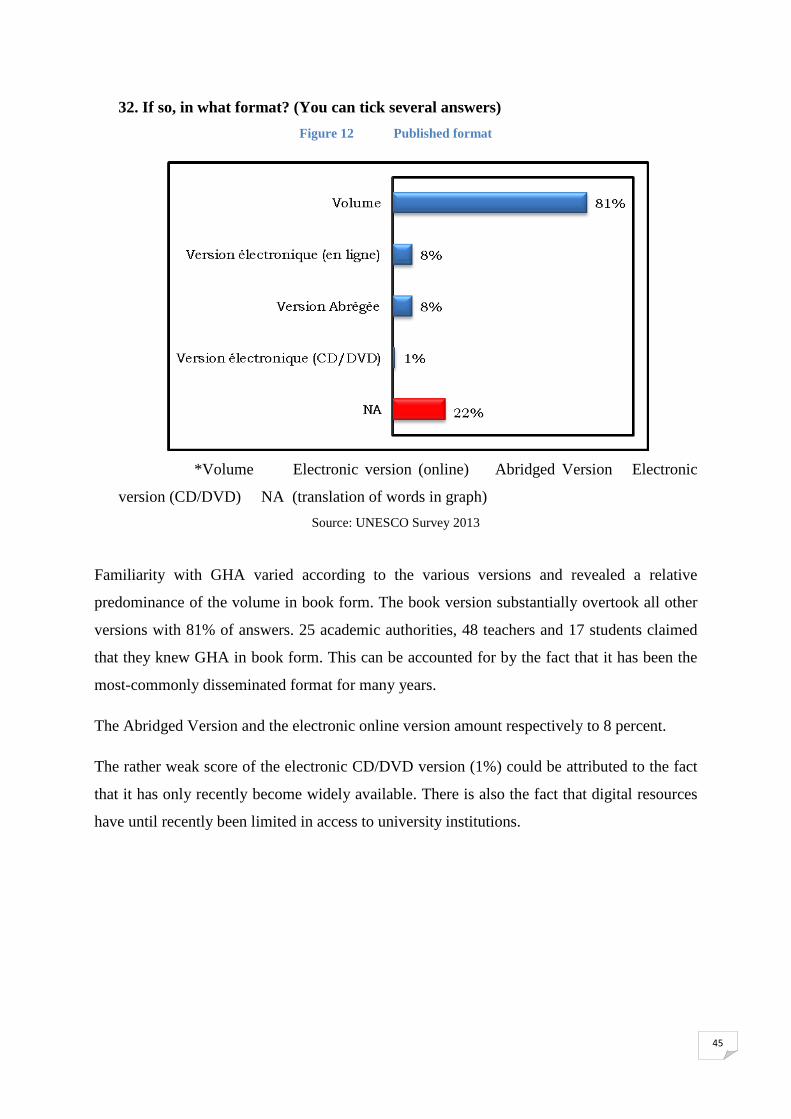
32. If so, in what format? (You can tick several answers) Figure 12 Published format
*Volume Electronic version (online) Abridged Version Electronic
version (CD/DVD) NA (translation of words in graph) Source: UNESCO Survey 2013
Familiarity with GHA varied according to the various versions and revealed a relative
predominance of the volume in book form. The book version substantially overtook all other
versions with 81% of answers. 25 academic authorities, 48 teachers and 17 students claimed
that they knew GHA in book form. This can be accounted for by the fact that it has been the
most-commonly disseminated format for many years.
The Abridged Version and the electronic online version amount respectively to 8 percent.
The rather weak score of the electronic CD/DVD version (1%) could be attributed to the fact
that it has only recently become widely available. There is also the fact that digital resources
have until recently been limited in access to university institutions.
46
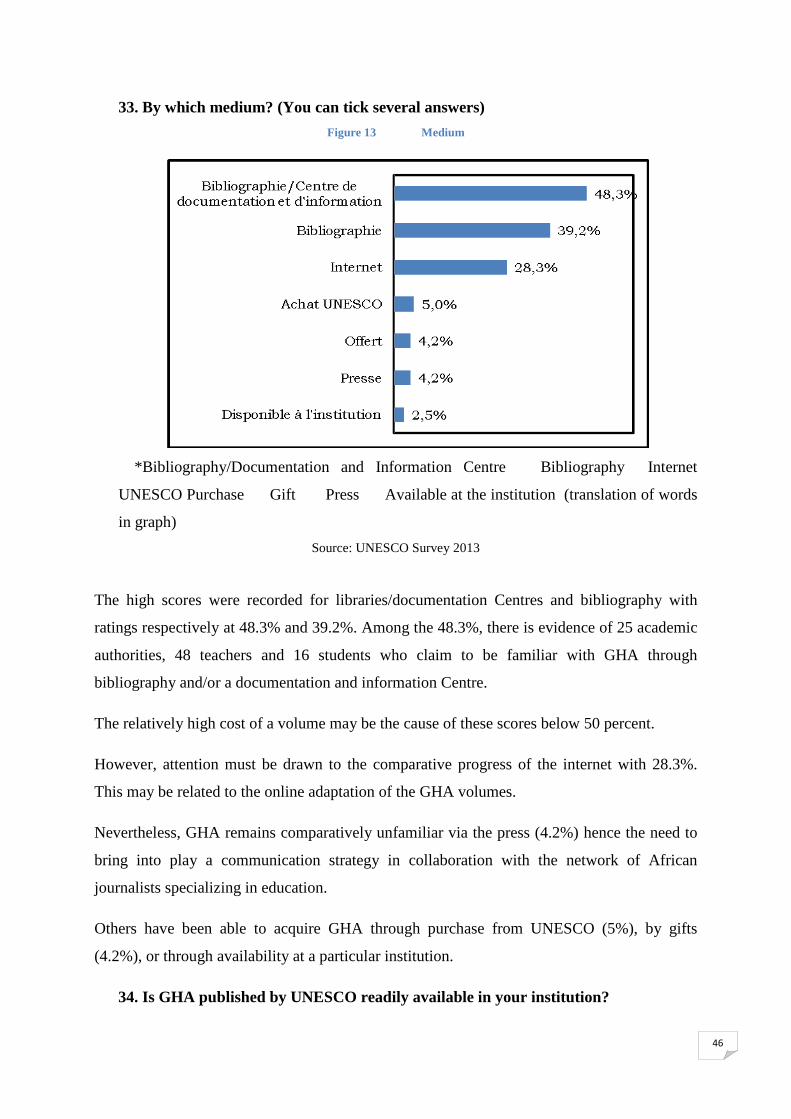
33. By which medium? (You can tick several answers) Figure 13 Medium
*Bibliography/Documentation and Information Centre Bibliography Internet
UNESCO Purchase Gift Press Available at the institution (translation of words
in graph) Source: UNESCO Survey 2013
The high scores were recorded for libraries/documentation Centres and bibliography with
ratings respectively at 48.3% and 39.2%. Among the 48.3%, there is evidence of 25 academic
authorities, 48 teachers and 16 students who claim to be familiar with GHA through
bibliography and/or a documentation and information Centre.
The relatively high cost of a volume may be the cause of these scores below 50 percent.
However, attention must be drawn to the comparative progress of the internet with 28.3%.
This may be related to the online adaptation of the GHA volumes.
Nevertheless, GHA remains comparatively unfamiliar via the press (4.2%) hence the need to
bring into play a communication strategy in collaboration with the network of African
journalists specializing in education.
Others have been able to acquire GHA through purchase from UNESCO (5%), by gifts
(4.2%), or through availability at a particular institution.
34. Is GHA published by UNESCO readily available in your institution?

47
Figure 14 Availability of GHA in academic institutions
*NA Do not know No Yes (translation of words in brackets)
Source: UNESCO Survey 2013
Slightly more than half of respondents, namely 68 (56.7%) claimed that GHA was available
in their institution. Those concerned included 31 teachers, 16 academic authorities, 8 students,
5 “others” and 8 unidentified.
Conversely, 35 (29.2%) of respondents asserted that GHA was not available in their
institution: 12 teachers, 8 unspecified persons, 7 students, 4 academic authorities and
4 “others”.
Evidence reveals 12 NA, namely 10%, distributed as follows: 5 academic authorities,
5 undetermined profiles and 2 students.
Respondents were in the number of 5 (4.2%) to have answered “Do not know”: 3 teachers and
2 students.

48
Hence the need to develop a strategy to petition partners in development to provide the
African universities with the 8 volumes of GHA.
35. If GHA is available, is it in the book format?
Figure 15 Availability of the book format of GHA in institutions
*NA No Yes (translation of words in graph)
Source: UNESCO Survey 2013
The 120 answers can be broken up as follows:
65 respondents (54%) stated that GHA was available in book form in their institutions.
Conversely, 4 respondents (3%), including 2 teachers and 2 academic authorities, asserted
that GHA was not available in book form in their establishments.
The proportion of NA scores assessed at 51 (43%) raises a problem. It respresents
respectively 15 teachers, 13 unidentified, 10 academic authorities, 9 students and 4 “others”.
It is paradoxical to observe such a high number of teachers and students, and even academic
authorities, who are not aware of the existence of GHA in its book form in the libraries of
their own institutions.
Accordingly, are efforts required to ensure better availability of the volumes in the
institutions.

49
36. If so, how many volumes in the book form? Table XI Number of volumes in book form
Number of volumes
Numbers %
1 2 3,1%
2 8 12,3%
3 7 10,8%
4 6 9,2%
5 2 3,1%
6 1 1,5%
7 6 9,2%
8 26 40,0%
NA 7 10,8%
Total 65 100,0% Source: UNESCO Survey 2013
Out of 65 answers provided:
• 40% of respondents, namely 26, were in possession of the entire GHA collection of 8
volumes.
• 12,3% (8): 2 volumes
• 10,8% (7): 3 volumes
• 9,2% (6): 4 volumes
• 9,2% (6): 7 volumes
• 3,1% (2): 5 volumes
• 3,1% (2): 1 volume
• 1,5% (1): 6 volumes
• 10.8 % (7) did not answer this question (NA).
Access to and dissemination of GHA have been reduced by its high cost, hence the need to
lower the cost of each volume.
37. If GHA were available in your institution, would it be in abridged form? Figure 16 Availability of the abridged volume in institutions

50
* NA Yes No Do not know
(translation of words in graph)
Source: UNESCO Survey 2013
Out of 120 answers, there are 25 with “Yes”, namely 20.8%: 12 teachers, 6 academic
authorities, 3 “Others”, 2 students and 2 unidentified.
28 (23.3%) answered “No” including 13 teachers, 8 academic authorities, 3 unidentified,
2 “Others”, and 2 students.
7 (5.8%) answered “I Do not know” including 5 teachers and 2 students.
A substantial proportion of NA was observed. In fact, 60 (50%) did not provide an answer to
this question: 18 teachers, 16 unidentified, 11 academic authorities, 11 students and
4 “Others”.
Paradoxically, this particular version would not seem to have played its part in popularizing
GHA among students, researchers and teachers. The abridged version is unfamiliar among
teachers while 12 of them stated that it was available, 36 (13 Nos, 5 “Do not knows” and
18 NA) were not of the same opinion.
51
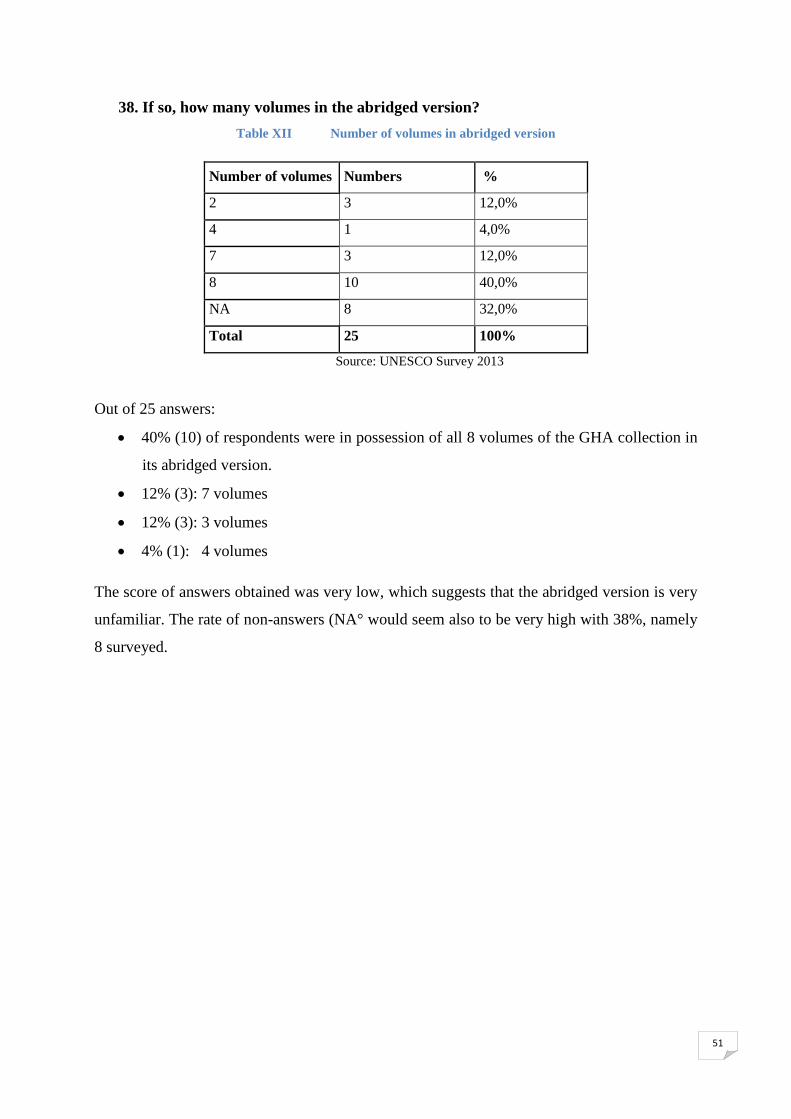
38. If so, how many volumes in the abridged version? Table XII Number of volumes in abridged version
Number of volumes Numbers %
2 3 12,0%
4 1 4,0%
7 3 12,0%
8 10 40,0%
NA 8 32,0%
Total 25 100%
Source: UNESCO Survey 2013
Out of 25 answers:
• 40% (10) of respondents were in possession of all 8 volumes of the GHA collection in
its abridged version.
• 12% (3): 7 volumes
• 12% (3): 3 volumes
• 4% (1): 4 volumes
The score of answers obtained was very low, which suggests that the abridged version is very
unfamiliar. The rate of non-answers (NA° would seem also to be very high with 38%, namely
8 surveyed.

52
39. If GHA is available, is it in an electronic version? (you can tick several answers) Figure 17 Availability of the electronic version in institutions
*On line CD/DVD NA (translation of words in graph)
Source: UNESCO Survey 2013
Out of 120 answers, 16 (13.3%) were in possession of GHA online: 6 teachers, 5 academic
authorities, 2 students, 2 “Others” and 1 unidentified.
11 (9.2%) including 7 teachers, 2 academic authorities and 2 students, were in possession of
GHA in the CD/DVD version.
93 NA (77.5%) were recorded including 35 students, 20 unidentified, 18 academic authorities,
13 students and 7 “Others”.
This very high score of NA proves that a very limited proportion of institutions possess the
electronic version of GHA. This situation could be attributable to a problem of access or the
recent nature of the dissemination of GHA in its electronic version.

53
40. Do you have your own copy of GHA? Figure 18 Individual ownership of GHA
*NA No Yes (translation of words in graph)
Source: UNESCO Survey 2013
The number of answers was 120.
67 (56%) of informants had their own copy of GHA in all formats combined. In fact they
included 35 teachers, 13 academic authorities, 7 students and 4 “Others.
Furthermore, we noted that 37 respondents, (31%) did not have their own copy of GHA: 11
teachers, 8 academic authorities, 7 students, 6 unidentified and 5 « Others ».
16 NA (13%) were recorded including 7 unidentified, 4 academic authorites, 2 teachers and 3
students.
Out of a total of 44% (31% of No and 13 without an opinion) of informers, including 13
teachers, were not in possession of GHA.This is very considerable.

54
41. If you own your own GHA, is it in book form ? Figure 19 Personal ownership of GHA in book form
*NA No Yes (translation of words in graph)
Source: UNESCO Survey 2013
120 answers were received for this question.
44 respondants (37%) owned GHA in book form: 23 teachers, 11 academic authorities, 6
unidentified 2 students 2 « Others ».
18 respondants (15%) did not possess GHA in book form: 9 teachers, 4 students, 2 academic
authorites, 2 unidentified and 1 « Other ».
Records revealed 58 NA (48%): 16 teachers, 13 unidentified, 12 academic authorities, 11
students and 6 « Others».
Account should be taken of the high number of teachers who do not possess GHA in book
form (9) or because they did not answer the question (16). This leads to a total of 25 whereas
only 23 actually state that they own a GHA in book form.
There is a need for a policy to popularize GHA for the benefit of teachers and students.

55
42. If so, how many volumes in book form? Figure 20 Number of volumes in book form
Source: UNESCO Survey 2013
Out of 44 respondants in possession of GHA in book form:
Only 29.5% were in possession of the complete 8-volume collection of GHA which is a very
limited figure. Those who possessed 1 and 2 volumes accounted for 20.5 each.
13.6 % of respondants owned 4 volumes and 9.1% owned 3.
Furthermore, those who owned 5 and 7 volumes only represented 2.3 et 4.5%. respectively.
A promotion policy must be undertaken to ensure that GHA is within the reach of users.

56
43. If you own GHA, is it in its abridged version? Figure 21 Individual ownership of the abridged version of GHA
Source: UNESCO Survey 2013
Very few informants, estimated to be 17 (14%) actually owned GHA in its abridged version:
They were 11 teachers, 2 academic authorities, 2 students and 2 unidentified.
33 répondants (28%) declared that they did not own GHA in its abridged version: 9
academic authorities, 14 teachers, 4 unidentified, 4 students and 2 “Others”.
70 NA (58%): 24 teachers, 15 academic authorities, 15 unidentified, 10 students, and 6
“Others”.*

57
44. If so, how many volumes do you possess of the abridged version? Figure 22 Number of volumes in the abridged version
Source: UNESCO Survey 2013
Among the 17 respondants,
- 10 (58.8%) had all 8 volumes in the abridged version: 4 teachers, 3 academic
authorities, one student and 2 « Others ».
- 3 possessed 7 volumes (17.6%): 1 teacher, 1 academic authority and 1 « Other ».
- 3 (17.6%) of others possessed 2 volumes: 2 teachers and 1 unidentified.
- 1 (5.8%) stated that he was in possession of 4 volumes: 1 teacher.

58
45. If you have your own copy of GHA, is it in its electronic (online) version? Figure 23 Personal possession of the online/electronic version of GHA
*NA No Yes (translation of words in graph)
Source: UNESCO Survey 2013
A very limited number of informants 17 (14%) actually possessed GHA online in its
electronic version: 11 teachers, 2 students, 2 academic authorities, 2 unidentified. This may be
accountable to the fact there is a lack of information on the availability of this online version.
Those who answered « No » accounted for 30 respondants (25%), namely 11 teachers, 9
academic authorities, 4 unidentified, 3 « Others » and 2 students.
73 persons (61%), namely 25 teachers, 15 unidentified, 14 academic authorities, 13 students
and 6 « Others » did not respond to this question.
Efforts must be made to develop a strategy to foster greater awareness of the existence of an
online version among university institutions (flyers, posters, etc) and on the UNESCO website
through a publicity banner.
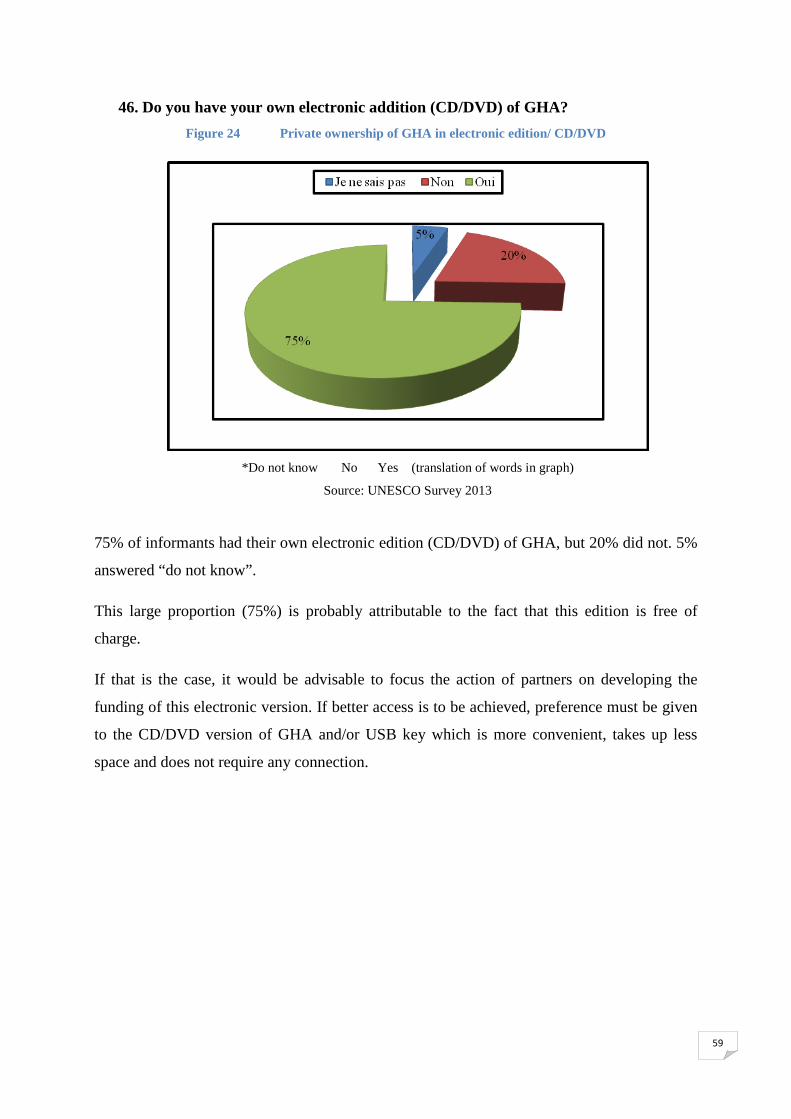
59
46. Do you have your own electronic addition (CD/DVD) of GHA? Figure 24 Private ownership of GHA in electronic edition/ CD/DVD
*Do not know No Yes (translation of words in graph)
Source: UNESCO Survey 2013
75% of informants had their own electronic edition (CD/DVD) of GHA, but 20% did not. 5%
answered “do not know”.
This large proportion (75%) is probably attributable to the fact that this edition is free of
charge.
If that is the case, it would be advisable to focus the action of partners on developing the
funding of this electronic version. If better access is to be achieved, preference must be given
to the CD/DVD version of GHA and/or USB key which is more convenient, takes up less
space and does not require any connection.
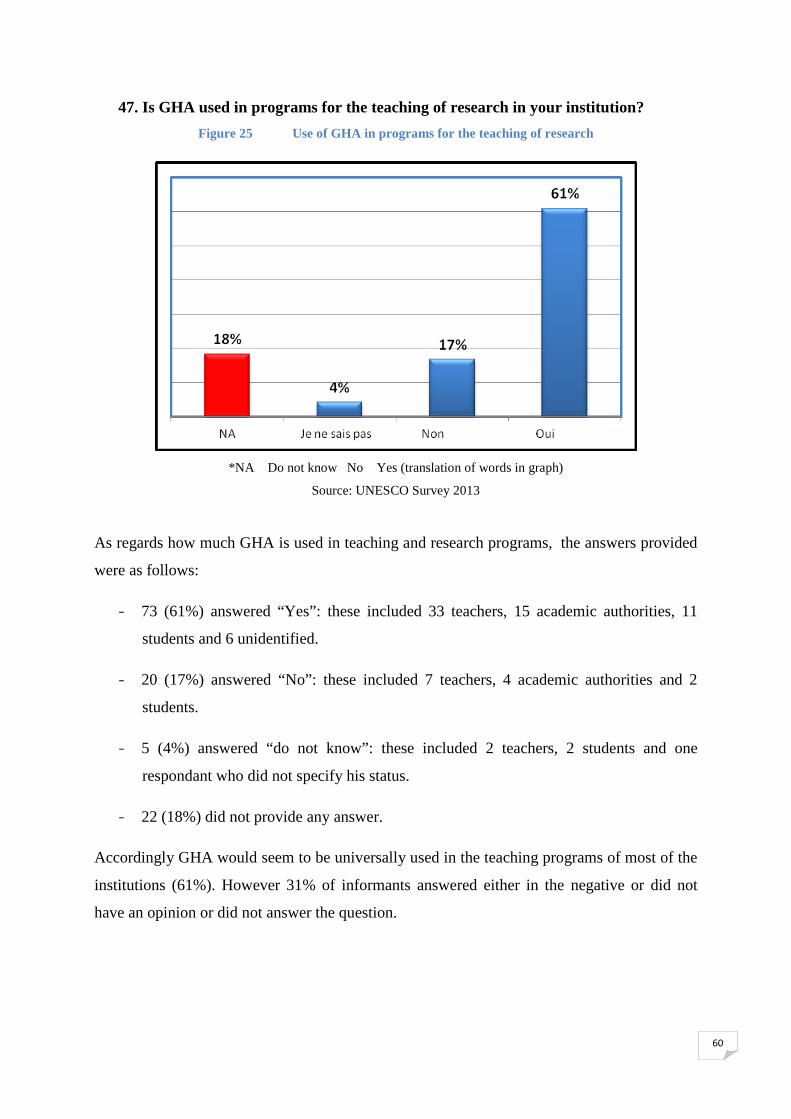
60
47. Is GHA used in programs for the teaching of research in your institution? Figure 25 Use of GHA in programs for the teaching of research
*NA Do not know No Yes (translation of words in graph)
Source: UNESCO Survey 2013
As regards how much GHA is used in teaching and research programs, the answers provided
were as follows:
- 73 (61%) answered “Yes”: these included 33 teachers, 15 academic authorities, 11
students and 6 unidentified.
- 20 (17%) answered “No”: these included 7 teachers, 4 academic authorities and 2
students.
- 5 (4%) answered “do not know”: these included 2 teachers, 2 students and one
respondant who did not specify his status.
- 22 (18%) did not provide any answer.
Accordingly GHA would seem to be universally used in the teaching programs of most of the
institutions (61%). However 31% of informants answered either in the negative or did not
have an opinion or did not answer the question.

61
48. Does GHA meet your expectations? Figure 26 Expectations of GHA
* NA Do not know No Yes
(translation of words in graph)
Source: UNESCO Survey 2013
As regards the degree to which GHA meets users’ expectations, 120 answers were provided
as follows:
- 88 (73%) answered “Yes”: these included 41 teachers, 16 academic authorities, 12
students, 12 unidentified and 7 “Others”.
- 4 (3%) answered “No”: These included one academic authority, one teacher, one
student and one unidentified respondent.
- 7 (6%) answered “do not know”: these included 3 academic authorities, 2 teachers,
one student and one “Other”.
- 21 (18%) did not provide any answer.
For slightly less than three quarters of the informants, GHA does meet their expectations.
The combined score of other answers (NA, Do not know and No) amount to 27% which is
considerable.

62
49. If so, in what way?
Analysis of contents (Cf annex)
50. Do you use GHA? Figure 27 Use of GHA
*NA No Yes (translation of words in graph)
Source: UNESCO Survey 2013
As regards the use of GHA, the answers provided were as follows:
- 91 (76%) answered « Yes »: these included 41 teachers, 16 academic authorities, 14
students, 13 unidentified and 7 « Others ».
- 12 (10%) answered « No »: these included 4 teachers, 3 students, 2 academic
authorities, 2 unidentified and 1 « Other ».
- 17 (14%) did not provide any answer (NA): these included 3 teachers, 7 academic
authorities, 6 unidentified and 1« Other ».
The majority of the informants (76%) stated that they used GHA. This group was composed
largely of teachers, estimated to be 41 in number.

63
51. If so, how frequently do you use it? Figure 28 Frequency of use of GHA
*Do not know occasionally regularly
(translation of words in graph) Source: UNESCO Survey 2013
As regards how frequently GHA was used, the answers provided were as follows:
- 59 (49.2%) answered “regularly”: these included 29 teachers, 14 academic authorities,
6 students, 6 unidentified and 4 “Others”.
- 34 (28.3%) “occasionally”: these included 12 teachers, 8 students, 8 unidentified, 3
academic authorities and 3 “Others”.
- 27 (22.5%) could not say how frequently they used GHA: these included 8 academic
authorities, 7 teachers, 7 unidentified, 3 students and 2 “thers”.
GHA was used regularly in 49.2% of cases. This is a very limited score whereas the combined
scores of “occasionally” and of “I do not know” amount to 50.8%.

64
52. For what purposes do you use GHA? (You may tick several answers)
Figure 29 Purposes of using GHA
*Research Training Teaching General knowledge Professional reasons
(words translated in graph) Source: UNESCO Survey 2013
The most frequent uses were principally in the fields of research (87.5%), training (70%) and
teaching (69%). They therefore concern very specific users.
It is worth noting that almost half of the informants (45.8%) also used GHA for their general
knowledge. Those who used GHA for personal reasons amount to 3.3%.
The use of these volumes of the history of Africa corresponds to the aims of the GHA
collection.

65
53. How many GHA volumes have you consulted up to now? Figure 30 Number of GHA volumes consulted
Source: UNESCO Survey 2013
Out of the number of GHA volumes consulted, the 120 answers provided can be broken down
as follows:
- 41 (34.2%) respondents had consulted 8 volumes: they included 26 teachers,
6 academic authorities, 6 unidentified, 2 “Others” and one student.
- 33 (27.5%) did not provide any answer (NA).
- 15 (12.5%) respondents had consulted 3 volumes: they included 4 academic
authorities, 4 “Others”, 3 unidentified, 3 students and one teacher.
- 10 (8.3%) respondents had consulted 4 volumes: they included 5 academic authorities,
3 teachers and 2 students.
- 7 (5.8%) respondents had consulted 2 volumes: they were 5 students, one academic
authority and one unidentified respondent.
- 5 (4.2%) respondents had consulted 5 volumes: they were 3 teachers, one academic
authority and 1 unidentified.
- 4 (3.3%) respondents had consulted 6 volumes: they were 3 teachers and one academic
authority.
- 3 (2.5%) respondents had consulted 7 volumes: they were 2 teachers and
1 unidentified.
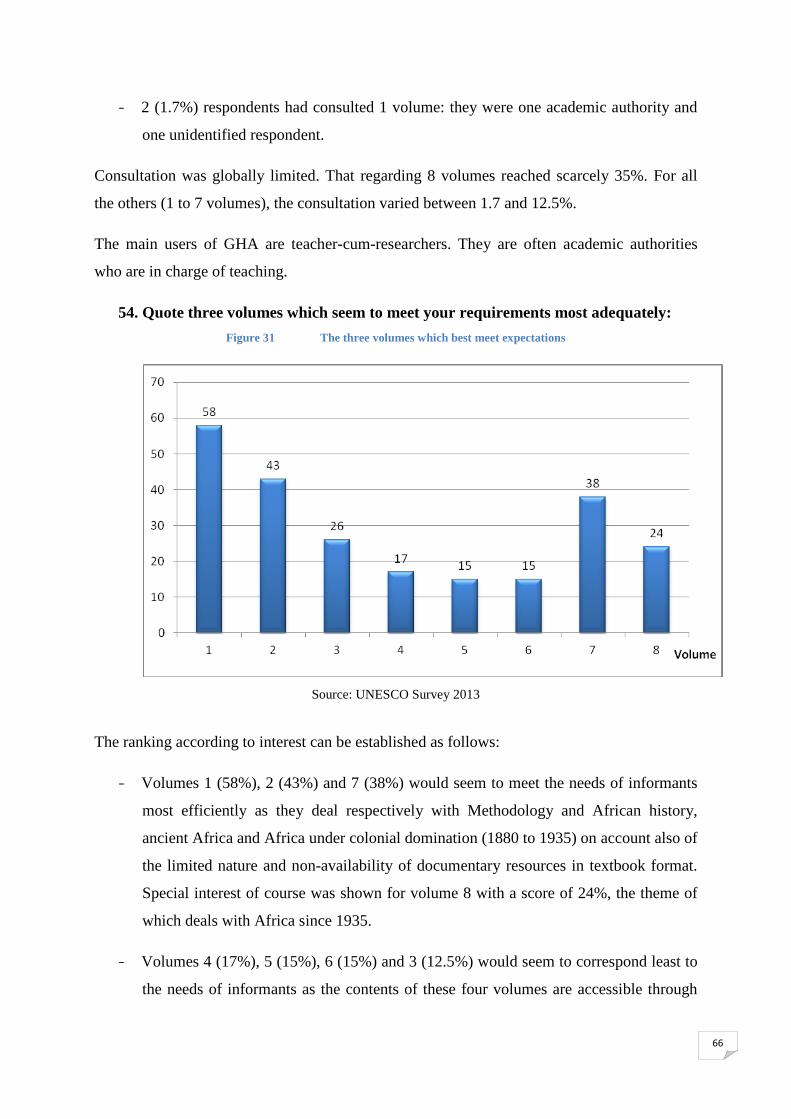
66
- 2 (1.7%) respondents had consulted 1 volume: they were one academic authority and
one unidentified respondent.
Consultation was globally limited. That regarding 8 volumes reached scarcely 35%. For all
the others (1 to 7 volumes), the consultation varied between 1.7 and 12.5%.
The main users of GHA are teacher-cum-researchers. They are often academic authorities
who are in charge of teaching.
54. Quote three volumes which seem to meet your requirements most adequately: Figure 31 The three volumes which best meet expectations
Source: UNESCO Survey 2013
The ranking according to interest can be established as follows:
- Volumes 1 (58%), 2 (43%) and 7 (38%) would seem to meet the needs of informants
most efficiently as they deal respectively with Methodology and African history,
ancient Africa and Africa under colonial domination (1880 to 1935) on account also of
the limited nature and non-availability of documentary resources in textbook format.
Special interest of course was shown for volume 8 with a score of 24%, the theme of
which deals with Africa since 1935.
- Volumes 4 (17%), 5 (15%), 6 (15%) and 3 (12.5%) would seem to correspond least to
the needs of informants as the contents of these four volumes are accessible through

67
other documentary sources. The four volumes deal respectively with Africa from the
12th to the 16th century, Africa from the 16th to the 18th century, Africa in the 19th
century until 1880 and Africa from the 7th to the 11th century.
These GHA volumes are only consulted marginally.
55. Are you satisfied with the current format? Figure 32 Satisfaction with the current format
*Yes No NA Do not know (translation of words in graph)
Source: UNESCO Survey 2013
As regards the satisfaction of respondents with the current GHA format, the answers provided
are as follows:
- 75 (62.5%) of informants are satisfied with the current GHA format: they include 38
teachers, 10 unidentified, 8 students and 6 “Others”.
- 8 (6.7%) respondents are not satisfied with the current GHA format: they are 3
academic authorities, 2 students, 2 unidentified, and one teacher.
- 10 (8.3%) answered “Do not know”: they are 4 students, 3 teachers, 2 academic
authorities and one “Other”.
- 27 (22.5%) did not provide any answer (NA): 9 unidentified, 7 academic authorities, 6
teachers, 3 students and 2 “Others.

68
Most of the informants (62.5%) were satisfied with the current HGA format. They were
mostly teachers. Nevertheless, the combined scores of NA and “Do not know” amounted to
30.8% which is quite substantial.
56. What is your opinion of the typographical legibility? Figure 33 Typographical legibility
*Satisfactory very satisfactory hardly satisfactory NA
(translation of words in graph)
Source: UNESCO Survey 2013
As regards the typographical legibility of GHA, the respondents’ views were as follows:
- 72 (60%) answered “satisfactory”: these included 36 teachers, 10 academic authorities,
10 who did not specify their status, 10 students and 6 unidentified.
- 12 (10%) stated that the typographical legibility was “very satisfactory”: They
included 4 teachers, 4 academic authorities, 2 unidentified, one student and one
“Other”.
- 9 (7.5%) answered “Hardly satisfactory »: they included 4 academic authorities, 3
students, one teacher and one unidentified respondent.
- 27 (22.5%) did not provide any answer (NA): these were 8 unidentified, 7 academic
authorities, 7 teachers, 3 students and 2 “Others”.

69
60% of informants stated they were satisfied with the typographical legibility. The very
limited number of “very satisfied” answers (10%) and “hardly satisfied” (7.5%) combined
with those of the NA (22.5%) suggest that the GHA publication must be improved.
57. Are there enough illustrations in GHA? Figure 34 Illustrations in GHA
*NA Do not know No Yes (translation of words in graph)
Source: UNESCO Survey 2013
As regards the appreciation of the number of illustrations in GHA, the answers provided were
as follows:
- 51 (42.5%) answered “Yes”: 22 teachers, 11 academic authorities, 6 students, 6 who
did not specify their status, 5 “Others” and 1 student/teacher.
- 38 (31.7%) answered “No”: 18 teachers, 7 academic authorities, 7 who did not specify
their status, 5 students, and 1 respondent who has “another” status.
- 5 (4.2%) answered “Do not know”: 2 students, 1 academic authority, 1 teacher and 1
respondent who had “Another” status.
- 26 (21.7%) respondents did not provide any answer (NA): 8 unidentified, 7 teachers, 6
academic authorities, 3 students and 2 “Others”.
Slightly fewer than half (42.5%) thought there were enough illustrations. Nevertheless, 31.7%

70
of informants thought the contrary and 21.7% did not express an opinion and 4.2% answered
“do not know” making a total of 57.6%. This proves the need to increase the number of
illustrations.
58. How legible are the illustrations? Figure 35 Legibility of the illustrations
*NA Hardly satisfactory Satisfactory Very satisfactory (translation of words in graph)
Source: UNESCO Survey 2013
As regards the legibility of the illustrations, the opinions of the respondents were as follows:
- 67 (56%) thought the legibility of the illustrations was “satisfactory”: 32 teachers, 11
academic authorities, 10 who did not specify their status, 8 students, 5 “Others” and
one student-teacher.
- 20 (16.7%) answered “Hardly satisfactory”: 7 teachers, 5 students, 3 who did not
specify their status and 1 “Other”.
- 4 (3.3%) thought that the legibility of the illustrations was “very satisfactory”: they
included 2 academic authorities, one teacher and one “Other”.
- There were 29 NA answers, namely 24%: 8 teachers, 8 academic authorities, 8
unidentified, 3 students and 2 “Others”.
Even if 56% of the informants thought the legibility of the illustrations was satisfactory, the

71
negligible proportion of the “very satisfactory” answers (3.3%) and the “hardly satisfactory”
answers (16.7%) suggest that efforts have to be made in this regard.
59. What appreciation do you have of the current state of the contents? Figure 366 Appreciations of the contents
*NA Hardly satisfactory Satisfactory Very satisfactory (translation of words in graph)
Source: UNESCO Survey 2013
As regards the appreciation of the state of the contents, the opinions were as follows:
- 63 (52.5%) estimated that the state of the contents is « very satisfactory »: they include
31 teachers, 11 students, 9 academic authorities, 9 who did not specify their status and
3 “Others”.
- 16 (13.3%) found that the state of the contents was “satisfactory”. They include 6
academic authorities, 4 teachers, 4 “Others”, one student and one informant who did
not specify his/her status.
- 11 (9.2%) believe that the state of the contents was “hardly satisfactory”: 4 academic
authorities, 3 teachers, 3 respondents who did not specify their status and one student.
- 30 (25%) did not express an opinion: 10 teachers, 8 respondents who did not specify
their status, 6 academic authorities, 4 students and 2 “Others”.
“Very satisfactory” was the opinion expressed by 52.5% of the informants. The combined

72
scores of “very satisfactory” and “satisfactory” reached 65.8%.
Supplementary efforts must be made to ensure even greater satisfaction among users of GHA.
60. Comment on your answer
See analysis of contents (Cf. annex)
61. Do the contents meet the expectations of students, teachers and researchers in
Africa? Figure 37 Expectations regarding GHA contents
*NA Do not know No Yes (translation of words in graph)
Source: UNESCO Survey 2013
Approximately three quarters of the informants (74.2%) asserted that the contents met their
expectations.
As regards the degree to which GHA contents met the expectations of African students,
teachers and researchers, the various perceptions were as follows:
- 69 (57.5%) answered “Yes”: they were 30 teachers, 1 academic authority, 9 who did
not specify their status, 8 students, 7 “Others” and one student/teacher.
- 18 (15%) answered “Do not know”: they were 12 teachers, 3 students and 3 who did
not specify their status.

73
- 6 (5%) answered “No”: They were 3 academic authorities, one teacher, one student,
and one respondent who did not specify his/her status.
- 27 (22.5%) NA: 8 unidentified, 8 academic authorities, 5 teachers, 4 students and 2
“Others”.
While 57.5% asserted that the contents met their expectations, 5% of respondents claimed that
they did not. The combined scores of “No”, “NA” and “do not know” reached 42.5%.
Consequently the importance of those who did not express an opinion has yet to be assessed.
62. If so, in what way? Analysis of contents (Cf. annex)
63. Comment on your answer
Analysis of contents (Cf. annex)
64. What other themes omitted from this work would you like to see appear in a
forthcoming edition?
Analysis of contents (Cf. annex)