sustainability appraisal scoping report (draft) · pdf fileterm definition . baseline a ......
TRANSCRIPT
Thurrock Local Plan
Sustainability Appraisal Scoping Report (DRAFT)
February 2016

Document No.
Contents
Glossary and Acronyms ........................................................................................................................................ i
Executive Summary .............................................................................................................................................. iii
1. Introduction ................................................................................................................................................ 1
1.1 Introduction .................................................................................................................................................. 1
1.2 Project background ...................................................................................................................................... 1
1.3 Purpose of this report .................................................................................................................................. 1
1.4 Scoping consultation ................................................................................................................................... 2
2. Thurrock’s Local Plan and Sustainability Appraisal ............................................................................. 3
2.1 Thurrock’s Local Plan .................................................................................................................................. 3
2.1.1 Local Plan Timetable/ Programme .............................................................................................................. 3
2.2 The Sustainability Appraisal process .......................................................................................................... 4
2.2.1 Strategic Environmental Assessment .......................................................................................................... 6
2.2.2 Health Impact Assessment .......................................................................................................................... 6
2.2.3 Equalities Impact Assessment .................................................................................................................... 6
2.2.4 Habitats Regulations Assessment ............................................................................................................... 7
2.3 Guidance sources ........................................................................................................................................ 7
3. Planning and Policy Context .................................................................................................................... 8
3.1 Requirement and Scope .............................................................................................................................. 8
3.2 Document Review for Thurrock ................................................................................................................... 8
3.3 International ................................................................................................................................................. 8
3.4 National ....................................................................................................................................................... 9
3.5 Regional ...................................................................................................................................................... 9
3.6 Local .......................................................................................................................................................... 10
3.7 Future Review ........................................................................................................................................... 10
4. Evidence Base ......................................................................................................................................... 11
4.1 Introduction ................................................................................................................................................ 11
4.2 Data sources ............................................................................................................................................. 11
4.3 Environmental baseline ............................................................................................................................. 11
4.3.1 Air Quality .................................................................................................................................................. 11
4.3.2 Biodiversity, Flora and Fauna .................................................................................................................... 14
4.3.3 Climate Change and Energy ..................................................................................................................... 18
4.3.4 Cultural Heritage ........................................................................................................................................ 21
4.3.5 Flood Risk .................................................................................................................................................. 22
4.3.6 Geology and Soils ..................................................................................................................................... 25
4.3.7 Landscape, Townscape and Visual Impacts ............................................................................................. 27
4.3.8 Materials and Waste .................................................................................................................................. 29
4.3.9 Noise.......................................................................................................................................................... 31
4.3.10 Water Resources and Quality ................................................................................................................... 34
4.4 Socio-economic baseline .......................................................................................................................... 35
4.4.1 Economy and Employment ....................................................................................................................... 35

Document No.
4.4.2 Education and Skills .................................................................................................................................. 38
4.4.3 Housing ..................................................................................................................................................... 40
4.4.4 Deprivation ................................................................................................................................................ 42
4.4.5 Crime ......................................................................................................................................................... 43
4.4.6 Equalities ................................................................................................................................................... 45
4.5 Health baseline .......................................................................................................................................... 49
4.5.1 Pollution and Health .................................................................................................................................. 51
4.5.2 Physical Activity and Obesity .................................................................................................................... 52
4.5.3 Access to Services and Facilities .............................................................................................................. 54
4.5.4 Transport Safety ........................................................................................................................................ 55
5. Sustainability Issues and Problems ...................................................................................................... 57
6. Sustainability Appraisal Framework and Approach ............................................................................ 60
6.1 Sustainability Objectives............................................................................................................................ 60
6.2 Appraisal guide questions ......................................................................................................................... 61
6.3 Methodology and approach ....................................................................................................................... 63
6.3.1 Spatial Scope ............................................................................................................................................ 63
6.3.2 Temporal Scope ........................................................................................................................................ 64
6.3.3 Secondary, cumulative and synergistic effects ......................................................................................... 64
6.3.4 Appraisal of policies and proposals ........................................................................................................... 64
6.3.5 Appraisal of potential development sites ................................................................................................... 65
6.3.6 Assumptions and uncertainties ................................................................................................................. 71
7. Conclusions and next steps ................................................................................................................... 72
7.1 Conclusions and next steps ...................................................................................................................... 72
7.2 Proposed SA Report structure .................................................................................................................. 72
List of Tables and Figures
Table E-1 : The Sustainability Appraisal Framework .............................................................................................. v
Table 2-1 : Thurrock Local Plan Preparation Timetable ..........................................................................................3
Figure 2-1 : The SA process and its relationship to Local Plan preparation ...........................................................5
Table 4-1 : Air Quality Objectives relevant to Thurrock ........................................................................................ 12
Table 4-2 : Thurrock’s SSSIs ................................................................................................................................ 16
Figure 4-1 and 4-2 : Breakdown of Thurrock CO2 emission sources 2005 - 2013 ............................................... 19
Figure 4-3 : Heat Demand in Thurrock ................................................................................................................. 20
Figure 4-4 : Flood Zones in Thurrock ................................................................................................................... 24
Table 4-3 : Geological SSSIs in Thurrock ............................................................................................................ 26
Table 4-4 : Municipal Waste Collected in Thurrock (2005 – 2015) ...................................................................... 30
Table 4-5 : Municipal Waste Management in Thurrock (2005-2015)69
................................................................ 30
Figure 4-5 : Waste Management Trends in Thurrock (2005-2015) ...................................................................... 31
Figure 4-6 : CPRE Tranquillity Map- Thurrock (2016) .......................................................................................... 33
Table 4-6 : Breakdown of Employment in Thurrock by Industry (2014)86
............................................................ 37
Table 4-7 : Affordable housing provision in Thurrock ........................................................................................... 41

Document No.
Figure 4-7 : Spatial distribution of deprivation across Thurrock ........................................................................... 43
Table 4-8 : Breakdown of Crimes in Thurrock (2013/14) ..................................................................................... 44
Table 4-9 : Breakdown of Thurrock’s Population by Ethnicity .............................................................................. 47
Figure 4-8 : Breakdown of Religions in Thurrock (2011) ...................................................................................... 48
Figure 4-9 : All Age, All-Cause Mortality Rate in Thurrock (2000-2010) .............................................................. 51
Table 4-10: Adult Participation in Sport in Thurrock ............................................................................................. 53
Table 4-11 : Road Traffic Accidents in Thurrock (2009-2014) ............................................................................. 55
Table 6-1 : Sustainability Objectives .................................................................................................................... 60
Table 6-2 : The SA Framework ............................................................................................................................ 61
Table 6-3 : SA Ratings and Definitions ................................................................................................................. 65
Table 6-4 : SA Site Appraisal Methodology .......................................................................................................... 67

i
Glossary and Acronyms
Glossary of Terms
Term Definition
Baseline A description of the present and future state of an area, taking into account changes resulting from natural events and from human activities.
Consultation Body An authority concerned with the environmental effects of implementing plans and programmes which must be consulted under the SEA Regulations. The Consultation Bodies, designated in the SEA Regulations are Historic England, Natural England and the Environment Agency.
Cumulative Effects Effects are those which arise from two or more impacts occurring simultaneously, whereby an impact that may not have a significant effect on its own may combine with another to produce a cumulative effect that is significant.
Environmental assessment
Generically, a method or procedure for predicting the effects on the environment of a policy, plan or programme, with the aim of taking account of these effects in decision-making. In the SEA Directive, an environmental assessment means preparation of an environmental report, carrying out consultation, taking into account results of the assessment and consultation in decision-making and providing information on the decision.
Environmental Report Document required by the SEA Regulations as part of an environmental assessment, which identifies, describes and appraises the likely significant effects on the environment of implementing a plan or programme.
Health Impact Assessment
A combination of procedures, methods and tools by which a policy, program or project may be judged as to its potential effects on the health of a population, and the distribution of those effects within the population.
Indicator A measure of variables over time, often used to measure achievement of objectives.
Mitigation Refers to measures that can be used to prevent, reduce or offset adverse effects.
Responsible Authority In the SEA Regulations, means an organisation which prepares a plan or programme subject to the SEA Regulations and is responsible for the SEA/SA.
Scoping The process of deciding the scope and level of detail of an SA, including the environmental effects and options which need to be considered, the assessment methods to be used, and the structure and contents of the SA Report.
Secondary effect Effects that are not a direct result of the plan but occur away from the original effect or as a result of a complex pathway e.g. development that changes a water table and affects the ecology of a nearby wetland.
Significant effect Effects which are significant in the context of the plan. (Schedule 1 of the SEA Regulations gives criteria for determining the likely environmental significance of effects).
Sustainability Appraisal
Sustainability appraisal is an appraisal of the economic, environmental, and social effects of a plan from the outset of the preparation process to allow decisions to be made that promote sustainable development.
Synergistic effects Effects which interact to produce a total effect greater than the sum of the individual effects.

ii
List of Acronyms
Acronym Meaning
AQMA Air Quality Management Area
BAP Biodiversity Action Plan
CO Carbon Monoxide
CO2 Carbon Dioxide
DEFRA Department for Environment, Food and Rural Affairs
DfT Department for Transport
DH Department of Health
EA Environment Agency
EIA Environmental Impact Assessment
EqIA Equality Impact Assessment
GHG Greenhouse Gases
GIS Geographic Information System
HIA Health Impact Assessment
HRA Habitats Regulation Assessment
IMD Indices of Multiple Deprivation
LNR Local Nature Reserve
NNR National Nature Reserve
NO2 Nitrogen Dioxide
ODPM Office of the Deputy Prime Minister
ONS Office for National Statistics
PM Particulate Matter
PM10 Particulate Matter < 10μm
RAMSAR Wetlands of International Importance
RSS Regional Spatial Strategy
SA Sustainability Appraisal
SAC Special Area of Conservation
SEA Strategic Environmental Assessment
SPA Special Protection Area
SPZ Source Protection Zones
SSSI Site of Special Scientific Interest
SuDS Sustainable Drainage System

iii
Executive Summary
Purpose of this Sustainability Appraisal Scoping Report
This report sets out the scope of the Sustainability Appraisal (SA) of Thurrock’s emerging Local Plan and
includes the approach and methodology that will be used to conduct the appraisal. It will form the basis for
consultation with the statutory environmental consultation bodies (namely the Environment Agency, Historic
England and Natural England) and other interested parties in order to agree the scope for the SA, prior to the
appraisal stage.
Thurrock’s new Local Plan
Thurrock Council is currently preparing an emerging Local Plan as required by the Planning and Compulsory
Purchase Act 2004 (as amended) and in accordance with The Town and Country Planning (Local Planning)
Regulations 2012 (as amended). The Local Plan will set out policies and proposals for new development and
provide a long-term development strategy for Thurrock, replacing the existing Core Strategy and Policies for
Management of Development (2011).
The plan is a strategic document which contains development policies and proposals, and allocates sites for
potential development.
Sustainability Appraisal
Under Section 19 of the Planning and Compulsory Purchase Act 2004, documents which form part of a Local
Plan must be subject to a Sustainability Appraisal which is conducted in line with requirements of Strategic
Environmental Assessment.1
Sustainability Appraisal (SA) is an iterative process which is closely integrated with the overall process of
preparing a Local Plan. Its role is to promote sustainable development by assessing the likely significant effects
of the plan and the extent to which the plan, when judged against reasonable alternatives, will help or hinder the
achievement of relevant environmental, economic and social objectives 2 . The staged approach to SA is
designed to align with each key stage of the plan-making process.
Scoping – the current stage – is stage A in the SA process, and involves setting the context and objectives,
establishing the baseline and deciding on the scope of the appraisal. The main outcome of this stage is this
Sustainability Appraisal Scoping Report, which while itself not required by legislation, helps to fulfil requirements
of the SEA Regulations by recording information to be agreed with the statutory consultation bodies, and used
to inform future stages in the SA process. In line with guidance on SA and good practice, it will also be
consulted upon with interested parties and the public. A workshop has already taken place internally with
council officers which focused on key issues and proposed sustainability objectives to inform this report.
Review of Policy and Legislation
A range of key international, national, regional and local documents and legislation have been reviewed as part
of the SA scoping process. These documents provide a valuable source of information and set out the
contextual framework for developing different components of the Local Plan and the SA. In particular:
at a high level, key legislation and national policies provide the planning context for Thurrock;
local documents provide a useful source of information about the current and projected status of the
environment and communities without the emerging Local Plan in place, and identify local priorities which
have been used to frame the SA Objectives; and
a number of documents provide objectives and indicators (i.e. ways to measure environmental, social or
economic performance) that have helped shape the SA Framework.
1 Statutory Instrument No. 1633 – The Environmental Assessment of Plans and Programmes Regulations 2004 (“the SEA Regulations”) 2 Department for Communities and Local Government (2016) Strategic environmental assessment and sustainability appraisal [online] Available at:
http://planningguidance.communities.gov.uk/blog/guidance/strategic-environmental-assessment-and-sustainability-appraisal/strategic-environmental-assessment-and-sustainability-appraisal-and-how-does-it-relate-to-strategic-environmental-assessment/

iv
Overview of the Baseline
The evidence base is a key feature of the SA, which in turn is part of the Local Plan’s wider evidence base. As
with Local Plans themselves, SAs must be informed by robust, credible and proportionate information about the
current and future state of the environment and communities, as this will allow the SA to influence plan-making.
A good evidence base helps the Council be certain the SA has identified the plan’s potential effects correctly,
both positive and negative, so that it can consider whether and how to address those potential effects. The
evidence base for the emerging Local Plan is in development and will form a key building block for the SA.
A desk-based review of key data and documentation has been undertaken to identify baseline conditions in
Thurrock. It is based on readily available data and information gathered online and supplied by the Council.
Thurrock has a strong and growing economy with logistics and distribution and retailing as major employment
sectors. Whilst it has achieved high rates of employment in recent years, many jobs are relatively low-paying
which has meant that the economy is not as productive as it could be.
The borough benefits from a good location in terms of transport. The M25 London Orbital Motorway passes
through the borough, as does the A13 London to Southend trunk road, which connects with the M25 (Junction
30) just north of the Dartford Tunnel (Junction 31) and the Queen Elizabeth Bridge. The Channel Tunnel Rail
Link (HS1) also passes through the borough and the C2C Railway links London (Fenchurch Street) to
Southend, with seven stations in the borough. The Port of Tilbury provides international connections for both
passengers and freight.
Thurrock has more than 70% of its land in the Green Belt, some of which is of considerable nature conservation
and landscape value. The borough has sites of international and national importance for nature conservation,
including a Ramsar site and 12 Sites of Special Scientific Interest (SSSIs). The borough also has some rich
cultural heritage, with seven Conservation Areas, 17 Scheduled Ancient Monuments and 245 Listed Buildings.
Sustainability Appraisal Framework
Building on SA work completed for the existing Local Plan and incorporating findings from the policy review and
evidence base collection, a set of sustainability objectives has been identified to cover each of the sustainability
topics that will be included in the appraisal. These objectives create a framework against which the Local Plan
will be appraised, using the baseline evidence, experience and knowledge of the impacts of development and
professional judgement about the effects of the various proposals in plan.
Owing to the strategic and wide-ranging nature of the Local Plan, which will help shape future development
across Thurrock, it has not been possible to scope out any environmental or sustainability issues at this stage.
This will be reviewed in the course of further assessment work.
To appraise the policies, proposals and potential development sites set out in the Local Plan against the
objectives, a set of appraisal guide questions have been identified covering a variety of indicators and metrics
which can be considered when evaluating the likely significant effects of a plan or proposal.
Together these objectives and appraisal guide questions form the Sustainability Appraisal Framework (Table E-
1).
It should be noted that transport, land use, green infrastructure and adaptation to climate change are not
represented by their own topics, and will be addressed within each topic where there are clear links, as relevant
and applicable to the proposals and remit of the Local Plan. For example, changes in transport can potentially
influence a range of topics, including air quality, noise, physical activity and obesity, climate change and
landscape, townscape and visual impacts. Similarly, creation of green infrastructure and adaptation to climate
change are important considerations across a number of environmental, social and economic issues.
Severance will be considered through the assessment process under the Access to Services and Facilities
objective, and also in relation to Equalities.

v
Table E-1 : The Sustainability Appraisal Framework
Topic SA Objective Appraisal guide questions
Will the policy / proposal / site…
Air Quality Reduce concentrations of harmful atmospheric pollutants and avoid their emission
Improve air quality; reducing pollutant emissions from all sources?
Avoid or reduce emissions of NOx and PM from transport?
Biodiversity, Flora and Fauna
Conserve and enhance Thurrock’s biodiversity, including all statutory and non-statutory designated sites, notable and protected habitats and species
Conserve or enhance biodiversity; avoiding harm to or loss of statutory and non-statutory designated wildlife sites?
Maintain and enhance habitats and species in line with borough and national targets?
Climate Change and Energy
Reduce greenhouse gas emissions and encourage transition to renewable energy
Reduce energy consumption and greenhouse gas emissions?
Avoid or reduce greenhouse gas emissions from transport?
Encourage up-take of renewable energy sources and low carbon technologies?
Cultural Heritage
Protect and enhance the borough’s cultural heritage and historic assets and their settings
Help to protect the borough’s historic assets and heritage; allowing more people to enjoy them?
Geology and Soils
Protect and enhance Thurrock’s geodiversity and soil resources
Protect or enhance the borough’s geological sites?
Help to maintain Thurrock’s soil resources?
Flood Risk Reduce the risk and effects of flooding, both now and in the future
Reduce the impact of surface, groundwater and tidal flooding on people and property?
Landscape, Townscape and Visual Impacts
Preserve and enhance Thurrock’s landscape and townscape, ensuring development does not detract from the quality of views and local distinctiveness
Improve the attractiveness of built-up areas; avoiding incongruent development?
Contribute positively to the landscape/ townscape and the borough’s character; avoiding inappropriate development in sensitive areas?
Avoid or reduce light pollution?
Materials and Waste
Use resources intelligently, optimising reuse and recovery to keep waste to a minimum
Protect mineral resources?
Minimise the production of waste?
Help to avoid or reduce waste sent to landfill; promoting reuse and recovery?
Reduce the distance waste travels; minimising imports and exports?
Noise Avoid or reduce the impacts of noise pollution on residents and wildlife
Reduce noise and disturbance to people and wildlife?
Avoid or reduce transport-related noise pollution?
Water Resources and Quality
Ensure that water supply can support future development and preserve and enhance the quality of waterbodies and groundwater
Maintain or improve the quality of waterbodies and groundwater?
Ease pressure on existing sources; reducing water consumption and abstraction?
Increase water resource capacity that is resilient to climate change?
Economy and Employment
Create a prosperous, growing economy founded on high rates of employment and
Create new jobs or protect existing ones?
Enable access to employment opportunities, particularly for disadvantaged groups?

vi
investment Facilitate the growth of small and medium size businesses?
Help to attract inwards investment?
Diversify the local economy; reducing the burden on core sectors?
Encourage new business start-ups and social enterprises?
Education
and Skills
Provide opportunities for high-
quality education and skills
development to allow
everyone to achieve their
potential
Provide education and skills development opportunities;
particularly in deprived areas accessible to all social groups?
Provide or maintain jobs of varying skill levels?
Encourage innovation and entrepreneurship?
Increase the number and capacity of local education and
training facilities?
Housing Provide new and affordable
housing to meet identified
needs
Increase the availability of housing; particularly housing that is
affordable?
Provide housing which meets locally identified needs (i.e.in
terms of type, tenure and size).
Deprivation Reduce disparities in
deprivation across all domains
Reduce disparities in deprivation; targeting the most deprived
areas and social groups?
Crime Reduce crime, antisocial behaviour and fear of crime
Reduce crime rates, antisocial behaviour or fear of crime?
Equalities Advance equality of
opportunity and foster good
relations between those who
share a protected
characteristic (Equality Act
2010) and those who do not.
Remove or reduce disadvantages suffered by people due to
their protected characteristics?
Encourage public participation in decision-making by people
with protected characteristics?
Promote community cohesion?
Help meet the needs of people with certain protected
characteristics (e.g. disabled people)?
Pollution and Health
Avoid or reduce pollution harmful to health
Help to improve the physical and mental health of the population?
Avoid or reduce emissions of pollutants harmful to health; including air pollutants, noise and contamination of land and water?
Physical Activity and Obesity
Tackle adult and child obesity, getting people physically active
Encourage active transport; providing high quality and attractive infrastructure?
Encourage or enable people to be physically active?
Improve availability of high quality publically accessible green space and recreational resources?
Access to Services and Facilities
Ensure adequate and safe access to services and facilities for all
Enable the local community to access the services and facilities they need?
Help the local community to interact with the natural environment and wildlife?
Improve the quality of services and facilities offered?
Help to retain key village services?
Transport Safety
Improve transport safety for motorised and non-motorised users
Reduce congestion and improve the flow of traffic?
Provide services or facilities to help improve transport safety?
Increase public and active transport options?
The SA will be completed using the SA Framework. It will identify ‘likely significant effects’ of the Local Plan on
the projected baseline in Thurrock, drawing on the key sustainability issues which have been identified and the
evidence base that has been assembled. The SA will inform plan development by recommending potential

vii
mitigation measures to avoid, prevent, reduce or offset adverse effects. Where possible, the SA will also
recommend potential measures to generate or enhance beneficial effects.
The results of the appraisal will be reported in an SA Report, which will be published alongside the Draft Local
Plan for public consultation.
This SA Scoping Report is being issued for public consultation on 26th February 2016, and is available on the
Council’s Local Plan website, where details are provided on how to make comments on this report, the Local
Plan Issues and Options (Stage 1) Consultation Document and the Draft Thurrock Design Strategy.
The consultation period will last for six weeks, closing at 5pm on 11th April 2016.

1
1. Introduction
1.1 Introduction
Thurrock Council is currently preparing its Local Plan as required by the Planning and Compulsory Purchase
Act 2004 (as amended) and in accordance with The Town and Country Planning (Local Planning) Regulations
2012 (as amended). The Local Plan will set out policies and proposals for new development and provide a
long-term development strategy for Thurrock, replacing the existing Core Strategy and Policies for Management
of Development (2011).
1.2 Project background
Thurrock is located on the north bank of the Thames, twenty miles east of central London. The borough covers
165 sq. km and has a diverse range of land uses and associated environmental issues. More than half of the
land in Thurrock is designated Green Belt and the borough has over 18 miles of riverfront.
Much of the riverside area is highly urbanised with a mixture of industrial and residential development at the
west and eastern ends of the borough. Thurrock has a number of main settlements, including Grays,
Stanford/Corringham, South Ockendon and Tilbury, together with a number of villages in the Green Belt. The
recently developed settlement of Chafford Hundred and the Lakeside Regional Shopping Centre are located
west of Grays and east of the M25.
Thurrock is a key regeneration area in the East of England, lying within the Thames Gateway, and a major
growth area in the UK Government’s Communities Plan due to the availability of large areas of former industrial
land for redevelopment, its proximity to London and its good transport links. 3 There is considerable investment
planned in Thurrock to support this growth, and the identification and allocation of suitable sites for development
will help to direct this investment to where it can achieve the most benefit for Thurrock and its residents.
1.3 Purpose of this report
It is a legal requirement of the Planning and Compulsory Purchase Act 2004 that Thurrock’s new Local Plan is
accompanied by a Sustainability Appraisal (SA). The SA will identify the likely significant effects of the
proposals of the Local Plan and inform its development by recommending ways to mitigate adverse effects and
generate or enhance beneficial ones. “Mitigation” refers to measures that can be used to prevent, reduce and
offset adverse effects. This report (the ‘SA Scoping Report’) sets out the proposed scope of the appraisal stage
of the SA.
The scope of the SA includes:
A spatial (or geographic) scope – the physical extent to which decisions made on the Local Plan might
significantly affect the environment or communities;
Background information which is relevant to identifying the potential impacts of the Local Plan on the
environment and communities;
A temporal (or time) scope – the length of time over which significant effects of the Local Plan are
considered probable and thus will be covered by the SA; and
A technical scope – the approach and methodology proposed for conducting the SA.
In addition to the above, this SA Scoping Report provides an overview of the context for SA, its relationship to
the Local Plan and the requirements which it must fulfil under the SEA Regulations (Chapter 2). It contains a
review of relevant plans, policies and programmes which could have a bearing on the Local Plan’s development
(Chapter 3 and 4), as well as a review of current and projected baseline conditions in Thurrock, i.e. what the
situation would be in the absence of a new Local Plan (Chapter 4).
3 Thurrock Council (2010) Thurrock Council Strategic Housing Land Availability Assessment: Final report [online] Available at:
https://www.thurrock.gov.uk/sites/default/files/assets/documents/shlaa_volume1_2010.pdf
2
A key element of the SA Scoping Report is consideration of the key sustainability issues for Thurrock (Chapter
5) and the SA Framework (Chapter 6). This is the proposed methodology which will be used to appraise the
Local Plan, including both the policies and proposals it contains and potential sites identified for future
development.
1.4 Scoping consultation
A workshop has already taken place internally with council officers, which focused on key issues and proposed
sustainability objectives. This has helped to shape this Scoping Report. The workshop included officers from
functions covering:
flood risk and air quality;
strategic planning, cross-boundary planning and minerals and waste;
children’s’ care;
heritage, footpaths;
landscape, ecology and open spaces;
transport development; and
housing.
Going forwards, it is expected that an internal reference group will continue to act in a review and advisory
capacity on the SA process.
This SA Scoping Report is being issued for public consultation on 26th February 2016, and is available on the
Council’s Local Plan website, where details are provided on how to make comments on this report, the Local
Plan Issues and Options (Stage 1) Consultation Document and the Draft Thurrock Design Strategy.
The consultation period will last for six weeks, closing at 5pm on 11th April 2016.
Environmental bodies such as the Environment Agency, Natural England and Historic England, with whom
consultation is a statutory requirement, will be provided with the SA Scoping Report directly and invited to make
representations. Representations received from public and the statutory consultation bodies during the six-week
consultation will be used to inform future stages of the SA.

3
2. Thurrock’s Local Plan and Sustainability Appraisal
2.1 Thurrock’s Local Plan
Thurrock Council began work on its Local Plan under the previous Local Development Framework (LDF) system
in 2005, which led to the adoption of the Thurrock Core Strategy and Policies for Management of Development
(the Core Strategy) in December 2011, and subsequently the adoption of the Focused Review: Consistency
with National Planning Policy Framework in 2015. The Core Strategy and the focused review together set out
the spatial vision, strategy and planning policies for Thurrock up to and beyond 2026.
The Core Strategy is a statutory planning document that contains planning policies on topics such as housing,
employment, green belt, community facilities, education and health, sports and leisure, open space, climate
change, minerals and waste. It allocates only large sites for development considered pivotal for the future of
Thurrock (i.e. of ‘strategic importance’). It did not go as far as to allocate smaller sites, which were to be
considered in subsequent, more detailed Local Plan documents.
Since the Core Strategy was adopted, there have been a number of significant changes to the planning system
at a national, regional and local level. These include:
the need for a more up-to-date statutory planning framework to co-ordinate the delivery of the Council’s
ambitious growth strategy for Thurrock;
the revocation of the East of England Plan and the requirement for local planning authorities to undertake a
fresh assessment of their future development needs;
the need for the Council to identify a deliverable five-year housing land supply and bring forward more sites
for development to support economic growth;
a need to plan for the possible impact of a decision by Government on the route and location of the
proposed Lower Thames Crossing; and
legislative changes that affect the form, content and process for preparing a Local Plan.
In February 2014, Thurrock Council made the decision to begin work on preparing a new Local Plan for the
borough which will replace the Core Strategy, take the above changes into account and progress with site-
specific allocations. A new Local Development Scheme (LDS) was adopted in December 2015, proposing a
timetable to complete the production of the new Local Plan. This was required because of the impact and
uncertainty caused to the plan-making process by a delay in an announcement by the Government on the route
and location of the new Lower Thames Crossing.
Other previously proposed plans, including the Gypsy and Traveller Local Plan and the Minerals and Waste
Local Plan, will be combined into the new Local Plan.
2.1.1 Local Plan Timetable/ Programme
A timetable for the key production stages of the Local Plan is shown in Table 2-1.
It is important to note that some of the dates have less certainty, such as adoption dates, as they depend on the
timing and length of examinations (indicated in italics).
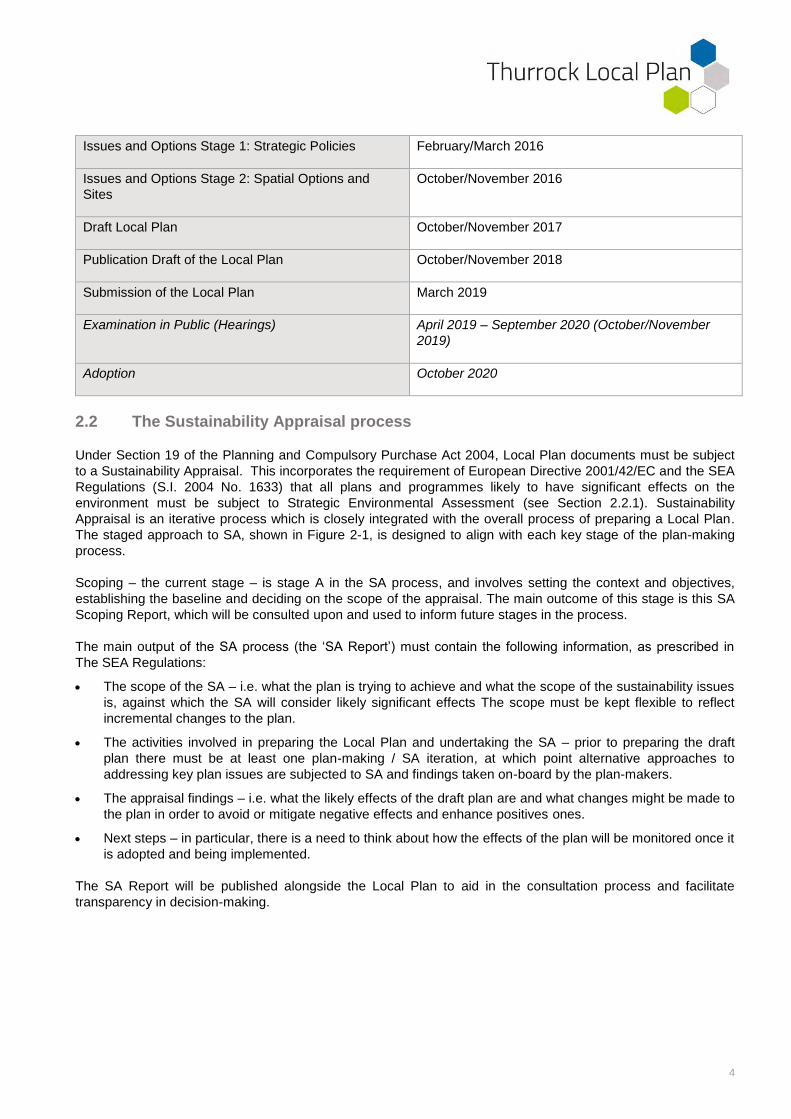
Table 2-1 : Thurrock Local Plan Preparation Timetable
Plan Preparation Stage Target Date
4
Issues and Options Stage 1: Strategic Policies February/March 2016
Issues and Options Stage 2: Spatial Options and
Sites
October/November 2016
Draft Local Plan October/November 2017
Publication Draft of the Local Plan October/November 2018
Submission of the Local Plan March 2019
Examination in Public (Hearings) April 2019 – September 2020 (October/November
2019)
Adoption October 2020
2.2 The Sustainability Appraisal process
Under Section 19 of the Planning and Compulsory Purchase Act 2004, Local Plan documents must be subject
to a Sustainability Appraisal. This incorporates the requirement of European Directive 2001/42/EC and the SEA
Regulations (S.I. 2004 No. 1633) that all plans and programmes likely to have significant effects on the
environment must be subject to Strategic Environmental Assessment (see Section 2.2.1). Sustainability
Appraisal is an iterative process which is closely integrated with the overall process of preparing a Local Plan.
The staged approach to SA, shown in Figure 2-1, is designed to align with each key stage of the plan-making
process.
Scoping – the current stage – is stage A in the SA process, and involves setting the context and objectives,
establishing the baseline and deciding on the scope of the appraisal. The main outcome of this stage is this SA
Scoping Report, which will be consulted upon and used to inform future stages in the process.
The main output of the SA process (the ‘SA Report’) must contain the following information, as prescribed in
The SEA Regulations:
The scope of the SA – i.e. what the plan is trying to achieve and what the scope of the sustainability issues
is, against which the SA will consider likely significant effects The scope must be kept flexible to reflect
incremental changes to the plan.
The activities involved in preparing the Local Plan and undertaking the SA – prior to preparing the draft
plan there must be at least one plan-making / SA iteration, at which point alternative approaches to
addressing key plan issues are subjected to SA and findings taken on-board by the plan-makers.
The appraisal findings – i.e. what the likely effects of the draft plan are and what changes might be made to
the plan in order to avoid or mitigate negative effects and enhance positives ones.
Next steps – in particular, there is a need to think about how the effects of the plan will be monitored once it
is adopted and being implemented.
The SA Report will be published alongside the Local Plan to aid in the consultation process and facilitate
transparency in decision-making.

5
Figure 2-1 : The SA process and its relationship to Local Plan preparation4
4 Department for Communities and Local Government (2016) Strategic environmental assessment and sustainability appraisal [online] Available at:
http://planningguidance.communities.gov.uk/blog/guidance/strategic-environmental-assessment-and-sustainability-appraisal/sustainability-appraisal-requirements-for-local-plans/

6
2.2.1 Strategic Environmental Assessment
SEA became a statutory requirement following the adoption of European Directive 2001/42/EC (the SEA
Directive) “on the assessment of the effects of certain plans and programmes on the environment”. The SEA
Directive was transposed into UK legislation on the 20 July 2004 as Statutory Instrument No. 1633 – The
Environmental Assessment of Plans and Programmes Regulations 2004 (“the SEA Regulations”).
The objective of SEA as set out in the Directive is:
to provide for a high level of protection of the environment and to contribute to the integration of environmental considerations into the preparation and adoption of plans and programmes with a view to promoting sustainable development.
The SEA Regulations require a report to be prepared which:
Identifies, describes and evaluates the likely significant effects on the environment of-
a) Implementing the plan or programme; and
b) Reasonable alternatives taking into account the objectives and the geographical scope of the plan or programme; and …
Is made available for the purpose of consultation.
2.2.2 Health Impact Assessment
Health Impact Assessment (HIA) is a means of assessing the likely health effects of plans, programmes and
projects. In itself, it is not a statutory requirement, but in 2005 the Office of the Deputy Prime Minister (ODPM)
published ‘A Practical Guide to the Strategic Environmental Assessment Directive’5, which noted that:
Responsible Authorities may find it helpful to draw on the methods of Health Impact Assessment when
considering how a plan or programme might affect people’s health.
The purpose of HIA is to assist decision-makers in understanding the health impacts of a plan. It seeks to
inform and enhance the decision-making process, making decisions more holistic and robust by:
highlighting practical ways to enhance the positive health, equality and well-being effects of a plan; and
avoiding or reducing the negative health, equality and well-being effects.
Whilst a full HIA has not been completed for the Local Plan, relevant elements of the HIA process have been
integrated into the SA through the inclusion of four health topics and accompanying sustainability objectives.
2.2.3 Equalities Impact Assessment
The Equalities Act 2010 requires public authorities to work to eliminate discrimination and promote equality in all
their activities. Public authorities must ensure that all decisions are made in such a way as to minimise
unfairness, and do not have disproportionately negative effects on people because of their protected
characteristics or background.
As Thurrock’s new Local Plan will include policies, proposals and sites for future development which have the
potential to affect a diverse range of social and demographic groups, the Council has decided that an Equalities
Impact Assessment (EqIA) will be completed as part of the Sustainability Appraisal. The EqIA, which for the
purpose of reporting is included as one of the SA topics, will seek to ensure that effects of the Local Plan do not
disproportionately affect or discriminate against groups with protected characteristics as defined in the Equality
Act.
5 Office of the Deputy Prime Minister (ODPM) (2005) A Practical Guide to the Strategic Environmental Assessment Directive [online] Available at:
https://www.gov.uk/government/uploads/system/uploads/attachment_data/file/7657/practicalguidesea.pdf

7
2.2.4 Habitats Regulations Assessment
Embedded within Article 6(3) and (4) of the Habitats Directive is the requirement for the assessment of plans
and projects likely to have significant effects on European sites. The Habitats Directive is brought into effect in
England by the Conservation of Habitats and Species Regulations 2010 (as amended), which also transpose
the Directive’s requirement to undertake assessment for both projects and plans likely to have significant effect
on European sites.
Sites protected under the Conservation of Habitats and Species Regulations include Special Areas of
Conservation (SAC); Special Protection Areas (SPA) and European Offshore Marine Sites (EOMS). Together
these make up the Natura 2000 Network of European sites. In England, as a matter of policy, Ramsar sites
(identified under the Ramsar Convention), proposed SACs and potential SPAs are subject to the same
procedures as SACs and SPAs.
A plan or project, such as a Local Plan, cannot be given effect or consent unless it can be determined that it
would not have an adverse effect on the integrity of European sites or, where there are no alternative solutions,
there are imperative reasons of overriding public interest for the plan or project to proceed, and compensatory
measures are secured to ensure the coherence of the Natura 2000 network.
While a HRA will be completed as a standalone assessment outside the remit of this SA, there is the potential
for overlap between the two assessments. The policy review and evidence base collected as part of the SA
scoping process will help to inform the HRA of Thurrock’s new Local Plan.
2.3 Guidance sources
A range of guidance sources on Local Plan development, SA, SEA, HIA, EqIA and HRA have been considered
in the preparation of this report. These include:
Planning Advisory Service (PAS) guidance – Principles of plan making Chapter 6 - The Role of
Sustainability Appraisal6
PAS Good Plan Making Guide7
Office of the Deputy Prime Minister ‘A Practical Guide to the Strategic Environmental Assessment
Directive’ (2005)8
National Planning Policy Framework9 and accompanying technical guidance10
National Planning Policy Guidance11
London Healthy Urban Development Unit – HIA guidance12
Equalities and Human Rights Commission – Equality Impact assessment quick-start guide13
6 Planning Advisory Service (PAS) (2015) Principles of Plan Making Chapter 6 [online] Available at: http://www.pas.gov.uk/chapter-6-the-role-of-
sustainability-appraisal 7 Planning Advisory Service (PAS) (2015) Good Plan Making Guide [online] Available at: http://www.pas.gov.uk/web/pas1/local-planning/-
/journal_content/56/332612/6627529/ARTICLE 8 Office of the Deputy Prime Minister (ODPM) (2005) A Practical Guide to the Strategic Environmental Assessment Directive [online] Available at:
https://www.gov.uk/government/uploads/system/uploads/attachment_data/file/7657/practicalguidesea.pdf 9 Department for Communities and Local Government (2012) National Planning Policy Framework [online] Available at:
http://planningguidance.communities.gov.uk/blog/policy/ 10 Department for Communities and Local Government (2012) Technical Guidance to the National Planning Policy Framework [online] Available at:
https://www.gov.uk/government/uploads/system/uploads/attachment_data/file/6000/2115548.pdf 11 Department for Communities and Local Government (2016) Planning Practice Guidance [online] Available at:
http://planningguidance.communities.gov.uk/blog/guidance/ 12 London Healthy Urban Development Unit (2016) Health Impact Assessment [online] Available at: http://www.healthyurbandevelopment.nhs.uk/our-
services/delivering-healthy-urban-development/health-impact-assessment/ 13 Equalities and Human Rights Commission (2010) Equality Impact assessment quick-start guide [online] Available at:
http://www.equalityhumanrights.com/sites/default/files/documents/PSD/equality_impact_assessment_guidance_quick-start_guide.pdf

8
3. Planning and Policy Context
3.1 Requirement and Scope
Local Plan documents and Sustainability Appraisal (SA) can be influenced by many different plans and
programmes. This is recognised by the SEA Regulations, which require a review of relevant plans and
programmes to be completed in the preparation of these documents. The review should include:
‘An outline of the contents and main objectives of the plan and programme, and of its relationships with other relevant plans and programmes’ and ‘the environmental protection objectives, established at international, community or member state level, which are relevant to the plan or programme and the way those objectives and any environmental considerations have been taken into account during its preparation’.14
The first stage in scoping the SA is therefore to review relevant international, national, regional and local policy,
plans and strategies. This will help to:
ensure Local Plan documents and SA are in line with the requirements of legislation and national policy;
maximise synergies between the Thurrock Local Plan and the SA and other relevant plans and policies,
and identify inconsistencies or constraints to be dealt with;
identify sustainability objectives, and key targets and indicators that should be reflected in the SA; and
provide current and projected baseline data.
At this stage in the SA process, the plans, policies and programmes reviewed cover Thurrock as a whole.
Whilst this provides the context for all documents contained within the Local Plan, more area-based or specific
Local Plan documents, such as master plans for major sites (sometimes referred to as adopted ‘area action
plans’) may require additional and more relevant documents to be reviewed as part of future scoping. This will
allow local issues to be identified and taken into account.
3.2 Document Review for Thurrock
An up-to-date, comprehensive list of key international, national, regional and local documents is provided in
Appendix A. These documents are reviewed in Appendix B, with a summary of national, regional and local
policy provided in sections 3.3 to 3.6. Policies and plans which pertain to specific environmental or sustainability
topics have been considered in developing the evidence base, and are presented in Chapter 4.
The review process will provide a valuable source of information and set out the contextual framework for
developing different components of the Local Plan and the SA. In particular:
at a high level, key legislation and national policies provide the planning context for Thurrock;
local documents provide a useful source of baseline information, and identify local priorities which will be
used to frame the SA Objectives and objectives of the Local Plan; and
a number of documents provide objectives and indicators that have helped shape the SA Framework.
3.3 International
Land use planning and management decisions are usually made at a local or regional level. However, the
European Commission has a role to play in ensuring Member States take environmental concerns into account
in their land-use development plans.
14 SI No. 1633 The Environmental Assessment of Plans and Programmes Regulations 2004 (Schedule 2 - Part 1 and 5)

9
European Territorial Agenda of the EU (2011)
Integrated spatial development has been addressed by the Territorial Agenda of the EU (2011) which focuses
on mobilising the potential of European regions and cities for sustainable economic growth and more jobs.15
The Åarhus Convention (2005) and UK Environmental Information Regulations (2004)
The UK Environmental Information Regulations (2004) transpose into law the European Åarhus Convention
(1998) as amended (2005), which establishes a number of rights of the public (citizens and their associations)
with regard to the environment. The Åarhus Convention creates obligations in three fields or 'pillars':
Public access to environmental information;
Public participation in decision-making on matters related to the environment; and
Access to justice (i.e. administrative or judicial review proceedings) in environmental matters.
Strategic Plan for the Åarhus Convention (2008)
The Strategic Plan for the Convention highlights challenges and reinforces the need to address them. This
includes the requirement that public authorities take responsibility for the quality and level of public participation.
3.4 National
National Planning Policy Framework and Technical Guidance (2012)
On the 27th March 2012 the UK Government published the National Planning Policy Framework (NPPF)
superseding 44 planning documents- primarily Planning Policy Statements (PPS) and Planning Policy Guidance
(PPGs), which previously formed government policy towards planning. The NPPF sets out the Government’s
planning policies for England and how these are expected to be applied.
Technical Guidance to the NPPF provides guidance to ensure the effective implementation of planning policy
set out in the NPPF on development in areas at risk of flooding and in relation to mineral extraction.
The Localism Act (2011)
The Localism Act abolished Regional Strategy (which previously local plans had to be in general conformity
with) and replaced this with a Duty to Co-operate. This requires local authorities and other public bodies to
work together in the preparation of development plans.
The UK Sustainable Development Strategy (2005)
The UK Sustainable Development Strategy (2005) outlines objectives for sustainable development. The
objectives are driven by environmental improvement, equality and inclusiveness, ‘polluter pays’ principle and
incentives for natural resource efficiency, promoting participation and applying strong scientific evidence with
accounting for uncertainty, public attitudes and public values.
3.5 Regional
The Regional Spatial Strategy for the East of England, which covered Essex (including Thurrock), was revoked
on January 3rd
2013. It is no longer part of the development plan as defined by Section 38(3) of the Planning
and Compulsory Purchase Act 2004. Instead development is guided by national policy and Local Development
Plans.
The South East Local Enterprise Partnership (LEP) is the business-led, public/private body established to drive
economic growth across East Sussex, Essex, Kent, Medway, Southend and Thurrock. The partnership has
15 European Commission (2011) Territorial Agenda of the European Union 2020 [online] Available at:
http://ec.europa.eu/regional_policy/sources/policy/what/territorial-cohesion/territorial_agenda_2020.pdf
10
produced a Strategic Economic Plan16, which outlines the opportunities and challenges across the SE LEP area,
and sets out its approach to creating growth. This includes focusing investment on key regions, sectors and
infrastructure such as ports, roads and rail.
3.6 Local
Core Strategy and Policies for Management of Development (2011)
Thurrock’s adopted Core Strategy contains objectives and policies covering a range of spatial development
issues in relation to education, health, community safety, sustainable development, climate change, energy and
flood management, housing, employment, sport and leisure, community facilities and the natural and historic
environment. It will remain in effect until it is replaced by the emerging Local Plan.
The Site Specific Allocations and Policies Local Plan (2013)
This planning document sets out site allocation for new development in Thurrock, together with area-based
policies. The plan was prepared to support the delivery of the adopted Core Strategy; however, on 12 Feb 2014
Thurrock’s cabinet authorised the preparation of a new Local Plan for Thurrock. Work undertaken for the Site
Specific Allocations and Policies Local Plan, including representations received on individual sites, will be
carried forward and incorporated into the emerging Local Plan.
Core Strategy and Policies for Management of Development Focused Review (2015)
The Review amends a number of policies to accord with current governmental advice and the NPPF.
Thurrock’s emerging Local Plan and Local Development Scheme
As outlined in Chapter 2, the Council is preparing an emerging Local Plan which will guide the future
development of Thurrock over the period to 2036. The new Local Plan will supersede the adopted Core
Strategy and other Local Development Plan documents.
The Thurrock Local Development Scheme (LDS): 2014-2017 is the Council’s project plan for preparing a new
Local Plan for the borough, which will eventually replace the Thurrock Core Strategy adopted in December
2011. The new Local Development Scheme (LDS) was approved by Cabinet on 10th December 2015.
3.7 Future Review
As the plans, policies and programmes covered in this review are replaced, amended or updated, further review
will be required to ensure the SA remains up-to-date and consistent with wider planning and policy objectives.
16 South East Local Enterprise Partnership (2014). Growth Deal and Strategic Economic Plan [online] Available at:
http://www.southeastlep.com/images/uploads/resources/SECTION_2_South_East_LEP_-_Growth_Deal_and_Strategic_Economic_Plan_WEB-2%281%29.pdf

11
4. Evidence Base
4.1 Introduction
The evidence base is a key feature of the SA process. The NPPF makes it clear that Local Plans must be
informed by a robust and credible, proportionate evidence base, and the SA is a key part of this evidence.
Gathering sound information about the current and future state of the environment and communities will allow
the SA to influence plan-making. A good SA evidence base provides the Council with the necessary assurance
that the SA has identified the plan’s potential effects correctly, so that it can consider whether and how to
address those potential effects – for example, whether or not to adopt a particular SA recommendation.
An SA evidence base may include data gaps or be missing information and yet still be sound; it is important
during the appraisal stage of SA to recognise opportunities to gather better information at appropriate stages in
the future (e.g. site-specific assessments or planning applications), and this may form part of the SA’s
recommendations.
The Council is in the process of undertaking a comprehensive and extensive update of the Local Plan evidence
base to ensure that the new Local Plan is compliant with the NPPF, and based upon up-to-date information and
data. As studies and reports are completed they will be published on the Council’s Local Plan website and will
inform preparation of the plan and further iterations of the SA.
4.2 Data sources
A desk-based review has been undertaken to identify baseline conditions in Thurrock. The baseline review is
based on readily available data and information gathered online and supplied by the Council. No specific site
surveys have been undertaken to inform this work. Each sub-section in this Chapter includes a summary of
relevant planning policies and legislation, along with an overview of the current and projected baseline for each
SA topic. The topics have been grouped under three themes: Environment, Socio-economics and Health.
4.3 Environmental baseline
4.3.1 Air Quality
Introduction
Air quality is defined as the condition of the air with respect to the presence (or absence) of pollutants, including
oxides of nitrogen (NOx), carbon monoxide (CO), hydrocarbons, carbon dioxide (CO2) and particulate matter
(PM). The presence of such pollutants in the air can have wide ranging consequences from an environmental
and health perspective.
Air with a high concentration of pollutants can exacerbate respiratory conditions such as asthma and bronchitis.
From an environmental point of view, pollutants such as NOx, CO and CO2 can have significant global warming
potential. In sufficient concentrations, NOx can also lead to deposition of nitrogen in sensitive habitats,
contributing to eutrophication or otherwise degrading the habitat.
Policy and Legislation
International
The EU Ambient Air Quality Directive (2008/50/EC) is a revision of previously existing European air quality
legislation, and sets out long‐term air quality objectives and legally binding limits for ambient concentrations of
certain pollutants in the air. For NO2 there are two limit values for the protection of human health. These require
Member States to ensure that:
(i) annual mean concentration levels of NO2 do not exceed 40μg/m3; and
12
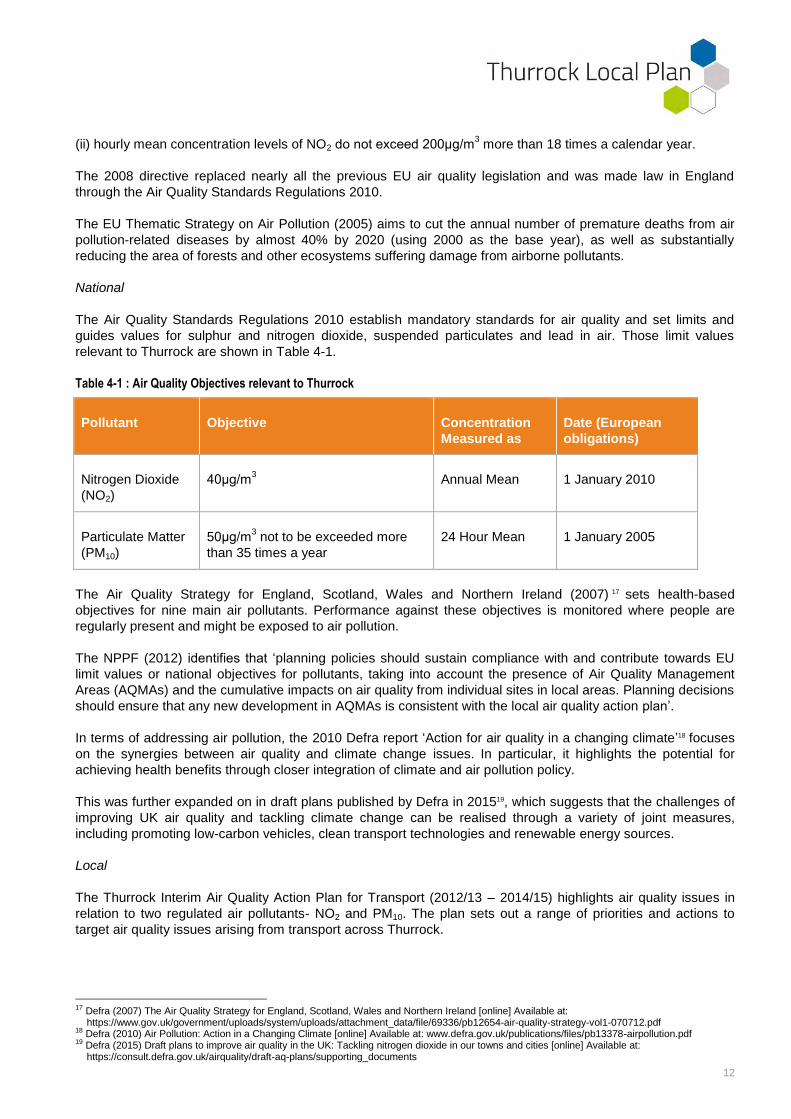
(ii) hourly mean concentration levels of NO2 do not exceed 200μg/m3 more than 18 times a calendar year.
The 2008 directive replaced nearly all the previous EU air quality legislation and was made law in England
through the Air Quality Standards Regulations 2010.
The EU Thematic Strategy on Air Pollution (2005) aims to cut the annual number of premature deaths from air
pollution-related diseases by almost 40% by 2020 (using 2000 as the base year), as well as substantially
reducing the area of forests and other ecosystems suffering damage from airborne pollutants.
National
The Air Quality Standards Regulations 2010 establish mandatory standards for air quality and set limits and
guides values for sulphur and nitrogen dioxide, suspended particulates and lead in air. Those limit values
relevant to Thurrock are shown in Table 4-1.
Table 4-1 : Air Quality Objectives relevant to Thurrock
Pollutant Objective Concentration
Measured as
Date (European
obligations)
Nitrogen Dioxide
(NO2)
40μg/m3 Annual Mean 1 January 2010
Particulate Matter
(PM10)
50μg/m3 not to be exceeded more
than 35 times a year
24 Hour Mean 1 January 2005
The Air Quality Strategy for England, Scotland, Wales and Northern Ireland (2007) 17 sets health-based
objectives for nine main air pollutants. Performance against these objectives is monitored where people are
regularly present and might be exposed to air pollution.
The NPPF (2012) identifies that ‘planning policies should sustain compliance with and contribute towards EU
limit values or national objectives for pollutants, taking into account the presence of Air Quality Management
Areas (AQMAs) and the cumulative impacts on air quality from individual sites in local areas. Planning decisions
should ensure that any new development in AQMAs is consistent with the local air quality action plan’.
In terms of addressing air pollution, the 2010 Defra report ‘Action for air quality in a changing climate’18 focuses
on the synergies between air quality and climate change issues. In particular, it highlights the potential for
achieving health benefits through closer integration of climate and air pollution policy.
This was further expanded on in draft plans published by Defra in 201519, which suggests that the challenges of
improving UK air quality and tackling climate change can be realised through a variety of joint measures,
including promoting low-carbon vehicles, clean transport technologies and renewable energy sources.
Local
The Thurrock Interim Air Quality Action Plan for Transport (2012/13 – 2014/15) highlights air quality issues in
relation to two regulated air pollutants- NO2 and PM10. The plan sets out a range of priorities and actions to
target air quality issues arising from transport across Thurrock.
17 Defra (2007) The Air Quality Strategy for England, Scotland, Wales and Northern Ireland [online] Available at:
https://www.gov.uk/government/uploads/system/uploads/attachment_data/file/69336/pb12654-air-quality-strategy-vol1-070712.pdf 18 Defra (2010) Air Pollution: Action in a Changing Climate [online] Available at: www.defra.gov.uk/publications/files/pb13378-airpollution.pdf 19 Defra (2015) Draft plans to improve air quality in the UK: Tackling nitrogen dioxide in our towns and cities [online] Available at:
https://consult.defra.gov.uk/airquality/draft-aq-plans/supporting_documents

13
Current Baseline
The majority of air pollution in Thurrock is caused by road vehicle emissions, particularly from Heavy Goods
Vehicles (HGVs). Thurrock is situated along a number of busy road transport routes, including the M25, A13,
A128, A126, A1089 and A1306. HGVs produce large quantities of NO2 and PM10 from their diesel engines and
from brake and tyre wear. The mix of residential and industry areas along these transport routes has further
exacerbated air quality issues.
Potential cross-boundary pollution affects Thurrock due to its close proximity to London and power stations
located nearby at Kingsnorth, Littlebrook and Grain, as well as from shipping along the Thames estuary. Other
pollution sources, including commercial, industrial and domestic sources, also make a contribution to
background pollution concentrations.20
There are currently 16 AQMAs in Thurrock, all of which have been declared for high NO2 levels, with a further
four of them also declared due to high levels of PM10.21 All of these AQMAs have been declared as a result of
road transport-related air pollution.
In September 2009, Thurrock’s AQMAs were prioritised in order of importance to assign air quality measures to
best counteract poor air quality from transport-related sources of pollution.22 The aim was to increase the focus
and spending of money in certain AQMAs which have the greatest air quality issues. The top three priority areas
were identified as:
London Road Aveley, next to the A1306;
London Road Purfleet, near to Jarrah Cottages; and
West of Chafford Hundred Visitor Centre.
Although air pollution has fallen in some areas of Thurrock in recent years – largely due to improvements in
motor vehicle technologies – on the whole air quality is not improving. This is primarily due to the increased
volume of vehicles on the road network, which has offset potential improvements.23
Monitoring of all pollutants over 2014 did not highlight any new potentially poor air quality areas within the
borough other than the ones which are already AQMAs.21
Both the rolling annual mean NOx and NO2 trends
monitored at sites across the borough show a gradual overall decline over the last 17 years. Some monitored
results for NO2 in certain AQMAs have shown in recent years that they are below the objective level.
Up-to-date monitoring of NO2 and PM10 confirms that the Government’s air quality objectives are still being
widely exceeded at locations with relevant public exposure. 21
The Council therefore plans to maintain its
AQMAs for these two pollutants. There have not been any new instances of breaches of the air quality
standards for either NO2 or PM10 within the borough.
Projected Baseline
Predictions of post-2014 NO2 concentrations were made by Thurrock Council using the Defra year adjustment
factors, based on 2014 measurements.21
The estimates indicate that despite the predicted reduction in
concentrations, of the 10 locations exceeding the objective in 2014, 8 are predicted to still be exceeding the
annual mean objective in 2015 with 0 sites predicted to be exceeding in 2020. This prediction must be used with
some caution, as the diffusion tube results have not shown this level of decrease in previous years, suggesting
this would be a significant change in the trend. It is more likely most of these sites will still exceed the annual
mean objective in 2015 and 2020.
20 Thurrock Council (2014) Air Quality Progress Report for Thurrock Council [online] Available at:
http://www.essexair.org.uk/Reports/Thurrock_Progress_Report_2014.pdf 21 Thurrock Council (2015) Air Quality Updating and Screening Assessment for Thurrock [online] Available at:
http://www.essexair.org.uk/Reports/Thurrock_USA_2015.pdf 22 Thurrock Council (2012) Fifth Round Updating and Screening Assessment for Air Quality [online] Available at:
https://www.thurrock.gov.uk/sites/default/files/assets/documents/air-quality-report-2012.pdf 23 Kings College London (2011) Essex Air [online] Available at: http://www.essexair.org.uk/AQInEssex/LA/Thurrock.aspx

14
What can be deduced from this is that broadly-speaking, NO2 emissions will continue to fall gradually, extending
the trend seen over the last two decades.
Monitoring of PM10 concentrations at a number of sites across Thurrock between 1997 and 2014 has shown a
small overall decrease, with seasonal and annual spikes, particularly in 2003 and 2011. However, since 2006
the rate of reductions has slowed to the extent that in 2014 there was little or no change in PM10 concentrations
registered at the majority of sites compared to previous years. It is likely that this trend will continue, with
gradual but small reductions in PM10 concentrations across the borough.
Annual Mean Sulphur Dioxide (SO2) concentrations across Thurrock between 1996 and 2014 have seen a
substantial decline, from around 17 μg/m3
in 1996 to around 2 μg/m3
in 2014. Concentrations are now
approaching the limit of detection.24 As reductions have slowed considerably since 2011, with the annual mean
concentration plateauing at about 2 μg/m3, it is likely that SO2 concentrations will continue to remain at this level
for the foreseeable future.
If pollutant concentrations continue to fall, it will be the Council’s aim to review some of its AQMA’s with the
intention of either reducing the current size of them or revoking some entirely. It should be noted that there is a
possibility that air quality may worsen in the long-term as result of climate change due to a greater likelihood of
prolonged periods of still, dry days, and to-date this relationship has been difficult to predict. This will need to be
taken into account in development of future air quality action plans and monitoring regimes, as will the effects of
proposed major infrastructure developments such as the Lower Thames Crossing and London Gateway.
4.3.2 Biodiversity, Flora and Fauna
Introduction
Biological diversity, or ‘biodiversity’, is the term given to the variety of life on Earth. It is the variety within and
between all species of plants, animals and micro-organisms and the ecosystems within which they live and
interact. It performs a number of important roles, from maintaining the function of the biosphere as a whole, to
providing food and medicine ingredients and enhancing health and well-being.
Nature conservation is concerned with maintaining a viable population of the country’s fauna, flora and wildlife
communities. Impacts on nature conservation are broadly split into two categories; habitats and species.
Policy and Legislation
International
The EC Directive on the Conservation of Natural Habitats of Wild Fauna and Flora 92/43/EEC (1992) (‘the
Habitats Directive’) and the EC Directive on the Conservation of Wild Birds 09/147/EC (2009) (‘the Birds
Directive’) aim to protect biodiversity through the conservation of natural habitats and wild plants and animals.
The network of ’Natura 2000’ sites which these directives protect, include SACs, which host rare, endangered
and vulnerable habitats and species of European importance, and SPAs which support significant populations
of wild birds of European impacts and their habitats.
National
The Conservation of Habitats and Species Regulations (2010) provide for the designation and protection of a
Natura 2000 sites, the protection of 'European protected species', and the adaptation of planning and other
controls for the protection of European Sites in the UK.
The Wildlife & Countryside Act 1981 (as amended) is the principal piece of UK legislation relating to the
protection of wildlife. It consolidates and amends existing national legislation to implement the Convention on
the Conservation of European Wildlife and Natural Habitats (Bern Convention) and Council Directive
79/409/EEC on the Conservation of Wild Birds (Birds Directive) in Great Britain. The Countryside and Rights of
24 Thurrock Council (2015) Air Quality Updating and Screening Assessment for Thurrock [online] Available at:
http://www.essexair.org.uk/Reports/Thurrock_USA_2015.pdf

15
Way (CRoW) Act 2000 was passed to provide additional levels of protection for wildlife whilst also strengthening
the protection afforded to Sites of Special Scientific Interest (SSSI).
The Natural Environment & Rural Communities (NERC) Act 2006 is designed to help achieve a rich and diverse
natural environment and thriving rural communities. Section 40 of NERC carries a duty to public bodies and
statutory undertakers to ensure due regard to the conservation of biodiversity. Section 41 requires the
Secretary of State to publish a list of the living organisms and types of habitat which it deems of principal
importance for the purpose of conserving biodiversity.
The Marine and Coastal Access Act 2009 allows for the creation of Marine Conservation Zones (MCZs), which
protect a range of nationally important marine wildlife, habitats, geology and geomorphology.
The National Planning Policy Framework 2012 requires planning authorities to minimise impacts on biodiversity
and provide net biodiversity gain where possible, including establishing coherent ecological networks which are
more resilient to current and future pressures.
The UK Post-2010 Biodiversity Framework (2012) replaces the UK Biodiversity Action Plan (1992). The
purpose of the Framework is to set a broad enabling structure for action across the UK to 2020.
Local
The Thurrock Biodiversity Action Plan (BAP) 2007-2012 (2007) identifies important species and habitats found
in Thurrock and includes an action plan for their conservation. The Council intends to commission a number of
studies to update the evidence basis which underpinned the original Thurrock BAP.
Current Baseline
Special Protection Area (SPA) / Ramsar
Thames Estuary and Marches SPA and Ramsar site is located in the south east of the borough, approximately
1km from East Tilbury and 2km from Stanford-le-Hope along the River Thames. Much of the site is brackish
grazing marsh, although some parts have been converted to arable use. The estuary and adjacent marsh areas
support an important assemblage of wintering water birds including grebes, geese, ducks and waders. Over
winter, the area regularly supports a large population of waterfowls and is also important during spring and
autumn for migratory birds.25
Marine Conservation Zones (MCZ)
Thurrock does not border or encompass any Marine Conservation Zones (MCZ). The River Thames and its
estuary was put forward as a potential MCZ in 2011, but was not selected for designation following a two year
consultation process.26
Although it is not designated as a MCZ, the Thames Estuary is an important fish nursery and spawning ground
with a high density of European eels. It also protects the seasonal seaward migration of smelt for which this is
the only site in the south east of England. The site is also considered the best in the region for the tentacled
lagoon worm.27
Sites of Special Scientific Interest (SSSIs)
There are 12 Sites of Special Scientific Interest (SSSI) within Thurrock, covering a total area of over 1,300
hectares. Table 4-2 provides a description of the nine sites designated for their biological or nature conservation
25 Joint nature Conservation Committee (JNCC): SPA description Thames Estuary and Marches [online] Available at: http://jncc.defra.gov.uk/page-
2042 26 Kent Wildlife Trust (2016) Marine Conservation Zones [online] Available at: http://www.kentwildlifetrust.org.uk/MCZs 27 DEFRA (2013) Marine Conservation Zones: Consultation on proposals for designation in 2013 [online] Available at: https://www.gov.uk/government/consultations/marine-conservation-zones-consultation-on-proposals-for-designation-in-2013

16
value. Three sites are designated for their geological characteristics.28 These are described in Section 4.3.6:
Geology & Soils.
Table 4-2 : Thurrock’s SSSIs29
SSSI sites Grid reference Description
Vange and
Fobbing Marshes TQ729844
An alluvial plain of the lower River Thames. Its unimproved coastal grassland and associated
dykes and creeks support a diversity of maritime grasses and herbs, many of which are
nationally important or rare, and together they form an outstanding assemblage of plants.
Holehaven Creek TQ753834
The intertidal mudflats and saltmarsh habitats of Holehaven Creek support a nationally
important number of black-tailed godwit. These sheltered inner estuary conditions are rare
within the Thames Estuary.
Mucking Flats and
Marshes TQ698791
An extensive stretch of the Thames mudflats and saltmarshes together with sea wall grassland.
Wintering wildfowl and waders both reach nationally and internationally important numbers on
the mudflats, roosting and feeding on adjacent saltmarsh and disused silt lagoon.
Hangman’s Wood
and Deneholes TQ630793
The remains of the medieval chalk mines provide an important underground hibernation site for
bats in Essex.
Grays Thurrock
Chalk Pit TQ609789
An active mineral extraction site which ceased operation in the early 1920s. Since then natural
colonisation of the pit bottom has created a range of woodland, scrub and calcareous
grassland; an important habitat for the assemblage of invertebrate fauna.
West Thurrock
Lagoon and
Marshes
TQ582763
One of the most important sites for wintering waders and wildfowl on the Inner Thames Estuary.
The combination of extensive intertidal mudflats together with a large and secure high tide roost
attracts waders in nationally important numbers, with significant populations of other bird
species.
Purfleet Road
Aveley TQ555798
The silts and sands of the site yield important assemblages of molluscs, insects, pollen and
mammal remains which are indicative of temperate or interglacial conditions.
Inner-Thames
Marshes TQ531802
The site forms the largest remaining expanse of wetland bordering the upper reaches of the
Thames Estuary. It is particularly notable for its diverse ornithological interest especially for the
variety of breeding birds and the numbers of wintering wildfowl, waders, finches and birds of
prey, with wintering teal populations reaching levels of international importance.
Basildon Meadows TQ703867 Three unimproved herb-rich meadows lying on neutral soils about two miles south west of
Basildon which are among the few areas of old pasture known to remain in the county.30
Local Nature Reserves (LNR)
There are two Local Nature Reserves (LNRs) within Thurrock. Grove House Wood in Stanford-Le-Hope is a
2.24 hectares area with a mixture of habitats including reed beds, a pond and brook as well as the woods. The
site is an important haven for wildlife in an area where no similar large habitats are found, while dead elms in
the wood provide nesting sites for woodpeckers.31 Linford Wood LNR in Linford is an area of woodland covering
3.46 hectares. It consists of a hedge bank, mixed woodland, willow plantation, ditches and an open area
surrounded by arable farmland. The wood provides a habitat for wildlife, including tawny owls, great spotted
woodpeckers and green woodpeckers, as well as migrant birds in spring and autumn.
Local Wildlife Sites (LWS)
There are currently 70 Local Wildlife Sites (LWS) in Thurrock.32 LWS are selected using established criteria
recognising their significance as habitat and/or for the species that they support. Designated habitats within the
borough include ancient woodland, grazing marsh, post-industrial brownfield sites, reedbeds and chalk
28 DEFRA (2016) Magic Mapping [online] Available at: http://www.magic.gov.uk/MagicMap.aspx 29 Natural England (2016) Designated Sites List [online] Available at: https://designatedsites.naturalengland.org.uk/ 30 Natural England (2016) SSSI List [online] available at http://www.sssi.naturalengland.org.uk/ 31 Natural England (2016) Local Nature Reserves List [online] Available at:
http://www.lnr.naturalengland.org.uk/special/lnr/lnr_details.asp?themeid=1009001 32 Essex Wildlife Trust Biological Records Centre (2016) [online] Available at: http://www.essexwtrecords.org.uk/lowsfinder#
17
grassland. An updated Biodiversity Study for Thurrock is being commissioned by the Council in 2016. This may
result in some revisions of existing LWS site boundaries as well as the designation of new sites.
Ancient Woodland
There are 22 areas of ancient woodland in Thurrock, clustered mainly in two locations: the Langdon Hills/One
Tree Hill complex in the north east of the borough, and the Aveley/South Ockendon area in the south west.33
The majority of ancient woodlands in the borough are also designated as Local Wildlife Sites.34
Protected Habitats and Species
Thurrock contains a number of national Biodiversity Action Plan (BAP) Priority Habitats, including ancient and
semi-natural woodland, ancient replanted woodland, deciduous woodland, broadleaved woodland, coastal and
floodplain grazing marsh, good quality semi-improved grassland, coastal saltmarsh, mudflats and reed beds.
Road verges and drainage ditches can provide local habitat for important species. Some are recognised as a
Local BAP habitat, whilst others may be recognised as a local non-designated site.35
Key habitats in the borough as set out in the Thurrock Biodiversity Action Plan include35
:
Estuarine habitats: Coastal areas from Corringham to East Tilbury provide nationally important feeding
grounds for a wide variety of over-wintering waders and wildfowl.
Farmland: As the major land use within Thurrock, sympathetic management of farmland is considered to
be vital to the conservation of the areas wildlife and landscape.
Thames Terraces: The Purfleet-Grays ridge rises from the Thames, forming a central belt of sands and
gravels across the borough, where short acidic grassland can develop.
Woodland: There are many small semi-natural broad-leaved woods in the north of the borough, covering
2% of the land area.
Priority species identified within the Thurrock Biodiversity Action Plan are: brown hare, bats, hedgehogs, water
vole, black redstart, skylark, song thrush, adder, grass snake, great crested newts, glow-worm, hornet robberfly,
shrill carder-bee, stag beetle, black poplar and broadleaved cudweed.
There are a few Essex and national BAP species not covered by the Thurrock BAP which could be present in
the borough, including the brown carder-bee, digger wasp and the dormouse.
Projected Baseline
Evidence on the status and trends of biodiversity in the UK suggests long-term declines, but there have been
improvements recently for some species and habitats. Of the range of ecosystem services delivered in the UK
by eight broad habitat types, about 30% have been assessed as declining since 1990. 36 Reductions in
ecosystem services are associated with declines in habitat extent or condition and changes in biodiversity,
though the exact relationships are not well-documented.
There is currently no assessment of spatial indicators of ecosystem health at a regional or local level. This
makes it difficult to predict future changes in the baseline. What is clear from past trends is that development
can have both adverse and beneficial impacts on biodiversity, flora and fauna. Land-take required to facilitate
development can cause loss of and damage to habitats, but intelligent design and creation of green corridors
can help to offset such impacts and even enhance biodiversity at a local level.
33 Thurrock Council (2012) Site Specific Allocations and Policies Development Plan Document Issues and Options Consultation- Technical
Appendices [online] Available at: https://www.thurrock.gov.uk/sites/default/files/assets/documents/consult_sites_201203_maps_p3_4.pdf 34 DEFRA (2016) Magic Mapping [online] Available at: http://www.magic.gov.uk/MagicMap.aspx 35 Thurrock Council (2007) Biodiversity Action Plan [online] available at: https://www.yumpu.com/en/document/view/11846083/thurrock-council-biodiversity-action-plan-2007-2012 (accessed 01/2016) 36 UK National Ecosystem Assessment (2011) Synthesis of the key findings [online] Available at: http://uknea.unep-
wcmc.org/LinkClick.aspx?fileticket=ryEodO1KG3k%3D&tabid=82

18
4.3.3 Climate Change and Energy
Introduction
Climate change is one of the key challenges facing the UK and the world today. It poses many environmental
risks; including extended period of dryness and heat in the summer which could lead to drought; heightened
flood risk due to more intensive and prolonged rainfall, particularly in winter months; and sea level rise and
changes in wave patterns and strength which may result in increased erosion of coastal areas. Such
environmental effects may also have significant socio-economic and health implications, particularly for nations
and regions less able to mitigate or adapt to changes.
As climate change is difficult to quantify and predict, approaches to addressing impacts tend to focus on
reducing emissions of carbon dioxide and other greenhouse gases (GHG) which contribute to anthropogenic
global warming and thus may bring about climate change.
Policy and Legislation
International
The United Nations Framework Convention on Climate Change, (1992 – came into force 1994) aimed to
mitigate the negative impacts of climate change and stabilise GHG concentrations in the atmosphere at a level
that would prevent dangerous anthropogenic interference with the climate system.
Under the Kyoto Protocol (1997) many of the world’s developed countries agreed to reduce collective emissions
of GHG by 5.2% from 1990 levels by 2012. The Doha amendment adds a second commitment period, in which
parties must reduce emissions by at least 18% below 1990 levels between 2013 and 2020.
Through the Promotion of The Use of Energy from Renewable Sources Directive (2009/28/EC), the EU
committed to providing 20% of energy from renewable sources by 2020 and a mandatory 10% minimum target
should be achieved by all Member States for the share of biofuels in transport petrol and diesel consumption.
National
The Climate Change Act (2008) aims to achieve the Kyoto target, setting out a legally binding framework for the
UK to cut carbon emissions. It also paves the way for the UK to adapt to climate change.
The UK Low Carbon Transition Plan (2009) sets out how the UK will meet a 34% cut in emissions on 1990
levels (or an 18% cut on 2008 levels) by 2020 to deliver the UK’s legally binding target to cut emissions by at
least 80% by 2050. It will do this through a set of five-year “carbon budgets” to 2022 to keep the UK on track.
The UK Climate Change Programme (2006) emphasises the contribution that Local Planning Authorities can
make to reducing transport-related emissions of GHG.
Local
Thurrock Council’s Energy Study (2010) assessed renewable and low-carbon energy generation opportunities
for Thurrock, providing an evidence base to support proposed planning policies and evaluate the feasibility of
renewable energy targets in new residential and non-residential buildings.
The Local Climate Impacts Profile Report: Planning for Thurrock’s Adaptation to Impacts of Climate Change
(2010) was developed to assist the Council and its partners in the development of a comprehensive risk-based,
site and service-specific action plan, to ensure that Thurrock’s infrastructure, services and communities are
resilient to the impacts of a changing climate.

19
Current Baseline
Emissions of carbon dioxide (CO2) per capita in Thurrock have been falling in recent years but remain higher
than regional and national averages. Total emissions per capita have fallen from 12.6 tonnes in 2005 to 7.3
tonnes in 2013 (a decrease of 42%).37
This reduction can be broken down as follows:
transport emissions per capita have fallen from 3 tonnes per capita in 2005 to 2.5 in 2013 (a reduction of
around 17%);
domestic emissions per capita have reduced from 2.2 to 1.8 tonnes (a decrease of approximately 18%);
and
industrial emissions per capita have decreased from 7.3 tonnes in 2005 to 3.0 tonnes in 2013 (a 59%
reduction).
Comparing this to regional and national figures - at 7.3 tonnes, the total emissions per capita figure for Thurrock
is considerably higher than that of Essex (6.2 tonnes), and higher than the total emissions per capita for East of
England (6.7 tonnes) and England (6.7 tonnes).37
Figure 4-1 and 4-2 show how Thurrock’s total CO2 emissions in 2005 and 2013 were divided between industry
and commercial, domestic and transport sources.
Figure 4-1 and 4-2 : Breakdown of Thurrock CO2 emission sources 2005 - 2013
Per capita road transport emissions in Thurrock in 2013 were 39% higher than the national average. This may
partly be due to the borough’s proximity to London, which results in considerable levels of commuting.
Historically, energy and electricity consumption in Thurrock has been relatively high, with industrial and
commercial energy consumption widely regarded as the cause of disproportionately high energy consumption
per capita and related GHG emissions. In 2008, electricity consumption stood at 96,600 kWh per capita, three
times the regional average.38
However, both domestic and non-domestic electricity consumption has gradually been falling. Between 2005
and 2014 total domestic consumption of electricity in Thurrock fell by around 8.7%; a greater reduction than that
of the East of England (8.6%) and England (8.3%).39 Non-domestic (commercial and industrial) consumption of
electricity saw even greater reductions over this period, falling from 825 Gigawatt hours (GWh) in 2005 to 653
GWh in 2014, a decrease of approximately 21%. This reduction was far greater than that seen in the East of
England (7.4%) and the national average (7.5%).
37 DECC (2015) UK Local Authority and Regional Carbon Emissions National Statistics 2005-2013 [online] Available at: https://www.gov.uk/government/statistics/uk-local-authority-and-regional-carbon-dioxide-emissions-national-statistics-2005-2013 38 Thurrock Council (2008) Thurrock Climate Change Evidence Base [online] Available at http://www.thurrock.gov.uk/planning/strategic/pdf/ldf_tech_climate_2008.pdf 39 Department of Energy & Climate Change (2015) Sub-national electricity sales and numbers of customers [online] Available at:
https://www.gov.uk/government/collections/sub-national-electricity-consumption-data
58% 18%
24%
Breakdown of Total CO2 Emissions in Thurrock
(2005)
Industry andCommercial
Domestic
Transport
41%
24%
35%
Breakdown of Total CO2
Emissions in Thurrock (2013)
Industry andCommercial
Domestic
Transport

20
In fact, the largest decrease in total energy consumption as a percentage between 2012 and 2013 seen
anywhere in the UK occurred in Thurrock, where total energy consumption fell by 48% from 0.6 to 0.3 mtoe
(megatonnes of oil equivalent).40 These changes were mostly brought about by reductions in the industry and
commercial sector.
The Department of Energy and Climate Change (DECC) manages a set of online maps showing heat demand
from buildings across England. As Figure 4-3 demonstrates, heat demand for the borough is concentrated in the
West Thurrock, Grays and Thames Haven areas.41
Figure 4-3 : Heat Demand in Thurrock
Projected Baseline
According to 2009 UK Climate Projections42, by 2080 temperatures in Essex are likely to increase by 2.6 - 3.7°C
in the winter and 2.9 - 4.7°C in the summer. This will be coupled with an anticipated increase in precipitation of
12.9 – 21.3% in the winter and a decrease of 14.9 – 27.9% in the summer.
These changes could create a number of risks, including increased risks to people, property and the
environment from flooding; hotter and drier summers causing “heat stress” to buildings, utilities and the
transport system and putting public health and safety at greater risk; and decreased moisture in soils
(particularly during summer and autumn) potentially affecting agriculture, the natural environment and
landscape.
Climate-related weather events identified as posing the greatest risk to Thurrock and its communities are:
Heat wave and drought;
Flooding (including flash, fluvial and tidal flooding); and
Extreme weather events, including snow and ice and stronger winds.
40 Department of Energy & Climate Change (2015) Sub-national total final energy consumption statistics [online] available at:
https://www.gov.uk/government/uploads/system/uploads/attachment_data/file/462932/Sep_2015_-_Sub-national_total_fuel_consumption_factsheet_FINAL__publication_version_.pdf
41 DECC (2012) National Heat Map [online] Available at http://ceo.decc.gov.uk/nationalheatmap/ 42 Thurrock Council (2010) Planning for Thurrock’s Adaptation to Impacts of Climate Change [online] Available at: http://www.thurrock.gov.uk/planning/strategic/pdf/ldf_tech_climate_201010.pdf

21
Growth in traffic levels, largely as a result of ongoing development, is a continuing long-term trend in Thurrock.
This means that the difference between Thurrock’s per capita road transport emissions and the national
average is likely to continue widening. This could conflict with Thurrock’s attempts to meet its carbon emission
targets.
4.3.4 Cultural Heritage
Introduction
Cultural heritage is often thought of in environmental assessment terms as comprising three elements:
archaeological remains – the material remains of human activity from the earliest periods of human
evolution to the present, which may be buried traces of human activities, sites visible above ground, or
moveable artefacts;
historic buildings – architectural or designed or other structures with a significant ‘historical value’, which
may include structures that have no aesthetic appeal or structures not usually thought of as buildings’, such
as milestones or bridges; and
historic landscape – the current landscape, whose character is the result of the action and interaction of
natural and human factors, and includes evidence of past human activities, which is a significant part of the
historic landscape, and may derive both from archaeological remains and historic buildings within it.
Historic features and archaeological remains can be affected by new development through effects to their
integrity - in the form of damage or degradation caused by land-take, or as is more often the case, effects on
their setting from changes in the landscape.
Policy and Legislation
International
The European Conventions for the protection of the Architectural Heritage of Europe and the protection of
Archaeological Heritage (1987) set out a framework for the protection of assets of national value, as well as
archaeological assets generally.
National
National legislation such as the Planning (Listed Buildings and Conservation Areas) Act (1990) and the Ancient
Monuments and Archaeological Areas Act (1979) builds on the framework set out in the European conventions
and includes for the protection of Scheduled Monuments, Conservation Areas, Registered Parks and Gardens
and Listed Buildings.
The Hedgerow Regulations (1997- as amended 2003) set the legislative context for the protection of
countryside boundary features.
Local
The Thurrock Unitary Historic Environment Characterisation Project (2009) considers the sensitivity, diversity
and value of historic environment resources within Thurrock and aims to facilitate development of positive
approaches to the integration of historic environment objectives into spatial planning.
Current Baseline
Thurrock contains a number of historic assets including seven conservation areas and 245 listed buildings (239
of which Thurrock listed as special interest).43 Thirteen of Thurrock’s Listed Buildings are Grade I, 15 are Grade
II* and the remaining 217 are Grade II.
43 Thurrock Council (2016) Listed Buildings [online] available at: https://www.thurrock.gov.uk/listed-buildings/listed-buildings-in-thurrock

22
The seven conservation areas are Horndon-on-the-Hill, Corringham, Orsett, Fobbing, Purfleet, West Tilbury and
East Tilbury. The Council continues to research and identify other potential conservation areas.
There are 17 scheduled monuments in Thurrock.44
Four are in the south east of the borough, to the east of
Tilbury and five are located in the centre of the borough near Orsett and Orsett Heath. The remainder are
spread across the west, north and east of the borough, towards the edge of its administrative boundary.
The borough has one registered Grade II Park and Garden – Belhus Park, a remnant of a mid-18 century park
which was converted to a golf course and leisure centre in 2000.44
The English Heritage ‘At Risk Register’ identifies 3 Listed Buildings and 2 Scheduled Monuments at Risk in
Thurrock.45 The Listed Buildings considered to be at risk are:
The State Cinema, George Street, Grays;
The Dovecote to east of High House, London Road, Purfleet; and
The Coalhouse Fort in Tilbury.
The Scheduled Monuments considered to be at risk are:
The causewayed enclosure and Anglo-Saxon cemetery, 500m from Heath Place; and
The Crop mark complex at Orsett.
Projected Baseline
The historic environment can be considered a finite resource. It cannot be replaced and is susceptible to decline
over time as historic features experience degradation and decay. However, cultural heritage as a whole can
evolve and change, and features which are not currently considered a valued part of the historic environment
may become so in the future, either due to their uniqueness, past use or historic or cultural significance.
At a local level infrastructure, development and environmental pressures such as extreme weather and flooding
present the greatest risk to cultural heritage assets.
4.3.5 Flood Risk
Introduction
Flood risk is a combination of the probability and the potential consequences of flooding from all sources. This
includes flooding from rivers and the sea, directly from rainfall on the ground surface and rising groundwater,
overwhelmed sewers and drainage systems, and from reservoirs, canals and lakes and other artificial sources.46
Policy and Legislation
International
The Water Framework Directive (WFD) 2000/60/EC (2000) expands the scope of water protection to all waters,
surface waters and groundwater, and aimed to achieve ‘good’ status or potential for all waters by 2015, or under
certain provisions, 2021 or 2025.
National
The Flood & Water Management Act 2010 assigned new responsibilities to local authorities to work in
partnership with the Environment Agency, water companies and others to manage various aspects of flood risk.
44 DEFRA (2016) Magic Mapping [online] Available at: http://www.magic.gov.uk/MagicMap.aspx 45 English Heritage (2012) Thurrock Heritage at Risk [online] Available at: http://risk.englishheritage. org.uk/register.aspx?rs=1&rt=0&pn=1&st=a&ua=Thurrock+(UA)&ctype=all&crit= 46 Department of Communities and Local Government (2015) Planning Practice Guidance: Planning and Flood Risk [online] Available at:
http://planningguidance.planningportal.gov.uk/blog/guidance/flood-risk-and-coastal-change/planning-and-flood-risk/what-is-flood-risk/
23
It requires Lead Local Authorities to produce a local strategy setting out significant flood risks affecting their
area, and how they intended to address them.
The UK Water Strategy (2008) builds on the principles of the existing Government Strategy for Flood and
Coastal Erosion Risk Management - ‘Making Space for Water’ (2005) to ensure a fully integrated approach to
flood risk and water management up to 2030.
Local
Flood Risk is included as a key consideration for development in the Thames Gateway South Essex Green Grid
Strategy (2005).
Thurrock’s Surface Water Management Plan (2014) 47 describes the Council’s surface water management
strategy, including consideration of flooding from sewers, drains, groundwater and run-off from land, small
watercourses and ditches that occurs as a result of heavy rainfall. For each of the 14 critical drainage areas
identified, the Council has produced a preferred option of flood defences, including mitigation measures such as
upstream flood storage areas, de-culverting of watercourses and improving in-stream conveyance of water.
In June 2015, Thurrock published a Draft Local Flood Risk Management Strategy 2016-2021, which aims to
provide a framework for how the Council, as the Lead Local Flood Authority, will work alongside other Risk
Management Authorities to manage and respond to local flood risk identified in Thurrock. The Strategy was
consulted on between June and September 2015 and on 13th January 2016 the Council recommended that the
final Strategy be approved.
Current Baseline
Thurrock has suffered the consequences of flooding in recent years, and a large proportion of Thurrock’s urban
areas are located within Flood Zone 3 (highest risk with a 1 in 100 chance of annual flooding). It has been
estimated that in total there are approximately 11,000 properties currently at risk of tidal flooding, with several
hundred properties at risk of fluvial flooding.48
Large areas of the borough are located within flood risk zones 2 and 3, especially in areas immediately adjacent
to the River Thames and Mardyke (Figure 4-4). Some of the key areas identified for major development and
regeneration (e.g. Tilbury, Thames Gateway) are partly located in Flood Zone 3.
47 Thurrock Council (2014) Surface Water Management Plan: Final Report [online] Available at:
https://www.thurrock.gov.uk/sites/default/files/assets/documents/surface_water_management_201407.pdf 48 Thurrock Council (2013) Core Strategy and Policies for Management of Development Focused Review- Consistency with the NPPF [online]
Available at: https://www.thurrock.gov.uk/sites/default/files/assets/documents/consult_core_nppf_sa_201305.pdf
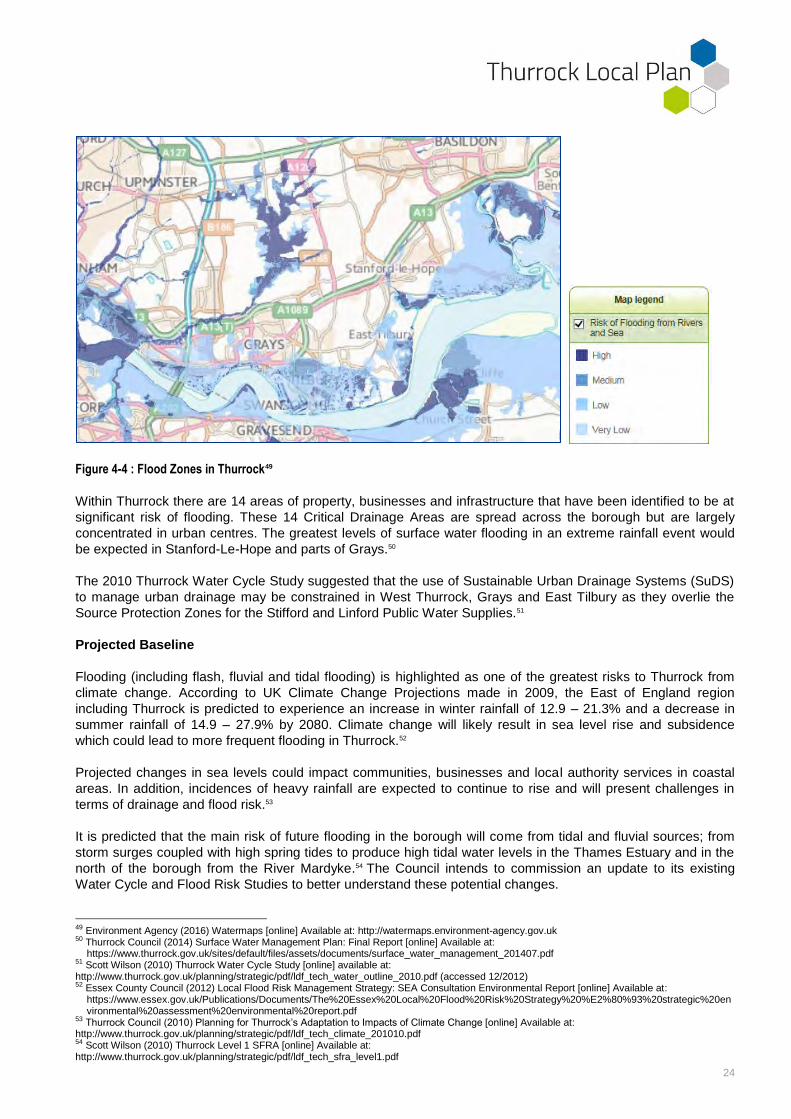
24
Figure 4-4 : Flood Zones in Thurrock49
Within Thurrock there are 14 areas of property, businesses and infrastructure that have been identified to be at
significant risk of flooding. These 14 Critical Drainage Areas are spread across the borough but are largely
concentrated in urban centres. The greatest levels of surface water flooding in an extreme rainfall event would
be expected in Stanford-Le-Hope and parts of Grays.50
The 2010 Thurrock Water Cycle Study suggested that the use of Sustainable Urban Drainage Systems (SuDS)
to manage urban drainage may be constrained in West Thurrock, Grays and East Tilbury as they overlie the
Source Protection Zones for the Stifford and Linford Public Water Supplies.51
Projected Baseline
Flooding (including flash, fluvial and tidal flooding) is highlighted as one of the greatest risks to Thurrock from
climate change. According to UK Climate Change Projections made in 2009, the East of England region
including Thurrock is predicted to experience an increase in winter rainfall of 12.9 – 21.3% and a decrease in
summer rainfall of 14.9 – 27.9% by 2080. Climate change will likely result in sea level rise and subsidence
which could lead to more frequent flooding in Thurrock.52
Projected changes in sea levels could impact communities, businesses and local authority services in coastal
areas. In addition, incidences of heavy rainfall are expected to continue to rise and will present challenges in
terms of drainage and flood risk.53
It is predicted that the main risk of future flooding in the borough will come from tidal and fluvial sources; from
storm surges coupled with high spring tides to produce high tidal water levels in the Thames Estuary and in the
north of the borough from the River Mardyke.54 The Council intends to commission an update to its existing
Water Cycle and Flood Risk Studies to better understand these potential changes.
49 Environment Agency (2016) Watermaps [online] Available at: http://watermaps.environment-agency.gov.uk 50 Thurrock Council (2014) Surface Water Management Plan: Final Report [online] Available at:
https://www.thurrock.gov.uk/sites/default/files/assets/documents/surface_water_management_201407.pdf 51 Scott Wilson (2010) Thurrock Water Cycle Study [online] available at: http://www.thurrock.gov.uk/planning/strategic/pdf/ldf_tech_water_outline_2010.pdf (accessed 12/2012) 52 Essex County Council (2012) Local Flood Risk Management Strategy: SEA Consultation Environmental Report [online] Available at:
https://www.essex.gov.uk/Publications/Documents/The%20Essex%20Local%20Flood%20Risk%20Strategy%20%E2%80%93%20strategic%20environmental%20assessment%20environmental%20report.pdf
53 Thurrock Council (2010) Planning for Thurrock’s Adaptation to Impacts of Climate Change [online] Available at: http://www.thurrock.gov.uk/planning/strategic/pdf/ldf_tech_climate_201010.pdf 54 Scott Wilson (2010) Thurrock Level 1 SFRA [online] Available at: http://www.thurrock.gov.uk/planning/strategic/pdf/ldf_tech_sfra_level1.pdf

25
4.3.6 Geology and Soils
Introduction
This topic considers potential effects of development on soil resources and quality (including contamination and
the potential for activities to disturb historic contamination), as well as potential effects on protected or important
geological features such as designated geological sites.
Policy and Legislation
International
The EU Soil Strategy (2006) was widely regarded as a precursor to the development of a Soil Framework
Directive to protect and ensure the sustainable use of soil. Its aim was to prevent further soil degradation and
restore degraded soil in line with its current and intended use.
While the European Commission decided in May 2014 to withdraw the proposal for a Soil Framework Directive,
the Seventh Environment Action Programme (2014) recognises that soil degradation is a serious challenge. It
aspires that by 2020 land is managed sustainably in the Union, soil is adequately protected and the remediation
of contaminated sites is well underway. It commits the EU and its Member States to increase efforts to reduce
soil erosion and increase soil organic matter, and remediate contaminated sites.
The EU Environmental Liability Directive (99/31/EC) focuses on prevention and remediation of environmental
damage, including land contamination, which presents a threat to human health. The Directive is based on the
polluter pays principle, where polluters are responsible for remediating damage they cause to the environment.
National
Little statutory protection exists specifically for soils in the UK, although they are indirectly protected by other
legislation such as that covering the prevention of pollution and contamination, and for land use planning.
The England Soil Strategy (2009) sets out a vision to improve the management of soil and tackle soil
degradation within 20 years in England as part of maintaining sustainable food supplies and developing
resilience to climate change.
Local
One of the overarching principles of the Thurrock Greengrid Strategy 2006-2011 is to protect the integrity and
functioning of natural systems (hydrology, soils, bio and geo-diversity) and seek to improve it wherever possible
through development and sustainable management systems.
Current Baseline
Thurrock lies on four main types of underlying geology found in layers that transition from the north of the
borough to the south: the Thames Group (clay, silt, sand and gravel); the Lambeth Group (clay silt, sand and
gravel); Thanet formation (sand, silt and clay) and the White Chalk Subgroup (chalk). The underlying geology
gets finer towards the River Thames.55
Excluding urban areas where soils have not been mapped, there are three main soil types in Thurrock reflecting
the underlying geology and pattern of drainage in the area.56 Adjacent to the shores of the Thames and the Mar
Dyke the low-lying floodplain land is dominated by groundwater gley soils, which are characteristically a mixture
of coarse and fine loamy permeable soils affected by groundwater. To the north of the borough away from the
main rivers, there are seasonally waterlogged slowly permeable surface-water gley soils intersected by a
55 British Geological Survey (2016) Geology of Britain viewer [online] Available at: http://mapapps.bgs.ac.uk/geologyofbritain/home.html 56 Environmental Agency (2015) Environment Agency Groundwater [online] Available at http://maps.environment-agency.gov.uk

26
network of drainage ditches. In the east, brown soil dominates except within the river flood zones. These soils
are loamy or clayey with reddish or reddish mottles, clay-enriched subsoil.57
There are three Sites of Special Scientific Interest (SSSIs) in Thurrock designated for their geological
characteristics - Globe Pit, Lion Pit and Purfleet Chalk Pits. These sites are described in Table 4-3.
Table 4-3 : Geological SSSIs in Thurrock
SSSI Grid
reference
Description
Purfleet chalk Pits TQ563784 Mid-Pleistocene sand and gravel deposits overlying chalk are exposed in a series of disused
quarried sites. The compiled lithstratigraphical and biostratigraphical evidence contained here
indicates the importance of this site in the scientific study of both the evolution of the Thames
and Northern European interglacial sequences.
Globe Pit TQ625783 An important site for the interrelationship of archaeology with geology since it is vital in the
correlation of the Lower Palaeolithic chronology with the Pleistocene Thames Terrace
sequence.
Lion Pit TQ598781 A pit that exhibits a complex sequence of Pleistocene Thames deposits overlying and banked
against chalk, representing the northern edge of the river’s floodplain at the time of deposition.
Geo-Essex is currently undertaking an assessment of sites within Thurrock that could be designated Local
Geological Sites. Where relevant, the outcomes of this assessment will inform the SA.
The majority of agricultural land in Thurrock is classed as grade II and III, defined as being among the ‘best and
most versatile’ soils. There is a small area of highest quality grade I agricultural land in the west of the borough.
Thurrock Council directly manages two allotment sites; one in Corringham and one in Stanford-le-Hope. There
are also 22 self-managed sites throughout the borough.58
Projected Baseline
Soil is a finite natural resource on which life depends. It regenerates only over extremely long geological
timescales and provides many essential services on which humans rely, including food production, water
management and support for valuable biodiversity and ecosystems. As a large store of carbon, it also plays a
vital role in preventing adverse climate change.
Soils in England have degraded over the last 200 years due to intensive agricultural production and industrial
pollution. Soils continue to face three main threats:
Soil erosion by wind and rain - erosion affects the productivity of soils as well as water quality and aquatic
ecosystems.
Compaction of soil - reduces agricultural productivity and water infiltration, and increases flood risk through
higher levels of runoff.
Organic matter decline - loss of organic matter reduces soil quality, affecting the supply of nutrients and
making it more difficult for plants to grow, as well as increasing emissions to the atmosphere.
According to UK Climate Projections made in 2009, the south east of the UK will face a decrease in soil
moisture (particularly during summer and autumn months) in the future, which is likely to affect agriculture, the
natural environment and the landscape.59
57 Thurrock Council (2005) Thurrock landscape capacity study [online] Available at:
https://www.thurrock.gov.uk/sites/default/files/assets/documents/ldf_tech_landscape.pdf 58 Thurrock Council (2012) Allotment Sites [online] Available at: http://www.thurrock.gov.uk/environment/allotments/ 59 Thurrock Council (2010) Local Climate Impacts Profile (NI 188): Planning for Thurrock’s Adaptation to Impacts of Climate Change [online] Available
at: https://www.thurrock.gov.uk/sites/default/files/assets/documents/ldf_tech_climate_201010.pdf

27
4.3.7 Landscape, Townscape and Visual Impacts
Introduction
The landscape takes its character from a combination of elements, including topography, watercourses, land
use and pattern, vegetation, public open space and cultural heritage features. Landscapes vary considerably in
character and quality, and are often considered a key component of the distinctiveness of any local area or
region. The concept of ‘townscape’ applies the same principles to an urban context, with greater emphasis on
the built environment.
Policy and Legislation
International
The European Landscape Convention (2000) established a definition of landscape and highlighted the
importance of developing policies dedicated to the protection, management and creation of landscapes, and
establishing procedures for stakeholders and the public to participate in policy creation and implementation.
National / Regional
The Rural Strategy (2004) reviews and updates the Rural White Paper (2000) following the creation of the
Department for Environment, Food and Rural Affairs in 2001. It set out a new devolved and targeted approach
to rural policy and development delivery.
The Countryside and Rights of Way Act (2000) addresses the designation of Areas of Outstanding Natural
Beauty (AONBs), Sites of Special Scientific Interest (SSSIs), Open Country and Common Land. It also adds
provisions to the consideration and management of the Public Right of Way network.
At a regional level, landscape issues were included in the Thames Gateway South Essex Green Grid Strategy
(2005).
Local
Building on the work of the Thames Gateway South Essex Green Grid Strategy, in 2006/07 a Green Grid
Strategy for Thurrock was developed. This identified existing and potential assets and needs of the borough and
mapped and evaluated the elements within Thurrock that contribute to the local Green Grid and broader green
infrastructure network. The Strategy included plans for providing accessible open spaces to meet community
aspirations and landscape features recognised for their biological and ascetic value.
Current Baseline
Thurrock forms part of the Northern Thames Basin National Character Area (NCA), which extends from
Hertfordshire in the west to the Essex coast in the east.60 Whilst arable agriculture is a large industry in the area,
the London Clay provides a poor quality soil that becomes waterlogged in winter and cracks and shrinks in
summer. Better quality soil is found in areas that contain alluvial deposits from the Thames and other rivers.
The Northern Thames Basin is an area rich in geodiversity, archaeology and history and diverse landscapes
ranging from the wooded Hertfordshire plateaux and river valleys, to the open landscape and predominantly
arable area of the Essex heathlands, with areas of urbanisation throughout. Urban expansion has been a
feature of this area since the 16th century, and it increased dramatically from the mid-19th century as
infrastructure improved and people could travel to work in London from the surrounding areas. This has put
increased pressure on the area in terms of extra housing developments, schools and other necessities for
expanding populations, with a consequential reduction in tranquillity.
60 Natural England (2014) National Character Area Profiles [online] Available at:
http://publications.naturalengland.org.uk/publication/4721112340496384?category=587130
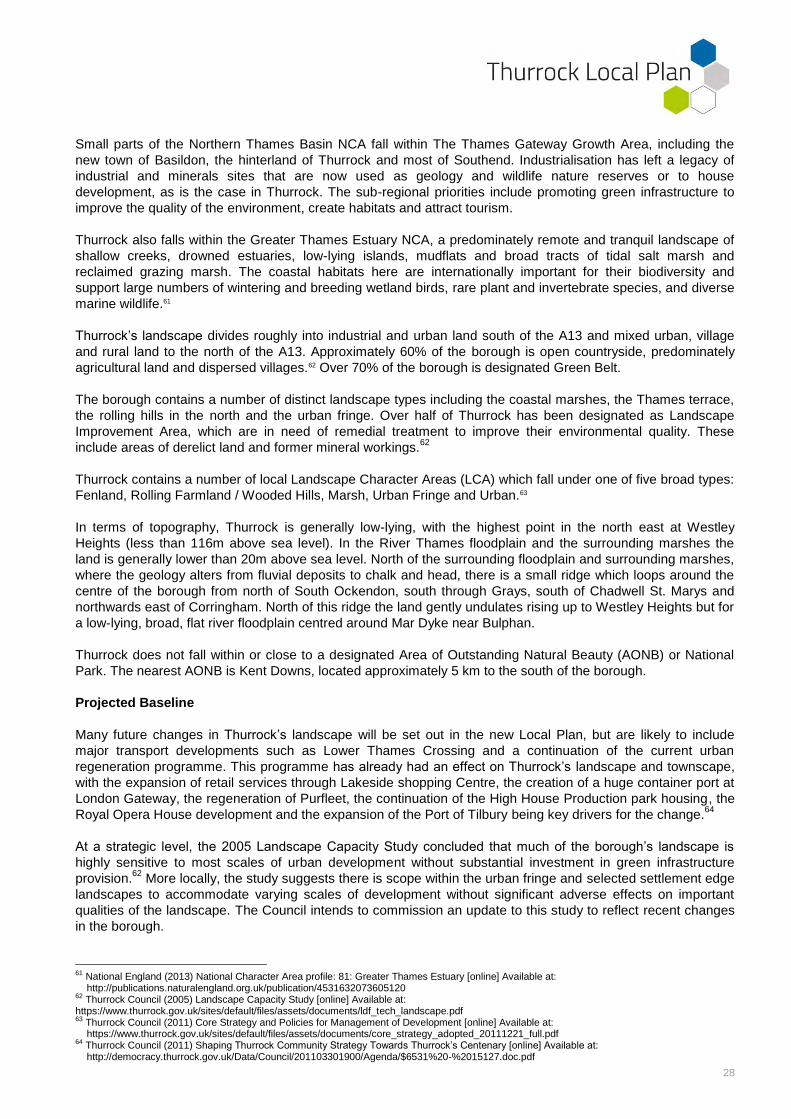
28
Small parts of the Northern Thames Basin NCA fall within The Thames Gateway Growth Area, including the
new town of Basildon, the hinterland of Thurrock and most of Southend. Industrialisation has left a legacy of
industrial and minerals sites that are now used as geology and wildlife nature reserves or to house
development, as is the case in Thurrock. The sub-regional priorities include promoting green infrastructure to
improve the quality of the environment, create habitats and attract tourism.
Thurrock also falls within the Greater Thames Estuary NCA, a predominately remote and tranquil landscape of
shallow creeks, drowned estuaries, low-lying islands, mudflats and broad tracts of tidal salt marsh and
reclaimed grazing marsh. The coastal habitats here are internationally important for their biodiversity and
support large numbers of wintering and breeding wetland birds, rare plant and invertebrate species, and diverse
marine wildlife.61
Thurrock’s landscape divides roughly into industrial and urban land south of the A13 and mixed urban, village
and rural land to the north of the A13. Approximately 60% of the borough is open countryside, predominately
agricultural land and dispersed villages.62 Over 70% of the borough is designated Green Belt.
The borough contains a number of distinct landscape types including the coastal marshes, the Thames terrace,
the rolling hills in the north and the urban fringe. Over half of Thurrock has been designated as Landscape
Improvement Area, which are in need of remedial treatment to improve their environmental quality. These
include areas of derelict land and former mineral workings.62
Thurrock contains a number of local Landscape Character Areas (LCA) which fall under one of five broad types:
Fenland, Rolling Farmland / Wooded Hills, Marsh, Urban Fringe and Urban.63
In terms of topography, Thurrock is generally low-lying, with the highest point in the north east at Westley
Heights (less than 116m above sea level). In the River Thames floodplain and the surrounding marshes the
land is generally lower than 20m above sea level. North of the surrounding floodplain and surrounding marshes,
where the geology alters from fluvial deposits to chalk and head, there is a small ridge which loops around the
centre of the borough from north of South Ockendon, south through Grays, south of Chadwell St. Marys and
northwards east of Corringham. North of this ridge the land gently undulates rising up to Westley Heights but for
a low-lying, broad, flat river floodplain centred around Mar Dyke near Bulphan.
Thurrock does not fall within or close to a designated Area of Outstanding Natural Beauty (AONB) or National
Park. The nearest AONB is Kent Downs, located approximately 5 km to the south of the borough.
Projected Baseline
Many future changes in Thurrock’s landscape will be set out in the new Local Plan, but are likely to include
major transport developments such as Lower Thames Crossing and a continuation of the current urban
regeneration programme. This programme has already had an effect on Thurrock’s landscape and townscape,
with the expansion of retail services through Lakeside shopping Centre, the creation of a huge container port at
London Gateway, the regeneration of Purfleet, the continuation of the High House Production park housing, the
Royal Opera House development and the expansion of the Port of Tilbury being key drivers for the change.64
At a strategic level, the 2005 Landscape Capacity Study concluded that much of the borough’s landscape is
highly sensitive to most scales of urban development without substantial investment in green infrastructure
provision.62
More locally, the study suggests there is scope within the urban fringe and selected settlement edge
landscapes to accommodate varying scales of development without significant adverse effects on important
qualities of the landscape. The Council intends to commission an update to this study to reflect recent changes
in the borough.
61 National England (2013) National Character Area profile: 81: Greater Thames Estuary [online] Available at:
http://publications.naturalengland.org.uk/publication/4531632073605120 62 Thurrock Council (2005) Landscape Capacity Study [online] Available at: https://www.thurrock.gov.uk/sites/default/files/assets/documents/ldf_tech_landscape.pdf 63 Thurrock Council (2011) Core Strategy and Policies for Management of Development [online] Available at:
https://www.thurrock.gov.uk/sites/default/files/assets/documents/core_strategy_adopted_20111221_full.pdf 64 Thurrock Council (2011) Shaping Thurrock Community Strategy Towards Thurrock’s Centenary [online] Available at:
http://democracy.thurrock.gov.uk/Data/Council/201103301900/Agenda/$6531%20-%2015127.doc.pdf

29
4.3.8 Materials and Waste
Introduction
Material resources include primary raw materials such as aggregates and minerals, and secondary
manufactured products. The production, sourcing, transport, handling, storage and use of materials, as well as
the disposal of any surplus, have the potential to affect the environment. At the same time, the beneficial reuse
of materials prevents them from becoming waste and reduces the need to use finite resources obtained from
elsewhere.
Wastes are materials, substances or objects which have no further use and are disposed of, are intended to be
disposed of, or are required to be disposed of by the provisions of national law.
Policy and Legislation
International
The European Community Waste Framework Directive (2008/98/EC) provides an overarching legislative
framework for the management of waste across Europe. The Directive requires Member States to draw up
waste management plans and for those plans to contain specific information including details of major disposal
and recovery installations.
National
Requirements of the EU Waste Framework Directive have been transposed in England through The Waste
Regulations (England and Wales) (Amendment) 2012.
The National Planning Policy for Waste (2014) sets out detailed waste planning policies and places
responsibility on waste planning authorities to ensure that waste management is considered alongside other
spatial planning concerns such as housing and transport; recognising the positive contribution waste
management can make to developing sustainable communities. This includes preparing Local Plans which
identify opportunities to meet the needs of their area for the management of waste streams.
The UK Waste Strategy for England (2007) describes a vision for better managing waste and resources and
sets out changes needed to deliver more sustainable development in England.
Local
Thurrock began preparation of a Minerals and Waste Local Plan with production of a Mineral and Waste
Development Plan Document- Issues and Options (2009), which was to include site allocations considered able
to deliver required mineral extraction and waste management capacity up to 2021. Its aim was to implement
the strategic vision and policies for minerals and waste planning set out in the Core Strategy through the
provision of a number of appropriately located and sized sites. This would help meet the regional need for
primary mineral extraction, secondary/recycled aggregates processing and ensure the careful management of
all waste streams originating within the borough.
Progress on the Minerals and Waste Local Pan was stopped following the decision by Thurrock Council in
February 2014 that a new Local Plan will be produced which will cover waste and mineral planning issues.
Current Baseline
There are two currently active mineral extractions sites in Thurrock: The East Tilbury Quarry and Mill House
Farm, West Tilbury.65
65 Thurrock Council (2014) Annual Monitoring Report [online] Available at:
https://www.thurrock.gov.uk/sites/default/files/assets/documents/monitor_authority_2014.pdf

30
There are 16 authorised landfill sites: Mucking Landfill, Pitsea Landfill, Rainbow Shaw Quarry, Princess
Margaret Road landfill, Baldwins Farm, Aveley Clay Pit, The East Tilbury Quarry, Titan Pit, Ockendon Power
Plant, Ockendon Area II and III Landfill, Flint Grit Pond, Medebridge Road Landfill, Southfields Quarry, Linford
Landfill, East Tilbury Quarry and Tilbury Power Station.66 Thurrock also has a number of waste treatment sites.
In 2014/15, there were 70,996 tonnes of municipal (household and non-household) waste arisings in Thurrock.67
Of this, 17.9% was sent to landfill. The remainder was sent for recycling, reuse, incineration or composting. The
proportion landfilled was a decrease on the previous year when 24.2% of waste was landfilled (Tables 4-4 and
4-5).
Since 2005 there has been a substantial rise in recycling and incineration rates and a decrease in the amount of
waste landfilled in Thurrock (Figure 4-5). Over the last five years this trend has plateaued somewhat, although
the proportion of waste incinerated has continued to rise gradually. The reason behind such a dramatic change
in how waste is managed may be due largely to policies in the existing Minerals and Waste Local Plans for
Thurrock (CSTP29 and CSTP31), which have encouraged the use of alternative aggregate sources and the
development of facilities for the recycling of mineral, construction and demolition wastes. Requirements of the
EU Waste Framework Directive introduced in 2008 and continued rises in Landfill Tax may also have played a
significant part.68
Table 4-4 : Municipal Waste Collected in Thurrock (2005 – 2015)69
2005/06 2010/11 2011/12 2012/13 2013/14 2014/15
Household - total waste
(tonnes)
71,789 66,970 66,753 67,283 73,111 67,865
Non-household - total
waste (tonnes)
3,023 2,866 2,860 2,606 4,416 3,131
Total waste collected
(tonnes)
74,811 69,836 69,613 69,888 77,527 70,996
Table 4-5 : Municipal Waste Management in Thurrock (2005-2015)69
2005/06 2010/11 2011/12 2012/13 2013/14 2014/15
Total waste
collected (tonnes)
74,811 69,836 69,613 69,888 77,527 70,996
% Landfilled
(tonnes)
77.3%
(57,843)
28.8%
(21,549)
26.4%
(19,716)
17.3%
(12,920)
24.2%
(18,098)
17.9%
(13,360)
% Incineration
with EfW (tonnes)
0.1% (71) 21.8%
(16,295)
25.6%
(19,157)
34.5%
(25,826)
34.6%
(25,915)
37.5%
(28,028)
% Recycled/
Composted
(tonnes)
22.6%
(16,896)
42.8%
(32,038)
41.1%
(30,734)
41.6%
(31,142)
44.1%
(32,980)
39.8%
(29,743)
66 Environment Agency (2016) ‘What’s in Your Backyard?’ Landfill Map [online] Available at: http://maps.environment-agency.gov.uk/ 67 DEFRA (2015) ENV18 – Local authority collected waste: annual results tables [online] Available at: https://www.gov.uk/government/statistical-data-
sets/env18-local-authority-collected-waste-annual-results-tables 68 Thurrock Council (2005) Toward Thurrock Municipal Waste Strategy and position statement 2005-2010 [online] Available at:
http://democracy.thurrock.gov.uk/thurrock/Data/Cabinet/200507201900/Agenda/$12277%20-%20458.doc.pdf 69 DEFRA (2015) ENV18 – Local authority collected waste: annual results tables [online] Available at: https://www.gov.uk/government/statistical-data-
sets/env18-local-authority-collected-waste-annual-results-tables
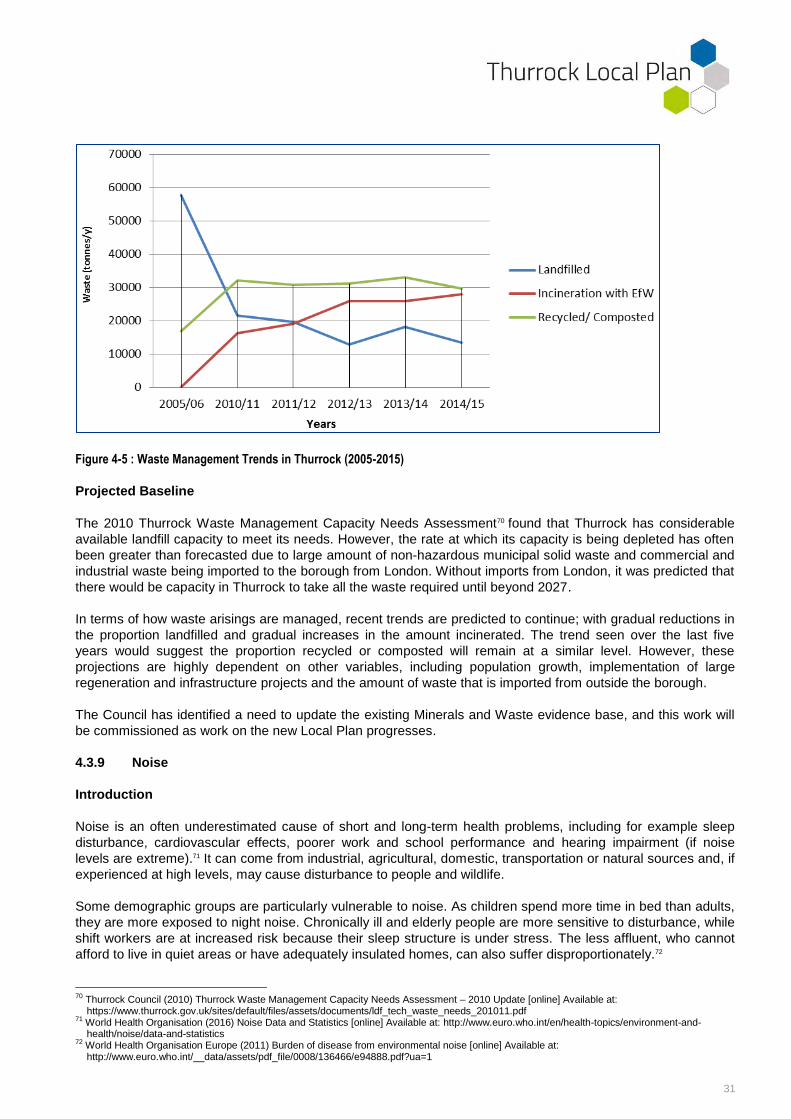
31
Figure 4-5 : Waste Management Trends in Thurrock (2005-2015)
Projected Baseline
The 2010 Thurrock Waste Management Capacity Needs Assessment70 found that Thurrock has considerable
available landfill capacity to meet its needs. However, the rate at which its capacity is being depleted has often
been greater than forecasted due to large amount of non-hazardous municipal solid waste and commercial and
industrial waste being imported to the borough from London. Without imports from London, it was predicted that
there would be capacity in Thurrock to take all the waste required until beyond 2027.
In terms of how waste arisings are managed, recent trends are predicted to continue; with gradual reductions in
the proportion landfilled and gradual increases in the amount incinerated. The trend seen over the last five
years would suggest the proportion recycled or composted will remain at a similar level. However, these
projections are highly dependent on other variables, including population growth, implementation of large
regeneration and infrastructure projects and the amount of waste that is imported from outside the borough.
The Council has identified a need to update the existing Minerals and Waste evidence base, and this work will
be commissioned as work on the new Local Plan progresses.
4.3.9 Noise
Introduction
Noise is an often underestimated cause of short and long-term health problems, including for example sleep
disturbance, cardiovascular effects, poorer work and school performance and hearing impairment (if noise
levels are extreme).71 It can come from industrial, agricultural, domestic, transportation or natural sources and, if
experienced at high levels, may cause disturbance to people and wildlife.
Some demographic groups are particularly vulnerable to noise. As children spend more time in bed than adults,
they are more exposed to night noise. Chronically ill and elderly people are more sensitive to disturbance, while
shift workers are at increased risk because their sleep structure is under stress. The less affluent, who cannot
afford to live in quiet areas or have adequately insulated homes, can also suffer disproportionately.72
70 Thurrock Council (2010) Thurrock Waste Management Capacity Needs Assessment – 2010 Update [online] Available at:
https://www.thurrock.gov.uk/sites/default/files/assets/documents/ldf_tech_waste_needs_201011.pdf 71 World Health Organisation (2016) Noise Data and Statistics [online] Available at: http://www.euro.who.int/en/health-topics/environment-and-
health/noise/data-and-statistics 72 World Health Organisation Europe (2011) Burden of disease from environmental noise [online] Available at:
http://www.euro.who.int/__data/assets/pdf_file/0008/136466/e94888.pdf?ua=1

32
Policy and Legislation
International and National
The EU Noise Directive – 2002/49/EC (2002) is implemented in the UK by the Environmental Noise Regulations
(2010). Amongst their provisions, they require the production of noise mapping to determine exposure to
environmental noise, and the adoption of noise action plans which should respond to noise issues and effects;
managing and reducing them where necessary.
Local
No specific local noise policy could be found. This is likely due to noise being covered in other documents such
as the Thurrock Community Strategy (2012) and the Thurrock Health and Well-being Strategy (2013).
Current Baseline
According to a World Health Organisation publication72
:
about 40% of the population in EU countries is exposed to road traffic noise at levels exceeding 55
decibels (dB) (A);
20% is exposed to levels exceeding 65 dB(A) during the daytime; and
more than 30% is exposed to levels exceeding 55 dB(A) at night.
The overall number of noise complaints received by Thurrock Council between 1999 and 2006 increased from
943 in 1999 to 1,682 in 2006. Whilst this would suggest that noise pollution is increasing across the borough,
such figures should be used with caution as other factors such as changes to the noise-complaints process may
have influenced this trend.
What is clear from monitoring that has been undertaken across the UK by Defra is that road traffic is a
significant source of noise emissions. In particular, highly congested roads with high traffic volumes and large
volumes of HGVs can cause substantial levels of noise and vibration for nearby residents.
Whilst no transport noise data is available for Thurrock at this time, the Essex Buildings Design Guide (2005)
recognises that the major sources of noise pollution across Essex are heavily trafficked main roads, airports and
heavy industry.73
The Campaign for Rural England tranquillity map74 (Figure 4-6) shows that the western parts of Thurrock are
generally the least tranquil, while northern and eastern areas are more tranquil. Built-up urban areas are also
shown to be less tranquil than rural areas with smaller settlements. In terms of ranking, Thurrock‘s tranquillity
rank is 57 out of 87, which is relatively low and just outside of the bottom quartile nationally.
Projected Baseline
Future changes in noise levels are difficult to predict. In broad terms, there is an intrinsic relationship between
development and noise, particularly large infrastructure developments which have the potential to create short-
term noise impacts during construction and longer-term changes to the noise environment during their
operation.
Loss of tranquillity is especially likely to result from growth pressures, while noise increases are often a by-
product of traffic growth, particularly if green belt land is released for development. Housing growth at the
periphery of existing towns can also extend the urban character of these areas into the landscape, thereby
increasing noise pollution.
73 Essex County Council (2005) The Essex Design Guide [online] Available at:
https://www.essex.gov.uk/Environment%20Planning/Planning/Transport-planning/Infomation-for-developers/Documents/19715_essexdesignguide.pdf
74 Campaign to Protect Rural England (2016) Tranquillity Maps [online] Available at: http://maps.cpre.org.uk/tranquillity_map.html?lon=0.01712&lat=51.25375&zoom=9&gclid=CO7fvbOapMoCFcMRHwodS3sH3w

33
Figure 4-6 : CPRE Tranquillity Map- Thurrock (2016)
Tranquillity — Areas in red have the lowest tranquillity scores and green the highest. The methodology was developed by Northumbria University on behalf of
CPRE and the then Countryside Agency in 2007.

34
4.3.10 Water Resources and Quality
Introduction
The water environment provides a number of vital functions to support communities. From providing drinking
supplies to serving as recreational facilities, water bodies of all types are fundamental for maintaining a healthy
and active population. Maintaining water resources and quality, including reducing pollution and abstraction, is
therefore a key consideration for local planning.
Policy and Legislation
International
The Water Framework Directive (WFD) 2000/60/EC expands the scope of water protection to all waters, surface
waters and groundwater, and aimed to achieve ‘good’ status or potential for all waters by 2015, or under certain
provisions, 2021 or 2025.
National / Regional
The Water Act (2003) is national legislation which transposes the WFD into UK law.
The River Basin Management Plan (RBMP) for the Thames River Basin District (2009) implements the Water
Act at a regional level, focusing on the protection, improvement and sustainable use of the water environment.
Many organisations and individuals help to protect and improve the water environment for the benefit of people
and wildlife. River basin management is the approach the Environment Agency is using to ensure combined
efforts achieve the improvement needed in the Thames River Basin District.
The Water Resources Strategy for England and Wales (2009) includes various actions to plan for sustainable,
reliable water supplies for people and businesses, whilst also protecting the environment.
Local
Thurrock’s Water Cycle Study (2010)75 assessed the impact of proposed growth targets for Thurrock on its water
cycle infrastructure and water environment, in order to determine where additional investment was required to
build new infrastructure or implement management measures to protect the water environment.
Current Baseline
The East of England is the driest region in England and is one of the fastest growing in terms of development.
Water resource availability is limited, with supply-demand issues in parts of the region. In some catchments,
water abstraction is not reliable during dry winters.
Water availability has been a major challenge for Thurrock in the past. Development at the Abberton Reservoir
to increase its storage capacity in 2014 has helped to improve water supply in the borough, but with anticipated
changes in climate likely to exaggerate existing water resource demands, this challenge is likely to remain.
The main watercourses in Thurrock are the River Mardyke, Stanford Brook and Vange Creek/Holehaven Creek.
The River Mardyke, a Water Framework Directive water body, flows from the north of the borough to the west
where it joins the River Thames. It is managed as part of the South Essex River Basin Management catchment
in the Thames river basin district. Under the WFD, the ecological and chemical status of the river are currently
classed as ‘poor’ and ‘good’ respectively, with the objective of achieving overall ‘good’ status by 2027.76
75 Scott Wilson (2010) Thurrock Water Cycle Study [online] Available at: www.thurrock.gov.uk/planning/strategic/pdf/ldf_tech_water_outline_2010.pdf 76 Environmental Agency (2016) Water Framework Directive- 2009 River Basin Management Plans-Rivers [online] Available at:
http://maps.environment-agency.gov.uk

35
Water quality within the lower stretches of the River Mardyke which flows through Thurrock urban area is
currently of moderate to poor quality and fails to meet ‘good ecological status’ under the WFD.76
Poorly
managed surface water runoff occurs from development bordering the River Mardyke, and it is thought that this
is largely responsible for the water quality issues.
Thurrock does not fall within any surface water safeguard zones or surface water Nitrate Vulnerable Zone (NVZ)
(an area of land that drains into water known to be polluted by nitrates).
The mid-section of the borough is under a secondary A aquifer (superficial deposits) between Purfleet and
Stanford-le-Hope, with areas along the River Thames under secondary (undifferentiated) aquifer.77
There are two groundwater abstractions or ‘Source Protection Zones’ within the borough, one in Linford and
another in west of North Stifford. The entire catchments of these two zones fall within the borough boundary.78
There are three large and two medium size groundwater abstraction licenced areas in Thurrock; between
Beacon and Lakeside, west and east Tilbury and south of Linford for large abstraction and between west and
east Tilbury and east Tilbury for medium size abstraction.79
Projected Baseline
Under predicted scenarios for climate change, more frequent drought conditions are expected in the East of
England, along with increased demands on water resources. 80 Future development will create additional
requirements for water abstraction from surface and groundwater sources in Thurrock. Whilst this is expected to
be met in the short and medium term through the increase in storage at Abberton Reservoir and the increase in
abstraction and transfer from the Ely-Ouse transfer scheme, in the long term new sources may need to be
identified.81
Of the water supply companies active in Thurrock, Essex and Suffolk Water have indicated that proposed
development up to 2025 is unlikely to require strategic level investment in the water supply network and that it
should be able to connect to all proposed development areas via the existing strategic mains, though site-
specific connections will still be required. Meanwhile, Anglian Water is undertaking work to improve the
wastewater network to accommodate projected growth.82
At a high level, it is broadly assumed that the quality of water bodies such as the River Mardyke will improve in
the future in line with WFD objectives. However, water quality is influenced by a wide range of internal and
external factors, including climate change, geology and soils, human consumption (including population change)
and pollution from human activities such as industry and agriculture. Future development, particularly in areas
close to water bodies, may present a challenge to improving water quality.
4.4 Socio-economic baseline
4.4.1 Economy and Employment
Introduction
A strong economy is fundamental to securing long-term growth and sustainable development, while the creation
and maintenance of employment opportunities can help to reduce poverty and facilitate sustainable economic
and social development in communities. For this reason, job-creation is considered a core element in national
strategies relating to growth, poverty and social equality.
77 Environmental Agency (2015), Environment Agency Groundwater [online] Available at http://maps.environment-agency.gov.uk 78 Environmental Agency (2015) Groundwater Mapping [online] Available at: http://maps.environment-agency.gov.uk 79 Environmental Agency (2015) Water Abstraction licenses [online] Available at http://maps.environment-agency.gov.uk/ 80 Thurrock Council (2010) Planning for Thurrock’s Adaptation to Impacts of Climate Change [online] Available at: http://www.thurrock.gov.uk/planning/strategic/pdf/ldf_tech_climate_201010.pdf 81 Thurrock Borough Council (2009) Thurrock Water Cycle Study: Scoping Study [online] Available at:
https://www.thurrock.gov.uk/sites/default/files/assets/documents/ldf_tech_water_2010.pdf 82 Scott Wilson (2010) Thurrock Water Cycle Study [online] Available at: http://www.thurrock.gov.uk/planning/strategic/pdf/ldf_tech_water_outline_2010.pdf

36
Policy and Legislation
International
The 2002 World Summit on Sustainable Development reaffirmed the international commitment to sustainable
development.
The EU Sustainable Development Strategy (2001) and updated Europe 2020 Strategy (2010) aim to identify
and develop policies and actions to enable the EU to achieve a continuous long-term improvement of quality of
life; creating sustainable communities that manage and use resources efficiently, tap the ecological and social
innovation potential of the economy and ensure prosperity, environmental protection and social cohesion.
National
The UK Government set out its plans for the economy in the policy ‘Achieving strong and sustainable economic
growth’ (2013). These include investing heavily in infrastructure development and science and technology,
encouraging investment and creating a more educated workforce.
Local
The Thurrock Economic Development Strategy (EDS) (2007) was created to provide strategic guidance to the
Council and its partners in their attempts to create the required economic conditions to achieve the delivery of
18,500 new homes and 26,000 new jobs by 2021, and an additional 4,750 houses to 2026 as set out in the
adopted Core Strategy.
As part of a 2016 update to the 2007 EDS the Council has undertaken work to refresh the economic baseline
and understand the extent to which progress has been made against economic challenges. An analysis of key
changes brought about since the previous strategy will further help to ensure that the Council and its partners
are in the best position to focus attention and resources on the most pressing issues.
Key objectives and targets for economic growth across Thurrock and the wider South East region are set out in
the South East Local Enterprise Partnership Strategic Economic Plan.83
Current Baseline
Thurrock’s economy can be characterised by challenges in economic productivity but high levels of
employment, which recovered sharply following the economic downturn of 2008/09. The Thurrock economy
was worth around £2.8bn (unadjusted for inflation and local price variations) in 2013, equivalent to £17,300 per
capita - 12.2% below the Essex County average of £19,700 and 28.2% below the England average of £24,100.
This is primarily due to having a disproportionate concentration of jobs in several low value sectors, including
ports and logistics and retail.
Thurrock saw its local employment rate decline after the economic downturn – falling from 75.4% of residents in
2007 to just 70% of working age residents in 2011. However, following a sharp rise in 2012/13, the employment
rate has settled considerably above the national average. In the 12 months to December 2014, 73.4% of
working age residents in Thurrock were in employment - above the England (72.5%) average and only slightly
below the rate for Essex County (74.1%).84
The unemployment rate in Thurrock rose sharply after the onset of the economic downturn, peaking at 11.4% of
economically active residents in Thurrock in the 12 months to March 2012 (9,400 people). It has since declined.
In the 12 months to December 2014, 6% of economically active residents in Thurrock were unemployed (5,000
people). The unemployment rate is now in-line with the rates for Essex County (6%) and England (6.2%) as a
whole, though significantly above the 3.3% (2,600 people) seen in 2007, prior to the recession.84
83 South East Local Enterprise Partnership (2014). Growth Deal and Strategic Economic Plan [online] Available at:
http://www.southeastlep.com/images/uploads/resources/SECTION_2_South_East_LEP_-_Growth_Deal_and_Strategic_Economic_Plan_WEB-2%281%29.pdf
84 Thurrock Council (2016) Cabinet Meeting of 7th January 2016: Economic Growth Strategy Refresh – Update [online] Available at: http://thurrock.moderngov.co.uk/documents/s6526/Economic%20Development%20Strategy%20Refresh.pdf
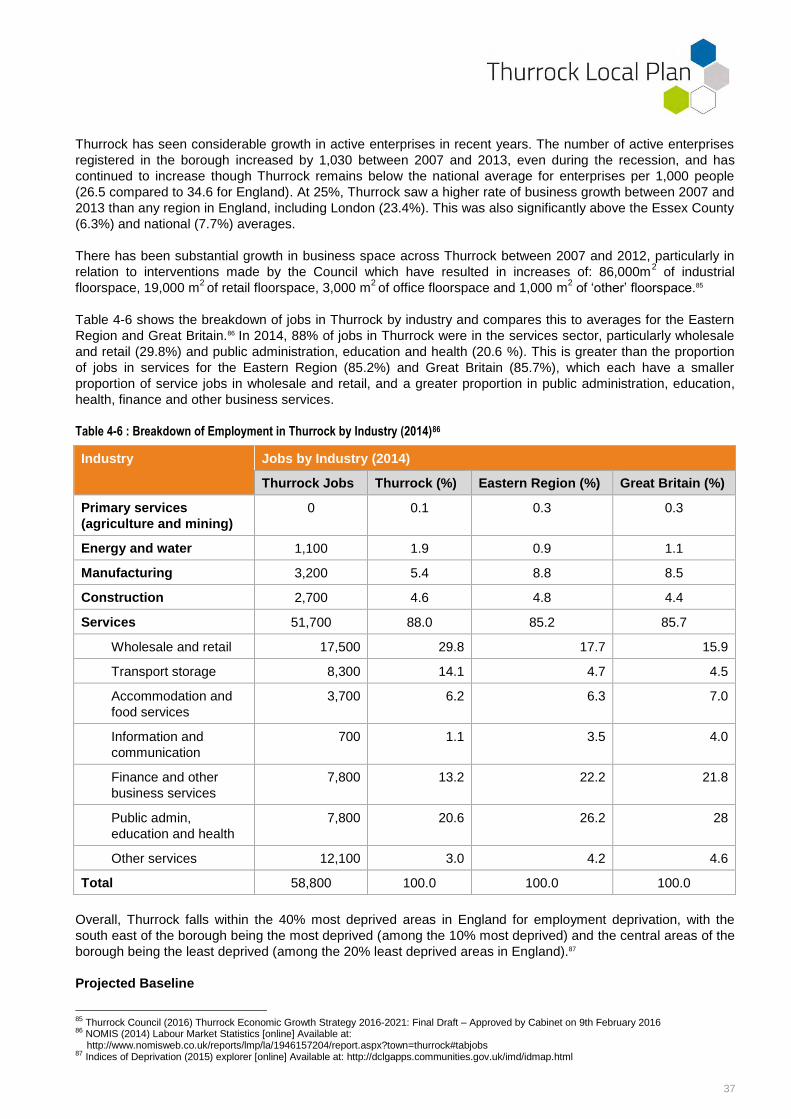
37
Thurrock has seen considerable growth in active enterprises in recent years. The number of active enterprises
registered in the borough increased by 1,030 between 2007 and 2013, even during the recession, and has
continued to increase though Thurrock remains below the national average for enterprises per 1,000 people
(26.5 compared to 34.6 for England). At 25%, Thurrock saw a higher rate of business growth between 2007 and
2013 than any region in England, including London (23.4%). This was also significantly above the Essex County
(6.3%) and national (7.7%) averages.
There has been substantial growth in business space across Thurrock between 2007 and 2012, particularly in
relation to interventions made by the Council which have resulted in increases of: 86,000m2 of industrial
floorspace, 19,000 m2 of retail floorspace, 3,000 m
2 of office floorspace and 1,000 m
2 of ‘other’ floorspace.85
Table 4-6 shows the breakdown of jobs in Thurrock by industry and compares this to averages for the Eastern
Region and Great Britain.86 In 2014, 88% of jobs in Thurrock were in the services sector, particularly wholesale
and retail (29.8%) and public administration, education and health (20.6 %). This is greater than the proportion
of jobs in services for the Eastern Region (85.2%) and Great Britain (85.7%), which each have a smaller
proportion of service jobs in wholesale and retail, and a greater proportion in public administration, education,
health, finance and other business services.
Table 4-6 : Breakdown of Employment in Thurrock by Industry (2014)86
Industry Jobs by Industry (2014)
Thurrock Jobs Thurrock (%) Eastern Region (%) Great Britain (%)
Primary services
(agriculture and mining)
0 0.1 0.3 0.3
Energy and water 1,100 1.9 0.9 1.1
Manufacturing 3,200 5.4 8.8 8.5
Construction 2,700 4.6 4.8 4.4
Services 51,700 88.0 85.2 85.7
Wholesale and retail 17,500 29.8 17.7 15.9
Transport storage 8,300 14.1 4.7 4.5
Accommodation and
food services
3,700 6.2 6.3 7.0
Information and
communication
700 1.1 3.5 4.0
Finance and other
business services
7,800 13.2 22.2 21.8
Public admin,
education and health
7,800 20.6 26.2 28
Other services 12,100 3.0 4.2 4.6
Total 58,800 100.0 100.0 100.0
Overall, Thurrock falls within the 40% most deprived areas in England for employment deprivation, with the
south east of the borough being the most deprived (among the 10% most deprived) and the central areas of the
borough being the least deprived (among the 20% least deprived areas in England).87
Projected Baseline
85 Thurrock Council (2016) Thurrock Economic Growth Strategy 2016-2021: Final Draft – Approved by Cabinet on 9th February 2016 86 NOMIS (2014) Labour Market Statistics [online] Available at:
http://www.nomisweb.co.uk/reports/lmp/la/1946157204/report.aspx?town=thurrock#tabjobs 87 Indices of Deprivation (2015) explorer [online] Available at: http://dclgapps.communities.gov.uk/imd/idmap.html

38
Looking ahead, there is a positive outlook for the Thurrock economy. According to data from the East of
England Forecasting Model88, Thurrock’s economy is forecast to grow by an average of 3.2% per annum
between 2012 and 2030 and total employment will grow by an average of 1.5% a year; equivalent to an
increase of 21,200 jobs.89 Thurrock is expected to see annual jobs and Gross Value Added growth significantly
above projections for Essex County and the UK as a whole between 2012 and 2030.
Extrapolating trend growth from 2007-2013 would see an increase of 11,800 jobs by 2021. Potential
investments in the local economy - in particular within identified economic hubs such as the London Gateway,
Port of Tilbury and Lakeside - offer the potential for faster jobs growth in the coming years. Supporting and
enabling delivery of those developments will play an important part in attempting to meet the target of 26,000
jobs by 2021.
The Council is commissioning an Economic Development Needs Assessment (EDNA), an Employment Land
Availability Assessment (ELAA) and a Strategic Retail and Leisure Capacity Study to inform the preparation of
the Local Plan.
4.4.2 Education and Skills
Introduction
Education and skills provision is widely regarded as a fundamental component in unlocking the economic
growth potential of an area. Having a population that is well-educated and sufficiently skilled can increase rates
of employment, particularly for high earning jobs, and help to make an economy more productive and
competitive.
Providing high quality education and training facilities gives residents opportunities for employment; regarded as
an important contributor to an individual’s health and well-being. It can also help to attract new people to an
area, which can in turn offer further socio-economic benefits.
Policy and Legislation
International / National
Europe 2020, the EU's strategic growth strategy, seeks to promote smart, sustainable, and inclusive growth. A
stated key factor in the achievement of this strategy is development of literacy, numeracy, science, and
technology skills.
Each EU country is responsible for its own education and training systems. EU policy is designed to support
national action and help address common challenges such as ageing societies, skills deficits in the workforce,
technological developments and global competition. Education and training 2020 (ET 2020) is the framework for
cooperation in education and training. It serves as a forum for exchange of best practices, mutual learning,
gathering and dissemination of information and evidence of what works, as well as advice and support for policy
reforms.
At the national level, in 2010 the Department for Business Innovation and Skills published the ‘Skills for
Sustainable Growth Strategy’ document for England. The Strategy set out a five-year direction for skills policy
and the shared responsibility of government, employers and individuals to create a system for skills in which all
parties can invest with confidence and benefit with consistency. The aim was to develop the skills needed to
support a competitive economy that is environmentally sound and resource efficient.90
In 2013, the Government built on this work with publication of a document entitled ‘Rigour and Responsiveness
in Skills’, with the objective of setting out the framework to accelerate reforms to the skills system to ensure that
the UK’s vocational training offer allows its citizens to compete with any in the world.
88 Cambridgeshire Insight (2014) East of England Forecasting Model [online] Available at: http://www.cambridgeshireinsight.org.uk/EEFM 89 Thurrock Council (2016) Thurrock Economic Growth Strategy 2016-2021: Final Draft – Approved by Cabinet on 9th February 2016 90 Department for Business Innovation & Skills (2010) Skills for Sustainable Growth Strategy [online] Available at:
https://www.gov.uk/government/uploads/system/uploads/attachment_data/file/32368/10-1274-skills-for-sustainable-growth-strategy.pdf

39
Local
Thurrock makes provision for education and skills development within its Economic Development Strategy
(2007), recognising that it is of paramount importance to Thurrock’s economic future. It makes the case that
without a significantly improved skills base, existing businesses will struggle to generate new employment and
the area will fail to attract new investment.
The refresh of the Economic Development Strategy, which is currently at a draft stage, continues to identify
skills development and education as critical enabling factors in Thurrock’s ability to grow. The Strategy uses
recent data to show that the borough continues to face challenges in improving attainment of qualifications and
skills amongst the population. This is important because Thurrock’s residents will need to have in-demand skills
if they are to benefit from the newly created and currently available jobs in the local economy.
The South East Local Enterprise Partnership (SE LEP) Strategic Economic Plan recognises that residents do
not offer all the skills that SE LEP employers, and employers in London need. This need underpins Thurrock’s
productivity and skills challenge.
Current Baseline
Thurrock has recently seen a significant shift towards attainment at the highest qualification levels (NVQ3 and
above) among working age residents, and away from qualifications at the lowest levels (NVQ1 and below). In
total there are 14,200 more working age residents qualified at Level 3 and above in 2014 than in 2007, and
10,500 fewer residents aged 16-64 whose highest level of qualification is at NVQ Level 1 or below.91 Whilst this
mirrors national trends, improvements have been particularly evident in Thurrock.
In 2013/14, 57.9% of key stage 4 students in Thurrock achieved 5 A*-C grades at GCSE including English and
maths. This was above the Essex County (56.5%) and England (53.4%) averages, and a significant
improvement on performance in 2007/08, when only 42.6% of KS4 students in Thurrock achieved 5 A*-C
grades at GCSE including English and maths. It should be noted that figures for 2013/14 are not directly
comparable with earlier years due to major education reforms which were introduced.
Despite these improvements, Thurrock still has relatively low proportions of residents who are qualified at NVQ
Level 3 and above – 40.5% of working age residents in 2014, compared to 53.2% nationally. There is also a
relatively high proportion of working age adults with low or no qualifications, including 12,600 Thurrock residents
aged 16-64, making up 12.2% of working age residents. This compares to just 8.6% nationally.
A relatively low proportion of Thurrock students went on to a sustained education destination in 2013/14 (54%
compared to 64% for England), although this was an improvement on 2009/10 when 51% of Thurrock students
were registered in a sustained education destination. There continues to be a relatively low proportion of
Thurrock young people going on to Higher Education.
Thurrock ranks poorly in the education, skills and training domain of the Indices of Multiple Deprivation Index,
with large portions of the borough ranked among the 20% most deprived areas in England.92
Projected Baseline
Higher skilled sectors such as advanced manufacturing and environmental technologies are expected to be
become more prevalent in Thurrock in coming years, as evidenced by the establishment of Thames Enterprise
Park. Many companies with offices, plant and premises in the area anticipate significant future growth; but many
employers are already experiencing difficulties in attracting suitably skilled candidates and many report
dissatisfaction with existing further education and higher education provision. Increasingly businesses are also
91 Thurrock Council (2016) Cabinet Meeting of 7th January 2016: Economic Development Strategy Refresh – Update [online] Available at:
http://thurrock.moderngov.co.uk/documents/s6526/Economic%20Development%20Strategy%20Refresh.pdf 92 Indices of Deprivation (2015) explorer [online] Available at: http://dclgapps.communities.gov.uk/imd/idmap.html

40
referencing a lack of numbers, i.e. not enough people for the number of jobs that are being created, as a critical
recruitment issue.
Between 2012 and 2022, UK Commission for Employment and Skills employment projections for the East of
England show an increase of almost 417,000 (+40.1%) jobs requiring at least a university level qualification.
Despite improving levels of attainment, there remain skill shortages in Thurrock’s local labour pool.93
4.4.3 Housing
Introduction
Providing high-quality housing that people can afford is key to enabling residents of an area to live healthy and
happy lives. This topic will not include a direct assessment of housing supply or the meeting of housing targets,
as this is part of the Local Plan evidence base external to the SA and the meeting of plan objectives. However,
this topic will consider the way in which housing delivery affects the housing needs of the community, such as
issues of affordability and levels of homelessness, the housing mix and levels of overcrowding, and the
adaptability of housing to people’s changing needs (e.g. issues of age and disability).
Policy and Legislation
National
The Localism Act (2011) gave greater powers to local housing authorities and providers of social housing to
meet local needs.
The regulatory framework for social housing (2015) is made up of regulatory requirements, codes of practice
and regulatory guidance that apply to providers of social housing.
The Homelessness Act (2002) places a duty on local authorities to formulate a homelessness strategy by
carrying out a homelessness review for their district.
Local
Thurrock Council’s Housing Strategy 2015-202094 sets out the Council’s vision for working together with all
housing providers to deliver both housing led growth and regeneration in the borough and improve the health,
wellbeing and life opportunities for communities. It includes a range of priorities and objectives to improve the
quality of housing and housing services to make Thurrock an attractive place to live.
Thurrock Council’s Homelessness Review and Prevention Strategy 2015-2020 set out targets to prevent
homelessness and its impacts on people.
Current Baseline
There were 2,366 net additional dwellings built in Thurrock between 2006 and 2015, an under provision of 6,184
dwellings compared to the Adopted Core Strategy target of 950 dwellings per annum over the period 2006-
2026.
There was a small increase in the number of total households in Thurrock between 2001 and 2011, rising from
58,485 to 62,353 (a 3.6% increase).95 Over the same period, there was a significant rise in the proportion of
private rented sector housing from 5.9% in 2001 to 13.2% in 2011. This is further demonstrated by the change
in the total number of households in this sector, which rose from 3,456 in 2001 to 8,220 in 2011 (an increase of
137.9%).95
93 Thurrock Council (2016) Thurrock Economic Growth Strategy 2016-2021: Final Draft – Approved by Cabinet on 9th February 2016 94 Thurrock Council (2015) A Housing Strategy for Thurrock [online] Available at:
https://www.thurrock.gov.uk/sites/default/files/assets/documents/housing_strategy_2015_2020_v01.pdf 95 Thurrock Council (2015) Joint Strategic Needs Assessment Demographic and Population Change [online] Available at:
https://www.thurrock.gov.uk/sites/default/files/assets/documents/jsna-demographics-population-v02.pdf
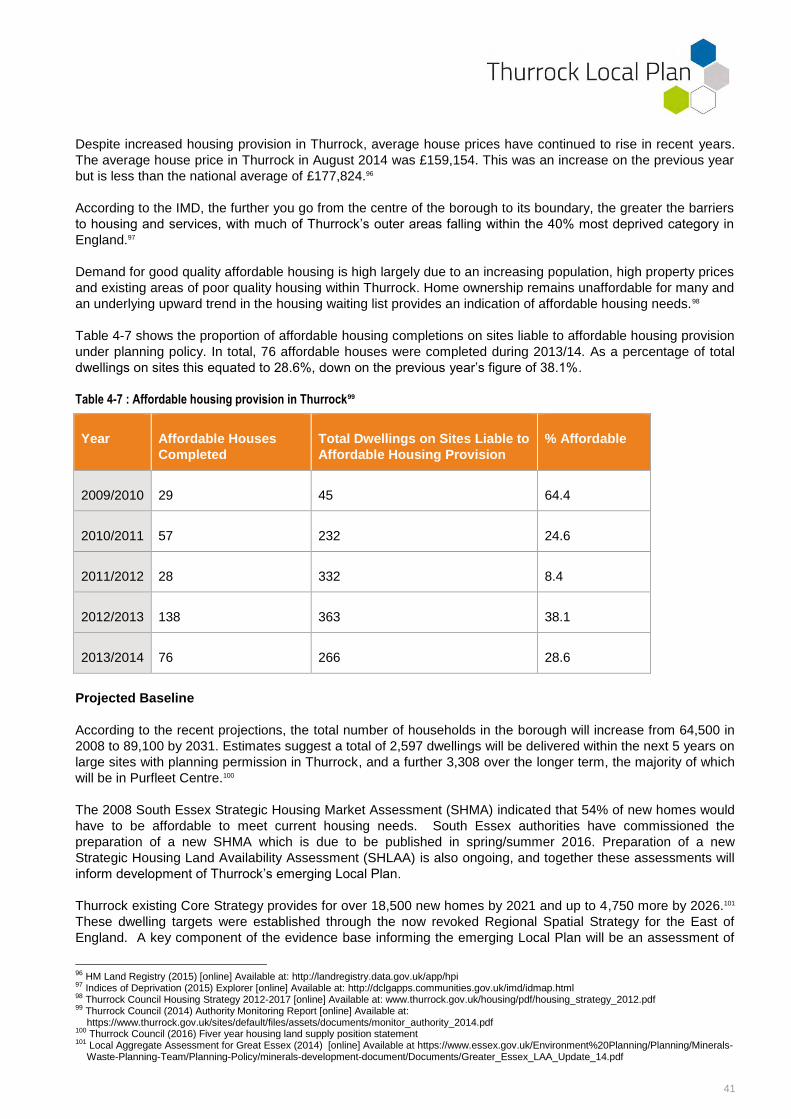
41
Despite increased housing provision in Thurrock, average house prices have continued to rise in recent years.
The average house price in Thurrock in August 2014 was £159,154. This was an increase on the previous year
but is less than the national average of £177,824.96
According to the IMD, the further you go from the centre of the borough to its boundary, the greater the barriers
to housing and services, with much of Thurrock’s outer areas falling within the 40% most deprived category in
England.97
Demand for good quality affordable housing is high largely due to an increasing population, high property prices
and existing areas of poor quality housing within Thurrock. Home ownership remains unaffordable for many and
an underlying upward trend in the housing waiting list provides an indication of affordable housing needs.98
Table 4-7 shows the proportion of affordable housing completions on sites liable to affordable housing provision
under planning policy. In total, 76 affordable houses were completed during 2013/14. As a percentage of total
dwellings on sites this equated to 28.6%, down on the previous year’s figure of 38.1%.
Table 4-7 : Affordable housing provision in Thurrock99
Year Affordable Houses
Completed
Total Dwellings on Sites Liable to
Affordable Housing Provision
% Affordable
2009/2010 29 45 64.4
2010/2011 57 232 24.6
2011/2012 28 332 8.4
2012/2013 138 363 38.1
2013/2014 76 266 28.6
Projected Baseline
According to the recent projections, the total number of households in the borough will increase from 64,500 in
2008 to 89,100 by 2031. Estimates suggest a total of 2,597 dwellings will be delivered within the next 5 years on
large sites with planning permission in Thurrock, and a further 3,308 over the longer term, the majority of which
will be in Purfleet Centre.100
The 2008 South Essex Strategic Housing Market Assessment (SHMA) indicated that 54% of new homes would
have to be affordable to meet current housing needs. South Essex authorities have commissioned the
preparation of a new SHMA which is due to be published in spring/summer 2016. Preparation of a new
Strategic Housing Land Availability Assessment (SHLAA) is also ongoing, and together these assessments will
inform development of Thurrock’s emerging Local Plan.
Thurrock existing Core Strategy provides for over 18,500 new homes by 2021 and up to 4,750 more by 2026.101
These dwelling targets were established through the now revoked Regional Spatial Strategy for the East of
England. A key component of the evidence base informing the emerging Local Plan will be an assessment of
96 HM Land Registry (2015) [online] Available at: http://landregistry.data.gov.uk/app/hpi 97 Indices of Deprivation (2015) Explorer [online] Available at: http://dclgapps.communities.gov.uk/imd/idmap.html 98 Thurrock Council Housing Strategy 2012-2017 [online] Available at: www.thurrock.gov.uk/housing/pdf/housing_strategy_2012.pdf 99 Thurrock Council (2014) Authority Monitoring Report [online] Available at:
https://www.thurrock.gov.uk/sites/default/files/assets/documents/monitor_authority_2014.pdf 100 Thurrock Council (2016) Fiver year housing land supply position statement 101 Local Aggregate Assessment for Great Essex (2014) [online] Available at https://www.essex.gov.uk/Environment%20Planning/Planning/Minerals-
Waste-Planning-Team/Planning-Policy/minerals-development-document/Documents/Greater_Essex_LAA_Update_14.pdf

42
the level of objectively assessed need for housing in Thurrock, to inform an updated housing requirement for the
borough.
4.4.4 Deprivation
Introduction
Deprivation relates to a person’s social and economic position in relation to others, based on the extent to which
their needs are being met.
The English Indices of Multiple Deprivation (IMD) is the most widely used measure of deprivation in this country.
It works by measuring distinct dimensions of deprivation separately and then combining these to give an overall
score or ‘rank’ for each Lower Super Output Area (LSOA).
Seven distinct domains of deprivation are included in the IMD, made up of 38 separate indicators. The domains
are:
income deprivation;
employment deprivation;
health deprivation and disability;
education, skills and training deprivation;
barriers to housing and services;
living environment deprivation; and
crime.
As employment, health and disability, education and skills, access to services, environment, housing and crime
are each covered under separate SA topics in this report; this topic focuses specifically on patterns of overall
deprivation across Thurrock.
Policy and Legislation
Thurrock’s Community Strategy (2012) sets out a vision for the borough to encourage and promote job creation
and economic prosperity.
The Thurrock Economic Development Strategy (2007) and 2016 ‘Economic Growth Strategy Refresh’ seek to
improve Thurrock’s economy by stimulating employment with the aim of creating 26,000 more jobs by 2021.
This could help to reduce economic and income deprivation across the borough.
Current Baseline
In 2015, Thurrock was ranked 125th out of 326 English authorities in the IMD (1 being most deprived). This is
eighteen places higher (more deprived) than in 2010 (143rd
out of 326).102
Five of Thurrock’s 95 Lower Super Output Areas (LSOA) were ranked among the 10% most deprived in
England and Wales in 2010.103
An examination of the IMD (2015) at the LSOA level reveals substantial spatial variation in deprivation across
Thurrock, with more deprived areas found in the south and the west of the borough and less deprived areas in
the north east (Figure 4-7).
There is a particular concentration of high deprivation in the vicinity of Tilbury and Chadwell Mary. The most
deprived LSOA in the borough is found here and is ranked 1,716th out of 32,844 LSOAs nationally (highlighted
in blue in Figure 4-7). However, this area ranks higher (less deprived) than in 2010 when it was ranked 1,156th.
102 Indices of Deprivation (2015) Explorer [online] Available at: http://dclgapps.communities.gov.uk/imd/idmap.html 103 Department for Communities and Local Government Index of Multiple Deprivation (2010)

43
The least deprived LSOA in the borough is ranked 29,137th nationally and forms part of a cluster of relatively
affluent LSOAs to the north of Grays. This cluster is an exception, as the majority of Thurrock’s high ranking
LSOAs are located in the north east of the borough.
West Thurrock and South Stifford ward experienced the greatest improvement in ranking of overall deprivation
since 2010, possibly as a result of the Lakeside retail park extension.
There are large areas of deprivation in the west of the borough, particularly near the towns of Purley, Averley
and in central Grays. Rural areas in the north west generally experience more deprivation than those to the
east.
Figure 4-7 : Spatial distribution of deprivation across Thurrock
Projected Baseline
Thurrock’s overall deprivation ranking has worsened between 2010 and 2015. Levels of deprivation continue to
vary spatially across the borough, with the east generally experiencing less relative deprivation than areas in the
west.
West Thurrock and South Stifford have showed significant improvement in the IMD rankings largely as a result
of development over the last five years. Whilst this has been good for these areas, if this trend continues it may
attract businesses away from central Grays, further worsening levels of deprivation experienced there.
4.4.5 Crime
Introduction
Crime in all its forms can significantly influence the perceived attractiveness of an area and the health and well-
being of its population. Areas which have low rates of crime are generally more desirable by both residents and
businesses, while the opposite is true for areas with high levels of crime. This can create or worsen levels of
deprivation experienced in such areas.
Spatial development has the potential to reduce or exacerbate crime issues. At a local level, design features
such as adequate street lighting can help to reduce the risk of crime, whilst at the strategic level, at which the

44
Local Plan is aimed, the location and nature of housing, employment and other services or facilities may help to
discourage crime and ease the fear of it. For example, unemployment and low income- two determinants of
certain crimes - could potentially be overcome by providing or improving access to employment.
Policy and Legislation
Regional / Local
The Joint Commissioning Strategy for Domestic Abuse (2015) aims to lead consistent and coordinated action,
bringing together collective resources to address the issue of Domestic Abuse. It has been developed through a
joint partnership between the Essex Domestic Abuse Strategic Board and partner agencies across Essex,
Thurrock and Southend.
Thurrock’s Community Safety Partnership Strategic Assessment (2015) covers the scale and scope of crime,
disorder and community safety issues in Thurrock.
Current Baseline
Recorded crime rates in Thurrock have fallen in recent years but are still above the national and county
average. 104 Figures for 2010/11 for Thurrock showed a 5% reduction in crime against the previous year,
equating to 317 less victims of these offences. However, more recent data shows an increase in recorded
crimes between 2012/13 and 2013/14 of 3.6% (239 crimes) (Table 4-8).104
There is considerable spatial variation in crime rates across Thurrock. Grays Riverside, West Thurrock and
South Stifford, Tilbury Riverside and Thurrock Park, Tilbury St. Chads, Stanford-le- Hope West and Ockendon
all have crime rates significantly above the Thurrock average.
Some of the highest volumes of crimes in Thurrock are domestic, criminal damage, motor vehicle theft,
shoplifting and serious violent crimes. All of these rank higher than Essex force average crimes per 1000
population.104
There were 211 reported sexual offences in Thurrock for the year ending September 2014, a 22% increase on
the previous year. This is in line with the trend seen across the Essex police force.
Hate Crime in Thurrock is decreasing but the borough continues to have the highest number of racial hate crime
incidents in Essex. One in five such incidents occurred in Tilbury Riverside, followed by 9% in Tilbury St. Chads
and Grays Riverside and 8% in South Ockendon; August being the peak month.105
Table 4-8 : Breakdown of Crimes in Thurrock (2013/14)
Crime 2012/13 2013/14 % change
Burglary in dwelling 924 764 -17%
Racially aggravated 426 310 -27%
Robbery 76 501 -29%
Sexual offences 903 1021 +13%
Vehicle offences 1989 1610 -19%
Violence against the person 2256 2607 +16%
Total 6574 6813 3.6%
104 Thurrock Council (2015) Thurrock Community Safety Partnership – Strategic Assessment [online] Available at:
https://www.thurrock.gov.uk/sites/default/files/assets/documents/tcsp_assessment_2015.pdf 105 Thurrock Council (2015) Joint Strategic Needs Assessment Demographics and Population Change [online] Available at:
https://www.thurrock.gov.uk/sites/default/files/assets/documents/jsna-demographics-population-v02.pdf

45
The four critical areas for antisocial behaviour in the borough are Tilbury, South Ockendon, Chadwell St. Mary
and Grays. In Tilbury over 50% of complaints in the first two quarters of 2014 were hate crime-related. South
Ockendon, Chadwell St. Mary and Grays also have high records of domestic abuse, making up 46%, 34% and
27% of antisocial behaviour complaints.106
Most areas in Thurrock are among the 30% most deprived in England in terms of crime, and many of the most
deprived are along the River Thames - with Tilbury Riverside and Thurrock Park ranked among the 10% most
deprived areas in England.107
Projected Baseline
Crime rates are influenced by such a large number of variables that it is very difficult to anticipate future trends.
Whilst data shows that the number of reported crime incidents in Thurrock grew between 2012 and 2014, this
could be due to improvements in the crime reporting process, which would be considered a positive change.
Spatial variation that currently exists in relative crime deprivation across Thurrock is likely to remain for the
foreseeable future, and for the most part will continue to mirror overall deprivation trends.
4.4.6 Equalities
Introduction
The topic of equalities focuses on reducing or eliminating discrimination in all forms based on an individual’s
age, gender, sexuality, marital status, race, disability or religion. In particular, it aims to identify where the effects
of a plan or proposal may be disproportionately experienced by one or more groups who share these ‘protected
characteristics’.
Policy and Legislation
National
The Equality Act (2010) requires public authorities (under the Public Sector Equality Duty) to take a pro-active
approach to eliminating discrimination. Specifically, they must promote equality of opportunity, good relations
between groups of people who share protected characteristics, while eliminating unlawful discrimination.
The Act is underpinned by a range of equality- and diversity-related legislation, including the Human Rights Act,
Race Relations Act and amendment, Disability Discrimination Act, Gender Recognition Act, Civil Partnerships
Act, Employment Equality (Religion or Belief) Regulations and Employment Equality (Sexual Orientation)
Regulations.
Local
Thurrock Council has a single equality scheme108 which aims to ensure the services it provides are fair and
equal. The scheme is reviewed each year in consultation with community groups and Council staff. It helps the
Council to involve communities in decision-making, oppose all forms of prejudice and discrimination, provide
equal access to jobs, promote diversity and tolerance and prevent harassment and victimisation of residents,
service users and employees.
The Council reports on its progress against its equality duties each year. The latest report was published in
2014.109
Current Baseline
106 Thurrock Council (2015) Thurrock Community Safety Partnership – Strategic Assessment [online] Available at:
https://www.thurrock.gov.uk/sites/default/files/assets/documents/tcsp_assessment_2015.pdf 107 Indices of Deprivation (2015) Explorer [online] Available at: http://dclgapps.communities.gov.uk/imd/idmap.html 108 Thurrock Council (2012) Single Equality Scheme [online] Available at:
https://www.thurrock.gov.uk/sites/default/files/assets/documents/single_equality_201204.pdf 109 Thurrock Council (2014) Annual Equality Report [online] Available at:
https://www.thurrock.gov.uk/sites/default/files/assets/documents/annual_equality_2014.pdf
46
Population Structure
In 2014, the total population of Thurrock was 163,270 110, of which 80,424 (49.3%) were male and 82,846
(50.7%) female.111
Whilst Thurrock’s age structure is broadly representative of regional and national trends, the borough has a
considerably younger population (ages 0-19 years), with a particularly high proportion of 0-4 year olds, and a
considerably larger proportion of the population in their 30s and early to mid-40s, than both East of England
region and England as a whole. In line with this, Thurrock has a smaller proportion of people in older age
groups than the regional and national averages.111
Population Change
The annual number of births in Thurrock has steadily increased from 1,852 births in 2001 to 2,359 in 2014. At
the same time, the number of deaths per annum has declined from 1,216 in 2001 to 1,147 in 2014.112
The borough’s population aged 60 years and above has increased by 16.5% since 2001, with a 47.5% increase
in the over 85 population,113
There has been substantial migration of people from London to Thurrock, particularly from geographically close
boroughs such as Havering, Barking and Dagenham and Newham. These three London boroughs account for
over 50% of total migration into Thurrock.111
In terms of international migration into Thurrock, Office for National Statistics estimates show that the annual
figure has varied significantly since 2001, from about 500 people a year, rising to a peak of 1,300 in 2006/7,
before decreasing to 940 per year in 2013/14.111
Population Distribution
Thurrock’s population is not evenly distributed across the borough - there are more densely populated areas win
the southern and central areas of Thurrock, and less populated areas in the north.
The areas with the highest percentage of under 15s in Thurrock are heavily clustered around the south and
south west of the borough, including the wards of Tilbury St Chads, Chafford and North Stifford, South Chafford
and West Thurrock, and South Stifford where around 34% of the population falls within this age group.
The highest proportion of the over 65s (22-36%) reside in the north of the borough in areas such as Orsett,
Corringham and Fobbing.
Race
Thurrock has a diverse population with nearly a fifth of the population from Black, Asian and Minority Ethnic
groups.114 In 2011, Ethnic minorities made up 14.1% of Thurrock’s population, similar to the 14.5% seen across
the country as a whole. Black/African/Caribbean/Black British; African were the largest group at 6.2%.
Despite an overall population increase across the borough, the White British and Irish groups have decreased in
number from 134,348 residents (93.9% of the resident Thurrock population in 2001) to 128,348 in 2011 (81.6%
of the total population). All other ethnicities have seen increases in number and proportion, particularly within
the Black and White Other groups which experienced 642.8% and 228.3% increases respectively (Table 4-9).111
110 ONS (2014) Annual Mid-year Population Estimates [online] Available at: http://www.ons.gov.uk/ons/rel/pop-estimate/population-estimates-for-uk--
england-and-wales--scotland-and-northern-ireland/mid-2014/stb---mid-2014-uk-population-estimates.html 111 Thurrock Council (2015) Joint Strategic Needs Assessment – Demographics and Population Change [online] Available at:
https://www.thurrock.gov.uk/sites/default/files/assets/documents/jsna-demographics-population-v02.pdf 112 Thurrock Council (2013) Health and Well-being strategy: Part 1 [online] Available at:
https://www.thurrock.gov.uk/sites/default/files/assets/documents/HWB-strategy-2013-pt1.pdf 113 Thurrock Council (2015) Market Position Statement: Adult Social Care in partnership with Health and Housing 2015 – 2018 [online] Available at:
http://democracy.thurrock.gov.uk/documents/s3477/Item%2011%20Appendix%201%20Market%20Position%20Statement%20Overview.pdf 114 Thurrock Council Pharmaceutical Needs Assessment (2014) [online] Available at:
https://www.thurrock.gov.uk/sites/default/files/assets/documents/pharmaceutical_needs_201411.pdf

47
Table 4-9 : Breakdown of Thurrock’s Population by Ethnicity
Ethnic Group 2001 2011 2001 - 2011
No. of
residents
% of
population
No. of
residents
% of
population
Absolute
change
Change as a
percentage
White British / White Irish 134,348 93.9% 128,348 81.6% -5,653 -4.5%
White Other 2,051 1.4% 6,734 4.3% 4,683 +228.3%
Mixed 1,319 0.9% 3,099 2.0% 1,780 +135%
Asian 3,405 2.4% 5,927 3.8% 2,522 +74.1%
Black 1,659 1.2% 12,323 7.8% 10,664 +642.8%
Other 346 0.2% 927 0.6% 581 +167.9%
Total 143,128 100.0% 157,705 100.0% 14,577 +10.2%
In total, 6% of the Thurrock population uses a language other than English as their main language, of which the
most commonly used language is Polish (1.4%).115
Disability
As of 2014, there are estimated to be 2,965 adults aged 18 and over living with a learning disability in Thurrock,
ranking the borough fifth in Essex County with Colchester estimated to have the largest number (3,436) and
Maldon District (1,175) the smallest.116
In the same year, 107 adults in Thurrock were living with severe or complex learning disabilities, 64 adults with
Down syndrome and 35 adults with challenging behaviours.116
The 2011 census showed 24,550 people (15.5% of the population) to be living with a disability in Thurrock, 7%
of whom suffered from day-to-day activities limited a lot and 8% suffered from day-to-day activities limited a
little.117 This is a decrease on the proportion of the population who were living with a limiting long-term illness in
the 2001 Census (16.1%). The previous census did not distinguish the extent to which people are limited by
their condition.
Religion
In 2011, the largest religious affiliation in Thurrock was to Christianity (63.3% of the population), while the
second largest proportion was no faith (26% of the population) (Figure 4-8).
Between 2002 and 2011 the percentage of Thurrock’s population who identified themselves as Christians fell by
around 12%, which was similar to the trend seen across the UK. The largest percentage increase between 2001
and 2011 was in the number of people in Thurrock who stated that they had no religion, which increased by
10.5%; slightly higher than the national average of 10.3%.118
115 Thurrock Council Pharmaceutical Needs Assessment (2014) [online] Available at:
https://www.thurrock.gov.uk/sites/default/files/assets/documents/pharmaceutical_needs_201411.pdf, (accessed 26/01/2016). 116 Essex County Council: Learning Disability Needs Assessment ( 2015) [online] Available at: http://www.essexinsight.org.uk 117 English Federation of Disability Sport (201)1 Census statistics for disability prevalence in England by region [online] Available at:
http://www.efds.co.uk/assets/0000/6746/Census_disability_stats.pdf 118 Thurrock Council (2014) The Changing profile of religion and Belief in Thurrock [online] Available at:
http://thurrock.moderngov.co.uk/Data/Standing%20Advisory%20Council%20for%20Religious%20Education/201403191800/Agenda/7848%20-%2020757.pdf

48
Figure 4-8 : Breakdown of Religions in Thurrock (2011)
Gypsy and Traveller Communities
According to the 2011 Census, 308 people living in Thurrock identified themselves as Gypsies and Travellers
(0.2% of the total population), compared to 187 people on average across all local authorities in Essex.119 This
figure is likely to be less than the actual figure due to some Gypsies and Travellers not declaring their ethnic
status or completing the census.
There were three authorised public and private Gypsy and Traveller sites in Thurrock in 2013:
Gammon Fields, Grays, Essex, RM16 2QH
Pilgrims Lane, North Stifford, Grays, Essex, RM16 5UZ
Ship Lane, Aveley, RM15 4HB
Together they contain a combined total of 64 residential pitches, accounting for over a quarter of all pitches in
Essex. There are also five private sites with permission for a total of 30 caravans, including a site at Herd Lane,
Corringham.119
No count of gypsy caravans has been carried out since 2008.120
Thurrock has historically been the base for a significant number of Travelling Showpeople, who have a different
cultural identity to Gypsies and Travellers as well as a unique lifestyle. There are three sites for ‘winter quarters’
for Travelling Showpeople in Thurrock at Tilbury, West Thurrock and Buckles Lane, South Ockendon. Buckles
lane in Thurrock is the largest group of Travelling Showpeople in Europe and contains a mixture or authorised
and temporary plots as well as non-Travelling Showpeople (often former workers) living alongside Travelling
Showpeople. Surveys have found that these sites experience significant overcrowding and are at full capacity.121
Projected Baseline
ONS subnational population projections from 2012 suggest that Thurrock’s total population will increase from its
current level of 163,270 to 176,500 by 2022 and 192,535 by 2032 (an increase of 8.1% and 19.9%
respectively).
119 Thurrock Council (2014) Essex gypsy and traveller and travelling show people accommodation assessment on behalf of Essex Planning Officers
Association [online] Available at: https://www.thurrock.gov.uk/sites/default/files/assets/documents/ldf_tech_gtta_201407.pdf 120 ONS (2014) Sub-national health expectancies, Disability-Free Life Expectancy by Upper Tier Local Authority: England 2009-11 [online] Available
at: http://www.ons.gov.uk/ons/dcp171778_372272.pdf 121 Thurrock Council (2007) Thurrock Gypsy, Traveller and Travelling Showperson Accommodation Assessment [online] Available at:
https://www.thurrock.gov.uk/sites/default/files/assets/documents/ldf_tech_gtta.pdf

49
The population is predicted to increase for almost all age groups. However, as a proportion of the total population, the largest percentage increases from 2012 to 2022 are predicted to occur in the 5-9, 50-54 and 70-74 years age groups.122 By 2022, those aged 50-64 are projected to increase by 5,900, an increase of 18%, while those aged 75-84 are projected to increase by 2,139 (26%).123 The number of 0-19 year olds in Thurrock is set to increase to 50,500 by 2037.124 The number of over 85 year olds is set to double by 2033.125
Data from recent years suggests the population of White British and Irish groups will continue to decrease as a
proportion of total population, while ethnic groups will continue to increase.
The total number of adults with learning disabilities in Essex, Southend-on-Sea and Thurrock is estimated to
increase by 7.8% over the next 6 years. In Thurrock, an 11.2% increase in people with learning disabilities is
projected by 2020.
The number of people who affiliate with Christianity is likely to continue decreasing in line with national trends,
but it will remain the most popular religion in Thurrock in the coming years. Those who report having no religious
belief or affiliation will continue to increase in number, in keeping with the national trend.
The Gypsy and Traveller needs assessment illustrated that there is a need for an additional 50 residential
pitches by 2016 for Gypsies and Travellers in the Thurrock area.126
4.5 Health baseline
Introduction
Health determinants are the factors that produce changes in a population’s health and well-being. Thurrock’s
Local Plan has the potential to affect the following health determinants:
pollution
physical activity and obesity
access to services and facilities
transport safety
These determinants will be addressed as four distinct topics in the Sustainability Appraisal. Baseline information
relating specifically to each of these determinants is provided in sections 4.5.1 to 4.5.4, along with an overview
of the current and projected baseline from a general health perspective.
Policy and Legislation
There is a huge body of plans and strategies at an international, national and local level that focus on health.
Whilst some target specific issues or determinants, many cover a range of health issues and explore the
relationships between them. For this reason, policy and legislation relevant to the four health topics considered
in the SA has been grouped together within the Policy Review in Appendix B, a summary of which is provided
here.
International
122 Joint Strategic Needs Assessment – Demographics and Population Change (2015) [online] Available at:
https://www.thurrock.gov.uk/sites/default/files/assets/documents/jsna-demographics-population-v02.pdf 123 Thurrock Council (2015) Market Position Statement: Adult Social Care in partnership with Health and Housing 2015 – 2018 [online] Available at:
http://democracy.thurrock.gov.uk/documents/s3477/Item%2011%20Appendix%201%20Market%20Position%20Statement%20Overview.pdf 124 Thurrock Council (2015) Joint Strategic Needs Assessment children and Young People [online] Available at:
https://www.thurrock.gov.uk/sites/default/files/assets/documents/jsna-children-young-people-201602-v01.pdf 125 Health and Well-being strategy (2013) 1 [online] Available at: https://www.thurrock.gov.uk/sites/default/files/assets/documents/HWB-strategy-
2013-pt1.pdf 126 Thurrock Gypsy, Traveller and Travelling Showperson Accommodation Assessment (2007) [online] Available at:
https://www.thurrock.gov.uk/sites/default/files/assets/documents/ldf_tech_gtta.pdf

50
‘Health 2020’ is the new European health policy framework. It aims to support action across government and
society to “significantly improve the health and well-being of populations, reduce health inequalities, strengthen
public health and ensure people-centred health systems that are universal, equitable, sustainable and of high
quality”.
The Human Rights Act makes provision for the protection and improvement of human health.
A revised EU Directive on Environmental Impact Assessment (EIA) is due to come into effect in April 2017. It
will include a requirement for plan-makers to take account of effects on population and human health.
National
The Health and Social Care Act 2012 creates a duty on the Secretary of State, NHS England and Directors of
Public Health to secure continuous improvement in the quality of services provided to individuals for or in
connection with ‘protection or improvement of public health’. The Act sets out the statutory responsibilities which
local authorities have for public health services.
The National Planning Policy Framework (NPPF) supports the role of planning to create healthy, inclusive
communities by supporting local strategies to improve health, social and cultural well-being for all and by
working with public health leads and health organisations.
Fair Society, Healthy Lives (the Marmot Review) (2010) found that individual health is influenced by wider
determinants such as income, education, local environmental quality and employment – what Marmot calls the
‘social determinants of health’. The review set out six policy objectives for reducing health inequalities including
‘to create and develop healthy and sustainable places and communities’.127
Healthy Lives, Healthy People: Our Strategy for Public Health in England (2010) sets out the Government’s
long-term vision for the future of public health in England. It aims to create a “wellness” service (Public Health
England) and to strengthen both national and local leadership.
Local
Thurrock’s Joint Strategic Needs Assessment (JSNA) (2015) outlines the current and future health and social
care needs of the local community that could be met by local authority, NHS England and Commissioning
Groups.
The JSNA: Children and Young People (2015) looks specifically at the needs of children and young people in
the borough, providing a comprehensive picture of the health and well-being needs of children and young
people now and in the future.
JSNA: Demographics and Population Change (2015) looks at the demography of Thurrock’s population as a
whole and feeds the information into the Health and Well-being Strategy for Thurrock (currently under
production).
The Thurrock Health and Well-being Strategy (2013) (which is currently under review) is a two-part document
jointly developed by Thurrock Council and Thurrock NHS Clinical Commission Group to deliver the ‘improve
health and well-being’ priority set up by Thurrock Community Strategy (2012). The objective for this strategy is
to ensure people stay healthy longer, reduce inequalities in health and well-being and empower communities to
take responsibility for their own health and well-being.
Current Baseline
Figure 4-9 shows the change in overall mortality rate in Thurrock from 2000 – 2010 – this is the directly
standardised death rate per 100,000 population (deaths of all ages and all causes). In 2010, Thurrock had
612.6 male deaths per 100,000 and 466 female deaths per 100,000.
127 The Marmot Review (2010) Fair Society, Healthy Lives [online] Available at: http://www.instituteofhealthequity.org/projects/fair-society-healthy-
lives-the-marmot-review

51
Figure 4-9 : All Age, All-Cause Mortality Rate in Thurrock (2000-2010)128
The all age, all-cause mortality rate has been falling for both males and females in Thurrock since 2000, but at a
faster rate for males. The mortality rate for males is still larger than for females. Early death rates from cancer,
heart disease and stroke have fallen, although the former is still worse than the England average. The rate of
smoking-related deaths is higher in Thurrock than the national average.
Life expectancy for both men (79.1 years) and women (82.7 years) is similar to the average for England (79.4
and 83.1 years respectively). However, life expectancy is 9.7 years lower for men and 7.1 years lower for
women in the most deprived areas of Thurrock than in the least deprived areas.129
Rates of early deaths from cardiovascular diseases (96 per year) and cancer (153 deaths per year) are worse
than the England average (78 per year and 144 deaths per year respectively).
In terms of the health and disability domain of the IMD, Thurrock is among the 30% least deprived areas in
England. The most deprived area, which falls within the 30% most deprived category, is in the south east of the
borough.130
Projected Baseline
There are many potential changes in health determinants that will affect all cause mortality in Thurrock. One
example is climate change. Summers are expected to become hotter and sunnier and this may increase the
excess mortality rate for vulnerable groups.131
4.5.1 Pollution and Health
Introduction
128 Health and Social Care Information Centre (2016) [online] Available at: https://indicators.ic.nhs.uk/webview/ 129 Public Health England (2015) Health Profile – Thurrock [online] Available at http://www.apho.org.uk/resource/item.aspx?RID=171774 130 Indices of Deprivation (2015) Explorer [online] Available at: http://dclgapps.communities.gov.uk/imd/idmap.html 131 Thurrock Council (2010) Local Climate Impacts Profile (NI 188): Planning for Thurrock’s Adaptation to Impacts of Climate Change [online]
Available at: https://www.thurrock.gov.uk/sites/default/files/assets/documents/ldf_tech_climate_201010.pdf
52
Pollution has been shown to have negative consequences in terms of human health. Concentrations of
particulate matter (PM) and oxides of nitrogen (NOx) in the air are a primary concern from a health perspective.
Studies have shown that there is a direct association between proximity to busy roads (including those used by
a large number of heavy vehicles) and respiratory illness.132 Rates of cardiovascular and respiratory diseases
and dementia, amongst others, are influenced by changes in air quality.
Pollution in the form of noise can lead to a range of health effects. This might include declines in communication
skills, school performance, sleep and heightened aggression and annoyance. Such effects may generate
anxiety and stress, which could lead to increased risk of cardiovascular conditions. In extreme cases, elevated
noise levels can result in hearing damage.
Changes in the water environment, which may include changes in quality or the availability of water resources,
can affect drinking water quality and food supplies. Such changes can also affect agriculture, direct recreation
facilities (e.g. angling, kayaking, canoeing and other recreational activities that involve water) or wider
recreational resources, for example views of water along countryside walks or public bridleways. Such effects
have implications for health.
Current and Projected Baseline
For information on the current and projected baseline in Thurrock in terms of pollution, please refer to sections
on Air Quality (4.3.1), Geology and Soils (4.3.6), Noise (4.3.9) and Water Resources and Quality (4.3.10).
4.5.2 Physical Activity and Obesity
Introduction
Access to high quality green and blue space affects both physical and mental well-being. In order to achieve
recommended daily activity levels, it is important that adults and children have access to suitable recreational
resources and amenity spaces and opportunities for active travel.
In addition, healthy habitats and populations of wildlife can be important aspects of recreation, through direct
enjoyment of nature and activities such as bird-watching, cross country walking, camping, boating, angling and
canoeing and many others.
Recreation, amenity and levels of physical activity could be affected by the Local Plan through:
Changes in infrastructure, including alterations to walking, cycling and public transport facilities;
Alteration of the environment surrounding the recreational facility, including effects on wildlife and natural
habitats, as well as effects on visual amenity;
Changes in the local road network that affect access to recreational and amenity features;
Effects on light, noise, air and water quality in the vicinity of developments; and
Disturbance and disruption of people due to noise, visual disturbance and temporary traffic disruption.
Current Baseline
Obesity and over-weight is a significant health problem in Thurrock and nationally. Data from 2014/15 shows
9.3% of reception-aged children in Thurrock are obese.133 This is similar to the national average of 9.1%, but
higher than the regional average of 8.8%. This trend continues as children get older, with 21.3% of children in
year 6 (10 and 11 year olds) classified as obese in the same year; higher than the average for England which
stood at 19.1% and substantially higher the regional average of 16.9%.134
132 Committee on the Medical Effects of Air Pollutants (2010). Long-Term Exposure to Air Pollution: Effect on Mortality [online] Available at:
https://www.gov.uk/government/uploads/system/uploads/attachment_data/file/304641/COMEAP_mortality_effects_of_long_term_exposure.pdf 133 Public Health England (2016) NCMP Local Authority Profile [online] Available at: http://fingertips.phe.org.uk/profile/national-child-measurement-
programme/data#page/0/gid/8000011/pat/6/par/E12000006/ati/102/are/E06000055 134 Public Health England (2015) Health Profile – Thurrock [online] Available at http://www.apho.org.uk/resource/item.aspx?RID=171774
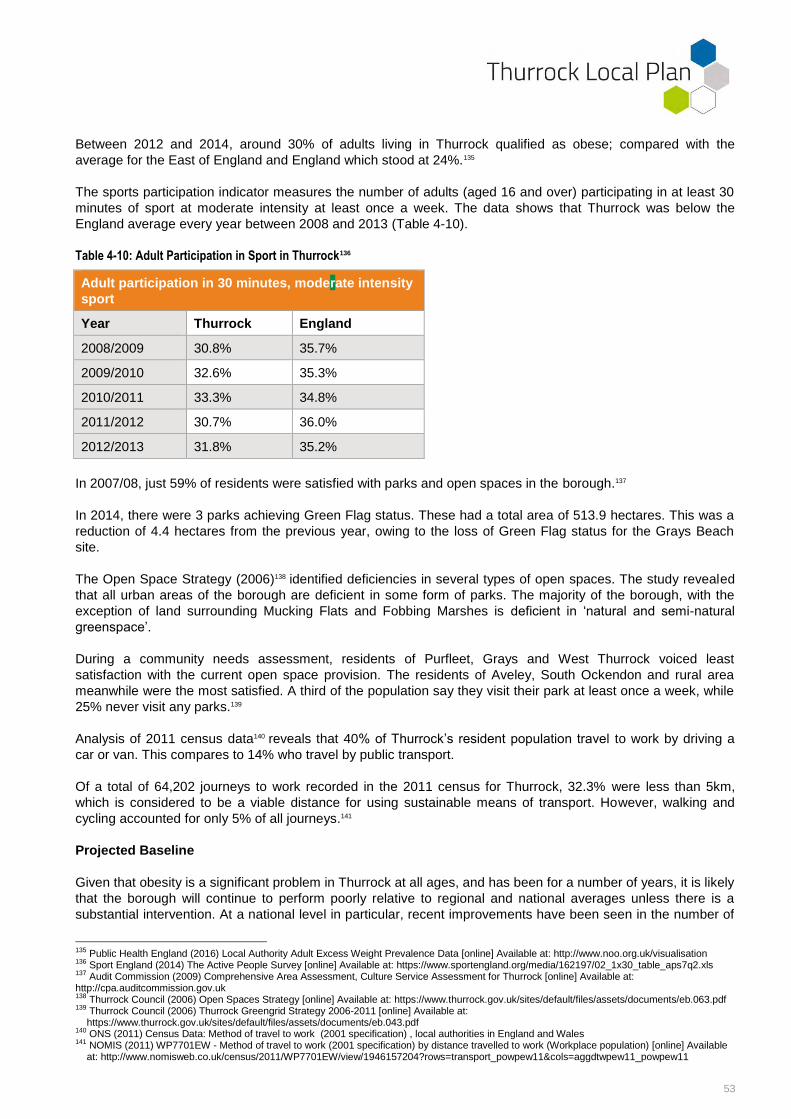
53
Between 2012 and 2014, around 30% of adults living in Thurrock qualified as obese; compared with the
average for the East of England and England which stood at 24%.135
The sports participation indicator measures the number of adults (aged 16 and over) participating in at least 30
minutes of sport at moderate intensity at least once a week. The data shows that Thurrock was below the
England average every year between 2008 and 2013 (Table 4-10).
Table 4-10: Adult Participation in Sport in Thurrock136
Adult participation in 30 minutes, moderate intensity
sport
Year Thurrock England
2008/2009 30.8% 35.7%
2009/2010 32.6% 35.3%
2010/2011 33.3% 34.8%
2011/2012 30.7% 36.0%
2012/2013 31.8% 35.2%
In 2007/08, just 59% of residents were satisfied with parks and open spaces in the borough.137
In 2014, there were 3 parks achieving Green Flag status. These had a total area of 513.9 hectares. This was a
reduction of 4.4 hectares from the previous year, owing to the loss of Green Flag status for the Grays Beach
site.
The Open Space Strategy (2006)138 identified deficiencies in several types of open spaces. The study revealed
that all urban areas of the borough are deficient in some form of parks. The majority of the borough, with the
exception of land surrounding Mucking Flats and Fobbing Marshes is deficient in ‘natural and semi-natural
greenspace’.
During a community needs assessment, residents of Purfleet, Grays and West Thurrock voiced least
satisfaction with the current open space provision. The residents of Aveley, South Ockendon and rural area
meanwhile were the most satisfied. A third of the population say they visit their park at least once a week, while
25% never visit any parks.139
Analysis of 2011 census data140 reveals that 40% of Thurrock’s resident population travel to work by driving a
car or van. This compares to 14% who travel by public transport.
Of a total of 64,202 journeys to work recorded in the 2011 census for Thurrock, 32.3% were less than 5km,
which is considered to be a viable distance for using sustainable means of transport. However, walking and
cycling accounted for only 5% of all journeys.141
Projected Baseline
Given that obesity is a significant problem in Thurrock at all ages, and has been for a number of years, it is likely
that the borough will continue to perform poorly relative to regional and national averages unless there is a
substantial intervention. At a national level in particular, recent improvements have been seen in the number of
135 Public Health England (2016) Local Authority Adult Excess Weight Prevalence Data [online] Available at: http://www.noo.org.uk/visualisation 136 Sport England (2014) The Active People Survey [online] Available at: https://www.sportengland.org/media/162197/02_1x30_table_aps7q2.xls 137 Audit Commission (2009) Comprehensive Area Assessment, Culture Service Assessment for Thurrock [online] Available at: http://cpa.auditcommission.gov.uk 138 Thurrock Council (2006) Open Spaces Strategy [online] Available at: https://www.thurrock.gov.uk/sites/default/files/assets/documents/eb.063.pdf 139 Thurrock Council (2006) Thurrock Greengrid Strategy 2006-2011 [online] Available at:
https://www.thurrock.gov.uk/sites/default/files/assets/documents/eb.043.pdf 140 ONS (2011) Census Data: Method of travel to work (2001 specification) , local authorities in England and Wales 141 NOMIS (2011) WP7701EW - Method of travel to work (2001 specification) by distance travelled to work (Workplace population) [online] Available
at: http://www.nomisweb.co.uk/census/2011/WP7701EW/view/1946157204?rows=transport_powpew11&cols=aggdtwpew11_powpew11

54
children classed as obese. One factor limiting improvement in Thurrock may be a lack of suitable open space,
which will need to be addressed if the borough is to reverse the negative trends in adult and child obesity seen
in recent years.
4.5.3 Access to Services and Facilities
Introduction
This topic considers the ways in which the ability of residents to access and use services and facilities can be
affected by development. Services and facilities include hospitals and GPs, recreational resources, food
retailers, employment and education centres, and other aspects of social infrastructure such as community
centres and places of worship. Good and equitable accessibility and the provision of sufficient community
facilities is a vital part of development’s role in improving the health and well-being of a community.
Development which alters access to services and facilities can affect health and well-being in a number of ways.
It can have direct links in terms of providing access to healthcare facilities, it can encourage walking or cycling,
which may help to prevent or reduce obesity and the risk of cardiovascular disease, or it can restrict accessibility
by non-car modes of transport, which may be particularly detrimental for certain social groups. Having suitable
access to employment, education, places of worship and community centres is also important for well-being.
Current Baseline
There is generally good accessibility by public transport and walking to many services across Thurrock, though
there are particular restrictions in terms of access to further education facilities and hospitals.
Key services include centres of employment, primary and secondary schools, further education institutions,
GPs, hospitals, food stores and town centres.
In 2015, the average journey time taken to reach the nearest key services in Thurrock by was car was 9.5
minutes, less than both the regional average for East of England (11 minutes) and the national average for
England (10.3 minutes).142
The average journey time by public transport was 16 minutes; again less than the regional average for East of
England (19 minutes) and the national average (17 minutes).
The same pattern exists for cycling, where the average of 12.8 minutes was significantly lower than for the East
of England (15.9 minutes) and for England as a whole (13.7 minutes).
These results suggest that access to key services and facilities is an area in which Thurrock demonstrates
strong performance compared to regional and national averages.
Projected Baseline
Existing issues in accessing education facilities and hospitals could become a major challenge for the borough
in the coming years as the population continues to grow and age. It could also continue to restrict skills
development and thus have implications for the Thurrock economy.
Many of the new jobs created in the borough over the next few years will be at London Gateway, which is
located away from the main urban areas and so is less accessible by active transport. This may also limit
employment opportunities for certain social groups.
142 Department for Transport (2015) Accessibility Statistics for 2014 [online] Available at: https://www.gov.uk/government/statistics/journey-time-
statistics-access-2014

55
4.5.4 Transport Safety
Introduction
Changes in traffic volumes and patterns (including vehicle types) can alter the risk of road traffic accidents and
affect journey times. Increases in journey times can result in heightened stress and anxiety for travellers,
reducing well-being and increasing the risk of diseases, such as cardiovascular conditions.
Studies have shown that as traffic increases, people modify their behaviours. 143 This means that social
networks may also be at risk because of reduced connectivity and ‘road dominance’ (i.e. the dominance of
roads over other transport options) in or near to residential areas. This can affect people’s sense of community
and inhibit healthy social interaction, which may lead to negative effects on mental health and well-being.
Current Baseline
A number of key road transport links pass through the borough. These include: M25 London Orbital; and A13
London to Southend trunk road, which connects with the M25 just north of the Dartford Tunnel and the Queen
Elizabeth Bridge.144
There are signs that the developments in Thurrock since 2007 are putting pressure on the road network. The
726 million vehicle miles travelled on major roads in Thurrock in 2014 is the highest figure on record since 2000.
The majority of this was accounted for by cars, but van (LGV) traffic saw the largest percentage increase from
2000-2014, and accounted for almost half (48.2%) of the overall increase in vehicle miles on major roads during
this period; reflecting growth in transport and logistics-related activity in the local economy.145
As a result of these increases, the average speed on ‘A’ roads in Thurrock during the weekday morning peak is
decreasing. This is particularly marked when looking specifically at the A13 where there has been a significant
decline in average vehicle speeds for westbound traffic in recent years.
Significant improvements in highway capacity will be required by 2021 as well as extensive road improvements
to improve journey times and safety. Or alternatively, improvements could be made in freight, public transport
and cycling infrastructure,
Transport infrastructure is vital in Thurrock, particularly for sectors such as retail and ports and logistics. It is
also vital for the resident population to travel and commute. Data for 2011 shows over 34% of residents
commute to London on a daily basis and at present a majority do so by car.145
In terms of road safety, Thurrock’s performance has declined since 2009 in terms of average number of road
accidents resulting in death or serious injury (Table 4-11).146
Table 4-11 : Road Traffic Accidents in Thurrock (2009-2014)
Year No. of People killed or seriously
injured in Road Traffic Accidents
2009/10 67.0
2010/11 62.0
143 Cave B, Coutts A. (2002) Health Evidence base for the Mayor's draft Cultural Strategy. London: South East London Strategic Health Authority
and East London & the City Health Action Zone 144 Thurrock Council (2011) Annual Monitoring Report [online] available at: http://www.thurrock.gov.uk/planning/strategic/pdf/monitor_annual_2011.pdf 145 Thurrock Council (2016) Thurrock Economic Growth Strategy 2016-2021: Final Draft – Approved by Cabinet on 9th February 2016 146 Shaping Thurrock (2012) Thurrock Joint Strategic Needs Assessment Strategic Refresh [online] Available at:
https://www.thurrock.gov.uk/sites/default/files/assets/documents/JSNA-2012-pt0.pdf
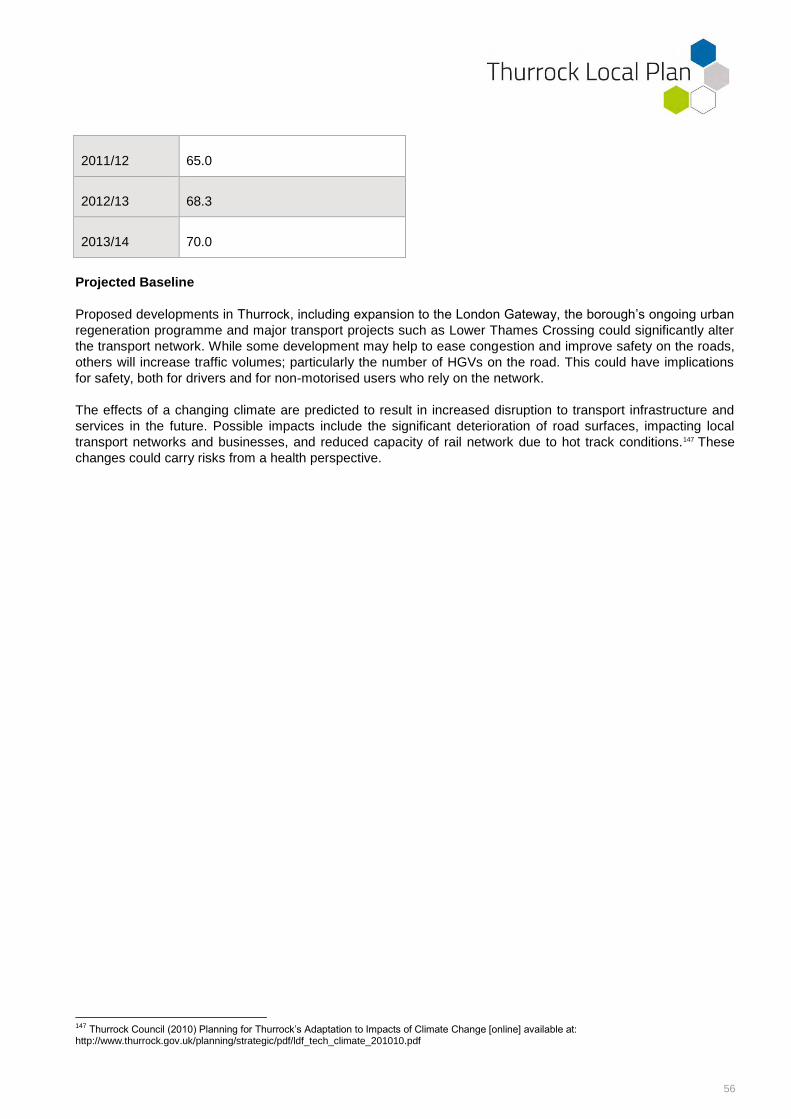
56
2011/12 65.0
2012/13 68.3
2013/14 70.0
Projected Baseline
Proposed developments in Thurrock, including expansion to the London Gateway, the borough’s ongoing urban
regeneration programme and major transport projects such as Lower Thames Crossing could significantly alter
the transport network. While some development may help to ease congestion and improve safety on the roads,
others will increase traffic volumes; particularly the number of HGVs on the road. This could have implications
for safety, both for drivers and for non-motorised users who rely on the network.
The effects of a changing climate are predicted to result in increased disruption to transport infrastructure and
services in the future. Possible impacts include the significant deterioration of road surfaces, impacting local
transport networks and businesses, and reduced capacity of rail network due to hot track conditions.147 These
changes could carry risks from a health perspective.
147 Thurrock Council (2010) Planning for Thurrock’s Adaptation to Impacts of Climate Change [online] available at: http://www.thurrock.gov.uk/planning/strategic/pdf/ldf_tech_climate_201010.pdf
57
5. Sustainability Issues and Problems
These sustainability topics and issues have been identified in line with a requirement of the SEA Regulations to
state any existing environmental problems which are relevant to the plan. They provide the methodological
framework for appraising the plan and alternatives against a defined set of objectives.
Air Quality – Air quality is a prominent issue in Thurrock. The borough currently has 16 Air Quality
Management Areas, all of which have been designated for road transport pollutant emissions. Whilst data has
shown gradual declines in pollutant concentrations over recent years, reductions have slowed, and proposed
future development such as the Lower Thames Crossing could create new air quality issues.
Biodiversity, Flora and Fauna – Thurrock has a diverse range of internationally, nationally and locally
important sites for nature conservation, as well as areas of ancient woodland and protected and/or notable
habitats and species. As discussed in Section 4.3, biodiversity in the wider context is suffering long-term
declines. Thurrock Council has a duty to conserve and enhance biodiversity, which also benefits residents and
visitors to the borough; providing opportunities to interact with nature. This can have positive health and well-
being effects.
Climate Change and Energy – Thurrock’s emissions of CO2 have fallen in recent years, largely as a result of
the closure of industry and transition towards a service-based economy. Whilst this has been positive from a
climate change and energy perspective, per capita emissions remain higher than regional and national
averages, especially from transport sources. Further work will be needed to promote low-carbon forms of
energy and sustainable transport modes.
Cultural Heritage – The borough has a rich portfolio of cultural heritage, including seven conservation areas,
245 Listed Buildings and 17 Scheduled Ancient Monuments. Such historic assets must be protected for the
enjoyment of local residents, to preserve the cultural identity of local communities and attract new visitors to
Thurrock.
Flood Risk – Large swathes of the borough are built on flood plain, including zones two and three; particularly
some of the urban areas near the River Thames and River Mardyke. The number of properties estimated to be
at risk of tidal flooding stands at over 11,000, while for fluvial flooding it is several hundred. Development must
ensure it does not increase flood risk, particularly in high risk areas.
Geology and Soils – Thurrock has three Sites of Special Scientific Interest (SSSIs) designated for geology and
considerable areas of best and most versatile agricultural soils. Development should avoid degrading the
borough’s geological resources and, where possible, avoid using up or degrading highest quality soil resources.
It is important to recognise that maintaining an area’s soil resources must be carefully balanced against the
economic viability of developing the land.
Landscape, Townscape and Visual Impacts – Development has the potential to greatly influence the
landscape or townscape of an area. Major developments such as new roads, residential expansion and
employment hubs can have not only a physical impact which affects views, but a wider impact on the
environment through changing travel patterns, increasing noise, air and water pollution and encouraging
population growth. Such changes can affect the character of local areas, particularly areas which are sensitive
to particular types of development, and may have associated health impacts.
Materials and Waste – With the closure of many of the borough’s mineral extraction sites and their subsequent
conversion to other uses such as nature sites and green space, materials are likely to be increasingly imported
to the borough from elsewhere. The environmental impacts of this transport should be considered in spatial
planning, and every effort should be made to reuse existing materials in new developments. This can help to
reduce waste arisings that require treatment or disposal. With the creation of a London Local Waste Plan, the
emphasis will be on reducing the amount of waste arisings in London that are transported for management
outside the city to locations such as Thurrock. This means the borough is likely to have greater capacity to
manage its own waste in the future.

58
Noise – There are clear links between development and noise. Sources of noise, including major transport
corridors, should be located or designed in a way that does not cause major adverse effects on the local
population or wildlife. This is particularly important for quiet rural communities and areas on the urban fringe.
Water Resources and Quality – Pressure on water resources has been an ongoing issue in Thurrock for a
number of years. Development increases requirements for water abstraction, as well as having the potential to
impact the quality of water bodies. Efforts should be made to ensure that development is located in areas where
sufficient water supply capacity is available, and where changes will not adversely affect the quality of water
bodies. Rivers such as the Mardyke, where nearby development has already adversely influenced water quality,
should be protected and improved wherever possible.
Economy and Employment – Whilst jobs growth in the borough has been strong in recent years, further work
will be needed to ensure that full benefit is realised from investment in the growth hubs to meet the 26,000 jobs
target by 2021. The Thurrock economy is also heavily reliant on relatively low-paying service jobs, particularly in
logistics and retail. Further work is needed to make the economy more resilient and improve the productivity of
employment in the borough.
Education and Skills – Skill shortages and low attainment in education has been a characteristic of Thurrock
for a number of years. Despite improvements, particularly in attainment at GSCE level, the borough performs
poorly against regional and national averages for those going on to further and higher education. This has
created challenges for businesses looking to grow, who have found it difficult to recruit sufficiently skilled staff. If
Thurrock hopes to fully capitalise on economic development opportunities such as the London Gateway, it will
need to improve the accessibility and provision of high quality education and training facilities.
Housing – Overcrowding is a problem in Thurrock, with the supply of housing in recent years falling below
increasing demand. The borough’s growing young population will create additional demand for larger family
homes, while relatively low levels of income will need to be taken into account through the provision of
affordable accommodation. Substantial spatial variation exists in housing deprivation across Thurrock. This will
need to be addressed by targeting residential development in areas where the barriers to housing are greatest.
Deprivation – There is considerable spatial variation in deprivation levels seen across Thurrock. Certain areas
which rank among the most deprived in the country need to be targeted through spatial planning, particularly
with a view to encouraging development that will provide jobs, raise income levels and reduce barriers to
housing and services.
Crime – Whilst reported crime rates have been shown to be increasing in the last few years, it is difficult to
determine whether this represents an actual increase in crime or simply an increase in the numbers of crimes
being reported. Either way crime remains an important issue, not just for Thurrock but for any local authority.
Reducing crime and fear of crime is an important element in improving the health and well-being of a
community. It can also have socio-economic implications if residents and businesses choose to avoid certain
areas with high levels of crime, which can further worsen deprivation experienced there. Opportunities for
development to reduce levels and fear of crime, particularly in deprived areas must be pursued.
Equalities – Local authorities have a legal requirement to ensure that spatial planning and development does
not disproportionately affect a particular group or groups with protected characteristics. The Local Plan should
provide and promote opportunities for all of the borough’s residents, including those with protected
characteristics. A review of baseline information suggests the borough has an ageing population, particularly in
rural areas (with poor access to services), growth in the numbers of young people in urban areas, growing
ethnic diversity and under-provision/overcrowding of Gypsy and Traveller Sites.
Pollution and Health –The risk of environmental pollution and associated adverse health effects is something
that needs to be carefully considered in spatial planning. Developments should avoid worsening existing air and
water quality, causing unacceptable noise pollution or encouraging the spread of land contamination.
Physical Activity and Obesity – Obesity continues to be a major problem in Thurrock. The borough performs
substantially worse than regional and national averages in terms of child obesity (for both reception and year 6
age groups), adult obesity and adult participation in sport. Spatial planning has an important role to play in
encouraging the population to get active, particularly if it encourages active transport modes such as walking

59
and cycling, and through provision of sufficient quality open spaces and recreational resources. Significant
steps need to be taken if the borough is to reverse current negative trends.
Access to Services and Facilities – Thurrock performs well against regional and national averages on journey
times to key services via a range of transport modes. Whilst this a positive result, further work is needed to
ensure that future developments, particularly those which will provide jobs or key services, for example the
London Gateway, are accessible to all. Access to healthcare and education are two areas where improvements
are particularly needed.
Transport Safety – With increases in the volume of traffic on Thurrock’s road network anticipated in the coming
years, efforts will need to be made to ensure that infrastructure is able to cope with this increase in capacity.
Increased traffic volumes and congestion can increase the likelihood of road accidents and create challenges
for non-motorised users who rely on the network. Where possible, development should seek to reduce the
volumes of traffic on roads by providing and promoting alternative transport modes, including public transport
and non-motorised forms of travel such as walking and cycling.

60
6. Sustainability Appraisal Framework and Approach
6.1 Sustainability Objectives
The SEA Regulations require that an Environmental Report is published for consultation alongside the draft plan
which ‘identifies, describes and evaluates’ the likely significant effects of implementing ‘the plan, and reasonable
alternatives’. The report must be taken into account alongside consultation responses when finalising the plan.
Effects are predicted and described according to criteria presented within the Regulations, which include for
consideration of the duration, frequency and reversibility of effects. The potential for ‘cumulative’ effects must
also be considered, with particular focus on the effects of the Local Plan acting in combination with equivalent
plans prepared for neighbouring authorities.
An important element of the Sustainability Appraisal Framework and thus an important part of the SA process is
the determination of sustainability objectives. These objectives, which should align with wider international,
national and local environmental and sustainability objectives, are what the Local Plan will be appraised against.
This includes both the policies and proposals of the plan as well as sites identified for potential development.
Building on SA work completed for the existing Local Plan and incorporating findings from the policy review and
baseline data gathering completed during scoping of this SA, the objectives set out in Table 6-1 have been
identified to cover each of the sustainability topics that will be included in the appraisal.
Owing to the strategic and wide-ranging nature of the Local Plan, it has not been possible to scope out any
environmental or sustainability issues at this stage. When assessing individual Local Plan documents, future
addendums to the SA Scoping Report may be produced and consulted upon to scope irrelevant topics out of
that specific document’s appraisal.
It should be noted that transport, land use, green infrastructure and adaptation to climate change are not
represented by their own topics, and will be addressed within each topic where there are clear links, as relevant
and applicable to the proposals and remit of the Local Plan. For example, changes in transport can potentially
influence a range of topics, including air quality, noise, physical activity and obesity, climate change and energy
and landscape, townscape and visual impacts. Similarly, creation of green infrastructure and adaptation to
climate change are important considerations across a number of environmental, social and economic issues.
Severance will be considered through the assessment process under the Access to Services and Facilities
objective, and also in relation to Equalities.
Table 6-1 : Sustainability Objectives
Topic Sustainability Objective
Air Quality Reduce concentrations of harmful atmospheric pollutants and avoid their emission
Biodiversity, Flora and Fauna
Conserve and enhance Thurrock’s biodiversity, including all statutory and non-statutory designated sites, notable and protected habitats and species
Climate Change and Energy
Reduce greenhouse gas emissions and encourage transition to renewable energy
Cultural Heritage Protect and enhance the borough’s cultural heritage and historic assets and their settings
Flood Risk Protect and enhance Thurrock’s geodiversity and soil resources
Geology and Soils Reduce the risk and effects of flooding, both now and in the future
Landscape, Townscape and Visual Impacts
Preserve and enhance Thurrock’s landscape and townscape, ensuring development does not detract from the quality of views and local distinctiveness
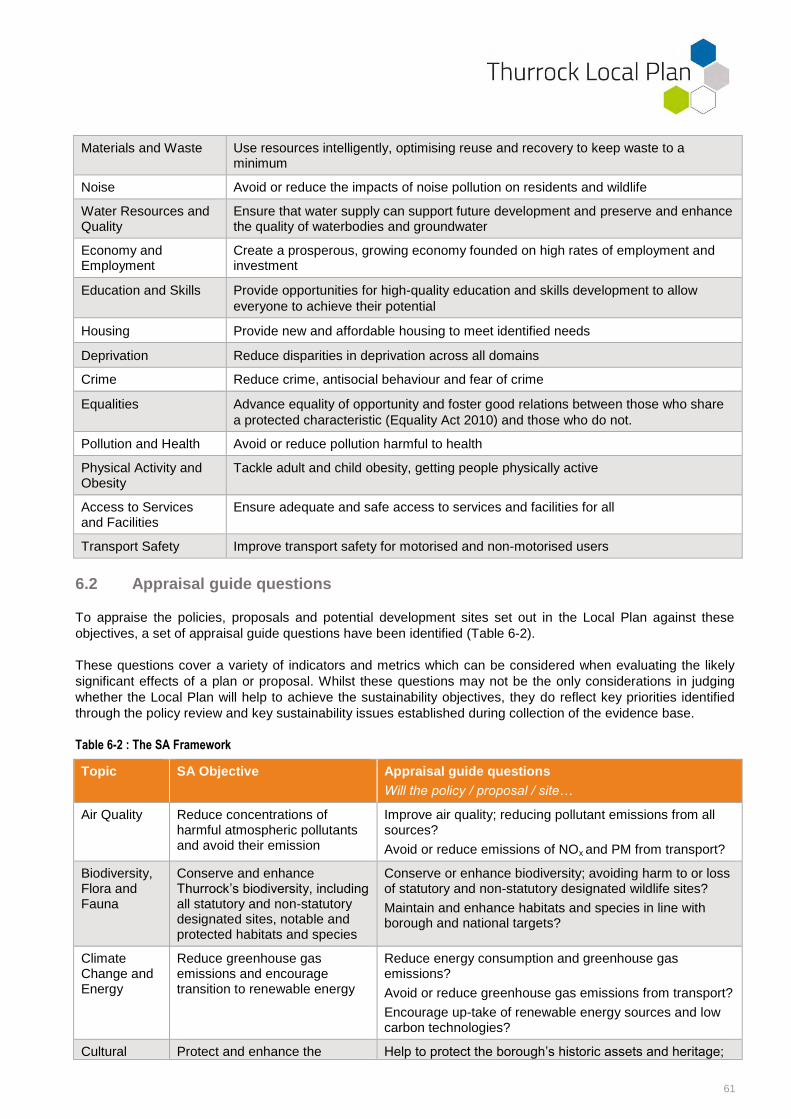
61
Materials and Waste Use resources intelligently, optimising reuse and recovery to keep waste to a minimum
Noise Avoid or reduce the impacts of noise pollution on residents and wildlife
Water Resources and Quality
Ensure that water supply can support future development and preserve and enhance the quality of waterbodies and groundwater
Economy and Employment
Create a prosperous, growing economy founded on high rates of employment and investment
Education and Skills Provide opportunities for high-quality education and skills development to allow
everyone to achieve their potential
Housing Provide new and affordable housing to meet identified needs
Deprivation Reduce disparities in deprivation across all domains
Crime Reduce crime, antisocial behaviour and fear of crime
Equalities Advance equality of opportunity and foster good relations between those who share
a protected characteristic (Equality Act 2010) and those who do not.
Pollution and Health Avoid or reduce pollution harmful to health
Physical Activity and Obesity
Tackle adult and child obesity, getting people physically active
Access to Services and Facilities
Ensure adequate and safe access to services and facilities for all
Transport Safety Improve transport safety for motorised and non-motorised users
6.2 Appraisal guide questions
To appraise the policies, proposals and potential development sites set out in the Local Plan against these
objectives, a set of appraisal guide questions have been identified (Table 6-2).
These questions cover a variety of indicators and metrics which can be considered when evaluating the likely
significant effects of a plan or proposal. Whilst these questions may not be the only considerations in judging
whether the Local Plan will help to achieve the sustainability objectives, they do reflect key priorities identified
through the policy review and key sustainability issues established during collection of the evidence base.
Table 6-2 : The SA Framework
Topic SA Objective Appraisal guide questions
Will the policy / proposal / site…
Air Quality Reduce concentrations of harmful atmospheric pollutants and avoid their emission
Improve air quality; reducing pollutant emissions from all sources?
Avoid or reduce emissions of NOx and PM from transport?
Biodiversity, Flora and Fauna
Conserve and enhance Thurrock’s biodiversity, including all statutory and non-statutory designated sites, notable and protected habitats and species
Conserve or enhance biodiversity; avoiding harm to or loss of statutory and non-statutory designated wildlife sites?
Maintain and enhance habitats and species in line with borough and national targets?
Climate Change and Energy
Reduce greenhouse gas emissions and encourage transition to renewable energy
Reduce energy consumption and greenhouse gas emissions?
Avoid or reduce greenhouse gas emissions from transport?
Encourage up-take of renewable energy sources and low carbon technologies?
Cultural Protect and enhance the Help to protect the borough’s historic assets and heritage;

62
Heritage borough’s cultural heritage and historic assets and their settings
allowing more people to enjoy them?
Geology and Soils
Protect and enhance Thurrock’s geodiversity and soil resources
Protect or enhance the borough’s geological sites?
Help to maintain Thurrock’s soil resources?
Flood Risk Reduce the risk and effects of flooding, both now and in the future
Reduce the impact of surface, groundwater and tidal flooding on people and property?
Landscape, Townscape and Visual Impacts
Preserve and enhance Thurrock’s landscape and townscape, ensuring development does not detract from the quality of views and local distinctiveness
Improve the attractiveness of built-up areas; avoiding incongruent development?
Contribute positively to the landscape/ townscape and the borough’s character; avoiding inappropriate development in sensitive areas?
Avoid or reduce light pollution?
Materials and Waste
Use resources intelligently, optimising reuse and recovery to keep waste to a minimum
Protect mineral resources?
Minimise the production of waste?
Help to avoid or reduce waste sent to landfill; promoting reuse and recovery?
Reduce the distance waste travels; minimising imports and exports?
Noise Avoid or reduce the impacts of noise pollution on residents and wildlife
Reduce noise and disturbance to people and wildlife?
Avoid or reduce transport-related noise pollution?
Water Resources and Quality
Ensure that water supply can support future development and preserve and enhance the quality of waterbodies and groundwater
Maintain or improve the quality of waterbodies and groundwater?
Ease pressure on existing sources; reducing water consumption and abstraction?
Increase water resource capacity that is resilient to climate change?
Economy and Employment
Create a prosperous, growing economy founded on high rates of employment and investment
Create new jobs or protect existing ones?
Enable access to employment opportunities, particularly for disadvantaged groups?
Facilitate the growth of small and medium size businesses?
Help to attract inwards investment?
Diversify the local economy; reducing the burden on core sectors?
Encourage new business start-ups and social enterprises?
Education
and Skills
Provide opportunities for high-
quality education and skills
development to allow everyone
to achieve their potential
Provide education and skills development opportunities;
particularly in deprived areas accessible to all social
groups?
Provide or maintain jobs of varying skill levels?
Encourage innovation and entrepreneurship?
Increase the number and capacity of local education and
training facilities?
Housing Provide new and affordable
housing to meet identified needs
Increase the availability of housing; particularly housing
that is affordable?
Provide housing which meets locally identified needs (i.e.in terms of type, tenure and size).
Deprivation Reduce disparities in deprivation across all domains
Reduce disparities in deprivation; targeting the most deprived areas and social groups?

63
Crime Reduce crime, antisocial behaviour and fear of crime
Reduce crime rates, antisocial behaviour or fear of crime?
Equalities Advance equality of opportunity
and foster good relations
between those who share a
protected characteristic (Equality
Act 2010) and those who do not.
Remove or reduce disadvantages suffered by people due
to their protected characteristics?
Encourage public participation in decision-making by
people with protected characteristics?
Promote community cohesion?
Help meet the needs of people with certain protected
characteristics (e.g. disabled people)?
Pollution and health
Avoid or reduce pollution harmful to health
Help to improve the physical and mental health of the population?
Avoid or reduce emissions of pollutants harmful to health; including air pollutants, noise and contamination of land and water?
Physical Activity and Obesity
Tackle adult and child obesity, getting people physically active
Encourage active travel; providing high quality and attractive infrastructure?
Encourage or enable people to be physically active?
Improve availability of high quality publically accessible green space and recreational resources?
Access to Services and Facilities
Ensure adequate and safe access to services and facilities for all
Enable the local community to access the services and facilities they need?
Help the local community to interact with the natural environment and wildlife?
Improve the quality of services and facilities offered?
Help to retain key village services?
Transport Safety
Improve transport safety for motorised and non-motorised users
Reduce congestion and improve the flow of traffic?
Provide services or facilities to help improve transport safety?
Increase public and active transport options?
6.3 Methodology and approach
6.3.1 Spatial Scope
The spatial scope of the appraisal is the entirety of Thurrock plus certain sites or receptors beyond the
administrative boundary which could still be affected by the Local Plan. This includes waste facilities, transport
corridors and water bodies which may pass through the borough and be influenced by development that takes
place there.
It is recognised that the Local Plan itself will be informed and influenced by decisions taken on the basis of
wider evidence, such as regional or national transport decisions, and the SA may be employed to identify or
document this wider environmental evidence (noting the requirement for ‘duty to cooperate’ between councils).
However, the focus of the SA will remain on the impacts and effects of planning proposals put forward by
Thurrock Council (including the effects which cross boundaries), and not those of other plan and policy-makers.
Whilst European designated nature sites within 5km of Thurrock will be considered in the SA, it should be noted
that they will be assessed in greater detail through a subsequent Habitats Regulations Assessment (HRA).

64
6.3.2 Temporal Scope
In general, the temporal scope of the appraisal will cover the Local Plan period from 2015 to 2036. For some
topics such as air quality and climate change and energy, effects of the plan may extend beyond this timeframe.
Where this is the case, a high-level discussion will be provided as part of the appraisal.
The SA appraisal stage will remain flexible in its use of timeframes when describing the potential effects of the
Local Plan, to allow it to be tailored to the varying proposals being assessed (e.g. high-level policies vs. specific
sites). As such, the SA scope is that the following guideline will be used:
Short term – 0-5 years, or during construction (inclusive of temporary impacts);
Medium term – 5-20 years, or the first 15 years of operation; this generally corresponds with the timeframe
of the plan; and
Long term – 20+ years, or considering the very long-term impacts of proposals; limits will be specific during
the appraisal, and will generally be topic-specific given the timeframe of evidence available upon which to
base the appraisal.
Temporary and permanent effects will be considered, acknowledging that these do not always correspond to
the construction and operational phases.
6.3.3 Secondary, cumulative and synergistic effects
The SEA Regulations require the appraisal to consider secondary effects, and the potential for cumulative and
synergistic effects.
‘Secondary effects’ are effects that are not a direct result of the plan, but occur away from the original effect or
as a result of a complex pathway e.g. development that changes a water table and affects the ecology of a
nearby wetland.
‘Cumulative effects’ are those which arise from two or more impacts occurring simultaneously, whereby an
impact that may not have a significant effect on its own may combine with another to produce a cumulative
effect that is significant. There are two main types of cumulative effect relevant to the Local Plan. These are:
intra-plan effects: effects which could result from policies or development sites being taken forward,
whereby the timing of implementation either overlaps to change the severity of an effect (whether to
increase or reduce it), or follows sequentially to prolong an effect; and
inter-plan effects: effects of other strategies, plans or programmes acting in combination with Thurrock’s
Local Plan.
There are three potential outcomes arising from the consideration of cumulative effects. These are summarised
as:
Additive: the simple sum of all the effects (e.g. overcoming community severance in more than one distinct
location);
Neutralising: where effects counteract each other to reduce the overall effect (e.g. a new road on the left
bank of a river encroaches on the floodplain, but equivalent flood storage capacity is provided by another
project on the right bank); and
Synergistic: where effects interact to produce a total effect greater than the sum of the individual effects.
Negative synergistic effects often happen as habitats and resources get close to capacity: for instance a
wildlife habitat can become progressively fragmented with limited effects on a particular species until the
last fragmentation makes the areas too small to support the species at all.
6.3.4 Appraisal of policies and proposals
The appraisal of the Local Plan will consider the potential for policies or proposals in the plan to contribute
towards or conflict with the sustainability objectives, relative to their significant effects on receptors.

65
Determination of significance will take into account the magnitude, duration and permanency of the effect, along
with consideration of potential secondary and cumulative effects.
Policies or proposals which are likely to go a long way towards, or have a major impact on achieving an
objective will receive a major positive (++) rating in the appraisal. Policies or proposals which are likely to
directly conflict with the objective, preventing it or helping to prevent it from being achieved will receive a major
negative (--) rating. Policies and proposals which are unlikely to significantly influence whether or not an
objective will be achieved will receive a neutral (0) rating. It is important to note that positive effects which are
not considered significant could become significant if enhanced through appropriate measures. Similarly,
opportunities for mitigating adverse effects, even if the effects are not considered to be significant, should still
be identified through the SA process where possible.
Those effects that are rated as minor negative, major negative, minor positive or major positive are deemed
significant.
The various ratings and the accompanying definition are provided in Table 6-3.
Table 6-3 : SA Ratings and Definitions
Rating Definition / Rationale
++ Major Positive Policy/ proposal would greatly help to achieve the objective
+ Minor Positive Policy/ proposal would slightly help to achieve the objective
0 Neutral / no effect / effect that is not significant
Policy/ proposal would not significantly affect the objective
- Minor Negative Policy/ proposal would slightly conflict with the objective
-- Major Negative Policy/ proposal would greatly conflict with the objective
6.3.5 Appraisal of potential development sites
The appraisal of sites identified in the Local Plan as having potential to accommodate future development will
be similar to that completed for policies and proposals. The main differences will be in the rationale used to
award ratings (which will be more detailed and incorporate Geographic Information System (GIS) and other
data), and the inclusion of a ‘showstopper’ rating, which may be given to a site which cannot be developed, for
instance if it is already fully developed or is proven to be economically unviable, or would conflict so severely
with an objective that the adverse effects would be unmitigatable.
Economic viability is not a direct consideration of SA as prescribed by the SEA Regulations. It is however a
fundamental consideration of spatial planning, and will be considered separately to, but in conjunction with, the
SA as part of a standalone viability assessment which is being commissioned by the Council.
The ratings and accompanying definitions for appraising sites are provided in Table 6-4. For each relevant topic,
specific effects which would be deemed unmitigatable have been determined.
It is likely that alternative sites will be considered for each settlement; however, it may be the case that all
potential development sites across the borough are considered against one another as alternatives.
Either way, a significant number of alternatives will be appraised, and so there is a need to ensure consistency
and robustness to avoid potential criticism by site objectors (who may be unhappy if a site is shown to perform
favourably relative to alternatives) and promoters (who may be unhappy if a site is shown to perform poorly
66
relative to alternatives). To achieve this consistency, the approach will be to apply quantitative analysis where
possible, with significant effects identified according to the definitions provided in Table 6-4.
In some cases, professional judgement will be used (drawing on a qualitative analysis of issues and baseline
information identified through the scoping stage) to inform the appraisal of significant effects for site alternatives.
This will to a large extent be dependent on which topic is being appraised, as for some topics quantitative data
may not be available or applicable.
Whilst this appraisal methodology represents current thinking, the SA process and the scope of the SA are
sufficiently flexible for them to be adjusted in light of new evidence and when tested in practice.
It is important to note that while the results of the SA are an important consideration in the selection of sites for
development, they are by no means the only consideration. Economic viability, for example, is another key
consideration which falls outside the remit of the SA. A site could perform exceptionally well from an SA
perspective but if it is economically unviable, it is unlikely to be developed, and thus may not be taken forward.

67
Table 6-4 : SA Site
Appraisal
Methodology
Ratings and Definition / Rationale
-- - 0 + ++
Showstopper Major negative Minor negative Neutral / no effect / effect that is not
significant Minor positive Major positive
SA Topic
Site already fully developed / site proven to be
economically unviable / major negative effects that
would be unmitigatable
Major negative effect that could only be mitigated at
significant cost
Negative effect that could be mitigated at minor
cost
Negative effect that could be mitigated at
no cost / no significant effect
Positive effect that would slightly help to achieve the objective
Major positive effect that would greatly help to achieve the objective
Air Quality N/A Development within an
AQMA Development <500m
from AQMA N/A
Change of land use leading to traffic
reduction outside of AQMA
Change of land use leading to traffic
reduction in AQMA
Biodiversity, Flora and Fauna
Site falls within or close to (<200m) an internationally or
nationally designated site (SPA, SAC, Ramsar, SSSI,
NNR)
Site falls within or close to (<200m) a locally
designated site or ancient woodland, or habitat supporting protected
species
Site would lead to loss of green space or adverse
impacts to notable species
N/A
Site would lead to creation of new habitat
or help to support notable species
Site would lead to expansion/ restoration of designated site and support protected or
notable species
Climate Change and Energy
N/A
Development would lead to loss of public or non-
motorised transport infrastructure
Development is totally dependent on private
motor vehicle use
N/A
Development would lead to net improvement
in public or non-motorised user
transport infrastructure or capacity
Development would create new public or non-motorised user
transport infrastructure capacity
Cultural Heritage
Site includes a nationally important historic site or
features (Scheduled Ancient Monument (SAM), Grade I, Grade II* Listed Building)
Development within conservation area, within 200m of SAM, Grade I or
II* Listed Building or Registered Park or
Garden, or site includes a Grade II Listed Building
Development within 200m of Grade II Listed Building or conservation
area, or includes a locally listed heritage feature
N/A
Development would improve the setting of a
conservation area, Grade II Listed Building or Registered Park or
Garden, or improve any locally listed heritage
feature
Development would lead to removal of
feature from 'at risk' register, or improve the
setting of a SAM, Grade I or II* Listed
Building or Registered Park or Garden

68
Flood Risk Site falls within a functional floodplain (flood risk zone
3b)
Site or all site access routes fall within a flood
risk zone 3a
Site or all site access routes fall within a flood
risk zone 2
N/A Development would contribute to existing
flood risk management
Development would alleviate existing flood
risk, e.g. increased flood storage
Geology and Soils
Within or less than 200m of a SSSI, ground proven to be
unstable
On heavily contaminated site, e.g. historic landfill, or loss of ALC grade 1 or
2 soils
On contaminated site or loss of ALC grade 3-5
soil
N/A Development would remediate existing contaminated land
Development would remediate existing
heavily contaminated land
Landscape, Townscape and Visual Impacts
No AONBs in Thurrock Development within high
sensitivity landscape character area
Development within moderate sensitivity
landscape character area
N/A Development would
improve landscape/townscape
character
Development would improve a high
sensitivity landscape character area, e.g. redevelopment of
brownfield site
Materials and Waste
Within or adjacent to authorised landfill.
Unmitigatable loss of waste/ mineral capacity
Within or adjacent to designated mineral site
or waste facility
Within 250m of designated mineral site
or waste facility
N/A Development would
reduce distance waste travels (i.e. below average distance)
Development will provide additional
waste management capacity
Noise N/A
Development within 50m of sensitive noise
receptor or major source of existing noise (e.g. schools, care homes)
Development within 50m of noise receptor (e.g.
residential or commercial properties)
N/A
Development will reduce the number of
receptors (e.g. residential or
commercial properties) affected by noise
Development will reduce noise on
sensitive receptors (e.g. schools, care
homes)
Water Resources and Quality
Unmitigatable constraint on water sewerage or supply
capacity
Development within 200m of WFD water body
Development within 200m of any water body
N/A Development would
restore or improve the quality of a water body
Development would restore or improve the quality of a WFD water
body
Economy and Employment
N/A
Development would lead to net loss of key source of local employment or employment land, e.g.
tourism site
Development would lead to net loss of employment
or employment land
N/A Development would lead to net gain of
employment or employment land
Development would lead to net gain of key
source of local employment or
employment land

69
Education and Skills
N/A Development would put unmitigatable pressure
on existing capacity
Development would put pressure on existing
capacity
N/A
Development would create additional capacity in areas
without existing capacity issues
Development would create additional
capacity in areas with existing capacity issues
Housing N/A
Would lead to loss of housing in an area with high barriers to housing
according to the IMD (less than 40%)
Would lead to loss of housing in an area with low barriers to housing
according to the IMD (40-100%)
N/A
Development would provide housing in an area with high barriers to housing according to the IMD (less than 40%)
Development would provide affordable
housing in an area with high barriers to housing
according to the IMD (less than 40%)
Deprivation N/A
Would lead to deprivation in an area of high
deprivation (less than 40%)
Would lead to deprivation in an area of
low deprivation (40-100%)
N/A
Development would lead to a reduction in
deprivation in an area of low deprivation (40-
100%)
Development would lead to a reduction in deprivation in an area
of high deprivation (less than 40%)
Equalities N/A
Development would have differential adverse
impacts on one or more groups of people who
share protected characteristics
Development would have disproportionate adverse impacts on one or more groups of people who
share protected characteristics
N/A
Development would create disproportionate benefits for a group of
people who share protected
characteristics
Development would create disproportionate and differential benefits for group(s) of people who share protected
characteristics
Crime N/A
Development within or adjacent to area of high
crime deprivation (0-20%)
Development within or adjacent to area of some
crime deprivation (20-40%)
N/A Redevelopment and removal of dereliction
Redevelopment and removal of dereliction in
area with high crime rates
Pollution and Health
N/A
Development would result in major air, water
or noise pollution, or major land contamination
Development would result in some air, water
or noise pollution, or land contamination
N/A
Development would slightly reduce air, water
or noise pollution or result in some
remediation of land contamination
Development would greatly reduce air,
water or noise pollution, or result in remediation of land contamination
Physical Activity and Obesity
N/A
Loss of existing recreational resource,
e.g. green/open space or NMU infrastructure
Degradation or loss of capacity of existing
recreational resource, e.g. green/ open space or
NMU provision
N/A
Improvement of existing recreational resource, e.g. green/open space or NMU infrastructure, or would encourage
active transport
Creation of new recreational resource, e.g. green/open space
or new NMU infrastructure, or would
greatly encourage active transport

70
Access to Services and Facilities
N/A
Would lead to loss of service or facility, or put unmitigatable pressure on existing capacity in
area of poor accessibility
Would or reduce access to services and facilities,
or put pressure on existing capacity
N/A
Would improve access to key services and facilities, including
through increases in capacity
Would improve access to key services and facilities, including
through increases in capacity in an area of poor accessibility, e.g. as measured by IMD
Transport Safety Development access would
depend on unmitigatable accident hotspots
Development would exacerbate existing
transport safety issues
Development would potentially create new transport safety issues
N/A Development would
reduce existing transport safety issues
Development would fully resolve existing
transport safety issues
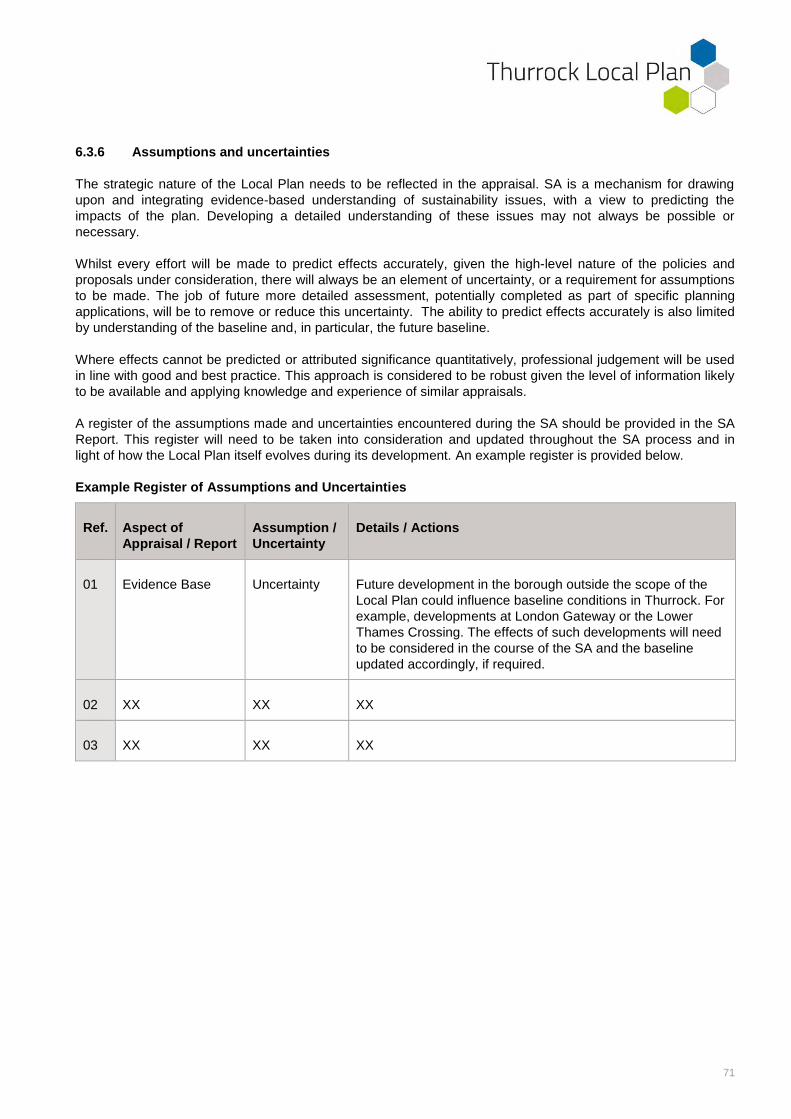
71
6.3.6 Assumptions and uncertainties
The strategic nature of the Local Plan needs to be reflected in the appraisal. SA is a mechanism for drawing
upon and integrating evidence-based understanding of sustainability issues, with a view to predicting the
impacts of the plan. Developing a detailed understanding of these issues may not always be possible or
necessary.
Whilst every effort will be made to predict effects accurately, given the high-level nature of the policies and
proposals under consideration, there will always be an element of uncertainty, or a requirement for assumptions
to be made. The job of future more detailed assessment, potentially completed as part of specific planning
applications, will be to remove or reduce this uncertainty. The ability to predict effects accurately is also limited
by understanding of the baseline and, in particular, the future baseline.
Where effects cannot be predicted or attributed significance quantitatively, professional judgement will be used
in line with good and best practice. This approach is considered to be robust given the level of information likely
to be available and applying knowledge and experience of similar appraisals.
A register of the assumptions made and uncertainties encountered during the SA should be provided in the SA
Report. This register will need to be taken into consideration and updated throughout the SA process and in
light of how the Local Plan itself evolves during its development. An example register is provided below.
Example Register of Assumptions and Uncertainties
Ref. Aspect of
Appraisal / Report
Assumption /
Uncertainty
Details / Actions
01 Evidence Base Uncertainty Future development in the borough outside the scope of the
Local Plan could influence baseline conditions in Thurrock. For
example, developments at London Gateway or the Lower
Thames Crossing. The effects of such developments will need
to be considered in the course of the SA and the baseline
updated accordingly, if required.
02 XX XX XX
03 XX XX XX

72
7. Conclusions and next steps
7.1 Conclusions and next steps
This Sustainability Appraisal (SA) Scoping report is being consulted on in February to April 2016 (see the
introduction of this report for specific dates). Representations received from interested parties and the public
will be documented, considered and used to shape the SA of Thurrock’s emerging Local Plan.
It is important to note that the scope of the appraisal will remain sufficiently flexible to respond to ongoing
changes to the Local Plan, as well as potential changes to the baseline. For example, major developments
outside the remit of the plan such as the Lower Thames Crossing could significantly alter the baseline in
Thurrock, and thus influence both the content and the effects of the Local Plan.
Following consultation on the SA Scoping Report, the SA will be completed using the established SA
Framework. The appraisal guide questions, which form part of the framework, cover a range of indicators which
will be used to identify likely ‘significant effects’ of the Local Plan on the projected baseline in Thurrock, drawing
on the key sustainability issues which have been identified and the evidence base that has been assembled.
This will fulfil Stage B of the SA process as shown in Figure 2-1.
The results of the appraisal of the Local Plan and reasonable alternatives will be reported in an SA Report
(Stage C of the SA process), which will be published alongside the draft Local Plan for public consultation
(Stage D). A proposed structure for the SA Report is set out below.
Following the public consultation, representations received will be taken into account in finalising the SA Report
and in developing a Post-Adoption Statement. This statement will demonstrate how the findings of the SA have
been incorporated into the Local Plan. A monitoring programme to monitor effects of the plan during its
implementation will also be included in the Post-Adoption Statement.
Preparation and issuing of a Post-Adoption Statement is the final stage in the SA process (Stage E).
7.2 Proposed SA Report structure
1. Introduction
2. Thurrock’s Local Plan
3. Scope of the SA
4. Methodology and Approach
5. Review of Plans, Policies and Programmes
6. Baseline Information and Sustainability Issues
7. SA Framework
8. Appraisal of the Local Plan and reasonable alternatives
a. Policies
b. Site allocations
9. Mitigation and enhancement measures
10. Proposed Monitoring
Appendices

Growth & Strategy Team
growth&[email protected]
Planning and Growth Planning and Transportation Civic Offices, New Road Grays, Essex RM17 6SL
The consultation on this document runs fromFriday 26 February to 5pm Monday 11 April 2016