sustainability: the link to pollution prevention
TRANSCRIPT

BP Canada EnergySustainability: The link to Pollution Prevention

Developing Society
Social
Environmental Financial
Alleviate povertyProtect environmentDefend human rights

Current Reality & Vision
Doing the Minimum Business-as-usual
Current Reality
Current Steps
Vision
Legal Compliance
•EMS - ISO 14001•Environmental targets •Stakeholder Dialogue•Community Involvement•Reporting
Corporate citizenshipRole in societyTransparencyHolistic
Strategic B
usiness Assessm
ents
•Env Impact Assessments
Hydrocarbons Energy
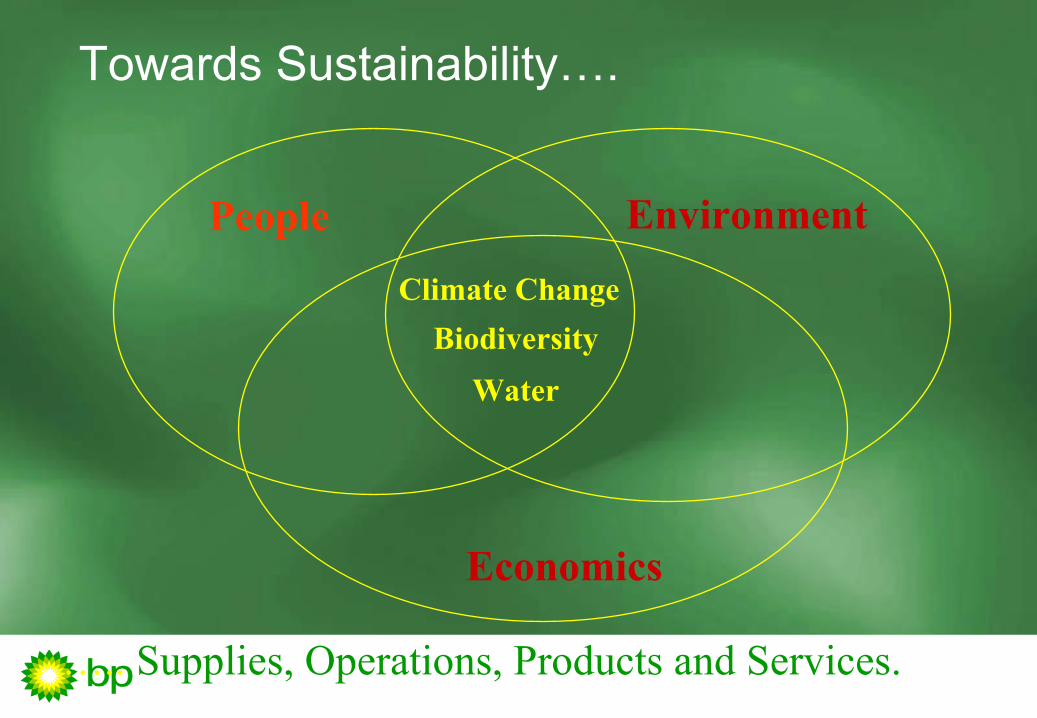
Towards Sustainability….
Climate Change
Biodiversity
Water
People
Economics
Environment
….. Supplies, Operations, Products and Services.
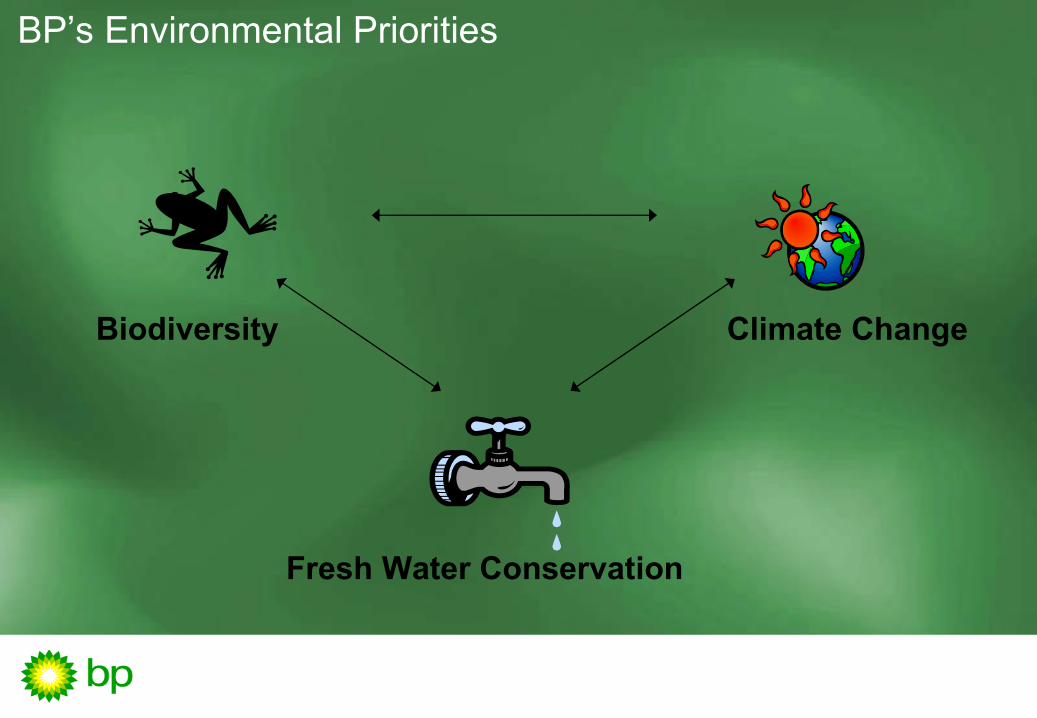
BP’s Environmental Priorities
Fresh Water Conservation
Biodiversity Climate Change

Examples of Interactions
Climate ChangeClimate Change
Biodiversity Water
….. Supplies, Operations, Products and Services.
DesertificationSpecies migrationHabitat destruction
FloodsSea level riseDesertification
DeforestationWater Quality
FootprintResource use
Emissions/discharges
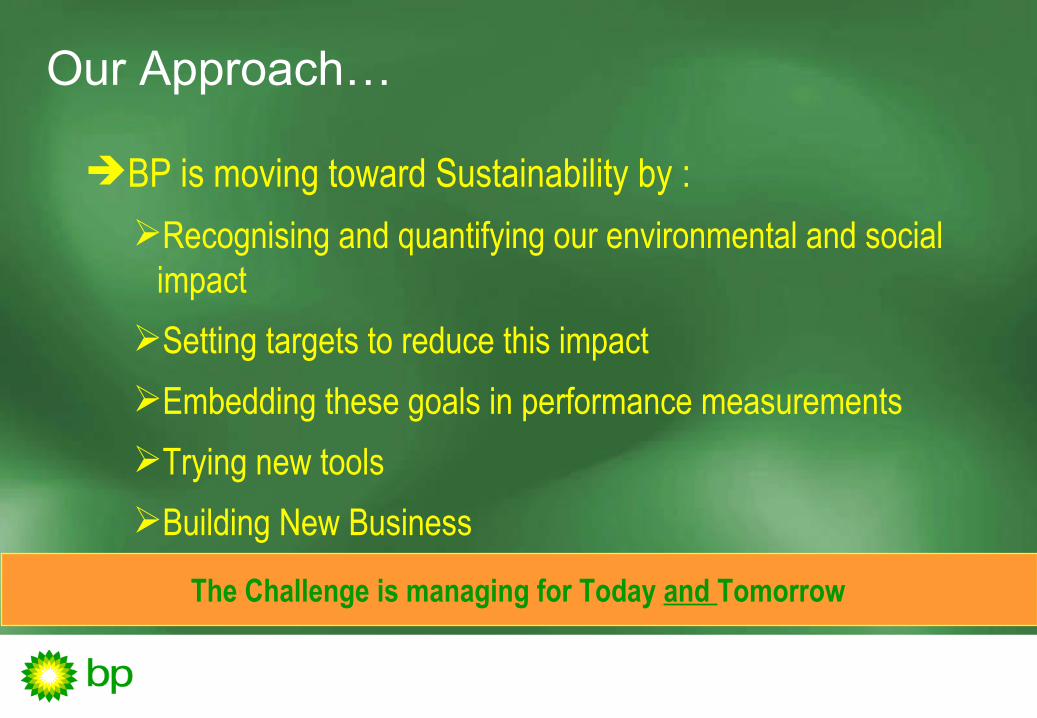
Our Approach…
BP is moving toward Sustainability by :
Recognising and quantifying our environmental and social impact
Setting targets to reduce this impact
Embedding these goals in performance measurements
Trying new tools
Building New Business
Learning from othersThe Challenge is managing for Today and Tomorrow
BP’s Environmental Story
Climate Change Strategy
Biodiversity Strategy
Water Strategy
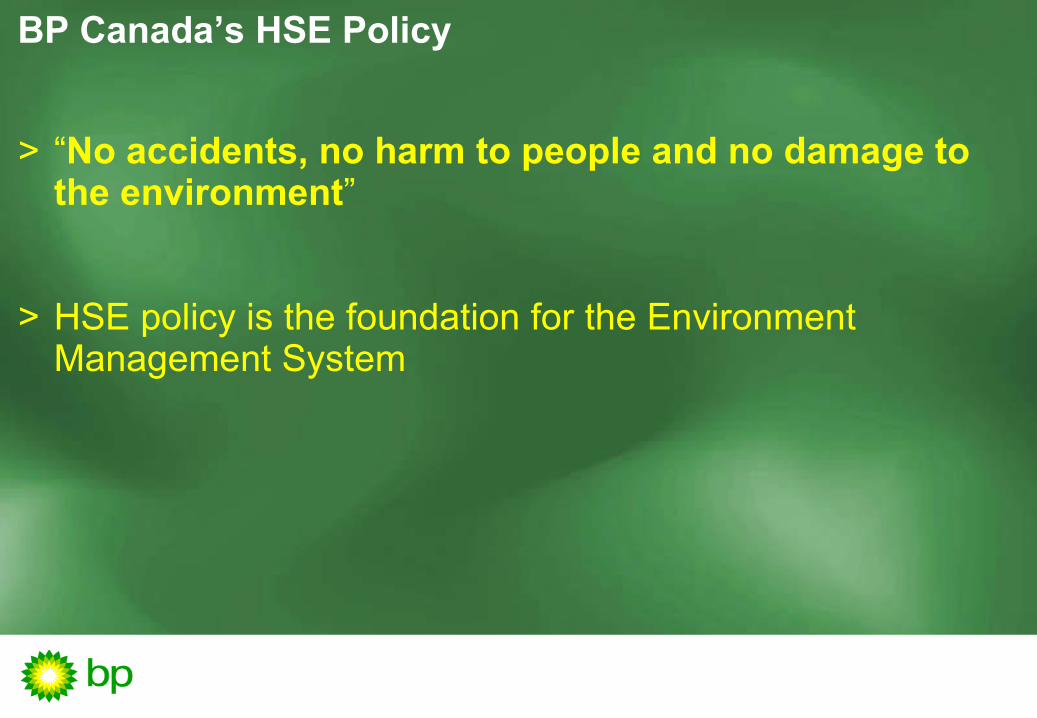
BP Canada’s HSE Policy
> “No accidents, no harm to people and no damage to the environment”
> HSE policy is the foundation for the Environment Management System
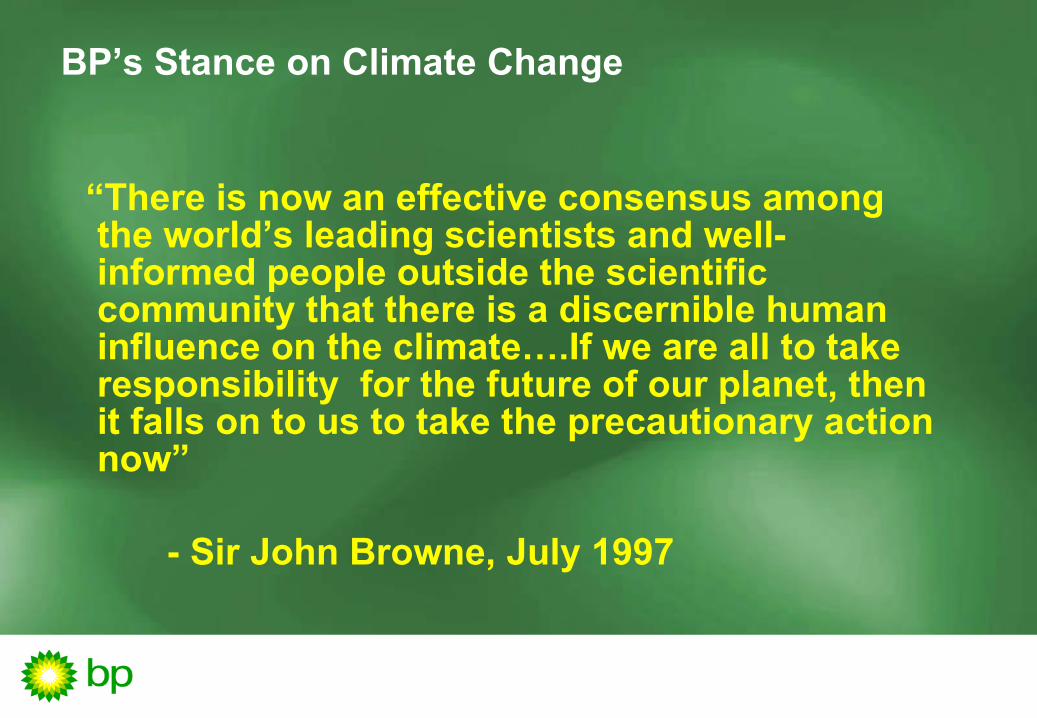
BP’s Stance on Climate Change
“There is now an effective consensus among the world’s leading scientists and well-informed people outside the scientific community that there is a discernible human influence on the climate….If we are all to take responsibility for the future of our planet, then it falls on to us to take the precautionary action now”
- Sir John Browne, July 1997

200
220
240
260
280
300
320
340
1000 1100 1200 1300 1400 1500 1600 1700 1800 1900 2000
Atmospheric COAtmospheric CO22
Source: Etheridge, D.M., Steele, L.P., Langenfelds, R.L., Francey, R.J., Barnola, J.-M. and Morgan V.I. 1998.
CO
p
pm
2

Observed Global Temperatures
1860 1880 1980 200019201900 19601940
-0.8
-0.2
-0.4
-0.6
0.2
0.0
0.4
0.6
Source: Intergovernmental Panel on Climate Change
Te
mp
erat
ure
Ch
ang
e (D
eg
rees
C)
Sea Surface
Land Surface

Vehicle numbers are rising dramatically
0
100
200
300
400
500
600
700
1945 1955 1965 1975 1985 1995
Cars Buses and Trucks

World Energy Consumption Projection
0
100
200
300
400
500
600
1990 1995 2000 2005 2010 2015
Qu
adri
llio
n B
tu
Source: International Energy Agency

GHG from Fossil Fuels
Production and Processing Transmission Combustion
2.4%9.2% 88.8%
Agriculture
Residential
CommercialOther
Transportation
IndustrialFossil Fuel Production
Natural Gas Production
Power Gen
Canada’s GHG Emissions
9090
100100
110110
120120
8989 9090 9191 9292 9393 9494 9595 9696 9797 9898
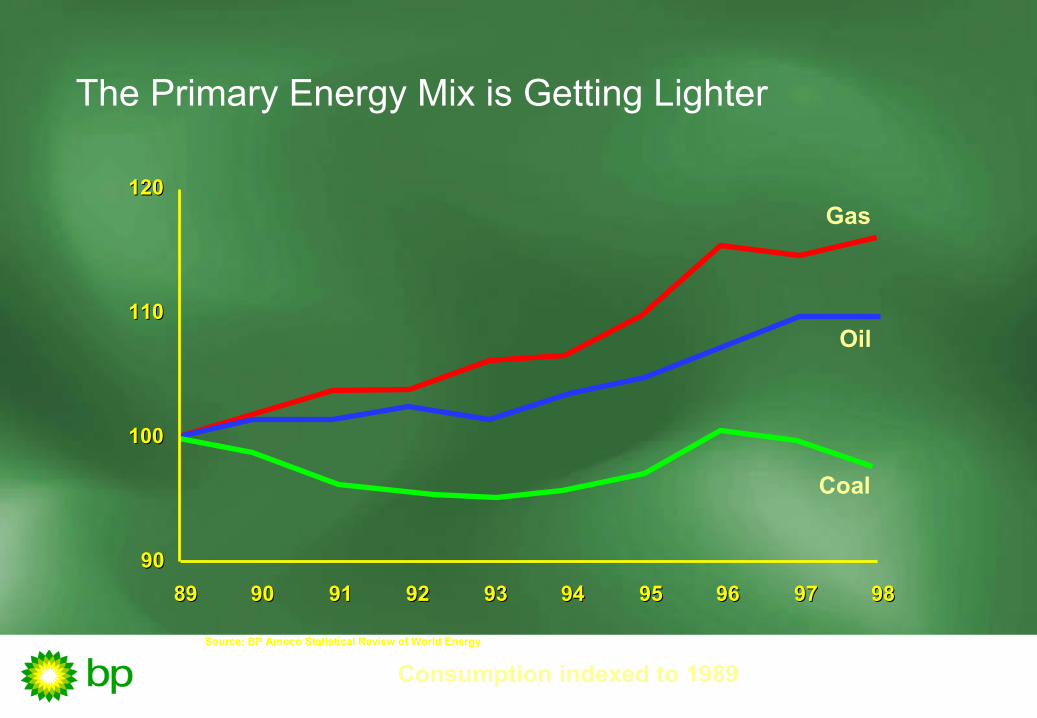
The Primary Energy Mix is Getting Lighter
Source: BP Amoco Statistical Review of World Energy
Consumption indexed to 1989
Gas
Oil
Coal

BP’s Commitment
> 10% reduction in direct, equity share greenhouse gases from 1990 level by 2010
> Group wide trading by January 2000
“In our terms that target will now sit alongside our financial targets. That means it is a promise and, as with our financial targets, a promise is a personal commitment”
Sir John Browne Yale School of Management, Sept 18 1998

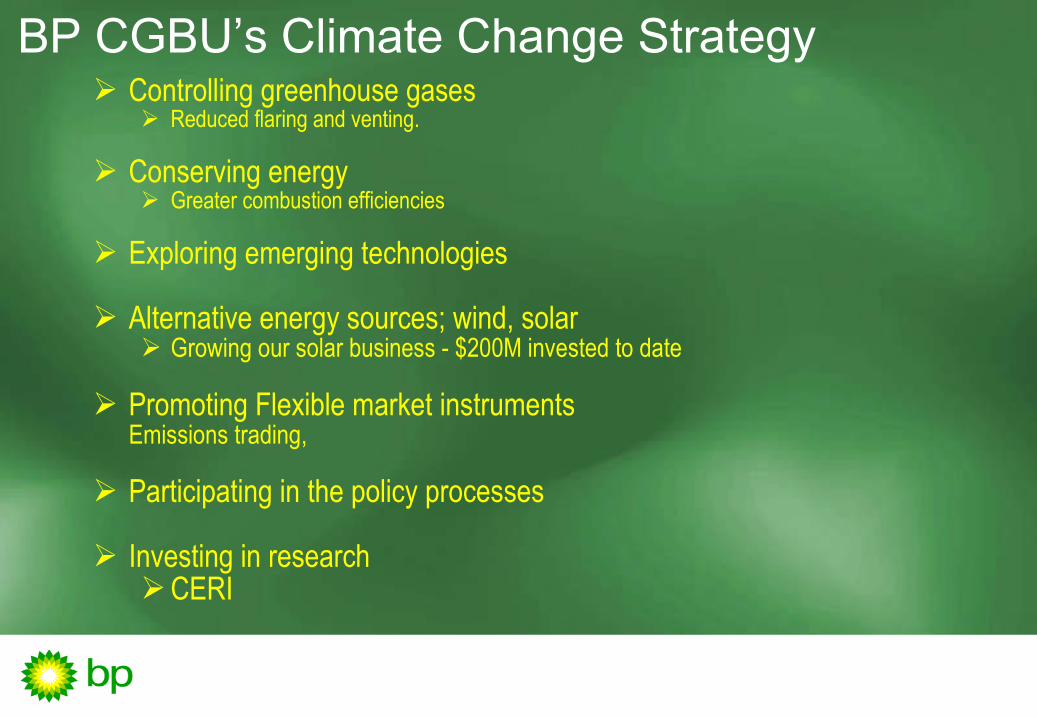
BP CGBU’s Climate Change Strategy Controlling greenhouse gases
Reduced flaring and venting.
Conserving energy Greater combustion efficiencies
Exploring emerging technologies
Alternative energy sources; wind, solar Growing our solar business - $200M invested to date
Promoting Flexible market instruments
Emissions trading,
Participating in the policy processes
Investing in researchCERI
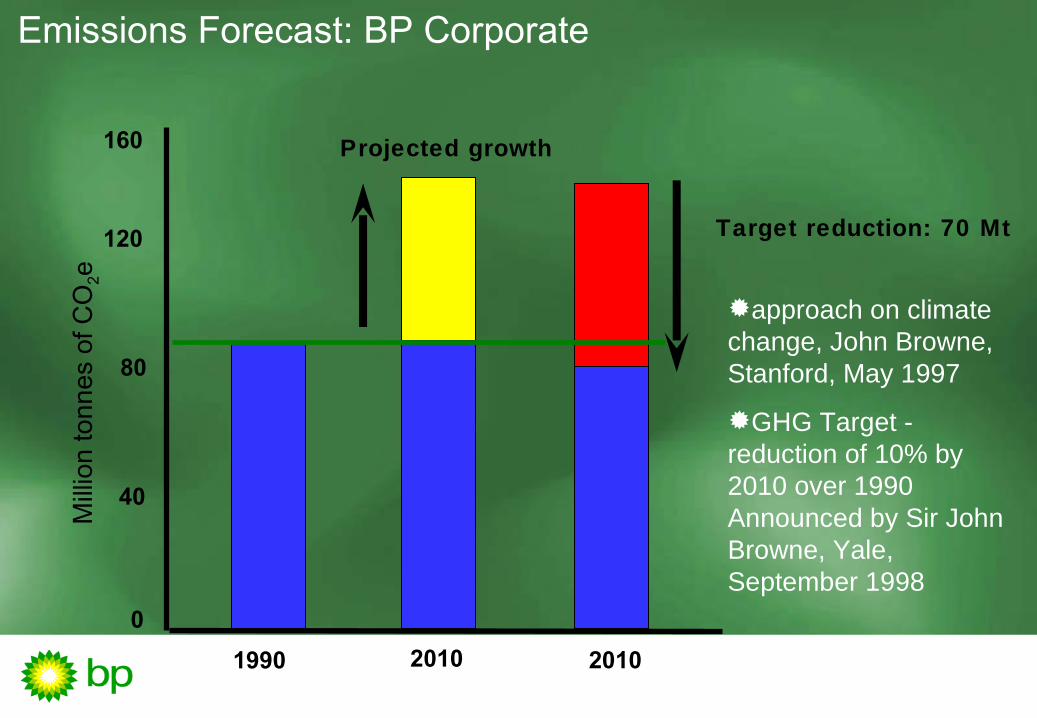
Emissions Forecast: BP Corporate
1990
120
80
40
0
Milli
on to
nnes
of C
O2e
Projected growth
2010
Target reduction: 70 Mt
2010
160
approach on climate change, John Browne, Stanford, May 1997
GHG Target - reduction of 10% by 2010 over 1990 Announced by Sir John Browne, Yale, September 1998

GHG Targets and Delivery
> Each business unit is given specific annual “allocation” which states what they can emit. (approximately a 4% reduction from the previous year)
> Two options to meet allocation>“Organic” GHG reductions>Purchase from the emissions trading system
>monies spent on emissions trading deducted from net income of the BU

CGBU GHG Targets
> Net reduction of 310,000 tonnes
> Organic reduction of 80,000 tonnes
> Balance of 230,000 tonnes by emission credits

BP Canada EnergyOrganic GHG Reductions: Compressor Retrofits
> BP Canada Energy operates approximately 275 gas fired engines> Represent 45% of our GHG emissions> Many older engines – “rich burn” combustion
> Rich burn turbo charged engines can be retrofit with air fuel ratio controls to improve the completeness of recovery:> Reduced fuel consumption> Improved reliability> Reduced emissions (CO2 and NOx)

GHG Reductions: Compressor Retrofits Results
> To date, 23 engines have been retrofit, 20 more planned for 2001
Average Improvements> Fuel savings of 12 – 15%> NOx reduction of 60%> CO2 reduction of 10 -12%> CO reduction of 97%

GHG Reductions: Well Test Flaring Results
19981999
20002001
Flaring (e3 m3/well)
Target (e3 m3/well)0
10
20
30
40
50
60
70
80
90

Emissions Trading System
> Annual cap and trade system
> BU’s which are able to reduce GHG below their annual allocation may sell credits to BU’s unable to cost effectively meet their GHG allocation.
> Emissions trading system has placed a value on the cost of one tonne of carbon dioxide equivalent – allowing for incorporation of environmental “costs” into project economics and evaluation

Emissions Trading – What we have learnt
Putting a value on greenhouse gases has:
Raised awareness of the climate change issue
Created innovative business strategies to find cost effective solutions
Enabled us to quantify financially the GHG implications of investment decisions - “value” on the environment
Our objective is to create a BP system that provides an accurate price signal of the value of GHGs in an external world

Emission Trading: $ (USD)/ tonne per year
0
5
10
15
20
25Ja
n-00
Mar
-00
May
-00
Jun-
00
Sep
-00
Nov
-00
Dec
-00
Feb
-01
Apr
-01
$(U
SD
)/to
nn
e

BP Canada Gas Business Unit GHSER Environmental Management System
> EMS based on ISO 14001 Standards
> Allows BP to systematically identify, focus, and create environment management programs
> Priorities are:> emission, spill, waste reductions> reduced footprint

HSE Policy
Planning- Environmental aspects
- Legal & other requirements- Objectives & targets- Env. mgmt program
Implementation & Operation- Structure and responsibility
- Training, awareness & competence- Communication- EMS documentation- Document control- Operational control- Emergency preparedness & response
Monitoring & Corrective Action- Monitoring & measurement
- Non-conformance, corrective & preventive action- Records- EMS audit
Management Review
An Environmental Management System
Continual Improvement
A snapshot of BP Canada’s Environment Management System
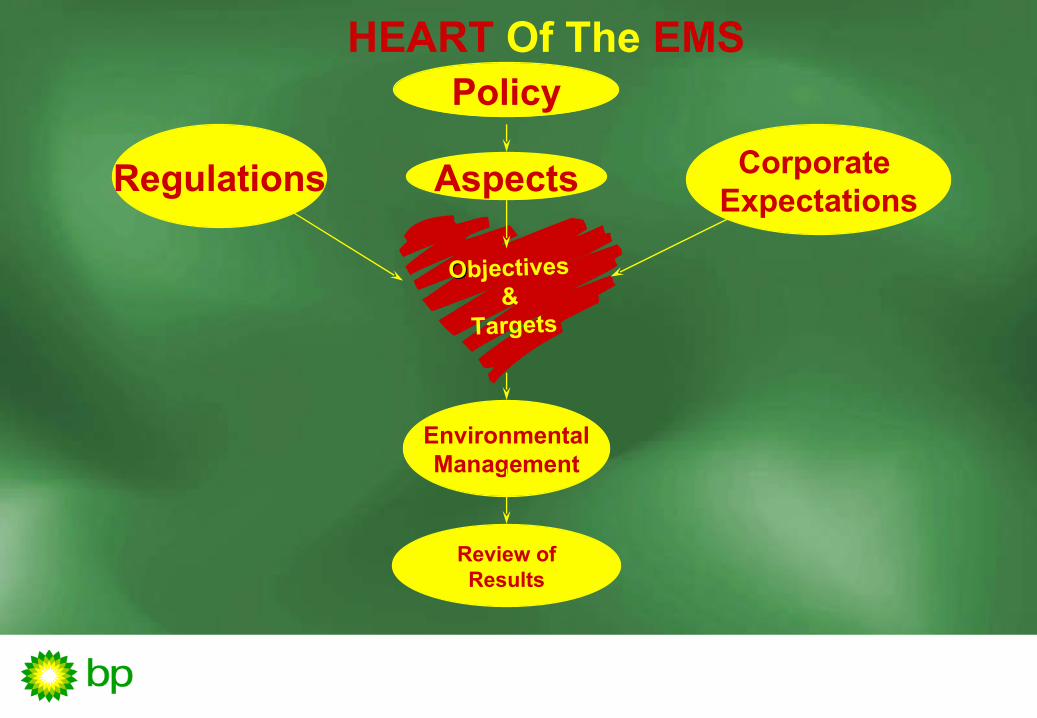
OObjectives&
Targets
HEART Of The EMSPolicy
AspectsRegulations Corporate Expectations
EnvironmentalManagement
Review ofResults

HSE Policy
Objectives & Targets on:-Greenhouse Gas Reduction--Spills reduction--Biodiversity--Flaring
PLAN
Environment Management Programs for Objectives and Targets
DO -Scorecard-Monitoring and Measurement
Management Review
IMPROVE
Key Components of Gas Business Unit’s Environmental Focus in 2001
CHECK
ACT

LCVA - An Eco-efficiency Tool
Life-cycle value assessment:
a business analysis and decision-making tool that combines potential environmental and social impact information for the full life-cycle of a product or system, with financial cost-benefit information, for better decisions.
Pembina Institute for Appropriate Development

Eco-efficiency
Eco-efficiency =
amount of resource inputs and/or pollution outputs
amount of useful product or service produced
is about getting the most for the least material and energy inputs, and least environmental outputs.
Pembina Institute for Appropriate Development

Use and Service
2.2 Develop Process Flow Maps
Product Purchase &
System Assembly
Material or Product
Manufacture
Raw Material Extraction
Planning / Approval / Administration
Retirement & Disposal
Recycling / Re-manufacturing / Reuse
Pembina Institute for Appropriate Development

Production Inputs and Outputs
RawMaterials
EnergyWater
Air EmissionsProductionActivity orServiceProcess
Undesired OutputsInputs
Water Effluents
Land Wastes
Land, WildernessWildlife Loss
Aesthetic Impacts
Jobs / Profit for producers
Desired Outputs
Product / Service for Consumer
By-products
Other:capital, labourinformationtechnologyetc.
Pembina Institute for Appropriate Development

LCVA Methodology
1. GoalDefinition
4. ImpactAnalysis
2. Scoping3. InventoryAssessment
ImprovementAssessment
6. DecisionMaking/Use
5. ImprovementAssessment
Pembina Institute for Appropriate Development

Thinking Life-Cycle:
Raw MaterialAcquisition
MaterialManufacture
Product Purchase
Use and Service
RetirementDisposal
upstream
Can I Select a Product or Process ...
that... downstream> reduces land damage> reduces raw material use> reduces energy & transportation> reduces environmental releases
> increases life span> increases reusability and
recyclability
Pembina Institute for Appropriate Development


LCVA - Kaybob Sulphur Project
> The goal: dispose of 300 M tonnes sulphur soil
> 1. Haul to commercial landfill
> 2. Construct on-site PBCC
> 3. Develop separation technology (flash distillation)

Environmental Stressor Categories
> GHG> CO2, methane, N2O
> Acid Deposition Precursors (ADP)> SO2, NOx
> Ground Level Ozone Precursors (GLOP)> NOx + VOC
> Particulate Matter> PM10 PM2.5
> Footprint> Hectares of land
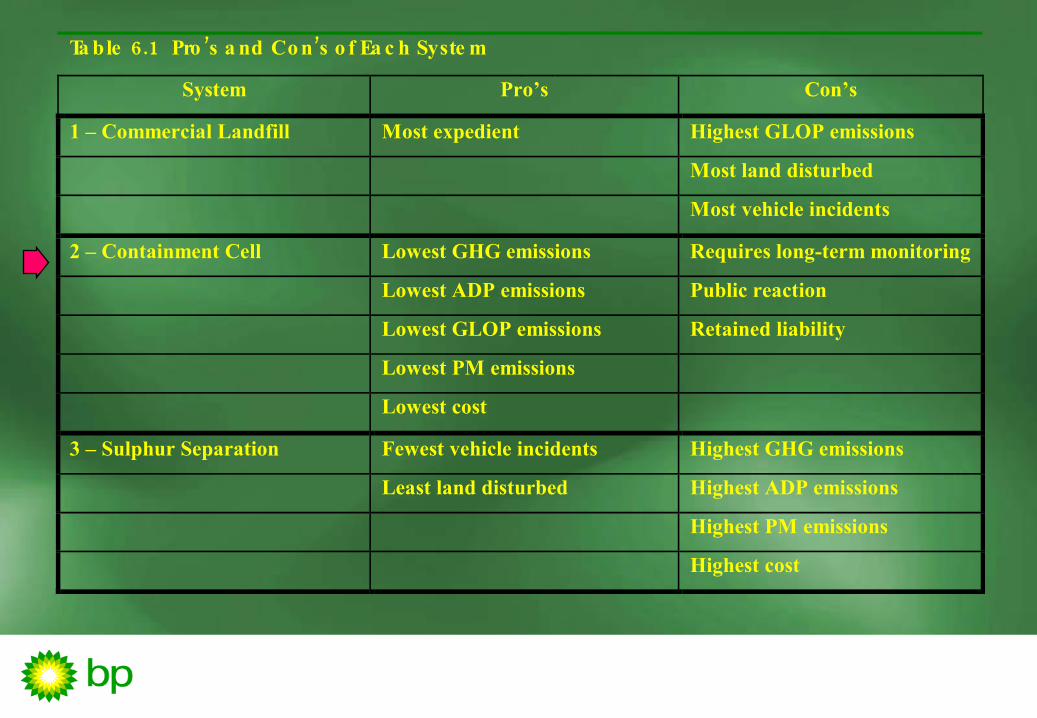
6.1 ’ ’ Ta ble Pro s a nd Co n s o f Ea c h Syste m
System Pro’s Con’s
1 – Commercial Landfill Most expedient Highest GLOP emissions
Most land disturbed
Most vehicle incidents
2 – Containment Cell Lowest GHG emissions Requires long-term monitoring
Lowest ADP emissions Public reaction
Lowest GLOP emissions Retained liability
Lowest PM emissions
Lowest cost
3 – Sulphur Separation Fewest vehicle incidents Highest GHG emissions
Least land disturbed Highest ADP emissions
Highest PM emissions
Highest cost

Towards Sustainability….
Climate Change
Biodiversity
Water
People
Economics
Environment
….. Supplies, Operations, Products and Services.

Most significant drivers for pollution prevention
> Corporate expectations and leadership by CEO (Sir John Brown)
> Environmental Management System (ISO 14001 certified)
> Inclusion of external stakeholder perspectives