sustainability — what matters?€¦ · sustainability — what matters? published by . governance...
TRANSCRIPT

sustainability — what matters?
published by Governance & Accountability Institute, Inc. 845 Third Avenue, Suite 644 New York, New York 10022
646.430.8230 [email protected] www.ga-institute.com

sustainability — what matters?
2014 | published by
Governance & Accountability Institute, Inc. 845 Third Avenue, Suite 644 New York, New York 10022
646.430.8230 [email protected] www.ga-institute.com
authors and architects
Hank Boerner — Chairman, Chief Strategist and Co-Founder Governance & Accountability Institute, Inc.
Louis D. Coppola — Executive Vice President and Co-Founder Governance & Accountability Institute, Inc.
primary researchers
Laura Ana Jardieanu Santiago Viteri
Sustainability – What Matters? | Governance & Accountability Institute, Inc.
sustainability — what matters? Table of Contents
OVERVIEW page 1 Most Material | Least Material In Reporters' Views 2 Background | Sustainability Reporting Trends 3 Materiality 4 Timing 5 Methodology 6
• Scoring 6
• Sectors 7
• Sector Scoring 8
• Sector Difference Scores 8
• Additional Categories and Aspect Ranks 9 And Now The Results | Top 10 / Bottom 10 9
SECTORS
Agriculture 10
Automotive 15
Aviation 20
Chemicals 25
Commercial Services 30
Computers 35
Conglomerates 40
Construction 45
Construction Materials 50
Consumer Durables 55
Energy 60
Energy Utilities 65
Equipment 70
Financial Services 75
Food and Beverage 80
Forest and Paper 85
Healthcare Products 90
Healthcare Services 95
Household and Personal Products 100
Logistics 105
Media 110
Metals Products 115
Mining 120
Public Agency 125
TABLE OF CONTENTS
Sustainability – What Matters? | Governance & Accountability Institute, Inc.
SECTORS continued Railroad 130
Real Estate 135
Retailers 140
Technology Hardware 145
Telecommunications 150
Textiles and Apparel 155
Tobacco 160
Travel and Tourism 165
Universities 170
Waste Management 175
Water Utilities 180
All Sectors 185
CUSTOMIZED RESEARCH AVAILABLE 193 All 84 Indicator Rankings by GRI Defined Sector 195 Sector Reports | with Detailed Company by Company Disclosure Results 195 Company Disclosure Materiality Check Report 196 Selected Indicator Reports 196 Other Customization Options 197 Other Choices 197
AUTHORS AND RESEARCHERS 198 Authors & Architects • Hank Boerner 199 • Louis D. Coppola 200
Team Contributors • Amy Gallagher 201 • Peter M. Hamilton 202
Lead Researchers • Laura Ana Jardieanu 203 • Santiago Viteri 204
Supporting Researchers • Eli Bach 205 • Jamie Reinhardt 205
ABOUT GOVERNANCE & ACCOUNTABILITY INSTITUTE, INC. 206 Consulting, Strategy and Research Services 206 GRI's Exclusive US, UK and Ireland Data Partner 208 Communications Background and Services 209 Investor Network Background and Services 210 Research Reports 211 Services and Resources Highlights 212

sustainability — what matters? Overview
Governance & Accountability Institute is pleased to present the highlights of its comprehensive "Sustainability - What Matters?" research project examining GRI G3 and G3.1 sustainability reports published in 2012. This research project encompasses 1,246 organizations that utilized the Global Reporting Initiative (GRI) Framework, and studies their level of disclosure on all 84 key performance indicator disclosures. The results are further refined into a set of indicator scores for each of 35 GRI-defined sectors. The objective of this report is to serve as a starting point for discussion and planning around sector-specific materiality — as seen through the lens of these 1,246 reporting organizations as well as the lens of their respective stakeholders. What is important to keep in mind: most companies and institutions utilizing the GRI Framework for their ESG and structured reporting conduct materiality reviews. That is, what is the material information for disclosure by management, and what are the expectations of the stakeholders, and their views of materiality (and the specific material information that they expect to be disclosed). And so, our assumption is that the material information and data about an organization in terms of economic, environmental and social (or societal) strategies, policies, performance, achievements, engagements, and so on, are reflected in the information that reporters choose to include in their report.

OVERVIEW
Sustainability – What Matters? | Governance & Accountability Institute, Inc.
MOST MATERIAL | LEAST MATERIAL IN REPORTERS' VIEWS The highlights of our findings consisting of the top 10 and bottom 10 performance indicators for organizations in each of the 35 sectors, as well as select quotes from senior executives of reporting organizations, are presented to you in this report. We also include basic data on the reports included in the research. The indicators were converted from the G3 and G3.1 guideline indicators to the newly-released G4 framework indicators in order to enable forward-looking discussions and planning. This important conversion is intended to be an aid for corporate and institutional managers planning their transition to G4, or, the start of reporting using G4 as the foundational framework. Additional data on the other 64 indicators, as well as customized reports tailored to specific needs of companies, and many other variables (including geography, report, and organization specifications) are available for purchase from G&A Institute. Please see the detailed information about the options that are available at the end of this report.
Page 2
OVERVIEW
Sustainability – What Matters? | Governance & Accountability Institute, Inc.
BACKGROUND | SUSTAINABILITY REPORTING TRENDS Over the past decade, the pace of corporate disclosure and reporting of an organization’s “sustainability journey” has dramatically accelerated. Whether the structured report is titled sustainability, responsibility, citizenship, or environmental, the company's ESG performance is on display for stakeholders, including shareholders and others in the investment community.
ESG = Environmental, Social / Societal and Corporate Governance Performance
In 2011 and 2012, our research was based on the open question — "Sustainability - Does it Matter?" (We concluded that it does matter; that is, corporate reporting matters to the capital markets, to employees, to customers, to influential third parties and other stakeholders.) Our findings determined a strong association with sustainability reporting and positive effects on the reputation and valuation of organizations that are reporting versus their peers who are not. Further, we found that organizations using the GRI framework to report enjoyed an additional boost in benefits than organizations reporting but not utilizing the GRI framework. Our recent research shows that 72% of the S&P 500 Index companies reported in 2013. Our 2012 research effort also established for the first time that a majority of the companies in the S&P 500 Index (53%) and in the Fortune 500 (57%) were reporting on their ESG performance. (Therefore, companies not reporting were for the first time in the minority - which is a rapidly shrinking minority.) To put this growth in context only 20% were found to be reporting in our 2011 research. The U.S.A. has a very large universe of potential reporters — some 14,000 entities file some kind of report on financial results. There are 3,000 companies in the Russell 3000 Index, which represents more than 90 percent of the U.S. investable market. Despite being the country with the highest number of corporate entities that issue GRI reports, the U.S. was often seen as lagging other countries in ESG reporting as a percentage of the total possible reporters.
Page 3
OVERVIEW
Sustainability – What Matters? | Governance & Accountability Institute, Inc.
MATERIALITY The large question posed to reporters now (with a greatly increased volume of both number of reports and content of reports):
In corporate sustainability reporting, What is Material?
That is the question!
Having established that reporting "does matter" in our previous two research reports, our next focus was... "what matters?" What are the material ESG and economic aspects of organizations that insiders (boards, senior executives, managers), and external stakeholders (customers, employees, investors, NGOs, academics, and others) feel is most important to measure, manage, and disclose in the form of a report? We broadened our research to look globally — since most companies operate in a global economy — researching the reporting activities of 1,246 organizations worldwide. The Global Reporting Initiative (GRI) is the de facto standard favored by most large-cap multinational enterprises (both publicly and privately-owned, or state-owned). An integral part of the GRI framework is the implementation of a rigorous materiality process to determine report content and select indicators for disclosure. As part of this required process every GRI reporting organization applying the framework must engage with internal and external stakeholders, and consider in that dialogue what issues, categories, aspects, and specific GRI key performance indicators are considered by these stakeholders to be material. Taking this required process into account we conclude that there is much to learn from the 1,246 organizations that reported in 2012 — and we present to you the highlights of what we have learned in the pages that follow.
Page 4
OVERVIEW
Sustainability – What Matters? | Governance & Accountability Institute, Inc.
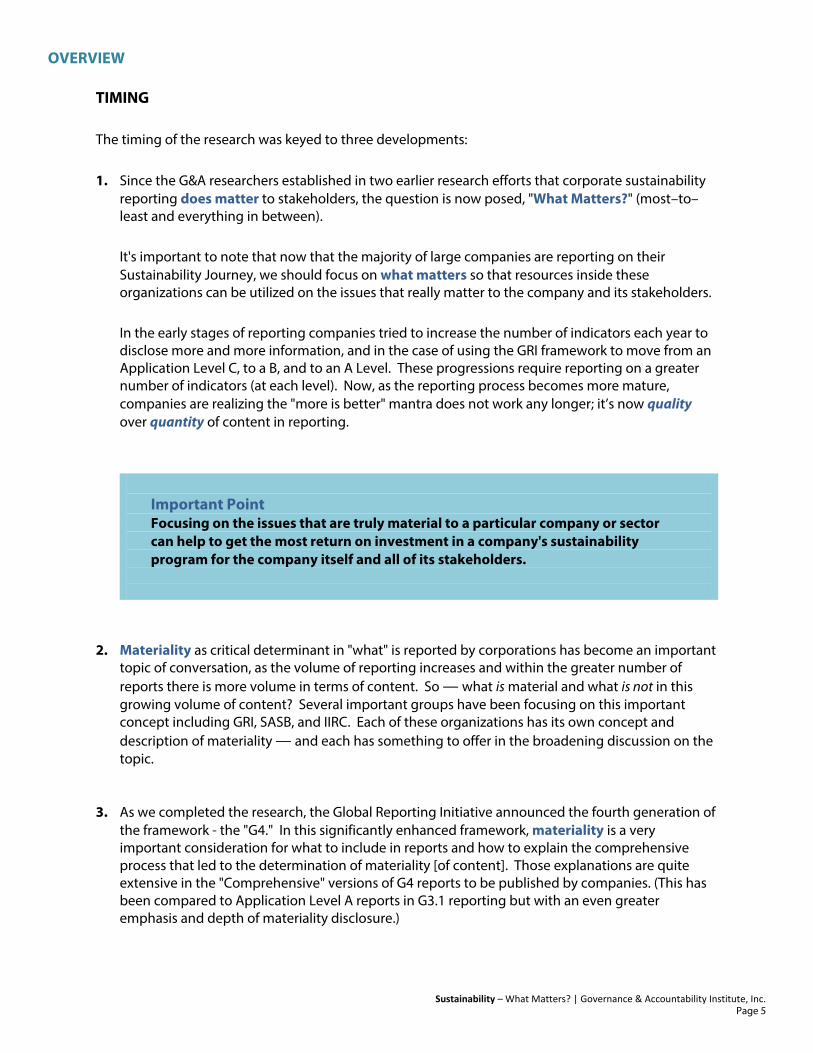
TIMING The timing of the research was keyed to three developments: 1. Since the G&A researchers established in two earlier research efforts that corporate sustainability
reporting does matter to stakeholders, the question is now posed, "What Matters?" (most–to–least and everything in between).
It's important to note that now that the majority of large companies are reporting on their Sustainability Journey, we should focus on what matters so that resources inside these organizations can be utilized on the issues that really matter to the company and its stakeholders. In the early stages of reporting companies tried to increase the number of indicators each year to disclose more and more information, and in the case of using the GRI framework to move from an Application Level C, to a B, and to an A Level. These progressions require reporting on a greater number of indicators (at each level). Now, as the reporting process becomes more mature, companies are realizing the "more is better" mantra does not work any longer; it’s now quality over quantity of content in reporting.
Important Point Focusing on the issues that are truly material to a particular company or sector can help to get the most return on investment in a company's sustainability program for the company itself and all of its stakeholders.
2. Materiality as critical determinant in "what" is reported by corporations has become an important
topic of conversation, as the volume of reporting increases and within the greater number of reports there is more volume in terms of content. So — what is material and what is not in this growing volume of content? Several important groups have been focusing on this important concept including GRI, SASB, and IIRC. Each of these organizations has its own concept and description of materiality — and each has something to offer in the broadening discussion on the topic.
3. As we completed the research, the Global Reporting Initiative announced the fourth generation of the framework - the "G4." In this significantly enhanced framework, materiality is a very important consideration for what to include in reports and how to explain the comprehensive process that led to the determination of materiality [of content]. Those explanations are quite extensive in the "Comprehensive" versions of G4 reports to be published by companies. (This has been compared to Application Level A reports in G3.1 reporting but with an even greater emphasis and depth of materiality disclosure.)
Page 5
OVERVIEW
Sustainability – What Matters? | Governance & Accountability Institute, Inc.
METHODOLOGY Our team of researchers utilized the GRI global database's (available at: database.globalreporting.org) data set for reports published in 2012 for the baseline data of this analysis. This was the most complete dataset at the time this research was started in 2013 and was made up of 1,246 organizations globally from 35 sectors that were utilizing the GRI G3 and G3.1 framework for reporting.
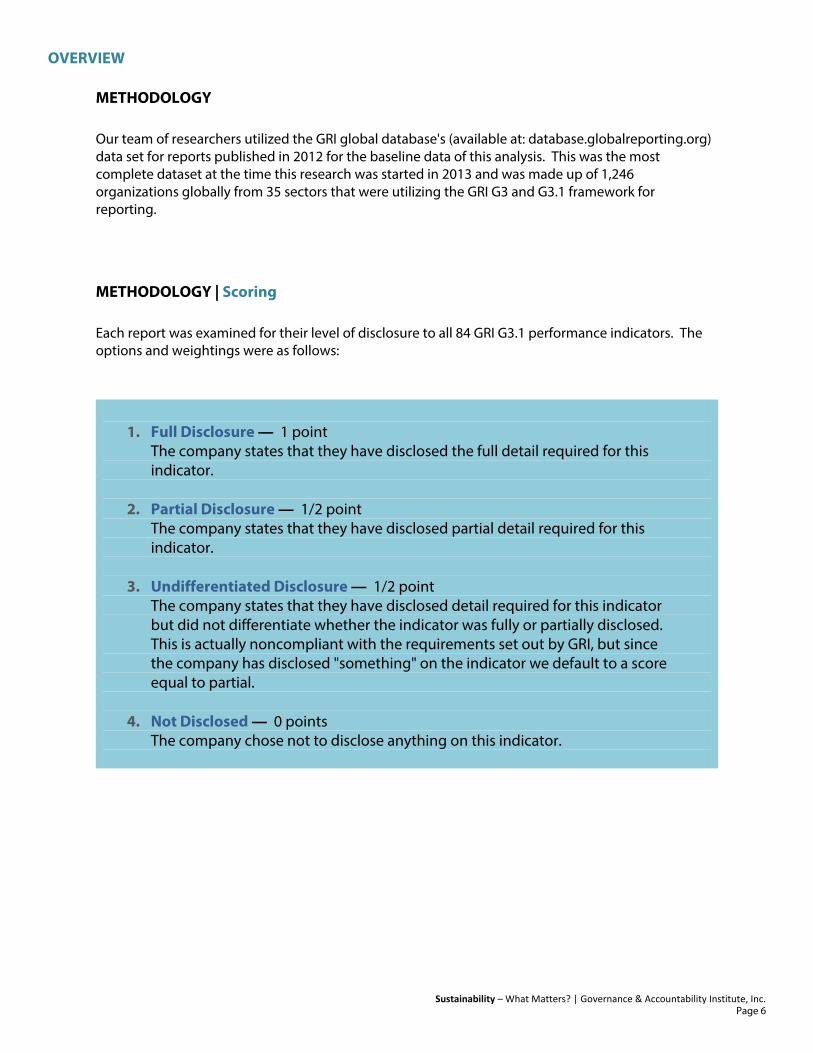
METHODOLOGY | Scoring Each report was examined for their level of disclosure to all 84 GRI G3.1 performance indicators. The options and weightings were as follows:
1. Full Disclosure — 1 point
The company states that they have disclosed the full detail required for this indicator.
2. Partial Disclosure — 1/2 point The company states that they have disclosed partial detail required for this indicator.
3. Undifferentiated Disclosure — 1/2 point The company states that they have disclosed detail required for this indicator but did not differentiate whether the indicator was fully or partially disclosed. This is actually noncompliant with the requirements set out by GRI, but since the company has disclosed "something" on the indicator we default to a score equal to partial.
4. Not Disclosed — 0 points The company chose not to disclose anything on this indicator.
Page 6

OVERVIEW
Sustainability – What Matters? | Governance & Accountability Institute, Inc.
METHODOLOGY | Sectors After completing the initial research for all 1,246 organizations disclosure levels on each of the 84 performance indicators we then organized the reporters into 35 sectors that are used by GRI in their Sustainability Disclosure database (database available at the GRI web site). Note that these sectors were assigned to the reporting organizations by the individual data partners in each country and therefore are subject to the discretion of each individual data partner. Further, the sectors are sometimes overlapping and sometimes at times encompass organizations that may have little in common. When possible we corrected sector allocations in cases where we thought an organization belonged in a sector which might be different from what was selected by the respective data partners. Organizations in the GRI Sustainability Disclosure Database that were selected as "other" for their sector were not included in our analysis. We made the list of organizations included in each sector available in the report to be transparent about the data. Customized research options available at the end of this report can be used to further tweak the results for a particular company, investor or other third party interest. There are many options for "sifting and sorting" the results of our research. We believe that this would be of value to companies benchmarking the sector or industry peers, customers, suppliers, and other organizations of interest and to capital market players tracking companies in the sector.
GRI SECTORS UTILIZED IN OUR DATA SAMPLE
1. Agriculture 2. Automotive 3. Aviation 4. Chemicals 5. Commercial Services 6. Computers 7. Conglomerates 8. Construction 9. Construction Materials 10. Consumer Durables 11. Energy 12. Energy Utilities 13. Equipment 14. Financial Services 15. Food and Beverage Products 16. Forest and Paper Products 17. Healthcare Products 18. Healthcare Services
19. Household and Personal Products 20. Logistics 21. Media 22. Metals Products 23. Mining 24. Public Agency 25. Railroad 26. Real Estate 27. Retailers 28. Technology Hardware 29. Telecommunications 30. Textiles and Apparel 31. Tobacco 32. Travel and Tourism 33. Universities 34. Waste Management 35. Water Utilities
Page 7
OVERVIEW
Sustainability – What Matters? | Governance & Accountability Institute, Inc.
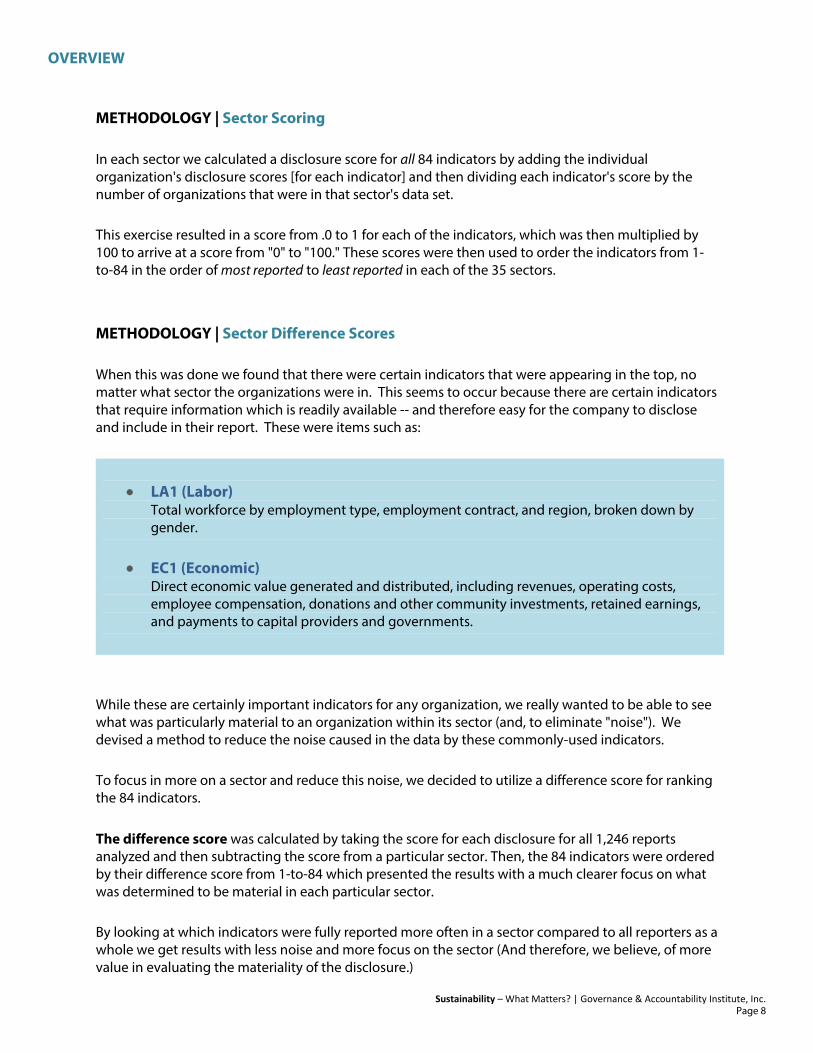
METHODOLOGY | Sector Scoring In each sector we calculated a disclosure score for all 84 indicators by adding the individual organization's disclosure scores [for each indicator] and then dividing each indicator's score by the number of organizations that were in that sector's data set. This exercise resulted in a score from .0 to 1 for each of the indicators, which was then multiplied by 100 to arrive at a score from "0" to "100." These scores were then used to order the indicators from 1-to-84 in the order of most reported to least reported in each of the 35 sectors. METHODOLOGY | Sector Difference Scores When this was done we found that there were certain indicators that were appearing in the top, no matter what sector the organizations were in. This seems to occur because there are certain indicators that require information which is readily available -- and therefore easy for the company to disclose and include in their report. These were items such as:
• LA1 (Labor) Total workforce by employment type, employment contract, and region, broken down by gender.
• EC1 (Economic) Direct economic value generated and distributed, including revenues, operating costs, employee compensation, donations and other community investments, retained earnings, and payments to capital providers and governments.
While these are certainly important indicators for any organization, we really wanted to be able to see what was particularly material to an organization within its sector (and, to eliminate "noise"). We devised a method to reduce the noise caused in the data by these commonly-used indicators. To focus in more on a sector and reduce this noise, we decided to utilize a difference score for ranking the 84 indicators. The difference score was calculated by taking the score for each disclosure for all 1,246 reports analyzed and then subtracting the score from a particular sector. Then, the 84 indicators were ordered by their difference score from 1-to-84 which presented the results with a much clearer focus on what was determined to be material in each particular sector. By looking at which indicators were fully reported more often in a sector compared to all reporters as a whole we get results with less noise and more focus on the sector (And therefore, we believe, of more value in evaluating the materiality of the disclosure.)
Page 8

OVERVIEW
Sustainability – What Matters? | Governance & Accountability Institute, Inc.
METHODOLOGY | Additional Categories and Aspect Ranks GRI Indicators are grouped into six categories, and 37 Aspects. We also went an extra step to then utilize the indicator's scores to score the categories and Aspects that have the highest difference in scores.
AND NOW THE RESULTS | Top 10 / Bottom 10 In the pages that follow this we display the top 10 and bottom 10 disclosures from our research in each of the 35 sectors analyzed and the results of companies from every sector are looked at as a group. We hope that you receive value from our findings and that it enables you to focus more on. . .
sustainability — what matters?
We value feedback from you regarding this analysis and your thoughts after reviewing the results. Please email us at [email protected].
Page 9

sustainability — what matters? The Agriculture Sector

The Agriculture Sector
Sustainability – What Matters? | Governance & Accountability Institute, Inc.
“EACH ONE OF OUR BUSINESSES IMPACTS THE SOCIETY AND IS IN TURN IMPACTED BY THE SOCIETY. PIPING AND DRIP IRRIGATION SYSTEMS
CONSERVE WATER AND ENERGY, AND AT THE SAME TIME IMPROVE PRODUCTION AND PRODUCTIVITY OF THE FARMERS. FRUIT AND
VEGETABLE PROCESSING HELPS IN AIDING FOOD SECURITY AND ENSURES VALUE ADDITION FOR THE FARMERS’ PRODUCE. THIS ALSO
EMPOWERS THEM TO CREATE SUSTAINABLE WEALTH .” — Bhavarlal H. Jain, Founder Chairman, Jain Irrigation Systems
“We are working to integrate sustainability into our operations by continuously improving efficiency and resource management, as well as fostering a safe, inclusive and productive work place.” — Martin Richenhagen, Chairman, President & Chief
Executive Officer, Agco
“AS A BUSINESS, WE REMAIN COMMITTED TO ACTIVELY PARTICIPAT
ING IN STAKEHOLDER DIALOGUE AND SUPPORTING INITIATIVES
THAT ARE FOCUSED ON INCREASING AGRICULTURAL PRODUCTIVITY,
MANAGING AND REDUCING THE ENVIRONMENTAL IMPACT OF AG
RICULTURE, AND IMPROVING THE ECONOMIC SUCCESS OF FARMERS
AND THEIR FAMILIES IN ALL PARTS OF THE WORLD.” — Hugh Grant, Chairman of the Board, President & CEO, Monsanto
“WE MANAGE OUR IMPACTS BY ASSESS
ING OUR INTERNAL SYSTEMS AGAINST
EMERGING SUSTAINABILITY
STANDARDS AND CONTINUALLY
IMPROVING OUR USE OF RESOURCES -
BE THEY LAND, SOIL, WATER,
FERTILISER, ENERGY, OR HUMAN. IN
OTHER WORDS, WE STRIVE TO DO
MORE WITH LESS .”
— Ciliandra Fangiono, Director and
Chief Executive Officer, First Resources
“Relatively high crop prices encouraged growers to invest in technology, and the geographical breadth of the company, notably our strength in emerging markets, meant we were very well placed to capture these growth opportunities.” —
Martin Taylor , Chairman, Syngenta
“Stewardship, innovation and the proper use of fertilizer and crop protection products are key to ensuring that food
production is accomplished responsibly.” — Mike Wilson,
President & CEO, Agrium
“IT IS A TASK BEYOND A SINGLE
COMPANY, BUT WE KNOW THAT
DEFORESTATION DUE TO EXPANSION OF
FARMLAND IS THE MAIN SOURCE OF
GREENHOUSE GAS (GHG) EMISSIONS
FROM AGRICULTURE. IMPROVING
FARM PRODUCTIVITY WILL REDUCE
PRESSURE ON EXISTING FORESTS.”
— Jørgen Ole Haslestad, CEO,
Yara International
“I BELIEVE THERE ARE FOUR KEY DEVELOPMENTAL CHANGES FACING US THIS CENTURY: ENERGY SECURITY, FOOD SECURITY, WATER SECURITY AND THE IMPACT OF CLIMATE CHANGE . WHILE POLICY MAKERS AND EXPERTS VIEW THESE SEPARATELY, ADDRESSING THEM IN A SILOED MANNER, WE BELIEVE THEY ARE MUTUALLY-RELATED PROBLEMS WITH INTERLOCKING CAUSES WHICH NEED TO BE ADDRESSED HOLISTICALLY.” — Jean-PaulPinard, Non-Executive Director and Chairman of the Board CR&S Committee, Olam International Ltd
“Initiatives that we have implemented cover a wide spectrum including education, health, social and economic empowerment, to enhance the overall livelihoods of the local communities. Education is a key area for us as we believe it is an effective way of breaking the poverty cycle.” — Franky Oesman Widjaja,
Chairman and Chief Executive Officer, Golden Agri-Resources, Ltd
“[WE] WILL TAKE A PROACTIVE APPROACH TOWARD REDUCING EMISSIONS THROUGH IMPROVEMENTS IN ENERGY USE AND EFFICIENCY,
PROMOTION OF SUSTAINABILITY AND CONSERVATION OF NATURAL RESOURCES. ALL PRACTICES WILL ENSURE THE CONTINUED SUCCESS
OF OUR COMPANY, WITH VALUABLE BENEFITS TO THE CUSTOMERS AND COMMUNITIES WE SERVE.”
— Dr. Peter Innes, Chairman & Chief Executive Officer, Becker Underwood
Page 11
The Agriculture Sector
Sustainability – What Matters? | Governance & Accountability Institute, Inc.
D A T A S A M P L E
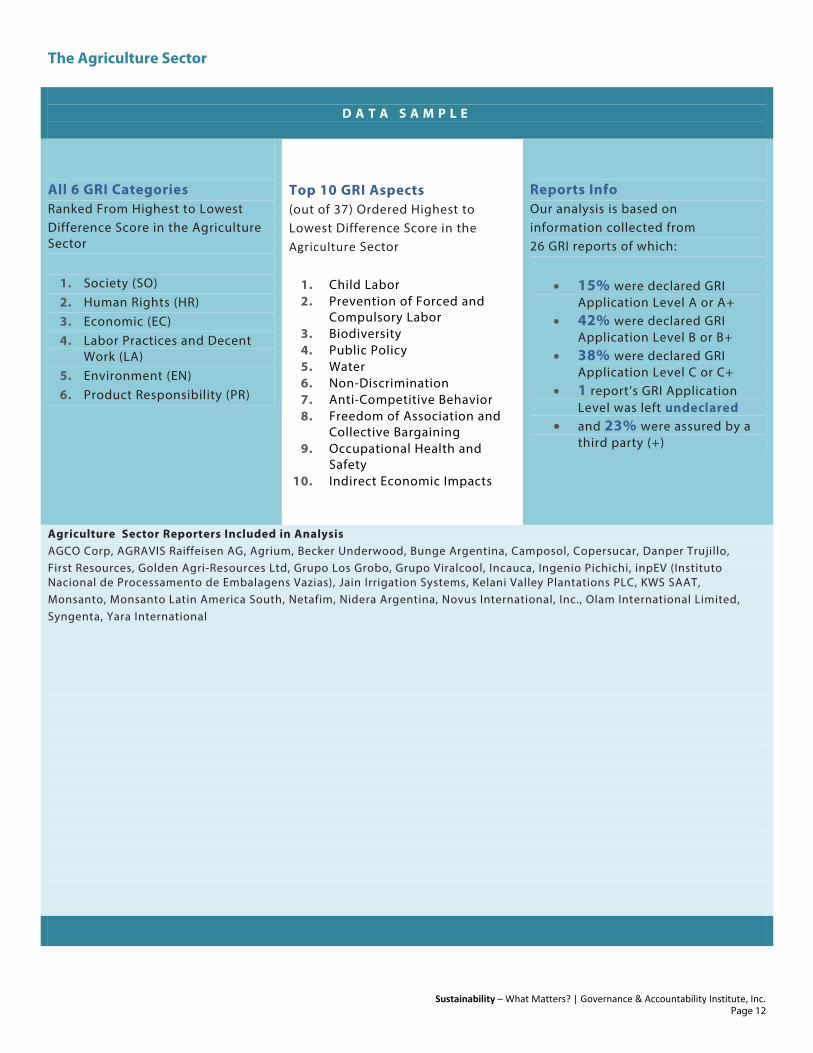
All 6 GRI Categories Ranked From Highest to Lowest Difference Score in the Agriculture Sector
1. Society (SO) 2. Human Rights (HR) 3. Economic (EC) 4. Labor Practices and Decent
Work (LA) 5. Environment (EN) 6. Product Responsibility (PR)
Top 10 GRI Aspects (out of 37) Ordered Highest to Lowest Difference Score in the Agriculture Sector
1. Child Labor 2. Prevention of Forced and
Compulsory Labor 3. Biodiversity 4. Public Policy 5. Water 6. Non-Discrimination 7. Anti-Competitive Behavior 8. Freedom of Association and
Collective Bargaining 9. Occupational Health and
Safety 10. Indirect Economic Impacts
Reports Info Our analysis is based on information collected from 26 GRI reports of which:
• 15% were declared GRI Application Level A or A+
• 42% were declared GRI Application Level B or B+
• 38% were declared GRI Application Level C or C+
• 1 report’s GRI Application Level was left undeclared
• and 23% were assured by a third party (+)
Agriculture Sector Reporters Included in Analysis AGCO Corp, AGRAVIS Raiffeisen AG, Agrium, Becker Underwood, Bunge Argentina, Camposol, Copersucar, Danper Trujillo, First Resources, Golden Agri-Resources Ltd, Grupo Los Grobo, Grupo Viralcool, Incauca, Ingenio Pichichi, inpEV (Instituto Nacional de Processamento de Embalagens Vazias), Jain Irrigation Systems, Kelani Valley Plantations PLC, KWS SAAT, Monsanto, Monsanto Latin America South, Netafim, Nidera Argentina, Novus International, Inc., Olam International Limited, Syngenta, Yara International
Page 12

TOP 10 INDICATORS | The Agriculture Sector | Get All 84: www.ga-institute.com/getall84
Sustainability – What Matters? | Governance & Accountability Institute, Inc. 0 — 50 — 100
Rank All Sector Score
Diff Difference
Sector Sector Score
G3.1 Indicator
G4 Indicator
Category Aspect Description
1 35.47 18.38 53.85 EN12 G4-EN12 (EN) Environment
Biodiversity Description of significant impacts of activities, products, and services on biodiversity in protected areas and areas of high biodiversity value outside protected areas.
2 29.57 16.58 46.15 EN13 G4-EN13 (EN) Environment
Biodiversity Habitats protected or restored.
3 50.36 13.11 63.46 HR6 G4-HR5 (HR) Human Rights
Child Labor Operations identified as having significant risk for incidents of child labor, and measures taken to contribute to the elimination of child labor.
4 48.19 11.43 59.62 HR7 H4-HR6 (HR) Human Rights
Prevention of Forced
and Compulsory
Labor
Operations and significant suppliers identified as having significant risk for incidents of forced or compulsory labor, and measures to contribute to the elimination of all forms of forced or compulsory labor.
5 52.17 11.30 63.46 LA8 G4-LA7 (Data points
moved to Guidance)
(LA) Labor
Practices and Decent
Work
Occupational Health and
Safety
Education, training, counseling, prevention, and risk-control programs in place to assist workforce members, their families, or community members regarding serious diseases.
6 34.11 10.13 44.23 EN11 G4-EN11 (EN) Environment
Biodiversity Location and size of land owned, leased, managed in, or adjacent to, protected areas and areas of high biodiversity value outside protected areas.
7 57.54 9.77 67.31 EN8 G4-EN8 (EN) Environment
Water Total water withdrawal by source.
8 44.26 9.59 53.85 EN23 G4-EN24 (EN) Environment
Emissions, Effluents and
Waste
Total number and volume of significant spills.
9 52.09 9.46 61.54 SO5 Entire Indicator Moved to Guidance
(SO) Society
Public Policy Public policy positions and participation in public policy development and lobbying.
10 33.31 9.01 42.31 EN14 Entire Indicator Moved to Guidance
(EN) Environment
Biodiversity Strategies, current actions, and future plans for managing impacts on biodiversity.
Page 13

BOTTOM 10 INDICATORS | The Agriculture Sector | Get All 84: www.ga-institute.com/getall84
Sustainability – What Matters? | Governance & Accountability Institute, Inc. 0 — 50 — 100
Rank All Sector Score
Diff Difference
Sector Sector Score
G3.1 Indicator
G4 Indicator
Category Aspect Description
75 22.91 -7.52 15.38 HR8 G4-HR7 (HR) Human Rights
Security Practices
Percentage of security personnel trained in the organization's policies or procedures concerning aspects of Human Rights (HR) that are relevant to operations.
76 54.94 -8.78 46.15 EN18 G4-EN19 (EN) Environment
Emissions, Effluents and
Waste
Initiatives to reduce greenhouse gas emissions and reductions achieved.
77 53.05 -8.81 44.23 EN5 G4-EN6 (EN) Environment
Energy Energy saved due to conservation and efficiency improvements.
78 54.37 -10.14 44.23 EC3 G4-EC3 (EC) Economic
Economic Performance
Coverage of the organization's defined benefit plan obligations.
79 39.25 -10.39 28.85 HR2 G4-HR10 (HR) Human Rights
Investment and
Procurement Practices
Percentage of significant suppliers, contractors, and other business partners that have undergone Human Rights (HR) screening and actions taken.
80 36.20 -11.19 25.00 EN2 G4-EN2 (EN) Environment
Materials Percentage of materials used that are recycled input materials.
81 48.48 -11.93 36.54 EN6 G4-EN7 (EN) Environment
Energy Initiatives to provide energy-efficient or renewable energy based products and services, and reductions in energy requirements as a result of these initiatives.
82 44.74 -13.97 30.77 EN17 G4-EN17, G4-EN18
(EN) Environment
Emissions, Effluents and
Waste
Other relevant indirect greenhouse gas emissions by weight.
83 35.51 -14.35 21.15 EN29 G4-EN30 (EN) Environment
Transport Significant environmental impacts of transporting products and other goods and materials used for the organization's operations, and transporting members of the workforce.
84 51.61 -19.60 32.00 PR5 G4-PR5 (Data points
moved to Guidance)
(PR) Product
Responsibility
Product and Service
Labeling
Practices related to customer satisfaction, including results of surveys measuring customer satisfaction.
Page 14

sustainability — what matters? The Automotive Sector

The Automotive Sector
Sustainability – What Matters? | Governance & Accountability Institute, Inc.
"WE BELIEVE A TRULY SUSTAINABLE LONG-TERM SOLUTION WILL REQUIRE A GLOBAL TRANSPORTATION NETWORK THAT ENABLES WIRELESS
COMMUNICATION AMONG VEHICLES AND INFRASTRUCTURE. THIS SYSTEM WOULD USE REAL-TIME DATA TO ENHANCE PERSONAL MOBILITY
ON A MASSIVE SCALE, BRINGING ALL MODES OF TRAVEL INTO A SINGLE NETWORK THAT LINKS TOGETHER PUBLIC AND PERSONAL
TRANSPORTATION. PEDESTRIAN WALKWAYS, BICYCLES, BUSES, AIRPLANES, TRAINS, AUTOMOBILES – IN OUR VISION OF THE FUTURE
EVERYTHING WOULD BE FULLY INTEGRATED TO SAVE TIME, CONSERVE RESOURCES AND LOWER EMISSIONS.” — William Clay Ford, Jr., Executive Chairman, Ford
“As the inventor of the automobile, we consider sustainable mobility our top priority. Through new
technologies we are continually reducing the fuel consumption and the emissions of our vehicle fleet.” — Dr. Dieter Zetsche, Chairman of the Board of
Management; Prof. Dr. Thomas Weber, Chairman of the
Sustainability Board, Daimler
“WE CAN RELY ON AN INDUSTRIAL STRATEGY ROOTED NOT IN DELOCALISATION, BUT IN MAKING MAJOR INVESTMENTS IN TERMS OF HUMAN AND FINANCIAL RESOURCES AIMED AT GROWTH IN THE WORLD’S MOST PROMISING REGIONS. THE RELATIONSHIP WITH THE TERRITORIES WHERE OUR PRODUCTS ARE CREATED IS FURTHER CONSOLIDATED BY THE SOUND RELATIONS WITH UNIVERSITIES, RESEARCH CENTRES AND LOCAL AUTHORITIES IN ORDER TO PROMOTE DEVELOPMENT TO THE BENEFIT OF THE ENTIRE COMMUNITY.” — Roberto Colaninno, Chairman and Chief Executive Officer, Piaggio
“ADDRESSING THE CHALLENGES OF
SUSTAINABLE DEVELOPMENT CONTINUES
TO BE AN INTEGRAL PART OF OUR
STRATEGY. THIS IS REFLECTED OUR CSR
APPROACH’S FOCUS ON: LAYING THE
FOUNDATION FOR ALL COMPONENTS OF
SUSTAINABLE MOBILITY, INCLUDING
CLEANTECHS AND INNOVATIVE SERVICES;
BEING A RESPONSIBLE EMPLOYER; AND
BEING A FULL-FLEDGED PARTNER TO OUR
HOST COMMUNITIES.” — Philippe Varin,
Chairman of the Managing Board,
Peugeot Citroën
“Acting in knowledge that the most important aspect of sustainability is the valuable human resource, [our] Company strives to provide a safe and healthy work environment, with respect for employee rights, and fair wages without discrimination among its employees.” — Zafer Başar, CEO, Doğus
"Our six forms of non-financial or intellectual capital – customers, employees, business partners, regulatory authorities, community and concern for the environment – are in dynamic interaction to create financial value…" — A. Ranjith Pandithage,
Chairman/Managing Director, Dimo
“…OUR BELIEF [IS] THAT THE MOST
SIGNIFICANT FUEL ECONOMY GAINS ARE
ACHIEVED WHEN YOU OFFER CONSUMERS
FUEL-EFFICIENT VEHICLES THAT THEY LOVE
TO DRIVE, THAT MEET THEIR NEEDS AND FIT
THEIR LIFESTYLE. THIS IS HOW YOU DELIVER
REAL AND SUSTAINABLE CHANGE IN OUR
INDUSTRY.” — Daniel F. Akerson, Chairman
and Chief Executive Officer, GM
“MOBILITY IS AN INHERENT AND FUNDAMENTAL HUMAN NEED. AND MOBILITY IS A KEY DRIVER OF FREEDOM AND GROWTH, HERE IN EUROPE AND ACROSS THE GLOBE. OUR JOB, OUR RESPONSIBILITY, IS TO SAFEGUARD THE FUTURE OF WIDESPREAD PERSONAL MOBILITY, KEEPING IT AFFORDABLE, SAFE AND ENVIRONMENTALLY COMPATIBLE.” — Prof. Dr. rer. nat., Chairman of the Board, Management; Martin Winterkorn Bernd Osterloh, Chairman, General/Group Works Councils, Volkswagen
"We believe that when you combine fuel efficiency, electrification and efficient manufacturing with intuitive, human-focused design and innovative safety systems and solutions, the result is a luxury car brand for the future." — Stefan Jacoby, President & CEO,
Volvo
“WE NEED TO INVEST IN THE PROTECTION OF OUR ECOSYSTEM AND TO TACKLE OTHER ENVIRONMENTAL PROBLEMS WHICH LEFT ALONE
COULD HAVE A SIGNIFICANT NEGATIVE IMPACT ON OUR LIVELIHOODS. THIS IS ESPECIALLY TRUE FOR THE AUTOMOBILE INDUSTRY
CONSIDERING THE LARGE AMOUNT OF RESOURCES THAT ARE USED AND THE EMISSIONS ASSOCIATED WITH THE MANUFACTURE AND USE OF
AUTOMOBILES. AUTOMOBILE MANUFACTURERS THEREFORE, ARE STRIVING TO ACHIEVE ‘SUSTAINABLE MOBILITY’, BOTH AS A MORAL
OBLIGATION AND AS SOMETHING WHICH IS IMPERATIVE TO OUR BUSINESS.” — Mong-koo Chung, Chairman, Hyundai
Page 16
The Automotive Sector
Sustainability – What Matters? | Governance & Accountability Institute, Inc.
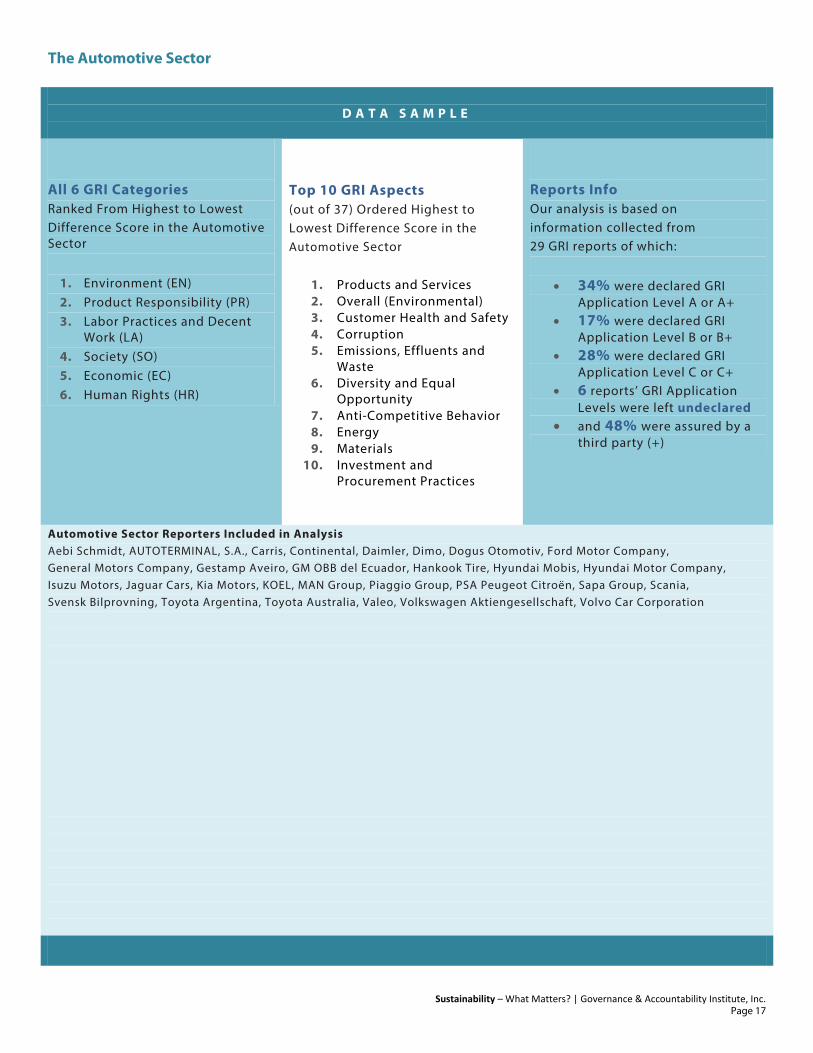
D A T A S A M P L E
All 6 GRI Categories Ranked From Highest to Lowest Difference Score in the Automotive Sector
1. Environment (EN) 2. Product Responsibility (PR) 3. Labor Practices and Decent
Work (LA) 4. Society (SO) 5. Economic (EC) 6. Human Rights (HR)
Top 10 GRI Aspects (out of 37) Ordered Highest to Lowest Difference Score in the Automotive Sector
1. Products and Services 2. Overall (Environmental) 3. Customer Health and Safety 4. Corruption 5. Emissions, Effluents and
Waste 6. Diversity and Equal
Opportunity 7. Anti-Competitive Behavior 8. Energy 9. Materials
10. Investment and Procurement Practices
Reports Info Our analysis is based on information collected from 29 GRI reports of which:
• 34% were declared GRI Application Level A or A+
• 17% were declared GRI Application Level B or B+
• 28% were declared GRI Application Level C or C+
• 6 reports’ GRI Application Levels were left undeclared
• and 48% were assured by a third party (+)
Automotive Sector Reporters Included in Analysis Aebi Schmidt, AUTOTERMINAL, S.A., Carris, Continental, Daimler, Dimo, Dogus Otomotiv, Ford Motor Company, General Motors Company, Gestamp Aveiro, GM OBB del Ecuador, Hankook Tire, Hyundai Mobis, Hyundai Motor Company, Isuzu Motors, Jaguar Cars, Kia Motors, KOEL, MAN Group, Piaggio Group, PSA Peugeot Citroën, Sapa Group, Scania, Svensk Bilprovning, Toyota Argentina, Toyota Australia, Valeo, Volkswagen Aktiengesellschaft, Volvo Car Corporation
Page 17
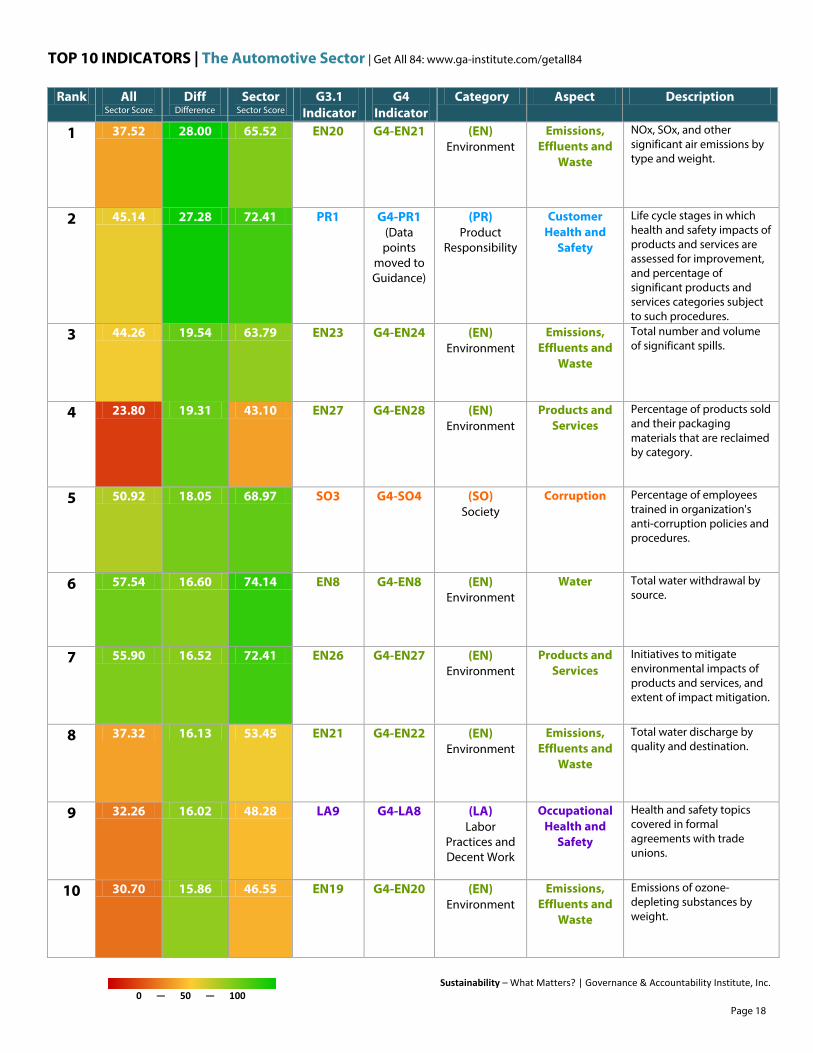
TOP 10 INDICATORS | The Automotive Sector | Get All 84: www.ga-institute.com/getall84
Sustainability – What Matters? | Governance & Accountability Institute, Inc. 0 — 50 — 100
Rank All Sector Score
Diff Difference
Sector Sector Score
G3.1 Indicator
G4 Indicator
Category Aspect Description
1 37.52 28.00 65.52 EN20 G4-EN21 (EN) Environment
Emissions, Effluents and
Waste
NOx, SOx, and other significant air emissions by type and weight.
2 45.14 27.28 72.41 PR1 G4-PR1 (Data points
moved to Guidance)
(PR) Product
Responsibility
Customer Health and
Safety
Life cycle stages in which health and safety impacts of products and services are assessed for improvement, and percentage of significant products and services categories subject to such procedures.
3 44.26 19.54 63.79 EN23 G4-EN24 (EN) Environment
Emissions, Effluents and
Waste
Total number and volume of significant spills.
4 23.80 19.31 43.10 EN27 G4-EN28 (EN) Environment
Products and Services
Percentage of products sold and their packaging materials that are reclaimed by category.
5 50.92 18.05 68.97 SO3 G4-SO4 (SO) Society
Corruption Percentage of employees trained in organization's anti-corruption policies and procedures.
6 57.54 16.60 74.14 EN8 G4-EN8 (EN) Environment
Water Total water withdrawal by source.
7 55.90 16.52 72.41 EN26 G4-EN27 (EN) Environment
Products and Services
Initiatives to mitigate environmental impacts of products and services, and extent of impact mitigation.
8 37.32 16.13 53.45 EN21 G4-EN22 (EN) Environment
Emissions, Effluents and
Waste
Total water discharge by quality and destination.
9 32.26 16.02 48.28 LA9 G4-LA8 (LA) Labor
Practices and Decent Work
Occupational Health and
Safety
Health and safety topics covered in formal agreements with trade unions.
10 30.70 15.86 46.55 EN19 G4-EN20 (EN) Environment
Emissions, Effluents and
Waste
Emissions of ozone-depleting substances by weight.
Page 18
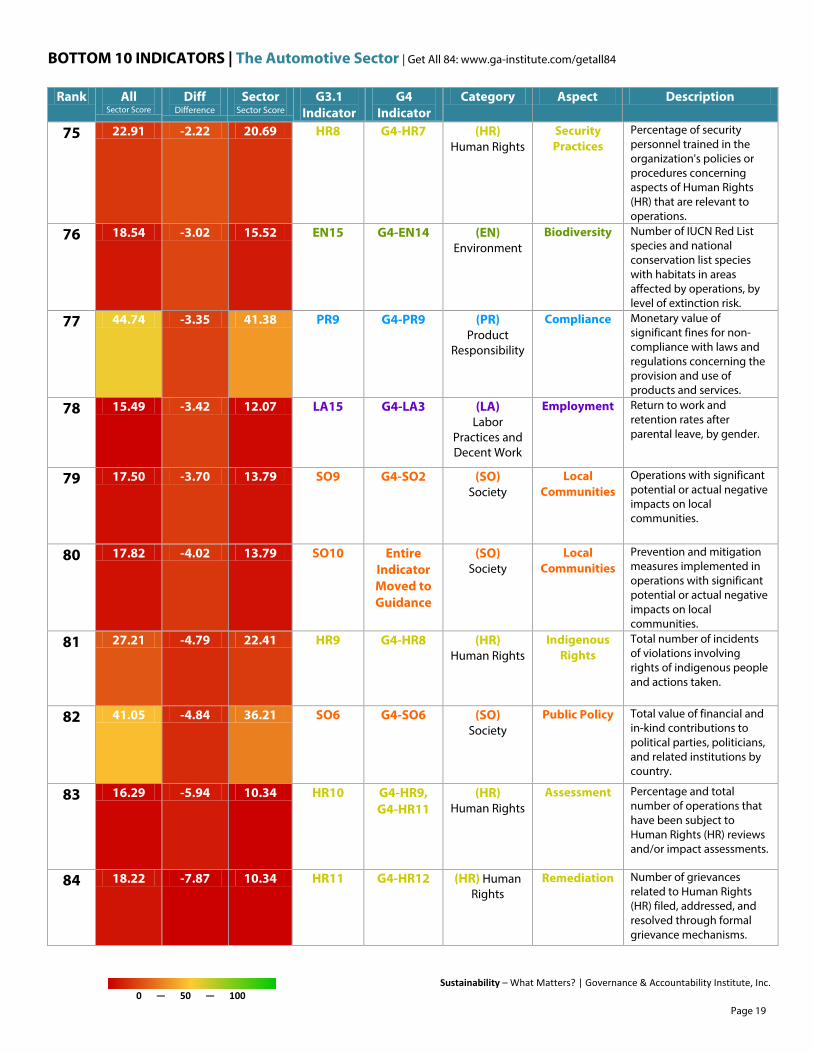
BOTTOM 10 INDICATORS | The Automotive Sector | Get All 84: www.ga-institute.com/getall84
Sustainability – What Matters? | Governance & Accountability Institute, Inc. 0 — 50 — 100
Rank All Sector Score
Diff Difference
Sector Sector Score
G3.1 Indicator
G4 Indicator
Category Aspect Description
75 22.91 -2.22 20.69 HR8 G4-HR7 (HR) Human Rights
Security Practices
Percentage of security personnel trained in the organization's policies or procedures concerning aspects of Human Rights (HR) that are relevant to operations.
76 18.54 -3.02 15.52 EN15 G4-EN14 (EN) Environment
Biodiversity Number of IUCN Red List species and national conservation list species with habitats in areas affected by operations, by level of extinction risk.
77 44.74 -3.35 41.38 PR9 G4-PR9 (PR) Product
Responsibility
Compliance Monetary value of significant fines for non-compliance with laws and regulations concerning the provision and use of products and services.
78 15.49 -3.42 12.07 LA15 G4-LA3 (LA) Labor
Practices and Decent Work
Employment Return to work and retention rates after parental leave, by gender.
79 17.50 -3.70 13.79 SO9 G4-SO2 (SO) Society
Local Communities
Operations with significant potential or actual negative impacts on local communities.
80 17.82 -4.02 13.79 SO10 Entire Indicator Moved to Guidance
(SO) Society
Local Communities
Prevention and mitigation measures implemented in operations with significant potential or actual negative impacts on local communities.
81 27.21 -4.79 22.41 HR9 G4-HR8 (HR) Human Rights
Indigenous Rights
Total number of incidents of violations involving rights of indigenous people and actions taken.
82 41.05 -4.84 36.21 SO6 G4-SO6 (SO) Society
Public Policy Total value of financial and in-kind contributions to political parties, politicians, and related institutions by country.
83 16.29 -5.94 10.34 HR10 G4-HR9, G4-HR11
(HR) Human Rights
Assessment Percentage and total number of operations that have been subject to Human Rights (HR) reviews and/or impact assessments.
84 18.22 -7.87 10.34 HR11 G4-HR12 (HR) Human Rights
Remediation Number of grievances related to Human Rights (HR) filed, addressed, and resolved through formal grievance mechanisms.
Page 19
sustainability — what matters? The Aviation Sector
The Aviation Sector
Sustainability – What Matters? | Governance & Accountability Institute, Inc.
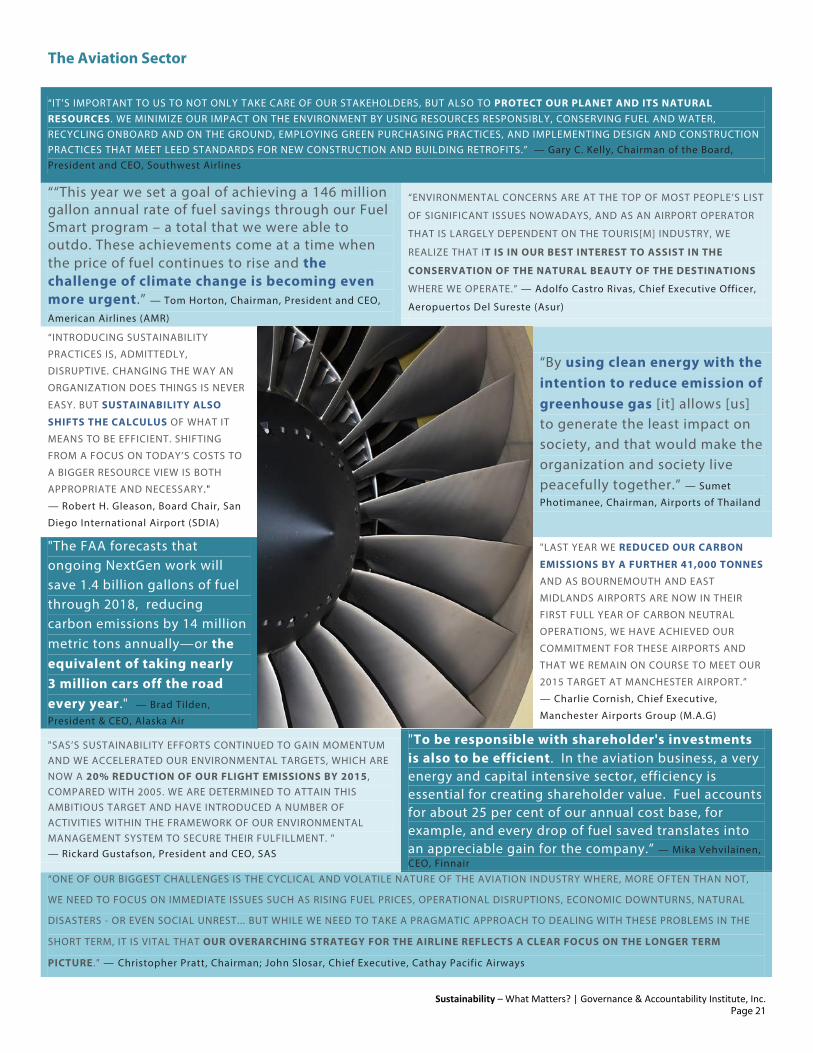
“IT’S IMPORTANT TO US TO NOT ONLY TAKE CARE OF OUR STAKEHOLDERS, BUT ALSO TO PROTECT OUR PLANET AND ITS NATURAL RESOURCES. WE MINIMIZE OUR IMPACT ON THE ENVIRONMENT BY USING RESOURCES RESPONSIBLY, CONSERVING FUEL AND WATER, RECYCLING ONBOARD AND ON THE GROUND, EMPLOYING GREEN PURCHASING PRACTICES, AND IMPLEMENTING DESIGN AND CONSTRUCTION PRACTICES THAT MEET LEED STANDARDS FOR NEW CONSTRUCTION AND BUILDING RETROFITS.” — Gary C. Kelly, Chairman of the Board, President and CEO, Southwest Airlines
““This year we set a goal of achieving a 146 million gallon annual rate of fuel savings through our Fuel Smart program – a total that we were able to outdo. These achievements come at a time when the price of fuel continues to rise and the challenge of climate change is becoming even more urgent.” — Tom Horton, Chairman, President and CEO,
American Airlines (AMR)
“ENVIRONMENTAL CONCERNS ARE AT THE TOP OF MOST PEOPLE’S LIST
OF SIGNIFICANT ISSUES NOWADAYS, AND AS AN AIRPORT OPERATOR
THAT IS LARGELY DEPENDENT ON THE TOURIS[M] INDUSTRY, WE
REALIZE THAT IT IS IN OUR BEST INTEREST TO ASSIST IN THE
CONSERVATION OF THE NATURAL BEAUTY OF THE DESTINATIONS
WHERE WE OPERATE.” — Adolfo Castro Rivas, Chief Executive Officer,
Aeropuertos Del Sureste (Asur)
“INTRODUCING SUSTAINABILITY
PRACTICES IS, ADMITTEDLY,
DISRUPTIVE. CHANGING THE WAY AN
ORGANIZATION DOES THINGS IS NEVER
EASY. BUT SUSTAINABILITY ALSO
SHIFTS THE CALCULUS OF WHAT IT
MEANS TO BE EFFICIENT. SHIFTING
FROM A FOCUS ON TODAY’S COSTS TO
A BIGGER RESOURCE VIEW IS BOTH
APPROPRIATE AND NECESSARY."
— Robert H. Gleason, Board Chair, San
Diego International Airport (SDIA)
“By using clean energy with the intention to reduce emission of greenhouse gas [it] allows [us] to generate the least impact on society, and that would make the organization and society live peacefully together.” — Sumet
Photimanee, Chairman, Airports of Thailand
"The FAA forecasts that ongoing NextGen work will save 1.4 billion gallons of fuel through 2018, reducing carbon emissions by 14 million metric tons annually—or the equivalent of taking nearly 3 million cars off the road every year." — Brad Tilden,
President & CEO, Alaska Air
"LAST YEAR WE REDUCED OUR CARBON
EMISSIONS BY A FURTHER 41,000 TONNES
AND AS BOURNEMOUTH AND EAST
MIDLANDS AIRPORTS ARE NOW IN THEIR
FIRST FULL YEAR OF CARBON NEUTRAL
OPERATIONS, WE HAVE ACHIEVED OUR
COMMITMENT FOR THESE AIRPORTS AND
THAT WE REMAIN ON COURSE TO MEET OUR
2015 TARGET AT MANCHESTER AIRPORT.”
— Charlie Cornish, Chief Executive,
Manchester Airports Group (M.A.G)
"SAS’S SUSTAINABILITY EFFORTS CONTINUED TO GAIN MOMENTUM AND WE ACCELERATED OUR ENVIRONMENTAL TARGETS, WHICH ARE NOW A 20% REDUCTION OF OUR FLIGHT EMISSIONS BY 2015, COMPARED WITH 2005. WE ARE DETERMINED TO ATTAIN THIS AMBITIOUS TARGET AND HAVE INTRODUCED A NUMBER OF ACTIVITIES WITHIN THE FRAMEWORK OF OUR ENVIRONMENTAL MANAGEMENT SYSTEM TO SECURE THEIR FULFILLMENT. " — Rickard Gustafson, President and CEO, SAS
"To be responsible with shareholder's investments is also to be efficient. In the aviation business, a very energy and capital intensive sector, efficiency is essential for creating shareholder value. Fuel accounts for about 25 per cent of our annual cost base, for example, and every drop of fuel saved translates into an appreciable gain for the company.” — Mika Vehvilainen, CEO, Finnair
“ONE OF OUR BIGGEST CHALLENGES IS THE CYCLICAL AND VOLATILE NATURE OF THE AVIATION INDUSTRY WHERE, MORE OFTEN THAN NOT,
WE NEED TO FOCUS ON IMMEDIATE ISSUES SUCH AS RISING FUEL PRICES, OPERATIONAL DISRUPTIONS, ECONOMIC DOWNTURNS, NATURAL
DISASTERS - OR EVEN SOCIAL UNREST... BUT WHILE WE NEED TO TAKE A PRAGMATIC APPROACH TO DEALING WITH THESE PROBLEMS IN THE
SHORT TERM, IT IS VITAL THAT OUR OVERARCHING STRATEGY FOR THE AIRLINE REFLECTS A CLEAR FOCUS ON THE LONGER TERM
PICTURE.” — Christopher Pratt, Chairman; John Slosar, Chief Executive, Cathay Pacific Airways
Page 21

The Aviation Sector
Sustainability – What Matters? | Governance & Accountability Institute, Inc.
D A T A S A M P L E
All 6 GRI Categories Ranked From Highest to Lowest Difference Score in the Aviation Sector
1. Environment (EN) 2. Society (SO) 3. Human Rights (HR) 4. Product Responsibility (PR) 5. Economic (EC) 6. Labor Practices and Decent
Work (LA)
Top 10 GRI Aspects (out of 37) Ordered Highest to Lowest Difference Score in the Aviation Sector
1. Customer Health and Safety 2. Local Communities 3. Assessment 4. Transport 5. Biodiversity 6. Child Labor 7. Emissions, Effluents and
Waste 8. Occupational Health and
Safety 9. Energy
10. Economic Performance
Reports Info Our analysis is based on information collected from 18 GRI reports of which:
• 44% were declared GRI Application Level A or A+
• 39% were declared GRI Application Level B or B+
• 11% were declared GRI Application Level C or C+
• 1 report’s GRI Application Levels was left undeclared
• and 44% were assured by a third party (+)
Aviation Sector Reporters Included in Analysis Airports of Thailand (AOT), Alaska Air Group, AMR, Cathay Pacific Airways, Commercial Aircraft Corporation of China, Enel, Finnair, Fraport AG, Grupo Aeroportuario del Sureste (ASUR), ITP (Industria de Turbo Propulsores), Manchester Airport Group (MAG), Mumbai International Airport, Munich Airport, San Diego International Airport, SAS USA, Schiphol Group, Southwest Airlines, Swedavia
Page 22
TOP 10 INDICATORS | The Aviation Sector | Get All 84: www.ga-institute.com/getall84
Sustainability – What Matters? | Governance & Accountability Institute, Inc. 0 — 50 — 100
Rank All Sector Score
Diff Difference
Sector Sector Score
G3.1 Indicator
G4 Indicator
Category Aspect Description
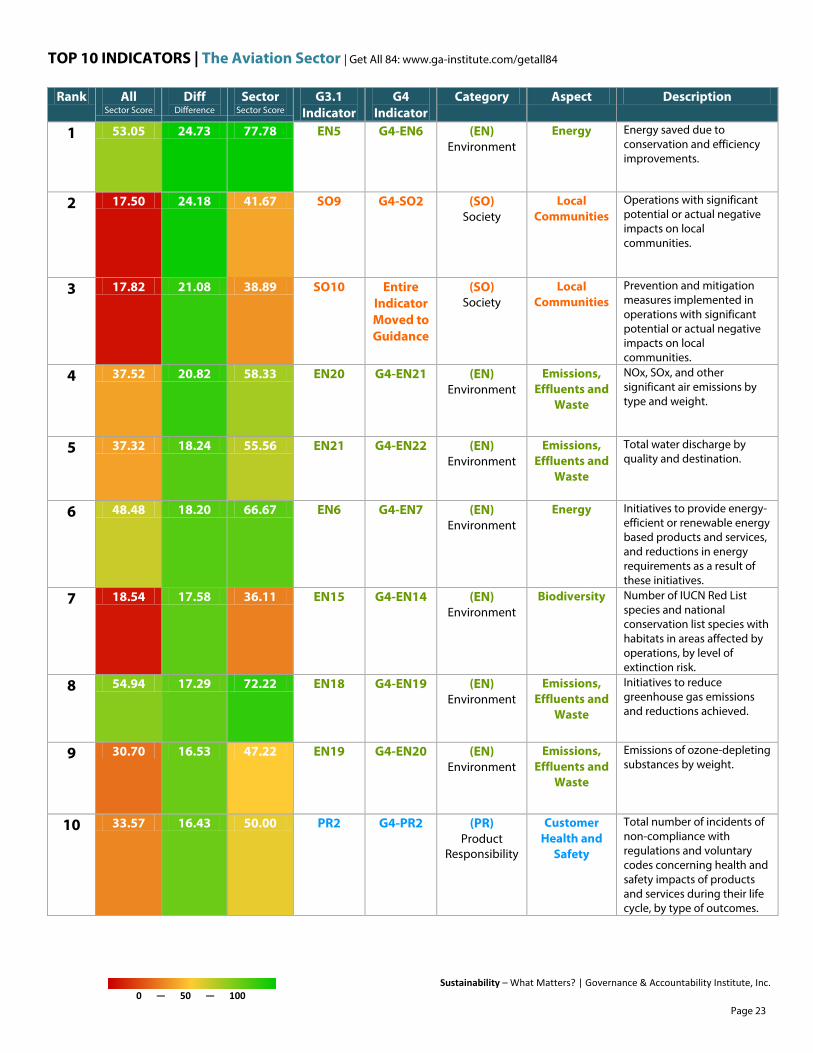
1 53.05 24.73 77.78 EN5 G4-EN6 (EN) Environment
Energy Energy saved due to conservation and efficiency improvements.
2 17.50 24.18 41.67 SO9 G4-SO2 (SO) Society
Local Communities
Operations with significant potential or actual negative impacts on local communities.
3 17.82 21.08 38.89 SO10 Entire Indicator Moved to Guidance
(SO) Society
Local Communities
Prevention and mitigation measures implemented in operations with significant potential or actual negative impacts on local communities.
4 37.52 20.82 58.33 EN20 G4-EN21 (EN) Environment
Emissions, Effluents and
Waste
NOx, SOx, and other significant air emissions by type and weight.
5 37.32 18.24 55.56 EN21 G4-EN22 (EN) Environment
Emissions, Effluents and
Waste
Total water discharge by quality and destination.
6 48.48 18.20 66.67 EN6 G4-EN7 (EN) Environment
Energy Initiatives to provide energy-efficient or renewable energy based products and services, and reductions in energy requirements as a result of these initiatives.
7 18.54 17.58 36.11 EN15 G4-EN14 (EN) Environment
Biodiversity Number of IUCN Red List species and national conservation list species with habitats in areas affected by operations, by level of extinction risk.
8 54.94 17.29 72.22 EN18 G4-EN19 (EN) Environment
Emissions, Effluents and
Waste
Initiatives to reduce greenhouse gas emissions and reductions achieved.
9 30.70 16.53 47.22 EN19 G4-EN20 (EN) Environment
Emissions, Effluents and
Waste
Emissions of ozone-depleting substances by weight.
10 33.57 16.43 50.00 PR2 G4-PR2 (PR) Product
Responsibility
Customer Health and
Safety
Total number of incidents of non-compliance with regulations and voluntary codes concerning health and safety impacts of products and services during their life cycle, by type of outcomes.
Page 23

BOTTOM 10 INDICATORS | The Aviation Sector | Get All 84: www.ga-institute.com/getall84
Sustainability – What Matters? | Governance & Accountability Institute, Inc. 0 — 50 — 100
Rank All Sector Score
Diff Difference
Sector Sector Score
G3.1 Indicator
G4 Indicator
Category Aspect Description
75 30.82 -3.04 27.78 EN30 G4-EN31, G4-EN32, G4-EN33, G4-EN34
(EN) Environment
Overall (Environmental)
Total environmental protection expenditures and investments by type.
76 36.40 -3.06 33.33 LA14 G4-LA13, G4-LA14, G4-LA15, G4-LA16
(LA) Labor
Practices and Decent Work
Equal Remuneration
for Women and Men
Ratio of basic salary and remuneration of women to men by employee category, by significant locations of operation.
77 31.02 -3.24 27.78 EN10 G4-EN10 (EN) Environment
Water Percentage and total volume of water recycled and reused.
78 51.04 -3.82 47.22 LA10 G4-LA9 (LA) Labor
Practices and Decent Work
Training and Education
Average hours of training per year per employee by gender, and by employee category.
79 23.80 -4.35 19.44 EN27 G4-EN28 (EN) Environment
Products and Services
Percentage of products sold and their packaging materials that are reclaimed by category.
80 36.20 -5.64 30.56 EN2 G4-EN2 (EN) Environment
Materials Percentage of materials used that are recycled input materials.
81 30.70 -5.69 25.00 EC5 G4-EC5 (EC) Economic
Market Presence
Range of ratios of standard entry level wage compared to local minimum wage at significant locations of operation.
82 44.78 -5.89 38.89 HR5 G4-HR4 (HR) Human Rights
Freedom of Association
and Collective Bargaining
Operations and significant suppliers identified in which the right to exercise freedom of association and collective bargaining may be at significant risk, and actions taken to support these rights.
83 42.37 -6.25 36.11 PR3 G4-PR3 (PR) Product
Responsibility
Product and Service
Labeling
Type of product and service information required by procedures, and percentage of significant products and services subject to such information requirements.
84 52.81 -8.36 44.44 LA2 G4-LA1 (LA) Labor
Practices and Decent Work
Employment Total number and rate of new employee hires and employee turnover by age group, gender, and region.
Page 24
sustainability — what matters? The Chemicals Sector
The Chemicals Sector
Sustainability – What Matters? | Governance & Accountability Institute, Inc.
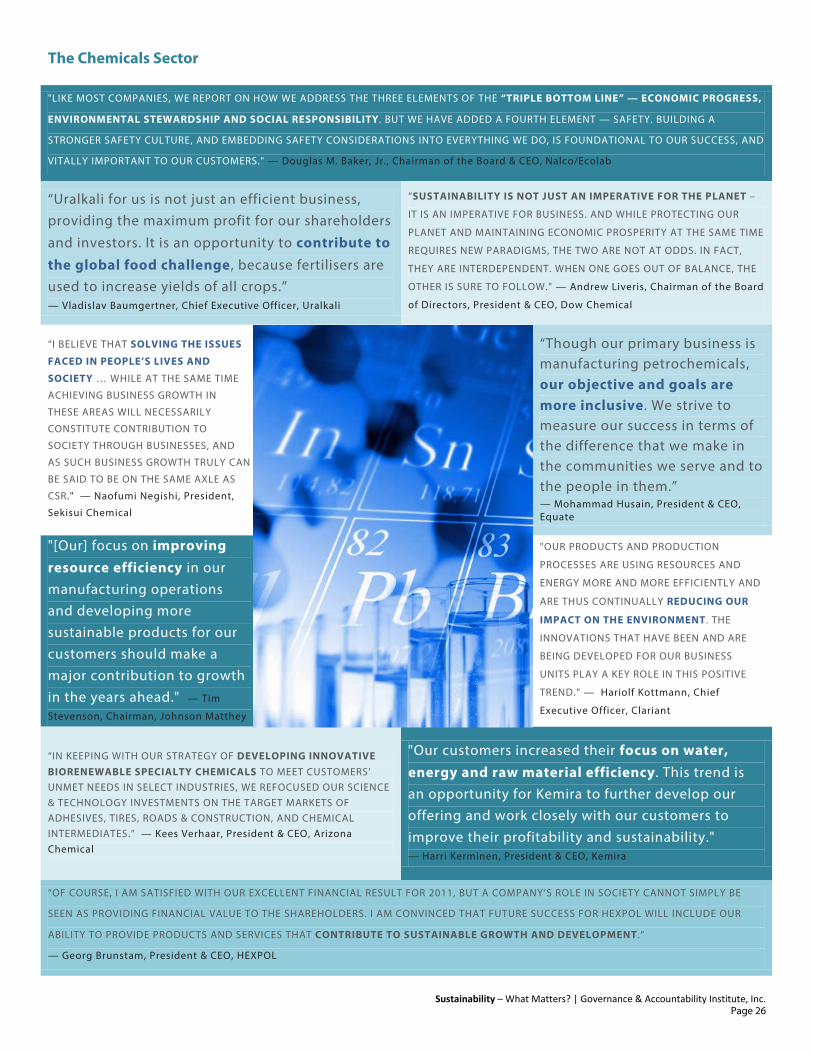
"LIKE MOST COMPANIES, WE REPORT ON HOW WE ADDRESS THE THREE ELEMENTS OF THE “TRIPLE BOTTOM LINE” — ECONOMIC PROGRESS,
ENVIRONMENTAL STEWARDSHIP AND SOCIAL RESPONSIBILITY. BUT WE HAVE ADDED A FOURTH ELEMENT — SAFETY. BUILDING A
STRONGER SAFETY CULTURE, AND EMBEDDING SAFETY CONSIDERATIONS INTO EVERYTHING WE DO, IS FOUNDATIONAL TO OUR SUCCESS, AND
VITALLY IMPORTANT TO OUR CUSTOMERS." — Douglas M. Baker, Jr., Chairman of the Board & CEO, Nalco/Ecolab
“Uralkali for us is not just an efficient business, providing the maximum profit for our shareholders
and investors. It is an opportunity to contribute to the global food challenge, because fertilisers are used to increase yields of all crops.” — Vladislav Baumgertner, Chief Executive Officer, Uralkali
“SUSTAINABILITY IS NOT JUST AN IMPERATIVE FOR THE PLANET –
IT IS AN IMPERATIVE FOR BUSINESS. AND WHILE PROTECTING OUR
PLANET AND MAINTAINING ECONOMIC PROSPERITY AT THE SAME TIME
REQUIRES NEW PARADIGMS, THE TWO ARE NOT AT ODDS. IN FACT,
THEY ARE INTERDEPENDENT. WHEN ONE GOES OUT OF BALANCE, THE
OTHER IS SURE TO FOLLOW.” — Andrew Liveris, Chairman of the Board
of Directors, President & CEO, Dow Chemical
“I BELIEVE THAT SOLVING THE ISSUES
FACED IN PEOPLE’S LIVES AND
SOCIETY … WHILE AT THE SAME TIME
ACHIEVING BUSINESS GROWTH IN
THESE AREAS WILL NECESSARILY
CONSTITUTE CONTRIBUTION TO
SOCIETY THROUGH BUSINESSES, AND
AS SUCH BUSINESS GROWTH TRULY CAN
BE SAID TO BE ON THE SAME AXLE AS
CSR." — Naofumi Negishi, President,
Sekisui Chemical
“Though our primary business is manufacturing petrochemicals, our objective and goals are more inclusive. We strive to measure our success in terms of the difference that we make in the communities we serve and to the people in them.” — Mohammad Husain, President & CEO, Equate
"[Our] focus on improving resource efficiency in our manufacturing operations and developing more sustainable products for our customers should make a major contribution to growth in the years ahead." — Tim
Stevenson, Chairman, Johnson Matthey
"OUR PRODUCTS AND PRODUCTION
PROCESSES ARE USING RESOURCES AND
ENERGY MORE AND MORE EFFICIENTLY AND
ARE THUS CONTINUALLY REDUCING OUR
IMPACT ON THE ENVIRONMENT. THE
INNOVATIONS THAT HAVE BEEN AND ARE
BEING DEVELOPED FOR OUR BUSINESS
UNITS PLAY A KEY ROLE IN THIS POSITIVE
TREND.” — Hariolf Kottmann, Chief
Executive Officer, Clariant
“IN KEEPING WITH OUR STRATEGY OF DEVELOPING INNOVATIVE BIORENEWABLE SPECIALTY CHEMICALS TO MEET CUSTOMERS’ UNMET NEEDS IN SELECT INDUSTRIES, WE REFOCUSED OUR SCIENCE & TECHNOLOGY INVESTMENTS ON THE TARGET MARKETS OF ADHESIVES, TIRES, ROADS & CONSTRUCTION, AND CHEMICAL INTERMEDIATES.” — Kees Verhaar, President & CEO, Arizona Chemical
"Our customers increased their focus on water, energy and raw material efficiency. This trend is an opportunity for Kemira to further develop our offering and work closely with our customers to improve their profitability and sustainability." — Harri Kerminen, President & CEO, Kemira
“OF COURSE, I AM SATISFIED WITH OUR EXCELLENT FINANCIAL RESULT FOR 2011, BUT A COMPANY’S ROLE IN SOCIETY CANNOT SIMPLY BE
SEEN AS PROVIDING FINANCIAL VALUE TO THE SHAREHOLDERS. I AM CONVINCED THAT FUTURE SUCCESS FOR HEXPOL WILL INCLUDE OUR
ABILITY TO PROVIDE PRODUCTS AND SERVICES THAT CONTRIBUTE TO SUSTAINABLE GROWTH AND DEVELOPMENT .”
— Georg Brunstam, President & CEO, HEXPOL
Page 26
The Chemicals Sector
Sustainability – What Matters? | Governance & Accountability Institute, Inc.
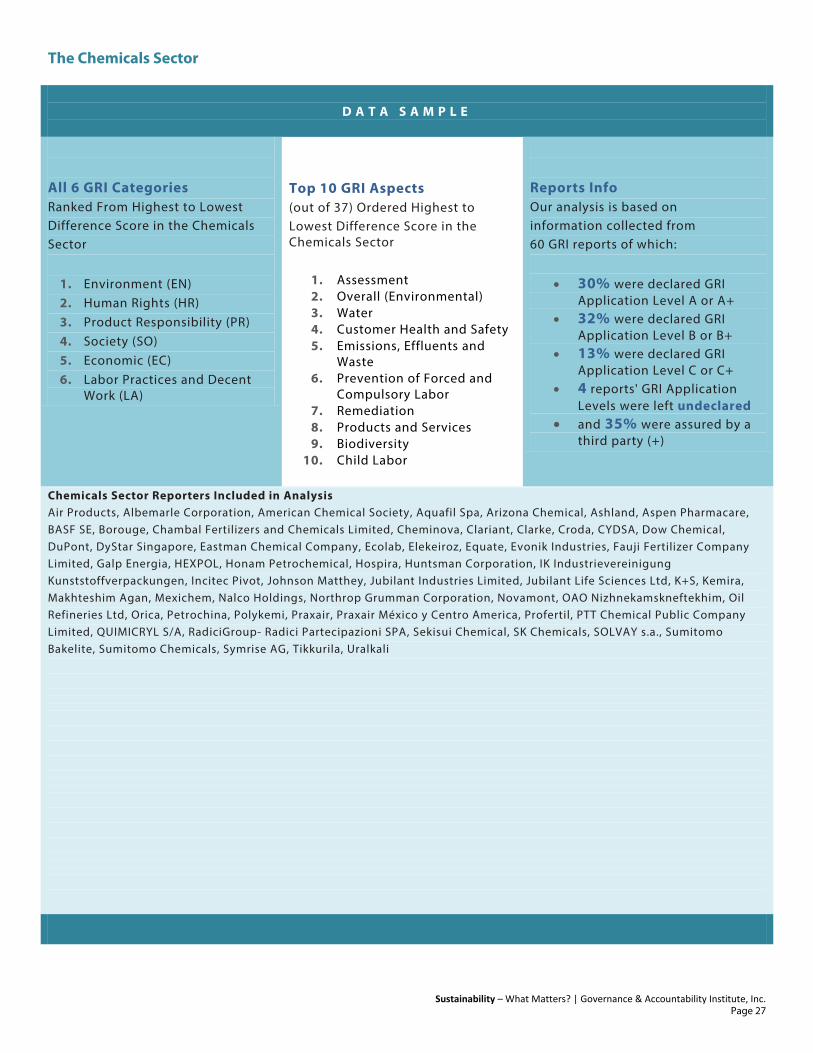
D A T A S A M P L E
All 6 GRI Categories Ranked From Highest to Lowest Difference Score in the Chemicals Sector
1. Environment (EN) 2. Human Rights (HR) 3. Product Responsibility (PR) 4. Society (SO) 5. Economic (EC) 6. Labor Practices and Decent
Work (LA)
Top 10 GRI Aspects (out of 37) Ordered Highest to Lowest Difference Score in the Chemicals Sector
1. Assessment 2. Overall (Environmental) 3. Water 4. Customer Health and Safety 5. Emissions, Effluents and
Waste 6. Prevention of Forced and
Compulsory Labor 7. Remediation 8. Products and Services 9. Biodiversity
10. Child Labor
Reports Info Our analysis is based on information collected from 60 GRI reports of which:
• 30% were declared GRI Application Level A or A+
• 32% were declared GRI Application Level B or B+
• 13% were declared GRI Application Level C or C+
• 4 reports' GRI Application Levels were left undeclared
• and 35% were assured by a third party (+)
Chemicals Sector Reporters Included in Analysis Air Products, Albemarle Corporation, American Chemical Society, Aquafil Spa, Arizona Chemical, Ashland, Aspen Pharmacare, BASF SE, Borouge, Chambal Fertilizers and Chemicals Limited, Cheminova, Clariant, Clarke, Croda, CYDSA, Dow Chemical, DuPont, DyStar Singapore, Eastman Chemical Company, Ecolab, Elekeiroz, Equate, Evonik Industries, Fauji Fertilizer Company Limited, Galp Energia, HEXPOL, Honam Petrochemical, Hospira, Huntsman Corporation, IK Industrievereinigung Kunststoffverpackungen, Incitec Pivot, Johnson Matthey, Jubilant Industries Limited, Jubilant Life Sciences Ltd, K+S, Kemira, Makhteshim Agan, Mexichem, Nalco Holdings, Northrop Grumman Corporation, Novamont, OAO Nizhnekamskneftekhim, Oil Refineries Ltd, Orica, Petrochina, Polykemi, Praxair, Praxair México y Centro America, Profertil, PTT Chemical Public Company Limited, QUIMICRYL S/A, RadiciGroup- Radici Partecipazioni SPA, Sekisui Chemical, SK Chemicals, SOLVAY s.a., Sumitomo Bakelite, Sumitomo Chemicals, Symrise AG, Tikkurila, Uralkali
Page 27
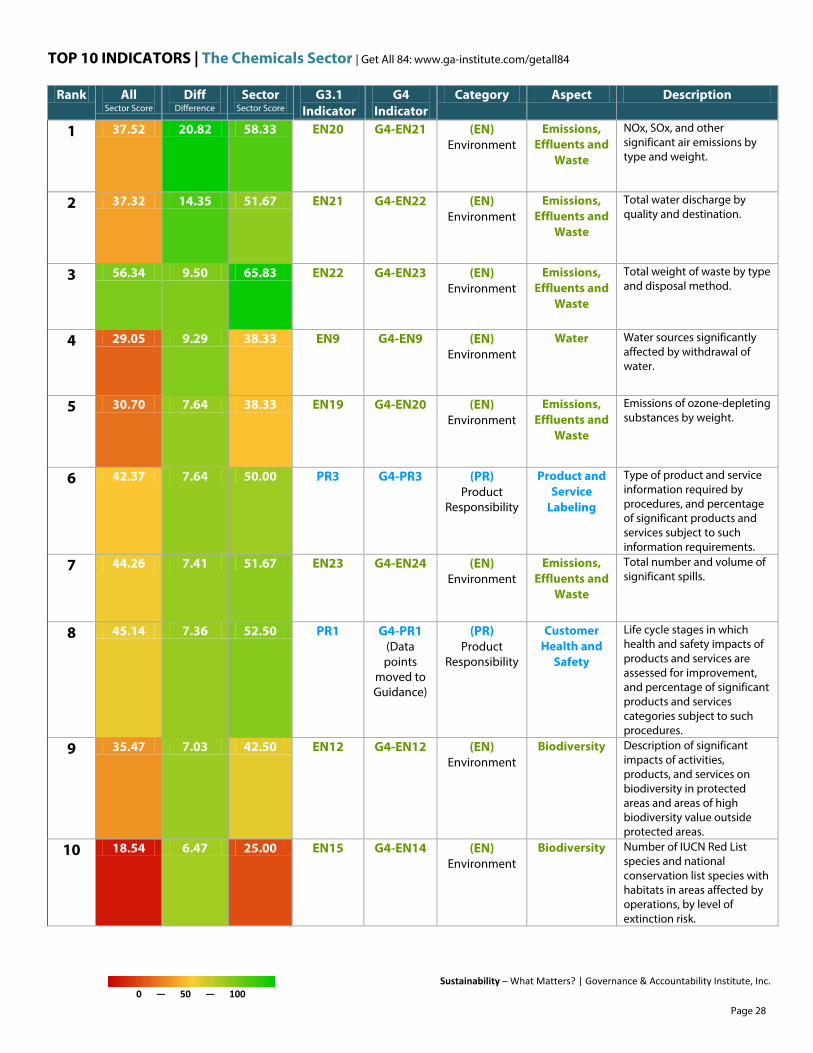
TOP 10 INDICATORS | The Chemicals Sector | Get All 84: www.ga-institute.com/getall84
Sustainability – What Matters? | Governance & Accountability Institute, Inc. 0 — 50 — 100
Rank All Sector Score
Diff Difference
Sector Sector Score
G3.1 Indicator
G4 Indicator
Category Aspect Description
1 37.52 20.82 58.33 EN20 G4-EN21 (EN) Environment
Emissions, Effluents and
Waste
NOx, SOx, and other significant air emissions by type and weight.
2 37.32 14.35 51.67 EN21 G4-EN22 (EN) Environment
Emissions, Effluents and
Waste
Total water discharge by quality and destination.
3 56.34 9.50 65.83 EN22 G4-EN23 (EN) Environment
Emissions, Effluents and
Waste
Total weight of waste by type and disposal method.
4 29.05 9.29 38.33 EN9 G4-EN9 (EN) Environment
Water Water sources significantly affected by withdrawal of water.
5 30.70 7.64 38.33 EN19 G4-EN20 (EN) Environment
Emissions, Effluents and
Waste
Emissions of ozone-depleting substances by weight.
6 42.37 7.64 50.00 PR3 G4-PR3 (PR) Product
Responsibility
Product and Service
Labeling
Type of product and service information required by procedures, and percentage of significant products and services subject to such information requirements.
7 44.26 7.41 51.67 EN23 G4-EN24 (EN) Environment
Emissions, Effluents and
Waste
Total number and volume of significant spills.
8 45.14 7.36 52.50 PR1 G4-PR1 (Data points
moved to Guidance)
(PR) Product
Responsibility
Customer Health and
Safety
Life cycle stages in which health and safety impacts of products and services are assessed for improvement, and percentage of significant products and services categories subject to such procedures.
9 35.47 7.03 42.50 EN12 G4-EN12 (EN) Environment
Biodiversity Description of significant impacts of activities, products, and services on biodiversity in protected areas and areas of high biodiversity value outside protected areas.
10 18.54 6.47 25.00 EN15 G4-EN14 (EN) Environment
Biodiversity Number of IUCN Red List species and national conservation list species with habitats in areas affected by operations, by level of extinction risk.
Page 28
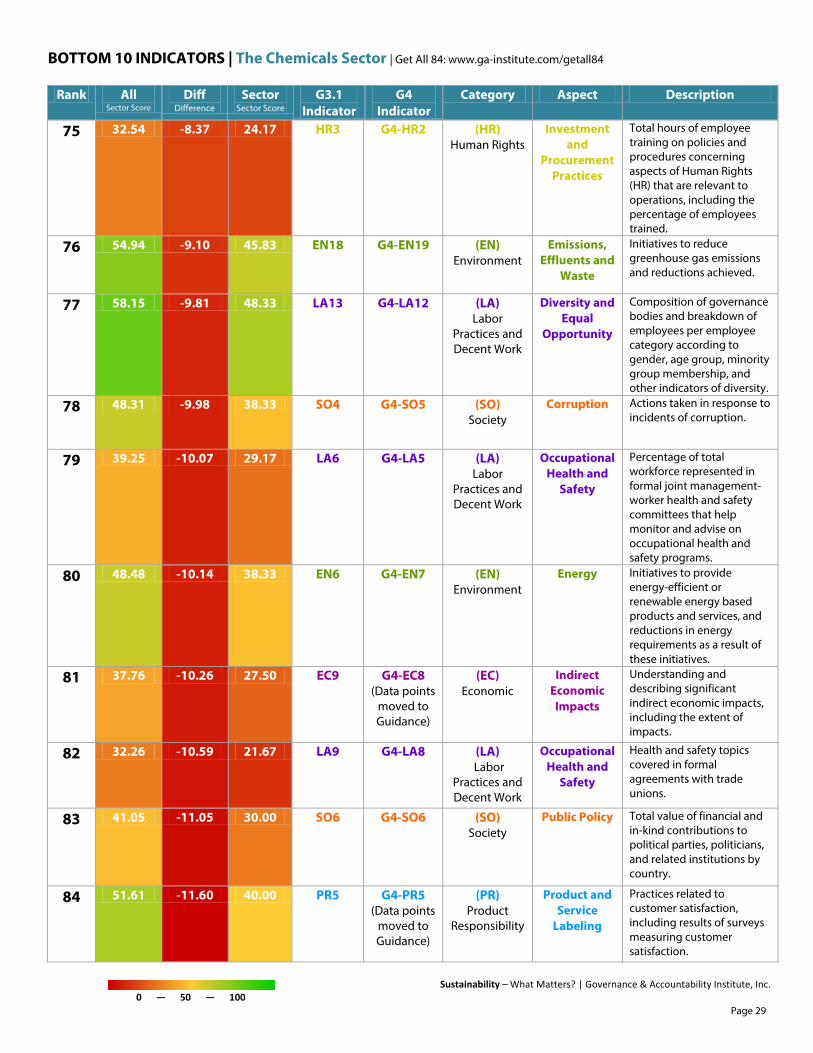
BOTTOM 10 INDICATORS | The Chemicals Sector | Get All 84: www.ga-institute.com/getall84
Sustainability – What Matters? | Governance & Accountability Institute, Inc. 0 — 50 — 100
Rank All Sector Score
Diff Difference
Sector Sector Score
G3.1 Indicator
G4 Indicator
Category Aspect Description
75 32.54 -8.37 24.17 HR3 G4-HR2 (HR) Human Rights
Investment and
Procurement Practices
Total hours of employee training on policies and procedures concerning aspects of Human Rights (HR) that are relevant to operations, including the percentage of employees trained.
76 54.94 -9.10 45.83 EN18 G4-EN19 (EN) Environment
Emissions, Effluents and
Waste
Initiatives to reduce greenhouse gas emissions and reductions achieved.
77 58.15 -9.81 48.33 LA13 G4-LA12 (LA) Labor
Practices and Decent Work
Diversity and Equal
Opportunity
Composition of governance bodies and breakdown of employees per employee category according to gender, age group, minority group membership, and other indicators of diversity.
78 48.31 -9.98 38.33 SO4 G4-SO5 (SO) Society
Corruption Actions taken in response to incidents of corruption.
79 39.25 -10.07 29.17 LA6 G4-LA5 (LA) Labor
Practices and Decent Work
Occupational Health and
Safety
Percentage of total workforce represented in formal joint management-worker health and safety committees that help monitor and advise on occupational health and safety programs.
80 48.48 -10.14 38.33 EN6 G4-EN7 (EN) Environment
Energy Initiatives to provide energy-efficient or renewable energy based products and services, and reductions in energy requirements as a result of these initiatives.
81 37.76 -10.26 27.50 EC9 G4-EC8 (Data points
moved to Guidance)
(EC) Economic
Indirect Economic Impacts
Understanding and describing significant indirect economic impacts, including the extent of impacts.
82 32.26 -10.59 21.67 LA9 G4-LA8 (LA) Labor
Practices and Decent Work
Occupational Health and
Safety
Health and safety topics covered in formal agreements with trade unions.
83 41.05 -11.05 30.00 SO6 G4-SO6 (SO) Society
Public Policy Total value of financial and in-kind contributions to political parties, politicians, and related institutions by country.
84 51.61 -11.60 40.00 PR5 G4-PR5 (Data points
moved to Guidance)
(PR) Product
Responsibility
Product and Service
Labeling
Practices related to customer satisfaction, including results of surveys measuring customer satisfaction.
Page 29

sustainability — what matters? The Commercial Services Sector
The Commercial Services Sector
Sustainability – What Matters? | Governance & Accountability Institute, Inc.
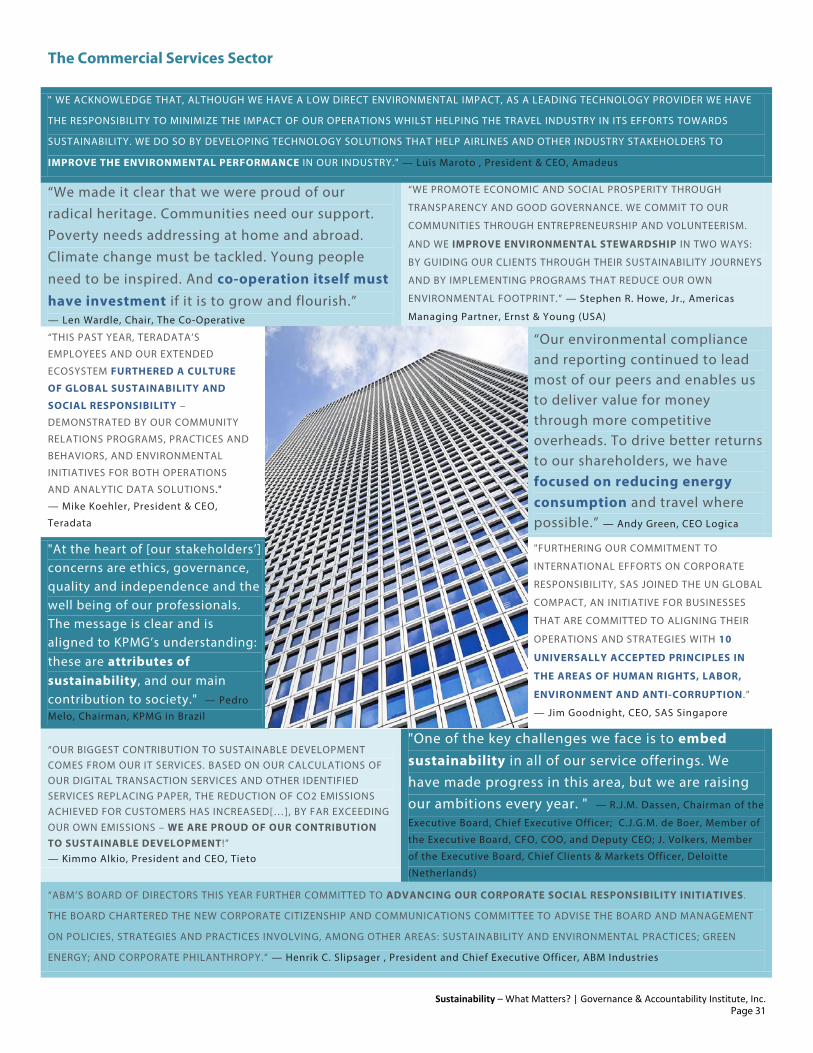
" WE ACKNOWLEDGE THAT, ALTHOUGH WE HAVE A LOW DIRECT ENVIRONMENTAL IMPACT, AS A LEADING TECHNOLOGY PROVIDER WE HAVE
THE RESPONSIBILITY TO MINIMIZE THE IMPACT OF OUR OPERATIONS WHILST HELPING THE TRAVEL INDUSTRY IN ITS EFFORTS TOWARDS
SUSTAINABILITY. WE DO SO BY DEVELOPING TECHNOLOGY SOLUTIONS THAT HELP AIRLINES AND OTHER INDUSTRY STAKEHOLDERS TO
IMPROVE THE ENVIRONMENTAL PERFORMANCE IN OUR INDUSTRY." — Luis Maroto , President & CEO, Amadeus
“We made it clear that we were proud of our radical heritage. Communities need our support. Poverty needs addressing at home and abroad. Climate change must be tackled. Young people
need to be inspired. And co-operation itself must have investment if it is to grow and flourish.” — Len Wardle, Chair, The Co-Operative
“WE PROMOTE ECONOMIC AND SOCIAL PROSPERITY THROUGH
TRANSPARENCY AND GOOD GOVERNANCE. WE COMMIT TO OUR
COMMUNITIES THROUGH ENTREPRENEURSHIP AND VOLUNTEERISM.
AND WE IMPROVE ENVIRONMENTAL STEWARDSHIP IN TWO WAYS:
BY GUIDING OUR CLIENTS THROUGH THEIR SUSTAINABILITY JOURNEYS
AND BY IMPLEMENTING PROGRAMS THAT REDUCE OUR OWN
ENVIRONMENTAL FOOTPRINT.” — Stephen R. Howe, Jr., Americas
Managing Partner, Ernst & Young (USA)
“THIS PAST YEAR, TERADATA’S
EMPLOYEES AND OUR EXTENDED
ECOSYSTEM FURTHERED A CULTURE
OF GLOBAL SUSTAINABILITY AND
SOCIAL RESPONSIBILITY –
DEMONSTRATED BY OUR COMMUNITY
RELATIONS PROGRAMS, PRACTICES AND
BEHAVIORS, AND ENVIRONMENTAL
INITIATIVES FOR BOTH OPERATIONS
AND ANALYTIC DATA SOLUTIONS."
— Mike Koehler, President & CEO,
Teradata
“Our environmental compliance and reporting continued to lead most of our peers and enables us to deliver value for money through more competitive overheads. To drive better returns to our shareholders, we have focused on reducing energy consumption and travel where possible.” — Andy Green, CEO Logica
"At the heart of [our stakeholders’] concerns are ethics, governance, quality and independence and the well being of our professionals. The message is clear and is aligned to KPMG’s understanding: these are attributes of sustainability, and our main contribution to society." — Pedro
Melo, Chairman, KPMG in Brazil
"FURTHERING OUR COMMITMENT TO
INTERNATIONAL EFFORTS ON CORPORATE
RESPONSIBILITY, SAS JOINED THE UN GLOBAL
COMPACT, AN INITIATIVE FOR BUSINESSES
THAT ARE COMMITTED TO ALIGNING THEIR
OPERATIONS AND STRATEGIES WITH 10
UNIVERSALLY ACCEPTED PRINCIPLES IN
THE AREAS OF HUMAN RIGHTS, LABOR,
ENVIRONMENT AND ANTI-CORRUPTION .”
— Jim Goodnight, CEO, SAS Singapore
“OUR BIGGEST CONTRIBUTION TO SUSTAINABLE DEVELOPMENT COMES FROM OUR IT SERVICES. BASED ON OUR CALCULATIONS OF OUR DIGITAL TRANSACTION SERVICES AND OTHER IDENTIFIED SERVICES REPLACING PAPER, THE REDUCTION OF CO2 EMISSIONS ACHIEVED FOR CUSTOMERS HAS INCREASED[…], BY FAR EXCEEDING OUR OWN EMISSIONS – WE ARE PROUD OF OUR CONTRIBUTION TO SUSTAINABLE DEVELOPMENT!” — Kimmo Alkio, President and CEO, Tieto
"One of the key challenges we face is to embed sustainability in all of our service offerings. We have made progress in this area, but we are raising our ambitions every year. " — R.J.M. Dassen, Chairman of the
Executive Board, Chief Executive Officer; C.J.G.M. de Boer, Member of
the Executive Board, CFO, COO, and Deputy CEO; J. Volkers, Member
of the Executive Board, Chief Clients & Markets Officer, Deloitte
(Netherlands)
“ABM’S BOARD OF DIRECTORS THIS YEAR FURTHER COMMITTED TO ADVANCING OUR CORPORATE SOCIAL RESPONSIBILITY INITIATIVES.
THE BOARD CHARTERED THE NEW CORPORATE CITIZENSHIP AND COMMUNICATIONS COMMITTEE TO ADVISE THE BOARD AND MANAGEMENT
ON POLICIES, STRATEGIES AND PRACTICES INVOLVING, AMONG OTHER AREAS: SUSTAINABILITY AND ENVIRONMENTAL PRACTICES; GREEN
ENERGY; AND CORPORATE PHILANTHROPY.” — Henrik C. Slipsager , President and Chief Executive Officer, ABM Industries
Page 31

The Commercial Services Sector
Sustainability – What Matters? | Governance & Accountability Institute, Inc.
D A T A S A M P L E
All 6 GRI Categories Ranked From Highest to Lowest Difference Score in the Commercial Services Sector
1. Society (SO) 2. Economic (EC) 3. Labor Practices and Decent
Work (LA) 4. Human Rights (HR) 5. Product Responsibility (PR) 6. Environment (EN))
Top 10 GRI Aspects (out of 37) Ordered Highest to Lowest Difference Score in the Commercial Services Sector
1. Customer Privacy 2. Anti-Competitive Behavior 3. Training and Education 4. Non-Discrimination 5. Compliance 6. Diversity and Equal
Opportunity 7. Economic Performance 8. Assessment 9. Freedom of Association and
Collective Bargaining 10. Corruption
Reports Info Our analysis is based on information collected from 39 GRI reports of which:
• 31% were declared GRI Application Level A or A+
• 38% were declared GRI Application Level B or B+
• 23% were declared GRI Application Level C or C+
• 3 reports’ GRI Application Levels were left undeclared
• and 51% were assured by a third party (+)
Commercial Services Sector Reporters Included in Analysis ABM Industries Incorporated, Accenture Spain, Amadeus, Antalis AG, Antaviana, Atento (Spain), Australian Centre for Corporate Social Responsibility (ACCSR), Autodesk, Cognizant, Covanta Energy, CSS Gruppe, Deloitte LLP, Deloitte Netherlands, Deloitte Spain, Deloitte USA, DM9DDB, DNV AS, Enterprise Holdings (EHI), Ernst & Young Brazil, Ernst & Young Netherlands, Ernst & Young Sweden, Ernst & Young Switzterland, Ernst & Young USA, KPMG Brazil, Landcom, LaVola, Logica, Multi Mall Management Portugal, Paharpur Business Centre, Parsons Brinckerhoff, PricewaterhouseCoopers (PwC) Netherlands, Randstad Sesa Select, SAS Singapore, Securitas Argentina, Société Générale de Surveillance (SGS) Switzerland, Teradata, The Co-operative, Tieto Corporation, Zofri
Page 32

TOP 10 INDICATORS | The Commercial Services Sector | Get All 84: www.ga-institute.com/getall84
Sustainability – What Matters? | Governance & Accountability Institute, Inc. 0 — 50 — 100
Rank All Sector Score
Diff Difference
Sector Sector Score
G3.1 Indicator
G4 Indicator
Category Aspect Description
1 35.42 14.58 50.00 PR8 G4-PR8 (PR) Product
Responsibility
Customer Privacy
Total number of substantiated complaints regarding breaches of customer privacy and losses of customer data.
2 52.77 12.62 65.38 EC8 G4-EC7 (Data points
moved to Guidance)
(EC) Economic
Indirect Economic Impacts
Development and impact of infrastructure investments and services provided primarily for public benefit through commercial, in-kind, or pro bono engagement.
3 52.77 11.34 64.10 LA12 G4-LA11 (LA) Labor
Practices and Decent Work
Training and Education
Percentage of employees receiving regular performance and career development reviews, by gender.
4 44.74 10.39 55.13 PR9 G4-PR9 (PR) Product
Responsibility
Compliance Monetary value of significant fines for non-compliance with laws and regulations concerning the provision and use of products and services.
5 52.81 10.02 62.82 LA2 G4-LA1 (LA) Labor
Practices and Decent Work
Employment Total number and rate of new employee hires and employee turnover by age group, gender, and region.
6 42.78 9.79 52.56 SO7 G4-SO7 (SO) Society
Anti-Competitive
Behavior
Total number of legal actions for anti-competitive behavior, anti-trust, and monopoly practices and their outcomes.
7 49.68 9.30 58.97 SO8 G4-SO8, G4-SO9,
G4-SO10, G4-SO11
(SO) Society
Compliance Monetary value of significant fines and total number of non-monetary sanctions for non-compliance with laws and regulations.
8 46.31 8.83 55.13 EC4 G4-EC4 (EC) Economic
Economic Performance
Significant financial assistance received from government.
9 50.24 7.46 57.69 HR4 G4-HR3 (HR) Human Rights
Non-Discrimination
Total number of incidents of discrimination and corrective actions taken.
10 51.61 7.37 58.97 PR5 G4-PR5 (Data points
moved to Guidance)
(PR) Product
Responsibility
Product and Service
Labeling
Practices related to customer satisfaction, including results of surveys measuring customer satisfaction.
Page 33

BOTTOM 10 INDICATORS | The Commercial Services Sector | Get All 84: www.ga-institute.com/getall84
Sustainability – What Matters? | Governance & Accountability Institute, Inc. 0 — 50 — 100
Rank All Sector Score
Diff Difference
Sector Sector Score
G3.1 Indicator
G4 Indicator
Category Aspect Description
75 18.54 -14.69 3.85 EN15 G4-EN14 (EN) Environment
Biodiversity Number of IUCN Red List species and national conservation list species with habitats in areas affected by operations, by level of extinction risk.
76 29.05 -14.95 14.10 EN9 G4-EN9 (EN) Environment
Water Water sources significantly affected by withdrawal of water.
77 29.57 -15.47 14.10 EN13 G4-EN13 (EN) Environment
Biodiversity Habitats protected or restored.
78 37.32 -15.52 21.79 EN21 G4-EN22 (EN) Environment
Emissions, Effluents and
Waste
Total water discharge by quality and destination.
79 35.47 -16.24 19.23 EN12 G4-EN12 (EN) Environment
Biodiversity Description of significant impacts of activities, products, and services on biodiversity in protected areas and areas of high biodiversity value outside protected areas.
80 45.14 -16.93 28.21 PR1 G4-PR1 (Data points
moved to Guidance)
(PR) Product
Responsibility
Customer Health and
Safety
Life cycle stages in which health and safety impacts of products and services are assessed for improvement, and percentage of significant products and services categories subject to such procedures.
81 33.31 -17.92 15.38 EN14 Entire Indicator Moved to Guidance
(EN) Environment
Biodiversity Strategies, current actions, and future plans for managing impacts on biodiversity.
82 37.52 -18.28 19.23 EN20 G4-EN21 (EN) Environment
Emissions, Effluents and
Waste
NOx, SOx, and other significant air emissions by type and weight.
83 44.26 -18.62 25.64 EN23 G4-EN24 (EN) Environment
Emissions, Effluents and
Waste
Total number and volume of significant spills.
84 42.37 -19.29 23.08 PR3 G4-PR3 (PR) Product
Responsibility
Product and Service
Labeling
Type of product and service information required by procedures, and percentage of significant products and services subject to such information requirements.
Page 34

sustainability — what matters? The Computers Sector

The Computers Sector
Sustainability – What Matters? | Governance & Accountability Institute, Inc.
"BEYOND DIRECT SERVICE TO THE COMMUNITY, WE MADE SIGNIFICANT STRIDES IN THE AREAS OF HUMAN RIGHTS AND ENVIRONMENTAL
SUSTAINABILITY. WE CONSULTED WITH BUSINESSES, GOVERNMENT AND OTHER KEY STAKEHOLDERS TO DEVELOP A HUMAN RIGHTS
STATEMENT THAT BRINGS TOGETHER LONG-STANDING POLICIES ON ISSUES SUCH AS PRIVACY, SECURITY, FREE EXPRESSION AND LABOR
RIGHTS. AND, WE EXCEEDED OUR GOAL TO CUT CARBON EMISSIONS BY 30 PERCENT COMPARED WITH 2007, DUE IN PART TO THE 1.1 BILLION
KILOWATT HOURS OF GREEN POWER WE PURCHASED, THE THIRD MOST OF ANY US COMPANY." — Steven A. Ballmer, CEO, Microsoft
“This core philosophy of advancing human potential is not limited to Dell solutions and product creation. We are also applying it to how we invest in and innovate on behalf of our planet and our people. It is ingrained in our sustainability and giving practices as well as in our relationships with our global team.” — Michael Dell, Chairman and CEO, Dell
“WE’RE HELPING IMPROVE WORLD WORKING AND LIVING STANDARDS
THROUGH THE POWER AND LEVERAGE OF OUR SUPPLY CHAIN. WE’RE
[ALSO] HELPING MAKE THE WORLD GREENER BY CONTINUING TO
MEET AND EXCEED OUR INDUSTRY-LEADING GOALS FOR REDUCING
THE ENVIRONMENTAL IMPACT OF OUR OPERATIONS AND PRODUCTS,
AND BY HELPING OUR CUSTOMERS REDUCE THEIR ENVIRONMENTAL
IMPACT.” — Meg Whitman, CEO, Hewlett Packard (HP)
“WE CONTINUED TO FACE CHALLENGES
IN THE AREAS OF WATER
CONSERVATION AND CHEMICAL WASTE
REDUCTION, BUT WE HAVE SET NEW
2020 ENVIRONMENTAL GOALS TO
DRIVE CONTINUOUS IMPROVEMENT IN
BOTH OUR MANUFACTURING
OPERATIONS AND THE ENERGY
EFFICIENCY OF OUR PRODUCTS."
— Paul S. Otellini, President & Chief
Executive Officer, Intel
“By leading the IT industry’s shift from physical to virtual to cloud, we will enable companies to reduce carbon emissions while increasing efficiency and lowering costs.” — Bill McCracken, Chief Executive Officer; Art Weinbach, Chairman of the Board, CA Technologies
“Our aim now is to turn great preparation into great results. Our five-year sustainability goals, to reduce energy, water and greenhouse gas emissions per chip, will help keep us on track.” — Rich Templeton, Chairman,
President and Chief Executive Officer,
Texas Instruments
"[W]E REMAIN ONE OF THE 45 COMPANIES
PARTICIPATING IN THE UNGC LEAD PROGRAM
– SIGNALING OUR COMMITMENT TO THE
PRINCIPLES OF HUMAN RIGHTS,
ENVIRONMENTAL PROTECTION, AND
BUSINESS ETHICS EMBEDDED IN THE
GLOBAL COMPACT FRAMEWORK ."
— Steve Bennett, President, CEO & Chairman,
Symantec
“INTERNALLY, WE WILL REMAIN COMMITTED TO OUR WORK ON DIVERSITY AND INCLUSION, ETHICAL BUSINESS PRACTICES AND CULTIVATING A SUPPORTIVE, PRODUCTIVE WORK ENVIRONMENT. EXTERNALLY, WE WILL CONTINUE TO BE GOOD NEIGHBORS IN OUR COMMUNITIES, PROTECT THE ENVIRONMENT AND ENSURE THAT OUR SUPPLIERS MEET THE SAME EXPECTATIONS WE HOLD OURSELVES ACCOUNTABLE FOR WHILE ENGAGING WITH OUR STAKEHOLDERS OPENLY AND HONESTLY.” — Rory Read, CEO and President, Advanced Micro Devices (AMD)
"I am particularly proud of the fact that we have chosen remanufacturing and reuse over recycling and were able to divert over 49 million pounds of materials from the landfills in 2012. This enabled us to save more natural resources, use less energy, and reduce waste. In addition, we offset our energy use in the United States through our commitment to green energy." — James J. Cerkleski, CEO, Clover Technologies
“[THE] SHARED BELIEF IN A HIGHER PURPOSE REAFFIRMS ASPIRATIONS AND VALUES THAT HAVE BEEN AT THE CORE OF THIS ENTERPRISE SINCE
ITS INCEPTION, MORE THAN A CENTURY AGO. THESE NEVER CHANGE. BUT THEY ARE BEING REANIMATED AND REDIRECTED TODAY THANKS TO
A RADICALLY NEW ERA IN TECHNOLOGY—THE EMERGENCE OF NEW TOOLS AND WAYS OF WORKING THAT CAN MAKE OUR WORLD MORE
SUSTAINABLE, EFFICIENT, EQUITABLE AND INTELLIGENT .” — Virginia M. Rometty, President and Chief Executive Officer, IBM
Page 36
The Computers Sector
Sustainability – What Matters? | Governance & Accountability Institute, Inc.
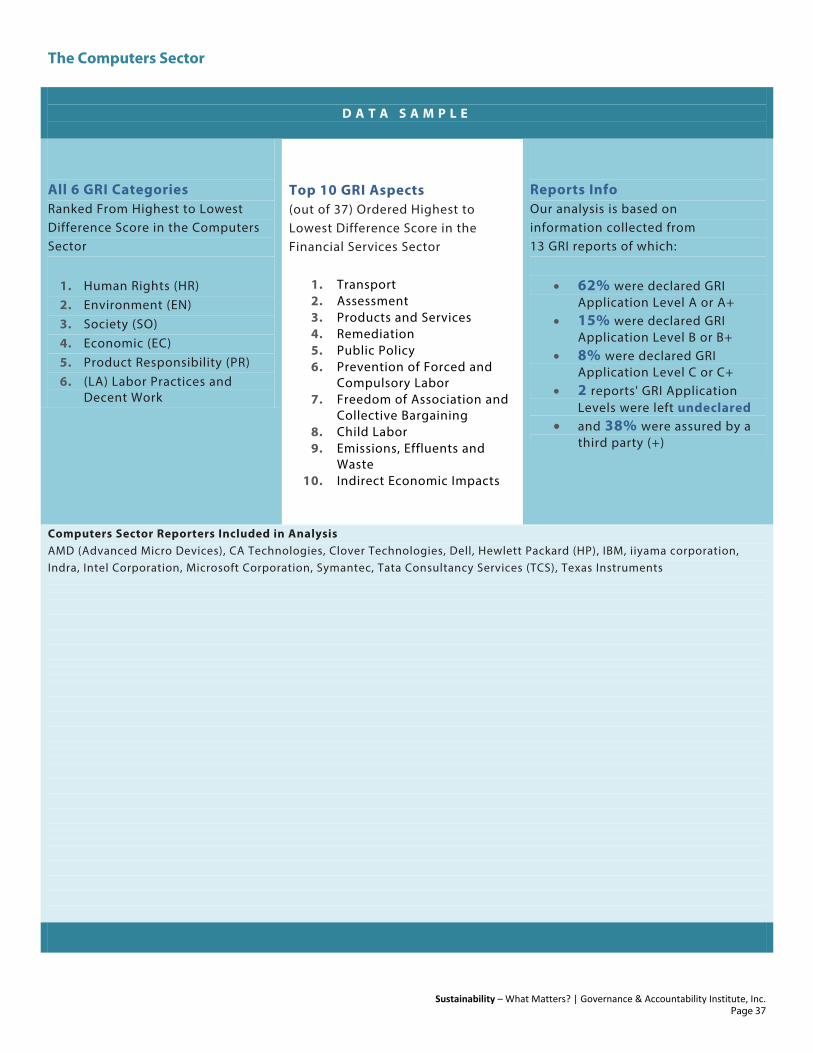
D A T A S A M P L E
All 6 GRI Categories Ranked From Highest to Lowest Difference Score in the Computers Sector
1. Human Rights (HR) 2. Environment (EN) 3. Society (SO) 4. Economic (EC) 5. Product Responsibility (PR) 6. (LA) Labor Practices and
Decent Work
Top 10 GRI Aspects (out of 37) Ordered Highest to Lowest Difference Score in the Financial Services Sector
1. Transport 2. Assessment 3. Products and Services 4. Remediation 5. Public Policy 6. Prevention of Forced and
Compulsory Labor 7. Freedom of Association and
Collective Bargaining 8. Child Labor 9. Emissions, Effluents and
Waste 10. Indirect Economic Impacts
Reports Info Our analysis is based on information collected from 13 GRI reports of which:
• 62% were declared GRI Application Level A or A+
• 15% were declared GRI Application Level B or B+
• 8% were declared GRI Application Level C or C+
• 2 reports' GRI Application Levels were left undeclared
• and 38% were assured by a third party (+)
Computers Sector Reporters Included in Analysis AMD (Advanced Micro Devices), CA Technologies, Clover Technologies, Dell, Hewlett Packard (HP), IBM, iiyama corporation, Indra, Intel Corporation, Microsoft Corporation, Symantec, Tata Consultancy Services (TCS), Texas Instruments
Page 37

TOP 10 INDICATORS | The Computers Sector | Get All 84: www.ga-institute.com/getall84
Sustainability – What Matters? | Governance & Accountability Institute, Inc. 0 — 50 — 100
Rank All Sector Score
Diff Difference
Sector Sector Score
G3.1 Indicator
G4 Indicator
Category Aspect Description
1 35.51 45.26 80.77 EN29 G4-EN30 (EN) Environment
Transport Significant environmental impacts of transporting products and other goods and materials used for the organization's operations, and transporting members of the workforce.
2 23.80 41.59 65.38 EN27 G4-EN28 (EN) Environment
Products and Services
Percentage of products sold and their packaging materials that are reclaimed by category.
3 30.70 38.54 69.23 EN19 G4-EN20 (EN) Environment
Emissions, Effluents and
Waste
Emissions of ozone-depleting substances by weight.
4 16.29 37.56 53.85 HR10 G4-HR9, G4-HR11
(HR) Human Rights
Assessment Percentage and total number of operations that have been subject to Human Rights (HR) reviews and/or impact assessments.
5 44.74 36.03 80.77 EN17 G4-EN17, G4-EN18
(EN) Environment
Emissions, Effluents and
Waste
Other relevant indirect greenhouse gas emissions by weight.
6 41.05 35.88 76.92 SO6 G4-SO6 (SO) Society Public Policy Total value of financial and in-kind contributions to political parties, politicians, and related institutions by country.
7 42.74 34.19 76.92 EC6 G4-EC9 (EC) Economic
Market Presence
Policy, practices, and proportion of spending on locally-based suppliers at significant locations of operation.
8 39.25 33.84 73.08 HR2 G4-HR10 (HR) Human Rights
Investment and
Procurement Practices
Percentage of significant suppliers, contractors, and other business partners that have undergone Human Rights (HR) screening and actions taken.
9 18.22 31.79 50.00 HR11 G4-HR12 (HR) Human Rights
Remediation Number of grievances related to Human Rights (HR) filed, addressed, and resolved through formal grievance mechanisms.
10 49.36 31.42 80.77 EC2 GF-EC2 (EC) Economic
Economic Performance
Financial implications and other risks and opportunities for the organization's activities due to climate change.
Page 38
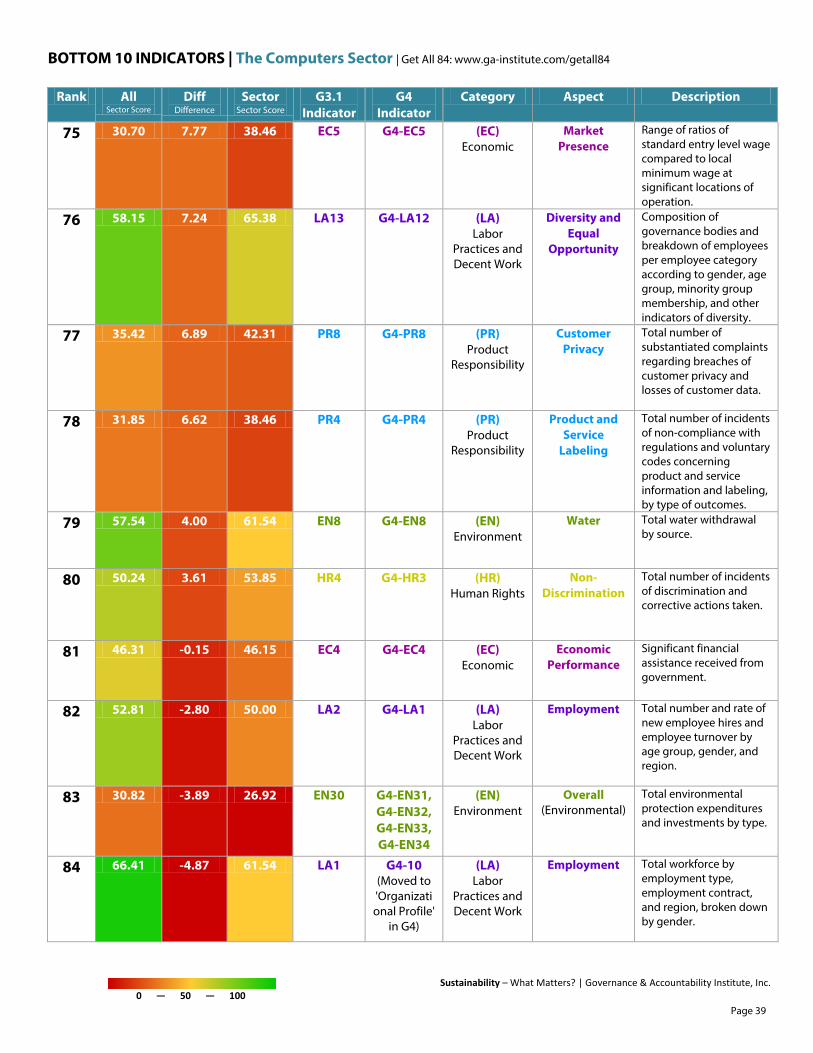
BOTTOM 10 INDICATORS | The Computers Sector | Get All 84: www.ga-institute.com/getall84
Sustainability – What Matters? | Governance & Accountability Institute, Inc. 0 — 50 — 100
Rank All Sector Score
Diff Difference
Sector Sector Score
G3.1 Indicator
G4 Indicator
Category Aspect Description
75 30.70 7.77 38.46 EC5 G4-EC5 (EC) Economic
Market Presence
Range of ratios of standard entry level wage compared to local minimum wage at significant locations of operation.
76 58.15 7.24 65.38 LA13 G4-LA12 (LA) Labor
Practices and Decent Work
Diversity and Equal
Opportunity
Composition of governance bodies and breakdown of employees per employee category according to gender, age group, minority group membership, and other indicators of diversity.
77 35.42 6.89 42.31 PR8 G4-PR8 (PR) Product
Responsibility
Customer Privacy
Total number of substantiated complaints regarding breaches of customer privacy and losses of customer data.
78 31.85 6.62 38.46 PR4 G4-PR4 (PR) Product
Responsibility
Product and Service
Labeling
Total number of incidents of non-compliance with regulations and voluntary codes concerning product and service information and labeling, by type of outcomes.
79 57.54 4.00 61.54 EN8 G4-EN8 (EN) Environment
Water Total water withdrawal by source.
80 50.24 3.61 53.85 HR4 G4-HR3 (HR) Human Rights
Non-Discrimination
Total number of incidents of discrimination and corrective actions taken.
81 46.31 -0.15 46.15 EC4 G4-EC4 (EC) Economic
Economic Performance
Significant financial assistance received from government.
82 52.81 -2.80 50.00 LA2 G4-LA1 (LA) Labor
Practices and Decent Work
Employment Total number and rate of new employee hires and employee turnover by age group, gender, and region.
83 30.82 -3.89 26.92 EN30 G4-EN31, G4-EN32, G4-EN33, G4-EN34
(EN) Environment
Overall (Environmental)
Total environmental protection expenditures and investments by type.
84 66.41 -4.87 61.54 LA1 G4-10 (Moved to 'Organizational Profile'
in G4)
(LA) Labor
Practices and Decent Work
Employment Total workforce by employment type, employment contract, and region, broken down by gender.
Page 39
sustainability — what matters? The Conglomerates Sector

The Conglomerates Sector
Sustainability – What Matters? | Governance & Accountability Institute, Inc.
"DURING THE YEAR UNDER REVIEW, WE HAVE SEEN NUMEROUS CONTRIBUTIONS TO SUSTAINABILITY THROUGH INNOVATIVE INITIATIVES SUCH
AS RENEWABLE ENERGY LIGHTING, CO-GENERATION UTILISING WASTE HEAT OF GENERATORS, MANUFACTURE OF BIO-DIESEL USING WASTE
COOKING OIL AND A COMPLETELY ORGANIC HYDROPONICS GARDEN. WHAT IS REMARKABLE IS THAT ALL THESE CONTRIBUTIONS HAVE COME
FROM OUR OWN STAFF AND WERE DEVELOPED IN-HOUSE USING MAINLY RECYCLED MATERIAL. THIS IS AN INDICATION THAT THE CULTURE
OF SUSTAINABILITY AND INNOVATION IS BECOMING A PART OF THE DNA OF THE GROUP ." — Susantha Ratnayake, Chairman,
John Keells Group
“2011 showed us that SEKEM’s sustainable bus- iness model proved resilient to these exogenous shocks. It reinforces and validates our strategy to include human development and to not only in-corporate economic but also societal and cultural life as well as the ecology into all our management considerations.” — Helmy Abouleish, Managing Director, SEKEM Group
“WE KNOW THAT WE DON’T HAVE ALL THE ANSWERS TO THE
SUSTAINABILITY CHALLENGES WE FACE, BUT WE BELIEVE THAT WE
DO ASK THE RIGHT QUESTIONS—AND WE ACT ON WHAT WE LEARN.
WE’RE COMMITTED TO PURSUING A PRECAUTIONARY APPROACH TO
THE CSR ISSUES ON OUR HORIZON OVER THE NEXT THREE TO FIVE
YEARS, SUPPORTED BY ACTIVE RISK MANAGEMENT POLICIES AND
PROCEDURES.” — Pierre Beaudoin, President & CEO; Daniel Desjardins,
Senior Vice President, General Counsel and CSR Chairman, Bombardier “INTERNALLY, OUR CODE OF CONDUCT CONTINUES TO BE OUR GUIDING PRINCIPLE. BUT WE ALSO MONITOR HOW OUR SUPPLIERS COMPLY WITH THE CODE’S PRINCIPLES OF RESPONSIBILITY. FURTHERMORE, WE ENCOURAGE BOTH SUPPLIERS AND PARTNERS TO FOLLOW OUR LEAD AND ADOPT THE UN GLOBAL COMPACT’S PRINCIPLES FOR RESPONSIBLE BUSINESS PRACTICES." — Peter Nilsson, President & CEO, Trelleborg Group
“In a challenging global economic environment and an even more difficult national one, we all have to set the foundations for a better future for ourselves and the future generations, something completely aligned with the concept of responsible and sustainable operation.” — Apostolos Petalas, CEO, Fourlis Group
"For the coming year, the top three priorities for the Group will be to improve safety, boost energy efficiency, and enhance our talent development and retention programmes so that we are able to position the Group for sustainable growth." — Choo Chiau Beng, Chief Executive Officer, Keppel Corporation
"WE RECOGNISE THAT THERE ARE CHALL- ENGES RELATED TO THE CREATION OF LONG TERM SUSTAINABLE DEVELOPMENT IN GROWTH MARKETS, SUCH AS INCREASED RESOURCE USE, PROTECTION OF HUMAN RIGHTS AND CLIMATE CHANGE. WE FOCUS ON DOING BUSINESS IN A RESPONSIBLE MANNER, NOT LEAST ENABLING LOCAL BUSINESSES TO EXPAND AND TAKE RESPONS- IBILITY FOR THEIR PEOPLE AND THEIR ENVIRONMENT.” — A.P. Moller, Executive Board, Maersk Group
“OUR COMPANY PRODUCES THE MEANS TO DRIVE OUR CARS AND BUSES, LIGHT UP OUR HOMES AND KEEP OUR INDUSTRIES RUNNING. UNARGUABLY, THE SECTORS’ IMPACT ON THE ENVIRONMENT, ECONOMY, AND SOCIETY IS IMMENSE. ONE OF OUR BIGGEST CHALLENGES IN OPERATING SUCH A LARGE PORTFOLIO LIES IN MAXIMISING ITS POSITIVE IMPACT ON THE PLANET.” — Naresh Nayyar, Chief Executive Officer, Essar Shipping
"Going forward, the implementation of CSR programs is expected to continue to improve in terms of the number of activities, program outreach, and quality of execution. At the same time, these CSR programs need to be effectively communicated and made known to the broader segments of the general public." — Budi Setiadharma, President Commissioner, Astra International
“WE HAVE BEEN PRACTICING SUSTAINABILITY FOR MUCH OF BALL‘S 132-YEAR HISTORY, AND WE HAVE MADE GREAT PROGRESS ON THIS
JOURNEY. OVER THE PAST FIVE YEARS, WE HAVE FOCUSED ON MEASURING AND IMPROVING OUR SUSTAINABILITY PERFORMANCE WITHIN OUR
FACILITIES. WE HAVE ALSO BROADENED OUR SCOPE TO COLLABORATE WITH CUSTOMERS AND SUPPLIERS TO DETERMINE OPPORTUNITIES
THAT PROVIDE THE GREATEST SUSTAINABILITY IMPACT WITHIN THE SUPPLY CHAIN OF OUR PRODUCTS.” — John A. Hayes, President and
Chief Executive Officer, Ball Corporation
Page 41

The Conglomerates Sector
Sustainability – What Matters? | Governance & Accountability Institute, Inc.
D A T A S A M P L E
All 6 GRI Categories Ranked From Highest to Lowest Difference Score in the Conglomerates Sector
1. Society (SO) 2. Labor Practices and Decent
Work (LA) 3. Environment (EN) 4. Product Responsibility (PR) 5. Economic (EC) 6. Human Rights (HR)
Top 10 GRI Aspects (out of 37) Ordered Highest to Lowest Difference Score in the Conglomerates Sector
1. Child Labor 2. Water 3. Compliance 4. Prevention of Forced and
Compulsory Labor 5. Employment 6. Non-Discrimination 7. Training and Education 8. Freedom of Association and
Collective Bargaining 9. Economic Performance
10. Marketing Communications
Reports Info Our analysis is based on information collected from 23 GRI reports of which:
• 17% were declared GRI Application Level A or A+
• 61% were declared GRI Application Level B or B+
• 17% were declared GRI Application Level C or C+
• 1 report’s GRI Application Levels was left undeclared
• and 52% were assured by a third party (+)
Conglomerates Sector Reporters Included in Analysis 3M Company, ALFA, Astra International, Ball Corporation, Bayer AG, Bombardier, Essar Shipping, Fourlis Group of Companies, Georg Fischer, John Keells Group, Keppel Corporation, Maersk Group, Mytilineos Holdings S.A., Piepenbrock Unternehmensgruppe, Reliance Industries Limited, SEKEM Group, Sembcorp Industries Ltd, Sime Darby Berhad, Suez Environment, TASA, ThyssenKrupp AG, Trelleborg Group, Votorantim Industrial S/A
Page 42
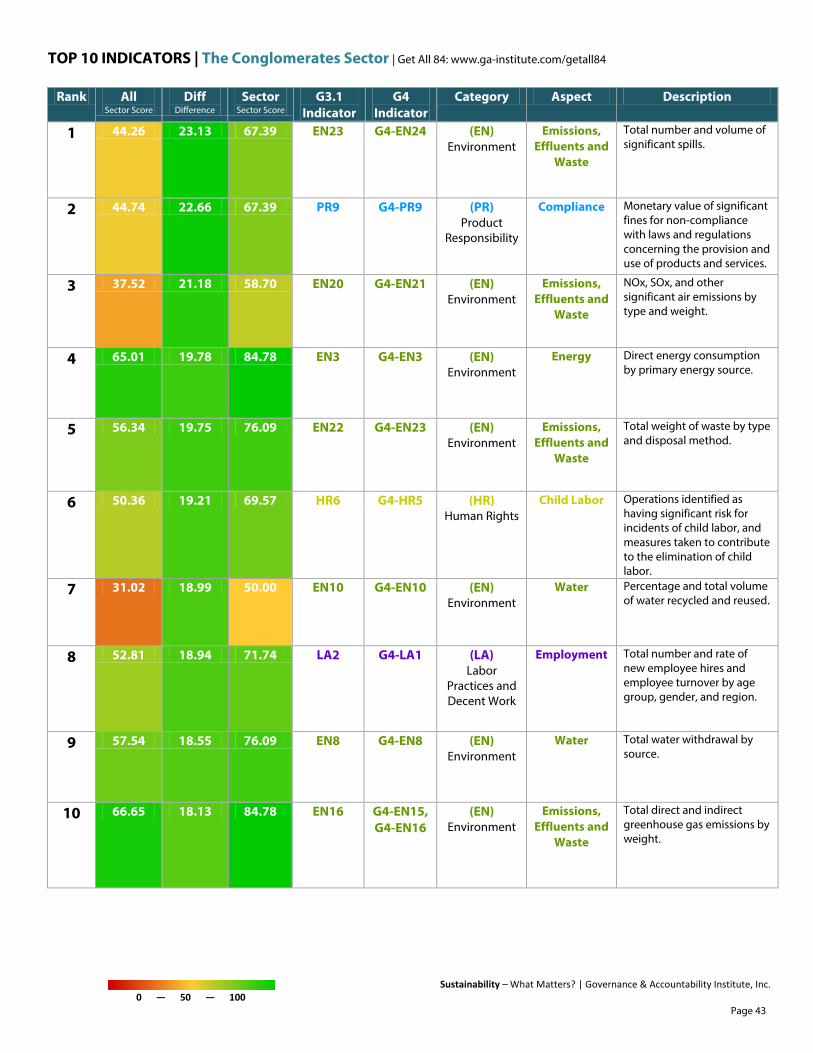
TOP 10 INDICATORS | The Conglomerates Sector | Get All 84: www.ga-institute.com/getall84
Sustainability – What Matters? | Governance & Accountability Institute, Inc. 0 — 50 — 100
Rank All Sector Score
Diff Difference
Sector Sector Score
G3.1 Indicator
G4 Indicator
Category Aspect Description
1 44.26 23.13 67.39 EN23 G4-EN24 (EN) Environment
Emissions, Effluents and
Waste
Total number and volume of significant spills.
2 44.74 22.66 67.39 PR9 G4-PR9 (PR) Product
Responsibility
Compliance Monetary value of significant fines for non-compliance with laws and regulations concerning the provision and use of products and services.
3 37.52 21.18 58.70 EN20 G4-EN21 (EN) Environment
Emissions, Effluents and
Waste
NOx, SOx, and other significant air emissions by type and weight.
4 65.01 19.78 84.78 EN3 G4-EN3 (EN) Environment
Energy Direct energy consumption by primary energy source.
5 56.34 19.75 76.09 EN22 G4-EN23 (EN) Environment
Emissions, Effluents and
Waste
Total weight of waste by type and disposal method.
6 50.36 19.21 69.57 HR6 G4-HR5 (HR) Human Rights
Child Labor Operations identified as having significant risk for incidents of child labor, and measures taken to contribute to the elimination of child labor.
7 31.02 18.99 50.00 EN10 G4-EN10 (EN) Environment
Water Percentage and total volume of water recycled and reused.
8 52.81 18.94 71.74 LA2 G4-LA1 (LA) Labor
Practices and Decent Work
Employment Total number and rate of new employee hires and employee turnover by age group, gender, and region.
9 57.54 18.55 76.09 EN8 G4-EN8 (EN) Environment
Water Total water withdrawal by source.
10 66.65 18.13 84.78 EN16 G4-EN15, G4-EN16
(EN) Environment
Emissions, Effluents and
Waste
Total direct and indirect greenhouse gas emissions by weight.
Page 43

BOTTOM 10 INDICATORS | The Conglomerates Sector | Get All 84: www.ga-institute.com/getall84
Sustainability – What Matters? | Governance & Accountability Institute, Inc. 0 — 50 — 100
Rank All Sector Score
Diff Difference
Sector Sector Score
G3.1 Indicator
G4 Indicator
Category Aspect Description
75 43.70 -2.39 41.30 EN1 G4-EN1 (EN) Environment
Materials Materials used by weight or volume.
76 16.29 -3.24 13.04 HR10 G4-HR9, G4-HR11
(HR) Human Rights
Assessment Percentage and total number of operations that have been subject to Human Rights (HR) reviews and/or impact assessments.
77 43.14 -4.00 39.13 EN7 G4-EN6 (EN) Environment
Energy Initiatives to reduce indirect energy consumption and reductions achieved.
78 21.67 -4.27 17.39 EN24 G4-EN25 (EN) Environment
Emissions, Effluents and
Waste
Weight of transported, imported, exported, or treated waste deemed hazardous under the terms of the Basel Convention Annex I, II, III, and VIII, and percentage of transported waste shipped internationally.
79 32.54 -4.28 28.26 HR3 G4-HR2 (HR) Human Rights
Investment and
Procurement Practices
Total hours of employee training on policies and procedures concerning aspects of Human Rights (HR) that are relevant to operations, including the percentage of employees trained.
80 35.51 -7.25 28.26 EN29 G4-EN30 (EN) Environment
Transport Significant environmental impacts of transporting products and other goods and materials used for the organization's operations, and transporting members of the workforce.
81 33.35 -7.25 26.09 HR1 G4-HR1 (HR) Human Rights
Investment and
Procurement Practices
Percentage and total number of significant investment agreements and contracts that include Human Rights (HR) clauses or that have undergone Human Rights (HR) screening.
82 51.61 -8.12 43.48 PR5 G4-PR5 (Data points
moved to Guidance)
(PR) Product
Responsibility
Product and Service
Labeling
Practices related to customer satisfaction, including results of surveys measuring customer satisfaction.
83 37.76 -9.49 28.26 EC9 G4-EC8 (Data points
moved to Guidance)
(EC) Economic
Indirect Economic Impacts
Understanding and describing significant indirect economic impacts, including the extent of impacts.
84 44.74 -9.96 34.78 EN17 G4-EN17, G4-EN18
(EN) Environment
Emissions, Effluents and
Waste
Other relevant indirect greenhouse gas emissions by weight.
Page 44
sustainability — what matters? The Construction Sector
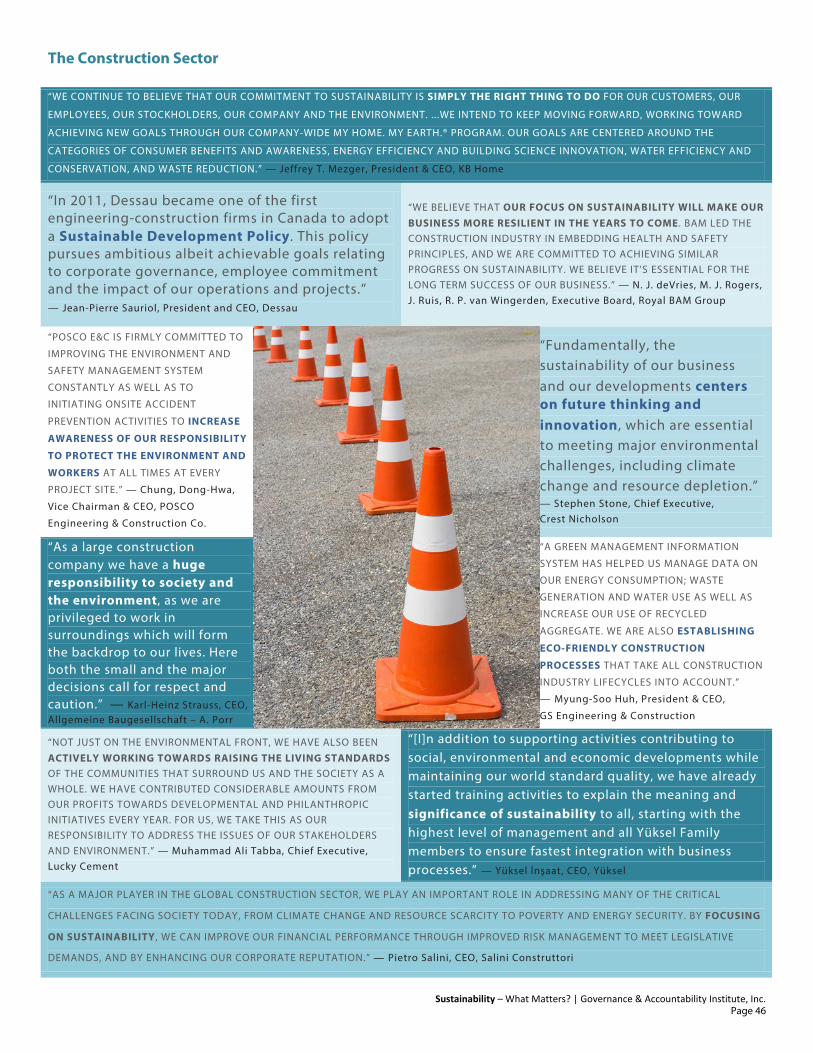
The Construction Sector
Sustainability – What Matters? | Governance & Accountability Institute, Inc.
“WE CONTINUE TO BELIEVE THAT OUR COMMITMENT TO SUSTAINABILITY IS SIMPLY THE RIGHT THING TO DO FOR OUR CUSTOMERS, OUR
EMPLOYEES, OUR STOCKHOLDERS, OUR COMPANY AND THE ENVIRONMENT. ...WE INTEND TO KEEP MOVING FORWARD, WORKING TOWARD
ACHIEVING NEW GOALS THROUGH OUR COMPANY-WIDE MY HOME. MY EARTH.® PROGRAM. OUR GOALS ARE CENTERED AROUND THE
CATEGORIES OF CONSUMER BENEFITS AND AWARENESS, ENERGY EFFICIENCY AND BUILDING SCIENCE INNOVATION, WATER EFFICIENCY AND
CONSERVATION, AND WASTE REDUCTION.” — Jeffrey T. Mezger, President & CEO, KB Home
“In 2011, Dessau became one of the first engineering-construction firms in Canada to adopt a Sustainable Development Policy. This policy pursues ambitious albeit achievable goals relating to corporate governance, employee commitment and the impact of our operations and projects.” — Jean-Pierre Sauriol, President and CEO, Dessau
“WE BELIEVE THAT OUR FOCUS ON SUSTAINABILITY WILL MAKE OUR BUSINESS MORE RESILIENT IN THE YEARS TO COME . BAM LED THE CONSTRUCTION INDUSTRY IN EMBEDDING HEALTH AND SAFETY PRINCIPLES, AND WE ARE COMMITTED TO ACHIEVING SIMILAR PROGRESS ON SUSTAINABILITY. WE BELIEVE IT’S ESSENTIAL FOR THE LONG TERM SUCCESS OF OUR BUSINESS.” — N. J. deVries, M. J. Rogers, J. Ruis, R. P. van Wingerden, Executive Board, Royal BAM Group
“POSCO E&C IS FIRMLY COMMITTED TO
IMPROVING THE ENVIRONMENT AND
SAFETY MANAGEMENT SYSTEM
CONSTANTLY AS WELL AS TO
INITIATING ONSITE ACCIDENT
PREVENTION ACTIVITIES TO INCREASE
AWARENESS OF OUR RESPONSIBILITY
TO PROTECT THE ENVIRONMENT AND
WORKERS AT ALL TIMES AT EVERY
PROJECT SITE.” — Chung, Dong-Hwa,
Vice Chairman & CEO, POSCO
Engineering & Construction Co.
“Fundamentally, the sustainability of our business and our developments centers on future thinking and innovation, which are essential to meeting major environmental challenges, including climate change and resource depletion.” — Stephen Stone, Chief Executive, Crest Nicholson
“As a large construction company we have a huge responsibility to society and the environment, as we are privileged to work in surroundings which will form the backdrop to our lives. Here both the small and the major decisions call for respect and caution.” — Karl-Heinz Strauss, CEO, Allgemeine Baugesellschaft – A. Porr
“A GREEN MANAGEMENT INFORMATION
SYSTEM HAS HELPED US MANAGE DATA ON
OUR ENERGY CONSUMPTION; WASTE
GENERATION AND WATER USE AS WELL AS
INCREASE OUR USE OF RECYCLED
AGGREGATE. WE ARE ALSO ESTABLISHING
ECO-FRIENDLY CONSTRUCTION
PROCESSES THAT TAKE ALL CONSTRUCTION
INDUSTRY LIFECYCLES INTO ACCOUNT.”
— Myung-Soo Huh, President & CEO,
GS Engineering & Construction
“NOT JUST ON THE ENVIRONMENTAL FRONT, WE HAVE ALSO BEEN ACTIVELY WORKING TOWARDS RAISING THE LIVING STANDARDS OF THE COMMUNITIES THAT SURROUND US AND THE SOCIETY AS A WHOLE. WE HAVE CONTRIBUTED CONSIDERABLE AMOUNTS FROM OUR PROFITS TOWARDS DEVELOPMENTAL AND PHILANTHROPIC INITIATIVES EVERY YEAR. FOR US, WE TAKE THIS AS OUR RESPONSIBILITY TO ADDRESS THE ISSUES OF OUR STAKEHOLDERS AND ENVIRONMENT.” — Muhammad Ali Tabba, Chief Executive, Lucky Cement
“[I]n addition to supporting activities contributing to social, environmental and economic developments while maintaining our world standard quality, we have already started training activities to explain the meaning and significance of sustainability to all, starting with the highest level of management and all Yüksel Family members to ensure fastest integration with business processes.” — Yüksel İnşaat, CEO, Yüksel
“AS A MAJOR PLAYER IN THE GLOBAL CONSTRUCTION SECTOR, WE PLAY AN IMPORTANT ROLE IN ADDRESSING MANY OF THE CRITICAL
CHALLENGES FACING SOCIETY TODAY, FROM CLIMATE CHANGE AND RESOURCE SCARCITY TO POVERTY AND ENERGY SECURITY. BY FOCUSING
ON SUSTAINABILITY, WE CAN IMPROVE OUR FINANCIAL PERFORMANCE THROUGH IMPROVED RISK MANAGEMENT TO MEET LEGISLATIVE
DEMANDS, AND BY ENHANCING OUR CORPORATE REPUTATION.” — Pietro Salini, CEO, Salini Construttori
Page 46
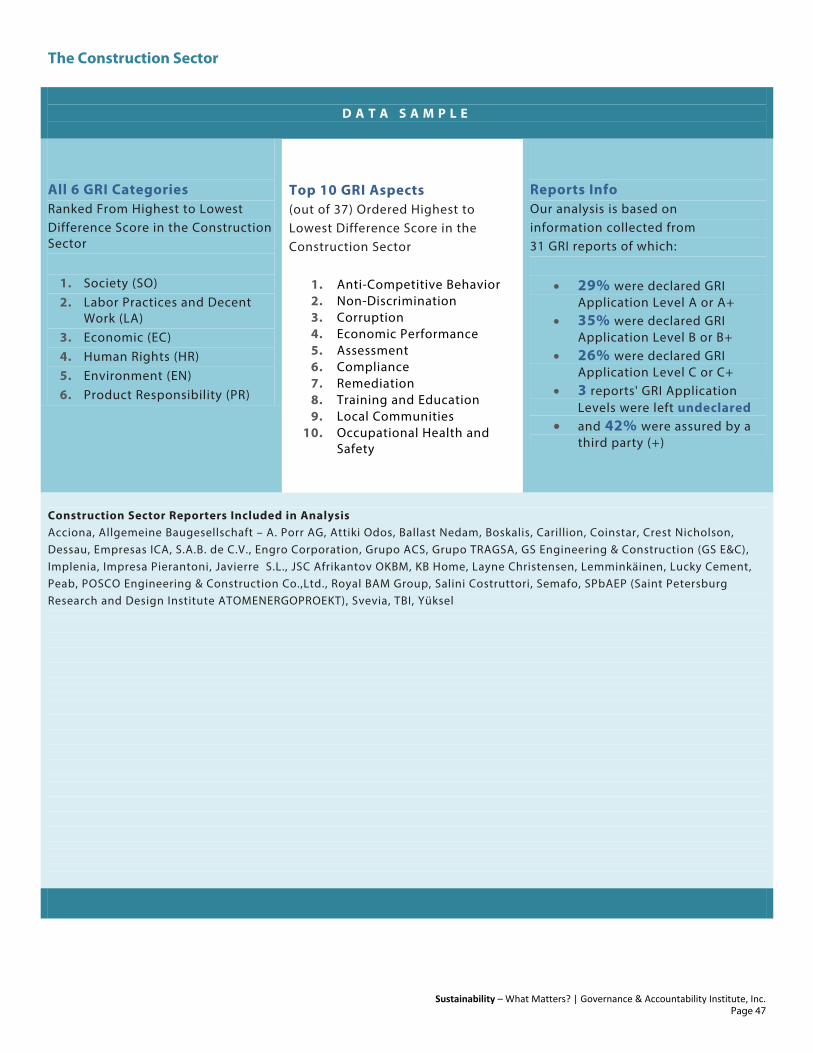
The Construction Sector
Sustainability – What Matters? | Governance & Accountability Institute, Inc.
D A T A S A M P L E
All 6 GRI Categories Ranked From Highest to Lowest Difference Score in the Construction Sector
1. Society (SO) 2. Labor Practices and Decent
Work (LA) 3. Economic (EC) 4. Human Rights (HR) 5. Environment (EN) 6. Product Responsibility (PR)
Top 10 GRI Aspects (out of 37) Ordered Highest to Lowest Difference Score in the Construction Sector
1. Anti-Competitive Behavior 2. Non-Discrimination 3. Corruption 4. Economic Performance 5. Assessment 6. Compliance 7. Remediation 8. Training and Education 9. Local Communities
10. Occupational Health and Safety
Reports Info Our analysis is based on information collected from 31 GRI reports of which:
• 29% were declared GRI Application Level A or A+
• 35% were declared GRI Application Level B or B+
• 26% were declared GRI Application Level C or C+
• 3 reports' GRI Application Levels were left undeclared
• and 42% were assured by a third party (+)
Construction Sector Reporters Included in Analysis Acciona, Allgemeine Baugesellschaft – A. Porr AG, Attiki Odos, Ballast Nedam, Boskalis, Carillion, Coinstar, Crest Nicholson, Dessau, Empresas ICA, S.A.B. de C.V., Engro Corporation, Grupo ACS, Grupo TRAGSA, GS Engineering & Construction (GS E&C), Implenia, Impresa Pierantoni, Javierre S.L., JSC Afrikantov OKBM, KB Home, Layne Christensen, Lemminkäinen, Lucky Cement, Peab, POSCO Engineering & Construction Co.,Ltd., Royal BAM Group, Salini Costruttori, Semafo, SPbAEP (Saint Petersburg Research and Design Institute ATOMENERGOPROEKT), Svevia, TBI, Yüksel
Page 47
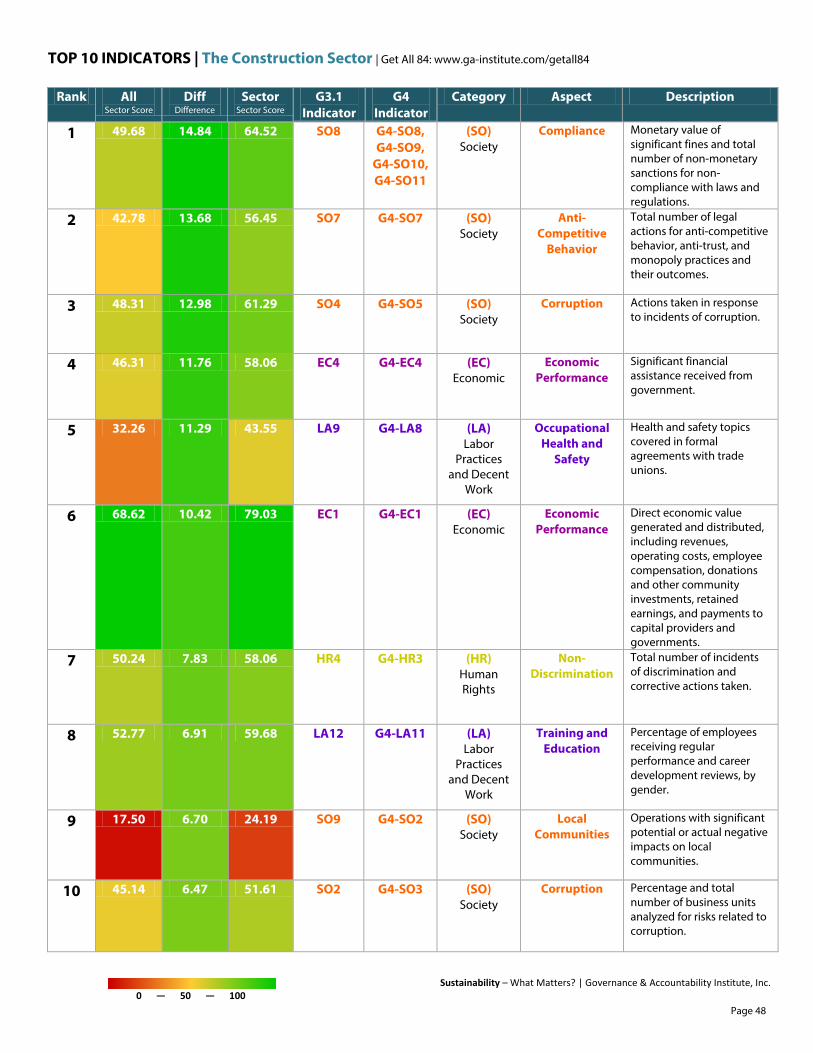
TOP 10 INDICATORS | The Construction Sector | Get All 84: www.ga-institute.com/getall84
Sustainability – What Matters? | Governance & Accountability Institute, Inc. 0 — 50 — 100
Rank All Sector Score
Diff Difference
Sector Sector Score
G3.1 Indicator
G4 Indicator
Category Aspect Description
1 49.68 14.84 64.52 SO8 G4-SO8, G4-SO9,
G4-SO10, G4-SO11
(SO) Society
Compliance Monetary value of significant fines and total number of non-monetary sanctions for non-compliance with laws and regulations.
2 42.78 13.68 56.45 SO7 G4-SO7 (SO) Society
Anti-Competitive
Behavior
Total number of legal actions for anti-competitive behavior, anti-trust, and monopoly practices and their outcomes.
3 48.31 12.98 61.29 SO4 G4-SO5 (SO) Society
Corruption Actions taken in response to incidents of corruption.
4 46.31 11.76 58.06 EC4 G4-EC4 (EC) Economic
Economic Performance
Significant financial assistance received from government.
5 32.26 11.29 43.55 LA9 G4-LA8 (LA) Labor
Practices and Decent
Work
Occupational Health and
Safety
Health and safety topics covered in formal agreements with trade unions.
6 68.62 10.42 79.03 EC1 G4-EC1 (EC) Economic
Economic Performance
Direct economic value generated and distributed, including revenues, operating costs, employee compensation, donations and other community investments, retained earnings, and payments to capital providers and governments.
7 50.24 7.83 58.06 HR4 G4-HR3 (HR) Human Rights
Non-Discrimination
Total number of incidents of discrimination and corrective actions taken.
8 52.77 6.91 59.68 LA12 G4-LA11 (LA) Labor
Practices and Decent
Work
Training and Education
Percentage of employees receiving regular performance and career development reviews, by gender.
9 17.50 6.70 24.19 SO9 G4-SO2 (SO) Society
Local Communities
Operations with significant potential or actual negative impacts on local communities.
10 45.14 6.47 51.61 SO2 G4-SO3 (SO) Society
Corruption Percentage and total number of business units analyzed for risks related to corruption.
Page 48
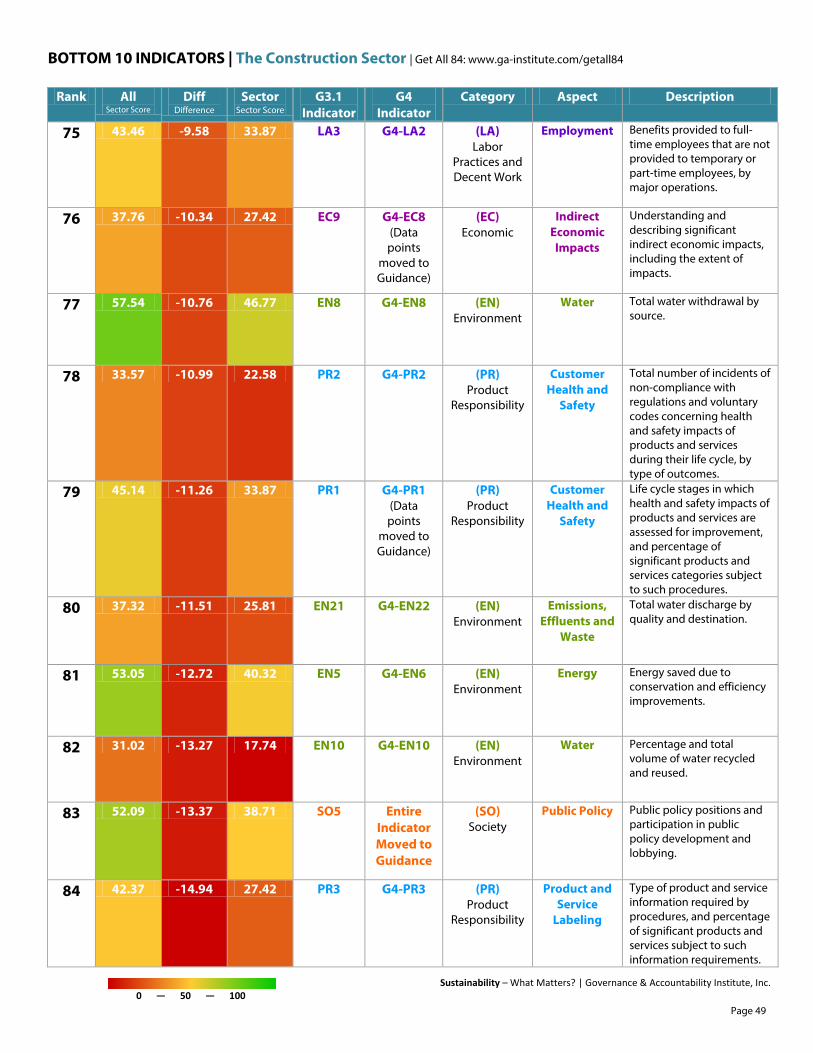
BOTTOM 10 INDICATORS | The Construction Sector | Get All 84: www.ga-institute.com/getall84
Sustainability – What Matters? | Governance & Accountability Institute, Inc. 0 — 50 — 100
Rank All Sector Score
Diff Difference
Sector Sector Score
G3.1 Indicator
G4 Indicator
Category Aspect Description
75 43.46 -9.58 33.87 LA3 G4-LA2 (LA) Labor
Practices and Decent Work
Employment Benefits provided to full-time employees that are not provided to temporary or part-time employees, by major operations.
76 37.76 -10.34 27.42 EC9 G4-EC8 (Data points
moved to Guidance)
(EC) Economic
Indirect Economic Impacts
Understanding and describing significant indirect economic impacts, including the extent of impacts.
77 57.54 -10.76 46.77 EN8 G4-EN8 (EN) Environment
Water Total water withdrawal by source.
78 33.57 -10.99 22.58 PR2 G4-PR2 (PR) Product
Responsibility
Customer Health and
Safety
Total number of incidents of non-compliance with regulations and voluntary codes concerning health and safety impacts of products and services during their life cycle, by type of outcomes.
79 45.14 -11.26 33.87 PR1 G4-PR1 (Data points
moved to Guidance)
(PR) Product
Responsibility
Customer Health and
Safety
Life cycle stages in which health and safety impacts of products and services are assessed for improvement, and percentage of significant products and services categories subject to such procedures.
80 37.32 -11.51 25.81 EN21 G4-EN22 (EN) Environment
Emissions, Effluents and
Waste
Total water discharge by quality and destination.
81 53.05 -12.72 40.32 EN5 G4-EN6 (EN) Environment
Energy Energy saved due to conservation and efficiency improvements.
82 31.02 -13.27 17.74 EN10 G4-EN10 (EN) Environment
Water Percentage and total volume of water recycled and reused.
83 52.09 -13.37 38.71 SO5 Entire Indicator Moved to Guidance
(SO) Society
Public Policy Public policy positions and participation in public policy development and lobbying.
84 42.37 -14.94 27.42 PR3 G4-PR3 (PR) Product
Responsibility
Product and Service
Labeling
Type of product and service information required by procedures, and percentage of significant products and services subject to such information requirements.
Page 49

sustainability — what matters? The Construction Materials Sector

The Construction Materials Sector
Sustainability – What Matters? | Governance & Accountability Institute, Inc.
"THE OVERALL RESULT OF OUR CARBON REDUCTION STRATEGY—WHICH ALSO INCLUDES REDUCTION IN CLINKER FACTOR IN OUR
PRODUCTION PROCESSES, INVESTMENT IN CLEAN DEVELOPMENT MECHANISM PROJECTS, AND INCREASED USE OF RENEWABLE ENERGY FROM
INITIATIVES LIKE OUR EURUS WIND FARM IN MEXICO—HAS BEEN TO REDUCE OUR SPECIFIC NET CO2 EMISSIONS PER TON OF CEMENT BY
ALMOST 23 PERCENT FROM 1990 LEVELS. THAT IS THE EQUIVALENT OF THE EMISSIONS GENERATED BY 900 THOUSAND HOMES PER YEAR."
— Lorenzo H. Zambrano, Chairman of the Board and CEO, CEMEX
“In January 2012, we issued a Directive on the use of contract workers. The Directive formalizes the obligation of Group companies to address all national regulations, but also the core conventions of the International Labor Organization and the requirements of the UN Global Compact, to which we are committed.” — Rolf Soiron, Chairman of the Board of Directors, Holcim
“THE COMMITMENT TO SUSTAINABLE GROWTH IS ALSO EXPRESSED IN
[OUR] INCENTIVES FOR R&D ACTIVITIES, WHETHER INTERNALLY OR
THROUGH PARTNERSHIPS WITH UNIVERSITIES, WITH THE MAIN FOCUS
BEING ON ENVIRONMENTAL COMPATIBILITY. CO2 REDUCTION IS A
MAJOR CHALLENGE OF THE INDUSTRY AND, ACCORDINGLY, AN
IMPORTANT PART OF INVESTMENT HAS BEEN DIRECTED AT PURSUING
EVER MORE DEMANDING GOALS.” — Francisco de Lacerda, Chief
Executive Officer, Cimpor
“GLOBALLY, IN 2011 WE CONTINUED TO PARTICIPATE ACTIVELY IN THE WORLD BUSINESS COUNCIL FOR SUSTAINABLE DEVELOPMENT (WBCSD), ENDORSING THE VISION 2050 PLATFORM AND INCLUSIVE BUSINESS PRACTICES, WHICH WILL ENABLE US TO PARTICIPATE IN THE RIO+20 SUMMIT WITH A BUSINESS COMMITMENT PROPOSAL. BASED ON THIS PLATFORM, WE [ARE] PROPOSING WAYS AND CHALLENGES TO BE MET BY 2025, PROMOTING INNOVATION AND ECO-EFFICIENCY." — Roberto Salas Guzmán, CEO, Masisa (Grupo Nueva)
“We achieved our tenth consecutive year of safety improvement, reflecting our commitment to our employees to have an environment that fosters injury-free lives.” — Mike Thaman, Chairman & CEO; Frank O’Brien-Bernini, Vice President, Chief Sustainability Officer, Owens Corning
“Social and ecological issues, in addition to economic aspects, are vital factors for sustainably profitable growth. This is why we have made sustainable eco- nomic activities a top priority at PALGINGER. Our major concern is not short-term profit operation, but rather long-term, sustainable success.” — Herbert Ortner, CEO, Palfinger
“AS YOU WOULD EXPECT FROM A COMPANY OF OUR SCALE AND NATURE, WE ARE ALSO ACUTELY AWARE OF OUR RESPONSIBILITY TO USE NATURAL RESOURCES WISELY AND TO CUT WASTES, WHEREVER POSSIBLE. DURING 2011, WE ACHIEVED A 95% REDUCTION IN THE AMOUNT OF WASTE WE SEND TO LICENSED DISPOSAL AND REDUCED THE AMOUNT OF POTABLE WATER WE USE IN CONCRETE AND MORTAR PRODUCTION BY 33% SINCE 2004.” — Terry Last, CEO, Tarmac
“IN ORDER TO ACCELERATE OUR CONTRIBUTION TOWARDS A MORE SUSTAINABLE WORLD , MORE THAN HALF OF OUR RESEARCH AND DEVELOPMENT EFFORTS HAS BEEN DEVOTED TO SUSTAINABLE DEVELOPMENT. OUR OFFER OF LOW CARBON MATERIALS/PRODUCTS AND SOLUTIONS HAVE BEEN EXTENDED, WITH PRODUCT DEVELOPMENTS PROVIDING MANY ATTRIBUTES, SUCH AS COMFORT, ENERGY EFFICIENCY AND AESTHETICS, ALONGSIDE SUSTAINABLE PRODUCTS SUCH AS HYDROMEDIA - A NEW GENERATION POROUS CONCRETE THAT ALLOWS FOR RAINWATER MANAGEMENT.” — Bruno Lafont, Chairman & Chief Executive Officer, Lafarge
“Looking more specifically at our sustainability program, in most areas we are on track but in some we face difficulties […] in large part this is a function of market demand for different types of product but we would also make more progress if we were able to make more beneficial use of alternative fuels, as happens in other EU countries.” — Pierre Deleplanque,
Chief Executive Office, Hercules General Cement
“ON ENVIRONMENTAL MATTERS WE PROMOTE A PROACTIVE APPROACH TO ALL ENVIRONMENTAL ISSUES AND CLIMATE CHANGE AND OUR
COMPLIANCE WITH THE APPLICABLE ENVIRONMENTAL LAWS AND REGULATIONS REMAINS AT A VERY HIGH LEVEL. WE HAVE CONTINUED TO
APPLY OUR WELL ESTABLISHED ENVIRONMENTAL DUE DILIGENCE PROCEDURES TO NEW ACQUISITIONS AND ANY IMPROVEMENT
RECOMMENDATIONS ARE FOLLOWED UP PROMPTLY.” — Miles Lee, CEO, CRH
Page 51
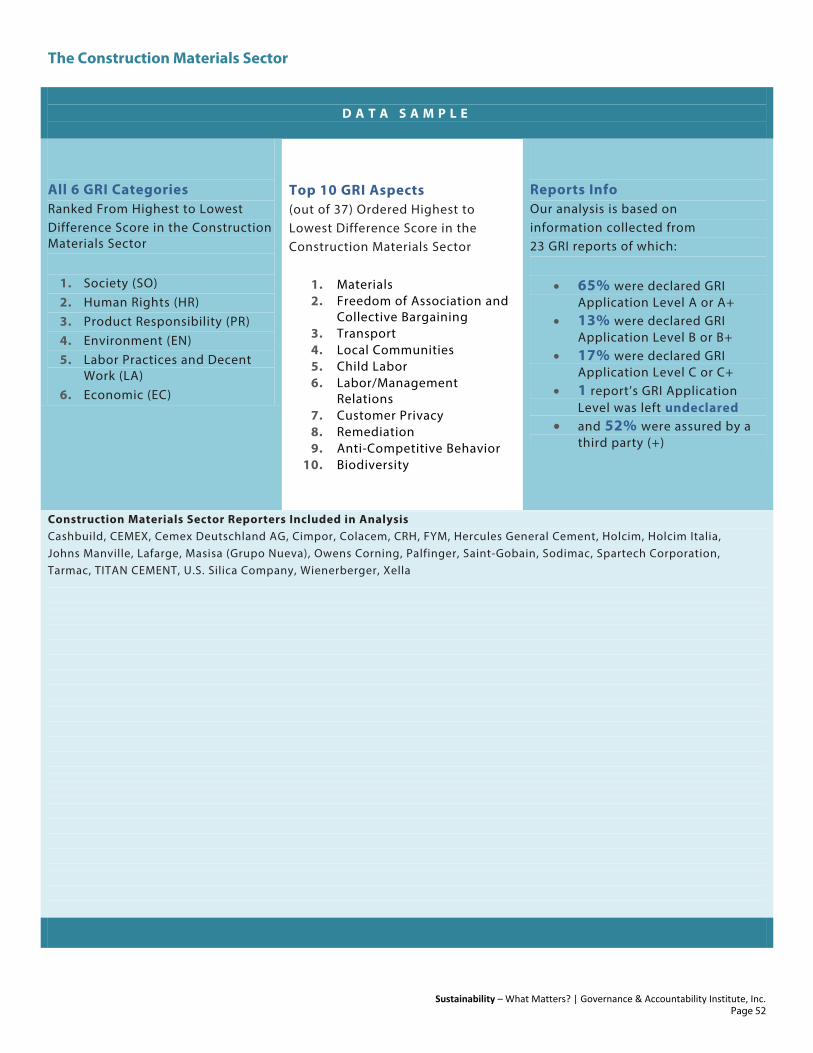
The Construction Materials Sector
Sustainability – What Matters? | Governance & Accountability Institute, Inc.
D A T A S A M P L E
All 6 GRI Categories Ranked From Highest to Lowest Difference Score in the Construction Materials Sector
1. Society (SO) 2. Human Rights (HR) 3. Product Responsibility (PR) 4. Environment (EN) 5. Labor Practices and Decent
Work (LA) 6. Economic (EC)
Top 10 GRI Aspects (out of 37) Ordered Highest to Lowest Difference Score in the Construction Materials Sector
1. Materials 2. Freedom of Association and
Collective Bargaining 3. Transport 4. Local Communities 5. Child Labor 6. Labor/Management
Relations 7. Customer Privacy 8. Remediation 9. Anti-Competitive Behavior
10. Biodiversity
Reports Info Our analysis is based on information collected from 23 GRI reports of which:
• 65% were declared GRI Application Level A or A+
• 13% were declared GRI Application Level B or B+
• 17% were declared GRI Application Level C or C+
• 1 report’s GRI Application Level was left undeclared
• and 52% were assured by a third party (+)
Construction Materials Sector Reporters Included in Analysis Cashbuild, CEMEX, Cemex Deutschland AG, Cimpor, Colacem, CRH, FYM, Hercules General Cement, Holcim, Holcim Italia, Johns Manville, Lafarge, Masisa (Grupo Nueva), Owens Corning, Palfinger, Saint-Gobain, Sodimac, Spartech Corporation, Tarmac, TITAN CEMENT, U.S. Silica Company, Wienerberger, Xella
Page 52
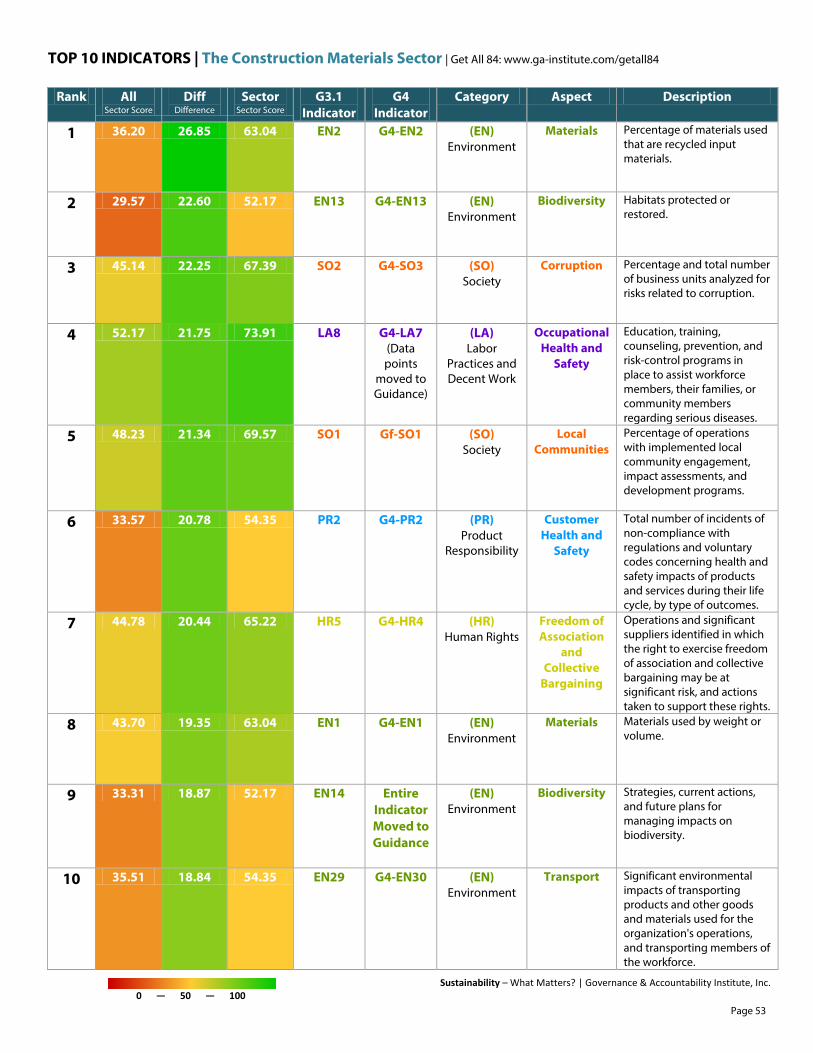
TOP 10 INDICATORS | The Construction Materials Sector | Get All 84: www.ga-institute.com/getall84
Sustainability – What Matters? | Governance & Accountability Institute, Inc. 0 — 50 — 100
Rank All Sector Score
Diff Difference
Sector Sector Score
G3.1 Indicator
G4 Indicator
Category Aspect Description
1 36.20 26.85 63.04 EN2 G4-EN2 (EN) Environment
Materials Percentage of materials used that are recycled input materials.
2 29.57 22.60 52.17 EN13 G4-EN13 (EN) Environment
Biodiversity Habitats protected or restored.
3 45.14 22.25 67.39 SO2 G4-SO3 (SO) Society
Corruption Percentage and total number of business units analyzed for risks related to corruption.
4 52.17 21.75 73.91 LA8 G4-LA7 (Data points
moved to Guidance)
(LA) Labor
Practices and Decent Work
Occupational Health and
Safety
Education, training, counseling, prevention, and risk-control programs in place to assist workforce members, their families, or community members regarding serious diseases.
5 48.23 21.34 69.57 SO1 Gf-SO1 (SO) Society
Local Communities
Percentage of operations with implemented local community engagement, impact assessments, and development programs.
6 33.57 20.78 54.35 PR2 G4-PR2 (PR) Product
Responsibility
Customer Health and
Safety
Total number of incidents of non-compliance with regulations and voluntary codes concerning health and safety impacts of products and services during their life cycle, by type of outcomes.
7 44.78 20.44 65.22 HR5 G4-HR4 (HR) Human Rights
Freedom of Association
and Collective
Bargaining
Operations and significant suppliers identified in which the right to exercise freedom of association and collective bargaining may be at significant risk, and actions taken to support these rights.
8 43.70 19.35 63.04 EN1 G4-EN1 (EN) Environment
Materials Materials used by weight or volume.
9 33.31 18.87 52.17 EN14 Entire Indicator Moved to Guidance
(EN) Environment
Biodiversity Strategies, current actions, and future plans for managing impacts on biodiversity.
10 35.51 18.84 54.35 EN29 G4-EN30 (EN) Environment
Transport Significant environmental impacts of transporting products and other goods and materials used for the organization's operations, and transporting members of the workforce.
Page 53

BOTTOM 10 INDICATORS | The Construction Materials Sector | Get All 84: www.ga-institute.com/getall84
Sustainability – What Matters? | Governance & Accountability Institute, Inc. 0 — 50 — 100
Rank All Sector Score
Diff Difference
Sector Sector Score
G3.1 Indicator
G4 Indicator
Category Aspect Description
75 30.70 1.92 32.61 EC5 G4-EC5 (EC) Economic
Market Presence
Range of ratios of standard entry level wage compared to local minimum wage at significant locations of operation.
76 37.32 1.82 39.13 EN21 G4-EN22 (EN) Environment
Emissions, Effluents and
Waste
Total water discharge by quality and destination.
77 54.94 1.59 56.52 EN18 G4-EN19 (EN) Environment
Emissions, Effluents and
Waste
Initiatives to reduce greenhouse gas emissions and reductions achieved.
78 53.05 1.30 54.35 EN5 G4-EN6 (EN) Environment
Energy Energy saved due to conservation and efficiency improvements.
79 44.74 0.91 45.65 EN17 G4-EN17, G4-EN18
(EN) Environment
Emissions, Effluents and
Waste
Other relevant indirect greenhouse gas emissions by weight.
80 56.42 0.11 56.52 EN28 G4-EN29 (EN) Environment
Compliance Monetary value of significant fines and total number of non-monetary sanctions for non-compliance with environmental laws and regulations.
81 43.46 -2.15 41.30 LA3 G4-LA2 (LA) Labor
Practices and Decent Work
Employment Benefits provided to full-time employees that are not provided to temporary or part-time employees, by major operations.
82 30.70 -2.43 28.26 EN19 G4-EN20 (EN) Environment
Emissions, Effluents and
Waste
Emissions of ozone-depleting substances by weight.
83 54.37 -4.37 50.00 EC3 G4-EC3 (EC) Economic
Economic Performance
Coverage of the organization's defined benefit plan obligations.
84 52.81 -4.98 47.83 LA2 G4-LA1 (LA) Labor
Practices and Decent Work
Employment Total number and rate of new employee hires and employee turnover by age group, gender, and region.
Page 54

sustainability — what matters? The Consumer Durables Sector
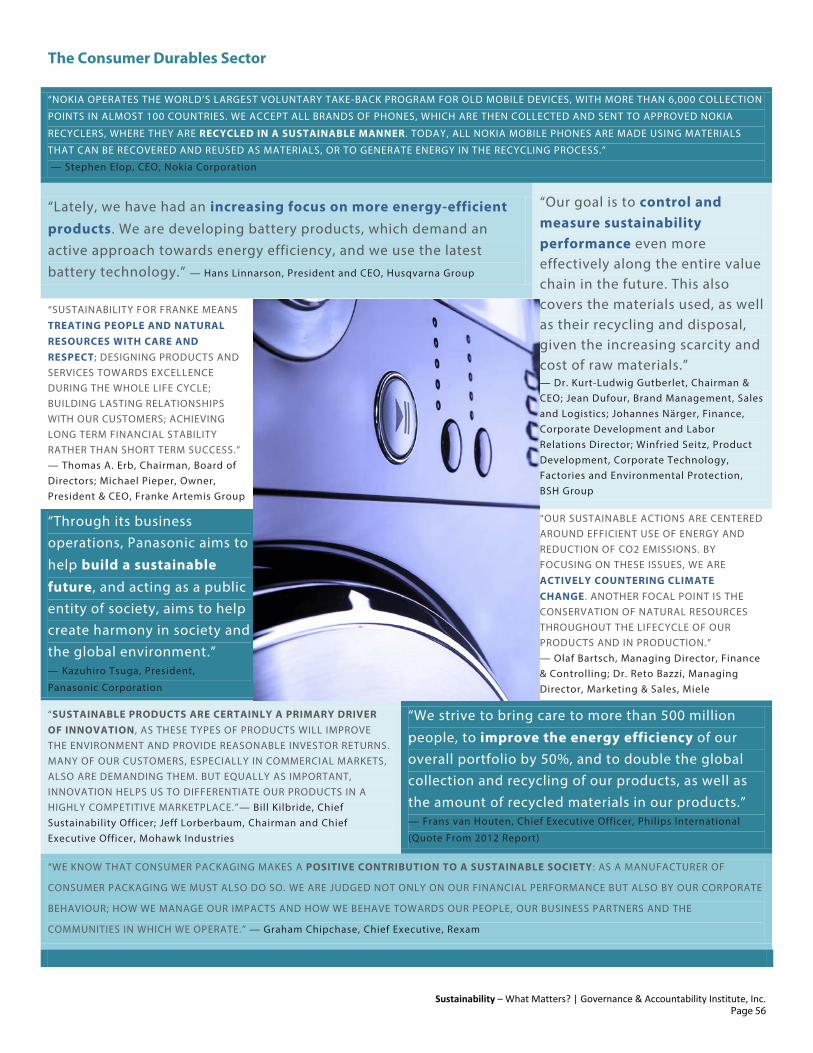
The Consumer Durables Sector
Sustainability – What Matters? | Governance & Accountability Institute, Inc.
“NOKIA OPERATES THE WORLD’S LARGEST VOLUNTARY TAKE-BACK PROGRAM FOR OLD MOBILE DEVICES, WITH MORE THAN 6,000 COLLECTION
POINTS IN ALMOST 100 COUNTRIES. WE ACCEPT ALL BRANDS OF PHONES, WHICH ARE THEN COLLECTED AND SENT TO APPROVED NOKIA
RECYCLERS, WHERE THEY ARE RECYCLED IN A SUSTAINABLE MANNER . TODAY, ALL NOKIA MOBILE PHONES ARE MADE USING MATERIALS
THAT CAN BE RECOVERED AND REUSED AS MATERIALS, OR TO GENERATE ENERGY IN THE RECYCLING PROCESS.”
— Stephen Elop, CEO, Nokia Corporation
“Lately, we have had an increasing focus on more energy-efficient products. We are developing battery products, which demand an active approach towards energy efficiency, and we use the latest battery technology.” — Hans Linnarson, President and CEO, Husqvarna Group
“Our goal is to control and measure sustainability performance even more effectively along the entire value chain in the future. This also covers the materials used, as well as their recycling and disposal, given the increasing scarcity and cost of raw materials.” — Dr. Kurt-Ludwig Gutberlet, Chairman & CEO; Jean Dufour, Brand Management, Sales and Logistics; Johannes Närger, Finance, Corporate Development and Labor Relations Director; Winfried Seitz, Product Development, Corporate Technology, Factories and Environmental Protection, BSH Group
“SUSTAINABILITY FOR FRANKE MEANS TREATING PEOPLE AND NATURAL RESOURCES WITH CARE AND RESPECT; DESIGNING PRODUCTS AND SERVICES TOWARDS EXCELLENCE DURING THE WHOLE LIFE CYCLE; BUILDING LASTING RELATIONSHIPS WITH OUR CUSTOMERS; ACHIEVING LONG TERM FINANCIAL STABILITY RATHER THAN SHORT TERM SUCCESS.” — Thomas A. Erb, Chairman, Board of Directors; Michael Pieper, Owner, President & CEO, Franke Artemis Group
“Through its business operations, Panasonic aims to
help build a sustainable future, and acting as a public entity of society, aims to help create harmony in society and the global environment.” — Kazuhiro Tsuga, President,
Panasonic Corporation
“OUR SUSTAINABLE ACTIONS ARE CENTERED AROUND EFFICIENT USE OF ENERGY AND REDUCTION OF CO2 EMISSIONS. BY FOCUSING ON THESE ISSUES, WE ARE ACTIVELY COUNTERING CLIMATE CHANGE. ANOTHER FOCAL POINT IS THE CONSERVATION OF NATURAL RESOURCES THROUGHOUT THE LIFECYCLE OF OUR PRODUCTS AND IN PRODUCTION.” — Olaf Bartsch, Managing Director, Finance & Controlling; Dr. Reto Bazzi, Managing Director, Marketing & Sales, Miele
“SUSTAINABLE PRODUCTS ARE CERTAINLY A PRIMARY DRIVER OF INNOVATION , AS THESE TYPES OF PRODUCTS WILL IMPROVE THE ENVIRONMENT AND PROVIDE REASONABLE INVESTOR RETURNS. MANY OF OUR CUSTOMERS, ESPECIALLY IN COMMERCIAL MARKETS, ALSO ARE DEMANDING THEM. BUT EQUALLY AS IMPORTANT, INNOVATION HELPS US TO DIFFERENTIATE OUR PRODUCTS IN A HIGHLY COMPETITIVE MARKETPLACE.”— Bill Kilbride, Chief Sustainability Officer; Jeff Lorberbaum, Chairman and Chief Executive Officer, Mohawk Industries
“We strive to bring care to more than 500 million
people, to improve the energy efficiency of our overall portfolio by 50%, and to double the global collection and recycling of our products, as well as the amount of recycled materials in our products.” — Frans van Houten, Chief Executive Officer, Philips International
(Quote From 2012 Report)
“WE KNOW THAT CONSUMER PACKAGING MAKES A POSITIVE CONTRIBUTION TO A SUSTAINABLE SOCIETY: AS A MANUFACTURER OF
CONSUMER PACKAGING WE MUST ALSO DO SO. WE ARE JUDGED NOT ONLY ON OUR FINANCIAL PERFORMANCE BUT ALSO BY OUR CORPORATE
BEHAVIOUR; HOW WE MANAGE OUR IMPACTS AND HOW WE BEHAVE TOWARDS OUR PEOPLE, OUR BUSINESS PARTNERS AND THE
COMMUNITIES IN WHICH WE OPERATE.” — Graham Chipchase, Chief Executive, Rexam
Page 56
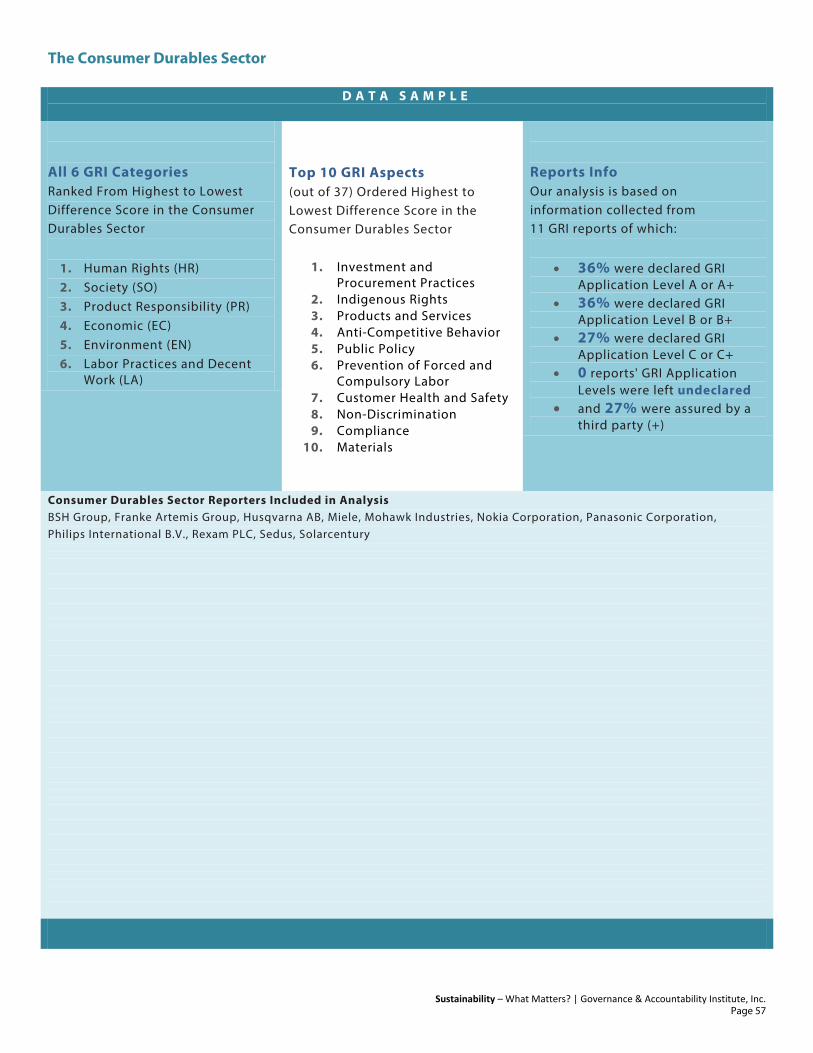
The Consumer Durables Sector
Sustainability – What Matters? | Governance & Accountability Institute, Inc.
D A T A S A M P L E All 6 GRI Categories Ranked From Highest to Lowest Difference Score in the Consumer Durables Sector
1. Human Rights (HR) 2. Society (SO) 3. Product Responsibility (PR) 4. Economic (EC) 5. Environment (EN) 6. Labor Practices and Decent
Work (LA)
Top 10 GRI Aspects (out of 37) Ordered Highest to Lowest Difference Score in the Consumer Durables Sector
1. Investment and Procurement Practices
2. Indigenous Rights 3. Products and Services 4. Anti-Competitive Behavior 5. Public Policy 6. Prevention of Forced and
Compulsory Labor 7. Customer Health and Safety 8. Non-Discrimination 9. Compliance
10. Materials
Reports Info Our analysis is based on information collected from 11 GRI reports of which:
• 36% were declared GRI Application Level A or A+
• 36% were declared GRI Application Level B or B+
• 27% were declared GRI Application Level C or C+
• 0 reports' GRI Application Levels were left undeclared
• and 27% were assured by a third party (+)
Consumer Durables Sector Reporters Included in Analysis BSH Group, Franke Artemis Group, Husqvarna AB, Miele, Mohawk Industries, Nokia Corporation, Panasonic Corporation, Philips International B.V., Rexam PLC, Sedus, Solarcentury
Page 57

TOP 10 INDICATORS | The Consumer Durables Sector | Get All 84: www.ga-institute.com/getall84
Sustainability – What Matters? | Governance & Accountability Institute, Inc. 0 — 50 — 100
Rank All Sector Score
Diff Difference
Sector Sector Score
G3.1 Indicator
G4 Indicator
Category Aspect Description
1 39.25 24.40 63.64 HR2 G4-HR10 (HR) Human Rights
Investment and
Procurement Practices
Percentage of significant suppliers, contractors, and other business partners that have undergone Human Rights (HR) screening and actions taken.
2 42.37 21.27 63.64 PR3 G4-PR3 (PR) Product
Responsibility
Product and Service
Labeling
Type of product and service information required by procedures, and percentage of significant products and services subject to such information requirements.
3 32.54 17.46 50.00 HR3 G4-HR2 (HR) Human Rights
Investment and
Procurement Practices
Total hours of employee training on policies and procedures concerning aspects of Human Rights (HR) that are relevant to operations, including the percentage of employees trained.
4 23.80 17.12 40.91 EN27 G4-EN28 (EN) Environment
Products and
Services
Percentage of products sold and their packaging materials that are reclaimed by category.
5 45.14 13.96 59.09 PR1 G4-PR1 (Data points
moved to Guidance)
(PR) Product
Responsibility
Customer Health
and Safety
Life cycle stages in which health and safety impacts of products and services are assessed for improvement, and percentage of significant products and services categories subject to such procedures.
6 27.21 13.71 40.91 HR9 G4-HR8 (HR) Human Rights
Indigenous Rights
Total number of incidents of violations involving rights of indigenous people and actions taken.
7 46.31 12.79 59.09 EC4 G4-EC4 (EC) Economic
Economic Performance
Significant financial assistance received from government.
8 33.35 12.11 45.45 HR1 G4-HR1 (HR) Human Rights
Investment and
Procurement Practices
Percentage and total number of significant investment agreements and contracts that include Human Rights (HR) clauses or that have undergone Human Rights (HR) screening.
9 42.61 11.94 54.55 PR6 G4-PR6 (PR) Product
Responsibility
Marketing Communi-
cations
Programs for adherence to laws, standards, and voluntary codes related to marketing communications, including advertising, promotion, and sponsorship.
10 42.78 11.77 54.55 SO7 G4-SO7 (SO) Society
Anti-Competitive
Behavior
Total number of legal actions for anti-competitive behavior, anti-trust, and monopoly practices and their outcomes.
Page 58

BOTTOM 10 INDICATORS | The Consumer Durables Sector | Get All 84: www.ga-institute.com/getall84
Sustainability – What Matters? | Governance & Accountability Institute, Inc. 0 — 50 — 100
Rank All Sector Score
Diff Difference
Sector Sector Score
G3.1 Indicator
G4 Indicator
Category Aspect Description
75 30.70 -12.51 18.18 EC5 G4-EC5 (EC) Economic
Market Presence
Range of ratios of standard entry level wage compared to local minimum wage at significant locations of operation.
76 30.82 -12.63 18.18 EN30 G4-EN31, G4-EN32, G4-EN33, G4-EN34
(EN) Environment
Overall (Environmental)
Total environmental protection expenditures and investments by type.
77 35.42 -12.69 22.73 PR8 G4-PR8 (PR) Product
Responsibility
Customer Privacy
Total number of substantiated complaints regarding breaches of customer privacy and losses of customer data.
78 17.82 -13.27 4.55 SO10 Entire Indicator Moved to Guidance
(SO) Society
Local Communities
Prevention and mitigation measures implemented in operations with significant potential or actual negative impacts on local communities.
79 33.31 -15.12 18.18 EN14 Entire Indicator Moved to Guidance
(EN) Environment
Biodiversity Strategies, current actions, and future plans for managing impacts on biodiversity.
80 29.57 -15.93 13.64 EN13 G4-EN13 (EN) Environment
Biodiversity Habitats protected or restored.
81 43.46 -16.18 27.27 LA3 G4-LA2 (LA) Labor
Practices and Decent Work
Employment Benefits provided to full-time employees that are not provided to temporary or part-time employees, by major operations.
82 31.85 -18.21 13.64 PR4 G4-PR4 (PR) Product
Responsibility
Product and Service
Labeling
Total number of incidents of non-compliance with regulations and voluntary codes concerning product and service information and labeling, by type of outcomes.
83 54.94 -18.57 36.36 EN18 G4-EN19 (EN) Environment
Emissions, Effluents and
Waste
Initiatives to reduce greenhouse gas emissions and reductions achieved.
84 43.14 -20.41 22.73 EN7 G4-EN6 (EN) Environment
Energy Initiatives to reduce indirect energy consumption and reductions achieved.
Page 59

sustainability — what matters? The Energy Sector
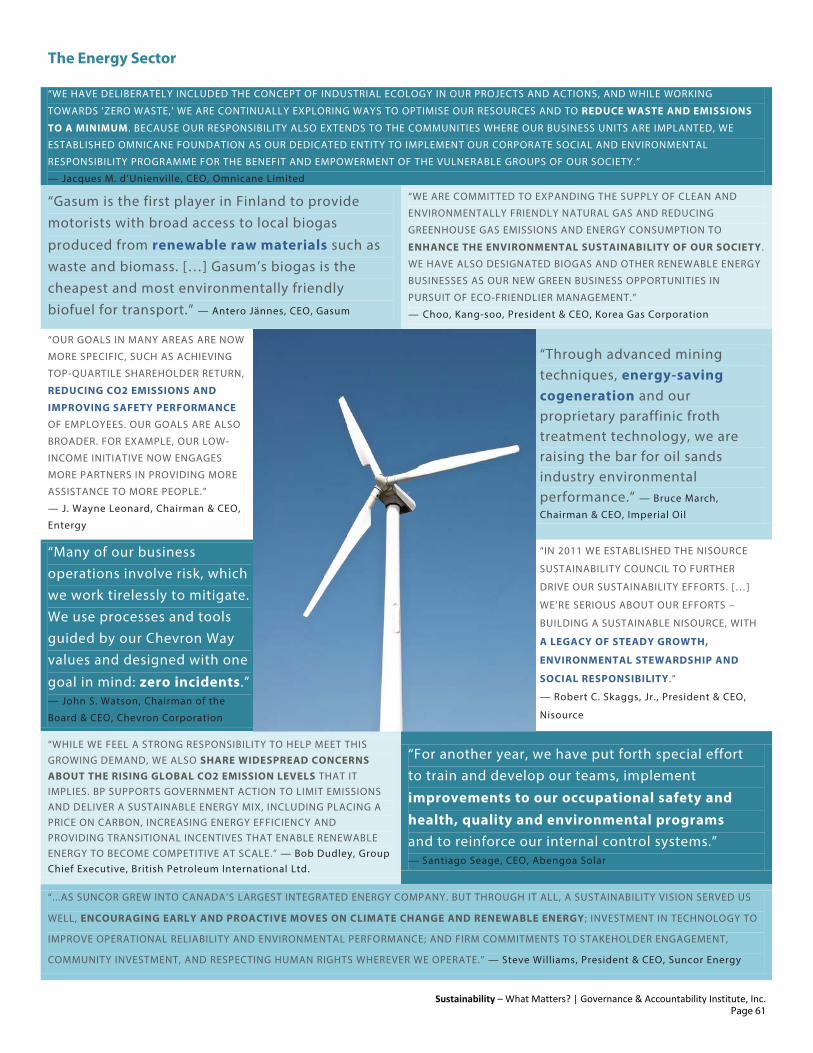
The Energy Sector
Sustainability – What Matters? | Governance & Accountability Institute, Inc.
“WE HAVE DELIBERATELY INCLUDED THE CONCEPT OF INDUSTRIAL ECOLOGY IN OUR PROJECTS AND ACTIONS, AND WHILE WORKING
TOWARDS 'ZERO WASTE,' WE ARE CONTINUALLY EXPLORING WAYS TO OPTIMISE OUR RESOURCES AND TO REDUCE WASTE AND EMISSIONS
TO A MINIMUM . BECAUSE OUR RESPONSIBILITY ALSO EXTENDS TO THE COMMUNITIES WHERE OUR BUSINESS UNITS ARE IMPLANTED, WE
ESTABLISHED OMNICANE FOUNDATION AS OUR DEDICATED ENTITY TO IMPLEMENT OUR CORPORATE SOCIAL AND ENVIRONMENTAL
RESPONSIBILITY PROGRAMME FOR THE BENEFIT AND EMPOWERMENT OF THE VULNERABLE GROUPS OF OUR SOCIETY.”
— Jacques M. d’Unienville, CEO, Omnicane Limited
“Gasum is the first player in Finland to provide motorists with broad access to local biogas
produced from renewable raw materials such as waste and biomass. […] Gasum’s biogas is the cheapest and most environmentally friendly biofuel for transport.” — Antero Jännes, CEO, Gasum
“WE ARE COMMITTED TO EXPANDING THE SUPPLY OF CLEAN AND
ENVIRONMENTALLY FRIENDLY NATURAL GAS AND REDUCING
GREENHOUSE GAS EMISSIONS AND ENERGY CONSUMPTION TO
ENHANCE THE ENVIRONMENTAL SUSTAINABILITY OF OUR SOCIETY .
WE HAVE ALSO DESIGNATED BIOGAS AND OTHER RENEWABLE ENERGY
BUSINESSES AS OUR NEW GREEN BUSINESS OPPORTUNITIES IN
PURSUIT OF ECO-FRIENDLIER MANAGEMENT.”
— Choo, Kang-soo, President & CEO, Korea Gas Corporation
“OUR GOALS IN MANY AREAS ARE NOW
MORE SPECIFIC, SUCH AS ACHIEVING
TOP-QUARTILE SHAREHOLDER RETURN,
REDUCING CO2 EMISSIONS AND
IMPROVING SAFETY PERFORMANCE
OF EMPLOYEES. OUR GOALS ARE ALSO
BROADER. FOR EXAMPLE, OUR LOW-
INCOME INITIATIVE NOW ENGAGES
MORE PARTNERS IN PROVIDING MORE
ASSISTANCE TO MORE PEOPLE.”
— J. Wayne Leonard, Chairman & CEO,
Entergy
“Through advanced mining techniques, energy-saving cogeneration and our proprietary paraffinic froth treatment technology, we are raising the bar for oil sands industry environmental performance.” — Bruce March,
Chairman & CEO, Imperial Oil
“Many of our business operations involve risk, which we work tirelessly to mitigate. We use processes and tools guided by our Chevron Way values and designed with one
goal in mind: zero incidents.” — John S. Watson, Chairman of the
Board & CEO, Chevron Corporation
“IN 2011 WE ESTABLISHED THE NISOURCE
SUSTAINABILITY COUNCIL TO FURTHER
DRIVE OUR SUSTAINABILITY EFFORTS. […]
WE’RE SERIOUS ABOUT OUR EFFORTS –
BUILDING A SUSTAINABLE NISOURCE, WITH
A LEGACY OF STEADY GROWTH,
ENVIRONMENTAL STEWARDSHIP AND
SOCIAL RESPONSIBILITY.”
— Robert C. Skaggs, Jr., President & CEO,
Nisource
“WHILE WE FEEL A STRONG RESPONSIBILITY TO HELP MEET THIS GROWING DEMAND, WE ALSO SHARE WIDESPREAD CONCERNS ABOUT THE RISING GLOBAL CO2 EMISSION LEVELS THAT IT IMPLIES. BP SUPPORTS GOVERNMENT ACTION TO LIMIT EMISSIONS AND DELIVER A SUSTAINABLE ENERGY MIX, INCLUDING PLACING A PRICE ON CARBON, INCREASING ENERGY EFFICIENCY AND PROVIDING TRANSITIONAL INCENTIVES THAT ENABLE RENEWABLE ENERGY TO BECOME COMPETITIVE AT SCALE.” — Bob Dudley, Group Chief Executive, British Petroleum International Ltd.
“For another year, we have put forth special effort to train and develop our teams, implement
improvements to our occupational safety and health, quality and environmental programs and to reinforce our internal control systems.” — Santiago Seage, CEO, Abengoa Solar
“...AS SUNCOR GREW INTO CANADA’S LARGEST INTEGRATED ENERGY COMPANY. BUT THROUGH IT ALL, A SUSTAINABILITY VISION SERVED US
WELL, ENCOURAGING EARLY AND PROACTIVE MOVES ON CLIMATE CHANGE AND RENEWABLE ENERGY ; INVESTMENT IN TECHNOLOGY TO
IMPROVE OPERATIONAL RELIABILITY AND ENVIRONMENTAL PERFORMANCE; AND FIRM COMMITMENTS TO STAKEHOLDER ENGAGEMENT,
COMMUNITY INVESTMENT, AND RESPECTING HUMAN RIGHTS WHEREVER WE OPERATE.” — Steve Williams, President & CEO, Suncor Energy
Page 61
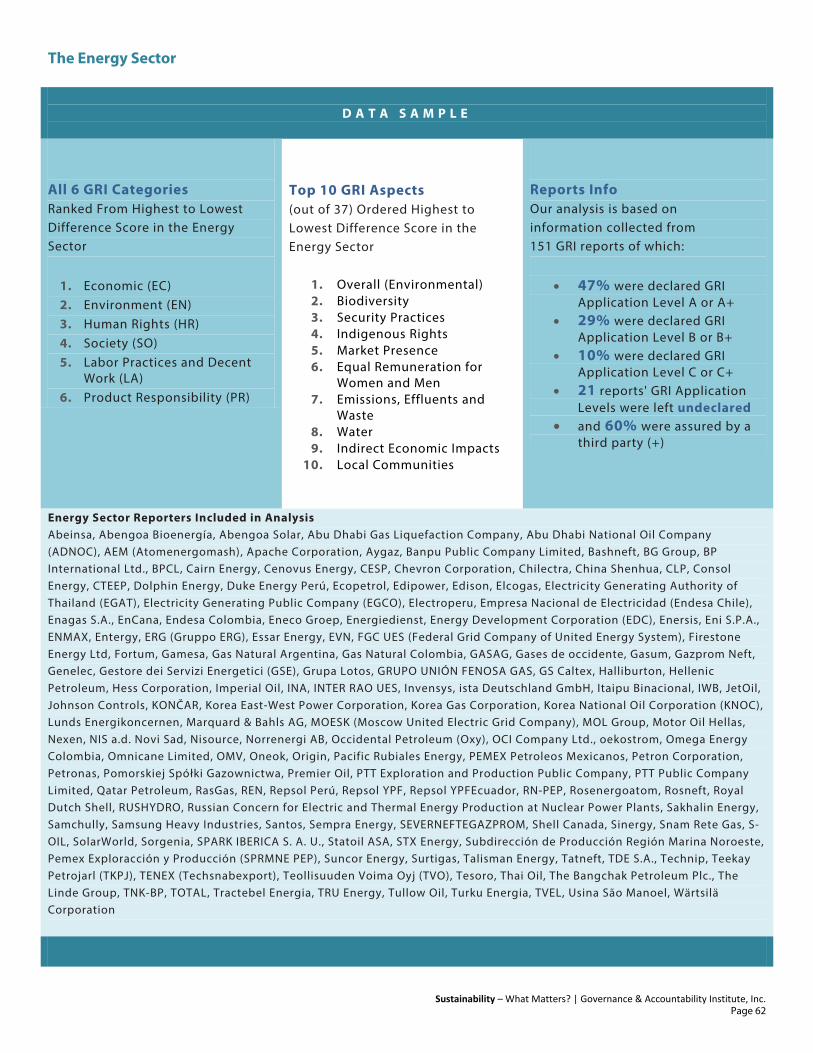
The Energy Sector
Sustainability – What Matters? | Governance & Accountability Institute, Inc.
D A T A S A M P L E
All 6 GRI Categories Ranked From Highest to Lowest Difference Score in the Energy Sector
1. Economic (EC) 2. Environment (EN) 3. Human Rights (HR) 4. Society (SO) 5. Labor Practices and Decent
Work (LA) 6. Product Responsibility (PR)
Top 10 GRI Aspects (out of 37) Ordered Highest to Lowest Difference Score in the Energy Sector
1. Overall (Environmental) 2. Biodiversity 3. Security Practices 4. Indigenous Rights 5. Market Presence 6. Equal Remuneration for
Women and Men 7. Emissions, Effluents and
Waste 8. Water 9. Indirect Economic Impacts
10. Local Communities
Reports Info Our analysis is based on information collected from 151 GRI reports of which:
• 47% were declared GRI Application Level A or A+
• 29% were declared GRI Application Level B or B+
• 10% were declared GRI Application Level C or C+
• 21 reports' GRI Application Levels were left undeclared
• and 60% were assured by a third party (+)
Energy Sector Reporters Included in Analysis Abeinsa, Abengoa Bioenergía, Abengoa Solar, Abu Dhabi Gas Liquefaction Company, Abu Dhabi National Oil Company (ADNOC), AEM (Atomenergomash), Apache Corporation, Aygaz, Banpu Public Company Limited, Bashneft, BG Group, BP International Ltd., BPCL, Cairn Energy, Cenovus Energy, CESP, Chevron Corporation, Chilectra, China Shenhua, CLP, Consol Energy, CTEEP, Dolphin Energy, Duke Energy Perú, Ecopetrol, Edipower, Edison, Elcogas, Electricity Generating Authority of Thailand (EGAT), Electricity Generating Public Company (EGCO), Electroperu, Empresa Nacional de Electricidad (Endesa Chile), Enagas S.A., EnCana, Endesa Colombia, Eneco Groep, Energiedienst, Energy Development Corporation (EDC), Enersis, Eni S.P.A., ENMAX, Entergy, ERG (Gruppo ERG), Essar Energy, EVN, FGC UES (Federal Grid Company of United Energy System), Firestone Energy Ltd, Fortum, Gamesa, Gas Natural Argentina, Gas Natural Colombia, GASAG, Gases de occidente, Gasum, Gazprom Neft, Genelec, Gestore dei Servizi Energetici (GSE), Grupa Lotos, GRUPO UNIÓN FENOSA GAS, GS Caltex, Halliburton, Hellenic Petroleum, Hess Corporation, Imperial Oil, INA, INTER RAO UES, Invensys, ista Deutschland GmbH, Itaipu Binacional, IWB, JetOil, Johnson Controls, KONČAR, Korea East-West Power Corporation, Korea Gas Corporation, Korea National Oil Corporation (KNOC), Lunds Energikoncernen, Marquard & Bahls AG, MOESK (Moscow United Electric Grid Company), MOL Group, Motor Oil Hellas, Nexen, NIS a.d. Novi Sad, Nisource, Norrenergi AB, Occidental Petroleum (Oxy), OCI Company Ltd., oekostrom, Omega Energy Colombia, Omnicane Limited, OMV, Oneok, Origin, Pacific Rubiales Energy, PEMEX Petroleos Mexicanos, Petron Corporation, Petronas, Pomorskiej Spółki Gazownictwa, Premier Oil, PTT Exploration and Production Public Company, PTT Public Company Limited, Qatar Petroleum, RasGas, REN, Repsol Perú, Repsol YPF, Repsol YPFEcuador, RN-PEP, Rosenergoatom, Rosneft, Royal Dutch Shell, RUSHYDRO, Russian Concern for Electric and Thermal Energy Production at Nuclear Power Plants, Sakhalin Energy, Samchully, Samsung Heavy Industries, Santos, Sempra Energy, SEVERNEFTEGAZPROM, Shell Canada, Sinergy, Snam Rete Gas, S- OIL, SolarWorld, Sorgenia, SPARK IBERICA S. A. U., Statoil ASA, STX Energy, Subdirección de Producción Región Marina Noroeste, Pemex Exploracción y Producción (SPRMNE PEP), Suncor Energy, Surtigas, Talisman Energy, Tatneft, TDE S.A., Technip, Teekay Petrojarl (TKPJ), TENEX (Techsnabexport), Teollisuuden Voima Oyj (TVO), Tesoro, Thai Oil, The Bangchak Petroleum Plc., The Linde Group, TNK-BP, TOTAL, Tractebel Energia, TRU Energy, Tullow Oil, Turku Energia, TVEL, Usina São Manoel, Wärtsilä Corporation
Page 62
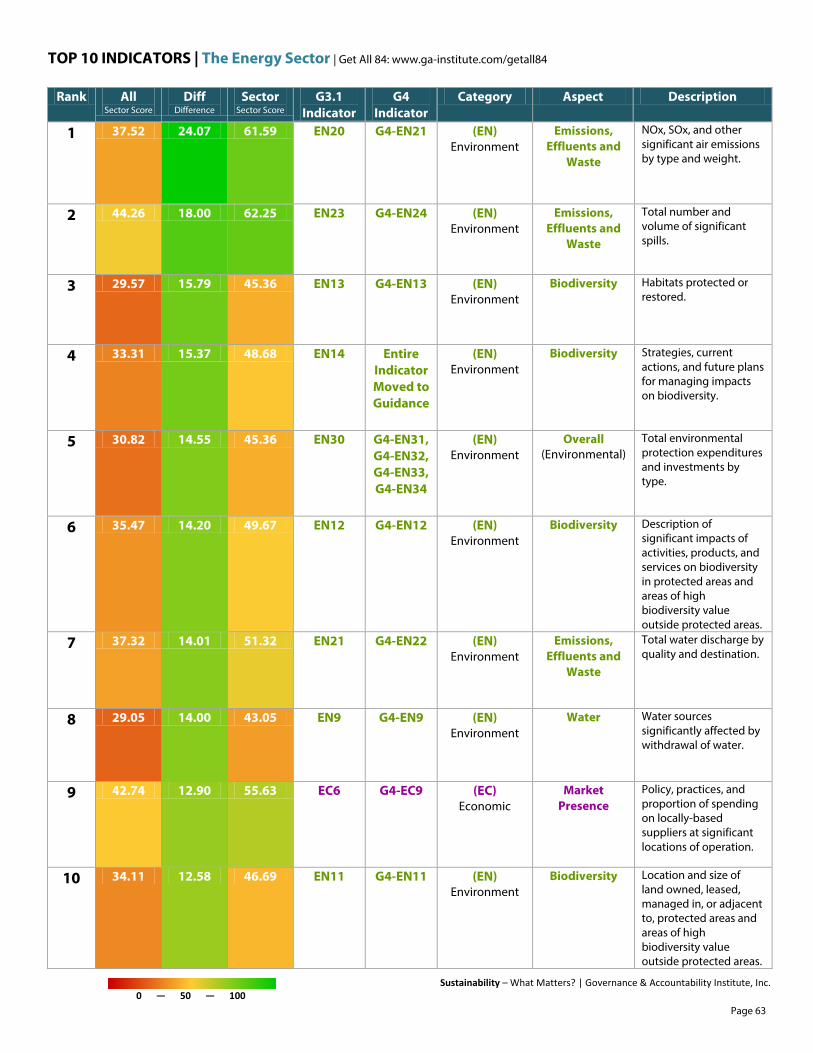
TOP 10 INDICATORS | The Energy Sector | Get All 84: www.ga-institute.com/getall84
Sustainability – What Matters? | Governance & Accountability Institute, Inc. 0 — 50 — 100
Rank All Sector Score
Diff Difference
Sector Sector Score
G3.1 Indicator
G4 Indicator
Category Aspect Description
1 37.52 24.07 61.59 EN20 G4-EN21 (EN) Environment
Emissions, Effluents and
Waste
NOx, SOx, and other significant air emissions by type and weight.
2 44.26 18.00 62.25 EN23 G4-EN24 (EN) Environment
Emissions, Effluents and
Waste
Total number and volume of significant spills.
3 29.57 15.79 45.36 EN13 G4-EN13 (EN) Environment
Biodiversity Habitats protected or restored.
4 33.31 15.37 48.68 EN14 Entire Indicator Moved to Guidance
(EN) Environment
Biodiversity Strategies, current actions, and future plans for managing impacts on biodiversity.
5 30.82 14.55 45.36 EN30 G4-EN31, G4-EN32, G4-EN33, G4-EN34
(EN) Environment
Overall (Environmental)
Total environmental protection expenditures and investments by type.
6 35.47 14.20 49.67 EN12 G4-EN12 (EN) Environment
Biodiversity Description of significant impacts of activities, products, and services on biodiversity in protected areas and areas of high biodiversity value outside protected areas.
7 37.32 14.01 51.32 EN21 G4-EN22 (EN) Environment
Emissions, Effluents and
Waste
Total water discharge by quality and destination.
8 29.05 14.00 43.05 EN9 G4-EN9 (EN) Environment
Water Water sources significantly affected by withdrawal of water.
9 42.74 12.90 55.63 EC6 G4-EC9 (EC) Economic
Market Presence
Policy, practices, and proportion of spending on locally-based suppliers at significant locations of operation.
10 34.11 12.58 46.69 EN11 G4-EN11 (EN) Environment
Biodiversity Location and size of land owned, leased, managed in, or adjacent to, protected areas and areas of high biodiversity value outside protected areas.
Page 63
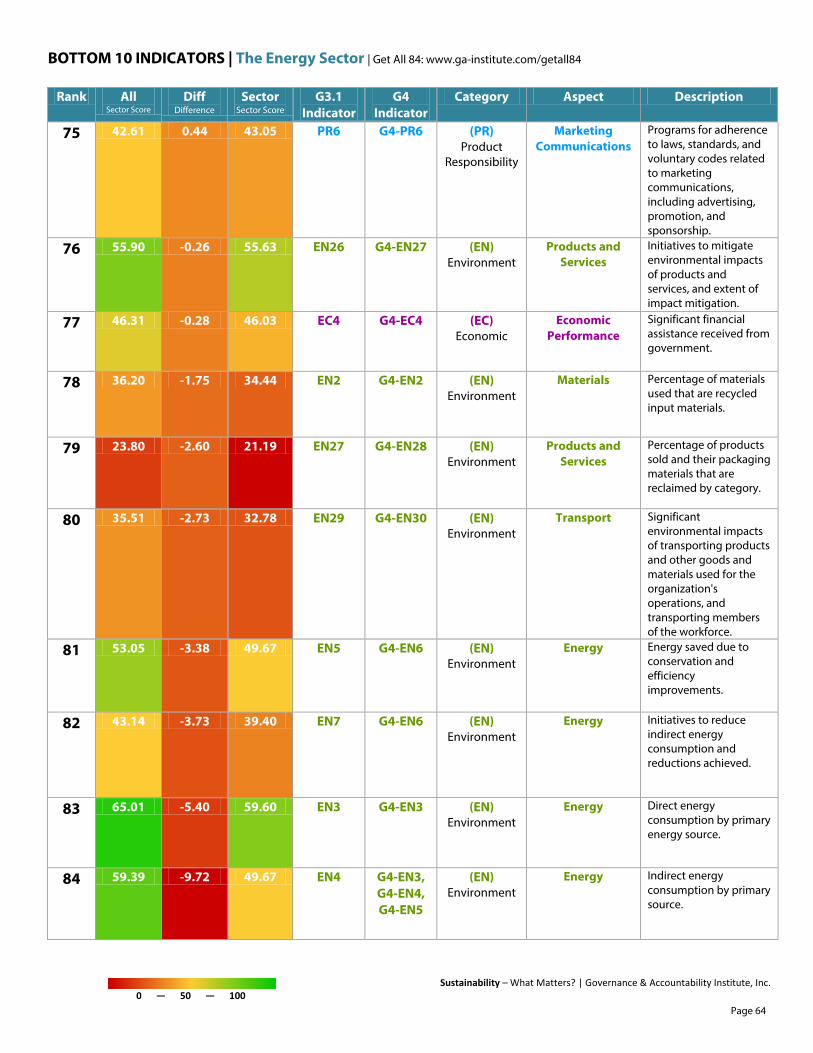
BOTTOM 10 INDICATORS | The Energy Sector | Get All 84: www.ga-institute.com/getall84
Sustainability – What Matters? | Governance & Accountability Institute, Inc. 0 — 50 — 100
Rank All Sector Score
Diff Difference
Sector Sector Score
G3.1 Indicator
G4 Indicator
Category Aspect Description
75 42.61 0.44 43.05 PR6 G4-PR6 (PR) Product
Responsibility
Marketing Communications
Programs for adherence to laws, standards, and voluntary codes related to marketing communications, including advertising, promotion, and sponsorship.
76 55.90 -0.26 55.63 EN26 G4-EN27 (EN) Environment
Products and Services
Initiatives to mitigate environmental impacts of products and services, and extent of impact mitigation.
77 46.31 -0.28 46.03 EC4 G4-EC4 (EC) Economic
Economic Performance
Significant financial assistance received from government.
78 36.20 -1.75 34.44 EN2 G4-EN2 (EN) Environment
Materials Percentage of materials used that are recycled input materials.
79 23.80 -2.60 21.19 EN27 G4-EN28 (EN) Environment
Products and Services
Percentage of products sold and their packaging materials that are reclaimed by category.
80 35.51 -2.73 32.78 EN29 G4-EN30 (EN) Environment
Transport Significant environmental impacts of transporting products and other goods and materials used for the organization's operations, and transporting members of the workforce.
81 53.05 -3.38 49.67 EN5 G4-EN6 (EN) Environment
Energy Energy saved due to conservation and efficiency improvements.
82 43.14 -3.73 39.40 EN7 G4-EN6 (EN) Environment
Energy Initiatives to reduce indirect energy consumption and reductions achieved.
83 65.01 -5.40 59.60 EN3 G4-EN3 (EN) Environment
Energy Direct energy consumption by primary energy source.
84 59.39 -9.72 49.67 EN4 G4-EN3, G4-EN4, G4-EN5
(EN) Environment
Energy Indirect energy consumption by primary source.
Page 64
sustainability — what matters? The Energy Utilities Sector

The Energy Utilities Sector
Sustainability – What Matters? | Governance & Accountability Institute, Inc.
“NOWADAYS, ENERGY CONSERVATION AND CARBON REDUCTION ARE IMPORTANT MANAGEMENT ISSUES FOR THE GLOBAL POWER
INDUSTRY. THE DEVELOPMENT OF A LOW-CARBON ECONOMY IS BOTH A MANAGEMENT CHALLENGE AND A DEVELOPMENT OPPORTUNITY FOR
CEM. MOVING TOWARDS SMART GRID DEVELOPMENT THROUGH INNOVATION, WE WILL CONTINUE TO PURSUE THE GOALS OF SUSTAINABLE
OPERATION AND TECHNOLOGY IMPROVEMENT.” — Joao Travassos, Executive Director & Chairman, Safety, Health, Environment & Quality
(SHEQ) Steering Committee, Companhia de Electricidade de Macau (CEM)
“America needs to diversify its fuel sources, invest in transmission systems, replace aging
infrastructure, stimulate energy efficiency and finalize a long-term solution to the problem of spent nuclear fuel.” — Nicholas K. Akins, President & Chief
Executive Officer, American Electric Power (AEP)
“DEVELOP TECHNOLOGIES TO SHAPE THE ENERGY FUTURE, BASED
ON ENERGY EFFICIENCY AND ON DEVELOPMENT OF SMART GRIDS. WE
HAVE ALSO CONTINUED TO DRIVE ACTIVITIES CONCERNING ENERGY
SAVINGS IN LIGHTING TECHNOLOGIES, MANAGEMENT OF RENEWABLE
ENERGY IN LOWER OUTPUT, AND HOME AUTOMATION.” — Salvador
Gabarró Serra, Chairman of the Board of Directors, Gas Natural Fenosa
“BEING A RESPONSIBLE CORPORATE
CITIZEN CREATES TANGIBLE BENEFITS
THAT REDUCE OUR ENVIRONMENTAL
FOOTPRINT, STRENGTHEN
COMMUNITIES, CONTRIBUTE TO
INNOVATION AND THE ADOPTION OF
BETTER TECHNOLOGIES, AND BUILD
HUMAN CAPACITY SO THAT OUR
PEOPLE REMAIN HEALTHY AND SAFE
WHILE DEVELOPING THEIR CAREERS.”
— Brian Vaasjo, President & CEO,
Capital Power Corporation
“The future will see new and dynamic network technology and systems that empower customers to make real choices about how and when they use energy.” — Nino Ficca, Managing
Director, SP Ausnet
“We are helping customers to
gain more insight into their energy consumption as well as supporting local initiatives of customers to produce and share their own energy.” — Peter Molengraaf, CEO, Alliander
“WE ARE EXPANDING THE SHARE OF
RENEWABLES IN THE GENERATING MIX
AND DEVELOPING AND INTRODUCING
INTELLIGENT NETWORKS. OUR
‘SUSTAINABLE TOWN’ CONCEPT ALSO
TREADS NEW GROUND AND SHOWS HOW
WE IMPLEMENT SUSTAINABLE ENERGY
SOLUTIONS IN PARTNERSHIP WITH MANY
LOCAL ACTORS.” — Hans-Peter Villis, CEO,
EnBW Energie Baden-Württemberg AG
“RESPECT FOR THE ENVIRONMENT, OUR PEOPLE AND OUR COMMUNITIES IS A CORE VALUE AT NRG. THOSE VALUES ARE SERVING OUR BUSINESS WELL AS AMERICANS INCREASINGLY DEMAND SUSTAINABLE ENERGY CHOICES THAT ARE AFFORDABLE, CLEANER AND VASTLY SUPERIOR TO “YOUR PARENTS’ ENERGY CHOICES.” — David Crane, CEO, NRG Energy
“People are always looking for tools to help manage their electricity consumption and we launched
PowerLens™ energy calculator to provide customers with customized conservation tips based on their unique consumption profiles.” — Clare R. Copeland, Chairman; Anthony M. Haines, President & CEO,
Toronto Hydro Corporation
“MORE THAN 80% OF THE HEATING VANTAAN HANDLED BY DISTRICT HEATING. CO-PRODUCTION MEANS IT IS ENERGY EFFICIENT AND
LOW-IMPACT OPTION. I BELIEVE THE DISTRICT HEATING OPERATIONS TO REMAIN THE MARKET LEADER IN THE REGION AND PROFITABLE
BUSINESS FOR A LONG TIME. IN PARTICULAR, IN DENSELY POPULATED AREAS OF DISTRICT HEATING IS DIFFICULT TO FIND COMPETITIVE
ALTERNATIVES.” — Pertti Laukkanen, CEO, Vantaan Energia
Page 66

The Energy Utilities Sector
Sustainability – What Matters? | Governance & Accountability Institute, Inc.
D A T A S A M P L E
All 6 GRI Categories Ranked From Highest to Lowest Difference Score in the Energy Utilities Sector
1. Society (SO) 2. Economic (EC) 3. Human Rights (HR) 4. Environment (EN) 5. Product Responsibility (PR) 6. Labor Practices and Decent
Work (LA)
Top 10 GRI Aspects (out of 37) Ordered Highest to Lowest Difference Score in the Energy Utilities Sector
1. Compliance 2. Anti-Competitive Behavior 3. Labor/Management
Relations 4. Public Policy 5. Biodiversity 6. Indigenous Rights 7. Emissions, Effluents and
Waste 8. Freedom of Association and
Collective Bargaining 9. Investment and
Procurement Practices 10. Occupational Health and
Safety
Reports Info Our analysis is based on information collected from 49 GRI reports of which:
• 42% were declared GRI Application Level A or A+
• 39% were declared GRI Application Level B or B+
• 8% were declared GRI Application Level C or C+
• 5 reports' GRI Application Levels were left undeclared
• and 65% were assured by a third party (+)
Energy Utilities Sector Reporters Included in Analysis AES Brasil, Alliander, American Electric Power (AEP), APG, APG All Pensions Group, Aurora Energy, BC Hydro, Capital Power Corporation, CHESF, China Southern Power Grid, Companhia de Electricidade de Macau (CEM), Copagaz, Dong Energy, Duke Energy, E.ON, EDP (Energias de Portugal), EDP Renováveis, Elektrizitätswerke des Kantons Zürich (EKZ), EnBW AG (Energie Baden-Wüerttemberg), Enexis, ERARING ENERGY, Eskom, Essent, EWO, Exelon Corp, FEDA, Gas Natural SDG, Green Mountain Energy, Gruppo Hera, Gruppo SGR, Guelph Hydro Inc., Horizon Holdings, Hydro Quebec, IDGC of Centre and Volga Region (Interregional Distributive Grid Company of Centre and Volga Region), Isagen, KHNP, Neste Oil, NRG Energy, Nuon, POSCO Energy, Power Seraya, RWE, SP Ausnet, Spectra Energy, Terna, Toronto Hydro Corporation, Vantaan Energia, Vattenfall, VERBUND
Page 67
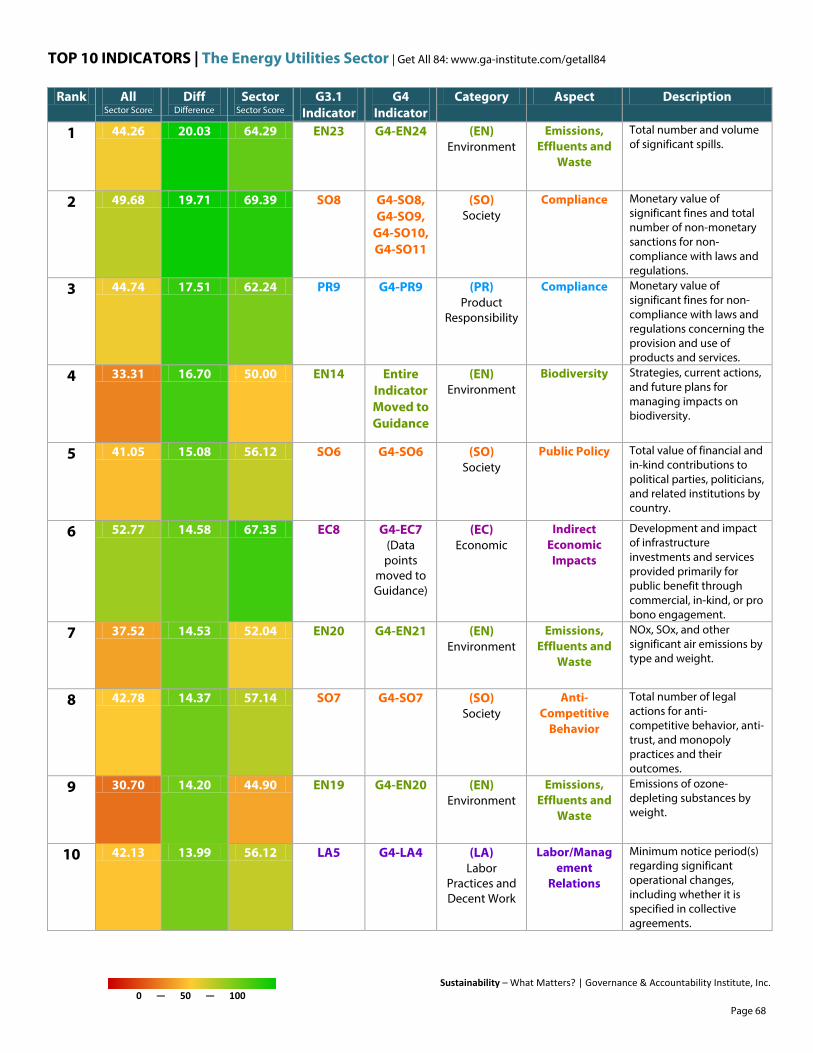
TOP 10 INDICATORS | The Energy Utilities Sector | Get All 84: www.ga-institute.com/getall84
Sustainability – What Matters? | Governance & Accountability Institute, Inc. 0 — 50 — 100
Rank All Sector Score
Diff Difference
Sector Sector Score
G3.1 Indicator
G4 Indicator
Category Aspect Description
1 44.26 20.03 64.29 EN23 G4-EN24 (EN) Environment
Emissions, Effluents and
Waste
Total number and volume of significant spills.
2 49.68 19.71 69.39 SO8 G4-SO8, G4-SO9,
G4-SO10, G4-SO11
(SO) Society
Compliance Monetary value of significant fines and total number of non-monetary sanctions for non-compliance with laws and regulations.
3 44.74 17.51 62.24 PR9 G4-PR9 (PR) Product
Responsibility
Compliance Monetary value of significant fines for non-compliance with laws and regulations concerning the provision and use of products and services.
4 33.31 16.70 50.00 EN14 Entire Indicator Moved to Guidance
(EN) Environment
Biodiversity Strategies, current actions, and future plans for managing impacts on biodiversity.
5 41.05 15.08 56.12 SO6 G4-SO6 (SO) Society
Public Policy Total value of financial and in-kind contributions to political parties, politicians, and related institutions by country.
6 52.77 14.58 67.35 EC8 G4-EC7 (Data points
moved to Guidance)
(EC) Economic
Indirect Economic Impacts
Development and impact of infrastructure investments and services provided primarily for public benefit through commercial, in-kind, or pro bono engagement.
7 37.52 14.53 52.04 EN20 G4-EN21 (EN) Environment
Emissions, Effluents and
Waste
NOx, SOx, and other significant air emissions by type and weight.
8 42.78 14.37 57.14 SO7 G4-SO7 (SO) Society
Anti-Competitive
Behavior
Total number of legal actions for anti-competitive behavior, anti-trust, and monopoly practices and their outcomes.
9 30.70 14.20 44.90 EN19 G4-EN20 (EN) Environment
Emissions, Effluents and
Waste
Emissions of ozone-depleting substances by weight.
10 42.13 13.99 56.12 LA5 G4-LA4 (LA) Labor
Practices and Decent Work
Labor/Management
Relations
Minimum notice period(s) regarding significant operational changes, including whether it is specified in collective agreements.
Page 68
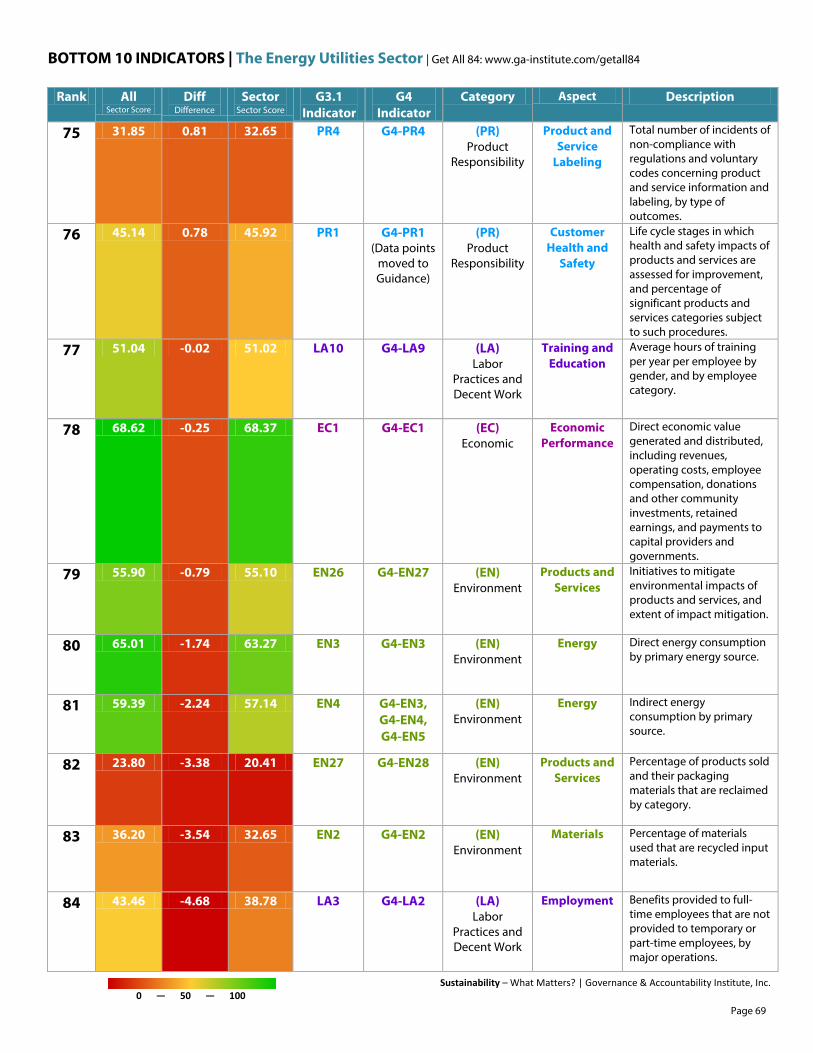
BOTTOM 10 INDICATORS | The Energy Utilities Sector | Get All 84: www.ga-institute.com/getall84
Sustainability – What Matters? | Governance & Accountability Institute, Inc. 0 — 50 — 100
Rank All Sector Score
Diff Difference
Sector Sector Score
G3.1 Indicator
G4 Indicator
Category Aspect Description
75 31.85 0.81 32.65 PR4 G4-PR4 (PR) Product
Responsibility
Product and Service
Labeling
Total number of incidents of non-compliance with regulations and voluntary codes concerning product and service information and labeling, by type of outcomes.
76 45.14 0.78 45.92 PR1 G4-PR1 (Data points
moved to Guidance)
(PR) Product
Responsibility
Customer Health and
Safety
Life cycle stages in which health and safety impacts of products and services are assessed for improvement, and percentage of significant products and services categories subject to such procedures.
77 51.04 -0.02 51.02 LA10 G4-LA9 (LA) Labor
Practices and Decent Work
Training and Education
Average hours of training per year per employee by gender, and by employee category.
78 68.62 -0.25 68.37 EC1 G4-EC1 (EC) Economic
Economic Performance
Direct economic value generated and distributed, including revenues, operating costs, employee compensation, donations and other community investments, retained earnings, and payments to capital providers and governments.
79 55.90 -0.79 55.10 EN26 G4-EN27 (EN) Environment
Products and Services
Initiatives to mitigate environmental impacts of products and services, and extent of impact mitigation.
80 65.01 -1.74 63.27 EN3 G4-EN3 (EN) Environment
Energy Direct energy consumption by primary energy source.
81 59.39 -2.24 57.14 EN4 G4-EN3, G4-EN4, G4-EN5
(EN) Environment
Energy Indirect energy consumption by primary source.
82 23.80 -3.38 20.41 EN27 G4-EN28 (EN) Environment
Products and Services
Percentage of products sold and their packaging materials that are reclaimed by category.
83 36.20 -3.54 32.65 EN2 G4-EN2 (EN) Environment
Materials Percentage of materials used that are recycled input materials.
84 43.46 -4.68 38.78 LA3 G4-LA2 (LA) Labor
Practices and Decent Work
Employment Benefits provided to full-time employees that are not provided to temporary or part-time employees, by major operations.
Page 69

sustainability — what matters? The Equipment Sector

The Equipment Sector
Sustainability – What Matters? | Governance & Accountability Institute, Inc.
“FIAT INDUSTRIAL MAKES PRODUCTS TO MEET THE NEEDS OF PEOPLE AT WORK AND THAT IS WHY WE BELIEVE WE HAVE A RESPONSIBILITY
TO OFFER THEM INNOVATIVE PRODUCTS THAT MEET THE HIGHEST SAFETY STANDARDS. OUR PRODUCTS ARE DESIGNED TO SIMPLIFY THE
ACTIVITIES OF OUR CUSTOMERS AND INCREASE THEIR PRODUCTIVITY, WHILE MINIMIZING THE ENVIRONMENTAL IMPACTS.”
— Sergio Marchionne, Chairman, Fiat Industrial
“We want to grow with sustainable solutions and aim to generate value for current and future stakeholders in a balanced way without eroding the environment’s carrying capacity.” — Klaus Stahlmann, CEO, Sulzer
“WE ADDRESS THESE CHALLENGES BY PROVIDING OUR CUSTOMERS
WITH SUSTAINABLE TECHNOLOGIES TO MAXIMIZE THE RECOVERY
OF VALUABLE METALS AND MINERALS WHILST CONSUMING LESS
ENERGY AND FEWER NATURAL RESOURCES AT REDUCED
OPERATIONAL COST.” — Pertti Korhonen, President & CEO, Outotec
“WITH EVER-INCREASING PRESSURE ON
RESOURCES, AS WELL AS THE IMPACTS
OF OUR OPERATIONS AND PRODUCTS
ON THE ENVIRONMENT AND SOCIETY,
SUSTAINABILITY MUST BE AT THE
VERY CORE OF OUR EFFORTS TO
ACHIEVE THE GREATEST SUCCESS.”
— Vincent R. Volpe Jr., President and
Chief Executive Officer, Dresser-Rand
“Engaging new partners and addressing new markets require the right systems to support sustainable growth.” — Charles Ruffing, Director of Health, Safety, Environment and Sustainability, Eastman Kodak Company
“To constantly challenge the
present, to improve and correct our actions where necessary and to forge ahead in areas where we see the future leading us as well as our customers.” — Hans-Peter
Schaefer, CEO, Mauser Group
“THERE ARE COMPETING PRIORITIES IN
THE PURSUIT OF NEW FUEL AND VEHICLE
TECHNOLOGIES THAT ARE RELIABLE,
AFFORDABLE AND ENVIRONMENTALLY
ADVANCED; NATURAL GAS IS WELL-
POSITIONED.”
— Karen Hamberg, Vice President of
Sustainable Energy Futures, Westport
Innovations
“SUSTAINABILITY CONSIDERATIONS COVER HOW WE DESIGN AND MANUFACTURE PRODUCTS, WHAT WE OFFER CUSTOMERS, HOW WE ENGAGE SUPPLIERS, HOW WE ASSESS RISKS AND OPPORTUNITIES, AND HOW WE BEHAVE IN THE COMMUNITIES WHERE WE OPERATE AND TOWARDS ONE ANOTHER.” — ABB Group, Sustainability Performance 2011
“Yesterday, today and tomorrow are connected.
What we do today, even the smallest things,
will affect tomorrow.” — William A. Linton, Chairman & CEO, Promega
“OUR CONTRIBUTION TO A SUSTAINABLE WORLD IS THREEFOLD : SUPPORTING THE NEEDS OF A RAPIDLY DEVELOPING WORLD,
IMPROVING OUR IMPACT ON ENVIRONMENT AND SOCIETY, AND PROVIDING ENERGY-EFFICIENT SOLUTIONS FOR OUR CUSTOMERS.”
— Klaus Stahlmann, CEO, Sulzer
Page 71

The Equipment Sector
Sustainability – What Matters? | Governance & Accountability Institute, Inc.
D A T A S A M P L E
All 6 GRI Categories Ranked From Highest to Lowest Difference Score in the Equipment Sector
1. Product Responsibility (PR) 2. Society (SO) 3. Environment (EN) 4. Human Rights (HR) 5. Labor Practices and Decent
Work (LA) 6. Economic (EC)
Top 10 GRI Aspects (out of 37) Ordered Highest to Lowest Difference Score in the Equipment Sector
1. Customer Health and Safety 2. Indigenous Rights 3. Energy 4. Anti-Competitive Behavior 5. Emissions, Effluents and
Waste 6. Products and Services 7. Product and Service
Labeling 8. Compliance 9. Public Policy
10. Corruption
Reports Info Our analysis is based on information collected from 12 GRI reports of which:
• 17% were declared GRI Application Level A or A+
• 50% were declared GRI Application Level B or B+
• 17% were declared GRI Application Level C or C+
• 2 reports' GRI Application Levels were left undeclared
• and 25% were assured by a third party (+)
Equipment Sector Reporters Included in Analysis ABB Asea Brown Boveri Ltd, China National Erzhong Group Co. - China, Dresser-Rand, Eastman Kodak Company, Fiat Industrial, Mauser Group, Outotec, Promega, SBM Offshore, Sulzer, Westport Innovations, Zehnder Group
Page 72
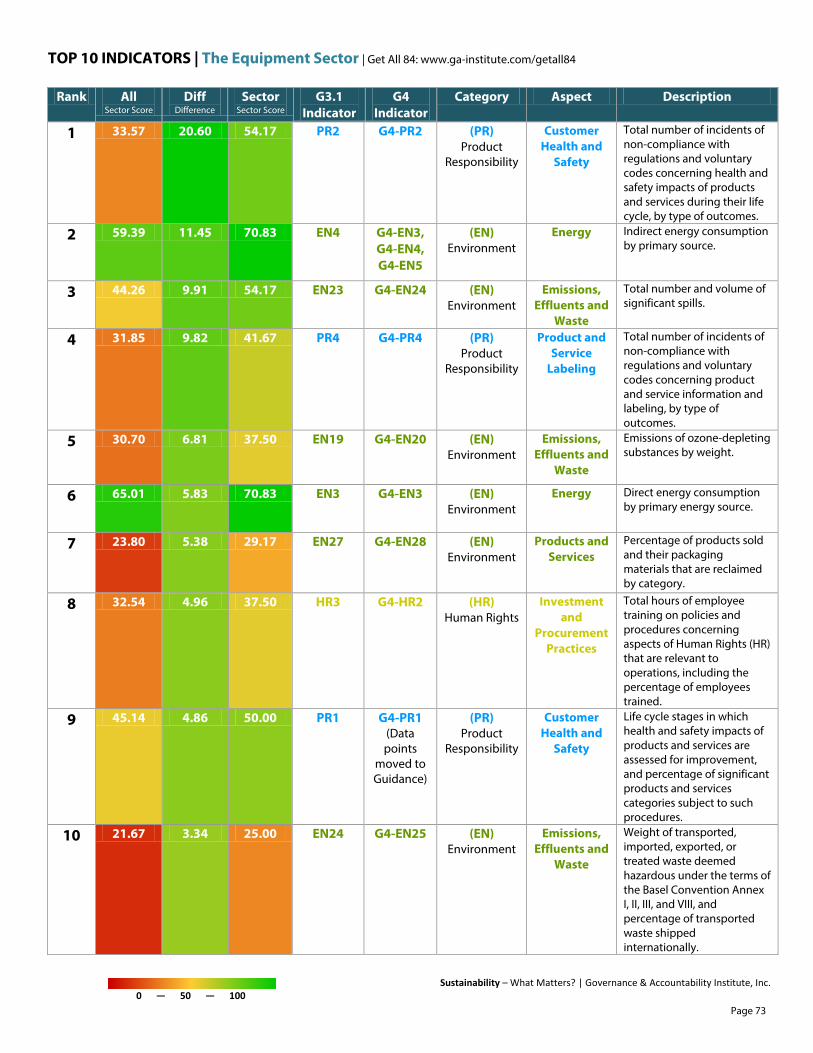
TOP 10 INDICATORS | The Equipment Sector | Get All 84: www.ga-institute.com/getall84
Sustainability – What Matters? | Governance & Accountability Institute, Inc. 0 — 50 — 100
Rank All Sector Score
Diff Difference
Sector Sector Score
G3.1 Indicator
G4 Indicator
Category Aspect Description
1 33.57 20.60 54.17 PR2 G4-PR2 (PR) Product
Responsibility
Customer Health and
Safety
Total number of incidents of non-compliance with regulations and voluntary codes concerning health and safety impacts of products and services during their life cycle, by type of outcomes.
2 59.39 11.45 70.83 EN4 G4-EN3, G4-EN4, G4-EN5
(EN) Environment
Energy Indirect energy consumption by primary source.
3 44.26 9.91 54.17 EN23 G4-EN24 (EN) Environment
Emissions, Effluents and
Waste
Total number and volume of significant spills.
4 31.85 9.82 41.67 PR4 G4-PR4 (PR) Product
Responsibility
Product and Service
Labeling
Total number of incidents of non-compliance with regulations and voluntary codes concerning product and service information and labeling, by type of outcomes.
5 30.70 6.81 37.50 EN19 G4-EN20 (EN) Environment
Emissions, Effluents and
Waste
Emissions of ozone-depleting substances by weight.
6 65.01 5.83 70.83 EN3 G4-EN3 (EN) Environment
Energy Direct energy consumption by primary energy source.
7 23.80 5.38 29.17 EN27 G4-EN28 (EN) Environment
Products and Services
Percentage of products sold and their packaging materials that are reclaimed by category.
8 32.54 4.96 37.50 HR3 G4-HR2 (HR) Human Rights
Investment and
Procurement Practices
Total hours of employee training on policies and procedures concerning aspects of Human Rights (HR) that are relevant to operations, including the percentage of employees trained.
9 45.14 4.86 50.00 PR1 G4-PR1 (Data points
moved to Guidance)
(PR) Product
Responsibility
Customer Health and
Safety
Life cycle stages in which health and safety impacts of products and services are assessed for improvement, and percentage of significant products and services categories subject to such procedures.
10 21.67 3.34 25.00 EN24 G4-EN25 (EN) Environment
Emissions, Effluents and
Waste
Weight of transported, imported, exported, or treated waste deemed hazardous under the terms of the Basel Convention Annex I, II, III, and VIII, and percentage of transported waste shipped internationally.
Page 73
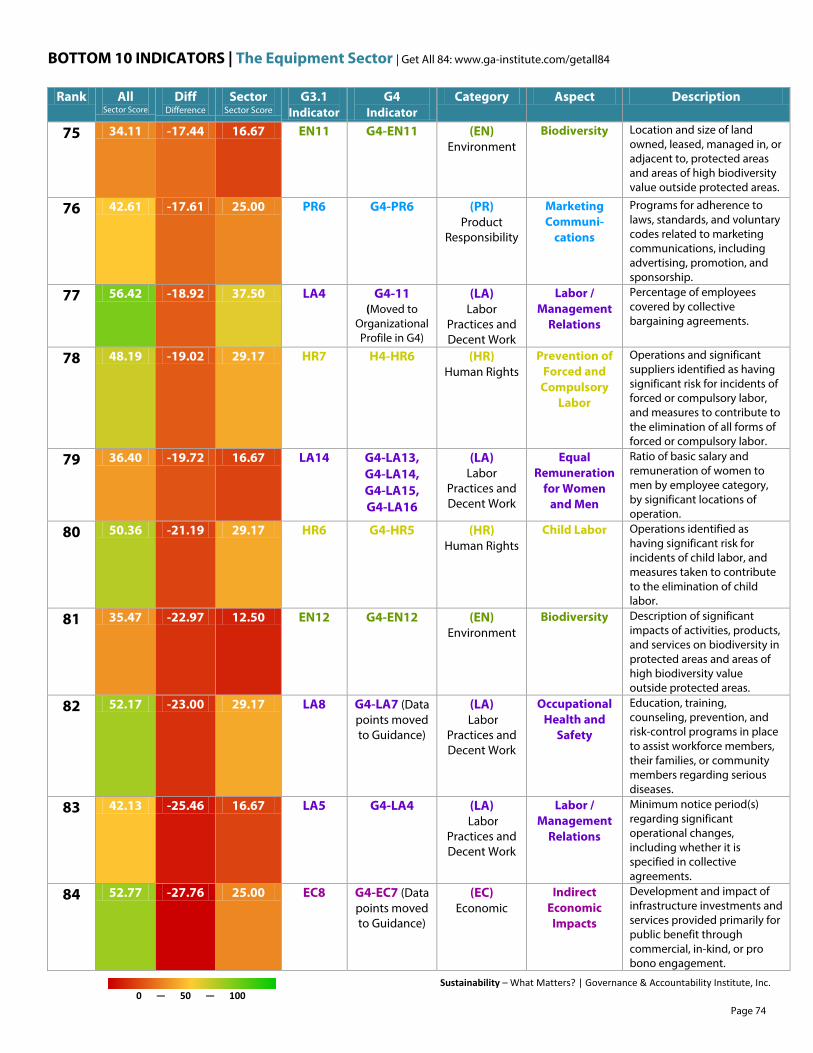
BOTTOM 10 INDICATORS | The Equipment Sector | Get All 84: www.ga-institute.com/getall84
Sustainability – What Matters? | Governance & Accountability Institute, Inc. 0 — 50 — 100
Rank All Sector Score
Diff Difference
Sector Sector Score
G3.1 Indicator
G4 Indicator
Category Aspect Description
75 34.11 -17.44 16.67 EN11 G4-EN11 (EN) Environment
Biodiversity Location and size of land owned, leased, managed in, or adjacent to, protected areas and areas of high biodiversity value outside protected areas.
76 42.61 -17.61 25.00 PR6 G4-PR6 (PR) Product
Responsibility
Marketing Communi-
cations
Programs for adherence to laws, standards, and voluntary codes related to marketing communications, including advertising, promotion, and sponsorship.
77 56.42 -18.92 37.50 LA4 G4-11 (Moved to
Organizational Profile in G4)
(LA) Labor
Practices and Decent Work
Labor / Management
Relations
Percentage of employees covered by collective bargaining agreements.
78 48.19 -19.02 29.17 HR7 H4-HR6 (HR) Human Rights
Prevention of Forced and
Compulsory Labor
Operations and significant suppliers identified as having significant risk for incidents of forced or compulsory labor, and measures to contribute to the elimination of all forms of forced or compulsory labor.
79 36.40 -19.72 16.67 LA14 G4-LA13, G4-LA14, G4-LA15, G4-LA16
(LA) Labor
Practices and Decent Work
Equal Remuneration
for Women and Men
Ratio of basic salary and remuneration of women to men by employee category, by significant locations of operation.
80 50.36 -21.19 29.17 HR6 G4-HR5 (HR) Human Rights
Child Labor Operations identified as having significant risk for incidents of child labor, and measures taken to contribute to the elimination of child labor.
81 35.47 -22.97 12.50 EN12 G4-EN12 (EN) Environment
Biodiversity Description of significant impacts of activities, products, and services on biodiversity in protected areas and areas of high biodiversity value outside protected areas.
82 52.17 -23.00 29.17 LA8 G4-LA7 (Data points moved to Guidance)
(LA) Labor
Practices and Decent Work
Occupational Health and
Safety
Education, training, counseling, prevention, and risk-control programs in place to assist workforce members, their families, or community members regarding serious diseases.
83 42.13 -25.46 16.67 LA5 G4-LA4 (LA) Labor
Practices and Decent Work
Labor / Management
Relations
Minimum notice period(s) regarding significant operational changes, including whether it is specified in collective agreements.
84 52.77 -27.76 25.00 EC8 G4-EC7 (Data points moved to Guidance)
(EC) Economic
Indirect Economic Impacts
Development and impact of infrastructure investments and services provided primarily for public benefit through commercial, in-kind, or pro bono engagement.
Page 74

sustainability — what matters? The Financial Services Sector
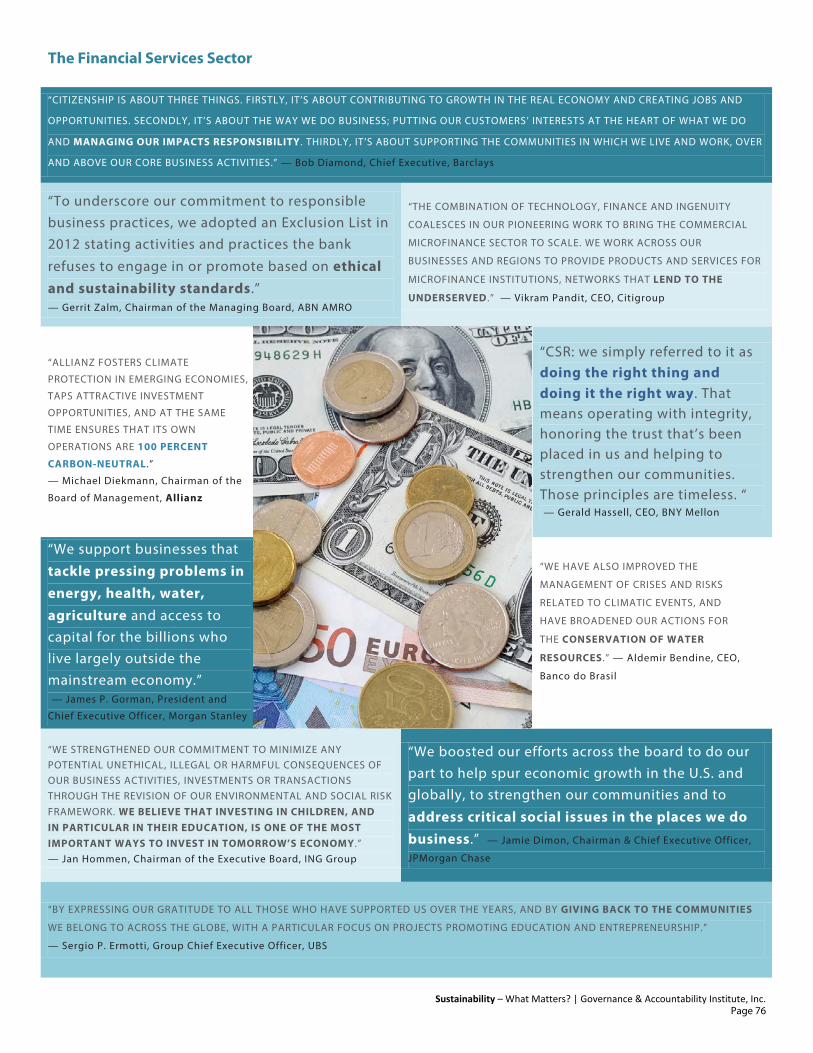
The Financial Services Sector
Sustainability – What Matters? | Governance & Accountability Institute, Inc.
“CITIZENSHIP IS ABOUT THREE THINGS. FIRSTLY, IT’S ABOUT CONTRIBUTING TO GROWTH IN THE REAL ECONOMY AND CREATING JOBS AND
OPPORTUNITIES. SECONDLY, IT’S ABOUT THE WAY WE DO BUSINESS; PUTTING OUR CUSTOMERS’ INTERESTS AT THE HEART OF WHAT WE DO
AND MANAGING OUR IMPACTS RESPONSIBILITY. THIRDLY, IT’S ABOUT SUPPORTING THE COMMUNITIES IN WHICH WE LIVE AND WORK, OVER
AND ABOVE OUR CORE BUSINESS ACTIVITIES.” — Bob Diamond, Chief Executive, Barclays
“To underscore our commitment to responsible business practices, we adopted an Exclusion List in 2012 stating activities and practices the bank
refuses to engage in or promote based on ethical and sustainability standards.” — Gerrit Zalm, Chairman of the Managing Board, ABN AMRO
“THE COMBINATION OF TECHNOLOGY, FINANCE AND INGENUITY
COALESCES IN OUR PIONEERING WORK TO BRING THE COMMERCIAL
MICROFINANCE SECTOR TO SCALE. WE WORK ACROSS OUR
BUSINESSES AND REGIONS TO PROVIDE PRODUCTS AND SERVICES FOR
MICROFINANCE INSTITUTIONS, NETWORKS THAT LEND TO THE
UNDERSERVED .” — Vikram Pandit, CEO, Citigroup
“ALLIANZ FOSTERS CLIMATE
PROTECTION IN EMERGING ECONOMIES,
TAPS ATTRACTIVE INVESTMENT
OPPORTUNITIES, AND AT THE SAME
TIME ENSURES THAT ITS OWN
OPERATIONS ARE 100 PERCENT
CARBON-NEUTRAL.”
— Michael Diekmann, Chairman of the
Board of Management, Allianz
“CSR: we simply referred to it as doing the right thing and doing it the right way. That means operating with integrity, honoring the trust that’s been placed in us and helping to strengthen our communities. Those principles are timeless. “ — Gerald Hassell, CEO, BNY Mellon
“We support businesses that
tackle pressing problems in energy, health, water, agriculture and access to capital for the billions who live largely outside the mainstream economy.” — James P. Gorman, President and
Chief Executive Officer, Morgan Stanley
“WE HAVE ALSO IMPROVED THE
MANAGEMENT OF CRISES AND RISKS
RELATED TO CLIMATIC EVENTS, AND
HAVE BROADENED OUR ACTIONS FOR
THE CONSERVATION OF WATER
RESOURCES.” — Aldemir Bendine, CEO,
Banco do Brasil
“WE STRENGTHENED OUR COMMITMENT TO MINIMIZE ANY POTENTIAL UNETHICAL, ILLEGAL OR HARMFUL CONSEQUENCES OF OUR BUSINESS ACTIVITIES, INVESTMENTS OR TRANSACTIONS THROUGH THE REVISION OF OUR ENVIRONMENTAL AND SOCIAL RISK FRAMEWORK. WE BELIEVE THAT INVESTING IN CHILDREN, AND IN PARTICULAR IN THEIR EDUCATION, IS ONE OF THE MOST IMPORTANT WAYS TO INVEST IN TOMORROW’S ECONOMY.” — Jan Hommen, Chairman of the Executive Board, ING Group
“We boosted our efforts across the board to do our part to help spur economic growth in the U.S. and globally, to strengthen our communities and to
address critical social issues in the places we do business.” — Jamie Dimon, Chairman & Chief Executive Officer,
JPMorgan Chase
“BY EXPRESSING OUR GRATITUDE TO ALL THOSE WHO HAVE SUPPORTED US OVER THE YEARS, AND BY GIVING BACK TO THE COMMUNITIES
WE BELONG TO ACROSS THE GLOBE, WITH A PARTICULAR FOCUS ON PROJECTS PROMOTING EDUCATION AND ENTREPRENEURSHIP.”
— Sergio P. Ermotti, Group Chief Executive Officer, UBS
Page 76
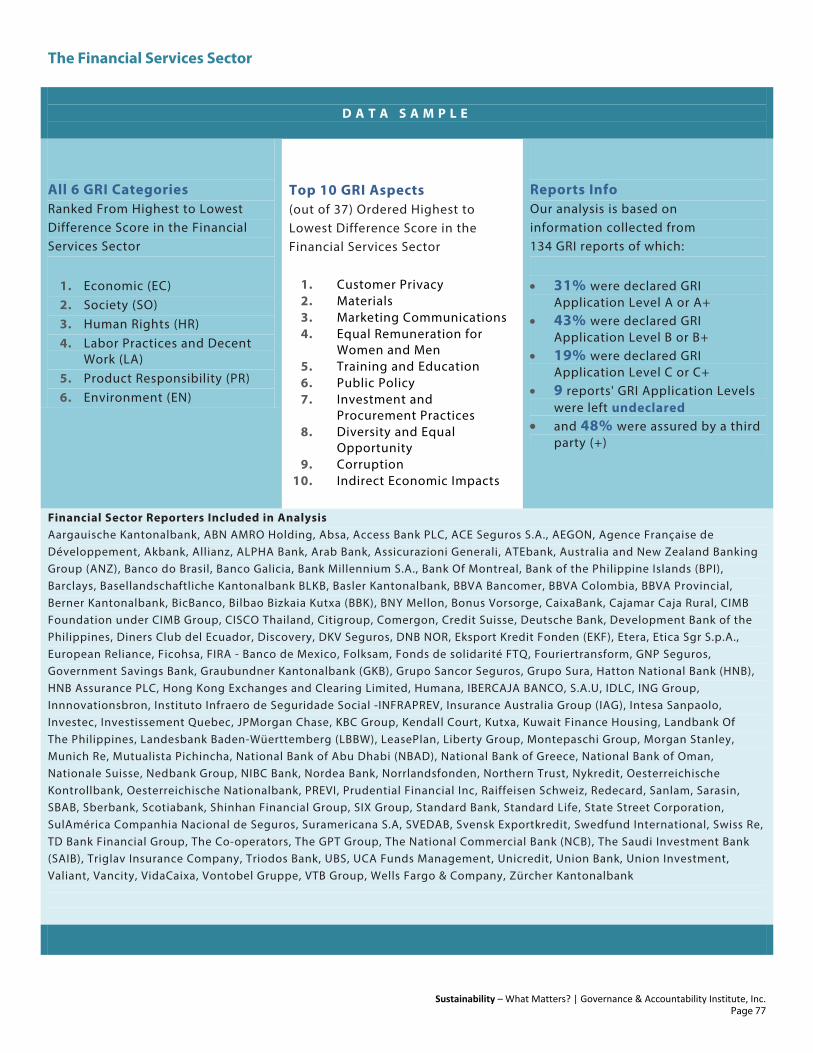
The Financial Services Sector
Sustainability – What Matters? | Governance & Accountability Institute, Inc.
D A T A S A M P L E
All 6 GRI Categories Ranked From Highest to Lowest Difference Score in the Financial Services Sector
1. Economic (EC) 2. Society (SO) 3. Human Rights (HR) 4. Labor Practices and Decent
Work (LA) 5. Product Responsibility (PR) 6. Environment (EN)
Top 10 GRI Aspects (out of 37) Ordered Highest to Lowest Difference Score in the Financial Services Sector
1. Customer Privacy 2. Materials 3. Marketing Communications 4. Equal Remuneration for
Women and Men 5. Training and Education 6. Public Policy 7. Investment and
Procurement Practices 8. Diversity and Equal
Opportunity 9. Corruption
10. Indirect Economic Impacts
Reports Info Our analysis is based on information collected from 134 GRI reports of which:
• 31% were declared GRI Application Level A or A+
• 43% were declared GRI Application Level B or B+
• 19% were declared GRI Application Level C or C+
• 9 reports' GRI Application Levels were left undeclared
• and 48% were assured by a third party (+)
Financial Sector Reporters Included in Analysis Aargauische Kantonalbank, ABN AMRO Holding, Absa, Access Bank PLC, ACE Seguros S.A., AEGON, Agence Française de Développement, Akbank, Allianz, ALPHA Bank, Arab Bank, Assicurazioni Generali, ATEbank, Australia and New Zealand Banking Group (ANZ), Banco do Brasil, Banco Galicia, Bank Millennium S.A., Bank Of Montreal, Bank of the Philippine Islands (BPI), Barclays, Basellandschaftliche Kantonalbank BLKB, Basler Kantonalbank, BBVA Bancomer, BBVA Colombia, BBVA Provincial, Berner Kantonalbank, BicBanco, Bilbao Bizkaia Kutxa (BBK), BNY Mellon, Bonus Vorsorge, CaixaBank, Cajamar Caja Rural, CIMB Foundation under CIMB Group, CISCO Thailand, Citigroup, Comergon, Credit Suisse, Deutsche Bank, Development Bank of the Philippines, Diners Club del Ecuador, Discovery, DKV Seguros, DNB NOR, Eksport Kredit Fonden (EKF), Etera, Etica Sgr S.p.A., European Reliance, Ficohsa, FIRA - Banco de Mexico, Folksam, Fonds de solidarité FTQ, Fouriertransform, GNP Seguros, Government Savings Bank, Graubundner Kantonalbank (GKB), Grupo Sancor Seguros, Grupo Sura, Hatton National Bank (HNB), HNB Assurance PLC, Hong Kong Exchanges and Clearing Limited, Humana, IBERCAJA BANCO, S.A.U, IDLC, ING Group, Innnovationsbron, Instituto Infraero de Seguridade Social -INFRAPREV, Insurance Australia Group (IAG), Intesa Sanpaolo, Investec, Investissement Quebec, JPMorgan Chase, KBC Group, Kendall Court, Kutxa, Kuwait Finance Housing, Landbank Of The Philippines, Landesbank Baden-Wüerttemberg (LBBW), LeasePlan, Liberty Group, Montepaschi Group, Morgan Stanley, Munich Re, Mutualista Pichincha, National Bank of Abu Dhabi (NBAD), National Bank of Greece, National Bank of Oman, Nationale Suisse, Nedbank Group, NIBC Bank, Nordea Bank, Norrlandsfonden, Northern Trust, Nykredit, Oesterreichische Kontrollbank, Oesterreichische Nationalbank, PREVI, Prudential Financial Inc, Raiffeisen Schweiz, Redecard, Sanlam, Sarasin, SBAB, Sberbank, Scotiabank, Shinhan Financial Group, SIX Group, Standard Bank, Standard Life, State Street Corporation, SulAmérica Companhia Nacional de Seguros, Suramericana S.A, SVEDAB, Svensk Exportkredit, Swedfund International, Swiss Re, TD Bank Financial Group, The Co-operators, The GPT Group, The National Commercial Bank (NCB), The Saudi Investment Bank (SAIB), Triglav Insurance Company, Triodos Bank, UBS, UCA Funds Management, Unicredit, Union Bank, Union Investment, Valiant, Vancity, VidaCaixa, Vontobel Gruppe, VTB Group, Wells Fargo & Company, Zürcher Kantonalbank
Page 77

TOP 10 INDICATORS | The Financial Services Sector | Get All 84: www.ga-institute.com/getall84
Sustainability – What Matters? | Governance & Accountability Institute, Inc. 0 — 50 — 100
Rank All Sector Score
Diff Difference
Sector Sector Score
G3.1 Indicator
G4 Indicator
Category Aspect Description
1 42.61 7.39 50.00 PR6 G4-PR6 (PR) Product
Responsibility
Marketing Commun-
ications
Programs for adherence to laws, standards, and voluntary codes related to marketing communications, including advertising, promotion, and sponsorship.
2 33.35 7.33 40.67 HR1 G4-HR1 (HR) Human Rights
Investment and
Procurement Practices
Percentage and total number of significant investment agreements and contracts that include Human Rights (HR) clauses or that have undergone Human Rights (HR) screening.
3 37.76 6.27 44.03 EC9 G4-EC8 (Data points
moved to Guidance)
(EC) Economic
Indirect Economic Impacts
Understanding and describing significant indirect economic impacts, including the extent of impacts.
4 35.42 5.63 41.04 PR8 G4-PR8 (PR) Product
Responsibility
Customer Privacy
Total number of substantiated complaints regarding breaches of customer privacy and losses of customer data.
5 36.20 4.85 41.04 EN2 G4-EN2 (EN) Environment
Materials Percentage of materials used that are recycled input materials.
6 51.61 4.74 56.34 PR5 G4-PR5 (Data points
moved to Guidance)
(PR) Product
Responsibility
Product and Service
Labeling
Practices related to customer satisfaction, including results of surveys measuring customer satisfaction.
7 43.70 4.44 48.13 EN1 G4-EN1 (EN) Environment
Materials Materials used by weight or volume.
8 54.37 4.21 58.58 EC3 G4-EC3 (EC) Economic
Economic Performance
Coverage of the organization's defined benefit plan obligations.
9 41.05 4.10 45.15 SO6 G4-SO6 (SO) Society
Public Policy Total value of financial and in-kind contributions to political parties, politicians, and related institutions by country.
10 30.70 3.26 33.96 EC5 G4-EC5 (EC) Economic
Market Presence
Range of ratios of standard entry level wage compared to local minimum wage at significant locations of operation.
Page 78

BOTTOM 10 INDICATORS | The Financial Services Sector | Get All 84: www.ga-institute.com/getall84
Sustainability – What Matters? | Governance & Accountability Institute, Inc. 0 — 50 — 100
Rank All Sector Score
Diff Difference
Sector Sector Score
G3.1 Indicator
G4 Indicator
Category Aspect Description
75 29.05 -13.38 15.67 EN9 G4-EN9 (EN) Environment
Water Water sources significantly affected by withdrawal of water.
76 33.57 -13.42 20.15 PR2 G4-PR2 (PR) Product
Responsibility
Customer Health and
Safety
Total number of incidents of non-compliance with regulations and voluntary codes concerning health and safety impacts of products and services during their life cycle, by type of outcomes.
77 56.98 -13.69 43.28 LA7 G4-LA6 (LA) Labor
Practices and Decent Work
Occupational Health and
Safety
Rates of injury, occupational diseases, lost days, and absenteeism, and number of work-related fatalities by region and by gender.
78 31.02 -14.22 16.79 EN10 G4-EN10 (EN) Environment
Water Percentage and total volume of water recycled and reused.
79 29.57 -14.64 14.93 EN13 G4-EN13 (EN) Environment
Biodiversity Habitats protected or restored.
80 33.31 -17.63 15.67 EN14 Entire Indicator Moved to Guidance
(EN) Environment
Biodiversity Strategies, current actions, and future plans for managing impacts on biodiversity.
81 45.14 -18.64 26.49 PR1 G4-PR1 (Data points
moved to Guidance)
(PR) Product
Responsibility
Customer Health and
Safety
Life cycle stages in which health and safety impacts of products and services are assessed for improvement, and percentage of significant products and services categories subject to such procedures.
82 37.32 -19.78 17.54 EN21 G4-EN22 (EN) Environment
Emissions, Effluents and
Waste
Total water discharge by quality and destination.
83 37.52 -22.22 15.30 EN20 G4-EN21 (EN) Environment
Emissions, Effluents and
Waste
NOx, SOx, and other significant air emissions by type and weight.
84 44.26 -26.35 17.91 EN23 G4-EN24 (EN) Environment
Emissions, Effluents and
Waste
Total number and volume of significant spills.
Page 79

sustainability — what matters? The Food and Beverage Sector

The Food and Beverage Sector
Sustainability – What Matters? | Governance & Accountability Institute, Inc.
" WE RECOGNISE THAT […] WE NEED TO CONTRIBUTE MORE BROADLY TO THE SOCIETIES WHERE WE OPERATE, WHICH WE ARE DOING THROUGH A NUMBER OF INITIATIVES RANGING FROM SOURCING HEALTHY DRINKING WATER IN RURAL AREAS IN AFRICA AND ASIA TO SUPPORTING EDUCATIONAL PROGRAMMES FOR CHILDREN IN EASTERN EUROPE, ASIA AND AFRICA. WE ARE ALSO PARTNERING WITH THE FAIR LABOR ASSOCIATION, A NON-PROFIT MULTI-STAKEHOLDER INITIATIVE, TO INVESTIGATE WHETHER CHILDREN ARE WORKING ON COCOA FARMS SUPPLYING OUR FACTORIES, SO WE CAN ADDRESS ANY ISSUES EFFECTIVELY AND TRANSPARENTLY ." — Peter Brabeck-Letmathe, Chairman; Paul Bulcke, Chief Executive Officer, Nestlé
“[W]e continue to broaden our ethical sourcing programs. Today, we are proud that more than 93% of our coffee meets our standard on this front. And through our enhanced sourcing efforts for cocoa, tea and manufactured products, we are making a more positive impact than ever before.” — Howard Schultz,
Chairman, President & CEO. Starbucks Coffee Company
“WE BELIEVE THE BIOLOGICAL RISK IN CHILE IS STILL HIGH, WITH
BACTERIAL DISEASE AND SEA LICE AS KEY ISSUES. AS THE INDUSTRY’S
STANDING BIOMASS IN SEA IS EXPECTED TO INCREASE TO PRE-CRISIS
LEVELS, WE ARE CONCERNED ABOUT THE EFFECT ON FISH HEALTH
AND PERFORMANCE. […] OVERALL OUR ENVIRONMENTAL
PERFORMANCE IS IMPROVING, WHILE WE STILL SEE AMPLE ROOM
FOR FURTHER IMPROVEMENTS.” — Alf-Helge Aarskog, Chief Executive
Officer, Marine Harvest
“WITH REGARD TO THE ENVIRONMENT, THE RESPONSIBLE STEWARDSHIP OF OUR LAND AND WATER IS ESSENTIAL TO ENSURING THE QUALITY OF OUR PRODUCTS. BUT IT’S NOT ONLY IN OUR BUSINESS INTEREST TO BE AS EFFICIENT AS POSSIBLE IN OUR USE OF NATURAL RESOURCES. WE ALSO KNOW THAT REDUCING OUR ENVIRONMENTAL IMPACT PRESERVES AND PROTECTS THE PLANET FOR FUTURE GENERATIONS." — Carlos Brito, Chief Executive Officer, Anheuser-Busch Companies
“We piloted […] a program which enables us to recycle our hot beverage cups into our take-out trays, we increased the fuel efficiency of our distribution fleet by 6.7%, and we revised and finalized our Animal Welfare Policy and worked with industry partners and our suppliers to understand and develop best practices.” — Paul D. House, Executive Chairman, President and CEO, Tim Hortons
" With 30% of waste coming from customers’ plates we supported the launch of their doggy box with the aim of trying to make it more socially acceptable for customers to ask to take the rest of their unfinished meal away. We think that avoidance of food waste should never be frowned upon!" — Alex Fisher, Managing Director. BFS Group Limited
"SINCE 2005, AS PART OF OUR EFFORTS TO
BECOME WATER NEUTRAL BY 2020, WE’VE
CONDUCTED 382 COMMUNITY WATER
PROJECTS IN 94 COUNTRIES, WORKING
HAND IN HAND WITH LOCAL GOVERNMENTS
AND PARTNERS INCLUDING WORLD
WILDLIFE FUND (WWF), THE UNITED STATES
AGENCY FOR INTERNATIONAL
DEVELOPMENT, THE NATURE CONSERVANCY
AND CARE.” — Muhtar Kent, Chairman and
CEO, Coca-Cola Company
“FERRERO IS COMMITTED TO REACHING 100% CERTIFIED AS TRACEABLE AND SUSTAINABLE COCOA, COFFEE, PALM OIL AND HAZELNUTS BEFORE 2020 AND TO IMPROVING THE LIVING CONDITIONS OF FARMERS IN SOME OF THE POOREST COUNTRIES OF THE WORLD. THIS WILL ALLOW, IN THE LONG TERM, INCREASED PRODUCTIVITY FROM THE SAME HARVESTING SOURCES AND ENHANCED FARMERS’ SKILLS, ALSO TO ADDRESS CLIMATE CHANGE CHALLENGES.” — Giovanni Ferrero, Chief Executive Officer, Ferrero International
" Over the last two years we have focused, in particular, on resource use within our own operations. In 2009, we set a target to reduce our per restaurant energy and
water usage by 15 percent by 2015. We are pleased to report that by Fy2011, we had reduced per restaurant water usage by 17 percent on an aggregate basis,
exceeding our water goal." — Clarence Otis, Jr., Chairman &
CEO; Andrew H. Madsen, President & COO, Darden Restaurants “[OUR VOLUNTEER] PROGRAM IS DESIGNED TO PROVIDE NUTRITIOUS MEALS AND HEALTH ADVICE TO DISADVANTAGED YOUTH IN SOUTH
WESTERN SYDNEY. THESE ACTIVITIES HAVE ALLOWED MANY OF OUR EMPLOYEES TO EXPERIENCE FIRSTHAND THE CHALLENGES FACED BY
SOME OF THE YOUNG PEOPLE IN OUR COMMUNITIES AND HOW THE COMPANY’S EFFORTS, IN CONJUNCTION WITH OFA, ARE PROVIDING THE
SUPPORT AND UNDERSTANDING NEEDED TO ENCOURAGE THESE YOUTH TO MAKE LIFE CHOICES THAT WILL LEAD TO A HAPPIER AND
HEALTHIER FUTURE.” — Chris Delaney, Managing Director and Chief Executive Officer, Goodman Fielder
Page 81

The Food and Beverage Sector
Sustainability – What Matters? | Governance & Accountability Institute, Inc.
D A T A S A M P L E
All 6 GRI Categories Ranked From Highest to Lowest Difference Score in the Food and Beverage Sector
1. Product Responsibility (PR) 2. Environment (EN) 3. Economic (EC) 4. Labor Practices and Decent
Work (LA) 5. Human Rights (HR) 6. Society (SO)
Top 10 GRI Aspects (out of 37) Ordered Highest to Lowest Difference Score in the Food and Beverage Sector
1. Customer Health and Safety 2. Marketing Communications 3. Products and Services 4. Transport 5. Public Policy 6. Product and Service
Labeling 7. Materials 8. Water 9. Energy
10. Emissions, Effluents and Waste
Reports Info Our analysis is based on information collected from 96 GRI reports of which:
• 23% were declared GRI Application Level A or A+
• 43% were declared GRI Application Level B or B+
• 22% were declared GRI Application Level C or C+
• 11 reports' GRI Application Levels were left undeclared
• and 41% were assured by a third party (+)
Food and Beverage Sector Reporters Included in Analysis AB Anders Löfberg, Alko, Alpina, Alsea, Altia, Amorim, Anheuser-Busch Companies, Asia Pacific Breweries Limited (APBL), Autogrill, Axfood, Barry Callebaut AG, BFS Group Limited, BONDUELLE SAS, BRF (Brasil Foods), Brown-Forman Corporation, Bunge Brazil, C.D.A. di Cattelan srl, Campbell Soup, Carlsberg Group, CCU, CELLER VEGA AIXALA, Cermaq, Chicken of the Sea, Coca-Cola Company, Coca-Cola de Argentina, Coca-Cola Femsa, Coca-Cola Germany, Coca-Cola HBC Switzerland, Coca-Cola Hellenic, Coca-Cola Hellenic Russia, Coca-Cola Hungary, Coca-Cola İcecek Turkey, Coca-Cola UK, Colombina, ConAgra Foods, Cuauhtémoc Moctezuma, Danone Group, Danone Poland, Darden Restaurants, Diageo, Dr Pepper Snapple Group, Erre de Vic, FEMSA, Ferrero International, Florida Ice & Farm Company (FIFCO), General Mills, Goodman Fielder, Grupo ARCOR, Grupo Bimbo, Grupo Marfrig, Grupo Nutresa, Heineken N.V., Heineken Spain, Hershey's, Hormel Foods, ICI, Joh. Barth & Sohn GmbH & Co. KG, Kärntnermilch, Kellogg, Kooperativa Förbundet Ekonomisk Förening (KF), Lantmännen, LVMH Group, Mahou-San Miguel Group, Marine Harvest, McDonald's Australia, McDonald's Corporation, McDonald's Deutschland Inc., Zweigniederlassung München, MoliNos Río de la Plata, Nestlé, Nestle Hellas, Nestlé Hungária, Nestlé Poland, Nestlé Portugal, OLEUM FLUMEN, Pacific Andes International Holdings Limited, Palsgaard, PRONACA, Riopaila Castilla S.A., Royal Wessanen, SABMiller UK, SanCor Cooperativas Unidas Limitada, Sanford, Simplot Australia, Smithfield, Spendrups Bryggerier AB, Starbucks Coffee Company, Sunny Delight, Tim Hortons, Unilever Brazil, Unilever Israel, Union de Cervecerias Peruanas Backus y Johnston, Vaasan, Vöslauer, Wesfarmers, Westfleisch, ŻYWIEC ZDRÓJ S.A.
Page 82

TOP 10 INDICATORS | The Food and Beverage Sector | Get All 84: www.ga-institute.com/getall84
Sustainability – What Matters? | Governance & Accountability Institute, Inc. 0 — 50 — 100
Rank All Sector Score
Diff Difference
Sector Sector Score
G3.1 Indicator
G4 Indicator
Category Aspect Description
1 42.61 13.64 56.25 PR6 G4-PR6 (PR) Product
Responsibility
Marketing Commun-
ications
Programs for adherence to laws, standards, and voluntary codes related to marketing communications, including advertising, promotion, and sponsorship.
2 45.14 10.59 55.73 PR1 G4-PR1 (Data points
moved to Guidance)
(PR) Product
Responsibility
Customer Health and
Safety
Life cycle stages in which health and safety impacts of products and services are assessed for improvement, and percentage of significant products and services categories subject to such procedures.
3 42.37 9.72 52.08 PR3 G4-PR3 (PR) Product
Responsibility
Product and Service
Labeling
Type of product and service information required by procedures, and percentage of significant products and services subject to such information requirements.
4 33.57 9.14 42.71 PR2 G4-PR2 (PR) Product
Responsibility
Customer Health and
Safety
Total number of incidents of non-compliance with regulations and voluntary codes concerning health and safety impacts of products and services during their life cycle, by type of outcomes.
5 23.80 9.02 32.81 EN27 G4-EN28 (EN) Environment
Products and Services
Percentage of products sold and their packaging materials that are reclaimed by category.
6 37.32 8.00 45.31 EN21 G4-EN22 (EN) Environment
Emissions, Effluents and
Waste
Total water discharge by quality and destination.
7 31.02 5.44 36.46 EN10 G4-EN10 (EN) Environment
Water Percentage and total volume of water recycled and reused.
8 66.65 5.23 71.88 EN16 G4-EN15, G4-EN16
(EN) Environment
Emissions, Effluents and
Waste
Total direct and indirect greenhouse gas emissions by weight.
9 35.51 5.12 40.63 EN29 G4-EN30 (EN) Environment
Transport Significant environmental impacts of transporting products and other goods and materials used for the organization's operations, and transporting members of the workforce.
10 57.54 4.96 62.50 EN8 G4-EN8 (EN) Environment
Water Total water withdrawal by source.
Page 83
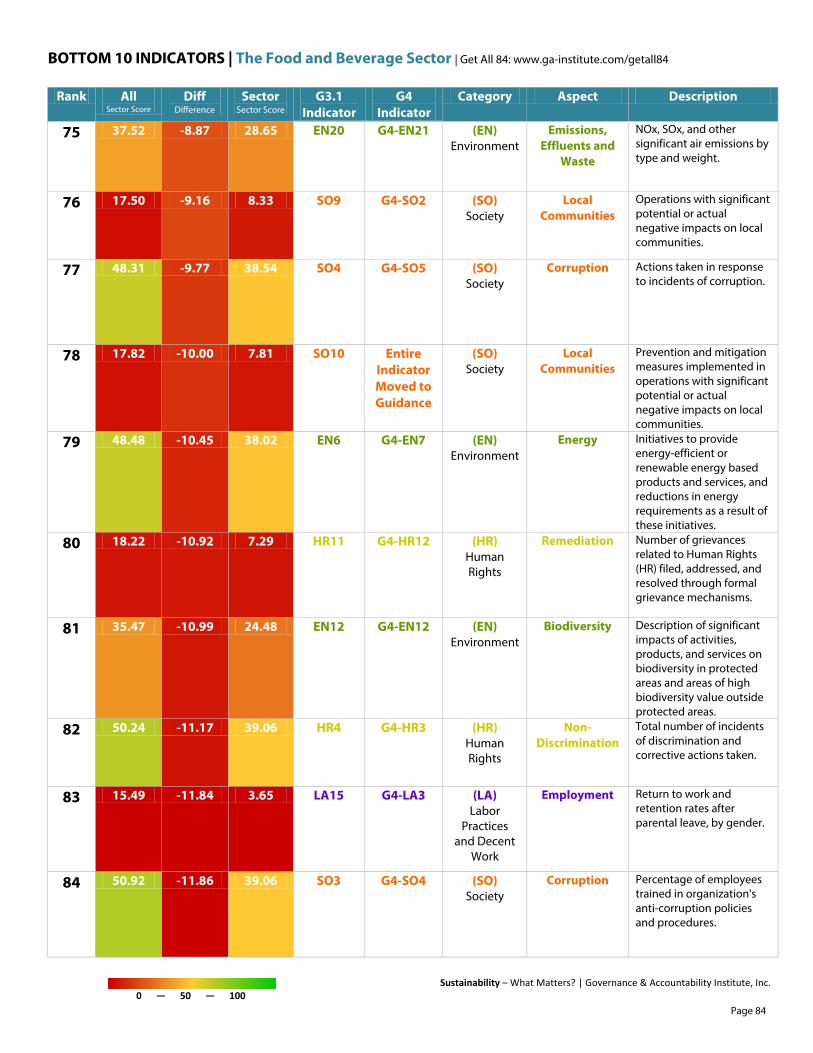
BOTTOM 10 INDICATORS | The Food and Beverage Sector | Get All 84: www.ga-institute.com/getall84
Sustainability – What Matters? | Governance & Accountability Institute, Inc. 0 — 50 — 100
Rank All Sector Score
Diff Difference
Sector Sector Score
G3.1 Indicator
G4 Indicator
Category Aspect Description
75 37.52 -8.87 28.65 EN20 G4-EN21 (EN) Environment
Emissions, Effluents and
Waste
NOx, SOx, and other significant air emissions by type and weight.
76 17.50 -9.16 8.33 SO9 G4-SO2 (SO) Society
Local Communities
Operations with significant potential or actual negative impacts on local communities.
77 48.31 -9.77 38.54 SO4 G4-SO5 (SO) Society
Corruption Actions taken in response to incidents of corruption.
78 17.82 -10.00 7.81 SO10 Entire Indicator Moved to Guidance
(SO) Society
Local Communities
Prevention and mitigation measures implemented in operations with significant potential or actual negative impacts on local communities.
79 48.48 -10.45 38.02 EN6 G4-EN7 (EN) Environment
Energy Initiatives to provide energy-efficient or renewable energy based products and services, and reductions in energy requirements as a result of these initiatives.
80 18.22 -10.92 7.29 HR11 G4-HR12 (HR) Human Rights
Remediation Number of grievances related to Human Rights (HR) filed, addressed, and resolved through formal grievance mechanisms.
81 35.47 -10.99 24.48 EN12 G4-EN12 (EN) Environment
Biodiversity Description of significant impacts of activities, products, and services on biodiversity in protected areas and areas of high biodiversity value outside protected areas.
82 50.24 -11.17 39.06 HR4 G4-HR3 (HR) Human Rights
Non-Discrimination
Total number of incidents of discrimination and corrective actions taken.
83 15.49 -11.84 3.65 LA15 G4-LA3 (LA) Labor
Practices and Decent
Work
Employment Return to work and retention rates after parental leave, by gender.
84 50.92 -11.86 39.06 SO3 G4-SO4 (SO) Society
Corruption Percentage of employees trained in organization's anti-corruption policies and procedures.
Page 84
sustainability — what matters? The Forest and Paper Products Sector
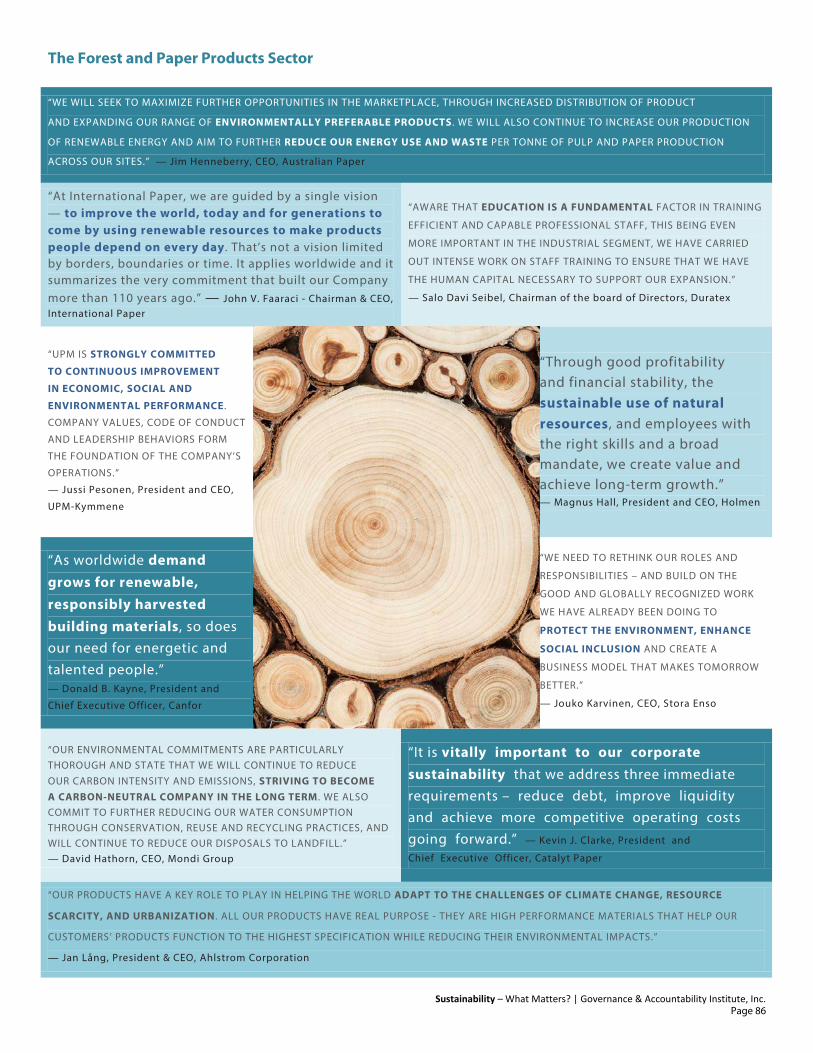
The Forest and Paper Products Sector
Sustainability – What Matters? | Governance & Accountability Institute, Inc.
“WE WILL SEEK TO MAXIMIZE FURTHER OPPORTUNITIES IN THE MARKETPLACE, THROUGH INCREASED DISTRIBUTION OF PRODUCT
AND EXPANDING OUR RANGE OF ENVIRONMENTALLY PREFERABLE PRODUCTS. WE WILL ALSO CONTINUE TO INCREASE OUR PRODUCTION
OF RENEWABLE ENERGY AND AIM TO FURTHER REDUCE OUR ENERGY USE AND WASTE PER TONNE OF PULP AND PAPER PRODUCTION
ACROSS OUR SITES.” — Jim Henneberry, CEO, Australian Paper
“At International Paper, we are guided by a single vision — to improve the world, today and for generations to come by using renewable resources to make products people depend on every day. That’s not a vision limited by borders, boundaries or time. It applies worldwide and it summarizes the very commitment that built our Company more than 110 years ago.” — John V. Faaraci - Chairman & CEO, International Paper
“AWARE THAT EDUCATION IS A FUNDAMENTAL FACTOR IN TRAINING
EFFICIENT AND CAPABLE PROFESSIONAL STAFF, THIS BEING EVEN
MORE IMPORTANT IN THE INDUSTRIAL SEGMENT, WE HAVE CARRIED
OUT INTENSE WORK ON STAFF TRAINING TO ENSURE THAT WE HAVE
THE HUMAN CAPITAL NECESSARY TO SUPPORT OUR EXPANSION.”
— Salo Davi Seibel, Chairman of the board of Directors, Duratex
“UPM IS STRONGLY COMMITTED
TO CONTINUOUS IMPROVEMENT
IN ECONOMIC, SOCIAL AND
ENVIRONMENTAL PERFORMANCE.
COMPANY VALUES, CODE OF CONDUCT
AND LEADERSHIP BEHAVIORS FORM
THE FOUNDATION OF THE COMPANY’S
OPERATIONS.”
— Jussi Pesonen, President and CEO,
UPM-Kymmene
“Through good profitability and financial stability, the sustainable use of natural resources, and employees with the right skills and a broad mandate, we create value and achieve long-term growth.” — Magnus Hall, President and CEO, Holmen
“As worldwide demand grows for renewable, responsibly harvested building materials, so does our need for energetic and talented people.” — Donald B. Kayne, President and
Chief Executive Officer, Canfor
“WE NEED TO RETHINK OUR ROLES AND
RESPONSIBILITIES – AND BUILD ON THE
GOOD AND GLOBALLY RECOGNIZED WORK
WE HAVE ALREADY BEEN DOING TO
PROTECT THE ENVIRONMENT, ENHANCE
SOCIAL INCLUSION AND CREATE A
BUSINESS MODEL THAT MAKES TOMORROW
BETTER.”
— Jouko Karvinen, CEO, Stora Enso
“OUR ENVIRONMENTAL COMMITMENTS ARE PARTICULARLY THOROUGH AND STATE THAT WE WILL CONTINUE TO REDUCE OUR CARBON INTENSITY AND EMISSIONS, STRIVING TO BECOME A CARBON-NEUTRAL COMPANY IN THE LONG TERM . WE ALSO COMMIT TO FURTHER REDUCING OUR WATER CONSUMPTION THROUGH CONSERVATION, REUSE AND RECYCLING PRACTICES, AND WILL CONTINUE TO REDUCE OUR DISPOSALS TO LANDFILL.” — David Hathorn, CEO, Mondi Group
“It is vitally important to our corporate sustainability that we address three immediate requirements – reduce debt, improve liquidity and achieve more competitive operating costs going forward.” — Kevin J. Clarke, President and
Chief Executive Officer, Catalyt Paper
“OUR PRODUCTS HAVE A KEY ROLE TO PLAY IN HELPING THE WORLD ADAPT TO THE CHALLENGES OF CLIMATE CHANGE, RESOURCE
SCARCITY, AND URBANIZATION. ALL OUR PRODUCTS HAVE REAL PURPOSE - THEY ARE HIGH PERFORMANCE MATERIALS THAT HELP OUR
CUSTOMERS’ PRODUCTS FUNCTION TO THE HIGHEST SPECIFICATION WHILE REDUCING THEIR ENVIRONMENTAL IMPACTS.”
— Jan Lång, President & CEO, Ahlstrom Corporation
Page 86

The Forest and Paper Products Sector
Sustainability – What Matters? | Governance & Accountability Institute, Inc.
D A T A S A M P L E
All 6 GRI Categories Ranked From Highest to Lowest Difference Score in the Forest and Paper Products Sector
1. Environment (EN) 2. Economic (EC) 3. Labor Practices and Decent
Work (LA) 4. Human Rights (HR) 5. Society (SO) 6. Product Responsibility (PR)
Top 10 GRI Aspects (out of 37) Ordered Highest to Lowest Difference Score in the Forest and Paper Products Sector
1. Materials 2. Biodiversity 3. Labor/Management
Relations 4. Indigenous Rights 5. Product and Service
Labeling 6. Public Policy 7. Training and Education 8. Economic Performance 9. Water
10. Emissions, Effluents and Waste
Reports Info Our analysis is based on information collected from 18 GRI reports of which:
• 28% were declared GRI Application Level A or A+
• 44% were declared GRI Application Level B or B+
• 22% were declared GRI Application Level C or C+
• 1 report’s GRI Application Level was left undeclared
• and 50% were assured by a third party (+)
Forest and Paper Products Sector Reporters Included in Analysis Ahlstrom Corporation, Australian Paper, Canfor Corp., Catalyst Paper, Cham Paper Group, Duratex, Grupo Portucel, Holmen, International Paper, Martela, Metsaliitto/ METSÄ GROUP, Mondi Group, SAP Labs, SCA - Svenska Cellulosa Aktiebolaget, SERVIFUSTER, S.A., Stora Enso, Sveaskog, UPM-Kymmene
Page 87

TOP 10 INDICATORS | The Forest and Paper Products Sector | Get All 84: www.ga-institute.com/getall84
Sustainability – What Matters? | Governance & Accountability Institute, Inc. 0 — 50 — 100
Rank All Sector Score
Diff Difference
Sector Sector Score
G3.1 Indicator
G4 Indicator
Category Aspect Description
1 37.52 29.15 66.67 EN20 G4-EN21 (EN) Environment
Emissions, Effluents and
Waste
NOx, SOx, and other significant air emissions by type and weight.
2 36.20 24.92 61.11 EN2 G4-EN2 (EN) Environment
Materials Percentage of materials used that are recycled input materials.
3 34.11 24.23 58.33 EN11 G4-EN11 (EN) Environment
Biodiversity Location and size of land owned, leased, managed in, or adjacent to, protected areas and areas of high biodiversity value outside protected areas.
4 29.57 23.21 52.78 EN13 G4-EN13 (EN) Environment
Biodiversity Habitats protected or restored.
5 49.88 22.35 72.22 LA11 G4-LA10 (LA) Labor
Practices and Decent Work
Training and Education
Programs for skills management and lifelong learning that support the continued employability of employees and assist them in managing career endings.
6 42.37 21.52 63.89 PR3 G4-PR3 (PR) Product
Responsibility
Product and Service
Labeling
Type of product and service information required by procedures, and percentage of significant products and services subject to such information requirements.
7 37.32 21.02 58.33 EN21 G4-EN22 (EN) Environment
Emissions, Effluents and
Waste
Total water discharge by quality and destination.
8 43.70 20.19 63.89 EN1 G4-EN1 (EN) Environment
Materials Materials used by weight or volume.
9 33.31 19.48 52.78 EN14 Entire Indicator Moved to Guidance
(EN) Environment
Biodiversity Strategies, current actions, and future plans for managing impacts on biodiversity.
10 52.77 16.68 69.44 LA12 G4-LA11 (LA) Labor
Practices and Decent Work
Training and Education
Percentage of employees receiving regular performance and career development reviews, by gender.
Page 88

BOTTOM 10 INDICATORS | The Forest and Paper Products Sector | Get All 84: www.ga-institute.com/getall84
Sustainability – What Matters? | Governance & Accountability Institute, Inc. 0 — 50 — 100
Rank All Sector Score
Diff Difference
Sector Sector Score
G3.1 Indicator
G4 Indicator
Category Aspect Description
75 33.35 -11.12 22.22 HR1 G4-HR1 (HR) Human Rights
Investment and
Procurement Practices
Percentage and total number of significant investment agreements and contracts that include Human Rights (HR) clauses or that have undergone Human Rights (HR) screening.
76 36.40 -11.39 25.00 LA14 G4-LA13, G4-LA14, G4-LA15, G4-LA16
(LA) Labor
Practices and Decent Work
Equal Remuneration
for Women and Men
Ratio of basic salary and remuneration of women to men by employee category, by significant locations of operation.
77 45.14 -11.81 33.33 SO2 G4-SO3 (SO) Society
Corruption Percentage and total number of business units analyzed for risks related to corruption.
78 51.04 -12.15 38.89 LA10 G4-LA9 (LA) Labor
Practices and Decent Work
Training and Education
Average hours of training per year per employee by gender, and by employee category.
79 48.31 -12.20 36.11 SO4 G4-SO5 (SO) Society
Corruption Actions taken in response to incidents of corruption.
80 33.29 -13.84 19.44 PR7 G4-PR7 (PR) Product
Responsibility
Marketing Commun-
ications
Total number of incidents of non-compliance with regulations and voluntary codes concerning marketing communications, including advertising, promotion, and sponsorship by type of outcomes.
81 52.77 -13.87 38.89 EC8 G4-EC7 (Data points
moved to Guidance)
(EC) Economic
Indirect Economic Impacts
Development and impact of infrastructure investments and services provided primarily for public benefit through commercial, in-kind, or pro bono engagement.
82 44.74 -14.18 30.56 PR9 G4-PR9 (PR) Product
Responsibility
Compliance Monetary value of significant fines for non-compliance with laws and regulations concerning the provision and use of products and services.
83 35.42 -15.97 19.44 PR8 G4-PR8 (PR) Product
Responsibility
Customer Privacy
Total number of substantiated complaints regarding breaches of customer privacy and losses of customer data.
84 44.74 -16.96 27.78 EN17 G4-EN17, G4-EN18
(EN) Environment
Emissions, Effluents and
Waste
Other relevant indirect greenhouse gas emissions by weight.
Page 89
sustainability — what matters? The Healthcare Products Sector

The Healthcare Products Sector
Sustainability – What Matters? | Governance & Accountability Institute, Inc.
“FROM 2008 THROUGH 2012, WE REALIZED MORE THAN $24 MILLION IN COST SAVINGS BY IMPLEMENTING STRATEGIC SUSTAINABILITY
INITIATIVES. AND WE MADE THOSE CONSERVATION GAINS EVEN AS WE GREW OPERATIONS WORLDWIDE. AS PART OF OUR SUSTAINABILITY
INITIATIVES, OUR STAFF ELIMINATED WASTE AND CREATED EFFICIENCIES THROUGH OUR GREEN CHEMISTRY AND GREEN BIOLOGY
PROGRAMS.” — Robert A. Bradway, Chairman and Chief Executive Officer, Amgen Inc.
“We are truly dedicated to making a real difference to the lives of millions of people, wherever we operate. We have no need for a separate corporate social responsibility agenda – it is intrinsically linked to what we do.” — Stefano Pessina, Executive Chairman, Alliance Boots
“OUR AIM IS FOR EVERY PERSON WHO NEEDS OUR PRODUCTS TO BE
ABLE TO ACCESS AND BENEFIT FROM THEM. TO THIS END, WE ARE
WORKING ALL OVER THE WORLD WITH HEALTHCARE AUTHORITIES,
GOVERNMENTS AND OTHER STAKEHOLDERS TO BREAK DOWN THE
BARRIERS TO ACCESSING HEALTHCARE .”
— Severin Schwan, CEO, F. Hoffmann – La Roche, Ltd.
“EFFICIENCY IS NOT ONLY
IMPORTANT IN KEEPING HEALTHCARE
SUSTAINABLE , BUT ALSO IN ALLOWING
US TO CONTINUE TO GROW, CREATE
JOBS, AND MAKE AN IMPACT ON
PEOPLE’S LIVES. THAT’S WHAT
MOTIVATES US TO KEEP ON
INNOVATING OUR PROCESSES, OUR
TECHNOLOGIES AND OUR PRODUCTS."
— Pierre Guyot, CEO, Mölnlycke
Health Care
“We are committed to ensuring healthy returns on our investments, striking the right balance between better business, cleaner environment, and better lives – regardless of the economic climate.” — Steen Riisgaard, President & CEO, Novozymes
“We implemented novel facility-based energy
initiatives and continued to shift to less carbon- intensive models of product transport. We complete five new green building projects.” — Robert L. Parkinson, Jr., Chairman
and Chief Executive Officer, Baxter
“WE BELIEVE THAT THE ESSENCE OF CSR FOR
THE TAKEDA GROUP LIES IN DEVELOPING
OUTSTANDING PHARMACEUTICAL
PRODUCTS IN ACCORDANCE WITH THE
PRINCIPLES OF OUR CORPORATE
PHILOSOPHY OF 'TAKEDA-ISM = INTEGRITY
MEANING FAIRNESS, HONESTY AND
PERSEVERANCE. '”
— Yasuchika Hasegawa, President & CEO,
Takeda
“THROUGH INNOVATIVE RESEARCH, GROUNDBREAKING PARTNERSHIPS AND SMARTER PROCESSES, WE ARE PREPARED TO LEAD IN THE FUTURE OF HEALTHCARE. AS WE DO SO, WE WILL REMAIN COMPETITIVE AND COMMITTED TO THE IDEA THAT CORPORATE RESPONSIBILITY MAKES GOOD BUSINESS SENSE .” — William B. Harrison, Jr., Lead Director and Chair, Committee on Governance, Public Policy and Corporate Responsibility, Merck
“Our five citizenship pillars align our actions with the expectations of a wide range of global stakeholders and allow us to monitor critical issues related to access to care, product safety, ethics, human rights, labor practices, supply chain and the environment.” — Omar Ishrak, Chairman and Chief
Executive Officer, Medtronic
“OUR PURPOSE AS A COMPANY IS TO HELP PEOPLE ON THEIR PATH TO BETTER HEALTH. WHEN PEOPLE ARE HEALTHY, THEY ARE IN A BETTER
POSITION TO CONTRIBUTE POSITIVELY TO THEIR FAMILIES, LOCAL COMMUNITIES AND SOCIETY. IN SHORT, IT TAKES HEALTHY PEOPLE TO
CREATE AND SUSTAIN A HEALTHY AND VIBRANT WORLD. OUR RESPONSIBILITY IS TO HELP US ALL GET THERE .”
— Larry J. Merlo, President and Chief Executive Officer, CVS Caremark
Page 91

The Healthcare Products Sector
Sustainability – What Matters? | Governance & Accountability Institute, Inc.
D A T A S A M P L E
All 6 GRI Categories Ranked From Highest to Lowest Difference Score in the Healthcare Products Sector
1. Product Responsibility (PR) 2. Environment (EN) 3. Human Rights (HR) 4. Labor Practices and Decent
Work (LA) 5. Society (SO) 6. Economic (EC)
Top 10 GRI Aspects (out of 37) Ordered Highest to Lowest Difference Score in the Healthcare Products Sector
1. Customer Health and Safety 2. Products and Services 3. Water 4. Indirect Economic Impacts 5. Remediation 6. Transport 7. Marketing Communications 8. Emissions, Effluents and
Waste 9. Investment and
Procurement Practices 10. Assessment
Reports Info Our analysis is based on information collected from 27 GRI reports of which:
• 22% were declared GRI Application Level A or A+
• 22% were declared GRI Application Level B or B+
• 22% were declared GRI Application Level C or C+
• 9 reports' GRI Application Levels were left undeclared
• and 41% were assured by a third party (+)
Healthcare Products Sector Reporters Included in Analysis Abbott, Alliance Boots, Amgen Inc., APL, Apoteket, Baxter International, Bilim Pharmaceuticals Company, Colgate-Palmolive, CVS Caremark Corporation, ESTEVE, F. Hoffmann-La Roche Ltd, Fosun Pharmaceutical, Infinitus China, Jointown Pharmaceutical Group Company, Medtronic, Merck USA, Mölnlycke Health Care, Mustafa Nevzat, Novozymes, Orion Group, Pfizer Corporation Austria, Roche Pharmaceuticals Turkey, Sandoz Türkiye, Takeda, Unimed de Cascavel - Cooperativa de Trabalho Médico, Unimed Vitoria, Zhejiang Hisun Pharmaceutical Company
Page 92

TOP 10 INDICATORS | The Healthcare Products Sector | Get All 84: www.ga-institute.com/getall84
Sustainability – What Matters? | Governance & Accountability Institute, Inc. 0 — 50 — 100
Rank All Sector Score
Diff Difference
Sector Sector Score
G3.1 Indicator
G4 Indicator
Category Aspect Description
1 43.14 10.57 53.70 EN7 G4-EN6 (EN) Environment
Energy Initiatives to reduce indirect energy consumption and reductions achieved.
2 37.32 8.98 46.30 EN21 G4-EN22 (EN) Environment
Emissions, Effluents and
Waste
Total water discharge by quality and destination.
3 37.76 8.54 46.30 EC9 G4-EC8 (Data points
moved to Guidance)
(EC) Economic
Indirect Economic Impacts
Understanding and describing significant indirect economic impacts, including the extent of impacts.
4 31.02 7.87 38.89 EN10 G4-EN10 (EN) Environment
Water Percentage and total volume of water recycled and reused.
5 44.26 7.60 51.85 EN23 G4-EN24 (EN) Environment
Emissions, Effluents and
Waste
Total number and volume of significant spills.
6 15.49 6.74 22.22 LA15 G4-LA3 (LA) Labor
Practices and Decent
Work
Employment Return to work and retention rates after parental leave, by gender.
7 56.34 6.63 62.96 EN22 G4-EN23 (EN) Environment
Emissions, Effluents and
Waste
Total weight of waste by type and disposal method.
8 53.05 6.21 59.26 EN5 G4-EN6 (EN) Environment
Energy Energy saved due to conservation and efficiency improvements.
9 21.67 6.11 27.78 EN24 G4-EN25 (EN) Environment
Emissions, Effluents and
Waste
Weight of transported, imported, exported, or treated waste deemed hazardous under the terms of the Basel Convention Annex I, II, III, and VIII, and percentage of transported waste shipped internationally.
10 23.80 5.84 29.63 EN27 G4-EN28 (EN) Environment
Products and Services
Percentage of products sold and their packaging materials that are reclaimed by category.
Page 93
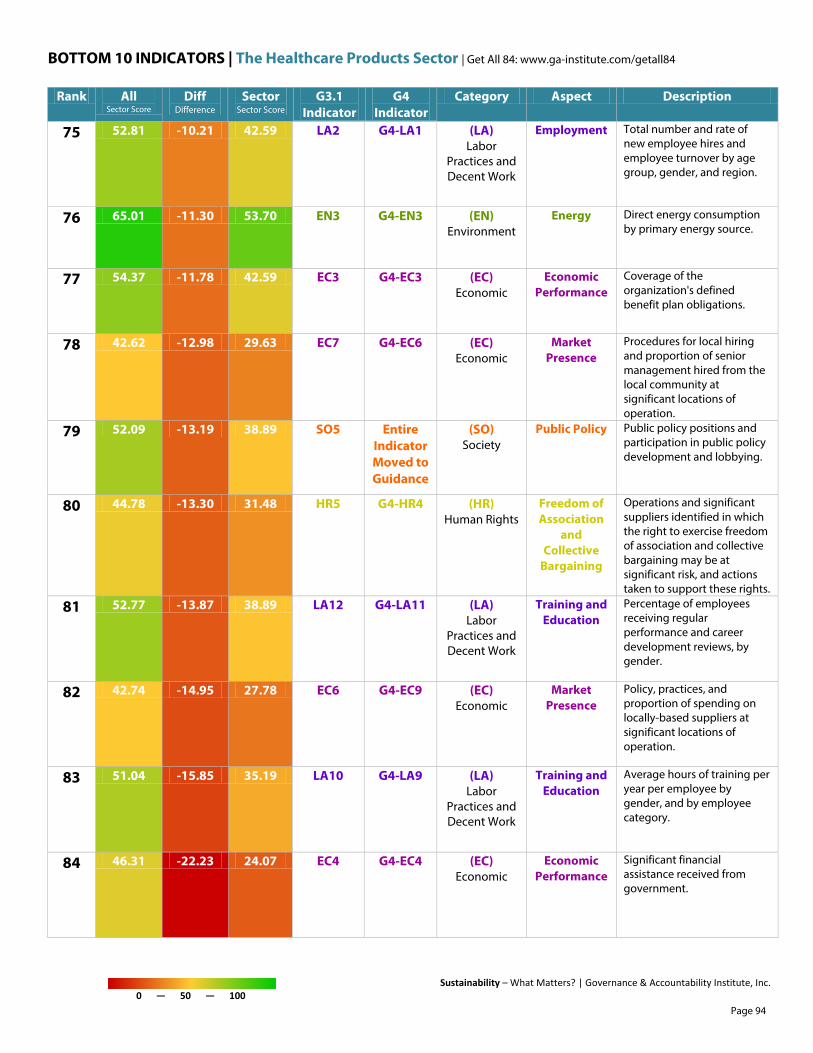
BOTTOM 10 INDICATORS | The Healthcare Products Sector | Get All 84: www.ga-institute.com/getall84
Sustainability – What Matters? | Governance & Accountability Institute, Inc. 0 — 50 — 100
Rank All Sector Score
Diff Difference
Sector Sector Score
G3.1 Indicator
G4 Indicator
Category Aspect Description
75 52.81 -10.21 42.59 LA2 G4-LA1 (LA) Labor
Practices and Decent Work
Employment Total number and rate of new employee hires and employee turnover by age group, gender, and region.
76 65.01 -11.30 53.70 EN3 G4-EN3 (EN) Environment
Energy Direct energy consumption by primary energy source.
77 54.37 -11.78 42.59 EC3 G4-EC3 (EC) Economic
Economic Performance
Coverage of the organization's defined benefit plan obligations.
78 42.62 -12.98 29.63 EC7 G4-EC6 (EC) Economic
Market Presence
Procedures for local hiring and proportion of senior management hired from the local community at significant locations of operation.
79 52.09 -13.19 38.89 SO5 Entire Indicator Moved to Guidance
(SO) Society
Public Policy Public policy positions and participation in public policy development and lobbying.
80 44.78 -13.30 31.48 HR5 G4-HR4 (HR) Human Rights
Freedom of Association
and Collective
Bargaining
Operations and significant suppliers identified in which the right to exercise freedom of association and collective bargaining may be at significant risk, and actions taken to support these rights.
81 52.77 -13.87 38.89 LA12 G4-LA11 (LA) Labor
Practices and Decent Work
Training and Education
Percentage of employees receiving regular performance and career development reviews, by gender.
82 42.74 -14.95 27.78 EC6 G4-EC9 (EC) Economic
Market Presence
Policy, practices, and proportion of spending on locally-based suppliers at significant locations of operation.
83 51.04 -15.85 35.19 LA10 G4-LA9 (LA) Labor
Practices and Decent Work
Training and Education
Average hours of training per year per employee by gender, and by employee category.
84 46.31 -22.23 24.07 EC4 G4-EC4 (EC) Economic
Economic Performance
Significant financial assistance received from government.
Page 94
sustainability — what matters? The Healthcare Services Sector

The Healthcare Services Sector
Sustainability – What Matters? | Governance & Accountability Institute, Inc.
“SUSTAINABLE DEVELOPMENT COVERS THE NEEDS OF THE PRESENT WITHOUT JEOPARDIZING THE ABILITY OF FUTURE GENERATIONS
TO DO THE SAME. SUSTAINABILITY INCLUDES IDEAS, PHILOSOPHY AND VALUES THAT CONTINUE TO INSPIRE PUBLIC AND PRIVATE
ORGANIZATIONS TO BECOME BETTER MANAGERS OF THE ENVIRONMENT AND PROMOTE POSITIVE ECONOMIC GROWTH AND SOCIAL GOALS.”
— Nikos Koutsianas,Chief Executive Officer, Apivita
“I believe there is nothing more important than the work we all are doing to redefine human health to include a healthy environment, a healthy planet ….” — Lloyd H. Dean, CEO, Dignity Health System
“THE UNITED NATIONS GLOBAL COMPACT ENHANCES CLEVELAND
CLINIC’S CULTURE OF CARING. IT ENUNCIATES WORTHWHILE GOALS,
PROMOTES THE EXCHANGE OF BEST PRACTICES AMONG ENTERPRISES,
AND REINFORCES GOOD CITIZENSHIP IN THE COMMUNITY AND
RESPONSIBLE STEWARDSHIP OF THE ENVIRONMENT.”
— Delos M. Cosgrove, MD, CEO and President, Cleveland Clinic
“EVERY GENERATION DISPOSES OF AN
ECONOMIC, SOCIAL AND
ENVIRONMENTAL LEGACY TO BUILD
ITS MARK OF CREATIVITY,
COMPREHENSION AND WORK
EVERY GENERATION HAS AN
INHERITANCE AND ITS EXPERIENCE
ON THIS PLANET SHOULD MAKE THE
PLANET BETTER, OR AT LEAST NOT
MAKE IT WORSE.” — João Bosco de
Almeida Duarte, President, Unimed
Cuiabá
“We know the real bottom line in the sustainability debate is not cost versus benefit; it is harm versus health …” — Lloyd H. Dean, CEO, Dignity Health System
“Innovative ideas and nature are the true inspiration for the development of new products. True beauty stems from within and can only be achieved by tuning into nature.” — Nikos Koutsianas,CEO, Apivita
“… IS CONTINUOUSLY LOOKING FOR
SOLUTIONS TO KEEP THE ENVIRONMENT
EFFECTS OF PHARMACEUTICAL
DISTRIBUTION AND TRANSPORTATION
TO A MINIMUM . THIS ALSO INCLUDES THE
ENVIRONMENT-FRIENDLY DISPOSAL OF
EXPIRED DRUGS.”
— We Deliver Health, Sustainability Report,
Phoenix Group, Tamro Group
“I BELIEVE THAT THE MAIN CHALLENGE WE FACE REMAINS IN BUILDING A CULTURE OF SUSTAINABILITY AND TRANSPARENCY IN THE COMMUNITY WE LIVE IN. WE UNDERSTAND THE MULTICULTURAL NATURE OF OUR COMMUNITY, AS WELL ITS LIMITATIONS.” — Dr. Mazen Fakeeh, Director General, Dr. Soliman Fakeeh Hospital
“We have also been supporting the growth of green society by establishing an environment- friendly system process, green financing and environmental volunteer programs.” — Chang-Soo Kim, President & CEO, Samsung Life Insurance
“THE MAIN THRUST OF THESE EFFORTS INCLUDES MAINTAINING THE HIGHEST STANDARDS OF BUSINESS CONDUCT; REDUCING
ENVIRONMENTAL IMPACT; PROVIDING A SAFE WORKPLACE FOR EMPLOYEES ; AND DELIVERING ON OUR COMMITMENTS TO PATIENTS,
PHYSICIANS, INVESTORS, EMPLOYEES AND OTHER STAKEHOLDERS.” — Trevor Fetter, President and Chief Executive Officer,
Tenet Healthcare Corporation
Page 96
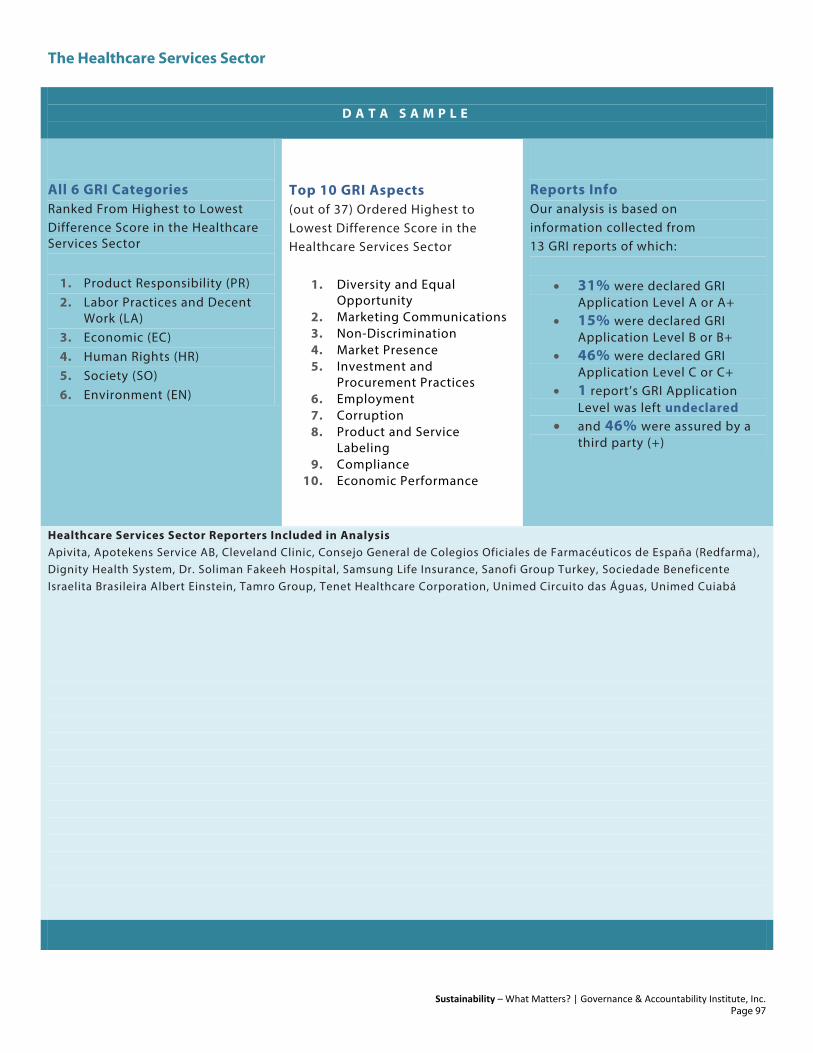
The Healthcare Services Sector
Sustainability – What Matters? | Governance & Accountability Institute, Inc.
D A T A S A M P L E
All 6 GRI Categories Ranked From Highest to Lowest Difference Score in the Healthcare Services Sector
1. Product Responsibility (PR) 2. Labor Practices and Decent
Work (LA) 3. Economic (EC) 4. Human Rights (HR) 5. Society (SO) 6. Environment (EN)
Top 10 GRI Aspects (out of 37) Ordered Highest to Lowest Difference Score in the Healthcare Services Sector
1. Diversity and Equal Opportunity
2. Marketing Communications 3. Non-Discrimination 4. Market Presence 5. Investment and
Procurement Practices 6. Employment 7. Corruption 8. Product and Service
Labeling 9. Compliance
10. Economic Performance
Reports Info Our analysis is based on information collected from 13 GRI reports of which:
• 31% were declared GRI Application Level A or A+
• 15% were declared GRI Application Level B or B+
• 46% were declared GRI Application Level C or C+
• 1 report’s GRI Application Level was left undeclared
• and 46% were assured by a third party (+)
Healthcare Services Sector Reporters Included in Analysis Apivita, Apotekens Service AB, Cleveland Clinic, Consejo General de Colegios Oficiales de Farmacéuticos de España (Redfarma), Dignity Health System, Dr. Soliman Fakeeh Hospital, Samsung Life Insurance, Sanofi Group Turkey, Sociedade Beneficente Israelita Brasileira Albert Einstein, Tamro Group, Tenet Healthcare Corporation, Unimed Circuito das Águas, Unimed Cuiabá
Page 97
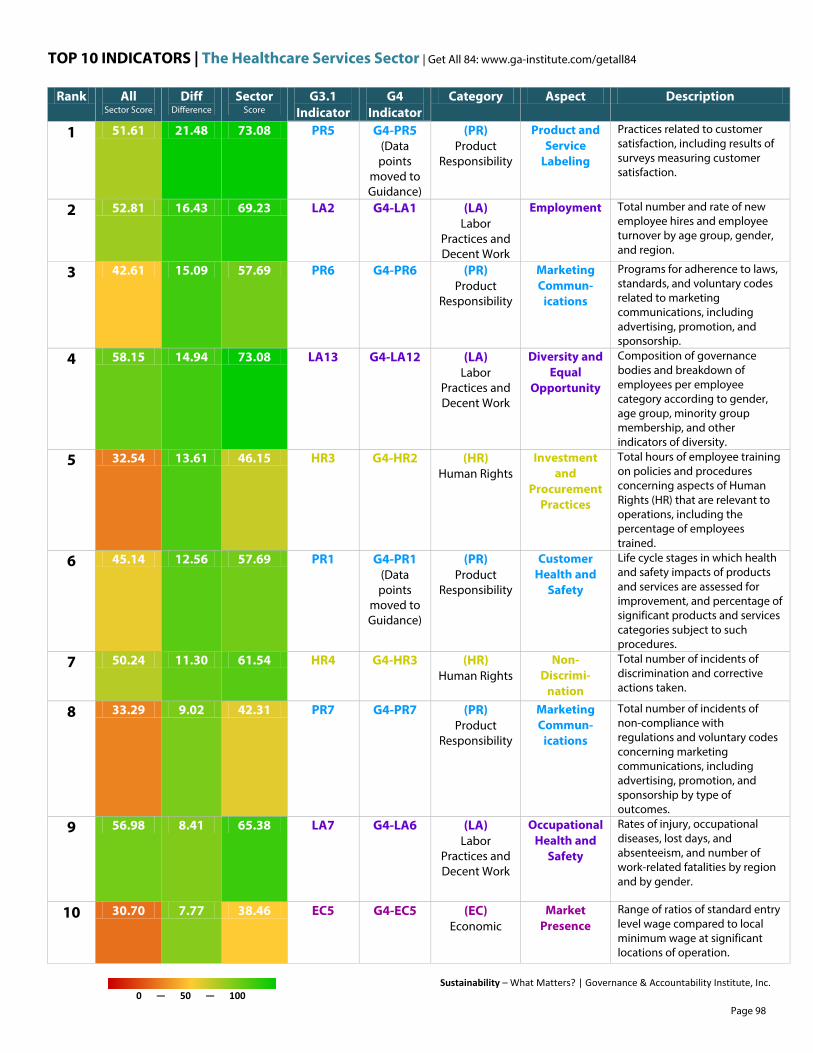
TOP 10 INDICATORS | The Healthcare Services Sector | Get All 84: www.ga-institute.com/getall84
Sustainability – What Matters? | Governance & Accountability Institute, Inc. 0 — 50 — 100
Rank All Sector Score
Diff Difference
Sector Score
G3.1 Indicator
G4 Indicator
Category Aspect Description
1 51.61 21.48 73.08 PR5 G4-PR5 (Data points
moved to Guidance)
(PR) Product
Responsibility
Product and Service
Labeling
Practices related to customer satisfaction, including results of surveys measuring customer satisfaction.
2 52.81 16.43 69.23 LA2 G4-LA1 (LA) Labor
Practices and Decent Work
Employment Total number and rate of new employee hires and employee turnover by age group, gender, and region.
3 42.61 15.09 57.69 PR6 G4-PR6 (PR) Product
Responsibility
Marketing Commun-
ications
Programs for adherence to laws, standards, and voluntary codes related to marketing communications, including advertising, promotion, and sponsorship.
4 58.15 14.94 73.08 LA13 G4-LA12 (LA) Labor
Practices and Decent Work
Diversity and Equal
Opportunity
Composition of governance bodies and breakdown of employees per employee category according to gender, age group, minority group membership, and other indicators of diversity.
5 32.54 13.61 46.15 HR3 G4-HR2 (HR) Human Rights
Investment and
Procurement Practices
Total hours of employee training on policies and procedures concerning aspects of Human Rights (HR) that are relevant to operations, including the percentage of employees trained.
6 45.14 12.56 57.69 PR1 G4-PR1 (Data points
moved to Guidance)
(PR) Product
Responsibility
Customer Health and
Safety
Life cycle stages in which health and safety impacts of products and services are assessed for improvement, and percentage of significant products and services categories subject to such procedures.
7 50.24 11.30 61.54 HR4 G4-HR3 (HR) Human Rights
Non-Discrimi-
nation
Total number of incidents of discrimination and corrective actions taken.
8 33.29 9.02 42.31 PR7 G4-PR7 (PR) Product
Responsibility
Marketing Commun-
ications
Total number of incidents of non-compliance with regulations and voluntary codes concerning marketing communications, including advertising, promotion, and sponsorship by type of outcomes.
9 56.98 8.41 65.38 LA7 G4-LA6 (LA) Labor
Practices and Decent Work
Occupational Health and
Safety
Rates of injury, occupational diseases, lost days, and absenteeism, and number of work-related fatalities by region and by gender.
10 30.70 7.77 38.46 EC5 G4-EC5 (EC) Economic
Market Presence
Range of ratios of standard entry level wage compared to local minimum wage at significant locations of operation.
Page 98
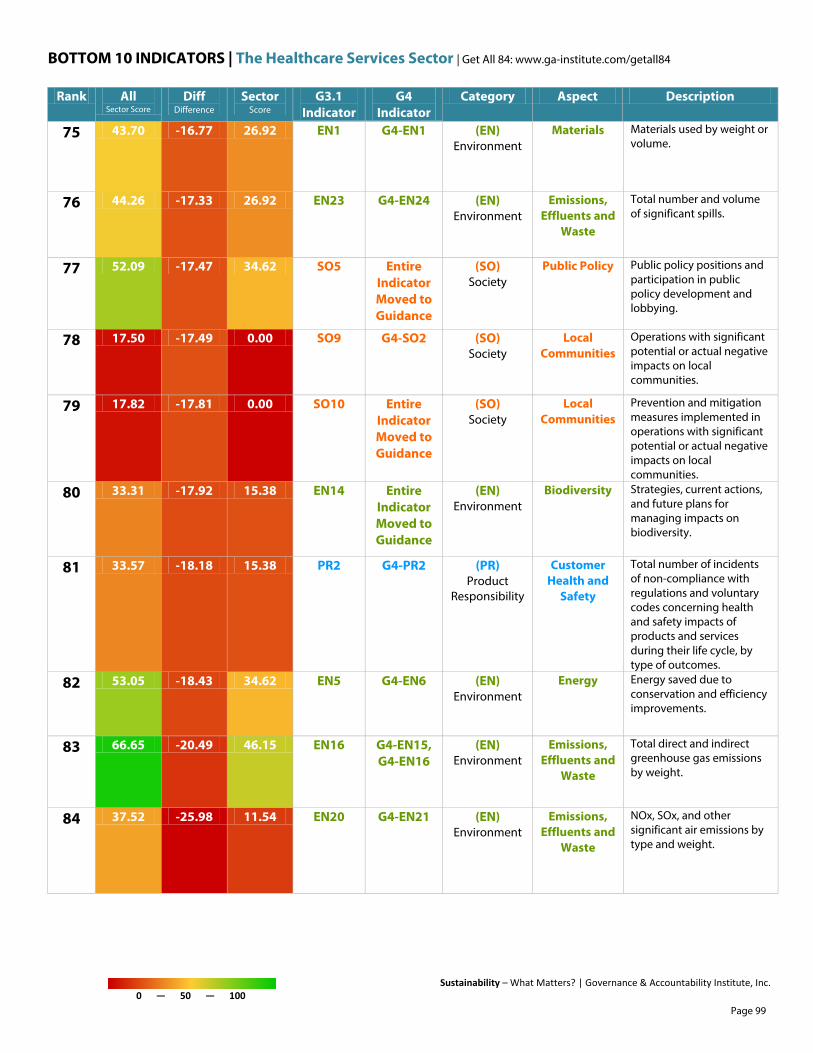
BOTTOM 10 INDICATORS | The Healthcare Services Sector | Get All 84: www.ga-institute.com/getall84
Sustainability – What Matters? | Governance & Accountability Institute, Inc. 0 — 50 — 100
Rank All Sector Score
Diff Difference
Sector Score
G3.1 Indicator
G4 Indicator
Category Aspect Description
75 43.70 -16.77 26.92 EN1 G4-EN1 (EN) Environment
Materials Materials used by weight or volume.
76 44.26 -17.33 26.92 EN23 G4-EN24 (EN) Environment
Emissions, Effluents and
Waste
Total number and volume of significant spills.
77 52.09 -17.47 34.62 SO5 Entire Indicator Moved to Guidance
(SO) Society
Public Policy Public policy positions and participation in public policy development and lobbying.
78 17.50 -17.49 0.00 SO9 G4-SO2 (SO) Society
Local Communities
Operations with significant potential or actual negative impacts on local communities.
79 17.82 -17.81 0.00 SO10 Entire Indicator Moved to Guidance
(SO) Society
Local Communities
Prevention and mitigation measures implemented in operations with significant potential or actual negative impacts on local communities.
80 33.31 -17.92 15.38 EN14 Entire Indicator Moved to Guidance
(EN) Environment
Biodiversity Strategies, current actions, and future plans for managing impacts on biodiversity.
81 33.57 -18.18 15.38 PR2 G4-PR2 (PR) Product
Responsibility
Customer Health and
Safety
Total number of incidents of non-compliance with regulations and voluntary codes concerning health and safety impacts of products and services during their life cycle, by type of outcomes.
82 53.05 -18.43 34.62 EN5 G4-EN6 (EN) Environment
Energy Energy saved due to conservation and efficiency improvements.
83 66.65 -20.49 46.15 EN16 G4-EN15, G4-EN16
(EN) Environment
Emissions, Effluents and
Waste
Total direct and indirect greenhouse gas emissions by weight.
84 37.52 -25.98 11.54 EN20 G4-EN21 (EN) Environment
Emissions, Effluents and
Waste
NOx, SOx, and other significant air emissions by type and weight.
Page 99

sustainability — what matters? The Household and Personal Products Sector

The Household and Personal Products Sector
Sustainability – What Matters? | Governance & Accountability Institute, Inc.
“WATER IS ONE OF THE KEY AREAS FOR RB. IT’S AN INCREASINGLY CRITICAL ISSUE FOR HEALTH AND HYGIENE, ESPECIALLY IN EMERGING
MARKETS AND WHEN CONSUMERS USE OUR PRODUCTS. WE WILL CUT OUR WATER IMPACT BY A THIRD BY 2020 ACROSS THE PRODUCTS’
WHOLE LIFECYCLE, NOT JUST IN OUR FACTORIES.” — Rakesh Kapoor, CEO, Reckitt Benckiser
“We initiated water-replenishment projects in India, Israel, Colombia and Spain, with a total anticipated return to communities of 205 million.” — Tom Falk, Chairman & CEO, Kimberly-Clark
“OUR AMBITION IS TO ACHIEVE MORE WITH LESS . WE SEE THIS
LONG-TERM STRATEGY AS A CORE SUCCESS FACTOR AND AS A
COMPETITIVE ADVANTAGE. IT STRENGTHENS OUR RELATIONSHIPS
WITH CUSTOMERS, DRIVES INNOVATION, AND INSPIRES OUR
EMPLOYEES.” — Kasper Rorsted, Chairman of the Management Board,
Henkel
“EXAMPLES OF OUR RESPONSIBLE
SOURCING INITIATIVES INCLUDE
MAKING SIGNIFICANT PROGRESS
TOWARDS SUSTAINABLE SOURCING OF
PALM OIL BY JOINING THE ROUND
TABLE ON SUSTAINABLE PALM OIL
(RSPO)."
— Joe Fabbri, Chair Of The Givaudan
Sustainability Programme, Givaudan
“For us, sustainability must include a focus on people. It helps them thrive both at work and out in the community. It enhances health and well-being.” — Laura Alber, President and CEO, Reckitt Benckiser
“We have moved the idea
of Sustainability being ‘a project’ to something
that is being embedded within our organization.” — Gilles Andrier, Chief Executive
Officer, Givaudan
“WE ARE COMMITTED TO LEADERSHIP
IN SUSTAINABILITY ON THE BASIS OF A
WELL-DEFINED LONG-TERM STRATEGY
AND A CLEAR OBJECTIVE: ACHIEVING
MORE WITH LESS.”
— Kathrin Menges, Executive Vice President
Human Resources and Chair of Henkel’s
Sustainability Council, Henkel
“WE’RE WORKING ON A NEW SOCIAL RESPONSIBILITY STRATEGY THAT WILL HELP US TO CONTINUE TO SUPPORT COMMUNITIES IN WHICH WE DO BUSINESS, WHILE USING OUR BRANDS TO IMPROVE LIVES AND COMMUNITIES AROUND THE GLOBE.” — Tom Falk, Chairman & CEO, Kimberly-Clark
“How people around the world achieve good health, in a sustainable manner, is likely to be the most significant challenge for our generation.” — Alex Gorsky, Chief Executive Officer, Johnson & Johnson
“WE BELIEVE SUSTAINABILITY MUST BE IN THE ATTITUDES OF EACH PERSON WHO INTERACTS WITH OUR ORGANIZATION.
AND IT IS COMMITMENT OF THE GROUP AND ITS BUSINESS UNITS TO EXEMPLIFY THIS TRANSFORMATION PROGRESSIVE.”
— Miguel Krigsner, Presidente do Conselho de Administração, Grupo Boticário
Page 101

The Household and Personal Products Sector
Sustainability – What Matters? | Governance & Accountability Institute, Inc.
D A T A S A M P L E
All 6 GRI Categories Ranked From Highest to Lowest Difference Score in the Household and Personal Products Sector
1. Environment (EN) 2. Product Responsibility (PR) 3. Human Rights (HR) 4. Economic (EC) 5. Society (SO) 6. Labor Practices and Decent
Work (LA)
Top 10 GRI Aspects (out of 37) Ordered Highest to Lowest Difference Score in the Household and Personal Products Sector
1. Public Policy 2. Customer Health and Safety 3. Investment and
Procurement Practices 4. Child Labor 5. Security Practices 6. Transport 7. Energy 8. Overall (Environmental) 9. Emissions, Effluents and
Waste 10. Occupational Health and
Safety
Reports Info Our analysis is based on information collected from 9 GRI reports of which:
• 33% were declared GRI Application Level A or A+
• 33% were declared GRI Application Level B or B+
• 11% were declared GRI Application Level C or C+
• 2 reports' GRI Application Levels were left undeclared
• and 33% were assured by a third party (+)
Household and Personal Products Sector Reporters Included in Analysis Geberit, Givaudan, Grupo Boticário, Henkel, Johnson & Johnson, Kimberly-Clark, Reckitt Benckiser, Scotts Miracle-Gro Company, Williams-Sonoma, Inc.
Page 102
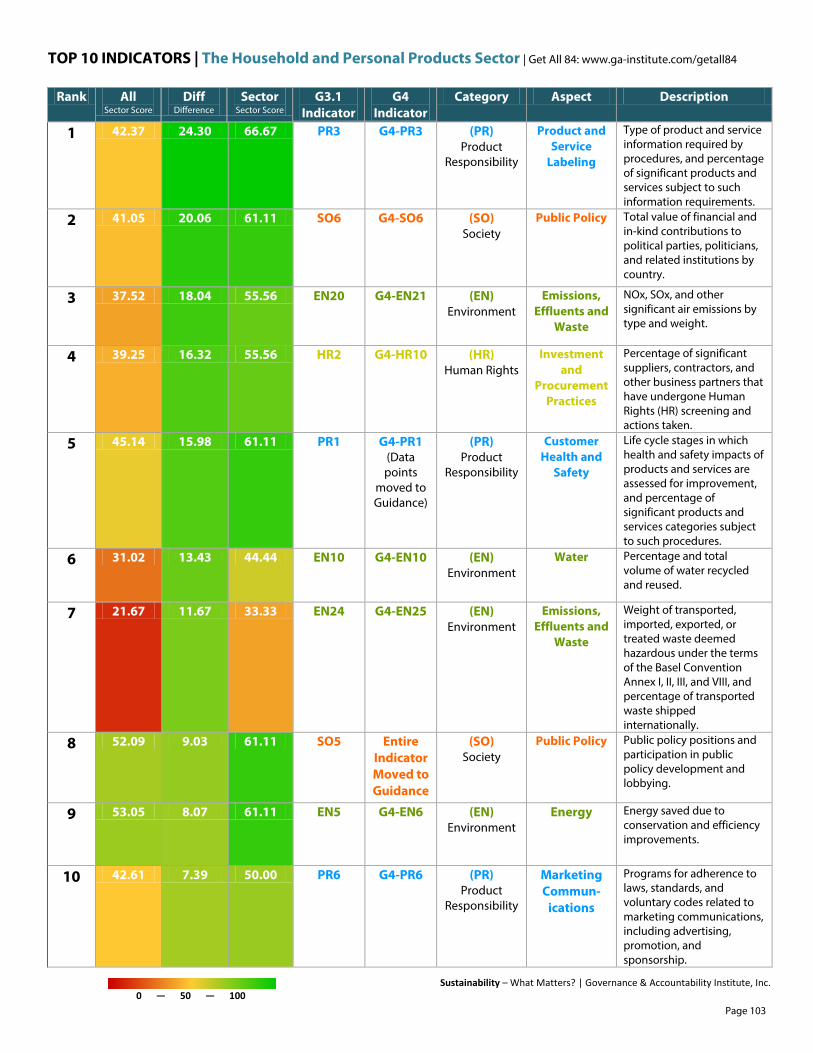
TOP 10 INDICATORS | The Household and Personal Products Sector | Get All 84: www.ga-institute.com/getall84
Sustainability – What Matters? | Governance & Accountability Institute, Inc. 0 — 50 — 100
Rank All Sector Score
Diff Difference
Sector Sector Score
G3.1 Indicator
G4 Indicator
Category Aspect Description
1 42.37 24.30 66.67 PR3 G4-PR3 (PR) Product
Responsibility
Product and Service
Labeling
Type of product and service information required by procedures, and percentage of significant products and services subject to such information requirements.
2 41.05 20.06 61.11 SO6 G4-SO6 (SO) Society
Public Policy Total value of financial and in-kind contributions to political parties, politicians, and related institutions by country.
3 37.52 18.04 55.56 EN20 G4-EN21 (EN) Environment
Emissions, Effluents and
Waste
NOx, SOx, and other significant air emissions by type and weight.
4 39.25 16.32 55.56 HR2 G4-HR10 (HR) Human Rights
Investment and
Procurement Practices
Percentage of significant suppliers, contractors, and other business partners that have undergone Human Rights (HR) screening and actions taken.
5 45.14 15.98 61.11 PR1 G4-PR1 (Data points
moved to Guidance)
(PR) Product
Responsibility
Customer Health and
Safety
Life cycle stages in which health and safety impacts of products and services are assessed for improvement, and percentage of significant products and services categories subject to such procedures.
6 31.02 13.43 44.44 EN10 G4-EN10 (EN) Environment
Water Percentage and total volume of water recycled and reused.
7 21.67 11.67 33.33 EN24 G4-EN25 (EN) Environment
Emissions, Effluents and
Waste
Weight of transported, imported, exported, or treated waste deemed hazardous under the terms of the Basel Convention Annex I, II, III, and VIII, and percentage of transported waste shipped internationally.
8 52.09 9.03 61.11 SO5 Entire Indicator Moved to Guidance
(SO) Society
Public Policy Public policy positions and participation in public policy development and lobbying.
9 53.05 8.07 61.11 EN5 G4-EN6 (EN) Environment
Energy Energy saved due to conservation and efficiency improvements.
10 42.61 7.39 50.00 PR6 G4-PR6 (PR) Product
Responsibility
Marketing Commun-
ications
Programs for adherence to laws, standards, and voluntary codes related to marketing communications, including advertising, promotion, and sponsorship.
Page 103
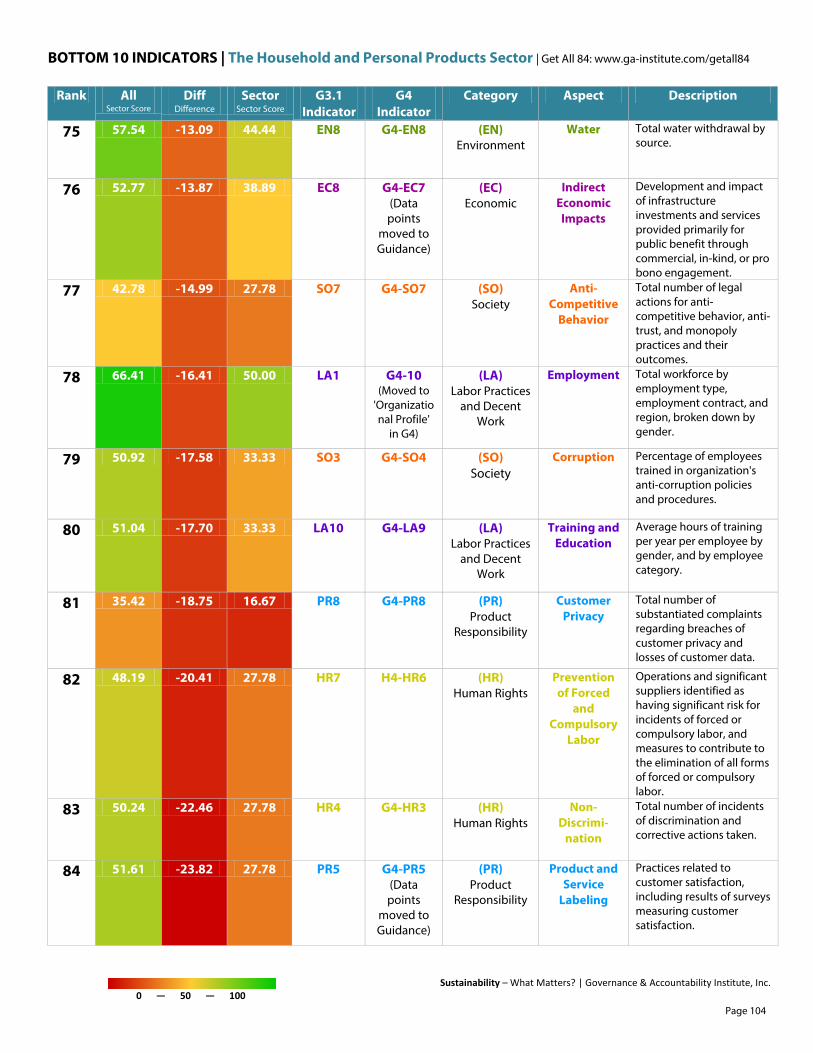
BOTTOM 10 INDICATORS | The Household and Personal Products Sector | Get All 84: www.ga-institute.com/getall84
Sustainability – What Matters? | Governance & Accountability Institute, Inc. 0 — 50 — 100
Rank All Sector Score
Diff Difference
Sector Sector Score
G3.1 Indicator
G4 Indicator
Category Aspect Description
75 57.54 -13.09 44.44 EN8 G4-EN8 (EN) Environment
Water Total water withdrawal by source.
76 52.77 -13.87 38.89 EC8 G4-EC7 (Data points
moved to Guidance)
(EC) Economic
Indirect Economic Impacts
Development and impact of infrastructure investments and services provided primarily for public benefit through commercial, in-kind, or pro bono engagement.
77 42.78 -14.99 27.78 SO7 G4-SO7 (SO) Society
Anti-Competitive
Behavior
Total number of legal actions for anti-competitive behavior, anti-trust, and monopoly practices and their outcomes.
78 66.41 -16.41 50.00 LA1 G4-10 (Moved to
'Organizational Profile'
in G4)
(LA) Labor Practices
and Decent Work
Employment Total workforce by employment type, employment contract, and region, broken down by gender.
79 50.92 -17.58 33.33 SO3 G4-SO4 (SO) Society
Corruption Percentage of employees trained in organization's anti-corruption policies and procedures.
80 51.04 -17.70 33.33 LA10 G4-LA9 (LA) Labor Practices
and Decent Work
Training and Education
Average hours of training per year per employee by gender, and by employee category.
81 35.42 -18.75 16.67 PR8 G4-PR8 (PR) Product
Responsibility
Customer Privacy
Total number of substantiated complaints regarding breaches of customer privacy and losses of customer data.
82 48.19 -20.41 27.78 HR7 H4-HR6 (HR) Human Rights
Prevention of Forced
and Compulsory
Labor
Operations and significant suppliers identified as having significant risk for incidents of forced or compulsory labor, and measures to contribute to the elimination of all forms of forced or compulsory labor.
83 50.24 -22.46 27.78 HR4 G4-HR3 (HR) Human Rights
Non-Discrimi-
nation
Total number of incidents of discrimination and corrective actions taken.
84 51.61 -23.82 27.78 PR5 G4-PR5 (Data points
moved to Guidance)
(PR) Product
Responsibility
Product and Service
Labeling
Practices related to customer satisfaction, including results of surveys measuring customer satisfaction.
Page 104

sustainability — what matters? The Logistics Sector
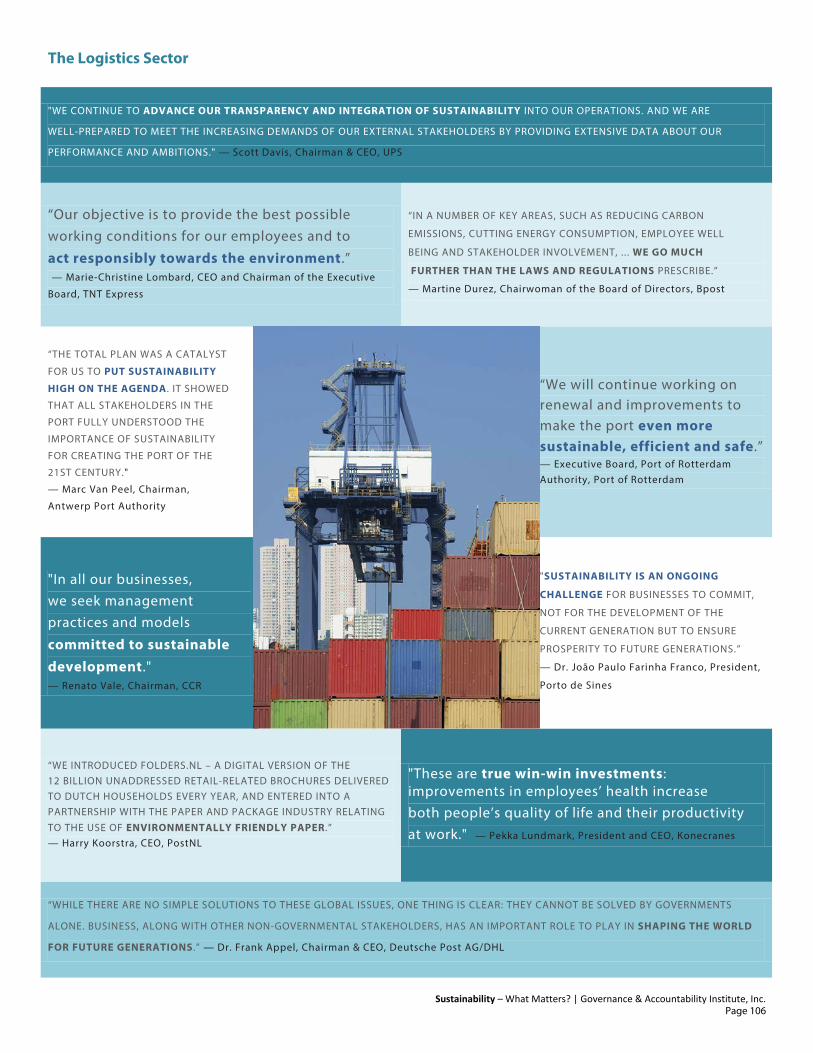
The Logistics Sector
Sustainability – What Matters? | Governance & Accountability Institute, Inc.
"WE CONTINUE TO ADVANCE OUR TRANSPARENCY AND INTEGRATION OF SUSTAINABILITY INTO OUR OPERATIONS. AND WE ARE
WELL-PREPARED TO MEET THE INCREASING DEMANDS OF OUR EXTERNAL STAKEHOLDERS BY PROVIDING EXTENSIVE DATA ABOUT OUR
PERFORMANCE AND AMBITIONS." — Scott Davis, Chairman & CEO, UPS
“Our objective is to provide the best possible working conditions for our employees and to
act responsibly towards the environment.” — Marie-Christine Lombard, CEO and Chairman of the Executive
Board, TNT Express
“IN A NUMBER OF KEY AREAS, SUCH AS REDUCING CARBON
EMISSIONS, CUTTING ENERGY CONSUMPTION, EMPLOYEE WELL
BEING AND STAKEHOLDER INVOLVEMENT, ... WE GO MUCH
FURTHER THAN THE LAWS AND REGULATIONS PRESCRIBE.”
— Martine Durez, Chairwoman of the Board of Directors, Bpost
“THE TOTAL PLAN WAS A CATALYST
FOR US TO PUT SUSTAINABILITY
HIGH ON THE AGENDA. IT SHOWED
THAT ALL STAKEHOLDERS IN THE
PORT FULLY UNDERSTOOD THE
IMPORTANCE OF SUSTAINABILITY
FOR CREATING THE PORT OF THE
21ST CENTURY."
— Marc Van Peel, Chairman,
Antwerp Port Authority
“We will continue working on renewal and improvements to make the port even more sustainable, efficient and safe.” — Executive Board, Port of Rotterdam Authority, Port of Rotterdam
"In all our businesses, we seek management practices and models
committed to sustainable development." — Renato Vale, Chairman, CCR
"SUSTAINABILITY IS AN ONGOING
CHALLENGE FOR BUSINESSES TO COMMIT,
NOT FOR THE DEVELOPMENT OF THE
CURRENT GENERATION BUT TO ENSURE
PROSPERITY TO FUTURE GENERATIONS.”
— Dr. João Paulo Farinha Franco, President,
Porto de Sines
“WE INTRODUCED FOLDERS.NL – A DIGITAL VERSION OF THE 12 BILLION UNADDRESSED RETAIL-RELATED BROCHURES DELIVERED TO DUTCH HOUSEHOLDS EVERY YEAR, AND ENTERED INTO A PARTNERSHIP WITH THE PAPER AND PACKAGE INDUSTRY RELATING TO THE USE OF ENVIRONMENTALLY FRIENDLY PAPER.” — Harry Koorstra, CEO, PostNL
"These are true win-win investments: improvements in employees’ health increase both people’s quality of life and their productivity at work." — Pekka Lundmark, President and CEO, Konecranes
“WHILE THERE ARE NO SIMPLE SOLUTIONS TO THESE GLOBAL ISSUES, ONE THING IS CLEAR: THEY CANNOT BE SOLVED BY GOVERNMENTS
ALONE. BUSINESS, ALONG WITH OTHER NON-GOVERNMENTAL STAKEHOLDERS, HAS AN IMPORTANT ROLE TO PLAY IN SHAPING THE WORLD
FOR FUTURE GENERATIONS.” — Dr. Frank Appel, Chairman & CEO, Deutsche Post AG/DHL
Page 106

The Logistics Sector
Sustainability – What Matters? | Governance & Accountability Institute, Inc.
D A T A S A M P L E
All 6 GRI Categories Ranked From Highest to Lowest Difference Score in the Logistics Sector
1. Labor Practices and Decent Work (LA)
2. Environment (EN) 3. Society (SO) 4. Human Rights (HR) 5. Economic (EC) 6. Product Responsibility (PR)
Top 10 GRI Aspects (out of 37) Ordered Highest to Lowest Difference Score in the Logistics Sector
1. Labor/Management Relations
2. Economic Performance 3. Energy 4. Compliance 5. Prevention of Forced and
Compulsory Labor 6. Employment 7. Emissions, Effluents and
Waste 8. Diversity and Equal
Opportunity 9. Materials
10. Products and Services
Reports Info Our analysis is based on information collected from 23 GRI reports of which:
• 31% were declared GRI Application Level A or A+
• 43% were declared GRI Application Level B or B+
• 26% were declared GRI Application Level C or C+
• 0 reports' GRI Application Levels were left undeclared
• and 48% were assured by a third party (+)
Logistics Sector Reporters Included in Analysis AIRFARM, Antwerp Port Authority, Autostrade per l'Italia, Bpost, CCR, Deutsche Post AG/ DHL, Egged Israel Transport Cooperative Society, ERGRANSA, Gebrüder Weiss, Green Cargo, Itella, Keppel T&T, Konecranes, Milano Serravalle - Milano Tangenziali, NORDEN, Port of Rotterdam, Porto de Sines, PostNL, Swiss Post, Terminal de Contenidors de Barcelona, S.L. (T.C.B.), TNT Express, UPS, Weyerhaeuser
Page 107
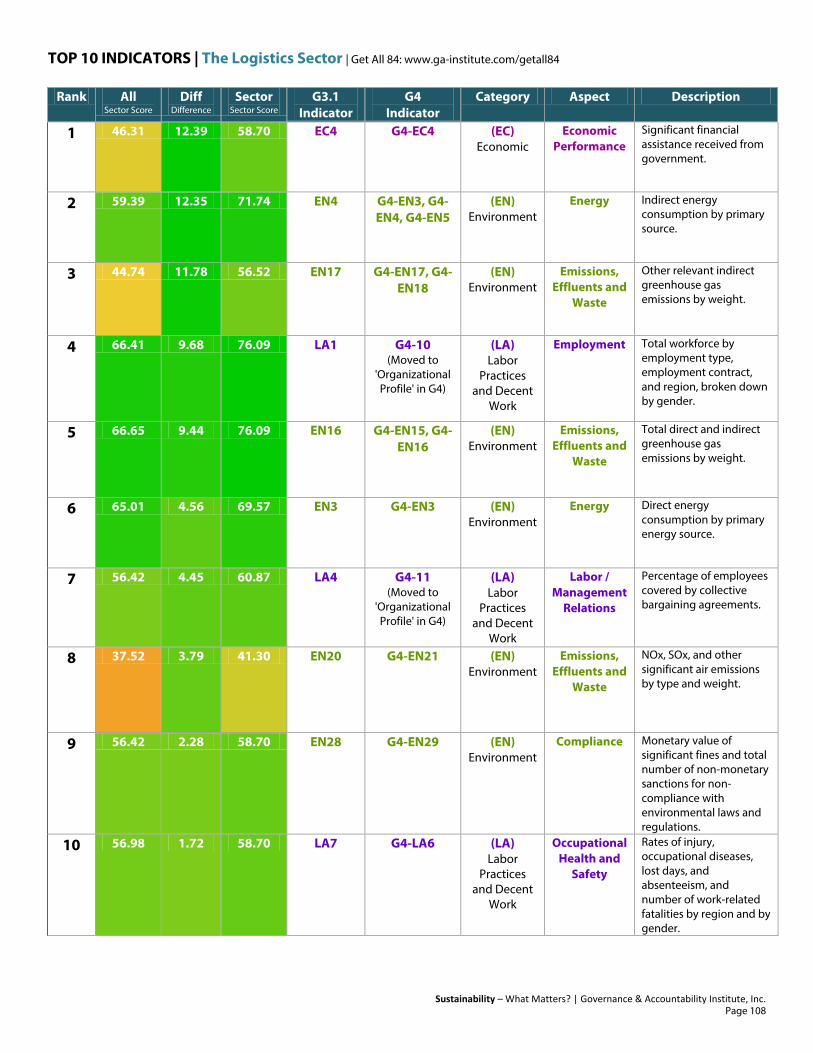
TOP 10 INDICATORS | The Logistics Sector | Get All 84: www.ga-institute.com/getall84
Sustainability – What Matters? | Governance & Accountability Institute, Inc.
Rank All Sector Score
Diff Difference
Sector Sector Score
G3.1 Indicator
G4 Indicator
Category Aspect Description
1 46.31 12.39 58.70 EC4 G4-EC4 (EC) Economic
Economic Performance
Significant financial assistance received from government.
2 59.39 12.35 71.74 EN4 G4-EN3, G4-EN4, G4-EN5
(EN) Environment
Energy Indirect energy consumption by primary source.
3 44.74 11.78 56.52 EN17 G4-EN17, G4-EN18
(EN) Environment
Emissions, Effluents and
Waste
Other relevant indirect greenhouse gas emissions by weight.
4 66.41 9.68 76.09 LA1 G4-10 (Moved to
'Organizational Profile' in G4)
(LA) Labor
Practices and Decent
Work
Employment Total workforce by employment type, employment contract, and region, broken down by gender.
5 66.65 9.44 76.09 EN16 G4-EN15, G4-EN16
(EN) Environment
Emissions, Effluents and
Waste
Total direct and indirect greenhouse gas emissions by weight.
6 65.01 4.56 69.57 EN3 G4-EN3 (EN) Environment
Energy Direct energy consumption by primary energy source.
7 56.42 4.45 60.87 LA4 G4-11 (Moved to
'Organizational Profile' in G4)
(LA) Labor
Practices and Decent
Work
Labor / Management
Relations
Percentage of employees covered by collective bargaining agreements.
8 37.52 3.79 41.30 EN20 G4-EN21 (EN) Environment
Emissions, Effluents and
Waste
NOx, SOx, and other significant air emissions by type and weight.
9 56.42 2.28 58.70 EN28 G4-EN29 (EN) Environment
Compliance Monetary value of significant fines and total number of non-monetary sanctions for non-compliance with environmental laws and regulations.
10 56.98 1.72 58.70 LA7 G4-LA6 (LA) Labor
Practices and Decent
Work
Occupational Health and
Safety
Rates of injury, occupational diseases, lost days, and absenteeism, and number of work-related fatalities by region and by gender.
Page 108
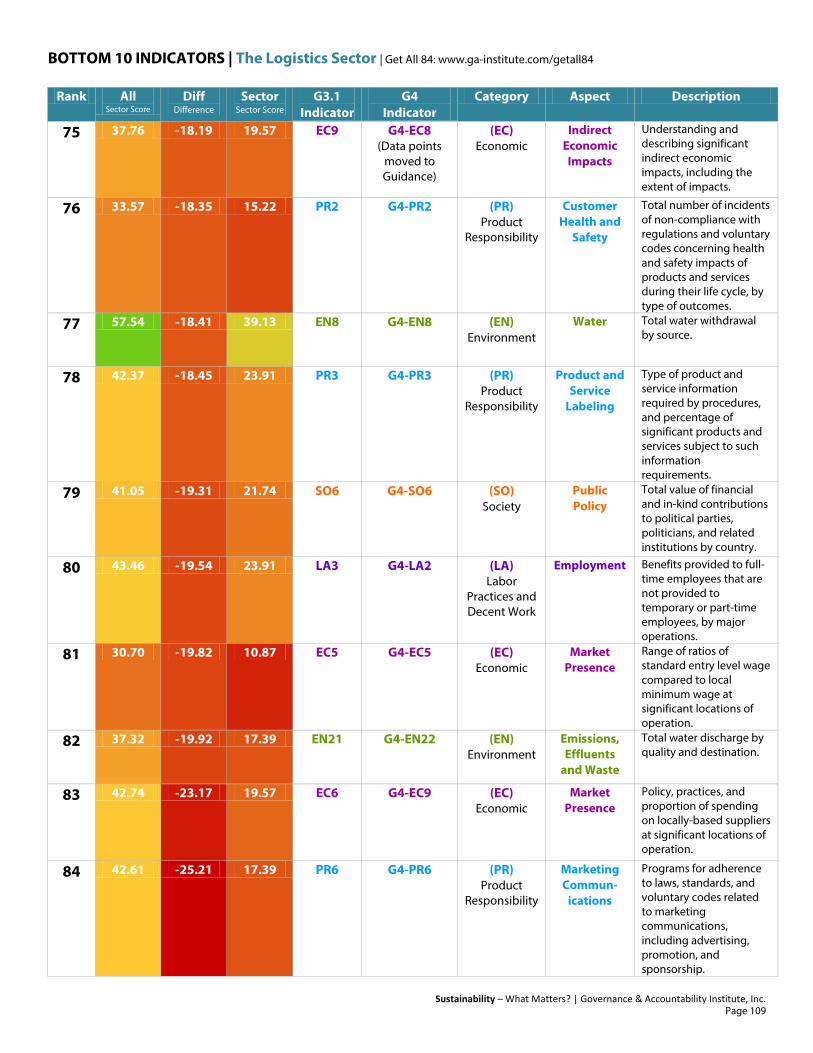
BOTTOM 10 INDICATORS | The Logistics Sector | Get All 84: www.ga-institute.com/getall84
Sustainability – What Matters? | Governance & Accountability Institute, Inc.
Rank All Sector Score
Diff Difference
Sector Sector Score
G3.1 Indicator
G4 Indicator
Category Aspect Description
75 37.76 -18.19 19.57 EC9 G4-EC8 (Data points
moved to Guidance)
(EC) Economic
Indirect Economic Impacts
Understanding and describing significant indirect economic impacts, including the extent of impacts.
76 33.57 -18.35 15.22 PR2 G4-PR2 (PR) Product
Responsibility
Customer Health and
Safety
Total number of incidents of non-compliance with regulations and voluntary codes concerning health and safety impacts of products and services during their life cycle, by type of outcomes.
77 57.54 -18.41 39.13 EN8 G4-EN8 (EN) Environment
Water Total water withdrawal by source.
78 42.37 -18.45 23.91 PR3 G4-PR3 (PR) Product
Responsibility
Product and Service
Labeling
Type of product and service information required by procedures, and percentage of significant products and services subject to such information requirements.
79 41.05 -19.31 21.74 SO6 G4-SO6 (SO) Society
Public Policy
Total value of financial and in-kind contributions to political parties, politicians, and related institutions by country.
80 43.46 -19.54 23.91 LA3 G4-LA2 (LA) Labor
Practices and Decent Work
Employment Benefits provided to full-time employees that are not provided to temporary or part-time employees, by major operations.
81 30.70 -19.82 10.87 EC5 G4-EC5 (EC) Economic
Market Presence
Range of ratios of standard entry level wage compared to local minimum wage at significant locations of operation.
82 37.32 -19.92 17.39 EN21 G4-EN22 (EN) Environment
Emissions, Effluents
and Waste
Total water discharge by quality and destination.
83 42.74 -23.17 19.57 EC6 G4-EC9 (EC) Economic
Market Presence
Policy, practices, and proportion of spending on locally-based suppliers at significant locations of operation.
84 42.61 -25.21 17.39 PR6 G4-PR6 (PR) Product
Responsibility
Marketing Commun-
ications
Programs for adherence to laws, standards, and voluntary codes related to marketing communications, including advertising, promotion, and sponsorship.
Page 109

sustainability — what matters? The Media Sector

The Media Sector
Sustainability – What Matters? | Governance & Accountability Institute, Inc.
“[W]E WILL BE AIMING TO INCREASE THE NUMBER OF SUPPLIERS WHO SIGN UP TO OUR SUPPLIER CODE OF CONDUCT AND LIMIT OUR
ENVIRONMENTAL FOOTPRINT IN AREAS LIKE ENERGY CONSUMPTION. WE WILL BE ENGAGING OUR PEOPLE IN THESE EFFORTS THROUGH OUR
CHAMPIONS NETWORKS THAT SPAN THE WHOLE OF OUR BUSINESS, LIKE OUR SOCIALLY RESPONSIBLE SUPPLIERS GROUP AND EMPLOYEE-LED
GREEN TEAMS. WE WILL ALSO BE UNDERTAKING A GLOBAL EMPLOYEE OPINION SURVEY TO HEAR STAFF VIEWS ON HOW WE ARE PERFORMING
AND MEETING THEIR NEEDS.” — Erik Engstrom, Chief Executive Officer, Reed Elsevier
“Mondadori has produced a new version of its Code of
Ethics – replacing the previous version in force since
2002 – which incorporates current issues of social responsibility and is designed, in terms of its structure
and objectives, to reflect the interests of the various stakeholders.” — Marina Berlusconi, Chairman; Maurizio Costa,
Vice-chairman & CEO, Mondadori
“LAST YEAR WE INVESTED IN THE DEVELOPMENT OF A SOCIAL AND ENVIRONMENTAL DATA MANAGEMENT SYSTEM THAT IS TAILORED TO OUR OPERATIONS. IT HAS GIVEN US THE MEANS TO BUILD AN AGGREGATED BASELINE OF RELEVANT CR INFORMATION ACROSS OUR FOOTPRINT – INCLUDING DATA ON OUR ENERGY CONSUMPTION, GREENHOUSE GAS EMISSIONS AND OUR COMMUNITY INVESTMENTS. WE WILL CONTINUE TO BUILD ON THIS TOOL, AND USE IT TO MEASURE AND IMPROVE OUR CR PERFORMANCE.” — Michael T. Fries, President and CEO, Liberty Global Inc.
“WE EXPANDED OUR FINANCIAL LITERACY PROGRAMS TO SERVE MORE CHILDREN AND MILITARY FAMILIES AS WELL AS BROUGHT NEW SUSTAIN- ABILITY PRODUCTS AND SERVICES TO MARKET AND CONSTRUCTED A SOLAR FIELD THAT WILL REDUCE OUR OVERALL CARBON EMISSIONS BY NEARLY 10%—THE ENVIRONMENTAL EQUIVALENT OF TAKING 2,500 CARS OFF THE ROAD.” — Harold McGraw III, Chairman, President & CEO, The McGraw-Hill Companies
“We continue to develop the communities in which we operate through our three core pillars: education, humanitarian and other community projects. Our sustainability goes beyond these commitments and is at the very heart of everything we do.” — Datuk Johan bin Jaaffar, Chairman, Media Prima
“While we strive to address corruption, human and labour rights issues and climate change with strong group-wide
policies, we also need to be sensitive to local culture when these are implemented.” — Hans-Holger Albrecht, President &
CEO, Modern Times Group
“IMPORTANTLY, IN COUNTRIES FACING
EDUCATIONAL CHALLENGES, NASPERS HAS
STEADILY EXPANDED THE SCOPE OF ITS
EDUCATIONAL AND LITERACY
INITIATIVES. WE ARE ALSO SUPPORTING
THE DEVELOPMENT OF INDUSTRIES WITH
POTENTIAL TO CREATE EMPLOYMENT AND
DEVELOP SKILLS, SUCH AS FILM-MAKING
AND JOURNALISM”
— Ton Vosloo, Chairman, Naspers
“OUR GROUP WORKS DAILY WITH SUPPLIERS, CLIENTS AND OTHER PARTNERS AS PARTICIPANTS IN SOCIAL INTERCOURSE. ROTO SMEETS GROUP’S ACTIVITIES ALSO IMPACT THE ENVIRONMENT. WE USE RAW MATERIALS SUCH AS PAPER, INK AND WATER; WE CONSUME ENERGY, AND CREATE WASTE. ROTO SMEETS GROUP IS ALSO A HUMAN ORGANIZATION. A CORE CONCERN IS THE CONTINUING EDUCATION OF OUR EMPLOYEES AND AN ONGOING CONCERN FOR A SAFE AND HEALTHY WORKING ENVIRONMENT .” — Joost de Haas, Chairman, Roto Smeets Group
“In early 2012, Lagardère Publishing made a commitment to labelling the books it publishes, to inform readers of their carbon footprint and the origin of the paper used. Lagardère Active carried out its second carbon audit of its Magazine Publishing, Audiovisual and Digital businesses, which showed that digital media accounts for a very large proportion of our CO2 emissions.” — Arnaud Lagardère, General and Managing Partner, Lagardère
“THE PROLIFERATION OF COMMUNICATION PLATFORMS HAS RESULTED IN […] THE OPPORTUNITY TO BECOME A MORE SUSTAINABLE
CORPORATION . WE ARE EXPANDING OUR PRODUCT AND SERVICE OFFERING BY SEIZING BUSINESS OPPORTUNITIES IN DIGITAL AND
INTERACTIVE FIELDS, WHILE KEEPING THE CAPABILITIES OF OUR BEST PRINTING ASSETS. WE ARE ALSO BECOMING MORE VERSATILE AND
EFFICIENT BY CONCENTRATING ON OUR MOST PRODUCTIVE ASSETS. THE CORPORATION IS INVESTING IN NEW EQUIPMENT AND REDUCING ITS
ENVIRONMENTAL IMPACTS.” — François Olivier, President & Chief Executive Officer, TC Transcontinental
Page 111

The Media Sector
Sustainability – What Matters? | Governance & Accountability Institute, Inc.
D A T A S A M P L E
All 6 GRI Categories Ranked From Highest to Lowest Difference Score in the Media Sector
1. Labor Practices and Decent Work (LA)
2. Society (SO) 3. Environment (EN) 4. Product Responsibility (PR) 5. Economic (EC) 6. Human Rights (HR)
Top 10 GRI Aspects (out of 37) Ordered Highest to Lowest Difference Score in the Media Sector
1. Materials 2. Equal Remuneration for
Women and Men 3. Local Communities 4. Assessment 5. Employment 6. Indigenous Rights 7. Marketing Communications 8. Products and Services 9. Energy
10. Remediation
Reports Info Our analysis is based on information collected from 24 GRI reports of which:
• 16% were declared GRI Application Level A or A+
• 28% were declared GRI Application Level B or B+
• 52% were declared GRI Application Level C or C+
• 1 report’s GRI Application Level was left undeclared
• and 40% were assured by a third party (+)
Media Sector Reporters Included in Analysis Alma Media Group, Axel Springer, British Sky, Caracol Televisión, D+ Brasil, DirecTV Argentina, Edita, Goodwill PR and Communication Agency, Grupo Antena 3, Grupo EL COMERCIO, Lagardère, Liberty Global Inc., Media Prima, MediaResponsable, Modern Times Group, Mondadori, Naspers, Radio e Televisao de Portugal, S.A. (RTP), Rede Gazeta - Espirito Santo, Reed Elsevier, Roto Smeets Group, TC Transcontinental, The McGraw-Hill Companies, TMG
Page 112
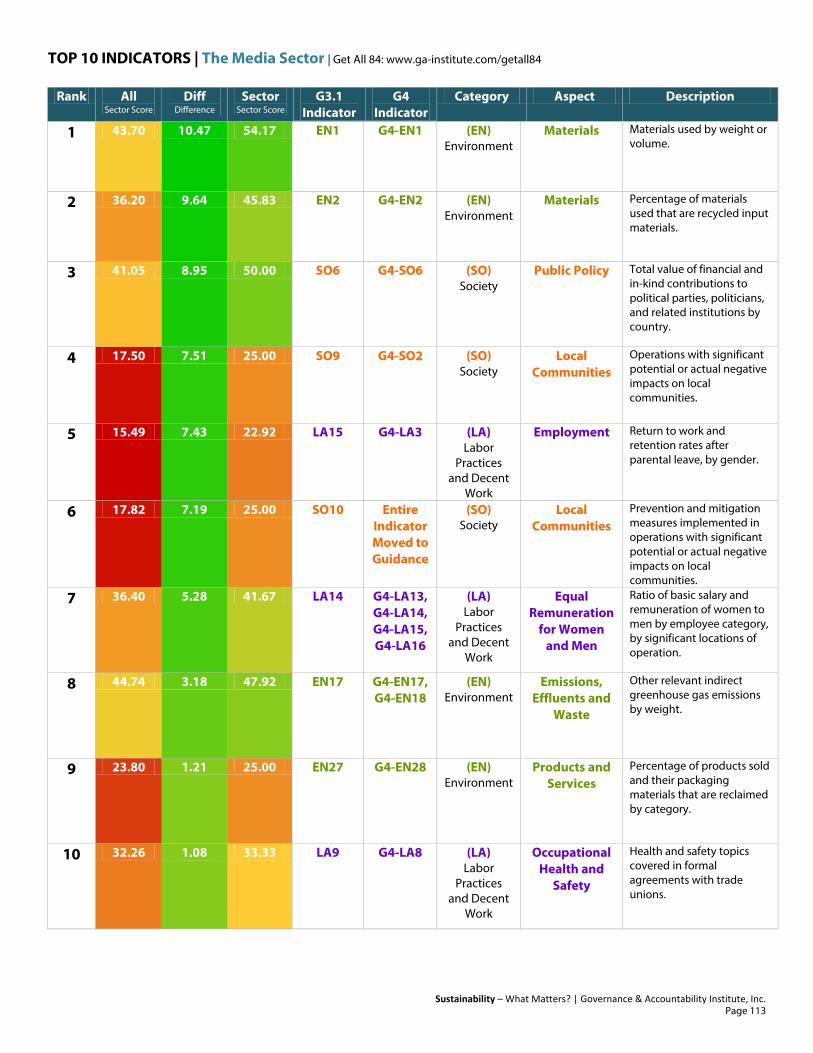
TOP 10 INDICATORS | The Media Sector | Get All 84: www.ga-institute.com/getall84
Sustainability – What Matters? | Governance & Accountability Institute, Inc.
Rank All Sector Score
Diff Difference
Sector Sector Score
G3.1 Indicator
G4 Indicator
Category Aspect Description
1 43.70 10.47 54.17 EN1 G4-EN1 (EN) Environment
Materials Materials used by weight or volume.
2 36.20 9.64 45.83 EN2 G4-EN2 (EN) Environment
Materials Percentage of materials used that are recycled input materials.
3 41.05 8.95 50.00 SO6 G4-SO6 (SO) Society
Public Policy Total value of financial and in-kind contributions to political parties, politicians, and related institutions by country.
4 17.50 7.51 25.00 SO9 G4-SO2 (SO) Society
Local Communities
Operations with significant potential or actual negative impacts on local communities.
5 15.49 7.43 22.92 LA15 G4-LA3 (LA) Labor
Practices and Decent
Work
Employment Return to work and retention rates after parental leave, by gender.
6 17.82 7.19 25.00 SO10 Entire Indicator Moved to Guidance
(SO) Society
Local Communities
Prevention and mitigation measures implemented in operations with significant potential or actual negative impacts on local communities.
7 36.40 5.28 41.67 LA14 G4-LA13, G4-LA14, G4-LA15, G4-LA16
(LA) Labor
Practices and Decent
Work
Equal Remuneration
for Women and Men
Ratio of basic salary and remuneration of women to men by employee category, by significant locations of operation.
8 44.74 3.18 47.92 EN17 G4-EN17, G4-EN18
(EN) Environment
Emissions, Effluents and
Waste
Other relevant indirect greenhouse gas emissions by weight.
9 23.80 1.21 25.00 EN27 G4-EN28 (EN) Environment
Products and Services
Percentage of products sold and their packaging materials that are reclaimed by category.
10 32.26 1.08 33.33 LA9 G4-LA8 (LA) Labor
Practices and Decent
Work
Occupational Health and
Safety
Health and safety topics covered in formal agreements with trade unions.
Page 113

BOTTOM 10 INDICATORS | The Media Sector | Get All 84: www.ga-institute.com/getall84
Sustainability – What Matters? | Governance & Accountability Institute, Inc.
Rank All Sector Score
Diff Difference
Sector Sector Score
G3.1 Indicator
G4 Indicator
Category Aspect Description
75 30.70 -16.11 14.58 EN19 G4-EN20 (EN) Environment
Emissions, Effluents and
Waste
Emissions of ozone-depleting substances by weight.
76 56.42 -16.83 39.58 EN28 G4-EN29 (EN) Environment
Compliance Monetary value of significant fines and total number of non-monetary sanctions for non-compliance with environmental laws and regulations.
77 49.36 -18.10 31.25 EC2 GF-EC2 (EC) Economic
Economic Performance
Financial implications and other risks and opportunities for the organization's activities due to climate change.
78 52.17 -18.83 33.33 LA8 G4-LA7 (Data points
moved to Guidance)
(LA) Labor
Practices and Decent Work
Occupational Health and
Safety
Education, training, counseling, prevention, and risk-control programs in place to assist workforce members, their families, or community members regarding serious diseases.
79 48.19 -19.02 29.17 HR7 H4-HR6 (HR) Human Rights
Prevention of Forced and
Compulsory Labor
Operations and significant suppliers identified as having significant risk for incidents of forced or compulsory labor, and measures to contribute to the elimination of all forms of forced or compulsory labor.
80 44.78 -19.78 25.00 HR5 G4-HR4 (HR) Human Rights
Freedom of Association
and Collective Bargaining
Operations and significant suppliers identified in which the right to exercise freedom of association and collective bargaining may be at significant risk, and actions taken to support these rights.
81 50.24 -21.07 29.17 HR4 G4-HR3 (HR) Human Rights
Non-Discrimination
Total number of incidents of discrimination and corrective actions taken.
82 45.14 -22.22 22.92 PR1 G4-PR1 (Data points
moved to Guidance)
(PR) Product
Responsibility
Customer Health and
Safety
Life cycle stages in which health and safety impacts of products and services are assessed for improvement, and percentage of significant products and services categories subject to such procedures.
83 44.26 -23.42 20.83 EN23 G4-EN24 (EN) Environment
Emissions, Effluents and
Waste
Total number and volume of significant spills.
84 52.09 -25.00 27.08 SO5 Entire Indicator Moved to Guidance
(SO) Society
Public Policy Public policy positions and participation in public policy development and lobbying.
Page 114
sustainability — what matters? The Metals Products Sector
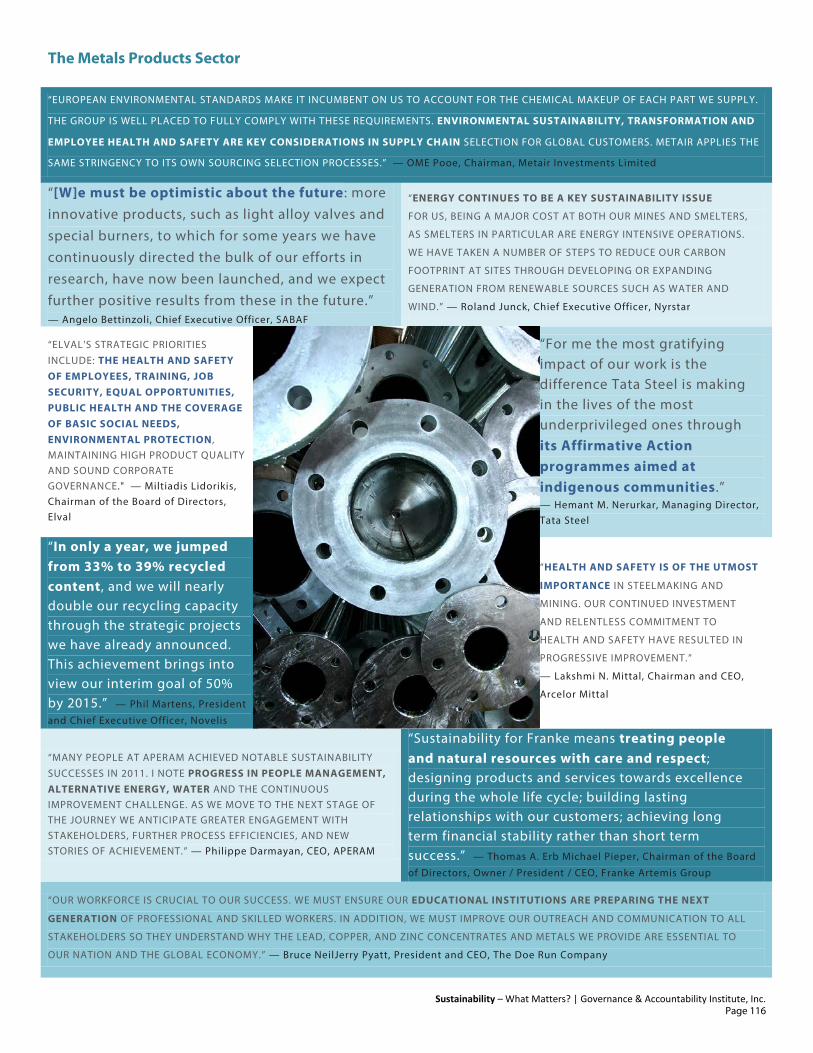
The Metals Products Sector
Sustainability – What Matters? | Governance & Accountability Institute, Inc.
“EUROPEAN ENVIRONMENTAL STANDARDS MAKE IT INCUMBENT ON US TO ACCOUNT FOR THE CHEMICAL MAKEUP OF EACH PART WE SUPPLY.
THE GROUP IS WELL PLACED TO FULLY COMPLY WITH THESE REQUIREMENTS. ENVIRONMENTAL SUSTAINABILITY, TRANSFORMATION AND
EMPLOYEE HEALTH AND SAFETY ARE KEY CONSIDERATIONS IN SUPPLY CHAIN SELECTION FOR GLOBAL CUSTOMERS. METAIR APPLIES THE
SAME STRINGENCY TO ITS OWN SOURCING SELECTION PROCESSES.” — OME Pooe, Chairman, Metair Investments Limited
“[W]e must be optimistic about the future: more innovative products, such as light alloy valves and special burners, to which for some years we have continuously directed the bulk of our efforts in research, have now been launched, and we expect further positive results from these in the future.” — Angelo Bettinzoli, Chief Executive Officer, SABAF
“ENERGY CONTINUES TO BE A KEY SUSTAINABILITY ISSUE
FOR US, BEING A MAJOR COST AT BOTH OUR MINES AND SMELTERS,
AS SMELTERS IN PARTICULAR ARE ENERGY INTENSIVE OPERATIONS.
WE HAVE TAKEN A NUMBER OF STEPS TO REDUCE OUR CARBON
FOOTPRINT AT SITES THROUGH DEVELOPING OR EXPANDING
GENERATION FROM RENEWABLE SOURCES SUCH AS WATER AND
WIND.” — Roland Junck, Chief Executive Officer, Nyrstar
“ELVAL'S STRATEGIC PRIORITIES INCLUDE: THE HEALTH AND SAFETY OF EMPLOYEES, TRAINING, JOB SECURITY, EQUAL OPPORTUNITIES, PUBLIC HEALTH AND THE COVERAGE OF BASIC SOCIAL NEEDS, ENVIRONMENTAL PROTECTION , MAINTAINING HIGH PRODUCT QUALITY AND SOUND CORPORATE GOVERNANCE." — Miltiadis Lidorikis, Chairman of the Board of Directors, Elval
“For me the most gratifying impact of our work is the difference Tata Steel is making in the lives of the most underprivileged ones through its Affirmative Action programmes aimed at indigenous communities.” — Hemant M. Nerurkar, Managing Director, Tata Steel
“In only a year, we jumped from 33% to 39% recycled content, and we will nearly double our recycling capacity through the strategic projects we have already announced. This achievement brings into view our interim goal of 50% by 2015.” — Phil Martens, President
and Chief Executive Officer, Novelis
“HEALTH AND SAFETY IS OF THE UTMOST
IMPORTANCE IN STEELMAKING AND
MINING. OUR CONTINUED INVESTMENT
AND RELENTLESS COMMITMENT TO
HEALTH AND SAFETY HAVE RESULTED IN
PROGRESSIVE IMPROVEMENT.”
— Lakshmi N. Mittal, Chairman and CEO,
Arcelor Mittal
“MANY PEOPLE AT APERAM ACHIEVED NOTABLE SUSTAINABILITY SUCCESSES IN 2011. I NOTE PROGRESS IN PEOPLE MANAGEMENT, ALTERNATIVE ENERGY, WATER AND THE CONTINUOUS IMPROVEMENT CHALLENGE. AS WE MOVE TO THE NEXT STAGE OF THE JOURNEY WE ANTICIPATE GREATER ENGAGEMENT WITH STAKEHOLDERS, FURTHER PROCESS EFFICIENCIES, AND NEW STORIES OF ACHIEVEMENT.” — Philippe Darmayan, CEO, APERAM
“Sustainability for Franke means treating people and natural resources with care and respect; designing products and services towards excellence during the whole life cycle; building lasting relationships with our customers; achieving long term financial stability rather than short term success.” — Thomas A. Erb Michael Pieper, Chairman of the Board
of Directors, Owner / President / CEO, Franke Artemis Group
“OUR WORKFORCE IS CRUCIAL TO OUR SUCCESS. WE MUST ENSURE OUR EDUCATIONAL INSTITUTIONS ARE PREPARING THE NEXT
GENERATION OF PROFESSIONAL AND SKILLED WORKERS. IN ADDITION, WE MUST IMPROVE OUR OUTREACH AND COMMUNICATION TO ALL
STAKEHOLDERS SO THEY UNDERSTAND WHY THE LEAD, COPPER, AND ZINC CONCENTRATES AND METALS WE PROVIDE ARE ESSENTIAL TO
OUR NATION AND THE GLOBAL ECONOMY.” — Bruce NeilJerry Pyatt, President and CEO, The Doe Run Company
Page 116

The Metals Products Sector
Sustainability – What Matters? | Governance & Accountability Institute, Inc.
D A T A S A M P L E
All 6 GRI Categories Ranked From Highest to Lowest Difference Score in the Metal Products Sector
1. Environment (EN)2. Human Rights (HR)3. Economic (EC)4. Labor Practices and Decent
Work (LA)5. Product Responsibility (PR)6. Society (SO)
Top 10 GRI Aspects (out of 37) Ordered Highest to Lowest Difference Score in the Metal Products Sector
1. Materials2. Overall (Environmental)3. Water4. Prevention of Forced and
Compulsory Labor5. Freedom of Association and
Collective Bargaining6. Indigenous Rights7. Security Practices8. Child Labor9. Emissions, Effluents and
Waste10. Anti-Competitive Behavior
Reports Info Our analysis is based on information collected from 14 GRI reports of which:
• 33% were declared GRIApplication Level A or A+
• 38% were declared GRIApplication Level B or B+
• 14% were declared GRIApplication Level C or C+
• 6 reports' GRI ApplicationLevels were left undeclared
• and 45% were assured by athird party (+)
Metal Products Sector Reporters Included in Analysis Acerinox SA, Acindar Grupo Arcelor Mittar, Alcoa, APERAM, ArcelorMittal, ArcelorMittal USA, BHP Billiton, Componenta, CSC STEEL HOLDINGS BERHAD, Elval, Essar Steel, Franke Artemis Group, Halcor, Inscape Office Furniture Corporation, JSW Steel Ltd., La Farga Group, Metair Investments Limited, METALLOINVEST,NLMK (Novolipetsk Steel), Novelis, NUCOR Corporation, Nyrstar, OutoKumpu, PELLICONI, Qatalum, Qatar Steel Company, Rautaruukki, SABAF, SAIL, Sandvik, SKF Group, SSAB, STX Metal, Talvivaara, Tata Steel, The Doe Run Company, Umicore, USIMINAS, V & M do Brasil, Xstrata, Copper Canada, Xstrata Copper Peru, Yamana Desenvolvimento Mineral
Page 117

TOP 10 INDICATORS | The Metals Products Sector | Get All 84: www.ga-institute.com/getall84
Sustainability – What Matters? | Governance & Accountability Institute, Inc. 0 — 50 — 100
Rank All Sector Score
Diff Difference
Sector Sector Score
G3.1 Indicator
G4 Indicator
Category Aspect Description
1 36.20 23.33 59.52 EN2 G4-EN2 (EN) Environment
Materials Percentage of materials used that are recycled input materials.
2 43.70 20.59 64.29 EN1 G4-EN1 (EN) Environment
Materials Materials used by weight or volume.
3 37.32 19.83 57.14 EN21 G4-EN22 (EN) Environment
Emissions, Effluents and
Waste
Total water discharge by quality and destination.
4 37.52 19.63 57.14 EN20 G4-EN21 (EN) Environment
Emissions, Effluents and
Waste
NOx, SOx, and other significant air emissions by type and weight.
5 56.34 12.71 69.05 EN22 G4-EN23 (EN) Environment
Emissions, Effluents and
Waste
Total weight of waste by type and disposal method.
6 30.82 12.04 42.86 EN30 G4-EN31, G4-EN32, G4-EN33, G4-EN34
(EN) Environment
Overall (Environmental)
Total environmental protection expenditures and investments by type.
7 42.37 11.21 53.57 PR3 G4-PR3 (PR) Product
Responsibility
Product and Service
Labeling
Type of product and service information required by procedures, and percentage of significant products and services subject to such information requirements.
8 39.25 10.76 50.00 LA6 G4-LA5 (LA) Labor
Practices and Decent Work
Occupational Health and
Safety
Percentage of total workforce represented in formal joint management-worker health and safety committees that help monitor and advise on occupational health and safety programs.
9 31.02 10.65 41.67 EN10 G4-EN10 (EN) Environment
Water Percentage and total volume of water recycled and reused.
10 57.54 10.32 67.86 EN8 G4-EN8 (EN) Environment
Water Total water withdrawal by source.
Page 118

BOTTOM 10 INDICATORS | The Metals Products Sector | Get All 84: www.ga-institute.com/getall84
Rank All Sector Score
Diff Difference
Sector Sector Score
G3.1 Indicator
G4 Indicator
Category Aspect Description
75 43.14 -5.04 38.10 EN7 G4-EN6 (EN) Environment
Energy Initiatives to reduce indirect energy consumption and reductions achieved.
76 34.11 -5.53 28.57 EN11 G4-EN11 (EN) Environment
Biodiversity Location and size of land owned, leased, managed in, or adjacent to, protected areas and areas of high biodiversity value outside protected areas.
77 15.49 -5.96 9.52 LA15 G4-LA3 (LA) Labor
Practices and Decent Work
Employment Return to work and retention rates after parental leave, by gender.
78 17.50 -6.78 10.71 SO9 G4-SO2 (SO) Society
Local Communities
Operations with significant potential or actual negative impacts on local communities.
79 42.61 -6.89 35.71 PR6 G4-PR6 (PR) Product
Responsibility
Marketing Commun-
ications
Programs for adherence to laws, standards, and voluntary codes related to marketing communications, including advertising, promotion, and sponsorship.
80 35.47 -6.90 28.57 EN12 G4-EN12 (EN) Environment
Biodiversity Description of significant impacts of activities, products, and services on biodiversity in protected areas and areas of high biodiversity value outside protected areas.
81 35.51 -6.94 28.57 EN29 G4-EN30 (EN) Environment
Transport Significant environmental impacts of transporting products and other goods and materials used for the organization's operations, and transporting members of the workforce.
82 17.82 -7.10 10.71 SO10 Entire Indicator Moved to Guidance
(SO) Society
Local Communities
Prevention and mitigation measures implemented in operations with significant potential or actual negative impacts on local communities.
83 41.05 -7.71 33.33 SO6 G4-SO6 (SO) Society
Public Policy Total value of financial and in-kind contributions to political parties, politicians, and related institutions by country.
84 35.42 -9.23 26.19 PR8 G4-PR8 (PR) Product
Responsibility
Customer Privacy
Total number of substantiated complaints regarding breaches of customer privacy and losses of customer data.
Sustainability – What Matters? | Governance & Accountability Institute, Inc. 0 — 50 — 100
Page 119

sustainability — what matters? The Mining Sector

The Mining Sector
Sustainability – What Matters? | Governance & Accountability Institute, Inc.
“NOWADAYS, TO SUCCESSFULLY MANAGE OUR MINING BUSINESS, WE NEED TO NOT ONLY REACH OUR PRODUCTION AND COSTS TARGETS
BUT TO MANAGE OUR HUMAN RESOURCES TO THEIR FULL POTENTIAL, TO ENSURE A HEALTHY AND SAFE WORKPLACE, TO PROTECT THE
ENVIRONMENT AND TO SECURE AND MAINTAIN SOCIAL ACCEPTABILITY WITHIN OUR COMMUNITIES.”
— Louise Grondin, Senior Vice-President, Environment And Sustainable Development, Agnico-Eagle Mines (AEM)
“We identify, reduce and, where possible,
eliminate any significant environmental impact from our mining activities.” — Peter Freyberg, Chief Executive, Xstrata Coal
“NOW MORE THAN EVER, COMMUNITIES, MINING COMPANIES, CIVIL
SOCIETY, AND GOVERNMENTS NEED TO COME TOGETHER IN OPEN
AND RESPECTFUL DIALOGUE. WE DO THIS IN A NUMBER OF WAYS,
INCLUDING THROUGH COMMUNITY ROUNDTABLES, THE
IMPLEMENTATION OF GRIEVANCE MECHANISMS AT ALL OF OUR SITES,
AND MULTI-STAKEHOLDER INITIATIVES…”
— Jamie Sokalsky, President & Chief Executive Officer, Barrick Golg
“WE CONTINUE TO PROACTIVELY
ENGAGE WITH COMMUNITIES NEAR
OUR OPERATIONS AND TO CONTRIBUTE
MEANINGFULLY TO THEIR WELL-BEING,
WITH A SPECIAL EMPHASIS ON
EMPOWERING NORTHERN AND
ABORIGINAL COMMUNITIES.”
— Tim Gitzel, President and CEO,
Cameco
“Our goal is to gain deeper knowledge of the most efficient water usage to reduce consumption in every region where we operate.” — Chuck Jeannes, President and Chief Executive Officer, Goldcorp
“Global issue on greenhouse gas emissions should become our concern.” — Alwinsyah Lubis, M. M., President
Director, PT Antam
“WE KEEP SOCIAL RESPONSIBILITY IN
MIND IN EVERYTHING WE DO. AT THE
OPERATIONS LEVEL, WE HAVE TEAMS
DEDICATED TO THE THREE CORNERSTONES
OF SOCIAL RESPONSIBILITY: HEALTH
AND SAFETY, ECONOMIC IMPACT AND
COMMUNITY ENGAGEMENT, AND
ENVIRONMENTAL STEWARDSHIP.”
— Phillips S. Baker, Jr., President and Chief
Executive Officer, Hecla Mining Company
(Aurizon Mines)
“…BASED ON RESPONSIBLE BUSINESS PRACTICES IN TERMS OF COMMUNITY ENGAGEMENT, LABOUR RELATIONS, CORPORATE GOVERNANCE AND SOCIAL RESPONSIBILITY (BOTH IN TERMS OF COMMUNITY INVESTMENT AND SUPPLY CHAIN ACCOUNTABILITY), THAT WILL ALLOW US TO ACHIEVE OUR ASPIRATION OF MORE THAN MINING.” — Kgomotso Moroka SC, Independent Chairman, Royal Bafokeng Platinum
“We strive to adhere to international standards in all our CSR activities and are continually strengthening our practices relating to health, safety, environmental protection, and community and government relations.” — Peter Marrone, Chairman and
Chief Executive Officer, Yamana Gold
“AS AN INDUSTRY THAT EXTRACTS A NON-RENEWABLE RESOURCE, WE HAVE A DUTY TO BE ESPECIALLY VIGILANT IN ENSURING THAT WE
MINE RESPONSIBLY, ENGENDER TRUST AND DELIVER A FAIR SHARE OF THE BENEFITS DURING THE TIME OF OUR OPERATIONS TO HOST
GOVERNMENTS AND COMMUNITIES, LEAVING THEM WITH A FIRM FOUNDATION FOR A SUSTAINABLE FUTURE .”
— Sir John Parker, Chairman, Anglo American PLC
Page 121
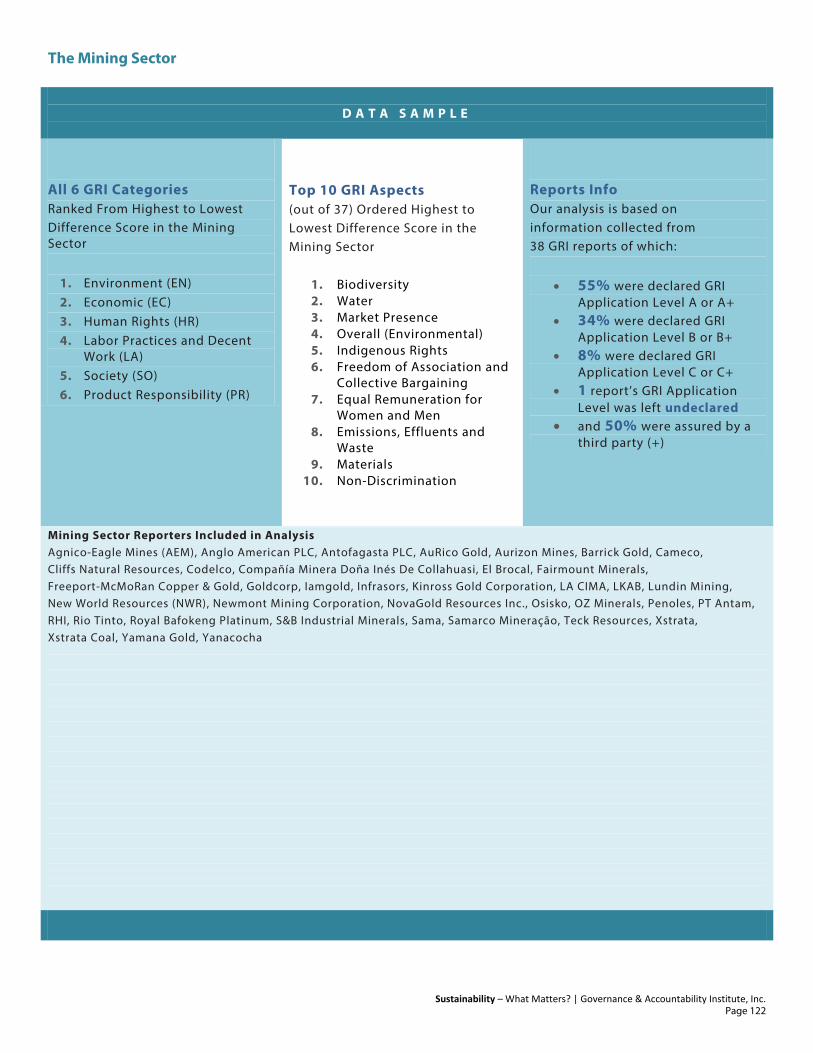
The Mining Sector
Sustainability – What Matters? | Governance & Accountability Institute, Inc.
D A T A S A M P L E
All 6 GRI Categories Ranked From Highest to Lowest Difference Score in the Mining Sector
1. Environment (EN) 2. Economic (EC) 3. Human Rights (HR) 4. Labor Practices and Decent
Work (LA) 5. Society (SO) 6. Product Responsibility (PR)
Top 10 GRI Aspects (out of 37) Ordered Highest to Lowest Difference Score in the Mining Sector
1. Biodiversity 2. Water 3. Market Presence 4. Overall (Environmental) 5. Indigenous Rights 6. Freedom of Association and
Collective Bargaining 7. Equal Remuneration for
Women and Men 8. Emissions, Effluents and
Waste 9. Materials
10. Non-Discrimination
Reports Info Our analysis is based on information collected from 38 GRI reports of which:
• 55% were declared GRI Application Level A or A+
• 34% were declared GRI Application Level B or B+
• 8% were declared GRI Application Level C or C+
• 1 report’s GRI Application Level was left undeclared
• and 50% were assured by a third party (+)
Mining Sector Reporters Included in Analysis Agnico-Eagle Mines (AEM), Anglo American PLC, Antofagasta PLC, AuRico Gold, Aurizon Mines, Barrick Gold, Cameco, Cliffs Natural Resources, Codelco, Compañía Minera Doña Inés De Collahuasi, El Brocal, Fairmount Minerals, Freeport-McMoRan Copper & Gold, Goldcorp, Iamgold, Infrasors, Kinross Gold Corporation, LA CIMA, LKAB, Lundin Mining, New World Resources (NWR), Newmont Mining Corporation, NovaGold Resources Inc., Osisko, OZ Minerals, Penoles, PT Antam, RHI, Rio Tinto, Royal Bafokeng Platinum, S&B Industrial Minerals, Sama, Samarco Mineração, Teck Resources, Xstrata, Xstrata Coal, Yamana Gold, Yanacocha
Page 122
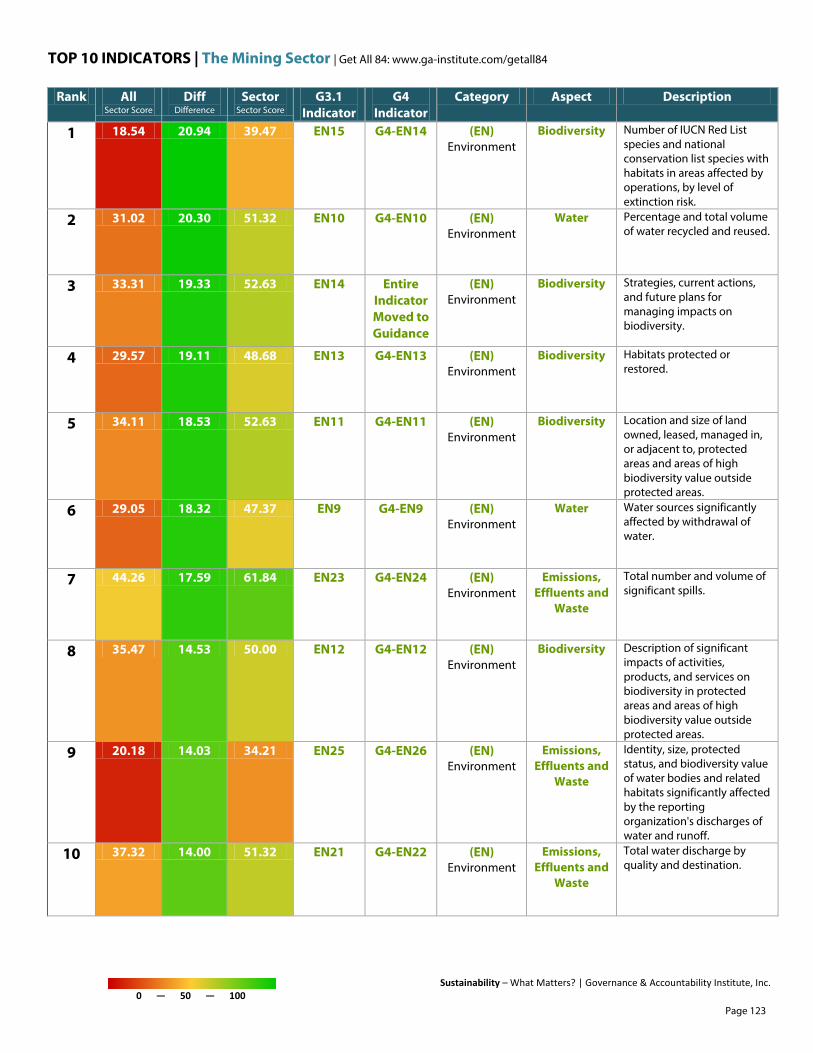
TOP 10 INDICATORS | The Mining Sector | Get All 84: www.ga-institute.com/getall84
Sustainability – What Matters? | Governance & Accountability Institute, Inc. 0 — 50 — 100
Rank All Sector Score
Diff Difference
Sector Sector Score
G3.1 Indicator
G4 Indicator
Category Aspect Description
1 18.54 20.94 39.47 EN15 G4-EN14 (EN) Environment
Biodiversity Number of IUCN Red List species and national conservation list species with habitats in areas affected by operations, by level of extinction risk.
2 31.02 20.30 51.32 EN10 G4-EN10 (EN) Environment
Water Percentage and total volume of water recycled and reused.
3 33.31 19.33 52.63 EN14 Entire Indicator Moved to Guidance
(EN) Environment
Biodiversity Strategies, current actions, and future plans for managing impacts on biodiversity.
4 29.57 19.11 48.68 EN13 G4-EN13 (EN) Environment
Biodiversity Habitats protected or restored.
5 34.11 18.53 52.63 EN11 G4-EN11 (EN) Environment
Biodiversity Location and size of land owned, leased, managed in, or adjacent to, protected areas and areas of high biodiversity value outside protected areas.
6 29.05 18.32 47.37 EN9 G4-EN9 (EN) Environment
Water Water sources significantly affected by withdrawal of water.
7 44.26 17.59 61.84 EN23 G4-EN24 (EN) Environment
Emissions, Effluents and
Waste
Total number and volume of significant spills.
8 35.47 14.53 50.00 EN12 G4-EN12 (EN) Environment
Biodiversity Description of significant impacts of activities, products, and services on biodiversity in protected areas and areas of high biodiversity value outside protected areas.
9 20.18 14.03 34.21 EN25 G4-EN26 (EN) Environment
Emissions, Effluents and
Waste
Identity, size, protected status, and biodiversity value of water bodies and related habitats significantly affected by the reporting organization's discharges of water and runoff.
10 37.32 14.00 51.32 EN21 G4-EN22 (EN) Environment
Emissions, Effluents and
Waste
Total water discharge by quality and destination.
Page 123

BOTTOM 10 INDICATORS | The Mining Sector | Get All 84: www.ga-institute.com/getall84
Sustainability – What Matters? | Governance & Accountability Institute, Inc. 0 — 50 — 100
Rank All Sector Score
Diff Difference
Sector Sector Score
G3.1 Indicator
G4 Indicator
Category Aspect Description
75 49.88 -7.77 42.11 LA11 G4-LA10 (LA) Labor
Practices and Decent Work
Training and
Education
Programs for skills management and lifelong learning that support the continued employability of employees and assist them in managing career endings.
76 52.77 -8.03 44.74 LA12 G4-LA11 (LA) Labor
Practices and Decent Work
Training and
Education
Percentage of employees receiving regular performance and career development reviews, by gender.
77 16.29 -8.39 7.89 HR10 G4-HR9, G4-HR11
(HR) Human Rights
Assessment Percentage and total number of operations that have been subject to Human Rights (HR) reviews and/or impact assessments.
78 53.05 -9.62 43.42 EN5 G4-EN6 (EN) Environment
Energy Energy saved due to conservation and efficiency improvements.
79 48.48 -10.31 38.16 EN6 G4-EN7 (EN) Environment
Energy Initiatives to provide energy-efficient or renewable energy based products and services, and reductions in energy requirements as a result of these initiatives.
80 33.29 -10.92 22.37 PR7 G4-PR7 (PR) Product
Responsibility
Marketing Commun-
ications
Total number of incidents of non-compliance with regulations and voluntary codes concerning marketing communications, including advertising, promotion, and sponsorship by type of outcomes.
81 54.94 -12.83 42.11 EN18 G4-EN19 (EN) Environment
Emissions, Effluents and
Waste
Initiatives to reduce greenhouse gas emissions and reductions achieved.
82 35.42 -13.05 22.37 PR8 G4-PR8 (PR) Product
Responsibility
Customer Privacy
Total number of substantiated complaints regarding breaches of customer privacy and losses of customer data.
83 42.61 -14.97 27.63 PR6 G4-PR6 (PR) Product
Responsibility
Marketing Commun-
ications
Programs for adherence to laws, standards, and voluntary codes related to marketing communications, including advertising, promotion, and sponsorship.
84 51.61 -29.23 22.37 PR5 G4-PR5 (Data points
moved to Guidance)
(PR) Product
Responsibility
Product and Service
Labeling
Practices related to customer satisfaction, including results of surveys measuring customer satisfaction.
Page 124
sustainability — what matters? The Public Agency Sector

The Public Agency Sector
Sustainability – What Matters? | Governance & Accountability Institute, Inc.
“RISK FACTORS SUCH AS CLIMATE CHANGE, WATER SHORTAGES, GLOBAL ECONOMIC CRISIS AND RELENTLESS URBANIZATION WILL HAVE EVEN
GREATER IMPACT ON THE SUSTAINABILITY OF OUR RURAL COMMUNITY. KRC, HOWEVER, WILL TURN THIS CRISIS INTO OPPORTUNITY TO
FOCUS ON THE GENERATION OF NEW & RENEWABLE ENERGY AND THE DEVELOPMENT OF LOW CARBON RURAL COMMUNITY AND TO
STRENGTHEN OUR EFFORTS TO MANAGE WATER RESOURCES EFFECTIVELY TO BUILD READINESS AGAINST POSSIBLE WATER SHORTAGES.”
— Jae-Sun, Park, CEO, Korea Rural Community Corporation (KRC)
“Most of all, we hoped that organisations that joined the Abu Dhabi Sustainability Group would be able to show tangible internal and external impacts that improve the environment, promote Emirati national goals and ideals, create great places to work, and support integration with the society at large.” — H.E.
Razan Khalifa Al Mubarak, Secretary General, H.E. Mohammed Al Bowardi, Group Sponsor, Abu Dhabi Sustainability Group
“RISING GLOBAL DEMAND FOR SCARCE RESOURCES, INCREASING
REGIONAL UNREST, AND THE EFFECTS OF CLIMATE CHANGE ARE JUST
SOME OF THE TRENDS THAT WILL AFFECT OUR FUTURE SECURITY
ENVIRONMENT. THE ARMY RECOGNIZES THAT INCORPORATING
SUSTAINABILITY […] WILL HELP REDUCE OUR RESOURCE DEMANDS
WHILE PRESERVING CURRENT AND FUTURE OPERATIONAL
FLEXIBILITY.” — Lloyd J. Austin III, General and Vice Chief of Staff, US
Army; Joseph Westphal, Under Secretary of the US Army “TO REALIZE OUR MISSION TO BUILD A LOW CARBON CITY WITH OUR STAKEHOLDERS, WE HAVE EXPANDED OUR SERVICES BEYOND A HARDWARE PROVIDER TO A MORE PROACTIVE ADVISORY ROLE ON SUSTAINABLE DESIGN; AND BY SHARING OUR EXPERIENCE AND EXPERTISE WITH OUR STAKEHOLDERS THROUGH EXHIBITIONS, PUBLICATIONS, PRESENTATIONS, WORKSHOPS, CONFERENCES ETC., WE HAVE MOVED CLOSER TOWARDS A MORE SUSTAINABLE FUTURE FOR OUR COMMUNITY .” — Marigold Lau JP, Director, Architectural Services Department (Hong Kong)
“SRC manages Project CLEANS, the environmental remediation of 38 abandoned mines in northern Saskatchewan. We reached major milestones by demolishing unsafe buildings and removing hazardous materials from the Gunnar mine and mill site.” — Dr. Laurier Schramm, President and CEO, Saskatchewan Research Council
“Throughout the year we have continued to invest in the development of our people as we seek to identify new opportunities and enhance their capabilities whilst ensuring we create a fair, equitable and diverse workplace.” — Menno
Henneveld, Managing Director, Main Roads Western Australia
“IN RESPONSE TO [CLIMATE CHANGE] CONCERNS, ECOLOGY LED THE DEVELOP- MENT OF WASHINGTON STATE’S CLIMATE RESPONSE STRATEGY, A COLLABORATION OF THE STATE DEPARTMENTS OF AGRICULTURE, COMMERCE, FISH AND WILDLIFE, HEALTH, NATURAL RESOURCES, AND TRANSPORTATION, AS WELL AS A BROAD RANGE OF STAKEHOLDERS WITH TECHNICAL, SCIENTIFIC, AND POLICY EXPERTISE.” — Ted Sturdevant, Director, Washington State Department Of Ecology
“[T]HE COMMISSION HAS ACHIEVED A WELL-DESERVED REPUTATION FOR LEADERSHIP IN THE EXERCISE OF ITS FUNCTIONS, AND FOR PARTNERSHIPS IN AUSTRALIA AND THE ASIA PACIFIC. THAT REPUTATION HAS PROVED WELL DESERVED AGAIN THIS YEAR, WITH PARTICULAR EMPHASIS BEING PLACED ON INNOVATION IN TECHNOLOGY, COMMUNITY ENGAGEMENT AND PARTNERSHIPS , ALL THE WHILE WITH A CONTINUING FOCUS ON IMPROVING EFFICIENCY.” — The Honourable T. Bathurst, President and Chief Justice, Judicial Commission Of New South Wales
“Our proactive approach to resource use also makes sense financially. We save around £200,000 annually through energy efficiency measures, which has saved us around £1.6m in energy spend since 2004. In addition, over the past year, we generated an income of £48,000 from the Feed in Tariff for our PV (photovoltaic) and Combined Heat and Power schemes.” — Ron Dobson, Commissioner, London Fire Brigade
“SOME OF THE STEPS WE HAVE TAKEN ON OUR JOURNEY OF SUSTAINABILITY INCLUDE THE REPLANTING OF MANGROVES TOTALING
136,000 SQUARE METRES —FOLLOWING THE CONSTRUCTION OF THE OFFSHORE SEMAKAU LANDFILL, INTEGRATING GREEN DESIGN IN OUR
NEWEST METEOROLOGICAL SERVICE FACILITY ALONG KIM CHUAN ROAD, AS WELL AS CHAMPIONING THE PUBLIC SECTOR TAKING THE LEAD
ON ENVIRONMENTAL SUSTAINABILITY (PSTLES) INITIATIVE.” — Andrew Tan, Chief Executive Officer, National Environment Agency (Singapore)
Page 126
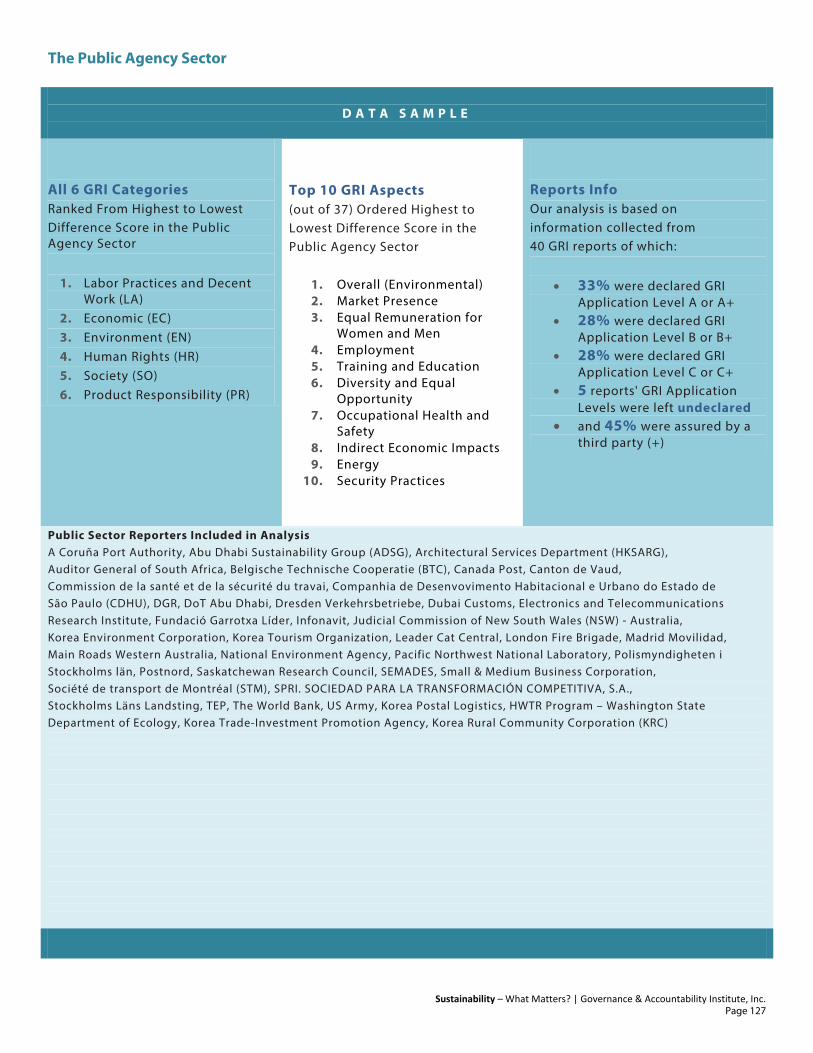
The Public Agency Sector
Sustainability – What Matters? | Governance & Accountability Institute, Inc.
D A T A S A M P L E
All 6 GRI Categories Ranked From Highest to Lowest Difference Score in the Public Agency Sector
1. Labor Practices and Decent
Work (LA) 2. Economic (EC) 3. Environment (EN) 4. Human Rights (HR) 5. Society (SO) 6. Product Responsibility (PR)
Top 10 GRI Aspects (out of 37) Ordered Highest to Lowest Difference Score in the Public Agency Sector
1. Overall (Environmental) 2. Market Presence 3. Equal Remuneration for
Women and Men 4. Employment 5. Training and Education 6. Diversity and Equal
Opportunity 7. Occupational Health and
Safety 8. Indirect Economic Impacts 9. Energy
10. Security Practices
Reports Info Our analysis is based on information collected from 40 GRI reports of which:
• 33% were declared GRI Application Level A or A+
• 28% were declared GRI Application Level B or B+
• 28% were declared GRI Application Level C or C+
• 5 reports' GRI Application Levels were left undeclared
• and 45% were assured by a third party (+)
Public Sector Reporters Included in Analysis A Coruña Port Authority, Abu Dhabi Sustainability Group (ADSG), Architectural Services Department (HKSARG), Auditor General of South Africa, Belgische Technische Cooperatie (BTC), Canada Post, Canton de Vaud, Commission de la santé et de la sécurité du travai, Companhia de Desenvovimento Habitacional e Urbano do Estado de São Paulo (CDHU), DGR, DoT Abu Dhabi, Dresden Verkehrsbetriebe, Dubai Customs, Electronics and Telecommunications Research Institute, Fundació Garrotxa Líder, Infonavit, Judicial Commission of New South Wales (NSW) - Australia, Korea Environment Corporation, Korea Tourism Organization, Leader Cat Central, London Fire Brigade, Madrid Movilidad, Main Roads Western Australia, National Environment Agency, Pacific Northwest National Laboratory, Polismyndigheten i Stockholms län, Postnord, Saskatchewan Research Council, SEMADES, Small & Medium Business Corporation, Société de transport de Montréal (STM), SPRI. SOCIEDAD PARA LA TRANSFORMACIÓN COMPETITIVA, S.A., Stockholms Läns Landsting, TEP, The World Bank, US Army, Korea Postal Logistics, HWTR Program – Washington State Department of Ecology, Korea Trade-Investment Promotion Agency, Korea Rural Community Corporation (KRC)
Page 127
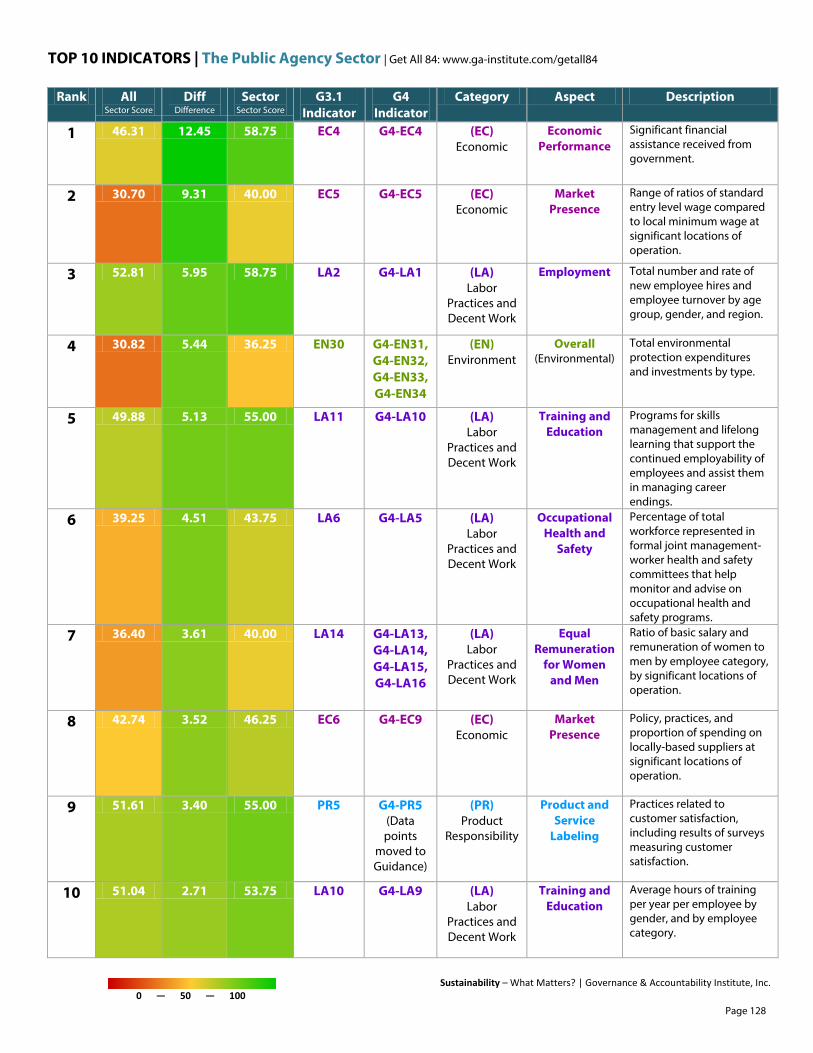
TOP 10 INDICATORS | The Public Agency Sector | Get All 84: www.ga-institute.com/getall84
Sustainability – What Matters? | Governance & Accountability Institute, Inc. 0 — 50 — 100
Rank All Sector Score
Diff Difference
Sector Sector Score
G3.1 Indicator
G4 Indicator
Category Aspect Description
1 46.31 12.45 58.75 EC4 G4-EC4 (EC) Economic
Economic Performance
Significant financial assistance received from government.
2 30.70 9.31 40.00 EC5 G4-EC5 (EC) Economic
Market Presence
Range of ratios of standard entry level wage compared to local minimum wage at significant locations of operation.
3 52.81 5.95 58.75 LA2 G4-LA1 (LA) Labor
Practices and Decent Work
Employment Total number and rate of new employee hires and employee turnover by age group, gender, and region.
4 30.82 5.44 36.25 EN30 G4-EN31, G4-EN32, G4-EN33, G4-EN34
(EN) Environment
Overall (Environmental)
Total environmental protection expenditures and investments by type.
5 49.88 5.13 55.00 LA11 G4-LA10 (LA) Labor
Practices and Decent Work
Training and Education
Programs for skills management and lifelong learning that support the continued employability of employees and assist them in managing career endings.
6 39.25 4.51 43.75 LA6 G4-LA5 (LA) Labor
Practices and Decent Work
Occupational Health and
Safety
Percentage of total workforce represented in formal joint management-worker health and safety committees that help monitor and advise on occupational health and safety programs.
7 36.40 3.61 40.00 LA14 G4-LA13, G4-LA14, G4-LA15, G4-LA16
(LA) Labor
Practices and Decent Work
Equal Remuneration
for Women and Men
Ratio of basic salary and remuneration of women to men by employee category, by significant locations of operation.
8 42.74 3.52 46.25 EC6 G4-EC9 (EC) Economic
Market Presence
Policy, practices, and proportion of spending on locally-based suppliers at significant locations of operation.
9 51.61 3.40 55.00 PR5 G4-PR5 (Data points
moved to Guidance)
(PR) Product
Responsibility
Product and Service
Labeling
Practices related to customer satisfaction, including results of surveys measuring customer satisfaction.
10 51.04 2.71 53.75 LA10 G4-LA9 (LA) Labor
Practices and Decent Work
Training and Education
Average hours of training per year per employee by gender, and by employee category.
Page 128
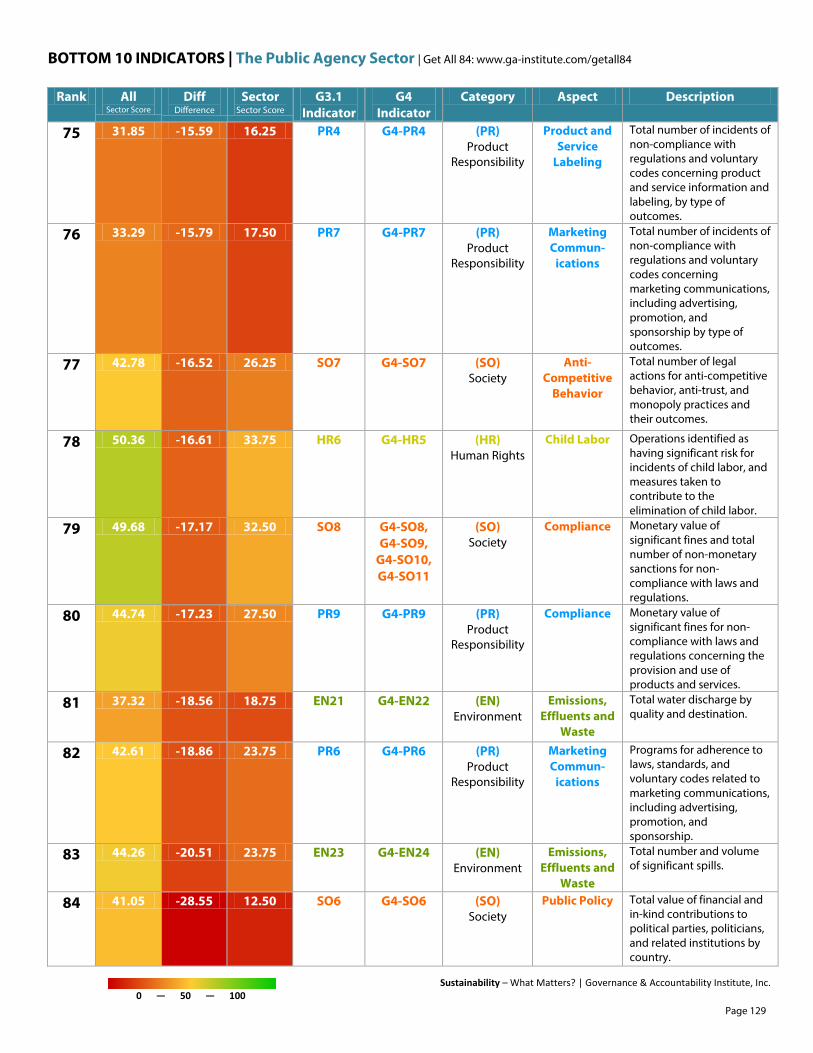
BOTTOM 10 INDICATORS | The Public Agency Sector | Get All 84: www.ga-institute.com/getall84
Sustainability – What Matters? | Governance & Accountability Institute, Inc. 0 — 50 — 100
Rank All Sector Score
Diff Difference
Sector Sector Score
G3.1 Indicator
G4 Indicator
Category Aspect Description
75 31.85 -15.59 16.25 PR4 G4-PR4 (PR) Product
Responsibility
Product and Service
Labeling
Total number of incidents of non-compliance with regulations and voluntary codes concerning product and service information and labeling, by type of outcomes.
76 33.29 -15.79 17.50 PR7 G4-PR7 (PR) Product
Responsibility
Marketing Commun-
ications
Total number of incidents of non-compliance with regulations and voluntary codes concerning marketing communications, including advertising, promotion, and sponsorship by type of outcomes.
77 42.78 -16.52 26.25 SO7 G4-SO7 (SO) Society
Anti-Competitive
Behavior
Total number of legal actions for anti-competitive behavior, anti-trust, and monopoly practices and their outcomes.
78 50.36 -16.61 33.75 HR6 G4-HR5 (HR) Human Rights
Child Labor Operations identified as having significant risk for incidents of child labor, and measures taken to contribute to the elimination of child labor.
79 49.68 -17.17 32.50 SO8 G4-SO8, G4-SO9,
G4-SO10, G4-SO11
(SO) Society
Compliance Monetary value of significant fines and total number of non-monetary sanctions for non-compliance with laws and regulations.
80 44.74 -17.23 27.50 PR9 G4-PR9 (PR) Product
Responsibility
Compliance Monetary value of significant fines for non-compliance with laws and regulations concerning the provision and use of products and services.
81 37.32 -18.56 18.75 EN21 G4-EN22 (EN) Environment
Emissions, Effluents and
Waste
Total water discharge by quality and destination.
82 42.61 -18.86 23.75 PR6 G4-PR6 (PR) Product
Responsibility
Marketing Commun-
ications
Programs for adherence to laws, standards, and voluntary codes related to marketing communications, including advertising, promotion, and sponsorship.
83 44.26 -20.51 23.75 EN23 G4-EN24 (EN) Environment
Emissions, Effluents and
Waste
Total number and volume of significant spills.
84 41.05 -28.55 12.50 SO6 G4-SO6 (SO) Society
Public Policy Total value of financial and in-kind contributions to political parties, politicians, and related institutions by country.
Page 129

sustainability — what matters? The Railroad Sector

The Railroad Sector
Sustainability – What Matters? | Governance & Accountability Institute, Inc.
“TO ME, THIS BRINGS SHARPER FOCUS TO THE NEED FOR SEAMLESS INTEGRATION OF OUR SERVICES WITH THE COMMUNITY. WE
NEED TO BE AMBITIOUS AND FORWARD THINKING AS WE FORGE AHEAD TO CONTINUOUSLY IMPROVE OUR EXISTING
BUSINESSES, DEVELOP MORE LOCAL RAIL PROJECTS AND PURSUE FURTHER FRANCHISES OUTSIDE HONG KONG. WE MUST ALSO
EMBRACE INNOVATION AND ACTIVELY ENGAGE WITH ALL OUR STAKEHOLDERS EVERY STEP OF THE WAY. CRITICALLY, WE MUST
BE GUIDED BY A CLEAR VISION OF HOW TRANSPORT SYSTEMS WILL SUPPORT FUTURE GENERATIONS AND IMPROVE
THEIR LIVES.” — Jay H Walder, Chief Executive Officer, MTR Corporation
“We believe that the railroad industry will serve both as a new catalyst for growth as a core transportation mode, expanding its coverage into the vast Eurasian
Continent in the upcoming years, and also as an eco-friendly mode of green transportation. To this end, KORAIL will continue to foster key talented individuals with integrated technical capabilities and accumulate technological skills in order to secure future engines of growth.” — Chang-Young Chung, CEO, KORAIL
“CLIMATE CHANGE IS [A] HUGE CHALLENGE FACING US ALL. WE ACTIVELY PROMOTE THE USAGE OF BUSES, WHICH OFFER A MORE ENVIRONMENTALLY FRIENDLY ALTERNATIVE TO PRIVATE CARS, BUT AT ABELLIO LONDON AND SURREY WE ALSO WANT TO MINIMIZE OUR OWN ENVIRONMENTAL IMPACT AS MUCH AS POSSIBLE. OUR NEW BUS DEPOT IN BATTERSEA LEADS THE WAY IN ECO-EFFICIENCY.” — Paul McGowan, Managing Director, Abellio
“[W]e have improved our fuel efficiency by over 90 percent since 1980, and are continuing to invest in new technologies that will reduce consumption even more. This creates both economic and environmental strengths that are increasing our appeal to industries around the world while reducing our environmental impact on it.” — Michael J. Ward, Chairman, CSX Corporation
“[WE HAVE] ACTIVELY PURSUED ECO-FRIENDLY DESIGN BY CONDUCTING A THOROUGH ENVIRONMENTAL IMPACT
ASSESSMENT FROM THE PHASE OF DESIGN, BASED ON EXPANDING OF THE CONCEPT OF ECO-FRIENDLY RAILWAYS TO INCLUDE
LIFE-CYCLE. […] KR ALSO TAKES LEAD IN THE CONSTRUCTION OF ECO-FRIENDLY RAILWAYS AND GREEN GROWTH, FOR EXAMPLE,
IT HAS MADE SHUT-DOWN RAILWAYS AREAS AND FACILITIES INTO BICYCLE LANES, ECO-FORESTS, AND ECO-TRAILS, RETURNING
THEM TO LOCAL COMMUNITIES.” — Kwang Jae Kim, Chairman and CEO, Korea Rail Network Authority
Page 131
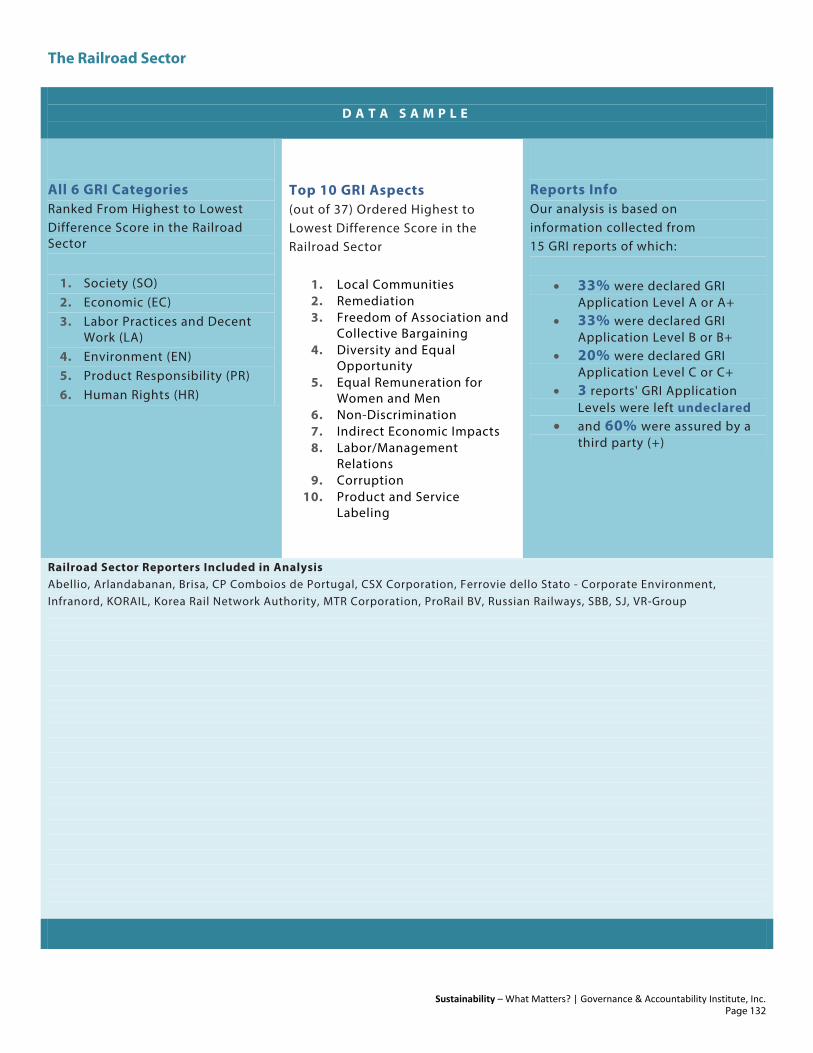
The Railroad Sector
Sustainability – What Matters? | Governance & Accountability Institute, Inc.
D A T A S A M P L E
All 6 GRI Categories Ranked From Highest to Lowest Difference Score in the Railroad Sector
1. Society (SO) 2. Economic (EC) 3. Labor Practices and Decent
Work (LA) 4. Environment (EN) 5. Product Responsibility (PR) 6. Human Rights (HR)
Top 10 GRI Aspects (out of 37) Ordered Highest to Lowest Difference Score in the Railroad Sector
1. Local Communities 2. Remediation 3. Freedom of Association and
Collective Bargaining 4. Diversity and Equal
Opportunity 5. Equal Remuneration for
Women and Men 6. Non-Discrimination 7. Indirect Economic Impacts 8. Labor/Management
Relations 9. Corruption
10. Product and Service Labeling
Reports Info Our analysis is based on information collected from 15 GRI reports of which:
• 33% were declared GRI Application Level A or A+
• 33% were declared GRI Application Level B or B+
• 20% were declared GRI Application Level C or C+
• 3 reports' GRI Application Levels were left undeclared
• and 60% were assured by a third party (+)
Railroad Sector Reporters Included in Analysis Abellio, Arlandabanan, Brisa, CP Comboios de Portugal, CSX Corporation, Ferrovie dello Stato - Corporate Environment, Infranord, KORAIL, Korea Rail Network Authority, MTR Corporation, ProRail BV, Russian Railways, SBB, SJ, VR-Group
Page 132

TOP 10 INDICATORS | The Railroad Sector | Get All 84: www.ga-institute.com/getall84
Sustainability – What Matters? | Governance & Accountability Institute, Inc. 0 — 50 — 100
Rank All Sector Score
Diff Difference
Sector Sector Score
G3.1 Indicator
G4 Indicator
Category Aspect Description
1 17.82 18.85 36.67 SO10 Entire Indicator Moved to Guidance
(SO) Society
Local Communities
Prevention and mitigation measures implemented in operations with significant potential or actual negative impacts on local communities.
2 51.61 18.40 70.00 PR5 G4-PR5 (Data points
moved to Guidance)
(PR) Product
Responsibility
Product and Service
Labeling
Practices related to customer satisfaction, including results of surveys measuring customer satisfaction.
3 46.31 17.03 63.33 EC4 G4-EC4 (EC) Economic
Economic Performance
Significant financial assistance received from government.
4 44.26 15.74 60.00 EN23 G4-EN24 (EN) Environment
Emissions, Effluents and
Waste
Total number and volume of significant spills.
5 31.02 15.65 46.67 EN10 G4-EN10 (EN) Environment
Water Percentage and total volume of water recycled and reused.
6 18.22 15.12 33.33 HR11 G4-HR12 (HR) Human Rights
Remediation Number of grievances related to Human Rights (HR) filed, addressed, and resolved through formal grievance mechanisms.
7 48.23 15.11 63.33 SO1 Gf-SO1 (SO) Society
Local Communities
Percentage of operations with implemented local community engagement, impact assessments, and development programs.
8 48.31 15.02 63.33 SO4 G4-SO5 (SO) Society
Corruption Actions taken in response to incidents of corruption.
9 34.11 12.56 46.67 EN11 G4-EN11 (EN) Environment
Biodiversity Location and size of land owned, leased, managed in, or adjacent to, protected areas and areas of high biodiversity value outside protected areas.
10 17.50 12.51 30.00 SO9 G4-SO2 (SO) Society
Local Communities
Operations with significant potential or actual negative impacts on local communities.
Page 133
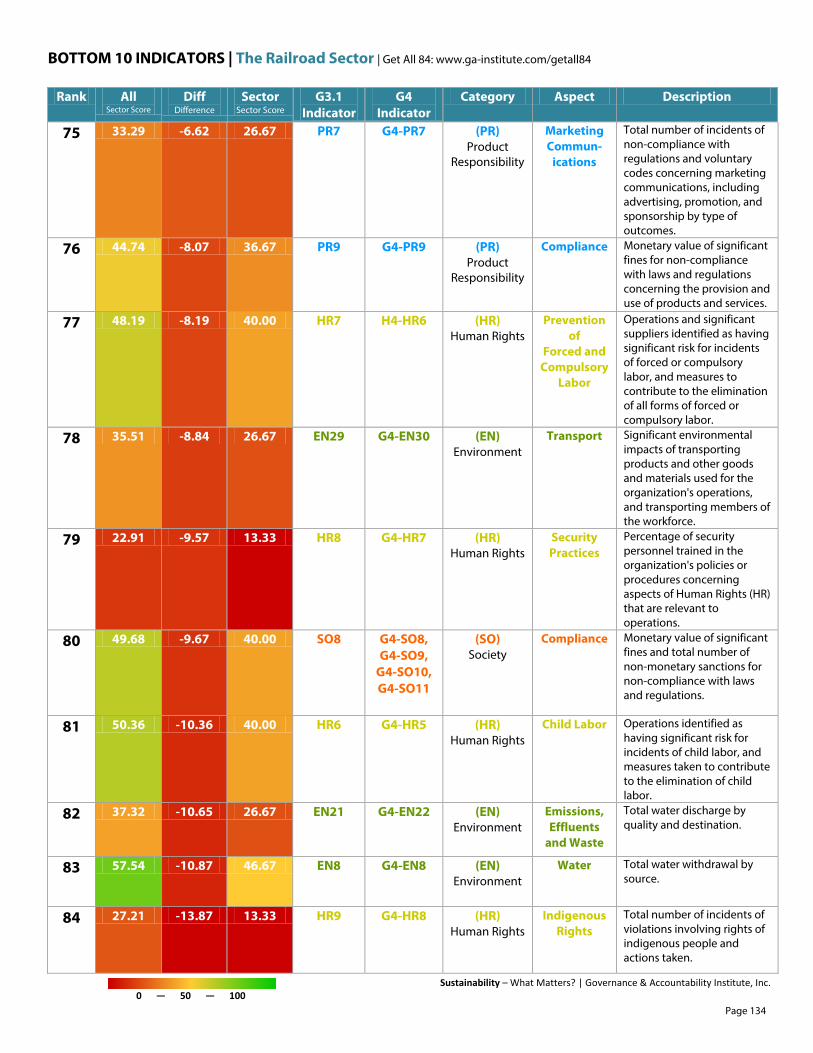
BOTTOM 10 INDICATORS | The Railroad Sector | Get All 84: www.ga-institute.com/getall84
Sustainability – What Matters? | Governance & Accountability Institute, Inc. 0 — 50 — 100
Rank All Sector Score
Diff Difference
Sector Sector Score
G3.1 Indicator
G4 Indicator
Category Aspect Description
75 33.29 -6.62 26.67 PR7 G4-PR7 (PR) Product
Responsibility
Marketing Commun-
ications
Total number of incidents of non-compliance with regulations and voluntary codes concerning marketing communications, including advertising, promotion, and sponsorship by type of outcomes.
76 44.74 -8.07 36.67 PR9 G4-PR9 (PR) Product
Responsibility
Compliance Monetary value of significant fines for non-compliance with laws and regulations concerning the provision and use of products and services.
77 48.19 -8.19 40.00 HR7 H4-HR6 (HR) Human Rights
Prevention of
Forced and Compulsory
Labor
Operations and significant suppliers identified as having significant risk for incidents of forced or compulsory labor, and measures to contribute to the elimination of all forms of forced or compulsory labor.
78 35.51 -8.84 26.67 EN29 G4-EN30 (EN) Environment
Transport Significant environmental impacts of transporting products and other goods and materials used for the organization's operations, and transporting members of the workforce.
79 22.91 -9.57 13.33 HR8 G4-HR7 (HR) Human Rights
Security Practices
Percentage of security personnel trained in the organization's policies or procedures concerning aspects of Human Rights (HR) that are relevant to operations.
80 49.68 -9.67 40.00 SO8 G4-SO8, G4-SO9,
G4-SO10, G4-SO11
(SO) Society
Compliance Monetary value of significant fines and total number of non-monetary sanctions for non-compliance with laws and regulations.
81 50.36 -10.36 40.00 HR6 G4-HR5 (HR) Human Rights
Child Labor Operations identified as having significant risk for incidents of child labor, and measures taken to contribute to the elimination of child labor.
82 37.32 -10.65 26.67 EN21 G4-EN22 (EN) Environment
Emissions, Effluents
and Waste
Total water discharge by quality and destination.
83 57.54 -10.87 46.67 EN8 G4-EN8 (EN) Environment
Water Total water withdrawal by source.
84 27.21 -13.87 13.33 HR9 G4-HR8 (HR) Human Rights
Indigenous Rights
Total number of incidents of violations involving rights of indigenous people and actions taken.
Page 134
sustainability — what matters? The Real Estate Sector

The Real Estate Sector
Sustainability – What Matters? | Governance & Accountability Institute, Inc.
“SOCIETY IS BECOMING MORE AND MORE AWARE OF ENVIRONMENTAL AND SOCIAL QUESTIONS AND IS REWARDING THOSE COMPANIES THAT
HAVE RESPONSIBLE AND RESILIENT BUSINESS STRATEGIES. LEGISLATION REFLECTS THIS TREND, AND IS PROGRESSIVELY MORE DEMANDING.
FINALLY, THROUGH CAREFUL COST BENEFIT ANALYSIS, WE ARE ABLE TO PROVE THAT SUSTAINABILITY PRINCIPLES INCORPORATED IN ALL
BUSINESS AREAS CAN RESULT IN LOWER OPERATIONAL COSTS, WHICH IN TURN LOWER OUR SERVICE CHARGES FOR TENANTS AND
CONTRIBUTE TO HIGHER OCCUPANCY AND SATISFACTION LEVELS.” — Fernando Guedes Oliveira, Chief Executive Officer, Sonae Sierra
“DEXUS is committed to employee diversity as we believe it enables organisations to make better informed decisions. We set a target last year of 33% female participation at senior management level by 2015 and I am pleased to report as at 30 June 2012 we are at 30%.” — Chris Beare, Chair, DEXUS
Property Group
“WITH CONCERNS OVER THE ENVIRONMENT AND CLIMATE CHANGE IN MIND, WE HAVE COMMITTED TO MANAGE OUR ELECTRICITY CONSUMPTION BY INVESTING IN ENERGY REDUCTION INITIATIVES. WE ALSO MANAGE WASTE GENERATED IN DAILY OPERATIONS AND HAVE IMPLEMENTED WASTE RECYCLING INITIATIVES IN OUR SHOPPING CENTRES. WE EDUCATE OUR STAFF ON ENVIRONMENTAL MANAGEMENT AND HELP RAISE COMMUNITY AWARENESS ABOUT ENVIRONMENTAL ISSUES .” — George Hongchoy, Chief Executive Officer, The Link Real Estate Investment Trust
“WITHOUT CHANGING DIRECTION, WE TOOK THE OPPORTUNITY TO EXPAND OUR SKILLS: SINCE 2006, BEFIMMO HAS DEVELOPED EXPERTISE IN THE STUDY OF RENOVATION PROJECTS. WE NOW HAVE AN IN-HOUSE TEAM OF ABOUT TEN PEOPLE THAT SPECIALISES IN STUDYING SUCH PROJECTS AND MANAGING MAJOR BUILDING PROJECTS. TWO MEMBERS OF THE TEAM ARE SPECIALISTS IN SUSTAINABLE DEVELOPMENT .” — Benoît De Blieck, CEO, Befimmo
“It is estimated that our 37 Green Mark certified buildings between 2008 and 2011 account for some S$19.7 million cost savings in electricity alone annually. We also remain committed to a 22% reduction in carbon emissions by 2020 from baseline year 2007, and to achieve a 25% reduction by 2030.” — Kwek Leng Joo, Managing Director, City Developments Limited
“In May 2006, we made a
commitment to build all future development projects to Leadership in Energy and Environmental Design (“LEED”) standards.” — Dori J. Segal, President and CEO,
First Capital Realty, Inc.
“OUR SUSTAINABILITY STRATEGY IS ALIGNED TO OUR STRATEGIC BUSINESS PLAN AND WE WILL CONTINUE TO DRIVE POSITIVE CHANGE IN THE LIVES OF OUR CUSTOMERS, STAKEHOLDERS AND THE COMMUNITY BY MAKING OUR RESIDENTIAL AND INTEGRATED BUSINESS DEVELOPMENTS ENVIRONMENT FRIENDLY – BY REDUCING OUR OWN CARBON FOOTPRINT, AND ENABLING COMMUNITIES TO REDUCE THEIRS.” — Arun Nanda, Chairman, Mahindra Lifespace Developers Limited
“WE HAVE DEVELOPED A SET OF ENVIRONMENTAL DESIGN GUIDELINES FOR OUR NEW PROPERTIES. THESE INCLUDE SOURCING 40% OF OUR CONSTRUCTION MATERIALS WITHIN 1,000 KM, ENSURING THAT 30% OF BUILDING MATERIALS HAVE RECYCLED CONTENT AND 70% OF THE GROSS FLOOR AREA IS WELL-LIT BY NATURAL LIGHT AS WELL AS MAINTAINING 20% AND 40% OF THE TOTAL SITE AREA FOR COMMERCIAL AND RESIDENTIAL DEVELOPMENTS RESPECTIVELY AS GREEN SPACES. THIS INTEGRATED APPROACH WILL IMPROVE OUR ENVIRONMENTAL PERFORMANCE .” — Kevin Wong, Group Chief Executive Officer, Keppel Land Limited
“Since 2011, we only purchase bioenergy-based electricity. Our aim is for all our new buildings to be environmentally classified to meet Green Building Silver stipulations. As the second-largest property
company in Sweden, we can and want to make a difference to the environment.” — Kerstin Lindberg Göransson, President, Akademiska Hus
“AS A REAL ESTATE DEVELOPER, THE WELL BEING OF THE COMMUNITIES WE BUILD IN IS OF PARAMOUNT IMPORTANCE. THIS INCLUDES
DEVELOPING GREEN BUILDINGS AND TAKING EFFORT TO MINIMISE THE IMPACT OUR GREEN BUILDINGS MAY HAVE ON THE SURROUNDING
ENVIRONMENT. WE ENSURE OUR VALUE CHAIN OF REAL ESTATE DEVELOPMENTS ARE BUILT AND OPERATED IN AN EFFICIENT AND
RESPONSIBLE MANNER. FOR INSTANCE, OUR HOME OWNERS, SHOPPERS, TENANTS AND SERVICED RESIDENCE GUESTS BENEFIT FROM BETTER
INDOOR AIR QUALITY, RESOURCE EFFICIENCY AS WELL AS LUSH GREENERY FOUND AT OUR PROPERTIES” — Liew Mun Leong, President and CEO, Capitaland
Page 136

The Real Estate Sector
Sustainability – What Matters? | Governance & Accountability Institute, Inc.
D A T A S A M P L E
All 6 GRI Categories Ranked From Highest to Lowest Difference Score in the Real Estate Sector
1. Labor Practices and Decent
Work (LA) 2. Society (SO) 3. Environment (EN) 4. Product Responsibility (PR) 5. Economic (EC) 6. Human Rights (HR)
Top 10 GRI Aspects (out of 37) Ordered Highest to Lowest Difference Score in the Real Estate Sector
1. Employment 2. Non-Discrimination 3. Diversity and Equal
Opportunity 4. Energy 5. Remediation 6. Training and Education 7. Corruption 8. Local Communities 9. Compliance
10. Products and Services
Reports Info Our analysis is based on information collected from 71 GRI reports of which:
• 18% were declared GRI Application Level A or A+
• 38% were declared GRI Application Level B or B+
• 41% were declared GRI Application Level C or C+
• 2 reports' GRI Application Levels were left undeclared
• and 35% were assured by a third party (+)
Real Estate Sector Reporters Included in Analysis Akademiska Hus, Alstria office REIT-AG, American Industries, Aspen Group, Atrium Ljungberg, Avalon Bay Communities Inc., Ayala Land, Befimmo, Bentall Kennedy, Berkeley Group, BIG, Bilfinger Berger, BostadsGaranti, Brinova, British Land, CA Immo, Capitaland, CBRE Group, CEBU Holdings, Cebu Property Ventures and Development Corp., City Developments Limited, Citycon, Corio, Cosil Construções e Incorporações S.A., DEXUS Property Group, DiamondRock Hospitality Company, DIC Asset, Environment Park, Equity One, Fabege AB, First Capital Realty, Inc., Fonciere Des Regions, Gazit Globe, GESOBAU AG, GSW Immobilien, Hammerson, Hermes Real Estate Investment Management Limited, Hines, HOWOGE, Hyprop, Industrial Buildings Corp (IBC), IVG Immobilien, Jernhusen, Jones Lang LaSalle, Keppel Land Limited, Las Vegas Sands Corp., Mahindra Lifespace Developers Limited, Mirvac, Mobimo, Morguard, Oxford Properties Group, Prologis, Pruksa Real Estate, Realia, Redefine, REDEVCO B.V., Riksbyggen, Senate Properties, Shaftesbury PLC, Sonae Sierra, Specialfastigheter Sverige, Sponda, Stockland, Swire Properties, The Crown Estate, The Link REIT, UNIBAIL-RODAMCO SE, Vasallen, Wallenstam, Westfield Group, Wihlborgs Fastigheter AB
Page 137
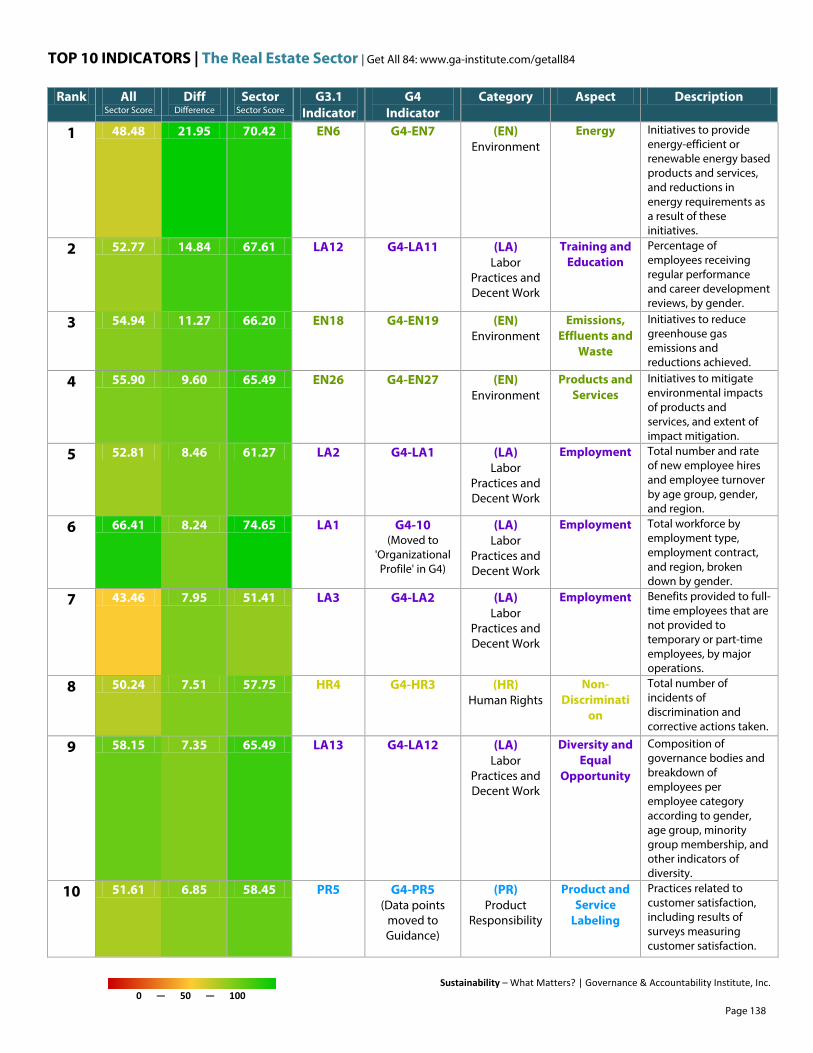
TOP 10 INDICATORS | The Real Estate Sector | Get All 84: www.ga-institute.com/getall84
Sustainability – What Matters? | Governance & Accountability Institute, Inc. 0 — 50 — 100
Rank All Sector Score
Diff Difference
Sector Sector Score
G3.1 Indicator
G4 Indicator
Category Aspect Description
1 48.48 21.95 70.42 EN6 G4-EN7 (EN) Environment
Energy Initiatives to provide energy-efficient or renewable energy based products and services, and reductions in energy requirements as a result of these initiatives.
2 52.77 14.84 67.61 LA12 G4-LA11 (LA) Labor
Practices and Decent Work
Training and Education
Percentage of employees receiving regular performance and career development reviews, by gender.
3 54.94 11.27 66.20 EN18 G4-EN19 (EN) Environment
Emissions, Effluents and
Waste
Initiatives to reduce greenhouse gas emissions and reductions achieved.
4 55.90 9.60 65.49 EN26 G4-EN27 (EN) Environment
Products and Services
Initiatives to mitigate environmental impacts of products and services, and extent of impact mitigation.
5 52.81 8.46 61.27 LA2 G4-LA1 (LA) Labor
Practices and Decent Work
Employment Total number and rate of new employee hires and employee turnover by age group, gender, and region.
6 66.41 8.24 74.65 LA1 G4-10 (Moved to
'Organizational Profile' in G4)
(LA) Labor
Practices and Decent Work
Employment Total workforce by employment type, employment contract, and region, broken down by gender.
7 43.46 7.95 51.41 LA3 G4-LA2 (LA) Labor
Practices and Decent Work
Employment Benefits provided to full-time employees that are not provided to temporary or part-time employees, by major operations.
8 50.24 7.51 57.75 HR4 G4-HR3 (HR) Human Rights
Non-Discriminati
on
Total number of incidents of discrimination and corrective actions taken.
9 58.15 7.35 65.49 LA13 G4-LA12 (LA) Labor
Practices and Decent Work
Diversity and Equal
Opportunity
Composition of governance bodies and breakdown of employees per employee category according to gender, age group, minority group membership, and other indicators of diversity.
10 51.61 6.85 58.45 PR5 G4-PR5 (Data points
moved to Guidance)
(PR) Product
Responsibility
Product and Service
Labeling
Practices related to customer satisfaction, including results of surveys measuring customer satisfaction.
Page 138

BOTTOM 10 INDICATORS | The Real Estate Sector | Get All 84: www.ga-institute.com/getall84
Sustainability – What Matters? | Governance & Accountability Institute, Inc. 0 — 50 — 100
Rank All Sector Score
Diff Difference
Sector Sector Score
G3.1 Indicator
G4 Indicator
Category Aspect Description
75 44.26 -14.68 29.58 EN23 G4-EN24 (EN) Environment
Emissions, Effluents and
Waste
Total number and volume of significant spills.
76 42.61 -15.14 27.46 PR6 G4-PR6 (PR) Product
Responsibility
Marketing Commun-
ications
Programs for adherence to laws, standards, and voluntary codes related to marketing communications, including advertising, promotion, and sponsorship.
77 44.78 -15.20 29.58 HR5 G4-HR4 (HR) Human Rights
Freedom of Association
and Collective
Bargaining
Operations and significant suppliers identified in which the right to exercise freedom of association and collective bargaining may be at significant risk, and actions taken to support these rights.
78 42.74 -15.27 27.46 EC6 G4-EC9 (EC) Economic
Market Presence
Policy, practices, and proportion of spending on locally-based suppliers at significant locations of operation.
79 30.70 -18.02 12.68 EN19 G4-EN20 (EN) Environment
Emissions, Effluents and
Waste
Emissions of ozone-depleting substances by weight.
80 30.70 -18.02 12.68 EC5 G4-EC5 (EC) Economic
Market Presence
Range of ratios of standard entry level wage compared to local minimum wage at significant locations of operation.
81 36.20 -18.59 17.61 EN2 G4-EN2 (EN) Environment
Materials Percentage of materials used that are recycled input materials.
82 37.32 -22.53 14.79 EN21 G4-EN22 (EN) Environment
Emissions, Effluents and
Waste
Total water discharge by quality and destination.
83 43.70 -24.68 19.01 EN1 G4-EN1 (EN) Environment
Materials Materials used by weight or volume.
84 37.52 -28.36 9.15 EN20 G4-EN21 (EN) Environment
Emissions, Effluents and
Waste
NOx, SOx, and other significant air emissions by type and weight.
Page 139

sustainability — what matters? The Retailers Sector

The Retailers Sector
Sustainability – What Matters? | Governance & Accountability Institute, Inc.
“WE ARE SEEKING TO PUT THE CUSTOMER AT THE CENTER OF WHAT WE DO , ADDRESSING THEIR NEEDS AND PROVIDING UNIQUE VALUE
TO THEM. ONE OF THE WAYS WE DO THIS IS BY HELPING OUR CUSTOMERS EXTEND THE LIFE OF THEIR TECHNOLOGY, IN PART THROUGH OUR
TRADE-IN AND RECYCLING PROGRAMS.” — Hubert Joly, President and Chief Executive Officer, Best Buy
“Wal-Mart U.S. crossed a significant threshold by preventing more than 80 percent of its waste from going to landfills. Eliminating unnecessary packaging is another great way to reduce costs.” — Michael T. Duke, President and Chief Executive Officer, Wal-Mart
“OUR APPROACH ENABLES US TO INTEGRATE OUR SUSTAINABILITY
VALUES WITH BUSINESS BEST PRACTICE. THIS HELPS US TO
SAFEGUARD RELATIONSHIPS WITH OUR SUPPLIERS AND GIVES THEM,
AS WELL AS OUR CUSTOMERS A CLEAR VIEW OF OUR EXPECTATIONS.”
— Lucy Shaw, Manager Responsible Sourcing, John Lewis
“WE HAVE FOR MANY YEARS VALUED
THE OPPORTUNITY TO ENGAGE
DIRECTLY WITH NGOS THAT AGGRESSIVELY CHALLENGE
INDUSTRY, RECOGNIZING THAT
ALL BUSINESSES REQUIRE A
SOCIAL LICENSE TO OPERATE.”
— Michael J. Kowalski, Chairman
and CEO, Tiffany & Co.
“Our stores divert approximately 58% of our waste away from landfills and incinerators. Our teams have committed to a goal of increasing the diversion rate to 65% across our 2,400 stores for 2013.” — David B. Dillon, Chairman
of the Board andChief Executive Officer,
The Kroger Company
“We believed we could build a sustainable business that strengthened communities for the long term by continually anticipating the consumer needs of the moment.” — Gregg Steinhafel,
Chairman, President and CEO, Target
“WE HAVE ALREADY STARTED THE
JOURNEY TOWARDS NEW SUSTAINABLE
BUSINESS MODELS WITH THE LAUNCH
OF OUR ‘SHWOPPING’ INITIATIVE , WHICH
ENCOURAGES CUSTOMERS TO RETURN A
USED GARMENT TO US WHENEVER THEY
BUY A NEW ONE.” — Marc Bolland,
Chief Executive Officer, Marks & Spencer
“WOOLWORTHS AIMS TO BE AUSTRALIA’S AND NEW ZEALAND’S MOST TRUSTED BRAND. AS WE SERVE MORE THAN 28 MILLION PEOPLE A WEEK, IT IS A GOAL THAT IS CENTRAL TO ENSURING OUR BUSINESS CAN EVOLVE AND GROW THROUGH THIS RAPIDLY TRANSFORMING ERA IN RETAIL. THAT IS WHY WE ARE COMMITTED TO STRETCHING OURSELVES BEYOND THE BASIC EXPECTATIONS IN ALL AREAS WHERE WE OPERATE.” — Grant O'Brien, Managing Director & CEO, Woolworths Limited
“We also offered thousands of environmentally preferable products, launched free technology recycling, and piloted new custom packaging software in our warehouses to reduce excess space in our customers’ deliveries.” — Ron Sargent, Chairman & CEO, Staples
“THE ACTIONS OF INDIVIDUALS AND THEIR UNDERSTANDING OF WHAT MIGHT BE ACHIEVABLE CONTRIBUTE AS MUCH TO THE LONG-TERM
RESOLUTION OF ENVIRONMENTAL CONCERNS AS PROMOTING EXEMPLARY CONSTRUCTION METHODS, BUILDING MANAGEMENT AND GIVING
AN ENVIRONMENTAL LEAD TO SUPPLY CHAINS.” — Patrick Burgess, Chairman, Capital Shopping Centres Group
Page 141

The Retailers Sector
Sustainability – What Matters? | Governance & Accountability Institute, Inc.
D A T A S A M P L E
All 6 GRI Categories Ranked From Highest to Lowest Difference Score in the Retailers Sector
1. (PR) Product Responsibility 2. (HR) Human Rights 3. (EN) Environment 4. (EC) Economic 5. (LA) Labor Practices and
Decent Work 6. (SO) Society
Top 10 GRI Aspects (out of 37) Ordered Highest to Lowest Difference Score in the Retailers Sector
1. Transport 2. Customer Health and Safety 3. Assessment 4. Product and Service
Labeling 5. Diversity and Equal
Opportunity 6. Prevention of Forced and
Compulsory Labor 7. Freedom of Association and
Collective Bargaining 8. Products and Services 9. Energy
10. Child Labor
Reports Info Our analysis is based on information collected from 40 GRI reports of which:
• 20% were declared GRI Application Level A or A+
• 50% were declared GRI Application Level B or B+
• 15% were declared GRI Application Level C or C+
• 6 reports' GRI Application Levels were left undeclared
• and 25% were assured by a third party (+)
Retailers Sector Reporters Included in Analysis Ahold, Areas, Best Buy, C&A Brazil, C&A Europe, Capital Shopping Centres Group, Carrefour Argentina, CARREFOUR Hellas, Consum, Coop, Delhaize Group, Falabella, Foschini, Grupo Auchan, Holdsport, Homeplus, ICA, Inditex, JD Group, John Lewis Partnership, Kathmandu, Kesko Corporation, Lotte Shopping, Marks & Spencer, Massmart, MEC, Metro, Migros, Staples, Stockmann, Target, The Kroger Company, Tiffany & Co, Truworths, United Rentals, Wal-Mart, Wal-Mart Brasil, Wal-Mart de México y Centroamérica, Woolworths Limited, Woolworths South Africa
Page 142
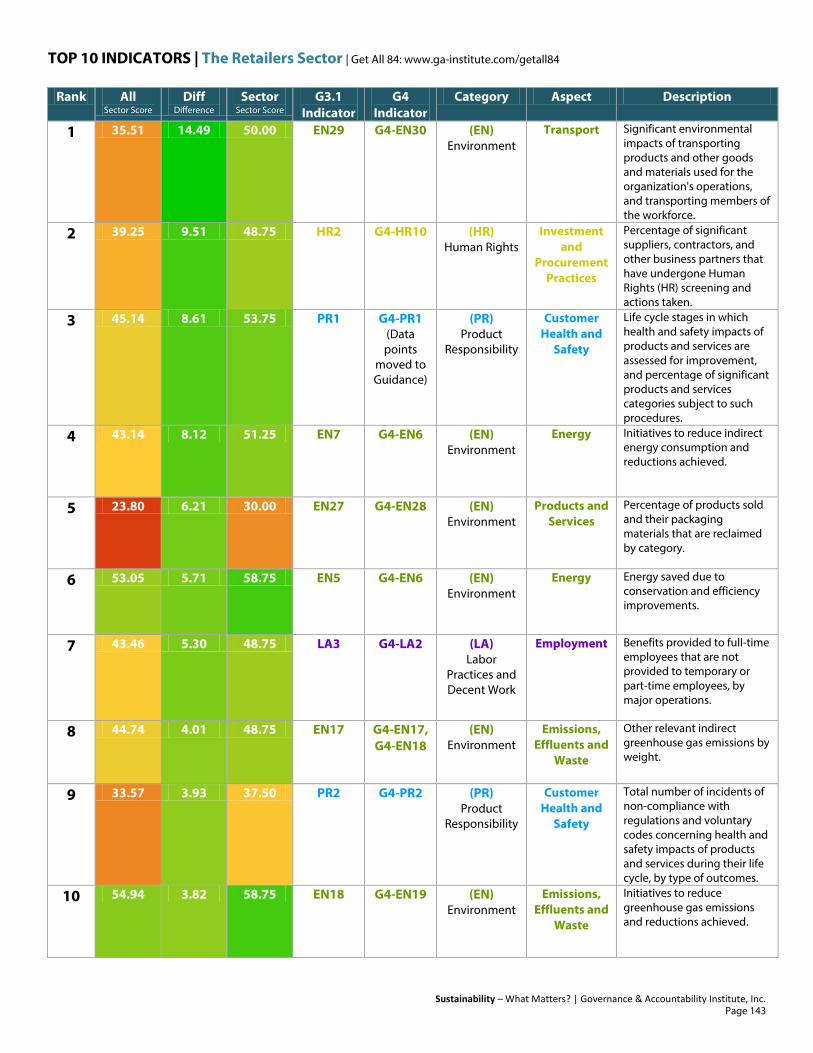
TOP 10 INDICATORS | The Retailers Sector | Get All 84: www.ga-institute.com/getall84
Sustainability – What Matters? | Governance & Accountability Institute, Inc.
Rank All Sector Score
Diff Difference
Sector Sector Score
G3.1 Indicator
G4 Indicator
Category Aspect Description
1 35.51 14.49 50.00 EN29 G4-EN30 (EN) Environment
Transport Significant environmental impacts of transporting products and other goods and materials used for the organization's operations, and transporting members of the workforce.
2 39.25 9.51 48.75 HR2 G4-HR10 (HR) Human Rights
Investment and
Procurement Practices
Percentage of significant suppliers, contractors, and other business partners that have undergone Human Rights (HR) screening and actions taken.
3 45.14 8.61 53.75 PR1 G4-PR1 (Data points
moved to Guidance)
(PR) Product
Responsibility
Customer Health and
Safety
Life cycle stages in which health and safety impacts of products and services are assessed for improvement, and percentage of significant products and services categories subject to such procedures.
4 43.14 8.12 51.25 EN7 G4-EN6 (EN) Environment
Energy Initiatives to reduce indirect energy consumption and reductions achieved.
5 23.80 6.21 30.00 EN27 G4-EN28 (EN) Environment
Products and Services
Percentage of products sold and their packaging materials that are reclaimed by category.
6 53.05 5.71 58.75 EN5 G4-EN6 (EN) Environment
Energy Energy saved due to conservation and efficiency improvements.
7 43.46 5.30 48.75 LA3 G4-LA2 (LA) Labor
Practices and Decent Work
Employment Benefits provided to full-time employees that are not provided to temporary or part-time employees, by major operations.
8 44.74 4.01 48.75 EN17 G4-EN17, G4-EN18
(EN) Environment
Emissions, Effluents and
Waste
Other relevant indirect greenhouse gas emissions by weight.
9 33.57 3.93 37.50 PR2 G4-PR2 (PR) Product
Responsibility
Customer Health and
Safety
Total number of incidents of non-compliance with regulations and voluntary codes concerning health and safety impacts of products and services during their life cycle, by type of outcomes.
10 54.94 3.82 58.75 EN18 G4-EN19 (EN) Environment
Emissions, Effluents and
Waste
Initiatives to reduce greenhouse gas emissions and reductions achieved.
Page 143

BOTTOM 10 INDICATORS | The Retailers Sector | Get All 84: www.ga-institute.com/getall84
Sustainability – What Matters? | Governance & Accountability Institute, Inc.
Rank All Sector Score
Diff Difference
Sector Sector Score
G3.1 Indicator
G4 Indicator
Category Aspect Description
75 52.77 -11.51 41.25 EC8 G4-EC7 (Data points
moved to Guidance)
(EC) Economic
Indirect Economic Impacts
Development and impact of infrastructure investments and services provided primarily for public benefit through commercial, in-kind, or pro bono engagement.
76 34.11 -11.60 22.50 EN11 G4-EN11 (EN) Environment
Biodiversity Location and size of land owned, leased, managed in, or adjacent to, protected areas and areas of high biodiversity value outside protected areas.
77 52.17 -12.16 40.00 LA8 G4-LA7 (Data points
moved to Guidance)
(LA) Labor
Practices and Decent Work
Occupational Health and
Safety
Education, training, counseling, prevention, and risk-control programs in place to assist workforce members, their families, or community members regarding serious diseases.
78 49.68 -12.17 37.50 SO8 G4-SO8, G4-SO9,
G4-SO10, G4-SO11
(SO) Society
Compliance Monetary value of significant fines and total number of non-monetary sanctions for non-compliance with laws and regulations.
79 51.04 -12.29 38.75 LA10 G4-LA9 (LA) Labor
Practices and Decent Work
Training and Education
Average hours of training per year per employee by gender, and by employee category.
80 30.82 -14.56 16.25 EN30 G4-EN31, G4-EN32, G4-EN33, G4-EN34
(EN) Environment
Overall (Environmental)
Total environmental protection expenditures and investments by type.
81 43.70 -16.19 27.50 EN1 G4-EN1 (EN) Environment
Materials Materials used by weight or volume.
82 37.52 -16.26 21.25 EN20 G4-EN21 (EN) Environment
Emissions, Effluents and
Waste
NOx, SOx, and other significant air emissions by type and weight.
83 46.31 -17.55 28.75 EC4 G4-EC4 (EC) Economic
Economic Performance
Significant financial assistance received from government.
84 56.98 -19.48 37.50 LA7 G4-LA6 (LA) Labor
Practices and Decent Work
Occupational Health and
Safety
Rates of injury, occupational diseases, lost days, and absenteeism, and number of work-related fatalities by region and by gender.
Page 144

sustainability — what matters? The Technology Hardware Sector

The Technology Hardware Sector
Sustainability – What Matters? | Governance & Accountability Institute, Inc.
“MAKING CONTINUED EFFORTS TO PROMOTE SUSTAINABLE MANAGEMENT UNDER THE BUSINESS PHILOSOPHY OF “DEVOTING OUR
HUMAN RESOURCES AND TECHNOLOGY TO CREATING SUPERIOR PRODUCTS AND SERVICES, THEREBY CONTRIBUTING TO A BETTER GLOBAL
SOCIETY.” — Oh-Hyun Kwon, Vice Chairman & CEO, Samsung
“Bringing people together to collaborate on
innovative solutions to social issues including education, healthcare, economic empowerment, and critical human needs and disaster relief.” — Tae Yoo, Senior Vice President, Corporate Affairs,
Cisco Systems Inc.
“SUSTAINABILITY IS MUCH MORE THAN ENERGY EFFICIENCY OR
PRODUCT TAKE-BACK PROGRAMS – IT’S ABOUT BEING PURPOSEFUL
IN HOW WE IDENTIFY, MANAGE AND CONSIDER ENVIRONMENTAL
AND SOCIAL IMPACTS IN THE DECISIONS WE MAKE EVERY DAY .”
— Kathrin Winkler, Chief Sustainability Officer, EMC
“OUR EFFORTS TO CREATE AND OFFER
ENVIRONMENTALLY RESPONSIBLE
PRODUCTS AND REDUCE THEIR
ENVIRONMENTAL IMPACT
THROUGHOUT THE ENTIRE PRODUCT
LIFE CYCLE FROM DEVELOPMENT, TO
PRODUCTION SALES, AND RECYCLING.”
— Masatoshi Matsuzaki, President and
CEO, Konica Minolta Holdings
“Once employees participate in our social activities they are motivated to build our brand and create moments of truth with their actions, thus contributing to the journey of sustainability.” — Aparup Sengupta, Managing Director and Global CEO, Aegis Limited
“To prevent global warming,
we need to choose power sources that are eco- conscious and optimal for a sustainable society.” — Hiroaki Nakanishi, President, Hitachi
“SUSTAINABILITY IS AN IMPORTANT
STRATEGIC OBJECTIVE, EMBEDDED IN
ALL WE DO FROM PRODUCT DEVELOPMENT,
CUSTOMER SUPPORT, HUMAN RESOURCES
MANAGEMENT AND PRODUCTION TO
SOCIAL ENGAGEMENT.”
— Dr. Paul J. Hälg, CEO, Dätwyler Holding
“WE SEE IT AS OUR MISSION TO DEVELOP MACHINES THAT MANUFACTURE MORE EFFICIENTLY INTEGRATED CIRCUITS, WHICH THEMSELVES WILL ENABLE MORE ENERGY-EFFICIENT ELECTRONIC PRODUCTS. OUR SUSTAINABILITY STRATEGY GOES HAND IN HAND WITH OUR BUSINESS STRATEGY.” — Eric Meurice, President and Chief Executive Officer, ASML Holding
“At corporate level, we place a high priority on environmental, health, and safety practices to ensure that we meet or exceed the regulatory requirements of the countries in which we operate.” — Jerald G. Fishman, Chief Executive Officer, Analog Devices
“OUR PRODUCT LINE WAS ENHANCED WITH NEW SOCIALLY AND ENVIRONMENTALLY BENEFICIAL HARDWARE AND SOFTWARE
SOLUTIONS . WE RECENTLY RELEASED TWO PHENOMENAL ACCESSIBILITY SOLUTIONS THAT HELP USERS WITH LIMITED SIGHT BE MORE
INDEPENDENT AND PRODUCTIVE IN THE WORKPLACE.” — Paul A. Rooke, Chairman and Chief Executive Officer, Lexmark International
Page 146
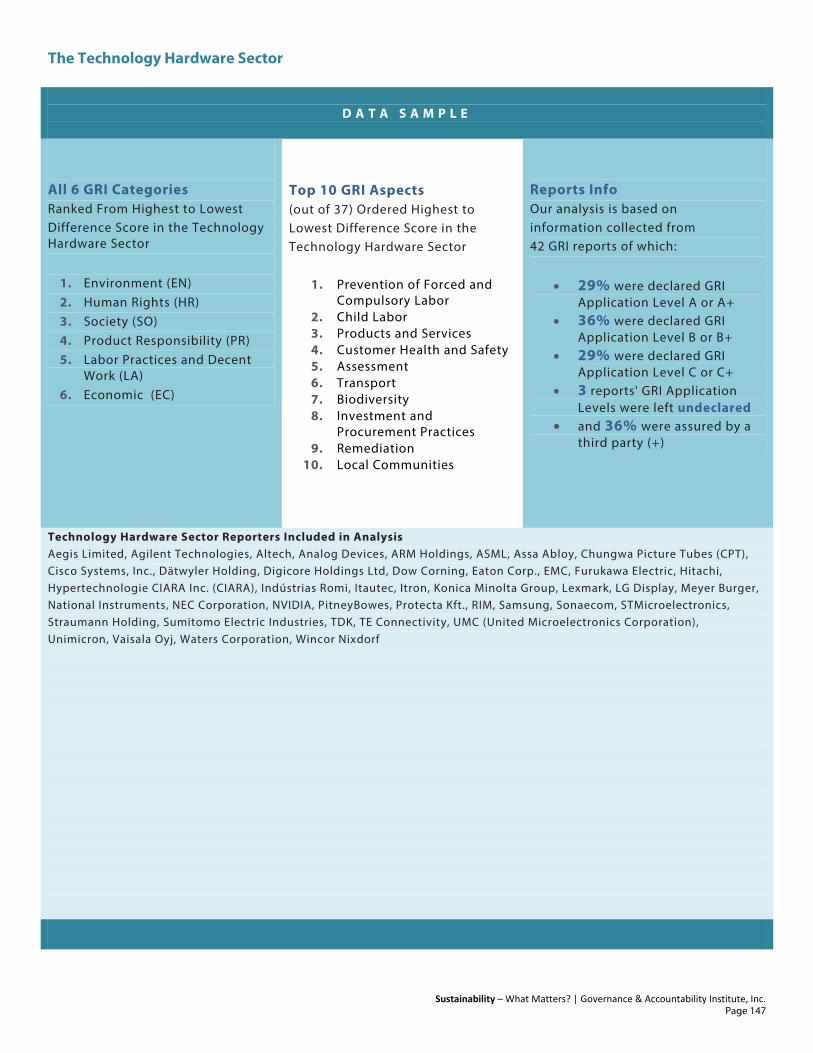
The Technology Hardware Sector
Sustainability – What Matters? | Governance & Accountability Institute, Inc.
D A T A S A M P L E
All 6 GRI Categories Ranked From Highest to Lowest Difference Score in the Technology Hardware Sector
1. Environment (EN) 2. Human Rights (HR) 3. Society (SO) 4. Product Responsibility (PR) 5. Labor Practices and Decent
Work (LA) 6. Economic (EC)
Top 10 GRI Aspects (out of 37) Ordered Highest to Lowest Difference Score in the Technology Hardware Sector
1. Prevention of Forced and Compulsory Labor
2. Child Labor 3. Products and Services 4. Customer Health and Safety 5. Assessment 6. Transport 7. Biodiversity 8. Investment and
Procurement Practices 9. Remediation
10. Local Communities
Reports Info Our analysis is based on information collected from 42 GRI reports of which:
• 29% were declared GRI Application Level A or A+
• 36% were declared GRI Application Level B or B+
• 29% were declared GRI Application Level C or C+
• 3 reports' GRI Application Levels were left undeclared
• and 36% were assured by a third party (+)
Technology Hardware Sector Reporters Included in Analysis Aegis Limited, Agilent Technologies, Altech, Analog Devices, ARM Holdings, ASML, Assa Abloy, Chungwa Picture Tubes (CPT), Cisco Systems, Inc., Dätwyler Holding, Digicore Holdings Ltd, Dow Corning, Eaton Corp., EMC, Furukawa Electric, Hitachi, Hypertechnologie CIARA Inc. (CIARA), Indústrias Romi, Itautec, Itron, Konica Minolta Group, Lexmark, LG Display, Meyer Burger, National Instruments, NEC Corporation, NVIDIA, PitneyBowes, Protecta Kft., RIM, Samsung, Sonaecom, STMicroelectronics, Straumann Holding, Sumitomo Electric Industries, TDK, TE Connectivity, UMC (United Microelectronics Corporation), Unimicron, Vaisala Oyj, Waters Corporation, Wincor Nixdorf
Page 147

TOP 10 INDICATORS | The Technology Hardware Sector | Get All 84: www.ga-institute.com/getall84
Sustainability – What Matters? | Governance & Accountability Institute, Inc. 0 — 50 — 100
Rank All Sector Score
Diff Difference
Sector Sector Score
G3.1 Indicator
G4 Indicator
Category Aspect Description
1 20.18 7.20 27.38 EN25 G4-EN26 (EN) Environment
Emissions, Effluents and
Waste
Identity, size, protected status, and biodiversity value of water bodies and related habitats significantly affected by the reporting organization's discharges of water and runoff.
2 48.48 5.10 53.57 EN6 G4-EN7 (EN) Environment
Energy Initiatives to provide energy-efficient or renewable energy based products and services, and reductions in energy requirements as a result of these initiatives.
3 17.82 3.62 21.43 SO10 Entire Indicator Moved to Guidance
(SO) Society
Local Communities
Prevention and mitigation measures implemented in operations with significant potential or actual negative impacts on local communities.
4 17.50 2.75 20.24 SO9 G4-SO2 (SO) Society
Local Communities
Operations with significant potential or actual negative impacts on local communities.
5 29.57 2.57 32.14 EN13 G4-EN13 (EN) Environment
Biodiversity Habitats protected or restored.
6 45.14 2.48 47.62 PR1 G4-PR1 (Data points
moved to Guidance)
(PR) Product
Responsibility
Customer Health and
Safety
Life cycle stages in which health and safety impacts of products and services are assessed for improvement, and percentage of significant products and services categories subject to such procedures.
7 32.54 1.98 34.52 HR3 G4-HR2 (HR) Human Rights
Investment and
Procurement Practices
Total hours of employee training on policies and procedures concerning aspects of Human Rights (HR) that are relevant to operations, including the percentage of employees trained.
8 48.19 1.81 50.00 HR7 H4-HR6 (HR) Human Rights
Prevention of Forced
and Compulsory
Labor
Operations and significant suppliers identified as having significant risk for incidents of forced or compulsory labor, and measures to contribute to the elimination of all forms of forced or compulsory labor.
9 39.25 1.24 40.48 HR2 G4-HR10 (HR) Human Rights
Investment and
Procurement Practices
Percentage of significant suppliers, contractors, and other business partners that have undergone Human Rights (HR) screening and actions taken.
10 23.80 1.21 25.00 EN27 G4-EN28 (EN) Environment
Products and Services
Percentage of products sold and their packaging materials that are reclaimed by category.
Page 148

BOTTOM 10 INDICATORS | The Technology Hardware Sector | Get All 84: www.ga-institute.com/getall84
Sustainability – What Matters? | Governance & Accountability Institute, Inc. 0 — 50 — 100
Rank All Sector Score
Diff Difference
Sector Sector Score
G3.1 Indicator
G4 Indicator
Category Aspect Description
75 54.37 -12.70 41.67 EC3 G4-EC3 (EC) Economic
Economic Performance
Coverage of the organization's defined benefit plan obligations.
76 52.09 -12.80 39.29 SO5 Entire Indicator Moved to Guidance
(SO) Society
Public Policy Public policy positions and participation in public policy development and lobbying.
77 44.74 -13.78 30.95 PR9 G4-PR9 (PR) Product
Responsibility
Compliance Monetary value of significant fines for non-compliance with laws and regulations concerning the provision and use of products and services.
78 46.31 -14.16 32.14 EC4 G4-EC4 (EC) Economic
Economic Performance
Significant financial assistance received from government.
79 56.42 -14.75 41.67 EN28 G4-EN29 (EN) Environment
Compliance Monetary value of significant fines and total number of non-monetary sanctions for non-compliance with environmental laws and regulations.
80 48.23 -14.89 33.33 SO1 Gf-SO1 (SO) Society
Local Communities
Percentage of operations with implemented local community engagement, impact assessments, and development programs.
81 68.62 -15.04 53.57 EC1 G4-EC1 (EC) Economic
Economic Performance
Direct economic value generated and distributed, including revenues, operating costs, employee compensation, donations and other community investments, retained earnings, and payments to capital providers and governments.
82 66.41 -15.22 51.19 LA1 G4-10 (Moved to
'Organizational Profile' in G4)
(LA) Labor
Practices and Decent Work
Employment Total workforce by employment type, employment contract, and region, broken down by gender.
83 56.42 -15.94 40.48 LA4 G4-11 (Moved to
'Organizational Profile' in G4)
(LA) Labor
Practices and Decent Work
Labor / Management
Relations
Percentage of employees covered by collective bargaining agreements.
84 50.24 -18.09 32.14 HR4 G4-HR3 (HR) Human Rights
Non- Discrim-ination
Total number of incidents of discrimination and corrective actions taken.
Page 149

sustainability — what matters? The Telecommunications Sector

The Telecommunications Sector
Sustainability – What Matters? | Governance & Accountability Institute, Inc.
“WE ALSO WORK TO DEMONSTRATE THE POSITIVE ROLE OF TECHNOLOGY, WHERE IT CAN SHAPE LOW-CARBON ECONOMIES,
INCREASE ACCESS TO EDUCATION, AND SUPPORT OTHER HUMANITARIAN ISSUES SUCH AS REFUGEES, PEACE AND CONFLICT
RESOLUTION, AND DISASTER RESPONSE.” — Hans Vestberg, President and CEO, Ericcson
“AT&T is working diligently to insulate our operations from increasing water scarcity and
rising water costs. We’re focused on reducing our water use today.” — John Schulz, Director Sustainability Operations, AT&T
“WE HOPE THAT THIS WILL HELP OUR ECOSYSTEM OF
STAKEHOLDERS ACHIEVE A MORE HOLISTIC UNDERSTANDING
OF HOW SUSTAINABILITY IMPACTS OUR BUSINESS AND HOW
WE MANAGE ITS 360 DEGREES , INTERCONNECTED CONSEQUENCES.”
— Robert Collymore, CEO, Safaricom Limited
“WE ARE ALSO COLLECTING MOBILE
PHONES FOR RE-USE OR SAFE
DISMANTLING, WITH OVER ONE
MILLION MOBILE PHONES RECYCLED ."
— Stéphane Richard, Chairman & CEO,
France Telecom – Orange
“Access to connectivity has the potential to transform education and healthcare, and accelerate economic growth and job creation.” — Peter Moyo, Chairman, Vodacom
“We are committed to protecting our customers’
privacy and providing multiple security and safety solutions.” — Dan Hesse, CEO, Sprint
“WE BELIEVE THAT BARRIERS TO
COMMUNICATION SHOULD BE MINIMIZED
WHICH IS WHY WE DEVOTE PARTICULAR
ATTENTION TO SUPPORTING THE
DISADVANTAGED .”
— Sergey Soldatenkov, Chairman of the
Board of Directors, MegaFon
“WE ENFORCE STRICT CONTROLS ON THE PROTECTION AND USE OF PERSONAL INFORMATION WITHIN OUR SYSTEMS, AND ARE A LEADER IN SUPPORTING AWARENESS AND EDUCATION FOR YOUTH AND PARENTS ON INTERNET SAFETY.” — George Cope, President and Chief Executive Officer, Bell Canada
“Investors look for companies that produce good financial results, but more and more they also want
to know how they get those results.” — Ben Verwaayen, CEO, Alcatel–Lucent
“WE BELIEVE THERE IS A SYMBIOTIC RELATIONSHIP BETWEEN OUR COMPANY, OUR TEAM AND THE HEALTH OF OUR COMMUNITIES, AND THAT
IT IS INCUMBENT UPON US TO CONDUCT BUSINESS IN A SOCIALLY RESPONSIBLE MANNER WHILST GIVING BACK TO THE COMMUNITIES
WHERE OUR CUSTOMERS AND TEAM MEMBERS WORK, LIVE AND SERVE.” — Darren Entwistle, President and CEO, Telus
Page 151
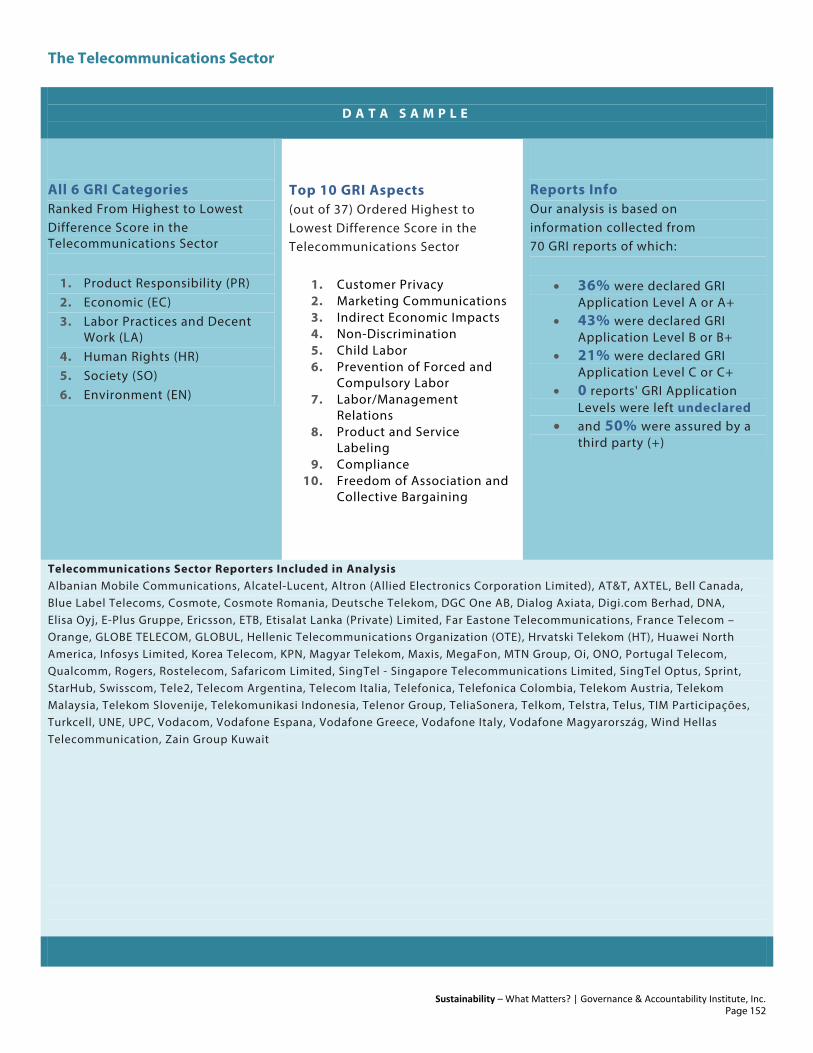
The Telecommunications Sector
Sustainability – What Matters? | Governance & Accountability Institute, Inc.
D A T A S A M P L E
All 6 GRI Categories Ranked From Highest to Lowest Difference Score in the Telecommunications Sector
1. Product Responsibility (PR) 2. Economic (EC) 3. Labor Practices and Decent
Work (LA) 4. Human Rights (HR) 5. Society (SO) 6. Environment (EN)
Top 10 GRI Aspects (out of 37) Ordered Highest to Lowest Difference Score in the Telecommunications Sector
1. Customer Privacy 2. Marketing Communications 3. Indirect Economic Impacts 4. Non-Discrimination 5. Child Labor 6. Prevention of Forced and
Compulsory Labor 7. Labor/Management
Relations 8. Product and Service
Labeling 9. Compliance
10. Freedom of Association and Collective Bargaining
Reports Info Our analysis is based on information collected from 70 GRI reports of which:
• 36% were declared GRI Application Level A or A+
• 43% were declared GRI Application Level B or B+
• 21% were declared GRI Application Level C or C+
• 0 reports' GRI Application Levels were left undeclared
• and 50% were assured by a third party (+)
Telecommunications Sector Reporters Included in Analysis Albanian Mobile Communications, Alcatel-Lucent, Altron (Allied Electronics Corporation Limited), AT&T, AXTEL, Bell Canada, Blue Label Telecoms, Cosmote, Cosmote Romania, Deutsche Telekom, DGC One AB, Dialog Axiata, Digi.com Berhad, DNA, Elisa Oyj, E-Plus Gruppe, Ericsson, ETB, Etisalat Lanka (Private) Limited, Far Eastone Telecommunications, France Telecom – Orange, GLOBE TELECOM, GLOBUL, Hellenic Telecommunications Organization (OTE), Hrvatski Telekom (HT), Huawei North America, Infosys Limited, Korea Telecom, KPN, Magyar Telekom, Maxis, MegaFon, MTN Group, Oi, ONO, Portugal Telecom, Qualcomm, Rogers, Rostelecom, Safaricom Limited, SingTel - Singapore Telecommunications Limited, SingTel Optus, Sprint, StarHub, Swisscom, Tele2, Telecom Argentina, Telecom Italia, Telefonica, Telefonica Colombia, Telekom Austria, Telekom Malaysia, Telekom Slovenije, Telekomunikasi Indonesia, Telenor Group, TeliaSonera, Telkom, Telstra, Telus, TIM Participações, Turkcell, UNE, UPC, Vodacom, Vodafone Espana, Vodafone Greece, Vodafone Italy, Vodafone Magyarország, Wind Hellas Telecommunication, Zain Group Kuwait
Page 152
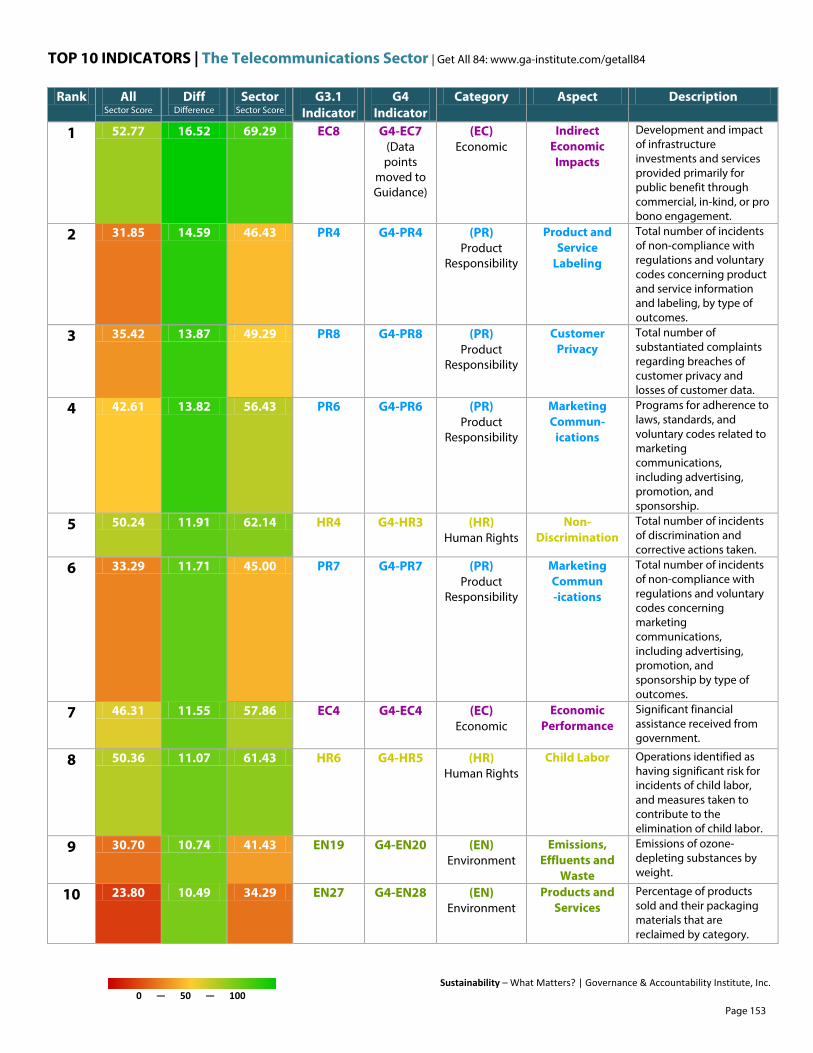
TOP 10 INDICATORS | The Telecommunications Sector | Get All 84: www.ga-institute.com/getall84
Sustainability – What Matters? | Governance & Accountability Institute, Inc. 0 — 50 — 100
Rank All Sector Score
Diff Difference
Sector Sector Score
G3.1 Indicator
G4 Indicator
Category Aspect Description
1 52.77 16.52 69.29 EC8 G4-EC7 (Data points
moved to Guidance)
(EC) Economic
Indirect Economic Impacts
Development and impact of infrastructure investments and services provided primarily for public benefit through commercial, in-kind, or pro bono engagement.
2 31.85 14.59 46.43 PR4 G4-PR4 (PR) Product
Responsibility
Product and Service
Labeling
Total number of incidents of non-compliance with regulations and voluntary codes concerning product and service information and labeling, by type of outcomes.
3 35.42 13.87 49.29 PR8 G4-PR8 (PR) Product
Responsibility
Customer Privacy
Total number of substantiated complaints regarding breaches of customer privacy and losses of customer data.
4 42.61 13.82 56.43 PR6 G4-PR6 (PR) Product
Responsibility
Marketing Commun-
ications
Programs for adherence to laws, standards, and voluntary codes related to marketing communications, including advertising, promotion, and sponsorship.
5 50.24 11.91 62.14 HR4 G4-HR3 (HR) Human Rights
Non-Discrimination
Total number of incidents of discrimination and corrective actions taken.
6 33.29 11.71 45.00 PR7 G4-PR7 (PR) Product
Responsibility
Marketing Commun -ications
Total number of incidents of non-compliance with regulations and voluntary codes concerning marketing communications, including advertising, promotion, and sponsorship by type of outcomes.
7 46.31 11.55 57.86 EC4 G4-EC4 (EC) Economic
Economic Performance
Significant financial assistance received from government.
8 50.36 11.07 61.43 HR6 G4-HR5 (HR) Human Rights
Child Labor Operations identified as having significant risk for incidents of child labor, and measures taken to contribute to the elimination of child labor.
9 30.70 10.74 41.43 EN19 G4-EN20 (EN) Environment
Emissions, Effluents and
Waste
Emissions of ozone-depleting substances by weight.
10 23.80 10.49 34.29 EN27 G4-EN28 (EN) Environment
Products and Services
Percentage of products sold and their packaging materials that are reclaimed by category.
Page 153

BOTTOM 10 INDICATORS | The Telecommunications Sector | Get All 84: www.ga-institute.com/getall84
Sustainability – What Matters? | Governance & Accountability Institute, Inc. 0 — 50 — 100
Rank All Sector Score
Diff Difference
Sector Sector Score
G3.1 Indicator
G4 Indicator
Category Aspect Description
75 45.14 -1.56 43.57 PR1 G4-PR1 (Data points
moved to Guidance)
(PR) Product
Responsibility
Customer Health and
Safety
Life cycle stages in which health and safety impacts of products and services are assessed for improvement, and percentage of significant products and services categories subject to such procedures.
76 50.92 -1.63 49.29 SO3 G4-SO4 (SO) Society
Corruption Percentage of employees trained in organization's anti-corruption policies and procedures.
77 31.02 -1.73 29.29 EN10 G4-EN10 (EN) Environment
Water Percentage and total volume of water recycled and reused.
78 33.31 -1.87 31.43 EN14 Entire Indicator Moved to Guidance
(EN) Environment
Biodiversity Strategies, current actions, and future plans for managing impacts on biodiversity.
79 36.20 -1.91 34.29 EN2 G4-EN2 (EN) Environment
Materials Percentage of materials used that are recycled input materials.
80 18.54 -2.11 16.43 EN15 G4-EN14 (EN) Environment
Biodiversity Number of IUCN Red List species and national conservation list species with habitats in areas affected by operations, by level of extinction risk.
81 43.70 -5.12 38.57 EN1 G4-EN1 (EN) Environment
Materials Materials used by weight or volume.
82 29.57 -6.71 22.86 EN13 G4-EN13 (EN) Environment
Biodiversity Habitats protected or restored.
83 30.82 -10.10 20.71 EN30 G4-EN31, G4-EN32, G4-EN33, G4-EN34
(EN) Environment
Overall (Environmental)
Total environmental protection expenditures and investments by type.
84 37.52 -11.09 26.43 EN20 G4-EN21 (EN) Environment
Emissions, Effluents and
Waste
NOx, SOx, and other significant air emissions by type and weight.
Page 154

sustainability — what matters? The Textiles and Apparel Sector
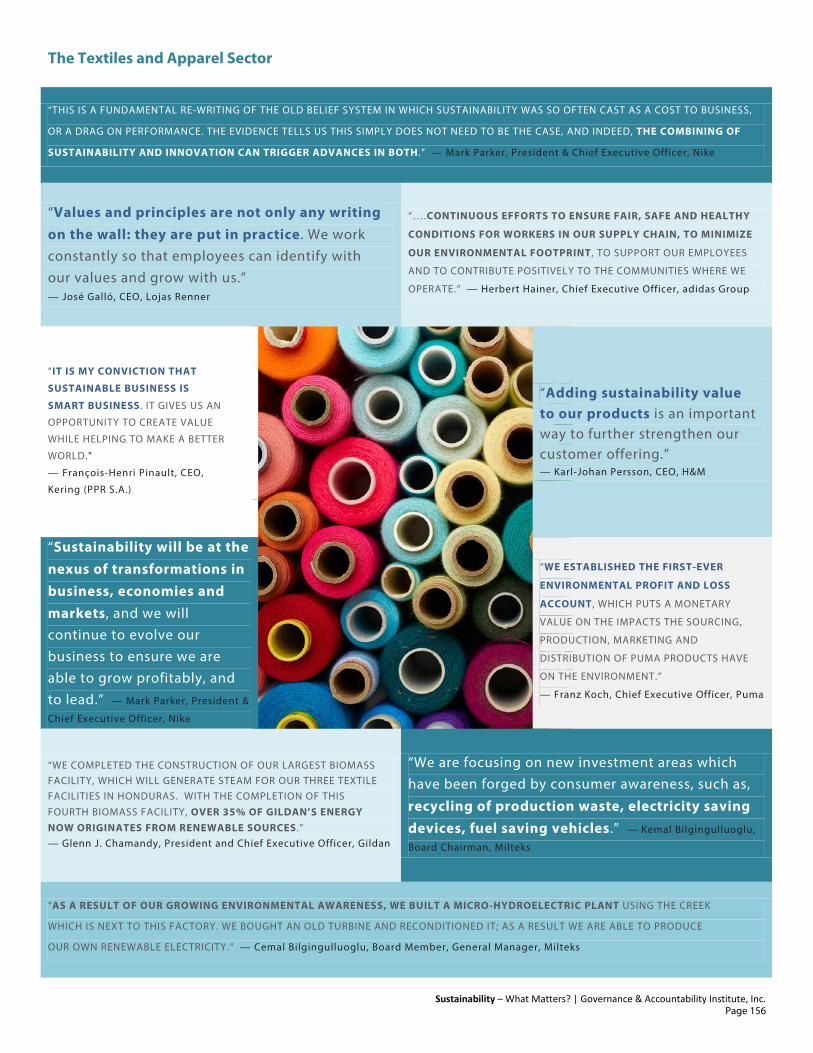
The Textiles and Apparel Sector
Sustainability – What Matters? | Governance & Accountability Institute, Inc.
“THIS IS A FUNDAMENTAL RE-WRITING OF THE OLD BELIEF SYSTEM IN WHICH SUSTAINABILITY WAS SO OFTEN CAST AS A COST TO BUSINESS,
OR A DRAG ON PERFORMANCE. THE EVIDENCE TELLS US THIS SIMPLY DOES NOT NEED TO BE THE CASE, AND INDEED, THE COMBINING OF
SUSTAINABILITY AND INNOVATION CAN TRIGGER ADVANCES IN BOTH .” — Mark Parker, President & Chief Executive Officer, Nike
“Values and principles are not only any writing on the wall: they are put in practice. We work constantly so that employees can identify with our values and grow with us.” — José Galló, CEO, Lojas Renner
“….CONTINUOUS EFFORTS TO ENSURE FAIR, SAFE AND HEALTHY
CONDITIONS FOR WORKERS IN OUR SUPPLY CHAIN, TO MINIMIZE
OUR ENVIRONMENTAL FOOTPRINT , TO SUPPORT OUR EMPLOYEES
AND TO CONTRIBUTE POSITIVELY TO THE COMMUNITIES WHERE WE
OPERATE.” — Herbert Hainer, Chief Executive Officer, adidas Group
“IT IS MY CONVICTION THAT
SUSTAINABLE BUSINESS IS
SMART BUSINESS. IT GIVES US AN
OPPORTUNITY TO CREATE VALUE
WHILE HELPING TO MAKE A BETTER
WORLD."
— François-Henri Pinault, CEO,
Kering (PPR S.A.)
“Adding sustainability value to our products is an important way to further strengthen our customer offering.” — Karl-Johan Persson, CEO, H&M
“Sustainability will be at the nexus of transformations in business, economies and markets, and we will continue to evolve our business to ensure we are able to grow profitably, and to lead.” — Mark Parker, President &
Chief Executive Officer, Nike
“WE ESTABLISHED THE FIRST-EVER
ENVIRONMENTAL PROFIT AND LOSS
ACCOUNT, WHICH PUTS A MONETARY
VALUE ON THE IMPACTS THE SOURCING,
PRODUCTION, MARKETING AND
DISTRIBUTION OF PUMA PRODUCTS HAVE
ON THE ENVIRONMENT.”
— Franz Koch, Chief Executive Officer, Puma
“WE COMPLETED THE CONSTRUCTION OF OUR LARGEST BIOMASS FACILITY, WHICH WILL GENERATE STEAM FOR OUR THREE TEXTILE FACILITIES IN HONDURAS. WITH THE COMPLETION OF THIS FOURTH BIOMASS FACILITY, OVER 35% OF GILDAN’S ENERGY NOW ORIGINATES FROM RENEWABLE SOURCES .” — Glenn J. Chamandy, President and Chief Executive Officer, Gildan
“We are focusing on new investment areas which have been forged by consumer awareness, such as,
recycling of production waste, electricity saving devices, fuel saving vehicles.” — Kemal Bilgingulluoglu,
Board Chairman, Milteks
“AS A RESULT OF OUR GROWING ENVIRONMENTAL AWARENESS, WE BUILT A MICRO-HYDROELECTRIC PLANT USING THE CREEK
WHICH IS NEXT TO THIS FACTORY. WE BOUGHT AN OLD TURBINE AND RECONDITIONED IT; AS A RESULT WE ARE ABLE TO PRODUCE
OUR OWN RENEWABLE ELECTRICITY.” — Cemal Bilgingulluoglu, Board Member, General Manager, Milteks
Page 156

The Textiles and Apparel Sector
Sustainability – What Matters? | Governance & Accountability Institute, Inc.
D A T A S A M P L E
All 6 GRI Categories Ranked From Highest to Lowest Difference Score in the Textiles and Apparel Sector
1. (HR) Human Rights 2. (EC) Economic 3. (PR) Product Responsibility 4. (EN) Environment 5. (LA) Labor Practices and
Decent Work 6. (SO) Society
Top 10 GRI Aspects (out of 37) Ordered Highest to Lowest Difference Score in the Textiles and Apparel Sector
1. Transport 2. Prevention of Forced and
Compulsory Labor 3. Child Labor 4. Investment and
Procurement Practices 5. Freedom of Association and
Collective Bargaining 6. Customer Health and Safety 7. Security Practices 8. Customer Privacy 9. Diversity and Equal
Opportunity 10. Non-Discrimination
Reports Info Our analysis is based on information collected from 12 GRI reports of which:
• 25% were declared GRI Application Level A or A+
• 58% were declared GRI Application Level B or B+
• 17% were declared GRI Application Level C or C+
• 0 report’s GRI Application Levels were left undeclared
• and 25% were assured by a third party (+)
Textiles and Apparel Sector Reporters Included in Analysis adidas Group, American Eagle Outfitters, CALIDA, Gildan, H&M (Hennes & Mauritz), Lojas Renner S.A., Milteks, Nike, PPR SA, Puma, SLN Tekstil ve Moda San.Tic.Ltd.Sti., The Timberland Company
Page 157

TOP 10 INDICATORS | The Textiles and Apparel Sector | Get All 84: www.ga-institute.com/getall84
Sustainability – What Matters? | Governance & Accountability Institute, Inc. 0 — 50 — 100
Rank All Sector Score
Diff Difference
Sector Sector Score
G3.1 Indicator
G4 Indicator
Category Aspect Description
1 39.25 35.76 75.00 HR2 G4-HR10 (HR) Human Rights
Investment and
Procurement Practices
Percentage of significant suppliers, contractors, and other business partners that have undergone Human Rights (HR) screening and actions taken.
2 55.90 23.27 79.17 EN26 G4-EN27 (EN) Environment
Products and Services
Initiatives to mitigate environmental impacts of products and services, and extent of impact mitigation.
3 35.51 22.82 58.33 EN29 G4-EN30 (EN) Environment
Transport Significant environmental impacts of transporting products and other goods and materials used for the organization's operations, and transporting members of the workforce.
4 48.19 22.64 70.83 HR7 H4-HR6 (HR) Human Rights
Prevention of Forced and
Compulsory Labor
Operations and significant suppliers identified as having significant risk for incidents of forced or compulsory labor, and measures to contribute to the elimination of all forms of forced or compulsory labor.
5 50.36 20.48 70.83 HR6 G4-HR5 (HR) Human Rights
Child Labor Operations identified as having significant risk for incidents of child labor, and measures taken to contribute to the elimination of child labor.
6 44.78 17.72 62.50 HR5 G4-HR4 (HR) Human Rights
Freedom of Association
and Collective
Bargaining
Operations and significant suppliers identified in which the right to exercise freedom of association and collective bargaining may be at significant risk, and actions taken to support these rights.
7 54.94 15.90 70.83 EN18 G4-EN19 (EN) Environment
Emissions, Effluents and
Waste
Initiatives to reduce greenhouse gas emissions and reductions achieved.
8 45.14 13.20 58.33 PR1 G4-PR1 (Data points
moved to Guidance)
(PR) Product
Responsibility
Customer Health and
Safety
Life cycle stages in which health and safety impacts of products and services are assessed for improvement, and percentage of significant products and services categories subject to such procedures.
9 49.88 12.63 62.50 LA11 G4-LA10 (LA) Labor
Practices and Decent Work
Training and Education
Programs for skills management and lifelong learning that support the continued employability of employees and assist them in managing career endings.
10 33.35 12.49 45.83 HR1 G4-HR1 (HR) Human Rights
Investment and
Procurement Practices
Percentage and total number of significant investment agreements and contracts that include Human Rights (HR) clauses or that have undergone Human Rights (HR) screening.
Page 158
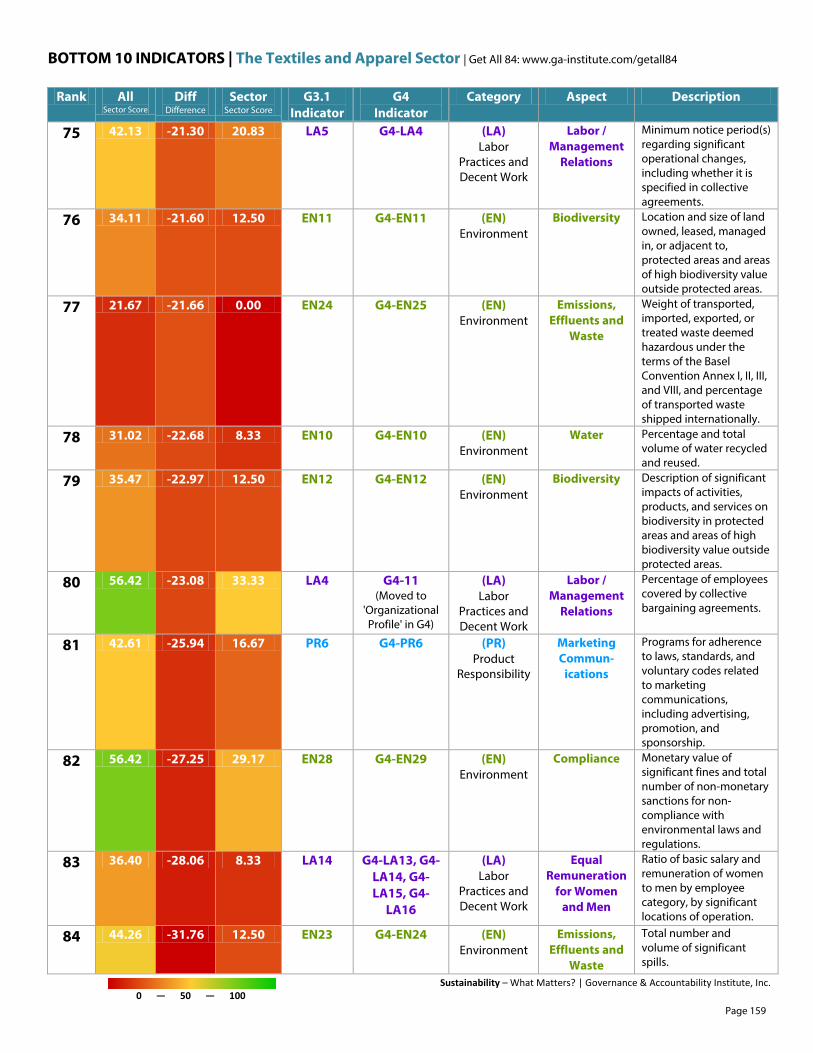
BOTTOM 10 INDICATORS | The Textiles and Apparel Sector | Get All 84: www.ga-institute.com/getall84
Sustainability – What Matters? | Governance & Accountability Institute, Inc. 0 — 50 — 100
Rank All Sector Score
Diff Difference
Sector Sector Score
G3.1 Indicator
G4 Indicator
Category Aspect Description
75 42.13 -21.30 20.83 LA5 G4-LA4 (LA) Labor
Practices and Decent Work
Labor / Management
Relations
Minimum notice period(s) regarding significant operational changes, including whether it is specified in collective agreements.
76 34.11 -21.60 12.50 EN11 G4-EN11 (EN) Environment
Biodiversity Location and size of land owned, leased, managed in, or adjacent to, protected areas and areas of high biodiversity value outside protected areas.
77 21.67 -21.66 0.00 EN24 G4-EN25 (EN) Environment
Emissions, Effluents and
Waste
Weight of transported, imported, exported, or treated waste deemed hazardous under the terms of the Basel Convention Annex I, II, III, and VIII, and percentage of transported waste shipped internationally.
78 31.02 -22.68 8.33 EN10 G4-EN10 (EN) Environment
Water Percentage and total volume of water recycled and reused.
79 35.47 -22.97 12.50 EN12 G4-EN12 (EN) Environment
Biodiversity Description of significant impacts of activities, products, and services on biodiversity in protected areas and areas of high biodiversity value outside protected areas.
80 56.42 -23.08 33.33 LA4 G4-11 (Moved to
'Organizational Profile' in G4)
(LA) Labor
Practices and Decent Work
Labor / Management
Relations
Percentage of employees covered by collective bargaining agreements.
81 42.61 -25.94 16.67 PR6 G4-PR6 (PR) Product
Responsibility
Marketing Commun-
ications
Programs for adherence to laws, standards, and voluntary codes related to marketing communications, including advertising, promotion, and sponsorship.
82 56.42 -27.25 29.17 EN28 G4-EN29 (EN) Environment
Compliance Monetary value of significant fines and total number of non-monetary sanctions for non-compliance with environmental laws and regulations.
83 36.40 -28.06 8.33 LA14 G4-LA13, G4-LA14, G4-LA15, G4-
LA16
(LA) Labor
Practices and Decent Work
Equal Remuneration
for Women and Men
Ratio of basic salary and remuneration of women to men by employee category, by significant locations of operation.
84 44.26 -31.76 12.50 EN23 G4-EN24 (EN) Environment
Emissions, Effluents and
Waste
Total number and volume of significant spills.
Page 159

sustainability — what matters? The Tobacco Sector

The Tobacco Sector
Sustainability – What Matters? | Governance & Accountability Institute, Inc.
“[F]OR SEVERAL YEARS WE HAVE PUT IN PLACE VARIOUS INITIATIVES TO HELP MITIGATE OUR IMPACT ON BIODIVERSITY, TO LIMIT AND
REDUCE DEFORESTATION IN OUR LEAF GROWING OPERATIONS AND TO IMPROVE EFFICIENCIES RELATING TO ENERGY AND WATER USE.
IN THE SUPPLY CHAIN IT’S IMPORTANT TO ENSURE THAT THE RIGHTS OF TOBACCO FARMERS ARE RESPECTED AND THAT THE INDUSTRY AND
STAKEHOLDERS WORK TOGETHER TO TACKLE CHILD LABOUR.” — Nicandro Durante, Chief Executive, British American Tobacco Holdings
“We […] actively work with governments, non- governmental organisations
and other stakeholders on issues of common concern, such as the illicit trade of tobacco products
and protecting natural resources, which underpins our long-term sustainability.” — Iain Napier, Chairman, Imperial
Tobacco
“We will strive to create more value
to our customers by interacting
with and supporting socially
disadvantaged groups [through]
cultural and scholarship
programs.”— Young-Jin Min, CEO, KT&G
“BEING WITHIN THE TOBACCO INDUSTRY, WE FACE MANY CHALLENGES AS REGULATIONS BECOME TOUGHER AND SOCIAL EXPECTATIONS OF THE TOBACCO INDUSTRY GET HIGHER. YOUTH SMOKING IS ALSO A GROWING CONCERN IN KOREA. WE’RE WORKING HARD TO ADDRESS THIS, BOTH DIRECTLY WITH RETAILERS AND TOGETHER WITH OTHER TOBACCO COMPANIES THROUGH A YOUTH SMOKING PREVENTION CAMPAIGN.” — Stephan Liechti, General Manager, British American Tobacco (Korea)
“… WE WORKED TO IMPROVE OUR COMMUNICATIONS EFFORTS WITH REGARD TO ACTIVITIES CONCERNING OUR EMPLOYEES, OUR PRODUCTS,
THE ENVIRONMENT, AND OUR COMMUNITY EFFORTS. WE ALSO EMBARKED ON A MORE DETAILED TARGET SETTING PROCESS, WITH A FOCUS
ON ENERGY CONSUMPTION, AND WORKED TO REDUCE THE USE OF MATERIALS IN BOTH OUR PRODUCTION FACILITIES AND OFFICES.
NOT ONLY DOES THIS IMPROVE OUR LONG TERM ENVIRONMENTAL FOOTPRINT BUT IT ALSO HELPS TO REDUCE COSTS. WE CONTINUED
OUR IMPORTANT EFFORTS TO ENGAGE WITH AND CONTRIBUTE TO THE COMMUNITIES IN WHICH WE OPERATE, AND TO MAINTAIN DIALOGUE
WITH OUR MOST IMPORTANT SUPPLIERS AND PARTNERS WITH REGARD TO SOCIAL, ECONOMIC, AND ENVIRONMENTAL MATTERS.”
— Lars Dahlgren, President and CEO, Swedish Match
Page 161

The Tobacco Sector
Sustainability – What Matters? | Governance & Accountability Institute, Inc.
D A T A S A M P L E All 6 GRI Categories Ranked From Highest to Lowest Difference Score in the Tobacco Sector
1. Product Responsibility (PR) 2. Society (SO) 3. Environment (EN) 4. Economic (EC) 5. Human Rights (HR) 6. Labor Practices and Decent
Work (LA)
Top 10 GRI Aspects (out of 37) Ordered Highest to Lowest Difference Score in the Tobacco Sector
1. Marketing Communications 2. Water 3. Materials 4. Child Labor 5. Overall (Environmental) 6. Anti-Competitive Behavior 7. Corruption 8. Product and Service
Labeling 9. Customer Privacy
10. Public Policy
Reports Info Our analysis is based on information collected from 5 GRI reports of which:
• 20% were declared GRI Application Level A or A+
• 20% were declared GRI Application Level B or B+
• 20% were declared GRI Application Level C or C+
• 2 reports' GRI Application Levels were left undeclared
• and 60% were assured by a third party (+)
Tobacco Sector Reporters Included in Analysis British American Tobacco (Holdings), British American Tobacco Korea, Imperial Tobacco, KT&G, Swedish Match
Page 162
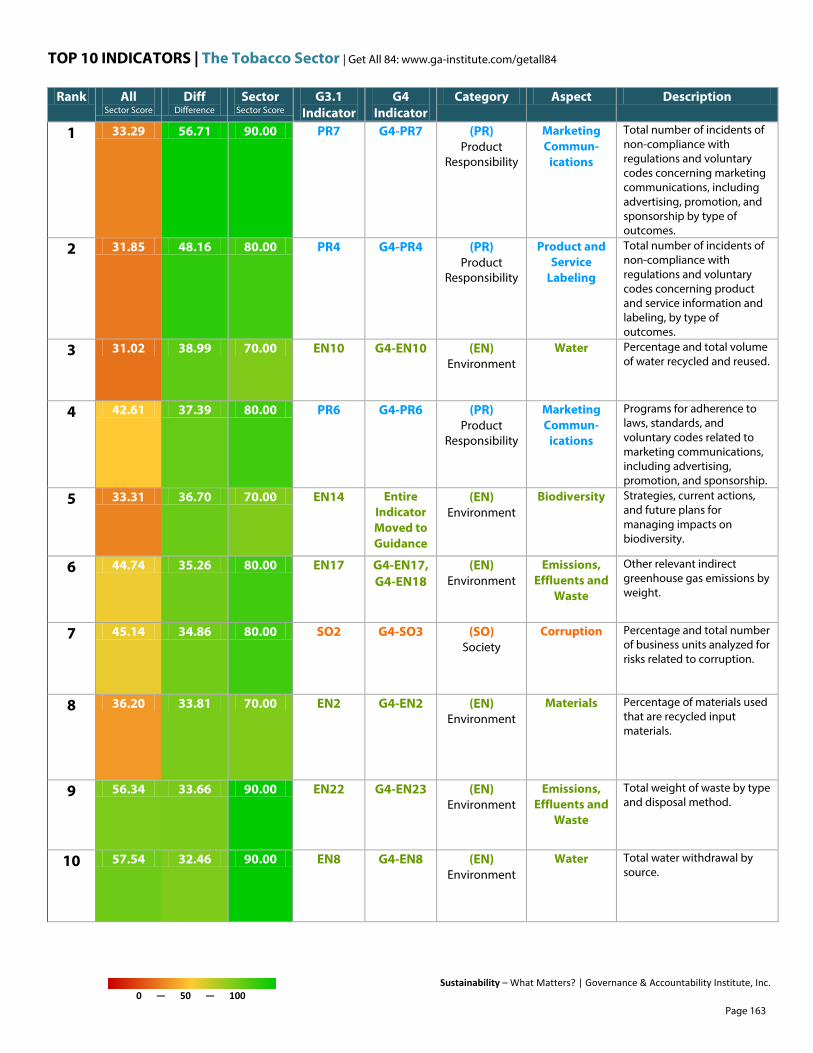
TOP 10 INDICATORS | The Tobacco Sector | Get All 84: www.ga-institute.com/getall84
Sustainability – What Matters? | Governance & Accountability Institute, Inc. 0 — 50 — 100
Rank All Sector Score
Diff Difference
Sector Sector Score
G3.1 Indicator
G4 Indicator
Category Aspect Description
1 33.29 56.71 90.00 PR7 G4-PR7 (PR) Product
Responsibility
Marketing Commun-
ications
Total number of incidents of non-compliance with regulations and voluntary codes concerning marketing communications, including advertising, promotion, and sponsorship by type of outcomes.
2 31.85 48.16 80.00 PR4 G4-PR4 (PR) Product
Responsibility
Product and Service
Labeling
Total number of incidents of non-compliance with regulations and voluntary codes concerning product and service information and labeling, by type of outcomes.
3 31.02 38.99 70.00 EN10 G4-EN10 (EN) Environment
Water Percentage and total volume of water recycled and reused.
4 42.61 37.39 80.00 PR6 G4-PR6 (PR) Product
Responsibility
Marketing Commun-
ications
Programs for adherence to laws, standards, and voluntary codes related to marketing communications, including advertising, promotion, and sponsorship.
5 33.31 36.70 70.00 EN14 Entire Indicator Moved to Guidance
(EN) Environment
Biodiversity Strategies, current actions, and future plans for managing impacts on biodiversity.
6 44.74 35.26 80.00 EN17 G4-EN17, G4-EN18
(EN) Environment
Emissions, Effluents and
Waste
Other relevant indirect greenhouse gas emissions by weight.
7 45.14 34.86 80.00 SO2 G4-SO3 (SO) Society
Corruption Percentage and total number of business units analyzed for risks related to corruption.
8 36.20 33.81 70.00 EN2 G4-EN2 (EN) Environment
Materials Percentage of materials used that are recycled input materials.
9 56.34 33.66 90.00 EN22 G4-EN23 (EN) Environment
Emissions, Effluents and
Waste
Total weight of waste by type and disposal method.
10 57.54 32.46 90.00 EN8 G4-EN8 (EN) Environment
Water Total water withdrawal by source.
Page 163

BOTTOM 10 INDICATORS | The Tobacco Sector | Get All 84: www.ga-institute.com/getall84
Sustainability – What Matters? | Governance & Accountability Institute, Inc. 0 — 50 — 100
Rank All Sector Score
Diff Difference
Sector Sector Score
G3.1 Indicator
G4 Indicator
Category Aspect Description
75 35.51 -15.51 20.00 EN29 G4-EN30 (EN) Environment
Transport Significant environmental impacts of transporting products and other goods and materials used for the organization's operations, and transporting members of the workforce.
76 46.31 -16.30 30.00 EC4 G4-EC4 (EC) Economic
Economic Performance
Significant financial assistance received from government.
77 66.41 -16.41 50.00 LA1 G4-10 (Moved to
'Organizational Profile' in G4)
(LA) Labor
Practices and Decent
Work
Employment Total workforce by employment type, employment contract, and region, broken down by gender.
78 37.52 -17.51 20.00 EN20 G4-EN21 (EN) Environment
Emissions, Effluents and
Waste
NOx, SOx, and other significant air emissions by type and weight.
79 48.23 -18.23 30.00 SO1 Gf-SO1 (SO) Society
Local Communities
Percentage of operations with implemented local community engagement, impact assessments, and development programs.
80 48.48 -18.47 30.00 EN6 G4-EN7 (EN) Environment
Energy Initiatives to provide energy-efficient or renewable energy based products and services, and reductions in energy requirements as a result of these initiatives.
81 51.04 -21.04 30.00 LA10 G4-LA9 (LA) Labor
Practices and Decent
Work
Training and Education
Average hours of training per year per employee by gender, and by employee category.
82 52.77 -22.76 30.00 EC8 G4-EC7 (Data points
moved to Guidance)
(EC) Economic
Indirect Economic Impacts
Development and impact of infrastructure investments and services provided primarily for public benefit through commercial, in-kind, or pro bono engagement.
83 53.05 -23.04 30.00 EN5 G4-EN6 (EN) Environment
Energy Energy saved due to conservation and efficiency improvements.
84 55.90 -25.89 30.00 EN26 G4-EN27 (EN) Environment
Products and Services
Initiatives to mitigate environmental impacts of products and services, and extent of impact mitigation.
Page 164

sustainability — what matters? The Travel and Tourism Sector
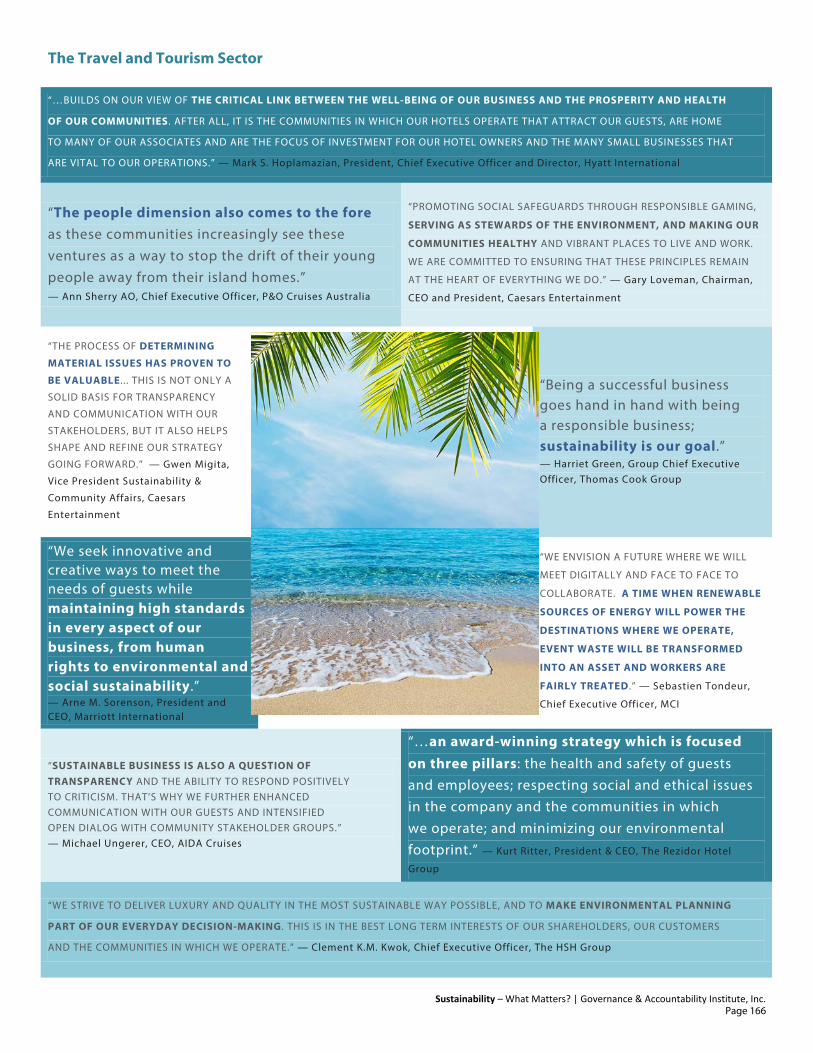
The Travel and Tourism Sector
Sustainability – What Matters? | Governance & Accountability Institute, Inc.
“…BUILDS ON OUR VIEW OF THE CRITICAL LINK BETWEEN THE WELL-BEING OF OUR BUSINESS AND THE PROSPERITY AND HEALTH
OF OUR COMMUNITIES. AFTER ALL, IT IS THE COMMUNITIES IN WHICH OUR HOTELS OPERATE THAT ATTRACT OUR GUESTS, ARE HOME
TO MANY OF OUR ASSOCIATES AND ARE THE FOCUS OF INVESTMENT FOR OUR HOTEL OWNERS AND THE MANY SMALL BUSINESSES THAT
ARE VITAL TO OUR OPERATIONS.” — Mark S. Hoplamazian, President, Chief Executive Officer and Director, Hyatt International
“The people dimension also comes to the fore as these communities increasingly see these ventures as a way to stop the drift of their young people away from their island homes.” — Ann Sherry AO, Chief Executive Officer, P&O Cruises Australia
“PROMOTING SOCIAL SAFEGUARDS THROUGH RESPONSIBLE GAMING,
SERVING AS STEWARDS OF THE ENVIRONMENT, AND MAKING OUR
COMMUNITIES HEALTHY AND VIBRANT PLACES TO LIVE AND WORK.
WE ARE COMMITTED TO ENSURING THAT THESE PRINCIPLES REMAIN
AT THE HEART OF EVERYTHING WE DO.” — Gary Loveman, Chairman,
CEO and President, Caesars Entertainment
“THE PROCESS OF DETERMINING
MATERIAL ISSUES HAS PROVEN TO
BE VALUABLE. . . THIS IS NOT ONLY A
SOLID BASIS FOR TRANSPARENCY
AND COMMUNICATION WITH OUR
STAKEHOLDERS, BUT IT ALSO HELPS
SHAPE AND REFINE OUR STRATEGY
GOING FORWARD.” — Gwen Migita,
Vice President Sustainability &
Community Affairs, Caesars
Entertainment
“Being a successful business goes hand in hand with being a responsible business; sustainability is our goal.” — Harriet Green, Group Chief Executive Officer, Thomas Cook Group
“We seek innovative and creative ways to meet the needs of guests while maintaining high standards in every aspect of our business, from human rights to environmental and social sustainability.” — Arne M. Sorenson, President and CEO, Marriott International
“WE ENVISION A FUTURE WHERE WE WILL
MEET DIGITALLY AND FACE TO FACE TO
COLLABORATE. A TIME WHEN RENEWABLE
SOURCES OF ENERGY WILL POWER THE
DESTINATIONS WHERE WE OPERATE,
EVENT WASTE WILL BE TRANSFORMED
INTO AN ASSET AND WORKERS ARE
FAIRLY TREATED .” — Sebastien Tondeur,
Chief Executive Officer, MCI
“SUSTAINABLE BUSINESS IS ALSO A QUESTION OF TRANSPARENCY AND THE ABILITY TO RESPOND POSITIVELY TO CRITICISM. THAT’S WHY WE FURTHER ENHANCED COMMUNICATION WITH OUR GUESTS AND INTENSIFIED OPEN DIALOG WITH COMMUNITY STAKEHOLDER GROUPS.” — Michael Ungerer, CEO, AIDA Cruises
“…an award-winning strategy which is focused on three pillars: the health and safety of guests and employees; respecting social and ethical issues in the company and the communities in which we operate; and minimizing our environmental footprint.” — Kurt Ritter, President & CEO, The Rezidor Hotel
Group
“WE STRIVE TO DELIVER LUXURY AND QUALITY IN THE MOST SUSTAINABLE WAY POSSIBLE, AND TO MAKE ENVIRONMENTAL PLANNING
PART OF OUR EVERYDAY DECISION-MAKING . THIS IS IN THE BEST LONG TERM INTERESTS OF OUR SHAREHOLDERS, OUR CUSTOMERS
AND THE COMMUNITIES IN WHICH WE OPERATE.” — Clement K.M. Kwok, Chief Executive Officer, The HSH Group
Page 166

The Travel and Tourism Sector
Sustainability – What Matters? | Governance & Accountability Institute, Inc.
D A T A S A M P L E
All 6 GRI Categories Ranked From Highest to Lowest Difference Score in the Travel and Tourism Sector
1. Human Rights (HR) 2. Product Responsibility (PR) 3. Society (SO) 4. Labor Practices and Decent
Work (LA) 5. Environment (EN) 6. Economic (EC)
Top 10 GRI Aspects (out of 37) Ordered Highest to Lowest Difference Score in the Travel and Tourism Sector
1. Customer Privacy 2. Security Practices 3. Non-Discrimination 4. Indigenous Rights 5. Public Policy 6. Child Labor 7. Labor/Management
Relations 8. Remediation 9. Compliance
10. Customer Health and Safety
Reports Info Our analysis is based on information collected from 15 GRI reports of which:
• 20% were declared GRI Application Level A or A+
• 27% were declared GRI Application Level B or B+
• 33% were declared GRI Application Level C or C+
• 3 reports' GRI Application Levels were left undeclared
• and 40% were assured by a third party (+)
Travel and Tourism Sector Reporters Included in Analysis AIDA Cruises, Caesars Entertainment, Hyatt International, Kungliga Dramatiska Teatern, Marriott International, MCI, NH Hoteles, P&O Cruises Australia, Rezidor Hotel Group, Sol Meliá, Studiosus Reisen, The HSH Group, Thomas Cook Group, TUI AG, Unimed Campinas
Page 167

TOP 10 INDICATORS | The Travel and Tourism Sector | Get All 84: www.ga-institute.com/getall84
Sustainability – What Matters? | Governance & Accountability Institute, Inc. 0 — 50 — 100
Rank All Sector Score
Diff Difference
Sector Sector Score
G3.1 Indicator
G4 Indicator
Category Aspect Description
1 35.42 14.58 50.00 PR8 G4-PR8 (PR) Product
Responsibility
Customer Privacy
Total number of substantiated complaints regarding breaches of customer privacy and losses of customer data.
2 52.77 13.90 66.67 LA12 G4-LA11 (LA) Labor
Practices and Decent Work
Training and Education
Percentage of employees receiving regular performance and career development reviews, by gender.
3 41.05 12.29 53.33 SO6 G4-SO6 (SO) Society
Public Policy Total value of financial and in-kind contributions to political parties, politicians, and related institutions by country.
4 65.01 11.66 76.67 EN3 G4-EN3 (EN) Environment
Energy Direct energy consumption by primary energy source.
5 51.61 8.40 60.00 PR5 G4-PR5 (Data points
moved to Guidance)
(PR) Product
Responsibility
Product and Service
Labeling
Practices related to customer satisfaction, including results of surveys measuring customer satisfaction.
6 55.90 7.44 63.33 EN26 G4-EN27 (EN) Environment
Products and Services
Initiatives to mitigate environmental impacts of products and services, and extent of impact mitigation.
7 22.91 7.09 30.00 HR8 G4-HR7 (HR) Human Rights
Security Practices
Percentage of security personnel trained in the organization's policies or procedures concerning aspects of Human Rights (HR) that are relevant to operations.
8 49.68 6.99 56.67 SO8 G4-SO8, G4-SO9,
G4-SO10, G4-SO11
(SO) Society
Compliance Monetary value of significant fines and total number of non-monetary sanctions for non-compliance with laws and regulations.
9 66.41 6.93 73.33 LA1 G4-10 (Moved to
'Organizational Profile' in G4)
(LA) Labor
Practices and Decent Work
Employment Total workforce by employment type, employment contract, and region, broken down by gender.
10 33.29 6.71 40.00 PR7 G4-PR7 (PR) Product
Responsibility
Marketing Commun-
ications
Total number of incidents of non-compliance with regulations and voluntary codes concerning marketing communications, including advertising, promotion, and sponsorship by type of outcomes.
Page 168
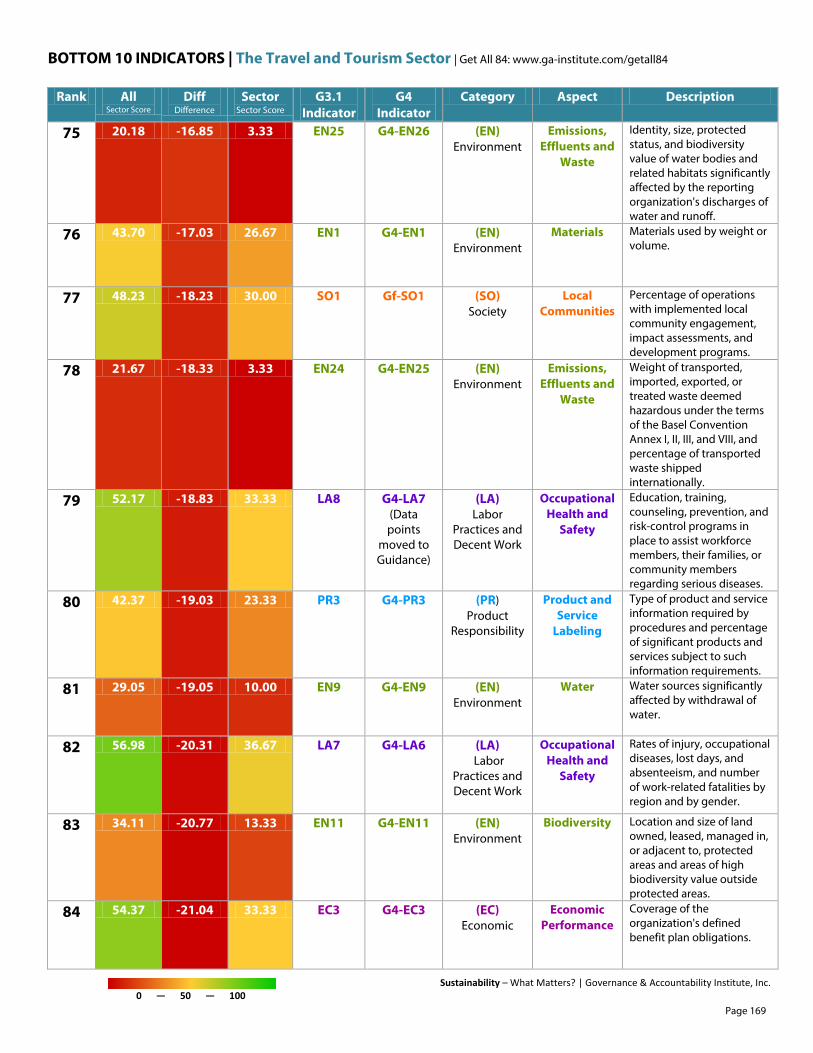
BOTTOM 10 INDICATORS | The Travel and Tourism Sector | Get All 84: www.ga-institute.com/getall84
Sustainability – What Matters? | Governance & Accountability Institute, Inc. 0 — 50 — 100
Rank All Sector Score
Diff Difference
Sector Sector Score
G3.1 Indicator
G4 Indicator
Category Aspect Description
75 20.18 -16.85 3.33 EN25 G4-EN26 (EN) Environment
Emissions, Effluents and
Waste
Identity, size, protected status, and biodiversity value of water bodies and related habitats significantly affected by the reporting organization's discharges of water and runoff.
76 43.70 -17.03 26.67 EN1 G4-EN1 (EN) Environment
Materials Materials used by weight or volume.
77 48.23 -18.23 30.00 SO1 Gf-SO1 (SO) Society
Local Communities
Percentage of operations with implemented local community engagement, impact assessments, and development programs.
78 21.67 -18.33 3.33 EN24 G4-EN25 (EN) Environment
Emissions, Effluents and
Waste
Weight of transported, imported, exported, or treated waste deemed hazardous under the terms of the Basel Convention Annex I, II, III, and VIII, and percentage of transported waste shipped internationally.
79 52.17 -18.83 33.33 LA8 G4-LA7 (Data points
moved to Guidance)
(LA) Labor
Practices and Decent Work
Occupational Health and
Safety
Education, training, counseling, prevention, and risk-control programs in place to assist workforce members, their families, or community members regarding serious diseases.
80 42.37 -19.03 23.33 PR3 G4-PR3 (PR) Product
Responsibility
Product and Service
Labeling
Type of product and service information required by procedures and percentage of significant products and services subject to such information requirements.
81 29.05 -19.05 10.00 EN9 G4-EN9 (EN) Environment
Water Water sources significantly affected by withdrawal of water.
82 56.98 -20.31 36.67 LA7 G4-LA6 (LA) Labor
Practices and Decent Work
Occupational Health and
Safety
Rates of injury, occupational diseases, lost days, and absenteeism, and number of work-related fatalities by region and by gender.
83 34.11 -20.77 13.33 EN11 G4-EN11 (EN) Environment
Biodiversity Location and size of land owned, leased, managed in, or adjacent to, protected areas and areas of high biodiversity value outside protected areas.
84 54.37 -21.04 33.33 EC3 G4-EC3 (EC) Economic
Economic Performance
Coverage of the organization's defined benefit plan obligations.
Page 169

sustainability — what matters? The Universities Sector
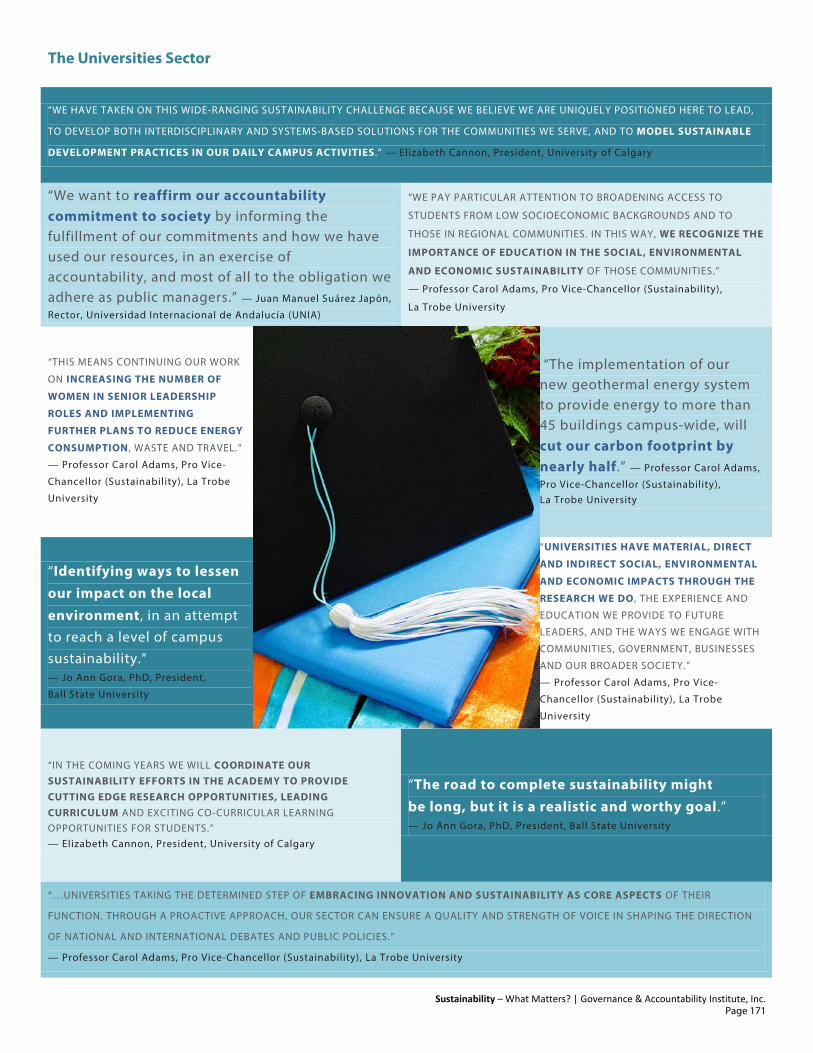
The Universities Sector
Sustainability – What Matters? | Governance & Accountability Institute, Inc.
“WE HAVE TAKEN ON THIS WIDE-RANGING SUSTAINABILITY CHALLENGE BECAUSE WE BELIEVE WE ARE UNIQUELY POSITIONED HERE TO LEAD,
TO DEVELOP BOTH INTERDISCIPLINARY AND SYSTEMS-BASED SOLUTIONS FOR THE COMMUNITIES WE SERVE, AND TO MODEL SUSTAINABLE
DEVELOPMENT PRACTICES IN OUR DAILY CAMPUS ACTIVITIES.” — Elizabeth Cannon, President, University of Calgary
“We want to reaffirm our accountability commitment to society by informing the fulfillment of our commitments and how we have used our resources, in an exercise of accountability, and most of all to the obligation we adhere as public managers.” — Juan Manuel Suárez Japón,
Rector, Universidad Internacional de Andalucía (UNIA)
“WE PAY PARTICULAR ATTENTION TO BROADENING ACCESS TO
STUDENTS FROM LOW SOCIOECONOMIC BACKGROUNDS AND TO
THOSE IN REGIONAL COMMUNITIES. IN THIS WAY, WE RECOGNIZE THE
IMPORTANCE OF EDUCATION IN THE SOCIAL, ENVIRONMENTAL
AND ECONOMIC SUSTAINABILITY OF THOSE COMMUNITIES.”
— Professor Carol Adams, Pro Vice-Chancellor (Sustainability),
La Trobe University
“THIS MEANS CONTINUING OUR WORK
ON INCREASING THE NUMBER OF
WOMEN IN SENIOR LEADERSHIP
ROLES AND IMPLEMENTING
FURTHER PLANS TO REDUCE ENERGY
CONSUMPTION , WASTE AND TRAVEL.”
— Professor Carol Adams, Pro Vice-
Chancellor (Sustainability), La Trobe
University
“The implementation of our new geothermal energy system to provide energy to more than 45 buildings campus-wide, will cut our carbon footprint by nearly half.” — Professor Carol Adams,
Pro Vice-Chancellor (Sustainability), La Trobe University
“Identifying ways to lessen our impact on the local environment, in an attempt to reach a level of campus sustainability.” — Jo Ann Gora, PhD, President,
Ball State University
“UNIVERSITIES HAVE MATERIAL, DIRECT
AND INDIRECT SOCIAL, ENVIRONMENTAL
AND ECONOMIC IMPACTS THROUGH THE
RESEARCH WE DO, THE EXPERIENCE AND
EDUCATION WE PROVIDE TO FUTURE
LEADERS, AND THE WAYS WE ENGAGE WITH
COMMUNITIES, GOVERNMENT, BUSINESSES
AND OUR BROADER SOCIETY.”
— Professor Carol Adams, Pro Vice-
Chancellor (Sustainability), La Trobe
University
“IN THE COMING YEARS WE WILL COORDINATE OUR SUSTAINABILITY EFFORTS IN THE ACADEMY TO PROVIDE CUTTING EDGE RESEARCH OPPORTUNITIES, LEADING CURRICULUM AND EXCITING CO-CURRICULAR LEARNING OPPORTUNITIES FOR STUDENTS.” — Elizabeth Cannon, President, University of Calgary
“The road to complete sustainability might be long, but it is a realistic and worthy goal.” — Jo Ann Gora, PhD, President, Ball State University
“…UNIVERSITIES TAKING THE DETERMINED STEP OF EMBRACING INNOVATION AND SUSTAINABILITY AS CORE ASPECTS OF THEIR
FUNCTION. THROUGH A PROACTIVE APPROACH, OUR SECTOR CAN ENSURE A QUALITY AND STRENGTH OF VOICE IN SHAPING THE DIRECTION
OF NATIONAL AND INTERNATIONAL DEBATES AND PUBLIC POLICIES.”
— Professor Carol Adams, Pro Vice-Chancellor (Sustainability), La Trobe University
Page 171
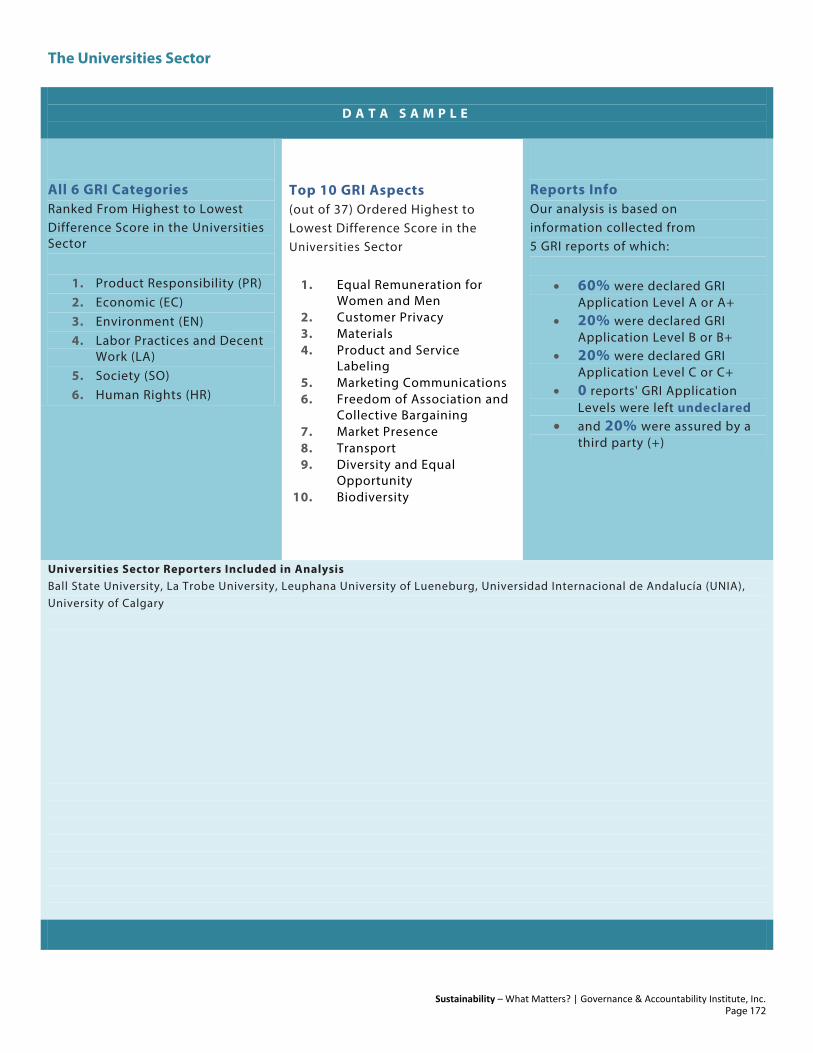
The Universities Sector
Sustainability – What Matters? | Governance & Accountability Institute, Inc.
D A T A S A M P L E
All 6 GRI Categories Ranked From Highest to Lowest Difference Score in the Universities Sector
1. Product Responsibility (PR) 2. Economic (EC) 3. Environment (EN) 4. Labor Practices and Decent
Work (LA) 5. Society (SO) 6. Human Rights (HR)
Top 10 GRI Aspects (out of 37) Ordered Highest to Lowest Difference Score in the Universities Sector
1. Equal Remuneration for Women and Men
2. Customer Privacy 3. Materials 4. Product and Service
Labeling 5. Marketing Communications 6. Freedom of Association and
Collective Bargaining 7. Market Presence 8. Transport 9. Diversity and Equal
Opportunity 10. Biodiversity
Reports Info Our analysis is based on information collected from 5 GRI reports of which:
• 60% were declared GRI Application Level A or A+
• 20% were declared GRI Application Level B or B+
• 20% were declared GRI Application Level C or C+
• 0 reports' GRI Application Levels were left undeclared
• and 20% were assured by a third party (+)
Universities Sector Reporters Included in Analysis Ball State University, La Trobe University, Leuphana University of Lueneburg, Universidad Internacional de Andalucía (UNIA), University of Calgary
Page 172

TOP 10 INDICATORS | The Universities Sector | Get All 84: www.ga-institute.com/getall84
Sustainability – What Matters? | Governance & Accountability Institute, Inc. 0 — 50 — 100
Rank All Sector Score
Diff Difference
Sector Sector Score
G3.1 Indicator
G4 Indicator
Category Aspect Description
1 36.40 23.61 60.00 LA14 G4-LA13, G4-LA14, G4-LA15, G4-LA16
(LA) Labor
Practices and Decent Work
Equal Remuneration
for Women and Men
Ratio of basic salary and remuneration of women to men by employee category, by significant locations of operation.
2 30.70 19.31 50.00 EC5 G4-EC5 (EC) Economic
Market Presence
Range of ratios of standard entry level wage compared to local minimum wage at significant locations of operation.
3 31.85 18.16 50.00 PR4 G4-PR4 (PR) Product
Responsibility
Product and Service
Labeling
Total number of incidents of non-compliance with regulations and voluntary codes concerning product and service information and labeling, by type of outcomes.
4 35.42 14.58 50.00 PR8 G4-PR8 (PR) Product
Responsibility
Customer Privacy
Total number of substantiated complaints regarding breaches of customer privacy and losses of customer data.
5 36.20 13.81 50.00 EN2 G4-EN2 (EN) Environment
Materials Percentage of materials used that are recycled input materials.
6 46.31 13.70 60.00 EC4 G4-EC4 (EC) Economic
Economic Performance
Significant financial assistance received from government.
7 29.57 10.43 40.00 EN13 G4-EN13 (EN) Environment
Biodiversity Habitats protected or restored.
8 49.68 10.33 60.00 SO8 G4-SO8, G4-SO9,
G4-SO10, G4-SO11
(SO) Society
Compliance Monetary value of significant fines and total number of non-monetary sanctions for non-compliance with laws and regulations.
9 21.67 8.34 30.00 EN24 G4-EN25 (EN) Environment
Emissions, Effluents and
Waste
Weight of transported, imported, exported, or treated waste deemed hazardous under the terms of the Basel Convention Annex I, II, III, and VIII, and percentage of transported waste shipped internationally.
10 52.09 7.92 60.00 SO5 Entire Indicator Moved to Guidance
(SO) Society
Public Policy Public policy positions and participation in public policy development and lobbying.
Page 173
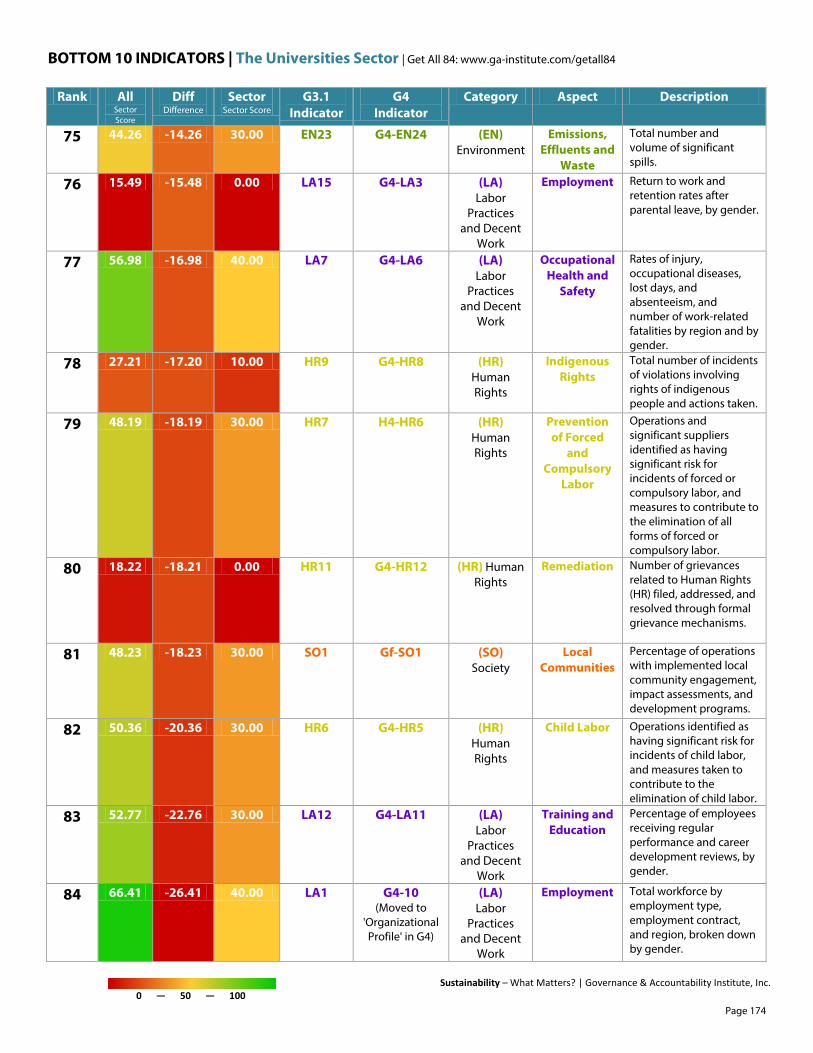
BOTTOM 10 INDICATORS | The Universities Sector | Get All 84: www.ga-institute.com/getall84
Sustainability – What Matters? | Governance & Accountability Institute, Inc. 0 — 50 — 100
Rank All Sector Score
Diff Difference
Sector Sector Score
G3.1 Indicator
G4 Indicator
Category Aspect Description
75 44.26 -14.26 30.00 EN23 G4-EN24 (EN) Environment
Emissions, Effluents and
Waste
Total number and volume of significant spills.
76 15.49 -15.48 0.00 LA15 G4-LA3 (LA) Labor
Practices and Decent
Work
Employment Return to work and retention rates after parental leave, by gender.
77 56.98 -16.98 40.00 LA7 G4-LA6 (LA) Labor
Practices and Decent
Work
Occupational Health and
Safety
Rates of injury, occupational diseases, lost days, and absenteeism, and number of work-related fatalities by region and by gender.
78 27.21 -17.20 10.00 HR9 G4-HR8 (HR) Human Rights
Indigenous Rights
Total number of incidents of violations involving rights of indigenous people and actions taken.
79 48.19 -18.19 30.00 HR7 H4-HR6 (HR) Human Rights
Prevention of Forced
and Compulsory
Labor
Operations and significant suppliers identified as having significant risk for incidents of forced or compulsory labor, and measures to contribute to the elimination of all forms of forced or compulsory labor.
80 18.22 -18.21 0.00 HR11 G4-HR12 (HR) Human Rights
Remediation Number of grievances related to Human Rights (HR) filed, addressed, and resolved through formal grievance mechanisms.
81 48.23 -18.23 30.00 SO1 Gf-SO1 (SO) Society
Local Communities
Percentage of operations with implemented local community engagement, impact assessments, and development programs.
82 50.36 -20.36 30.00 HR6 G4-HR5 (HR) Human Rights
Child Labor Operations identified as having significant risk for incidents of child labor, and measures taken to contribute to the elimination of child labor.
83 52.77 -22.76 30.00 LA12 G4-LA11 (LA) Labor
Practices and Decent
Work
Training and Education
Percentage of employees receiving regular performance and career development reviews, by gender.
84 66.41 -26.41 40.00 LA1 G4-10 (Moved to
'Organizational Profile' in G4)
(LA) Labor
Practices and Decent
Work
Employment Total workforce by employment type, employment contract, and region, broken down by gender.
Page 174
sustainability — what matters? The Waste Management Sector
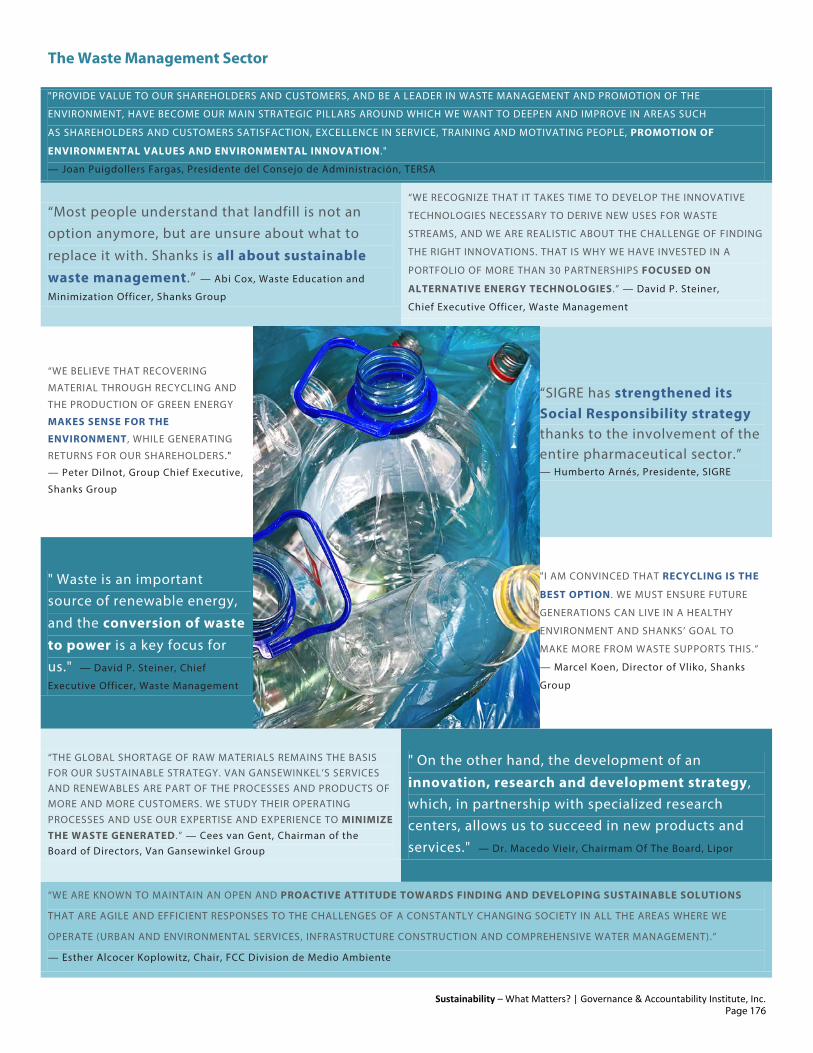
The Waste Management Sector
Sustainability – What Matters? | Governance & Accountability Institute, Inc.
"PROVIDE VALUE TO OUR SHAREHOLDERS AND CUSTOMERS, AND BE A LEADER IN WASTE MANAGEMENT AND PROMOTION OF THE
ENVIRONMENT, HAVE BECOME OUR MAIN STRATEGIC PILLARS AROUND WHICH WE WANT TO DEEPEN AND IMPROVE IN AREAS SUCH
AS SHAREHOLDERS AND CUSTOMERS SATISFACTION, EXCELLENCE IN SERVICE, TRAINING AND MOTIVATING PEOPLE, PROMOTION OF
ENVIRONMENTAL VALUES AND ENVIRONMENTAL INNOVATION."
— Joan Puigdollers Fargas, Presidente del Consejo de Administración, TERSA
“Most people understand that landfill is not an option anymore, but are unsure about what to
replace it with. Shanks is all about sustainable waste management.” — Abi Cox, Waste Education and
Minimization Officer, Shanks Group
“WE RECOGNIZE THAT IT TAKES TIME TO DEVELOP THE INNOVATIVE
TECHNOLOGIES NECESSARY TO DERIVE NEW USES FOR WASTE
STREAMS, AND WE ARE REALISTIC ABOUT THE CHALLENGE OF FINDING
THE RIGHT INNOVATIONS. THAT IS WHY WE HAVE INVESTED IN A
PORTFOLIO OF MORE THAN 30 PARTNERSHIPS FOCUSED ON
ALTERNATIVE ENERGY TECHNOLOGIES .” — David P. Steiner,
Chief Executive Officer, Waste Management
“WE BELIEVE THAT RECOVERING
MATERIAL THROUGH RECYCLING AND
THE PRODUCTION OF GREEN ENERGY
MAKES SENSE FOR THE
ENVIRONMENT , WHILE GENERATING
RETURNS FOR OUR SHAREHOLDERS."
— Peter Dilnot, Group Chief Executive,
Shanks Group
“SIGRE has strengthened its Social Responsibility strategy thanks to the involvement of the entire pharmaceutical sector.” — Humberto Arnés, Presidente, SIGRE
" Waste is an important source of renewable energy,
and the conversion of waste to power is a key focus for us." — David P. Steiner, Chief
Executive Officer, Waste Management
"I AM CONVINCED THAT RECYCLING IS THE
BEST OPTION. WE MUST ENSURE FUTURE
GENERATIONS CAN LIVE IN A HEALTHY
ENVIRONMENT AND SHANKS’ GOAL TO
MAKE MORE FROM WASTE SUPPORTS THIS.”
— Marcel Koen, Director of Vliko, Shanks
Group
“THE GLOBAL SHORTAGE OF RAW MATERIALS REMAINS THE BASIS FOR OUR SUSTAINABLE STRATEGY. VAN GANSEWINKEL’S SERVICES AND RENEWABLES ARE PART OF THE PROCESSES AND PRODUCTS OF MORE AND MORE CUSTOMERS. WE STUDY THEIR OPERATING PROCESSES AND USE OUR EXPERTISE AND EXPERIENCE TO MINIMIZE THE WASTE GENERATED .” — Cees van Gent, Chairman of the Board of Directors, Van Gansewinkel Group
" On the other hand, the development of an
innovation, research and development strategy, which, in partnership with specialized research centers, allows us to succeed in new products and services." — Dr. Macedo Vieir, Chairmam Of The Board, Lipor
“WE ARE KNOWN TO MAINTAIN AN OPEN AND PROACTIVE ATTITUDE TOWARDS FINDING AND DEVELOPING SUSTAINABLE SOLUTIONS
THAT ARE AGILE AND EFFICIENT RESPONSES TO THE CHALLENGES OF A CONSTANTLY CHANGING SOCIETY IN ALL THE AREAS WHERE WE
OPERATE (URBAN AND ENVIRONMENTAL SERVICES, INFRASTRUCTURE CONSTRUCTION AND COMPREHENSIVE WATER MANAGEMENT).”
— Esther Alcocer Koplowitz, Chair, FCC Division de Medio Ambiente
Page 176
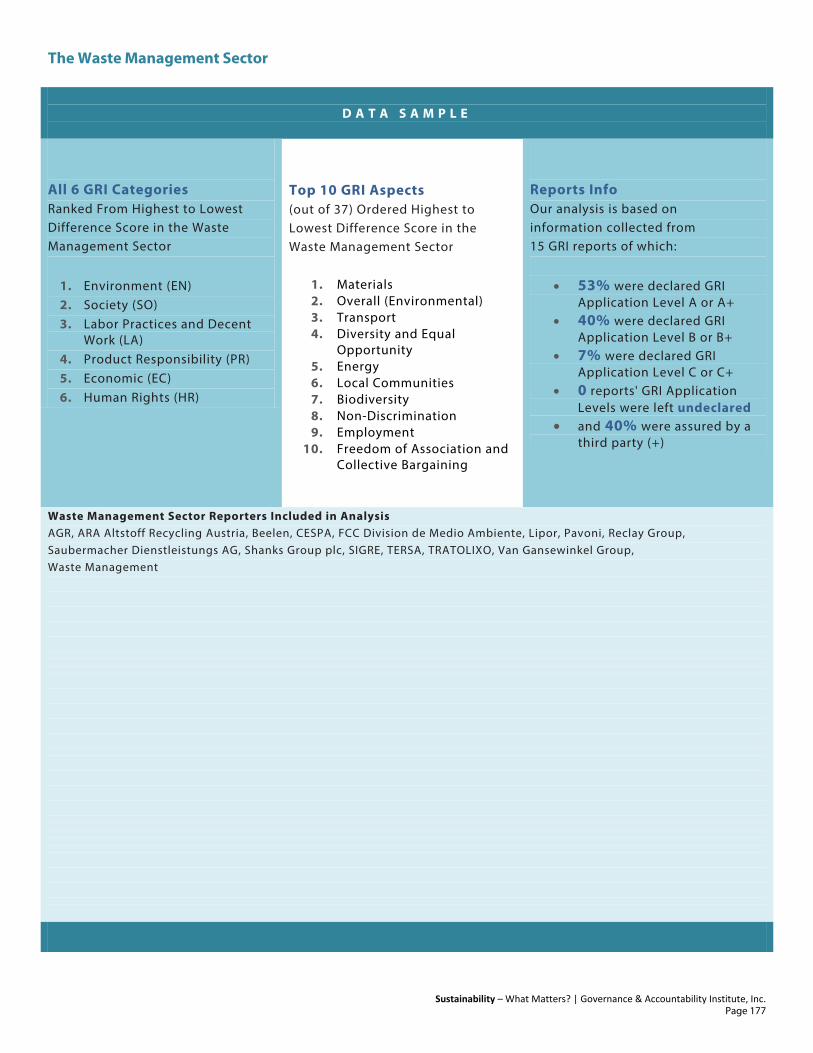
The Waste Management Sector
Sustainability – What Matters? | Governance & Accountability Institute, Inc.
D A T A S A M P L E
All 6 GRI Categories Ranked From Highest to Lowest Difference Score in the Waste Management Sector
1. Environment (EN) 2. Society (SO) 3. Labor Practices and Decent
Work (LA) 4. Product Responsibility (PR) 5. Economic (EC) 6. Human Rights (HR)
Top 10 GRI Aspects (out of 37) Ordered Highest to Lowest Difference Score in the Waste Management Sector
1. Materials 2. Overall (Environmental) 3. Transport 4. Diversity and Equal
Opportunity 5. Energy 6. Local Communities 7. Biodiversity 8. Non-Discrimination 9. Employment
10. Freedom of Association and Collective Bargaining
Reports Info Our analysis is based on information collected from 15 GRI reports of which:
• 53% were declared GRI Application Level A or A+
• 40% were declared GRI Application Level B or B+
• 7% were declared GRI Application Level C or C+
• 0 reports' GRI Application Levels were left undeclared
• and 40% were assured by a third party (+)
Waste Management Sector Reporters Included in Analysis AGR, ARA Altstoff Recycling Austria, Beelen, CESPA, FCC Division de Medio Ambiente, Lipor, Pavoni, Reclay Group, Saubermacher Dienstleistungs AG, Shanks Group plc, SIGRE, TERSA, TRATOLIXO, Van Gansewinkel Group, Waste Management
Page 177

TOP 10 INDICATORS | The Waste Management Sector | Get All 84: www.ga-institute.com/getall84
Sustainability – What Matters? | Governance & Accountability Institute, Inc. 0 — 50 — 100
Rank All Sector Score
Diff Difference
Sector Sector Score
G3.1 Indicator
G4 Indicator
Category Aspect Description
1 36.20 33.81 70.00 EN2 G4-EN2 (EN) Environment
Materials Percentage of materials used that are recycled input materials.
2 48.23 25.11 73.33 SO1 Gf-SO1 (SO) Society
Local Communities
Percentage of operations with implemented local community engagement, impact assessments, and development programs.
3 48.48 24.86 73.33 EN6 G4-EN7 (EN) Environment
Energy Initiatives to provide energy-efficient or renewable energy based products and services, and reductions in energy requirements as a result of these initiatives.
4 43.70 22.97 66.67 EN1 G4-EN1 (EN) Environment
Materials Materials used by weight or volume.
5 33.31 20.03 53.33 EN14 Entire Indicator Moved to Guidance
(EN) Environment
Biodiversity Strategies, current actions, and future plans for managing impacts on biodiversity.
6 34.11 19.23 53.33 EN11 G4-EN11 (EN) Environment
Biodiversity Location and size of land owned, leased, managed in, or adjacent to, protected areas and areas of high biodiversity value outside protected areas.
7 30.82 19.19 50.00 EN30 G4-EN31, G4-EN32, G4-EN33, G4-EN34
(EN) Environment
Overall (Environmental)
Total environmental protection expenditures and investments by type.
8 35.51 17.82 53.33 EN29 G4-EN30 (EN) Environment
Transport Significant environmental impacts of transporting products and other goods and materials used for the organization's operations, and transporting members of the workforce.
9 29.57 17.10 46.67 EN13 G4-EN13 (EN) Environment
Biodiversity Habitats protected or restored.
10 43.14 16.87 60.00 EN7 G4-EN6 (EN) Environment
Energy Initiatives to reduce indirect energy consumption and reductions achieved.
Page 178
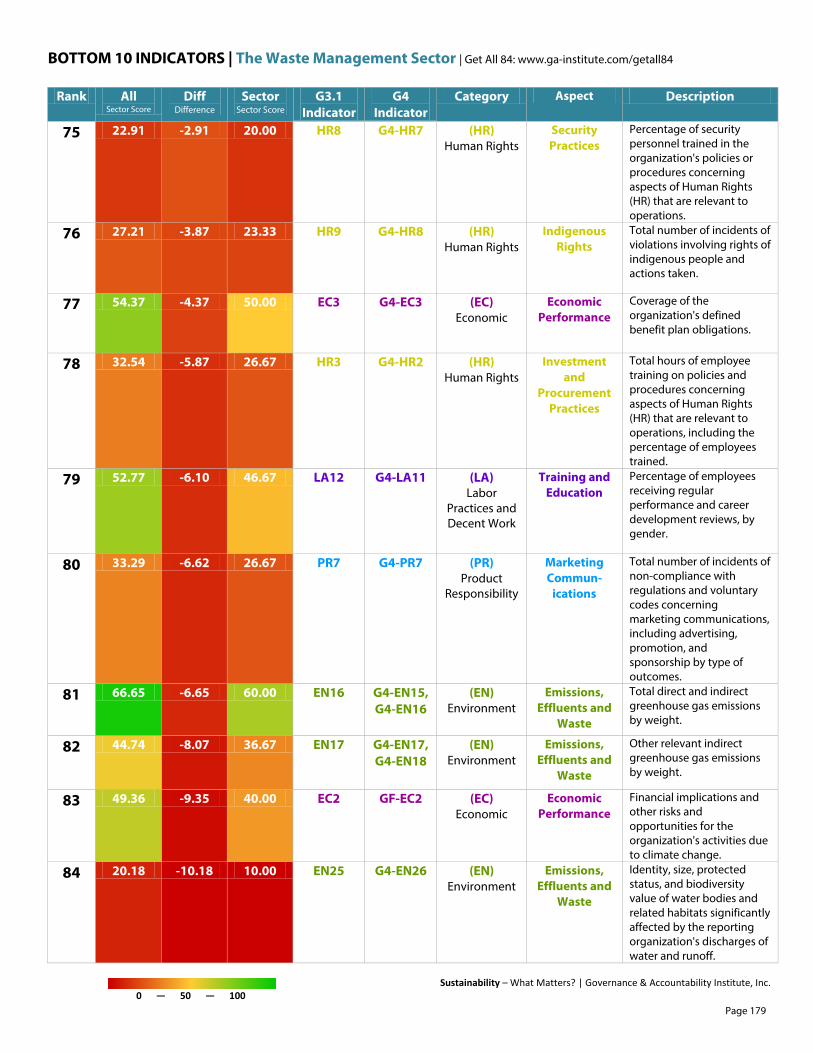
BOTTOM 10 INDICATORS | The Waste Management Sector | Get All 84: www.ga-institute.com/getall84
Sustainability – What Matters? | Governance & Accountability Institute, Inc. 0 — 50 — 100
Rank All Sector Score
Diff Difference
Sector Sector Score
G3.1 Indicator
G4 Indicator
Category Aspect Description
75 22.91 -2.91 20.00 HR8 G4-HR7 (HR) Human Rights
Security Practices
Percentage of security personnel trained in the organization's policies or procedures concerning aspects of Human Rights (HR) that are relevant to operations.
76 27.21 -3.87 23.33 HR9 G4-HR8 (HR) Human Rights
Indigenous Rights
Total number of incidents of violations involving rights of indigenous people and actions taken.
77 54.37 -4.37 50.00 EC3 G4-EC3 (EC) Economic
Economic Performance
Coverage of the organization's defined benefit plan obligations.
78 32.54 -5.87 26.67 HR3 G4-HR2 (HR) Human Rights
Investment and
Procurement Practices
Total hours of employee training on policies and procedures concerning aspects of Human Rights (HR) that are relevant to operations, including the percentage of employees trained.
79 52.77 -6.10 46.67 LA12 G4-LA11 (LA) Labor
Practices and Decent Work
Training and Education
Percentage of employees receiving regular performance and career development reviews, by gender.
80 33.29 -6.62 26.67 PR7 G4-PR7 (PR) Product
Responsibility
Marketing Commun-
ications
Total number of incidents of non-compliance with regulations and voluntary codes concerning marketing communications, including advertising, promotion, and sponsorship by type of outcomes.
81 66.65 -6.65 60.00 EN16 G4-EN15, G4-EN16
(EN) Environment
Emissions, Effluents and
Waste
Total direct and indirect greenhouse gas emissions by weight.
82 44.74 -8.07 36.67 EN17 G4-EN17, G4-EN18
(EN) Environment
Emissions, Effluents and
Waste
Other relevant indirect greenhouse gas emissions by weight.
83 49.36 -9.35 40.00 EC2 GF-EC2 (EC) Economic
Economic Performance
Financial implications and other risks and opportunities for the organization's activities due to climate change.
84 20.18 -10.18 10.00 EN25 G4-EN26 (EN) Environment
Emissions, Effluents and
Waste
Identity, size, protected status, and biodiversity value of water bodies and related habitats significantly affected by the reporting organization's discharges of water and runoff.
Page 179

sustainability — what matters? The Water Utilities Sector

The Water Utilities Sector
Sustainability – What Matters? | Governance & Accountability Institute, Inc.
“CORPORATE SUSTAINABILITY DEVELOPMENT REQUIRES GREAT CARE AND ATTENTION. WE HAVE MADE A GOOD START IN LAYING OUT
OUR BLUEPRINT FOR CORPORATE SUSTAINABILITY AND PLAYING OUR ROLE AS A CORPORATE CITIZEN . THIS SUCCESSFUL
START REINFORCES OUR CONFIDENCE IN MEETING THE CHALLENGES AHEAD.”
— Felix Fan Xiaojun, Executive Director and Chairman of the Corporate Sustainability Committee, Macao Water Supply Co. Ltd.
“As a water technology company, sustainability is ingrained in our business. We are here to provide smart, efficient water solutions to our customers and the world.” — Gretchen McClain, President & CEO, Xylem
“ACROSS ALL OUR EFFORTS WE ALSO MAKE SURE THAT WE FOLLOW
NOT ONLY LOCAL AND NATIONAL LAWS AND REGULATIONS, BUT
ALSO INTERNATIONAL POLICIES AND DECLARATIONS, PARTICULARLY
ON IMPORTANT ISSUES LIKE HUMAN RIGHTS, LABOR AND GOOD
GOVERNANCE PRACTICES.” — Fernando Zobel De Ayala, Chairman,
Manila Water Company
“… IS TRULY BLESSED TO HAVE HAD
THE OPPORTUNITY TO CREATE A
SIGNIFICANT DIFFERENCE IN THE
LIVES OF THE PEOPLE WE SERVE,
ESPECIALLY THOSE BELONGING TO
MARGINALIZED COMMUNITIES.”
— Gerardo C. Ablaza, Jr., President &
CEO, Manila Water Company
“…continue the implementation of our green procurement policy, taking into account cost, practicality and environmental protection.” — Felix Fan Xiaojun, Executive Director and Chairman of the Corporate Sustainability Committee, Macao Water Supply Co. Ltd.
“There's a direct line of sight from our work to the sustainable health of the planet, and we captured that in our company mission: Let's Solve Water.” — Gretchen McClain,
President & CEO, Xylem
“OUR COMPANY REAFFIRMED ITS
COMMITMENT IN THIS REPORT TO
PROVIDE WATER AND WASTEWATER
SERVICE IN A WAY THAT SUSTAINS
FUTURE GENERATIONS .”
— Fernando Zobel De Ayala, Chairman,
Manila Water Company
“OUR BUSINESS MODEL HAS MATURED TO A LEVEL THAT ALIGNS BUSINESS VIABILITY WITH CREATING A POSITIVE IMPACT IN THE COMMUNITIES WE SERVE AND FOR THE ENVIRONMENTAL RESOURCES WE UTILIZE.” — Gerardo C. Ablaza, Jr., President & CEO, Manila Water Company
“We thrive to minimize our environmental impacts by improving energy efficiency, reducing carbon emission and by carefully disposing of our waste from water treatment and distribution.” — Felix Fan Xiaojun, Executive Director and Chairman of the
Corporate Sustainability Committee, Macao Water Supply Co. Ltd.
“WE UNDERSTOOD THAT SUSTAINABILITY IS THE WAY WE WILL SUCCEED AS A COMPANY. IT'S NOT SOMETHING ELSE WE DO IN ADDITION
TO OUR REAL WORK. IT'S WHAT WE DO ALL THE TIME. IT'S PART OF WHO WE ARE, AND WE HAVE TAKEN MANY IMPORTANT STEPS TO
EMBED SUSTAINABILITY INTO OUR COMPANY'S CULTURE .” — Gretchen McClain, President & CEO, Xylem
Page 181
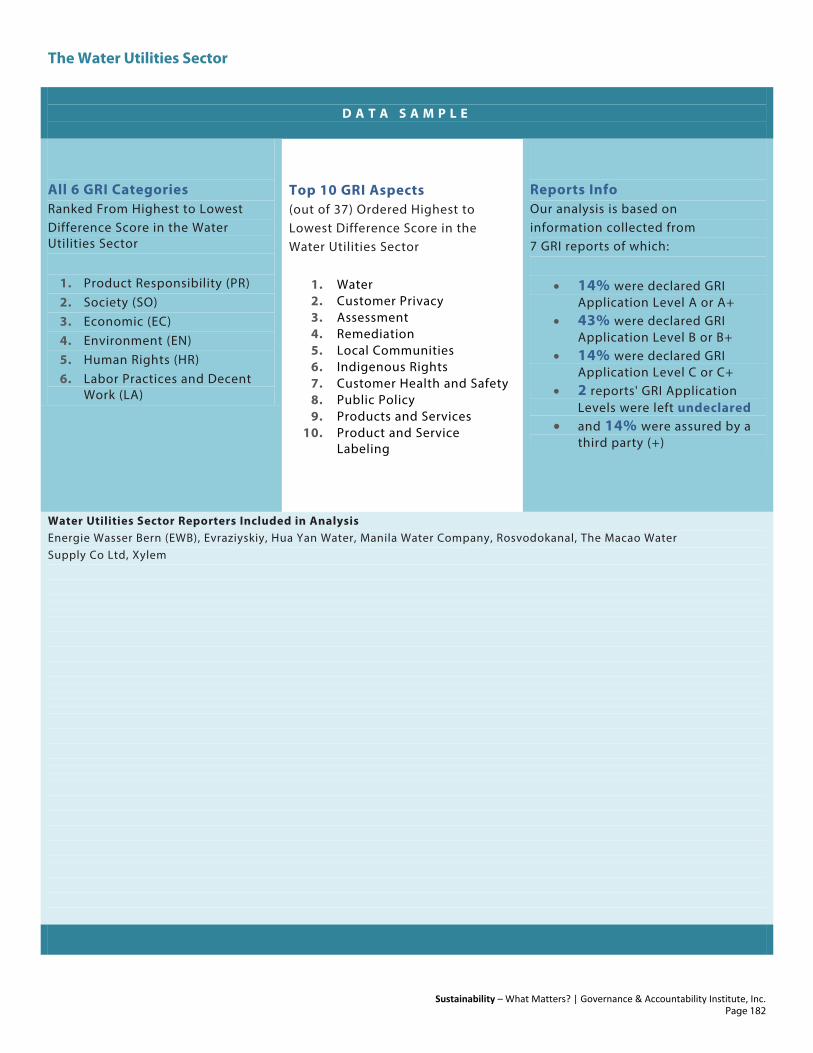
The Water Utilities Sector
Sustainability – What Matters? | Governance & Accountability Institute, Inc.
D A T A S A M P L E
All 6 GRI Categories Ranked From Highest to Lowest Difference Score in the Water Utilities Sector
1. Product Responsibility (PR) 2. Society (SO) 3. Economic (EC) 4. Environment (EN) 5. Human Rights (HR) 6. Labor Practices and Decent
Work (LA)
Top 10 GRI Aspects (out of 37) Ordered Highest to Lowest Difference Score in the Water Utilities Sector
1. Water 2. Customer Privacy 3. Assessment 4. Remediation 5. Local Communities 6. Indigenous Rights 7. Customer Health and Safety 8. Public Policy 9. Products and Services
10. Product and Service Labeling
Reports Info Our analysis is based on information collected from 7 GRI reports of which:
• 14% were declared GRI Application Level A or A+
• 43% were declared GRI Application Level B or B+
• 14% were declared GRI Application Level C or C+
• 2 reports' GRI Application Levels were left undeclared
• and 14% were assured by a third party (+)
Water Utilities Sector Reporters Included in Analysis Energie Wasser Bern (EWB), Evraziyskiy, Hua Yan Water, Manila Water Company, Rosvodokanal, The Macao Water Supply Co Ltd, Xylem
Page 182

TOP 10 INDICATORS | The Water Utilities Sector | Get All 84: www.ga-institute.com/getall84
Sustainability – What Matters? | Governance & Accountability Institute, Inc. 0 — 50 — 100
Rank All Sector Score
Diff Difference
Sector Sector Score
G3.1 Indicator
G4 Indicator
Category Aspect Description
1 29.05 20.95 50.00 EN9 G4-EN9 (EN) Environment
Water Water sources significantly affected by withdrawal of water.
2 44.26 12.89 57.14 EN23 G4-EN24 (EN) Environment
Emissions, Effluents and
Waste
Total number and volume of significant spills.
3 45.14 12.01 57.14 PR1 G4-PR1 (Data points
moved to Guidance)
(PR) Product
Responsibility
Customer Health and
Safety
Life cycle stages in which health and safety impacts of products and services are assessed for improvement, and percentage of significant products and services categories subject to such procedures.
4 23.80 11.92 35.71 EN27 G4-EN28 (EN) Environment
Products and Services
Percentage of products sold and their packaging materials that are reclaimed by category.
5 35.42 7.44 42.86 PR8 G4-PR8 (PR) Product
Responsibility
Customer Privacy
Total number of substantiated complaints regarding breaches of customer privacy and losses of customer data.
6 16.29 5.14 21.43 HR10 G4-HR9, G4-HR11
(HR) Human Rights
Assessment Percentage and total number of operations that have been subject to Human Rights (HR) reviews and/or impact assessments.
7 52.09 5.06 57.14 SO5 Entire Indicator Moved to Guidance
(SO) Society
Public Policy Public policy positions and participation in public policy development and lobbying.
8 31.02 4.70 35.71 EN10 G4-EN10 (EN) Environment
Water Percentage and total volume of water recycled and reused.
9 17.50 3.94 21.43 SO9 G4-SO2 (SO) Society
Local Communities
Operations with significant potential or actual negative impacts on local communities.
10 17.82 3.62 21.43 SO10 Entire Indicator Moved to Guidance
(SO) Society
Local Communities
Prevention and mitigation measures implemented in operations with significant potential or actual negative impacts on local communities.
Page 183
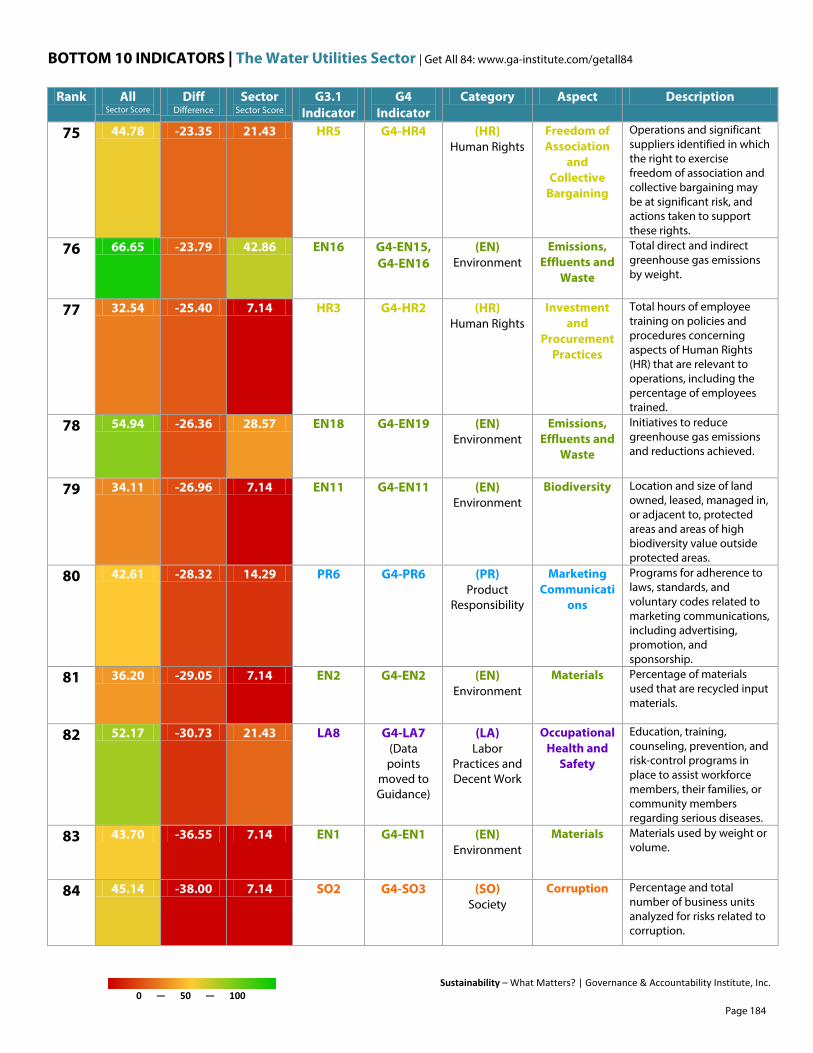
BOTTOM 10 INDICATORS | The Water Utilities Sector | Get All 84: www.ga-institute.com/getall84
Sustainability – What Matters? | Governance & Accountability Institute, Inc. 0 — 50 — 100
Rank All Sector Score
Diff Difference
Sector Sector Score
G3.1 Indicator
G4 Indicator
Category Aspect Description
75 44.78 -23.35 21.43 HR5 G4-HR4 (HR) Human Rights
Freedom of Association
and Collective
Bargaining
Operations and significant suppliers identified in which the right to exercise freedom of association and collective bargaining may be at significant risk, and actions taken to support these rights.
76 66.65 -23.79 42.86 EN16 G4-EN15, G4-EN16
(EN) Environment
Emissions, Effluents and
Waste
Total direct and indirect greenhouse gas emissions by weight.
77 32.54 -25.40 7.14 HR3 G4-HR2 (HR) Human Rights
Investment and
Procurement Practices
Total hours of employee training on policies and procedures concerning aspects of Human Rights (HR) that are relevant to operations, including the percentage of employees trained.
78 54.94 -26.36 28.57 EN18 G4-EN19 (EN) Environment
Emissions, Effluents and
Waste
Initiatives to reduce greenhouse gas emissions and reductions achieved.
79 34.11 -26.96 7.14 EN11 G4-EN11 (EN) Environment
Biodiversity Location and size of land owned, leased, managed in, or adjacent to, protected areas and areas of high biodiversity value outside protected areas.
80 42.61 -28.32 14.29 PR6 G4-PR6 (PR) Product
Responsibility
Marketing Communicati
ons
Programs for adherence to laws, standards, and voluntary codes related to marketing communications, including advertising, promotion, and sponsorship.
81 36.20 -29.05 7.14 EN2 G4-EN2 (EN) Environment
Materials Percentage of materials used that are recycled input materials.
82 52.17 -30.73 21.43 LA8 G4-LA7 (Data points
moved to Guidance)
(LA) Labor
Practices and Decent Work
Occupational Health and
Safety
Education, training, counseling, prevention, and risk-control programs in place to assist workforce members, their families, or community members regarding serious diseases.
83 43.70 -36.55 7.14 EN1 G4-EN1 (EN) Environment
Materials Materials used by weight or volume.
84 45.14 -38.00 7.14 SO2 G4-SO3 (SO) Society
Corruption Percentage and total number of business units analyzed for risks related to corruption.
Page 184

sustainability — what matters? All Sectors

All Sectors
Sustainability – What Matters? | Governance & Accountability Institute, Inc.
D A T A S A M P L E
All 6 GRI Categories Ranked From Highest to Lowest Difference Score in all the sectors
1. (EC) Economic 2. (LA) Labor Practices and
Decent Work 3. (SO) Society 4. (EN) Environment 5. (PR) Product Responsibility 6. (HR) Human Rights
Top 10 GRI Aspects (out of 37) Ordered Highest to Lowest Difference Score in all the sectors
1. Diversity and Equal Opportunity
2. Economic Performance 3. Energy 4. Training and Education 5. Child Labor 6. Compliance 7. Non-Discrimination 8. Labor/Management
Relations 9. Prevention of Forced and
Compulsory Labor 10. Corruption
Reports Info Our analysis is based on information collected from 1,246 GRI reports of which:
• 33% were declared GRI Application Level A or A+
• 36% were declared GRI Application Level B or B+
• 21% were declared GRI Application Level C or C+
• 115 reports' GRI Application Levels were left undeclared
• and 44% were assured by a third party (+)
Page 186
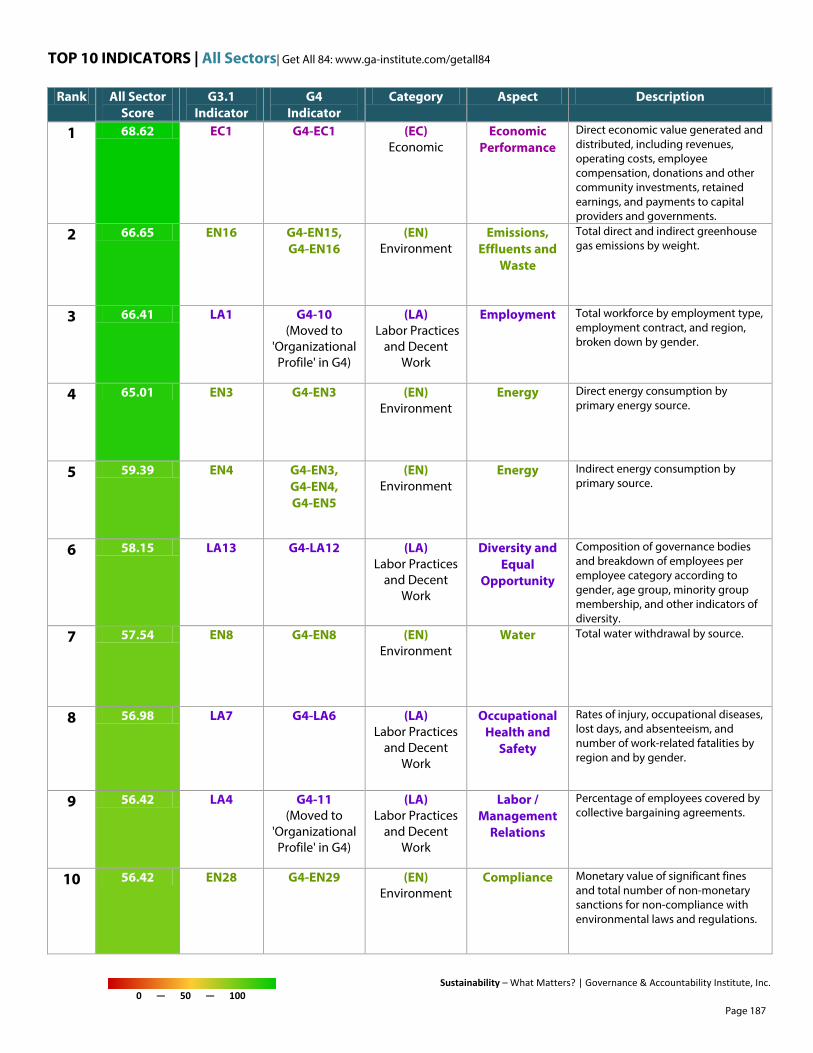
TOP 10 INDICATORS | All Sectors| Get All 84: www.ga-institute.com/getall84
Sustainability – What Matters? | Governance & Accountability Institute, Inc. 0 — 50 — 100
Rank All Sector Score
G3.1 Indicator
G4 Indicator
Category Aspect Description
1 68.62 EC1 G4-EC1 (EC) Economic
Economic Performance
Direct economic value generated and distributed, including revenues, operating costs, employee compensation, donations and other community investments, retained earnings, and payments to capital providers and governments.
2 66.65 EN16 G4-EN15, G4-EN16
(EN) Environment
Emissions, Effluents and
Waste
Total direct and indirect greenhouse gas emissions by weight.
3 66.41 LA1 G4-10 (Moved to
'Organizational Profile' in G4)
(LA) Labor Practices
and Decent Work
Employment Total workforce by employment type, employment contract, and region, broken down by gender.
4 65.01 EN3 G4-EN3 (EN) Environment
Energy Direct energy consumption by primary energy source.
5 59.39 EN4 G4-EN3, G4-EN4, G4-EN5
(EN) Environment
Energy Indirect energy consumption by primary source.
6 58.15 LA13 G4-LA12 (LA) Labor Practices
and Decent Work
Diversity and Equal
Opportunity
Composition of governance bodies and breakdown of employees per employee category according to gender, age group, minority group membership, and other indicators of diversity.
7 57.54 EN8 G4-EN8 (EN) Environment
Water Total water withdrawal by source.
8 56.98 LA7 G4-LA6 (LA) Labor Practices
and Decent Work
Occupational Health and
Safety
Rates of injury, occupational diseases, lost days, and absenteeism, and number of work-related fatalities by region and by gender.
9 56.42 LA4 G4-11 (Moved to
'Organizational Profile' in G4)
(LA) Labor Practices
and Decent Work
Labor / Management
Relations
Percentage of employees covered by collective bargaining agreements.
10 56.42 EN28 G4-EN29 (EN) Environment
Compliance Monetary value of significant fines and total number of non-monetary sanctions for non-compliance with environmental laws and regulations.
Page 187
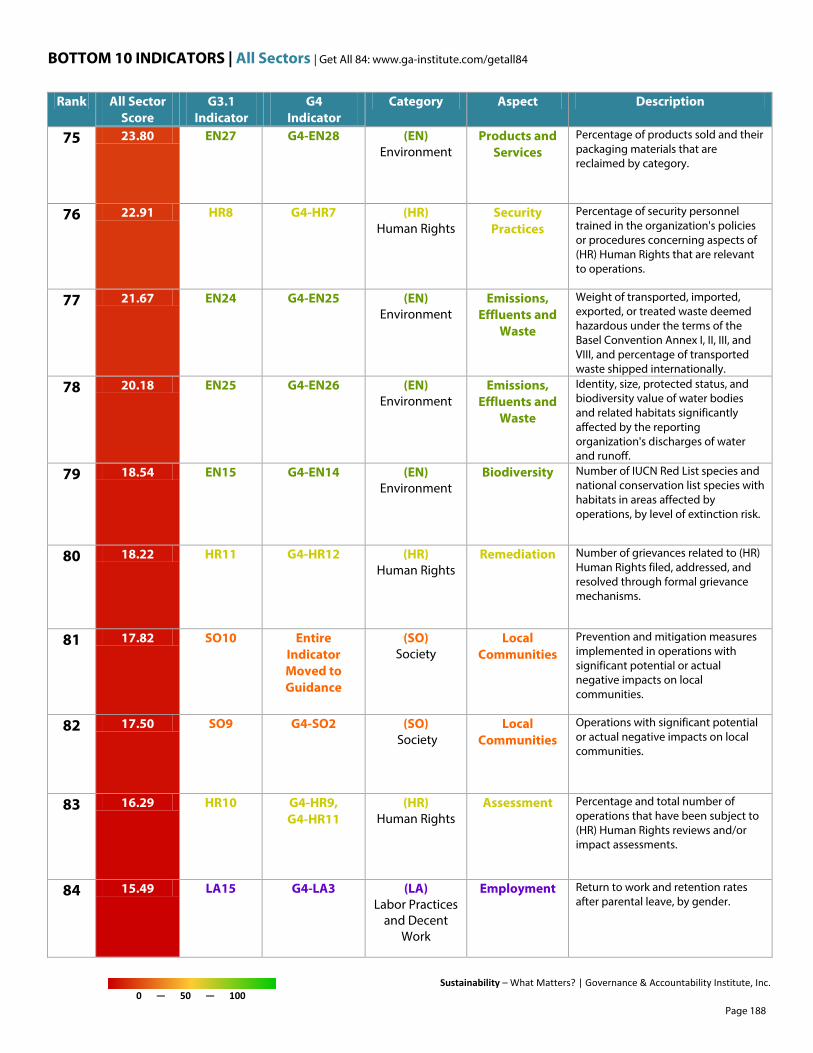
BOTTOM 10 INDICATORS | All Sectors | Get All 84: www.ga-institute.com/getall84
Sustainability – What Matters? | Governance & Accountability Institute, Inc. 0 — 50 — 100
Rank All Sector Score
G3.1 Indicator
G4 Indicator
Category Aspect Description
75 23.80 EN27 G4-EN28 (EN) Environment
Products and Services
Percentage of products sold and their packaging materials that are reclaimed by category.
76 22.91 HR8 G4-HR7 (HR) Human Rights
Security Practices
Percentage of security personnel trained in the organization's policies or procedures concerning aspects of (HR) Human Rights that are relevant to operations.
77 21.67 EN24 G4-EN25 (EN) Environment
Emissions, Effluents and
Waste
Weight of transported, imported, exported, or treated waste deemed hazardous under the terms of the Basel Convention Annex I, II, III, and VIII, and percentage of transported waste shipped internationally.
78 20.18 EN25 G4-EN26 (EN) Environment
Emissions, Effluents and
Waste
Identity, size, protected status, and biodiversity value of water bodies and related habitats significantly affected by the reporting organization's discharges of water and runoff.
79 18.54 EN15 G4-EN14 (EN) Environment
Biodiversity Number of IUCN Red List species and national conservation list species with habitats in areas affected by operations, by level of extinction risk.
80 18.22 HR11 G4-HR12 (HR) Human Rights
Remediation Number of grievances related to (HR) Human Rights filed, addressed, and resolved through formal grievance mechanisms.
81 17.82 SO10 Entire Indicator Moved to Guidance
(SO) Society
Local Communities
Prevention and mitigation measures implemented in operations with significant potential or actual negative impacts on local communities.
82 17.50 SO9 G4-SO2 (SO) Society
Local Communities
Operations with significant potential or actual negative impacts on local communities.
83 16.29 HR10 G4-HR9, G4-HR11
(HR) Human Rights
Assessment Percentage and total number of operations that have been subject to (HR) Human Rights reviews and/or impact assessments.
84 15.49 LA15 G4-LA3 (LA) Labor Practices
and Decent Work
Employment Return to work and retention rates after parental leave, by gender.
Page 188

All Sectors
Sustainability – What Matters? | Governance & Accountability Institute, Inc.
A L L R E P O R T E R S I N A L L S E C T O R S I N C L U D E D I N A N A L Y S I S
3M Company, A Coruña Port Authority, Aargauische Kantonalbank, AB Anders Löfberg, ABB Asea Brown Boveri Ltd, Abbott, Abeinsa, Abellio, Abengoa Bioenergía, Abengoa Solar, ABM Industries Incorporated, ABN AMRO Holding, Absa, Abu Dhabi Gas Liquefaction Company, Abu Dhabi National Oil Company (ADNOC), Abu Dhabi Sustainability Group (ADSG), Accenture Spain, Access Bank PLC, Acciona, ACE Seguros S.A., Acerinox SA, Acindar Grupo Arcelor Mittar, adidas Group, Aebi Schmidt, Aegis Limited, AEGON, AEM (Atomenergomash), AES Brasil, AGCO Corp, Agence Française de Développement, Agilent Technologies, Agnico-Eagle Mines (AEM), AGR, AGRAVIS Raiffeisen AG, Agrium, Ahlstrom Corporation, Ahold, Aida Cruises, Air Products, AIRFARM, Airports of Thailand (AOT), Akademiska Hus, Akbank, Alaska Air Group, Albanian Mobile Communications, Albemarle Corporation, Alcatel-Lucent, Alcoa, ALFA, Alko, Allgemeine Baugesellschaft – A. Porr AG, Alliance Boots, Alliander, Allianz, Alma Media Group, ALPHA Bank, Alpina, Alsea, Alstria office REIT-AG, Altech, Altia, Altron (Allied Electronics Corporation Limited), Amadeus, AMD (Advanced Micro Devices), American Chemical Society, American Eagle Outfitters, American Electric Power (AEP), American Industries, Amgen Inc., Amorim, AMR, Analog Devices, Anglo American PLC, Anheuser-Busch Companies, Antalis AG, Antaviana, Antofagasta PLC, Antwerp Port Authority, Apache Corporation, APERAM, APG, APG All Pensions Group, Apivita, APL, Apotekens Service AB, Apoteket, Aquafil Spa, ARA Altstoff Recycling Austria, Arab Bank, ArcelorMittal, ArcelorMittal USA, Architectural Services Department (HKSARG), Areas, Arizona Chemical, Arlandabanan, ARM Holdings, Ashland, Asia Pacific Breweries Limited (APBL), ASML, Aspen Group, Aspen Pharmacare, Assa Abloy, Assicurazioni Generali, Astra International, AT&T, ATEbank, Atento (Spain), Atrium Ljungberg, Attiki Odos, Auditor General of South Africa, AuRico Gold, Aurizon Mines, Aurora Energy, Australia and New Zealand Banking Group (ANZ), Australian Centre for Corporate Social Responsibility (ACCSR), Australian Paper, Autodesk, Autogrill, Autostrade per l'Italia, AUTOTERMINAL, S.A., Avalon Bay Communities Inc, Axel Springer, Axfood, AXTEL, Ayala Land, Aygaz, Ball Corporation, Ball State University, Ballast Nedam, Banco do Brasil, Banco Galicia, Bank Millennium S.A., Bank Of Montreal, Bank of the Philippine Islands (BPI), Banpu Public Company Limited, Barclays, Barrick Gold, Barry Callebaut AG, Basellandschaftliche Kantonalbank BLKB, BASF SE, Bashneft, Basler Kantonalbank, Baxter International, Bayer AG, BBVA Bancomer, BBVA Colombia, BBVA Provincial, BC Hydro, Becker Underwood, Beelen, Befimmo, Belgische Technische Cooperatie (BTC), Bell Canada, Bentall Kennedy, Berkeley Group, Berner Kantonalbank, Best Buy, BFS Group Limited, BG Group, BHP Billiton, BicBanco, BIG, Bilbao Bizkaia Kutxa (BBK), Bilfinger Berger, Bilim Pharmaceuticals Company, Blue Label Telecoms, BNY Mellon, Bombardier, BONDUELLE SAS, Bonus Vorsorge, Borouge, Boskalis, BostadsGaranti, BP International Ltd., BPCL, Bpost, BRF (Brasil Foods), Brinova, Brisa, British American Tobacco (Holdings), British American Tobacco Korea, British Land, British Sky, Brown-Forman Corporation, BSH Group, Bunge Argentina, Bunge Brazil, C&A Brazil, C&A Europe, C.D.A. di Cattelan srl, CA Immo, CA Technologies, Caesars Entertainment, Cairn Energy, CaixaBank, Cajamar Caja Rural, CALIDA, Cameco, Campbell Soup, Camposol, Canada Post, Canfor Corp., Canton de Vaud, Capital Power Corporation, Capital Shopping Centres Group, Capitaland, Caracol Televisión, Carillion, Carlsberg Group, Carrefour Argentina, CARREFOUR Hellas, Carris, Cashbuild, Catalyst Paper, Cathay Pacific Airways, CBRE Group, CCR, CCU, CEBU Holdings, Cebu Property Ventures and Development Corp., CELLER VEGA AIXALA, CEMEX, Cemex Deutschland AG, Cenovus Energy, Cermaq, CESP, CESPA, Cham Paper Group, Chambal Fertilizers and Chemicals Limited, Cheminova, CHESF, Chevron Corporation, Chicken of the Sea, Chilectra, China National Erzhong Group Co. - China, China Shenhua, China Southern Power Grid, Chungwa Picture Tubes (CPT), CIMB Foundation under CIMB Group, Cimpor, Cisco Systems, Inc., CISCO Thailand, Citigroup, City Developments Limited, Citycon, Clariant, Clarke, Cleveland Clinic, Cliffs Natural Resources, Clover Technologies, CLP, Coca-Cola Company, Coca-Cola de Argentina, Coca-Cola Femsa, Coca-Cola Germany, Coca-Cola HBC Switzerland, Coca-Cola Hellenic, Coca- Cola Hellenic Russia, Coca-Cola Hungary, Coca-Cola İcecek Turkey, Coca-Cola UK, Codelco, Cognizant, Coinstar, Colacem, Colgate-Palmolive, Colombina, Comergon, Commercial Aircraft Corporation of China, Commission de la santé et de la sécurité du travai, Companhia de Desenvovimento Habitacional e Urbano do Estado de São Paulo (CDHU), Companhia de Electricidade de Macau (CEM), Compañía Minera Doña Inés De Collahuasi, Componenta, ConAgra Foods, Consejo General de Colegios Oficiales de Farmacéuticos de España (Redfarma), Consol Energy, Consum, Continental, Coop, Copagaz, Copersucar, Corio, Cosil Construções e Incorporações S.A., Cosmote, COSMOTE Romania, Covanta Energy, CP Comboios de Portugal, Credit Suisse, Crest Nicholson, CRH, Croda, CSC STEEL HOLDINGS BERHAD, CSS Gruppe, CSX Corporation, CTEEP, Cuauhtémoc Moctezuma, CVS Caremark Corporation, CYDSA, D+ Brasil, Daimler, Danone Group, Danone Poland, Danper Trujillo, Darden Restaurants, Dätwyler Holding, Delhaize Group, Dell, Deloitte LLP, Deloitte Netherlands, Deloitte Spain, Deloitte USA, Dessau, Deutsche Bank, Deutsche Post AG/ DHL, Deutsche Telekom, Development Bank of the Philippines, DEXUS Property Group, DGC One AB,
Page 189

All Sectors
Sustainability – What Matters? | Governance & Accountability Institute, Inc.
All Reporters in All Sectors Included in Analysis continued DGR, Diageo, Dialog Axiata, DiamondRock Hospitality Company, DIC Asset, Digi.com Berhad, Digicore Holdings Ltd, Dignity Health System, Dimo, Diners Club del Ecuador, DirecTV Argentina, Discovery, DKV Seguros, DM9DDB, DNA, DNB NOR, DNV AS, Dogus Otomotiv, Dolphin Energy, Dong Energy, DoT Abu Dhabi, Dow Chemical, Dow Corning, Dr Pepper Snapple Group, Dr. Soliman Fakeeh Hospital, Dresden Verkehrsbetriebe, Dresser-Rand, Dubai Customs, Duke Energy, Duke Energy Perú, DuPont, Duratex, DyStar Singapore, E.ON, Eastman Chemical Company, Eastman Kodak Company, Eaton Corp., Ecolab, Ecopetrol, Edipower, Edison, Edita, EDP (Energias de Portugal), EDP Renováveis, Egged Israel Transport Cooperative Society, Eksport Kredit Fonden (EKF), El Brocal, Elcogas, Electricity Generating Authority of Thailand (EGAT), Electricity Generating Public Company (EGCO), Electronics and Telecommunications Research Institute, Electroperu, Elekeiroz, Elektrizitätswerke des Kantons Zürich (EKZ), Elisa Oyj, Elval, EMC, Empresa Nacional de Electricidad (Endesa Chile), Empresas ICA, S.A.B. de C.V., Enagas S.A., EnBW AG (Energie Baden-Wuerttemberg), EnCana, Endesa Colombia, Eneco Groep, Enel, Energie Wasser Bern (EWB), Energiedienst, Energy Development Corporation (EDC), Enersis, Enexis, Engro Corporation, Eni S.P.A., ENMAX, Entergy, Enterprise Holdings (EHI), Environment Park, E-Plus Gruppe, Equate, Equity One, ERARING ENERGY, ERG (Gruppo ERG), ERGRANSA, Ericsson, Ernst & Young Brazil, Ernst & Young Netherlands, Ernst & Young Sweden, Ernst & Young Switzterland, Ernst & Young USA, Erre de Vic, Eskom, Essar Energy, Essar Shipping, Essar Steel, Essent, ESTEVE, ETB, Etera, Etica Sgr S.p.A., Etisalat Lanka (Private) Limited, European Reliance, EVN, Evonik Industries, Evraziyskiy, EWO, Exelon Corp, F. Hoffmann-La Roche Ltd, Fabege AB, Fairmount Minerals, Falabella, Far Eastone Telecommunications, Fauji Fertilizer Company Limited, FCC Division de Medio Ambiente, FEDA, FEMSA, Ferrero International, Ferrovie dello Stato - Corporate Environment, FGC UES (Federal Grid Company of United Energy System), Fiat Industrial, Ficohsa, Finnair, FIRA - Banco de Mexico, Firestone Energy Ltd, First Capital Realty, Inc., First Resources, Florida Ice & Farm Company (FIFCO), Folksam, Fonciere Des Regions, Fonds de solidarité FTQ, Ford Motor Company, Fortum, Foschini, Fosun Pharmaceutical, Fouriertransform, Fourlis Group of Companies, France Telecom - Orange, Franke Artemis Group, Franke Group, Fraport AG, Freeport-McMoRan Copper & Gold, Fundació Garrotxa Líder, Furukawa Electric, FYM, Galp Energia, Gamesa, Gas Natural Argentina, Gas Natural Colombia, Gas Natural SDG, GASAG, Gases de occidente, Gasum, Gazit Globe, Gazprom Neft, Geberit, Gebrüder Weiss, Genelec, General Mills, General Motors Company, Georg Fischer, GESOBAU AG, Gestamp Aveiro, Gestore dei Servizi Energetici (GSE), Gildan, GIVAUDAN, GLOBE TELECOM, GLOBUL, GM OBB del Ecuador, GNP Seguros, Goldcorp, Golden Agri-Resources Ltd, Goodman Fielder, Goodwill PR and Communication Agency, Government Savings Bank, Graubundner Kantonalbank (GKB), Green Cargo, Green Mountain Energy, Grupa Lotos, Grupo ACS, Grupo Aeroportuario del Sureste (ASUR), Grupo Antena 3, Grupo ARCOR, Grupo Auchan, Grupo Bimbo, Grupo Boticário, Grupo EL COMERCIO, Grupo Los Grobo, Grupo Marfrig, Grupo Nutresa, Grupo Portucel, Grupo Sancor Seguros, Grupo Sura, Grupo TRAGSA, GRUPO UNIÓN FENOSA GAS, Grupo Viralcool, Gruppo Hera, Gruppo SGR, GS Caltex, GS Engineering & Construction (GS E&C), GSW Immobilien, Guelph Hydro Inc., H&M (Hennes & Mauritz), Halcor, Halliburton, Hammerson, Hankook Tire, Hatton National Bank (HNB), Heineken N.V., Heineken Spain, Hellenic Petroleum, Hellenic Telecommunications Organization (OTE), Henkel, Heracles General Cement, Hermes Real Estate Investment Management Limited, Hershey's, Hess Corporation, Hewlett Packard (HP), HEXPOL, Hines, Hitachi, HNB Assurance PLC, Holcim, Holcim Italia, Holdsport, Holmen, Homeplus, Honam Petrochemical, Hong Kong Exchanges and Clearing Limited, Horizon Holdings, Hormel Foods, Hospira, HOWOGE, Hrvatski Telekom (HT), Hua Yan Water, Huawei North America, Humana, Huntsman Corporation, Husqvarna AB, HWTR Program – Washington State Department of Ecology, Hyatt International, Hydro Quebec, Hypertechnologie CIARA Inc. (CIARA), Hyprop, Hyundai Mobis, Hyundai Motor Company, Iamgold, IBERCAJA BANCO, S.A.U, IBM, ICA, ICI, IDGC of Centre and Volga Region (Interregional Distributive Grid Company of Centre and Volga Region), IDLC, IIYAMA CORPORATION, IK Industrievereinigung Kunststoffverpackungen, Imperial Oil, Imperial Tobacco, Implenia, Impresa Pierantoni, INA, Incauca, Incitec Pivot, Inditex, Indra, Industrial Buildings Corp (IBC), Indústrias Romi, Infinitus China, Infonavit, Infosys Limited, Infranord, Infrasors, ING Group, Ingenio Pichichi, Innnovationsbron, inpEV (Instituto Nacional de Processamento de Embalagens Vazias), Inscape Office Furniture Corporation, Instituto Infraero de Seguridade Social -INFRAPREV, Insurance Australia Group (IAG), Intel Corporation, INTER RAO UES, International Paper no Brasil, Intesa Sanpaolo, Invensys, Investec, Investissement Quebec, Isagen, ista Deutschland GmbH, Isuzu Motors, Itaipu Binacional, Itautec, Itella, ITP (Industria de Turbo Propulsores), Itron, IVG Immobilien, IWB, Jaguar Cars, Jain Irrigation Systems, Javierre S.L., JD Group, Jernhusen, JetOil, Joh. Barth & Sohn GmbH & Co. KG, John Keells Group, John Lewis Partnership, Johns Manville, Johnson & Johnson, Johnson Controls, Johnson Matthey, Jointown Pharmaceutical Group Company, Jones Lang LaSalle, JPMorgan Chase, JSC Afrikantov OKBM, JSW Steel Ltd., Jubilant Industries Limited, Jubilant Life Sciences Ltd, Judicial Commission of New South Wales (NSW) - Australia, K+S, Kärntnermilch, Kathmandu, KB Home, KBC Group, Kelani Valley Plantations PLC, Kellogg, Kemira, Kendall Court, Keppel Corporation, KEPPEL LAND LIMITED,
Page 190

All Sectors
Sustainability – What Matters? | Governance & Accountability Institute, Inc.
All Reporters in All Sectors Included in Analysis continued Keppel T&T, Kesko Corporation, KHNP, Kia Motors, Kimberly-Clark, Kinross Gold Corporation, KOEL, KONČAR, Konecranes, Konica Minolta Group, Kooperativa Förbundet Ekonomisk Förening (KF), KORAIL, Korea East-West Power Corporation, Korea Environment Corporation, Korea Gas Corporation, Korea National Oil Corporation (KNOC), Korea Postal Logistics, Korea Rail Network Authority, Korea Telecom, Korea Tourism Organization, Korea Trade-Investment Promotion Agency, KPMG Brazil, KPN, KRC, KT&G, Kungliga Dramatiska Teatern, Kutxa, Kuwait Finance Housing, KWS SAAT, LA CIMA, La Farga Group, La Trobe University, Lafarge, Lagardère, LANDBANK OF THE PHILIPPINES, Landcom, Landesbank Baden-Wuerttemberg (LBBW), Lantmännen, Las Vegas Sands Corp., LaVola, Layne Christensen, Leader Cat Central, LeasePlan, Lemminkäinen, Leuphana University of Lueneburg, Lexmark, LG Display, Liberty Global Inc., Liberty Group, Lipor, LKAB, Logica, Lojas Renner S.A., London Fire Brigade, Lotte Shopping, Lucky Cement, Lundin Mining, Lunds Energikoncernen, LVMH Group, Madrid Movilidad, Maersk, Magyar Telekom, Mahindra Lifespace Developers Limited, Mahou-San Miguel Group, Main Roads Western Australia, Makhteshim Agan, MAN Group, Manchester Airport Group (MAG), Manila Water Company, Marine Harvest, Marks & Spencer, Marquard & Bahls AG, Marriott International, Martela, Masisa (Grupo Nueva), Massmart, Mauser Group, Maxis, McDonald's Australia, McDonald's Corporation, McDonald's Deutschland Inc., Zweigniederlassung München, MCI, MEC, Media Prima, MediaResponsable, Medtronic, MegaFon, Merck USA, Metair Investments Limited, METALLOINVEST, Metro, Metsaliitto/ METSÄ GROUP, Mexichem, Meyer Burger, Microsoft Corporation, Miele, Migros, Milano Serravalle - Milano Tangenziali, Milteks, Mirvac, Mobimo, Modern Times Group, MOESK (Moscow United Electric Grid Company), Mohawk Industries, MOL Group, MoliNos Río de la Plata, Mölnlycke Health Care, Mondadori, Mondi Group, Monsanto, Monsanto Latin America South, Montepaschi Group, Morgan Stanley, Morguard, Motor Oil Hellas, MTN Group, MTR Corporation, Multi Mall Management Portugal, Mumbai International Airport, Munich Airport, Munich Re, Mustafa Nevzat, Mutualista Pichincha, MYTILINEOS HOLDINGS S.A., Nalco Holdings, Naspers, National Bank of Abu Dhabi (NBAD), National Bank of Greece, National Bank of Oman, National Environment Agency, National Instruments, Nationale Suisse, NEC Corporation, Nedbank Group, Neste Oil, Nestlé, Nestle Hellas, Nestlé Hungária, Nestlé Poland, Nestlé Portugal, Netafim, New World Resources (NWR), Newmont Mining Corporation, Nexen, NH Hoteles, NIBC Bank, Nidera Argentina, Nike, NIS a.d. Novi Sad, Nisource, NLMK (Novolipetsk Steel), Nokia Corporation, Nordea Bank, NORDEN, Norrenergi AB, Norrlandsfonden, Northern Trust, Northrop Grumman Corporation, NovaGold Resources Inc., Novamont, Novelis, Novozymes, Novus International, Inc., NRG Energy, NUCOR CORPORATION, Nuon, NVIDIA, Nykredit, Nyrstar, OAO Nizhnekamskneftekhim, Occidental Petroleum (Oxy), OCI Company Ltd., oekostrom, Oesterreichische Kontrollbank, Oesterreichische Nationalbank, Oi, Oil Refineries Ltd, Olam International Limited, OLEUM FLUMEN, Omega Energy Colombia, Omnicane Limited, OMV, Oneok, ONO, Orica, Origin, Orion Group, Osisko, OutoKumpu, Outotec, Owens Corning, Oxford Properties Group, OZ Minerals, P&O Cruises Australia, Pacific Andes International Holdings Limited, Pacific Northwest National Laboratory, Pacific Rubiales Energy, Paharpur Business Centre, Palfinger, Palsgaard, Panasonic Corporation, Parsons Brinckerhoff, Pavoni, Peab, PELLICONI, PEMEX Petroleos Mexicanos, Penoles, Petrochina, Petron Corporation, Petronas, Pfizer Corporation Austria, Philips International B.V., Piaggio Group, Piepenbrock Unternehmensgruppe, PitneyBowes, Polismyndigheten i Stockholms län, Polykemi, Pomorskiej Spółki Gazownictwa, Port of Rotterdam, Porto de Sines, Portugal Telecom, POSCO Energy, POSCO Engineering & Construction Co.,Ltd., PostNL, Postnord, Power Seraya, PPR SA, Praxair, Praxair México y Centro America, Premier Oil, PREVI, PricewaterhouseCoopers (PwC) Netherlands, Profertil, Prologis, Promega, PRONACA, ProRail BV, Protecta Kft., Prudential Financial Inc, Pruksa Real Estate, PSA Peugeot Citroën, PT Antam, PTT Chemical Public Company Limited, PTT Exploration and Production Public Company, PTT Public Company Limited, Puma, Qatalum, Qatar Petroleum, Qatar Steel Company, Qualcomm, QUIMICRYL S/A, RadiciGroup- Radici Partecipazioni SPA, Radio e Televisao de Portugal, S.A. (RTP), Raiffeisen Schweiz, Randstad Sesa Select, RasGas, Rautaruukki, Realia, Reckitt Benckiser, Reclay Group, Rede Gazeta - Espirito Santo, Redecard, Redefine, REDEVCO B.V., Reed Elsevier, Reliance Industries Limited, REN, Repsol Perú, Repsol YPF, Repsol YPF Ecuador, Rexam PLC, Rezidor Hotel Group, RHI, Riksbyggen, RIM, Rio Tinto, Riopaila Castilla S.A., RN-PEP, ROCHE PHARMACEUTICALS TURKEY, Rogers, Rosenergoatom, Rosneft, Rostelecom, Rosvodokanal, Roto Smeets Group, Royal Bafokeng Platinum, Royal BAM Group, Royal Dutch Shell, Royal Wessanen, RUSHYDRO, Russian Concern for Electric and Thermal Energy Production at Nuclear Power Plants, Russian Railways, RWE, S&B Industrial Minerals, SABAF, SABMiller UK, Safaricom Limited, SAIL, Saint-Gobain, Sakhalin Energy, Salini Costruttori, Sama, Samarco Mineração, Samchully, Samsung, Samsung Heavy Industries, Samsung Life Insurance, San Diego International Airport, SanCor Cooperativas Unidas Limitada, Sandoz Türkiye, Sandvik, Sanford, Sanlam, Sanofi Group Turkey, Santos, SAP Labs, Sapa Group, Sarasin, SAS Singapore, SAS USA, Saskatchewan Research Council, Saubermacher Dienstleistungs AG, SBAB, SBB, Sberbank, SBM Offshore, SCA - Svenska Cellulosa Aktiebolaget, Scania, Schiphol Group, Scotiabank, Scotts Miracle-Gro Company, Securitas Argentina, Sedus, SEKEM Group, Sekisui Chemical,
Page 191

All Sectors
Sustainability – What Matters? | Governance & Accountability Institute, Inc.
All Reporters in All Sectors Included in Analysis continued SEMADES, Semafo, Sembcorp Industries Ltd, Sempra Energy, Senate Properties, SERVIFUSTER, S.A., SEVERNEFTEGAZPROM, Shaftesbury PLC, Shanks Group plc, Shell Canada, Shinhan Financial Group, SIGRE, Sime Darby Berhad, Simplot Australia, Sinergy, SingTel - Singapore Telecommunications Limited, SingTel Optus, SIX Group, SJ, SK Chemicals, SKF Group, SLN Tekstil ve Moda San.Tic.Ltd.Sti., Small & Medium Business Corporation, Smithfield, Snam Rete Gas, Sociedade Beneficente Israelita Brasileira Albert Einstein, Société de transport de Montréal (STM), Société Générale de Surveillance (SGS) Switzerland, Sodimac, S-OIL, Sol Meliá, Solarcentury, SolarWorld, SOLVAY s.a., Sonae Sierra, Sonaecom, Sorgenia, Southwest Airlines, SP Ausnet, SPARK IBERICA S. A. U., Spartech Corporation, SPbAEP (Saint Petersburg Research and Design Institute ATOMENERGOPROEKT), Specialfastigheter Sverige, Spectra Energy, Spendrups Bryggerier AB, Sponda, SPRI. SOCIEDAD PARA LA TRANSFORMACIÓN COMPETITIVA, S.A., Sprint, SSAB, Standard Bank, Standard Life, Staples, Starbucks Coffee Company, StarHub, State Street Corporation, Statoil ASA, STMicroelectronics, Stockholms Läns Landsting, Stockland, Stockmann, Stora Enso, Straumann Holding, Studiosus Reisen, STX Energy, STX Metal, Subdirección de Producción Región Marina Noroeste, Pemex Exploracción y Producción (SPRMNE PEP), Suez Environment, SulAmérica Companhia Nacional de Seguros, Sulzer, Sumitomo Bakelite, Sumitomo Chemicals, Sumitomo Electric Industries, Suncor Energy, Sunny Delight, Suramericana S.A, Surtigas, Sveaskog, SVEDAB, Svensk Bilprovning, Svensk Exportkredit, Svevia, Swedavia, Swedfund International, Swedish Match, Swire Properties, Swiss Post, Swiss Re, Swisscom, Symantec, Symrise AG, Syngenta, Takeda, Talisman Energy, Talvivaara, Tamro Group, Target, Tarmac, TASA, Tata Consultancy Services (TCS), Tata Steel, Tatneft, TBI, TC Transcontinental, TD Bank Financial Group, TDE S.A., TDK, TE Connectivity, Technip, Teck Resources, Teekay Petrojarl (TKPJ), Tele2, Telecom Argentina, Telecom Italia, Telefonica, Telefonica Colombia, Telekom Austria, Telekom Malaysia, Telekom Slovenije, Telekomunikasi Indonesia, Telenor Group, TeliaSonera, Telkom, Telstra, Telus, Tenet Healthcare Corporation, TENEX (Techsnabexport), Teollisuuden Voima Oyj (TVO), TEP, Teradata, Terminal de Contenidors de Barcelona, S.L. (T.C.B.), Terna, TERSA, Tesoro, Texas Instruments, Thai Oil, The Bangchak Petroleum Plc., The Co-operative, The Co-operators, The Crown Estate, The Doe Run Company, The GPT Group, The HSH Group, The Kroger Company, The Linde Group, The Link REIT, The Macao Water Supply Co Ltd, The McGraw-Hill Companies, The National Commercial Bank (NCB), The Saudi Investment Bank (SAIB), The Timberland Company, The World Bank, Thomas Cook Group, ThyssenKrupp AG, Tieto Corporation, Tiffany & Co, Tikkurila, Tim Hortons, TIM Participações, TITAN CEMENT, TMG, TNK- BP, TNT Express, Toronto Hydro Corporation, TOTAL, Toyota Argentina, Toyota Australia, Tractebel Energia, TRATOLIXO, Trelleborg Group, Triglav Insurance Company, Triodos Bank, TRU Energy, Truworths, TUI AG, Tullow Oil, Turkcell, Turku Energia, TVEL, U.S. Silica Company, UBS, UCA Funds Management, UMC (United Microelectronics Corporation), Umicore, UNE, UNIBAIL- RODAMCO SE, Unicredit, Unilever Brazil, Unilever Israel, Unimed Campinas, Unimed Circuito das Águas, Unimed Cuiabá, Unimed de Cascavel - Cooperativa de Trabalho Médico, Unimed Vitoria, Unimicron, Union Bank, Union de Cervecerias Peruanas Backus y Johnston, Union Investment, United Rentals, Universidad Internacional de Andalucía (UNIA), University of Calgary, UPC, UPM- Kymmene, UPS, Uralkali, US Army, USIMINAS, Usina São Manoel, V & M do Brasil, Vaasan, Vaisala Oyj, Valeo, Valiant, Van Gansewinkel Group, Vancity, Vantaan Energia, Vasallen, Vattenfall, VERBUND, VidaCaixa, Vodacom, Vodafone Espana, Vodafone Greece, Vodafone Italy, Vodafone Magyarország, Volkswagen Aktiengesellschaft, Volvo Car Corporation, Vontobel Gruppe, Vöslauer, VOTORANTIM INDUSTRIAL S/A, VR-Group, VTB Group, Wallenstam, Wal-Mart, Wal-Mart Brasil, Wal-Mart de México y Centroamérica, Wärtsilä Corporation, Waste Management, Waters Corporation, Wells Fargo & Company, Wesfarmers, Westfield Group, Westfleisch, Westport Innovations, Weyerhaeuser, Wienerberger, Wihlborgs Fastigheter AB, Williams-Sonoma, Inc., Wincor Nixdorf, Wind Hellas Telecommunication, Woolworths Limited, Woolworths South Africa, Xella, Xstrata, Xstrata Coal, Xstrata Copper Canada, Xstrata Copper Peru, Yamana Desenvolvimento Mineral, Yamana Gold, Yanacocha, Yara International, YSI, Yüksel, Zain Group Kuwait, Zehnder Group, Zhejiang Hisun Pharmaceutical Company, Zofri, Zürcher Kantonalbank, ŻYWIEC ZDRÓJ S.A.
Page 192

sustainability — what matters? Customized Research Results Available
In this report we have shared a great wealth of knowledge as part of Governance & Accountability Institute's mission to educate, elevate, and add to the important body of knowledge in the Sustainability field. To help fund the resources needed for the Institute's research projects (such as this one) we offer additional value-added research reports drawn from this internal comprehensive database which can provide a tremendous amount of value for a minimal charge. Purchasing the research outlined below will help to ensure that the Institute can continue its research and education mission. The experienced research team at G&A is also available for consulting and customized research engagements for clients. Please contact us at [email protected] for more details.
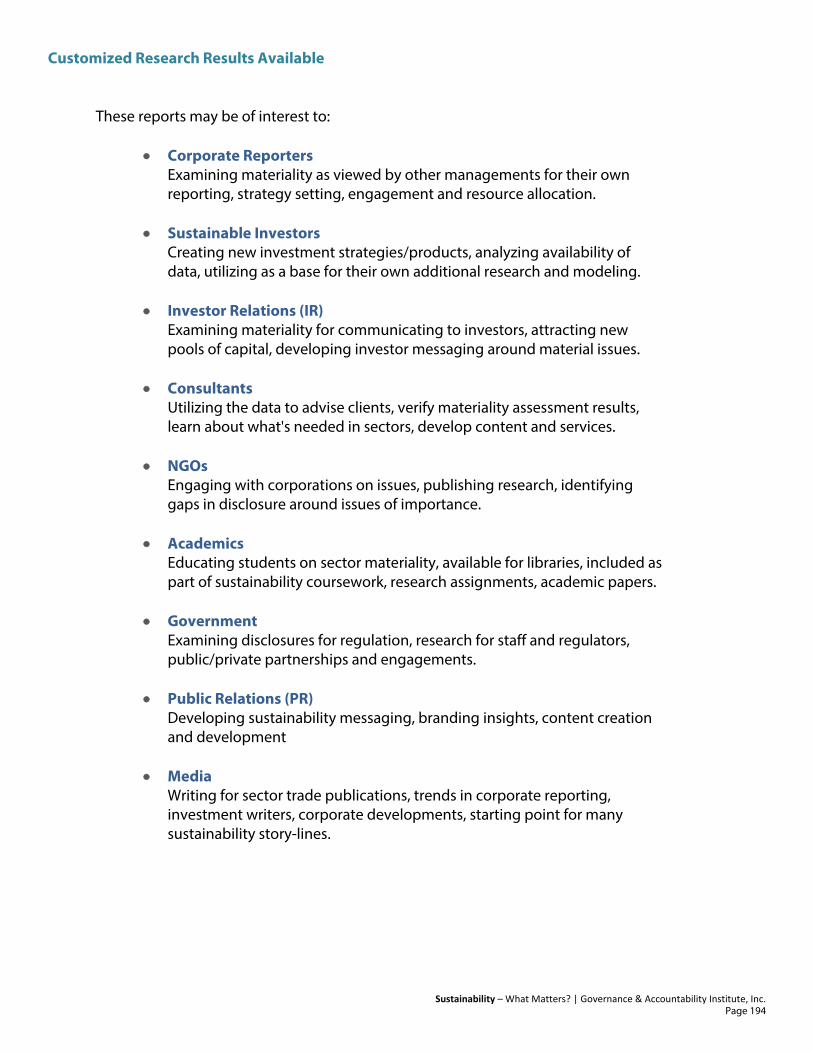
Customized Research Results Available
Sustainability – What Matters? | Governance & Accountability Institute, Inc.
These reports may be of interest to:
• Corporate Reporters
Examining materiality as viewed by other managements for their own reporting, strategy setting, engagement and resource allocation.
• Sustainable Investors Creating new investment strategies/products, analyzing availability of data, utilizing as a base for their own additional research and modeling.
• Investor Relations (IR) Examining materiality for communicating to investors, attracting new pools of capital, developing investor messaging around material issues.
• Consultants Utilizing the data to advise clients, verify materiality assessment results, learn about what's needed in sectors, develop content and services.
• NGOs Engaging with corporations on issues, publishing research, identifying gaps in disclosure around issues of importance.
• Academics Educating students on sector materiality, available for libraries, included as part of sustainability coursework, research assignments, academic papers.
• Government Examining disclosures for regulation, research for staff and regulators, public/private partnerships and engagements.
• Public Relations (PR) Developing sustainability messaging, branding insights, content creation and development
• Media Writing for sector trade publications, trends in corporate reporting, investment writers, corporate developments, starting point for many sustainability story-lines.
Page 194

Customized Research Results Available
Sustainability – What Matters? | Governance & Accountability Institute, Inc.
ALL 84 INDICATOR RANKINGS BY GRI DEFINED SECTOR This report will contain the full 84 performance indicator rankings for any sector of your choice. This is an additional 64 indicators beyond what you can find in this complimentary report. The list of the 35 GRI sectors that are available for purchase is located in the front of this report. These are sectors organized by the Global Reporting Initiative.
PRICING SCHEDULE
Number of Sectors Price 1-5 $100 per sector 6-10 $95 per sector 11-15 $90 per sector 16-20 $80 per sector 21-25 $70 per sector 26-30 $60 per sector 31-35 $50 per sector
Please visit - www.ga-institute.com/getall84 - to purchase these sector reports. SECTOR REPORTS | WITH DETAILED COMPANY BY COMPANY DISCLOSURE RESULTS In this report we will supply the detailed data on disclosure level of all 84 indicators for each individual company that is included in the sector of choice. This will allow a more granular look at the disclosures of the companies in the sector, rather than only the ranking of the indicators as a whole supplied in the report above. This report type is also available with individual company selection providing a more specific look at companies that are considered peers/competitors than the 35 sectors can provide. Pricing For more information and customized pricing, please contact [email protected].
Page 195

Customized Research Results Available
Sustainability – What Matters? | Governance & Accountability Institute, Inc.
COMPANY DISCLOSURE MATERIALITY CHECK REPORT In this report we will compare a specific company's disclosure levels to its sector and identify where there are gaps in the company's disclosures. This report is highly customizable and we can discuss the parameters with the needs of the client. This report type is also available with individual company selection providing a more specific look at companies that are considered peers/competitors than the 35 sectors can provide. Pricing For more information and customized pricing, please contact [email protected]. SELECTED INDICATOR REPORTS In this report you can select an indicator or group of indicators (rather than sector or company) of interest to you. We will then supply a list of organizations that responded to this indicator which you can then examine for examples of disclosures of that particular indicator. We can also supply customized reports on percentage of particular indicators disclosed in any universe of companies utilizing the criteria listed below in "Other Customization Options." Pricing For more information and customized pricing, please contact [email protected].
Page 196
Customized Research Results Available
Sustainability – What Matters? | Governance & Accountability Institute, Inc.
OTHER CUSTOMIZATION OPTIONS We can design a custom materiality indicator ranking report for your individual needs. The companies themselves can be hand-selected to be the universe used in our ranking methodology. Utilizing the data from this research we can develop the results that you need for any application or purpose. The database was designed to be comprehensive and customizable so that we can sift/sort and query the information to get the answers that you need. We can also customize the universe of companies used in our methodology to provide a custom ranking / report utilizing the following options available in our comprehensive database:
1. Company Name 2. Size 3. Organization Type 4. Listed / Non-Listed 5. Sector (35 sectors list provided in beginning of report) 6. Country 7. Region 8. Integrated / Non-Integrated 9. Type of Report (GRI G3, G3.1, G4) 10. Application Level (A, B, C, Core, Comprehensive) 11. Status (Self Declared, Third Party Checked, GRI-Checked) 12. External Assurance 13. Type of Assurance Provider
• Assurance Provider Name • Assurance Scope • Level of Assurance • Assurance Standards Used (AA 1000 AS, ISAE3000, etc)
14. Sector Supplements 15. OECD, UNGC, CDP, IFC, ISO (yes/no on each)
Pricing For more information and customized pricing, please contact [email protected]. OTHER CHOICES G&A Institute internal databases are very flexible. What are your needs? Let us know and we will do our best to meet them. Please contact us at [email protected].
Page 197
sustainability — what matters? Authors and Researchers
AUTHORS & ARCHITECTS Hank Boerner, Chairman, Chief Strategist and Co-Founder Governance & Accountability Institute, Inc. Louis D. Coppola, Executive Vice President and Co-Founder Governance & Accountability Institute, Inc. TEAM CONTRIBUTORS Amy Gallagher, Vice President, Client Services and Creative Director Governance & Accountability Institute, Inc. Peter M. Hamilton, Senior Vice President, Media Relations Governance & Accountability Institute, Inc. LEAD RESEARCHERS
• Laura Ana Jardieanu • Santiago Viteri
SUPPORTING RESEARCHERS
• Eli Bach • Jamie Reinhardt

Authors and Researchers
Sustainability – What Matters? | Governance & Accountability Institute, Inc.
A U T H O R A N D A R C H I T E C T
Hank Boerner Chairman, Chief Strategist and Co-Founder Governance & Accountability Institute, Inc.
Hank Boerner is Chairman of Governance & Accountability Institute, a New York-based research, knowledge management, advisory and strategies service provider. The Institute serves clients in the corporate sector, capital markets organizations and the not-for-profit sector / civil society NGOs.
Hank leads the Institute team’s work dealing with a wide variety of assignments in sustainability, corporate responsibility, corporate governance, issue management, crisis management, corporate governance, and strategic corporate communications.
He has been a corporate manager, business strategist, issue management consultant and senior level strategy advisor for more than 30 years, most frequently supporting clients with issues management services and programs. Hank's current work is focused on identifying issues in ESG (environmental, societal, governance performance factors) and assisting corporate managements in developing strategies, organizing teams and initiatives, coaching executives, assisting in the disclosure and communication of the company's sustainability journey.
Hank was a partner in the Rowan & Blewitt management consulting organization for two decades before co-founding the Institute. (The Rowan & Blewitt issue and crisis management practice was acquired by Interpublic Group of Companies - NYSE:IPG.)
Hank is active in key professional organizations including the US Forum for Sustainable & Responsible Investing (US SIF), the National Association of Corporate Directors (NACD), the New York Society of Securities Analysts (NYSSA), and the National Investor Relations Institute (NIRI). He was recognized by the NACD in the Directorship 100 ranking, 2011 and 2012 as one of "people to watch in corporate governance affairs."
Hank has been a contributing editor for Corporate Finance Review (Thomson Reuters) for 12 years, writing on corporate governance, sustainability and related issues for the CFO and financial executive audience, and has authored commentaries for such business publications as Financial Times, Bloomberg BNA, and other print and digital platforms.
Earlier in his career, Hank was a board elected officer and head of communications of the New York Stock Exchange, managing all communications; served American Airlines as the first corporate responsibility officer; and was a senior communications officer of the NY Metropolitan Transportation Authority. He served in Governor Nelson Rockefeller's administration.
Contact Information hboerner @ga-institute.com
Page 199
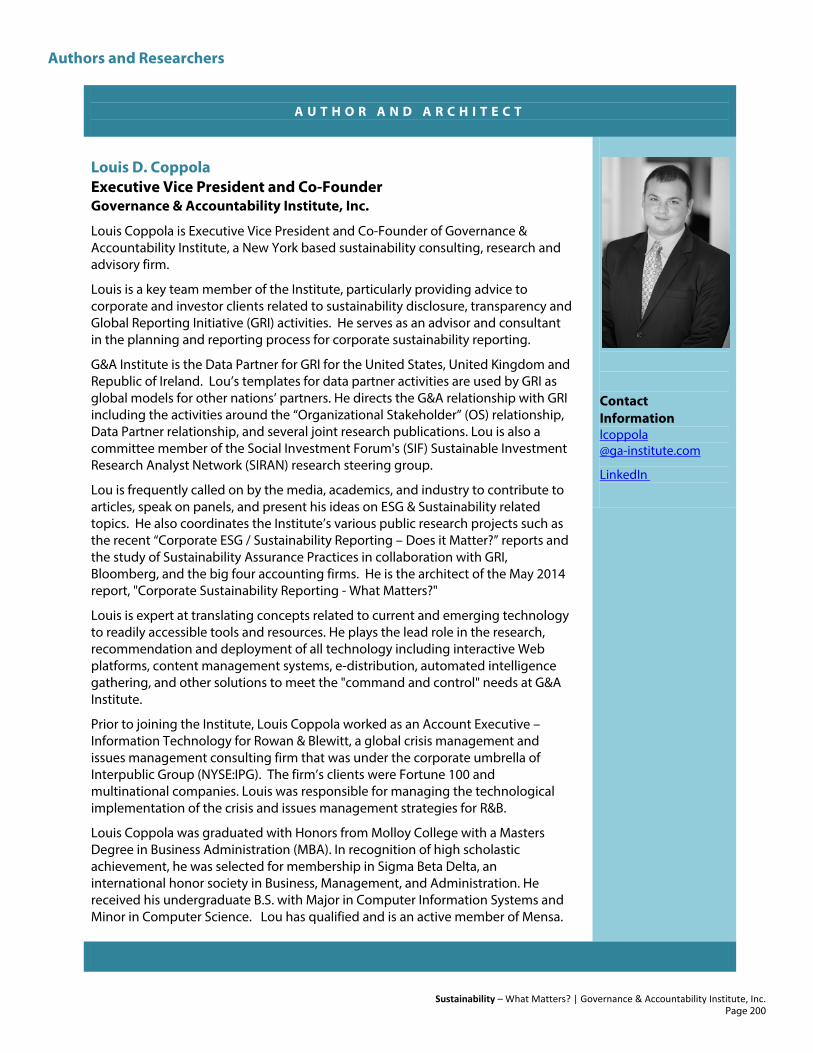
Authors and Researchers
Sustainability – What Matters? | Governance & Accountability Institute, Inc.
A U T H O R A N D A R C H I T E C T
Louis D. Coppola Executive Vice President and Co-Founder Governance & Accountability Institute, Inc.
Louis Coppola is Executive Vice President and Co-Founder of Governance & Accountability Institute, a New York based sustainability consulting, research and advisory firm.
Louis is a key team member of the Institute, particularly providing advice to corporate and investor clients related to sustainability disclosure, transparency and Global Reporting Initiative (GRI) activities. He serves as an advisor and consultant in the planning and reporting process for corporate sustainability reporting.
G&A Institute is the Data Partner for GRI for the United States, United Kingdom and Republic of Ireland. Lou’s templates for data partner activities are used by GRI as global models for other nations’ partners. He directs the G&A relationship with GRI including the activities around the “Organizational Stakeholder” (OS) relationship, Data Partner relationship, and several joint research publications. Lou is also a committee member of the Social Investment Forum's (SIF) Sustainable Investment Research Analyst Network (SIRAN) research steering group.
Lou is frequently called on by the media, academics, and industry to contribute to articles, speak on panels, and present his ideas on ESG & Sustainability related topics. He also coordinates the Institute’s various public research projects such as the recent “Corporate ESG / Sustainability Reporting – Does it Matter?” reports and the study of Sustainability Assurance Practices in collaboration with GRI, Bloomberg, and the big four accounting firms. He is the architect of the May 2014 report, "Corporate Sustainability Reporting - What Matters?"
Louis is expert at translating concepts related to current and emerging technology to readily accessible tools and resources. He plays the lead role in the research, recommendation and deployment of all technology including interactive Web platforms, content management systems, e-distribution, automated intelligence gathering, and other solutions to meet the "command and control" needs at G&A Institute.
Prior to joining the Institute, Louis Coppola worked as an Account Executive – Information Technology for Rowan & Blewitt, a global crisis management and issues management consulting firm that was under the corporate umbrella of Interpublic Group (NYSE:IPG). The firm’s clients were Fortune 100 and multinational companies. Louis was responsible for managing the technological implementation of the crisis and issues management strategies for R&B.
Louis Coppola was graduated with Honors from Molloy College with a Masters Degree in Business Administration (MBA). In recognition of high scholastic achievement, he was selected for membership in Sigma Beta Delta, an international honor society in Business, Management, and Administration. He received his undergraduate B.S. with Major in Computer Information Systems and Minor in Computer Science. Lou has qualified and is an active member of Mensa.
Contact Information lcoppola @ga-institute.com
Page 200

Authors and Researchers
Sustainability – What Matters? | Governance & Accountability Institute, Inc.
T E A M C O N T R I B U T O R
Amy Gallagher Vice President, Client Services and Creative Director Governance & Accountability Institute, Inc.
Amy Gallagher is Vice President of Client Services and Creative Director at Governance & Accountability Institute and has been associated with the G&A team for over 20 years. She serves as project manager for all client-related activities.
As Creative Director, Amy is expert in desktop publishing, graphics and design and oversees all design elements related to client projects and Institute research reports. She is responsible as well for the conference coordination activities of G&A Institute (the company collaborates with three dozen or more conference sponsors each year).
As Vice President of Client Services, Amy’s project management skills keep client projects and programs moving on scheduled timelines to meet established deadlines. Amy is experienced in oversight of full service research, issue monitoring and interactive communication programs.
In depth projects elements include research reports, issue monitoring, design, development and security of marketing and Internet communications programs; design and development of custom public Web sites and private password protected secure Intranet sites; as well as training for Web site maintenance and updating on Typo3 programming platforms. Among her responsibilities is the development and management of customized, proprietary databases for client organizations in the corporate and not-for-profit sectors.
Amy’s portfolio of skills is utilized to design, create and manage communication and marketing outreach programs for clients, centered on online communications and database operations. Amy has designed grassroots, media, third party, stakeholder, activist, and government agency databases for client communication programs.
Previously, Amy was an Account Executive for Rowan & Blewitt Incorporated, a global issues and crisis management consulting organization serving multinationals and Fortune 100 clients in the United States and abroad. She worked closely with clients in creating information management systems to help clients meet their needs.
Amy was graduated from Dowling College with a B.S. in Computer Science. She holds advanced training certificates in HTML Scripting and Web Page Design and is expert in software applications, desktop publishing, data structures, file processing, security, statistics, operations research and Typo3 Web platform management. While in college Amy participated in the Presidential Scholars scholarship program and contributed to the River Run Literary Magazine.
Contact Information agallagher @ga-institute.com
Page 201

Authors and Researchers
Sustainability – What Matters? | Governance & Accountability Institute, Inc.
T E A M C O N T R I B U T O R
Peter Hamilton Senior Vice President, Media Relations Governance & Accountability Institute, Inc.
Peter M. Hamilton is an experienced media relations professional who has managed a wide range of communications assignments for clients. He is Senior Vice President of Media Relations at G&A Institute.
Peter maintains extensive contacts throughout print, broadcast, wire service, electronic, digital platforms, and new media platforms. He rejoined the G&A team a decade ago after his tenure as a senior manager (and member of the executive committee) of the Rubenstein Associates organization in New York City. (Peter was responsible for management of media relations for a broad range of clients in media, including business, finance and real estate editors, and other business-related categories.)
He is an effective publicist in many sectors and industries, including real estate, retail, supermarket, banking, university, advertising, magazine publishing, media industry/industry-related international, dot-coms, and biotechnology. He maintains collaborative relations with key authors, journalists, bloggers, commentators, and other communicators focused on sustainability and corporate responsibility topics.
Peter began his career with the National Broadcasting Company (NBC) where he was involved with the publicity for all corporate functions, NBC's prime time schedule and all NBC operating and staff divisions. He was a unit publicist for a number of programs including SATURDAY NIGHT LIVE, THE TOMORROW SHOW STARRING TOM SNYDER, and liaison and unit publicist for NBC's television network White House program specials. He was also manager of corporate press relations for NBC.
He was subsequently recruited by Young & Rubicam, then the world's largest U.S.-based advertising agency where he was responsible for press relations for the creative product and businesses of all of Y&R's domestic general advertising agencies, and also for those specializing in direct marketing and medical advertising.
Prior to joining Rubenstein Associates in 1994 Hamilton was media relations manager for R&B Communications Service, an affiliate of the Rowan & Blewitt global management consulting organization. Peter was responsible for media communications for such clients as American Wood Preservers Institute and Moran Stahl and Boyer (relocation consultants) Peter worked with senior editors on creation of Fortune magazine's annual "Best Places to Do Business," and promotion of cities across the nation.
He also managed his own consultancy where he created the national publicity material for the acclaimed PBS miniseries, THE CIVIL WAR (producer, Ken Burns).
Contact Information Email phamilton @ga-institute.com
Page 202
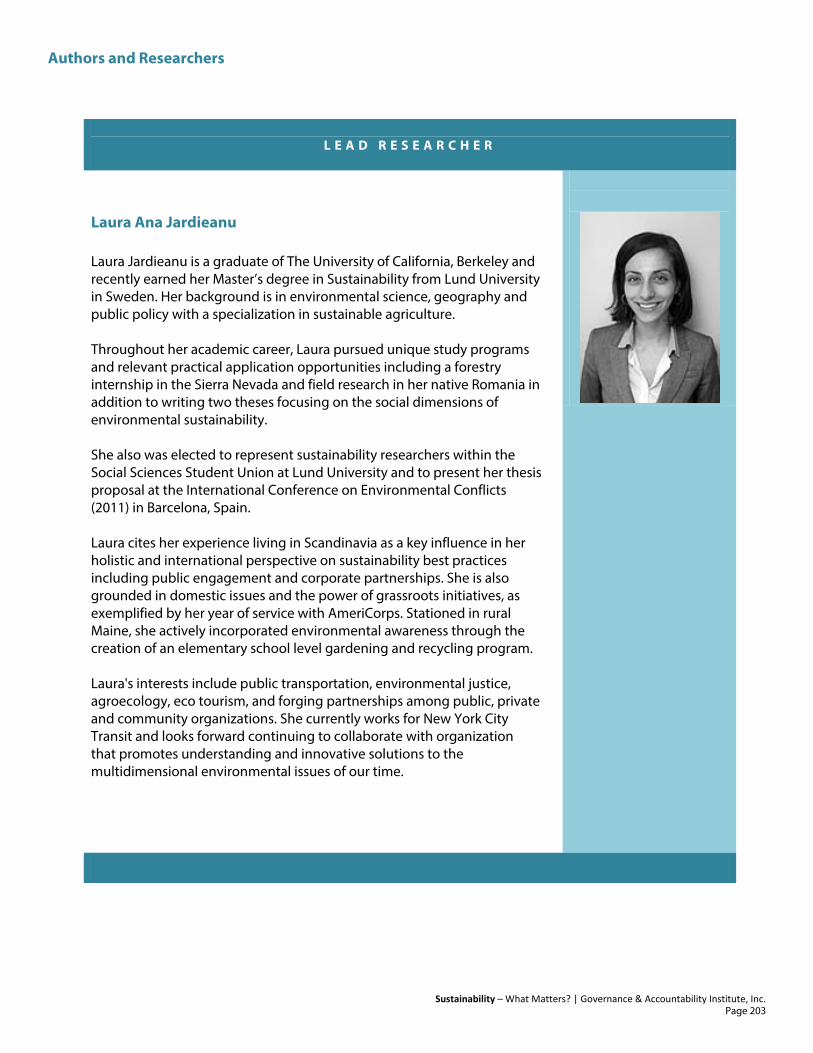
Authors and Researchers
Sustainability – What Matters? | Governance & Accountability Institute, Inc.
L E A D R E S E A R C H E R
Laura Ana Jardieanu Laura Jardieanu is a graduate of The University of California, Berkeley and recently earned her Master’s degree in Sustainability from Lund University in Sweden. Her background is in environmental science, geography and public policy with a specialization in sustainable agriculture. Throughout her academic career, Laura pursued unique study programs and relevant practical application opportunities including a forestry internship in the Sierra Nevada and field research in her native Romania in addition to writing two theses focusing on the social dimensions of environmental sustainability. She also was elected to represent sustainability researchers within the Social Sciences Student Union at Lund University and to present her thesis proposal at the International Conference on Environmental Conflicts (2011) in Barcelona, Spain. Laura cites her experience living in Scandinavia as a key influence in her holistic and international perspective on sustainability best practices including public engagement and corporate partnerships. She is also grounded in domestic issues and the power of grassroots initiatives, as exemplified by her year of service with AmeriCorps. Stationed in rural Maine, she actively incorporated environmental awareness through the creation of an elementary school level gardening and recycling program. Laura's interests include public transportation, environmental justice, agroecology, eco tourism, and forging partnerships among public, private and community organizations. She currently works for New York City Transit and looks forward continuing to collaborate with organization that promotes understanding and innovative solutions to the multidimensional environmental issues of our time.
Page 203

Authors and Researchers
Sustainability – What Matters? | Governance & Accountability Institute, Inc.
L E A D R E S E A R C H E R Santiago Viteri Santiago Viteri is an industrial engineer with more than seven years of experience in developing markets, managing technological transitions in banks and financial institutions. He is currently a candidate in the Full-Time MBA program at Baruch College’s Zicklin School of Business, majoring Sustainability and Computer Information. A seasoned negotiator, results-oriented business and technology professional, Santiago is seeking a sustainability manager position that requires strong business and organizational leadership skills, broad knowledge of sustainable practices, and experience in strategic business and technology planning. Santiago works as an analyst for the Governance & Accountability Institute. He has analyzed hundreds of corporate and institutional sustainability reports to be included in the GRI's Sustainability Reporting database, and collaborated on the research and publication of “Sustainability – What Matters?,” a unique and comprehensive analysis and report of materiality information of 84 GRI sustainability performance indicators.
Page 204
Authors and Researchers
Sustainability – What Matters? | Governance & Accountability Institute, Inc.
S U P P O R T I N G R E S E A R C H E R S
The team at G&A Institute would like to thank the following individuals for their assistance in preparing this analysis. Their contributions helped to make the analysis more insightful, accurate and meaningful to users.
Eli Bach Intern Governance & Accountability Institute, Inc.
Jamie Reinhardt Intern Governance & Accountability Institute, Inc.
Page 205

about governance & accountability institute, inc.
Helping Leaders and Organizations Recognize, Understand and Address Critical ESG Factors to Build More Sustainable Enterprises in the Corporate, Social and Public Sectors…
CONSULTING, STRATEGY AND RESEARCH SERVICES Governance & Accountability Institute, Inc. is a private sector consulting, strategy, and research services company focused on the key issues of sustainability and corporate responsibility. We serve the leaders and boards of organizations in the corporate sector and in the investment community. The Institute provides a portfolio of services and resources to help managers detect, identify, understand, monitor, quantify, analyze, address, and communicate their progress in meeting sustainability challenges.
We work closely with clients to effectively navigate their sustainability journey….
We help clients to better understand the importance of key ESG performance factors that increasingly affect and shape corporate reputation, market valuation and public & industry perception. G&A Institute assists corporations in creating and executing winning strategies that maximize return on investment at every step of their Sustainability Journey. We help organizations recognize, understand and address sustainability issues to address stakeholder and shareholder concerns. And we assist in structuring and managing third party engagements to assist managements in resolving issues of concern to key stakeholders. The focus on corporate ESG performance is about understanding and addressing critical issues of prime importance to investors and stakeholders affecting companies in the investors' portfolios.
ABOUT GOVERNANCE & ACCOUNTABILITY INSTITUTE, INC.
Sustainability – What Matters? | Governance & Accountability Institute, Inc.
The Institute resources are designed to support such organizational functions and specialty areas as: Sustainability, Enterprise Risk Management (ERM); Environmental Health & Safety (EHS); Corporate Social Responsibility (CSR); Stakeholder Engagement; External & Public Affairs; Marketing; Board Stewardship; Legal / Litigation; Human Resources; Investor Relations (IR); Corporate Communications; Financial Analysis…and more. G&A Institute is the exclusive Data Partner for the Global Reporting Initiative (GRI) in the USA, United Kingdom and the Republic of Ireland. In 2013 we analyzed over 600 US Sustainability reports from a wide range of industries and sectors, and geographies, and encompassing a wide range of stakeholders, ESG issues, and data. No other consulting organization has the depth and breadth of knowledge related to U.S. corporate sustainability & responsibility reporting. Analyzing these many corporate and institutional reports has enabled us to structure many unique resources for our clients. Briefly, our sustainability-focused services include: Counseling & Development of Strategies; Sustainability Disclosure and Structured Reporting; Materiality Assessments; Stakeholder Engagement; Benchmarking; Investor Relations resources focused on sustainable investment; Communications; Coaching, Team Building & Training; Issues Monitoring & Customized Research; Third Party Recognitions. No matter where your organization may be in its sustainability journey -- just beginning, or far along and the process maturing -- the G&A Institute team can assist. We design our service offerings and resources to accommodate client needs at every stage in the journey, to enhance the journey by assisting in the navigation of issues and challenges that are posed by today's dynamic, global business environment.
Page 207

ABOUT GOVERNANCE & ACCOUNTABILITY INSTITUTE, INC.
Sustainability – What Matters? | Governance & Accountability Institute, Inc.
G&A INSTITUTE | GRI's Exclusive US, UK and Ireland Data Partner G&A Institute is the exclusive GRI Data Partner in the United States of America. In this role, it is our responsibility to monitor, collect and analyze every sustainability, corporate responsibility, or corporate citizenship report issued by US entities (domestic companies and non-US entities issuing reports for their US operations). This includes analysis of GRI-compliant, GRI-referenced and non-GRI reports, in various formats – print, digital and hybrids. We serve as a central clearinghouse for sustainability reporting in the three countries. You can receive immediate news of sustainability and responsibility reports published in these countries in several ways - via our web sites, or Twitter accounts. Our databases created from these activities enable us to keep our finger on the pulse of corporate sustainability, and help our clients become sustainability leaders and receive more return on their investment. Citing the quality of our work, GRI now demonstrates our systems and methods as a model for data partners around the world (in other geographic areas). In 2012, the Institute was given the honor of being invited to be the sole data partner for the United Kingdom and The Republic of Ireland in addition to continuing our duties in the USA. Governance & Accountability Institute, Inc. is also an Organizational Stakeholder of the Global Reporting Initiative. We provide GRI with trend analysis and often conduct research with GRI and their partners.
Page 208

ABOUT GOVERNANCE & ACCOUNTABILITY INSTITUTE, INC.
Sustainability – What Matters? | Governance & Accountability Institute, Inc.
G&A INSTITUTE | Communications Background and Services We are known for our work by many media organizations; journalists, editors, broadcasters and platform publishers and they are regularly in touch with the G&A team as reliable sources. Key media outlets know that we have the most complete data, information and intelligence on trends, stories, and innovations in the corporate sustainability field. Because we have been doing this for over seven years we have built many strong relationships with media and are known as the definitive “go to” source for this information. Among these, we enjoy relationships with sustainability editors at publications like The Wall Street Journal, Bloomberg, CR Magazine, Responsible Investor, Ethical Corporation, CFO Magazine, Corporate Finance Review, Forbes, Fortune and many others, including trade publications. Since the founders, Hank Boerner and Louis Coppola launched G&A Institute they have developed effective communications platforms for sharing of information and intelligence -- web sites, newsletters, social media platforms, and other channels. These channels command attention in the sustainability space and the Institute has developed a loyal and dedicated following that relies on us for sustainability, corporate responsibility, Socially Responsible Investing (SRI) and ESG-related information. In our own channels and on our platforms we feature and highlight stories, articles, companies and people that we feel would be interesting to our connections in the corporate, investing, NGO, media, government, and other sectors. These web properties include:
WEB PRESENCE
• Accountability Central — www.accountability-central.com
• Sustainability HQTM — www.sustainabiltyhq.com
• G&A Institute’s Sustainability UpdateTM Blog — www.ga-institute.com/Sustainability-Update
• Sustainability HQ TM Highlights (newsletter) — www.sustainabilityhq.com/sustainabilityhq-home/weekly-highlights/
• Plus numerous social media outlets such as Facebook, LinkedIn, multiple Twitter accounts and more…
Our weekly newsletter — SustainabilityHQTM Highlights — has a loyal readership of around 10,000 subscribers who have expressed interest in learning more about sustainability topics that we share. The readers are from various sectors and backgrounds, such as media, corporate CSR leaders, SRI and mainstream investors, NGOs, Academic Institutions, Government, and other important stakeholders focused on ESG issues.
Page 209

ABOUT GOVERNANCE & ACCOUNTABILITY INSTITUTE, INC.
Sustainability – What Matters? | Governance & Accountability Institute, Inc.
At G&A, we partner with publishers, news organizations, financial and business information providers — these include CR Magazine, Ethical Corp, Financial Times, Bloomberg, Responsible Investor, Sustainable Brands, TBLI, the Better Business Bureau, and others on promoting their events to our audiences. They rely on us to help build awareness and attendance to these events and in return we have unique relationships which we leverage for our clients. Our communications team is focused on Sustainability / CSR / SRI, and our systems and resources, tools, relationships, data, knowledge, and experience base are unparalleled when it comes to this area of focus. We provide more value for our clients in this area than any other communications firm. And we consistently deliver results that are above and beyond the expectations of our client.
G&A INSTITUTE | Investor Network Background and Services G&A Institute team members have important affiliations that are resources for the types of services highlighted above. We are members of the sustainable investment trade association, the Forum for Sustainable & Responsible Investment (US SIF), and its analyst arm, SIRAN (Sustainable Investment Research Analysts Network). We collaborate closely with Bloomberg, Thomson Reuters, MSCI, IW Financial, GMI Ratings, Robeco SAM, and a number of other independent third party service providers (some also manage assets for their clients). Louis Coppola is a member of the SIRAN research committee, and Hank Boerner is vice chairman of the New York Society of Securities Analysts' sustainable investment committee (NYSSA). He is also contributing editor and governance commentator for Corporate Finance Review (a Thomson Reuters journal for financial executives), since 2002.
INVESTOR SERVICES SUPPORT - OBJECTIVES
Our IR service support includes such resources as:
• Crafting messages for the mainstream and SRI communities to position the company's sustainability story among key connections and thought leaders;
• Building greater investment community awareness and appreciation of our clients sustainability efforts;
• Ensuring that third party sustainable investment data providers have more complete and accurate information on the company, to encourage the service providers to portray our clients in the best possible light (these independent firms welcome such assistance; more accurate and complete information on companies, benefits all parties);
• Helping our clients access new sources of capital, within the existing shareholder base, and in identifying and engaging with sustainable investors focused on long-term appreciation for sources of new capital.
Page 210
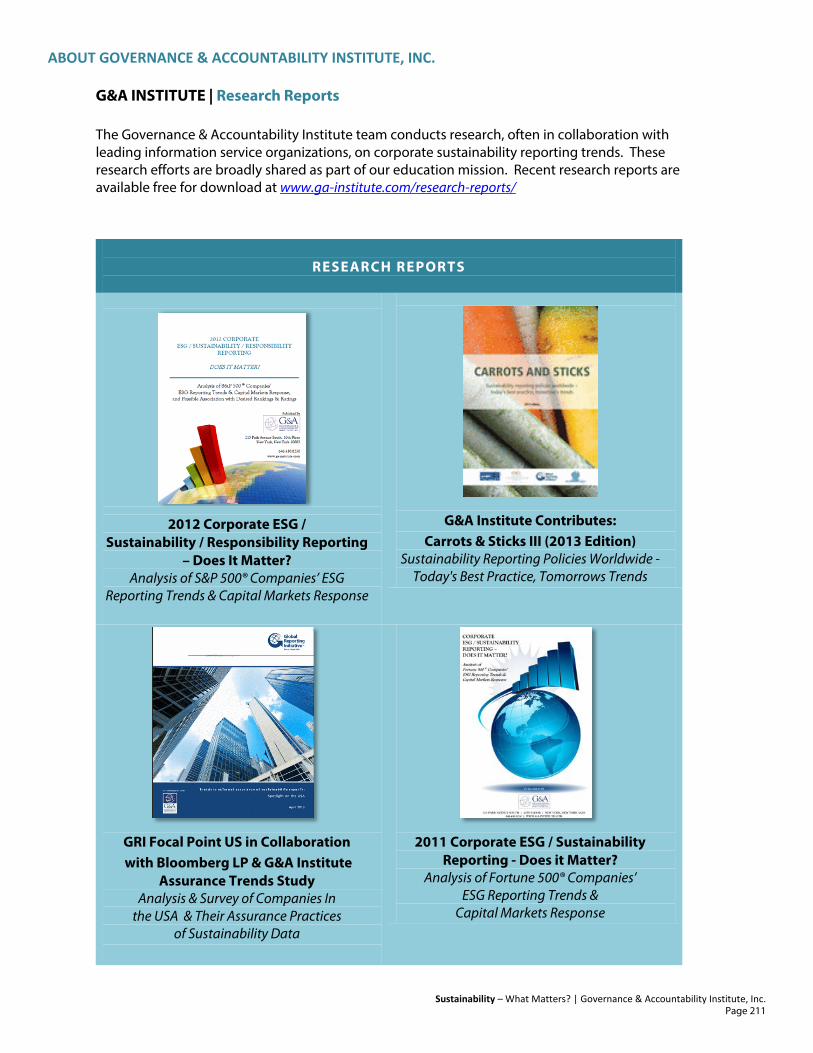
ABOUT GOVERNANCE & ACCOUNTABILITY INSTITUTE, INC.
Sustainability – What Matters? | Governance & Accountability Institute, Inc.
G&A INSTITUTE | Research Reports The Governance & Accountability Institute team conducts research, often in collaboration with leading information service organizations, on corporate sustainability reporting trends. These research efforts are broadly shared as part of our education mission. Recent research reports are available free for download at www.ga-institute.com/research-reports/
RESEARCH REPORTS
2012 Corporate ESG / Sustainability / Responsibility Reporting
– Does It Matter? Analysis of S&P 500® Companies’ ESG
Reporting Trends & Capital Markets Response
G&A Institute Contributes: Carrots & Sticks III (2013 Edition)
Sustainability Reporting Policies Worldwide - Today's Best Practice, Tomorrows Trends
GRI Focal Point US in Collaboration with Bloomberg LP & G&A Institute
Assurance Trends Study Analysis & Survey of Companies In
the USA & Their Assurance Practices of Sustainability Data
2011 Corporate ESG / Sustainability Reporting - Does it Matter?
Analysis of Fortune 500® Companies’ ESG Reporting Trends &
Capital Markets Response
Page 211

ABOUT GOVERNANCE & ACCOUNTABILITY INSTITUTE, INC.
Sustainability – What Matters? | Governance & Accountability Institute, Inc.
G&A INSTITUTE | Services and Resources Highlights G&A Institute is an independent private sector consulting and research organization with resources and services structured to support corporate and investment community clients in every phase of their sustainability journey. Highlights of our suite of services and tools designed for progressive steps: Strategies, Advice and Consulting
• Introduction to ESG performance / sustainability / socially responsible investing (SRI)
• Workshops for staff (customized learning sessions)
• Briefing for management (public perceptions, organization's public sustainability profile)
• Strategy suggestions / scoping sustainability journey - roadmaps
• Organizing team(s) (structuring internal processes; support for teams)
• Ongoing strategies and tactical advice for internal teams
• Making the Business Case and Making the Investment Case (internal support for teams)
• Investor Perception Surveys / Analysis / Engagement with SRI analysts and asset managers Development of Sustainability Strategies and Programs
• Competitive analysis of peers and competitors (detailed charting and comparisons)
• Gap analysis of existing sustainability information (easy move - Non-GRI to GRI, or G3.1 to G4)
• Materiality assessments (critical element of GRI reporting, especially with G4 Framework)
• Stakeholder engagement (advice, research, facilitation -- this aids in Materiality process)
• Coaching, executive training and education (ongoing, periodic)
• Development of unique programs and initiatives (positioning for leadership roles)
• Support for senior management and boards - strategic thinking Publication of the Sustainability Report
• Advice on disclosure and reporting approaches / disclosure / aiming for transparency • Verifying compliance with recognized reporting standards • Data aggregation and presentation (to better measure/manage) • Writing and editing (from advice to hands-on assistance) • Graphic design and web production (all formats) • Full suite of video services (production & distribution) • Alignment with GRI Framework (very important part of reporting process) • Assurance for GRI reports (ensuring the trustworthiness of your data for important stakeholders) • Guidance with the GRI Application Level Check, Materiality Matters Process or other engagements
Page 212

ABOUT GOVERNANCE & ACCOUNTABILITY INSTITUTE, INC.
Sustainability – What Matters? | Governance & Accountability Institute, Inc.
Investor Relations / Sustainability / Responsibility Focus
• Profiling of shareholder list to identify sustainability opportunities • Crafting sustainability messages for investors - mainstream and sustainable investors • Identifying potential new sources of capital focused on sustainability • Arranging meetings with prominent SRI / Investor community members • Identifying / Profiling / Engagement with important third party investor sustainability data
providers • Ensure sustainability data at third party providers are accurate, complete, and in the best light • PR & Communications assistance for leading sustainable investment communications platforms
Report Launch and Developing Third Party Recognition • Distribution through G&A's unique communication channels -global reach • External PR and communications support services to generate broader visibility • Introduction of client to key sustainability media connections • Developing media coverage – through relationships with leading CSR and SRI editors • Positioning organization, leaders and reports for third party awards and recognitions (liaison with
awards organizations; preparation of entries; response to queries) • Match third party information and profile with company realities (correct incomplete or inaccurate
information that analysts and stakeholder access) • Positioning for leading reputational lists, rankings and ratings • Assistance in responding to queries from third parties • Assistance with structuring 3BLMedia / CSRwire service programs
Page 213

sustainability — what matters?
There are many ways that the Institute can help you in your
Sustainability Journey...
Please take the first step and schedule an introductory call
with the team at G&A Institute.
We are here to help!
Governance & Accountability Institute, Inc. 845 Third Avenue, Suite 644 New York, New York 10022
646.430.8230 [email protected] www.ga-institute.com