swampy sw gs2 - geoscience projects and initiatives - … · · 2017-10-26swampy sw_gs2 bonita...
TRANSCRIPT
ABM Resources NL. – 2012 DPG Geochemical Sampling Programme 4/12/2012
Page | 1
ABN 58 000 127 020
Swampy SW_GS2
Bonita Project – EL29368
Deep Penetrating Geochemistry (DPG) – Geochemical Sampling Programme
December 2012
Rebecca Richards

ABM Resources NL. – 2012 DPG Geochemical Sampling Programme 4/12/2012
Page | 2
ABM Resources NL. – 2012 DPG Geochemical Sampling Programme 4/12/2012
Page | 3
Table of Contents Overview .................................................................................................................................... 5
1. Objectives ......................................................................................................................... 6
1.1 Survey Details .................................................................................................................. 6
1.2 Weak acid leach / partial leach Orientation Study ......................................................... 8
2. Methodology .................................................................................................................... 8
2.1 Field Sampling ................................................................................................................. 8
2.2 Lab Methodology – Leach technologies & techniques ................................................... 9
2.21 Ionic leach ............................................................................................................... 10
2.22 Au-ICP21 ................................................................................................................. 10
3. Sampling QAQC ............................................................................................................... 10
3.1 Sampling depth ............................................................................................................. 11
3.2 Laboratory QAQC .......................................................................................................... 11
3.2.1 Standards ............................................................................................................... 11
3.2.2 Blanks ..................................................................................................................... 11
3.2.3 Field Duplicates...................................................................................................... 12
4. Results ............................................................................................................................. 14
4.1 Laboratory Results ......................................................................................................... 14
4.1.1 Ionic Leach ............................................................................................................. 14
4.1.2 Au_ICP21 – Fire Assay with ICPMS finish .............................................................. 16
4.2 Evaluation of Laboratory methods ................................................................................ 16
5. Interpretation of Laboratory Results and Discussion ..................................................... 18
5.1 Multielement response across mineralisation .............................................................. 18
5.2 Low Detection geochemical method comparison (ME_MS23 vs. Au_ICP21).............. 21
5.3 Charcoal sorbtion effects (Burnt vs non-burnt sampling sites) .................................... 21
5.4 Effect of observed sampling variables .......................................................................... 22
6. Conclusions & Recommendations .................................................................................. 26
7. References ...................................................................................................................... 26
APPENDICES ............................................................................................................................. 27
APPENDIX 1. Assay Techniques ........................................................................................... 28
APPENDIX 2. Multielement Response ................................................................................. 29
ABM Resources NL. – 2012 DPG Geochemical Sampling Programme 4/12/2012
Page | 4
Table of Figures
Figure 1. Planned Swampy Surveys (Swampy regional SW_GS2 & Swampy pH SW_GS1 (red)), over geological controls (500k Map sheet Interpreted Geology – North Arunta). Pink - undifferentiated intrusives; Grey/brown –undifferentiated low grade facies Lander Rock Beds (sedimentary marine); Light Blue (stippled) – amphibolite facies Lander Rock Beds, including some dolerite; Dark Blue (stippled) moderate facies Lander Rock Beds. .................................................................. 7
Figure 2. Aeromagnetic image over Swampy Surveys (Swampy regional SW_GS2 & Swampy pH SW_GS1 (red)). .............. 8
Figure 3. Ionic leach gold results Original Sample compared to duplicate sample. ................................................................. 14
Figure 4. Probability Normal Plot showing stepped and poor data response for elements for the Ionic Leach. ...................... 15
Figure 5. Probability Normal Plot showing good data response for elements for the Ionic Leach. .......................................... 15
Figure 6. Probability normal plot for Au - Au_ICP21 method. .................................................................................................. 16
Figure 7. Au ppm - ME-MS23 Ionic Leach method (Left) compared to the results of the Au_ICP21 Fire Assay Result(Right). ................................................................................................................................................................................................. 17
Figure 8. Probability Normal Plot showing data response for elements for the Ionic Leach (green) and Fire Assay (red) methods. .................................................................................................................................................................................. 18
Figure 9. Schematic map showing the Gold response over the Swampy 2 grid (SW_GS2). The red dashed line shows interpreted trend of the magnetic anomaly. The lines illustrate the interpreted regional structural trends. The results are gridded in ioGAS using unequal percentiles (0/30/60/80/90/95/98/99/100%). ........................................................................ 19
Figure 10. Gold response from SW_GS2. The results are thematically mapped in ioGAS using unequal percentiles (0/30/60/80/90/95/98/99/100%). .............................................................................................................................................. 20
Figure 11. Mineralisation Pathfinders showing spatial response across the Swampy (SW_GS2) Geochemical Survey. ....... 21
Figure 15.Recent weather events including evidence of recent fires observed over the Swampy regional Geochemical Survey. ..................................................................................................................................................................................... 22
Figure 16. Top: Variation in Regolith, Lithology and alteration underlain by the Gold results from Ionic Leach over the Swampy Geochemical Survey. Bottom: Variation in Terrain and Vegetation underlain by the Gold results from Ionic Leach over the Swampy Geochemical Survey. .................................................................................................................................. 24
Figure 17. Top - Elevation variation observed over the Swampy Geochemical Survey. Bottom– Gold results from Ionic Leach over the Swampy Geochemical Survey. .................................................................................................................................. 25

ABM Resources NL. – 2012 DPG Geochemical Sampling Programme 4/12/2012
Page | 5
Overview The majority of the outcropping and sub cropping gold bearing deposits in the Northern Territory have been discovered. Increasingly Explorers are looking for buried deposits; complex regolith profiles and transported cover hinder these efforts. ABM is looking to trial new techniques (namely Deep Penetrating Geochemistry (DPG)) that look specifically for deposits buried under cover with very low (ppb to ppt concentrations) surface geochemical signals. The DPG techniques all assume that there is some form of upward movement of ions have taken place through the cover and change the surface chemistry in some detectable fashion. Techniques include multiple weak leach techniques, pH & conductivity surveys and very low detection laboratory assays. The aim of these techniques is to detect mineralisation that is essentially blind at surface and covered by many metres of exotic cover. After a successful Orientation study at the Buccaneer porphyry, completed in 2011, the Regional Geochemical Project is being applied and undertaken on regional projects across ABM’s extensive tenure.

ABM Resources NL. – 2012 DPG Geochemical Sampling Programme 4/12/2012
Page | 6
1. Objectives ABM Resources have selectively sampled surface samples from active tenements in the Tanami-Arunta region in 2010 and conducted a successful orientation study over Buccaneer in 2011 with positive results, several new prospects were identified. Consultation with industry professionals such as Dave Heberlein defined a more effective, efficient and accurate sampling programme covering large areas of land systematically and economically. The DPG techniques will involve a combination of pH sampling, weak leach technologies and laboratory trials of multiple low detection assay techniques namely weak leach / partial leach technologies. The beauty of the pH sampling and the weak acid leach techniques is that we can conduct them simultaneously at the same sample locations, within the same sampling programme. This saves on time and cost and allows comparison between the techniques and utilisation of the results simultaneously. The pH sampling requires minimal equipment and results are instant. 1.1 Survey Details
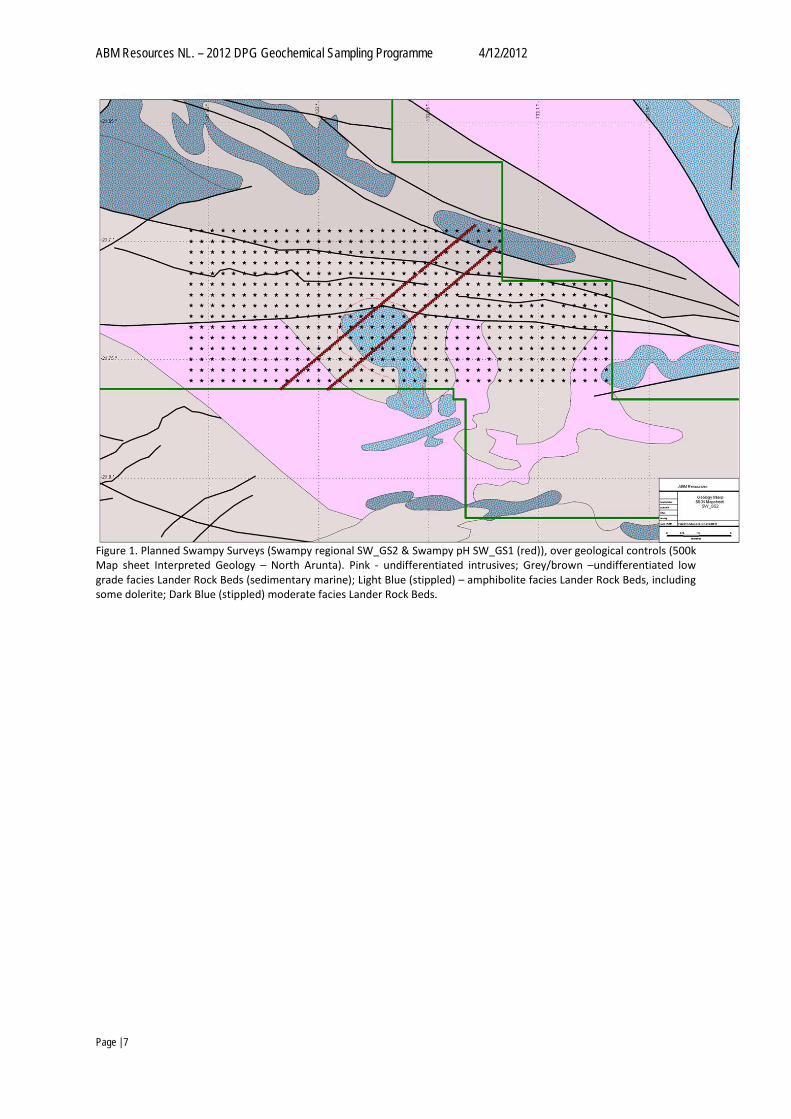
The Swampy geochemical survey was designed, in conjunction with SW_GS1 (DPG & pH survey), to target a magnetic anomaly on a greenfields target. The prospect has limited historical geochemical data (Au only) from a traverse 6 AC holes (between 45 -90m depth) across the magnetic anomaly. The max gold assay for Swampy was reported as 0.026ppm (AC hole). The Swampy survey is located in the North Arunta region within the Bonita project area and is comprised of Lander Rock Beds divided into 3 separate groups; an undifferentiated low grade facies, amphibolite facies including some dolerite & a moderate facies Lander Rock Beds. It is interpreted that the linear magnetic units are likely to be more magnetic BIF or intruded dolerites within the magnetic rock beds.
ABM Resources NL. – 2012 DPG Geochemical Sampling Programme 4/12/2012
Page | 7
Figure 1. Planned Swampy Surveys (Swampy regional SW_GS2 & Swampy pH SW_GS1 (red)), over geological controls (500k Map sheet Interpreted Geology – North Arunta). Pink - undifferentiated intrusives; Grey/brown –undifferentiated low grade facies Lander Rock Beds (sedimentary marine); Light Blue (stippled) – amphibolite facies Lander Rock Beds, including some dolerite; Dark Blue (stippled) moderate facies Lander Rock Beds.
ABM Resources NL. – 2012 DPG Geochemical Sampling Programme 4/12/2012
Page | 8
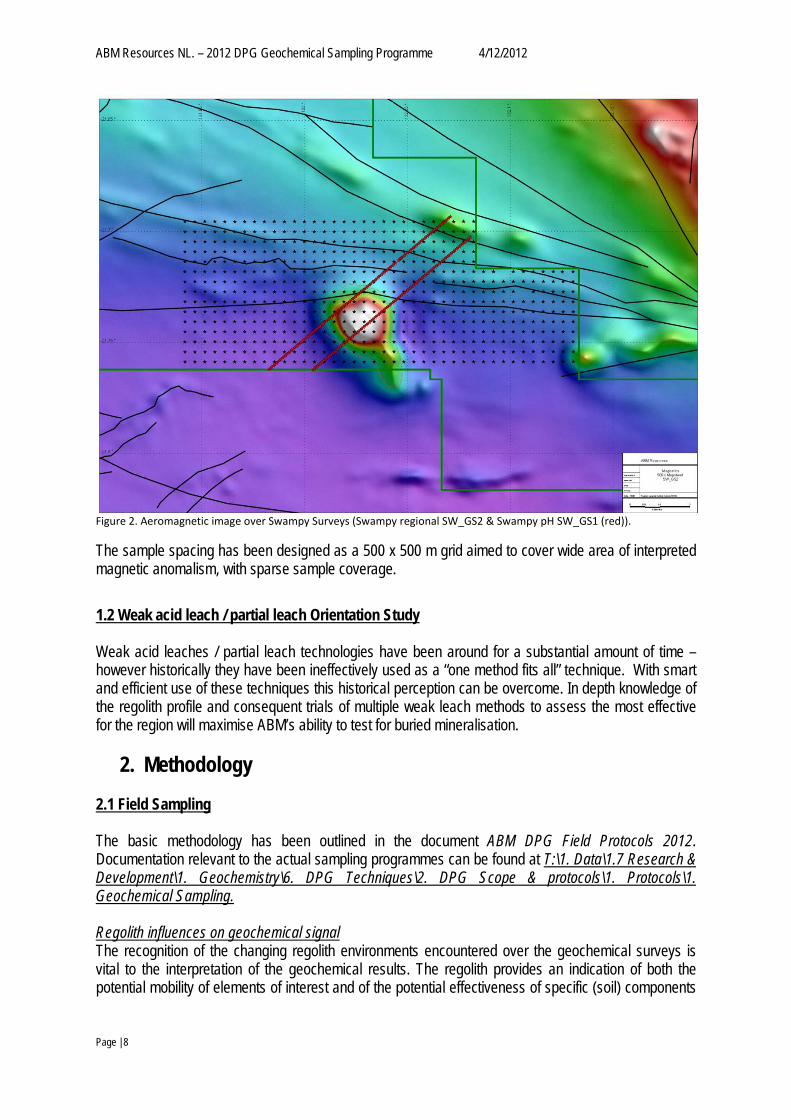
Figure 2. Aeromagnetic image over Swampy Surveys (Swampy regional SW_GS2 & Swampy pH SW_GS1 (red)).
The sample spacing has been designed as a 500 x 500 m grid aimed to cover wide area of interpreted magnetic anomalism, with sparse sample coverage.
1.2 Weak acid leach / partial leach Orientation Study Weak acid leaches / partial leach technologies have been around for a substantial amount of time – however historically they have been ineffectively used as a “one method fits all” technique. With smart and efficient use of these techniques this historical perception can be overcome. In depth knowledge of the regolith profile and consequent trials of multiple weak leach methods to assess the most effective for the region will maximise ABM’s ability to test for buried mineralisation.
2. Methodology 2.1 Field Sampling The basic methodology has been outlined in the document ABM DPG Field Protocols 2012. Documentation relevant to the actual sampling programmes can be found at T:\1. Data\1.7 Research & Development\1. Geochemistry\6. DPG Techniques\2. DPG Scope & protocols\1. Protocols\1. Geochemical Sampling. Regolith influences on geochemical signal The recognition of the changing regolith environments encountered over the geochemical surveys is vital to the interpretation of the geochemical results. The regolith provides an indication of both the potential mobility of elements of interest and of the potential effectiveness of specific (soil) components

ABM Resources NL. – 2012 DPG Geochemical Sampling Programme 4/12/2012
Page | 9
(horizons) as geochemical sample media. The eH-pH environment of the desert is alkaline, meaning that base metals and Iron are more stable and the control on mobility and pH is more carbonate based. Changes in regolith will be logged as Regolith, Lithology, Alteration and Colour of each of the individual samples collected. Any unusual observations will also be recorded. Additional Influences on geochemical signal Terrain, slope-dip, elevation, local vegetation and recent weather events can also greatly influence the geochemical signature of each sample. These will be recorded and geochemical assay results will be interpreted taking into account the influences. Terrain, Slope-Dip and Elevation can have a profound effect on the location / deposition of specific base metals and gold pathfinders. Steep terrains will influence drainage and erosion patterns and subsequent dispersion of analytes in the landscape. Although the geochemical techniques are targeted at the exogenic signal of the sample (for mineralisation undercover) these parameters can influence the results and must be taken into account during interpretation. Local vegetation can be important to capture in the data logging and interpretation as it can indicate subtle changes in elevation, landscape processes and different regolith regimes. In addition local vegetation can prefer areas anomalous in certain pathfinders and/or regolith. 2.2 Lab Methodology – Leach technologies & techniques Soil samples were submitted to ALS Perth where they were split for 2 analytical techniques; the Ionic Leach and a standard Fire Assay with an ICP-MS finish. The Ionic leach was established as the leading technique for deposits under cover in the Tanami region following the 2011 Orientation study of Buccaneer. The Fire assay technique is used as a back-up to the Ionic leach as ABM are entering terrains that may have high level ppm concentrations of gold. ABM want to be sure that the Ionic leach is picking up these stronger results and that the AU_ICP21 technique is also effective at picking up stronger signals. The methods are outlined below; the Ionic leach is aimed at determining the exogenic signal within the samples, i.e. the geochemical signal of the introduced ions from depth.
1. Ionic Leach ME-MS23 2. Fire Assay AU_ICP2121
The Ionic leach method is capable of low concentrations of base metals and other elements down to ppb (down to 0.00001) levels. The Fire Assay detects only in the ppm (down to 0.001 ppm) and has been analysed only for gold, no multielement results were generated for this method. None of the samples have been crushed prior to analysis. The instructions submitted to ALS Perth for sample preparation follow.
1. Samples to be shipped directly to Perth ALS for analysis a. samples shipped and stored separate from Drill samples
2. No milling 3. 1 kg sample split into 500g splits 4. 500g stored and 500g for analysis 5. 500g for assay subsampled to two separate techniques

ABM Resources NL. – 2012 DPG Geochemical Sampling Programme 4/12/2012
Page | 10
Specific instructions were also submitted to ALS Perth for sample analysis.
1. All samples are for LOW DETECTION Geochemistry and should be treated with caution and contamination minimised
2. Sieving conducted with special nylon sieves – ALS to provide 3. Sample shaken for 2 seconds prior to sampling for analysis by lab technician 4. Spoon used to sample material in vials are to be wiped by a new disposable tissue 6. Automatic high value analytical duplicates to be completed when elevated Au, Cu, Pb, Zn, Ni
Much of the Tanami region has been subjected to numerous fires and there is much charcoal residue in the soils. Charcoal is highly sorbtive for both organic and inorganic ions. Soil samples that are taken for analysis commonly contain some concentration of charcoal. Historically there has been little consideration for the metal scavenging effects of charcoal in soils and how this may affect the geochemical anomalies observed. Each sample collected will be logged in detail including any recent weather and /or fire events and any visible charcoal in the soil horizon. All measures have been taken by the lab to prevent any contamination to the low detection samples. ABM aims to extract the exogenic component and not the whole rock signal. By using a combination of leach techniques the Buccaneer Orientation Study determined the Ionic leach as the most effective technique for low detection sampling and gave geologists the best indication of the depth of the mobile ions from buried mineralisation reside. 2.21 Ionic leach The Ionic Leach (ALS Method ME-MS23) is a weak partial extraction geochemistry technique that targets accurate partial extraction of ionic species in soils. The leach is a static sodium sodium cyanide leach using chelating agent’s ammonium chloride, citric acid and EDTA with the leachant buffered at pH 8.5. The heavily buffered alkaline cyanide solution in conjunction with other complexing agents is designed to selectively dissolve or solubilise metal ions that have been mobilised from the primary source, migrated and then redeposited near the surface. The Ionic leach targets the loosely bound water soluble salts, acetate soluble secondary minerals, carbonates and limited Mn oxides. 2.22 Au-ICP21 The Au_ICP21 method is a standard Fire Assay Fusion (FA-FUSPG1) followed by Inductively Coupled Plasma – Atomic Emission Spectrometry (ICP-AES). This method is commonly conducted on Greenfield and brown fields rock and drill hole samples, producing a gold only result. A prepared sample is fused with a mixture of lead oxide, sodium carbonate, borax, silica and other reagents as required, inquarted with 6 mg of gold-free silver and then cupelled to yield a precious metal bead. The bead is digested in 0.5 mL dilute nitric acid in the microwave oven. 0.5 mL concentrated hydrochloric acid is then added and the bead is further digested in the microwave at a lower power setting. The digested solution is cooled, diluted to a total volume of 4 mL with de-mineralized water, and analysed by inductively coupled plasma atomic emission spectrometry against matrix-matched standards.
3. Sampling QAQC

ABM Resources NL. – 2012 DPG Geochemical Sampling Programme 4/12/2012
Page | 11
3.1 Sampling depth The first and foremost task was to conduct a pilot study (Buccaneer orientation study 2011) across the sampling lines comprising 4 soil pits dug to ~1-1.5m deep. These soil pits were then sampled at 10 cm intervals down to 1m depth and pH followed with a weak acid leach was conducted on each sample. Three repeats were completed for each sample to ensure robust results. The aim of the soil pit pilot study was to determine the optimum depth for sampling for the weak acid leaches / partial leach samples taking into account differing regolith/ cover characteristics (insitu vs. transported cover). The optimum depth is determined by a peak in acidity down the pH profile of soil pit. The peak indicates a level of iron accumulation, indicating a change in buffering capacity and is the optimum and most dynamic sampling point in the profile. This means that salts complexed with metals are accumulated in this zone and is therefore the best position for the extraction of mobile ions/element’s in the profile. The results determined that all 4 of the sampling pits had an optimum sampling depth of 10cm. Subsequent soil samples for the weak leach assays were taken at this depth in the Tanami region.
3.2 Laboratory QAQC
3.2.1 Standards Gannet Resources supplied a custom standard blended from SRM_18 & SRM_19. The custom blend was mixed from two standards that ALS currently uses for internal QAQC. Both of these standards have been used extensively for partial extraction methods and have nominal and upper/lower limit values for Au and a wide range of multielements. This standard is not certified but has been used extensively for ALS partial leaches and is designed for low detection limit methods. The pass or fail of the standard for each analyte has been determined as the comparison of the standard nominal value to the actual analysed result +/- the detection limit of that element for the method. In line with ABM Resources QAQC protocol for soil samples standards were inserted into the survey every 35th sample. The standards performed inconsistently in relation to the lab trails, however performed consistently between the 2012 DPG Surveys. This will be investigated at the end of the field season, to determine a more consistent standard value for the material. A full report of the Standard results over all geochemical surveys conducted for 2012 will be available at T:\1. Data\1.7 Research & Development\1. Geochemistry\6. DPG Techniques\1. Field Programmes\1. Field Programmes\2012 QAQC Performance.
3.2.2 Blanks
ABM Resources NL. – 2012 DPG Geochemical Sampling Programme 4/12/2012
Page | 12
Blank analyses have been randomly inserted throughout the sample run and analysed for each method. The blank material is a barren quartz mix which is has been thoroughly tested for and is certified as an ALS Laboratories blank for Gold Exploration. Theoretically all Blank material should have minimum concentrations of trace elements and major elements and should be barren of any mineralisation associated elements. Therefore the blank QAQC parameters are set at 0 (lower limit) and 2x the Detection Limit (upper limit). For a blank to pass the QAQC it must fall within these two values. The Blank material performed well. The detection limits of the method are so low that the material appears to not be completely barren for ppb level concentrations of all assayed elements. It is unlikely that other barren material will be any less responsive at a ppb scale; therefore ABM will continue to monitor the background level of the blanks over multiple surveys and should be able to pick outliers indicating contamination in the process.
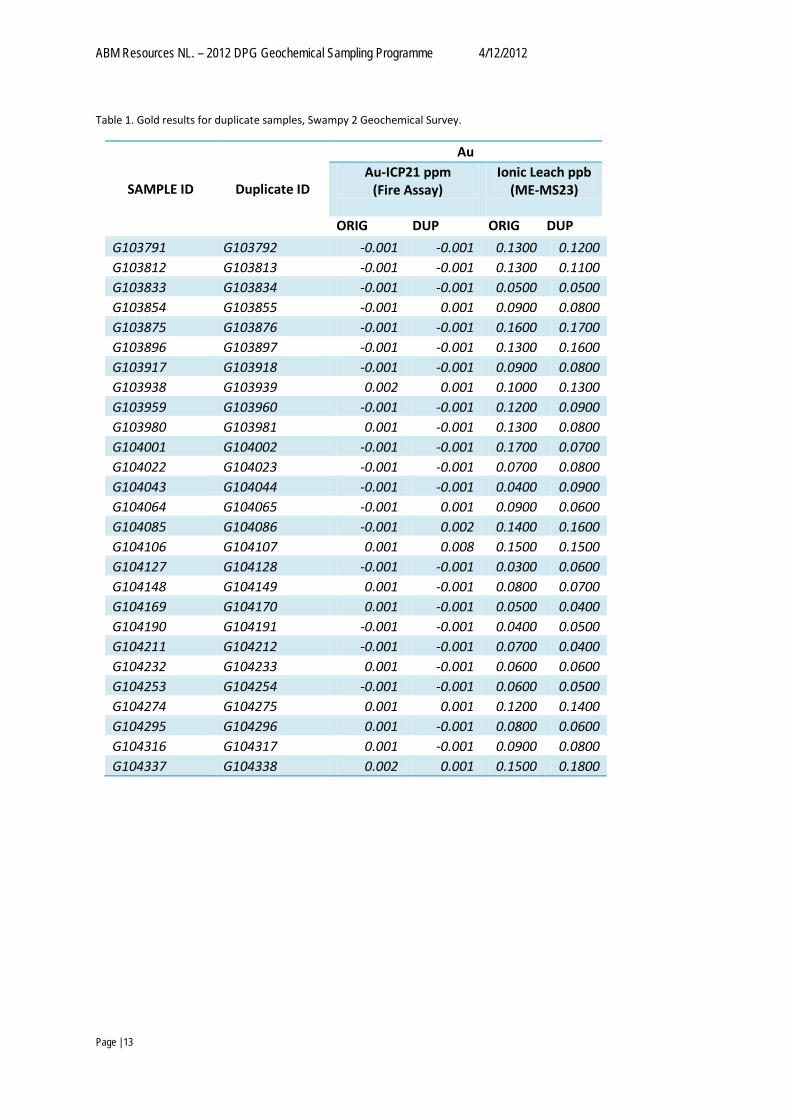
3.2.3 Field Duplicates Duplicates were taken at every 25th sample site for the soil survey. The Standard deviations or error allowable for each element has been determined by the detection limit for each element. The results for Gold are displayed in Table 1 below. Theoretically each duplicate sample should fall within the allowable range of detection for each individual element analysed for. Naturally there will be some variation in analyte concentration even within a single sample split for several methods. If the majority of elements passed with a few pathfinder elements failing in one or two duplicates within each sample batch, this is acceptable and can be attributed to the natural variation in analyte concentration. The Ionic leach duplicates show a lot of variation (Figure 3), with the detection limit so low natural variation may be larger than the allowable range of detection for the Ionic leach; therefore the allowable range has been adjusted to 2 x the detection limit (0.00004 ppm).
ABM Resources NL. – 2012 DPG Geochemical Sampling Programme 4/12/2012
Page | 13
Table 1. Gold results for duplicate samples, Swampy 2 Geochemical Survey.
SAMPLE ID Duplicate ID
Au Au-ICP21 ppm
(Fire Assay)
Ionic Leach ppb (ME-MS23)
ORIG DUP ORIG DUP G103791 G103792 -0.001 -0.001 0.1300 0.1200 G103812 G103813 -0.001 -0.001 0.1300 0.1100 G103833 G103834 -0.001 -0.001 0.0500 0.0500 G103854 G103855 -0.001 0.001 0.0900 0.0800 G103875 G103876 -0.001 -0.001 0.1600 0.1700 G103896 G103897 -0.001 -0.001 0.1300 0.1600 G103917 G103918 -0.001 -0.001 0.0900 0.0800 G103938 G103939 0.002 0.001 0.1000 0.1300 G103959 G103960 -0.001 -0.001 0.1200 0.0900 G103980 G103981 0.001 -0.001 0.1300 0.0800 G104001 G104002 -0.001 -0.001 0.1700 0.0700 G104022 G104023 -0.001 -0.001 0.0700 0.0800 G104043 G104044 -0.001 -0.001 0.0400 0.0900 G104064 G104065 -0.001 0.001 0.0900 0.0600 G104085 G104086 -0.001 0.002 0.1400 0.1600 G104106 G104107 0.001 0.008 0.1500 0.1500 G104127 G104128 -0.001 -0.001 0.0300 0.0600 G104148 G104149 0.001 -0.001 0.0800 0.0700 G104169 G104170 0.001 -0.001 0.0500 0.0400 G104190 G104191 -0.001 -0.001 0.0400 0.0500 G104211 G104212 -0.001 -0.001 0.0700 0.0400 G104232 G104233 0.001 -0.001 0.0600 0.0600 G104253 G104254 -0.001 -0.001 0.0600 0.0500 G104274 G104275 0.001 0.001 0.1200 0.1400 G104295 G104296 0.001 -0.001 0.0800 0.0600 G104316 G104317 0.001 -0.001 0.0900 0.0800 G104337 G104338 0.002 0.001 0.1500 0.1800

ABM Resources NL. – 2012 DPG Geochemical Sampling Programme 4/12/2012
Page | 14
Figure 3. Ionic leach gold results Original Sample compared to duplicate sample.
The Au_ICP21 Fire Assay duplicates were either at Detection Limit (0.001 ppm) or below the methods detection limits (Table 1.); it is difficult to draw any conclusions from the Fire Assay results. 4. Results 4.1 Laboratory Results 4.1.1 Ionic Leach The Ionic leach has been increasingly used in exploration geochemistry over a traditional aqua regia digestion with ICPAES finish. The Ionic leach targets the loosely bound water soluble salts, acetate soluble secondary minerals, carbonates and limited Manganese oxides. The method involves the use of a static sodium cyanide leach using chelating agent’s ammonium chloride, citric acid and EDTA with the leachant buffered at pH 8.5. The solution is finished off with ICP-MS. A pH reading of the final solution is taken at the end of each analysis. A total of 63 elements will be analysed for with the Ionic leach method (ME-MS23).
ABM Resources NL. – 2012 DPG Geochemical Sampling Programme 4/12/2012
Page | 15
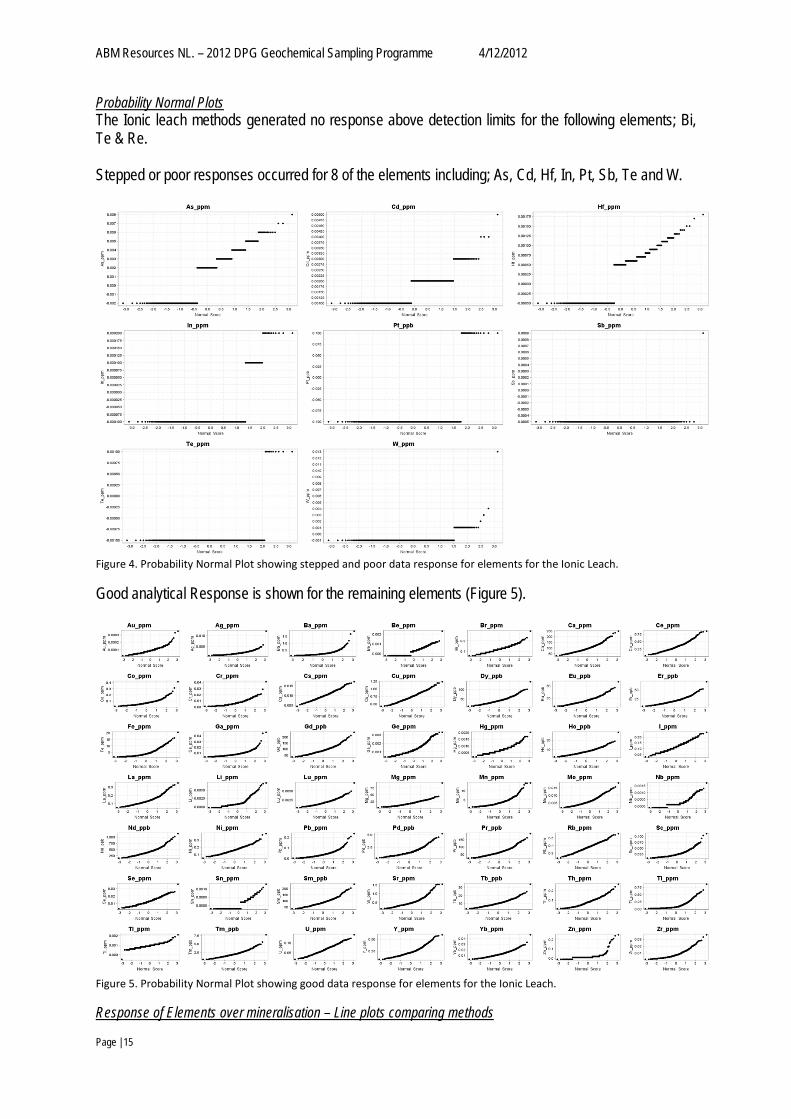
Probability Normal Plots The Ionic leach methods generated no response above detection limits for the following elements; Bi, Te & Re. Stepped or poor responses occurred for 8 of the elements including; As, Cd, Hf, In, Pt, Sb, Te and W.
Figure 4. Probability Normal Plot showing stepped and poor data response for elements for the Ionic Leach.
Good analytical Response is shown for the remaining elements (Figure 5).
Figure 5. Probability Normal Plot showing good data response for elements for the Ionic Leach.
Response of Elements over mineralisation – Line plots comparing methods

ABM Resources NL. – 2012 DPG Geochemical Sampling Programme 4/12/2012
Page | 16
The sampling grid was been broken into 15 lines for sampling. The response of elements over these lines has been investigated and interpretations incorporated into the final conclusions and recommendations.
4.1.2 Au_ICP21 – Fire Assay with ICPMS finish
The Au_ICP21 method is commonly used for rock chip and drill chip samples for brown fields and Greenfields exploration. ABM will be running the Au_ICP21 method alongside the Ionic leach to test for high grade, usually ppm range gold that would normally be much higher than the limits of the leach. The Fire Assay method reaches detection limits down to 0.001 ppm so will also be used to compare the accuracy and solidify the results of the Ionic leach. Au_ICP21 will only report a Gold value for the exogenic and endogenic signal, therefore giving a result of gold ppm for the entire sample including any in the matrix material. Probability Normal Plot
Figure 6. Probability normal plot for Au - Au_ICP21 method.
Figure 6 shows a stepped response which can be attributed to the low levels of Au in the sample. Greater than 50% of the samples are at or below detection at 0.001 ppm and the remainder were highly quantised. The method is therefore not sensitive enough to pick up the level of detail that the Ionic leach does. Maximum Au response is 0.008 ppm. 4.2 Evaluation of Laboratory methods Figure 7 illustrates the key differences between the Ionic leach (Left) and the Fire Assay Au results (Right).

ABM Resources NL. – 2012 DPG Geochemical Sampling Programme 4/12/2012
Page | 17
Figure 7. Au ppm - ME-MS23 Ionic Leach method (Left) compared to the results of the Au_ICP21 Fire Assay Result(Right).
ABM Resources NL. – 2012 DPG Geochemical Sampling Programme 4/12/2012
Page | 18
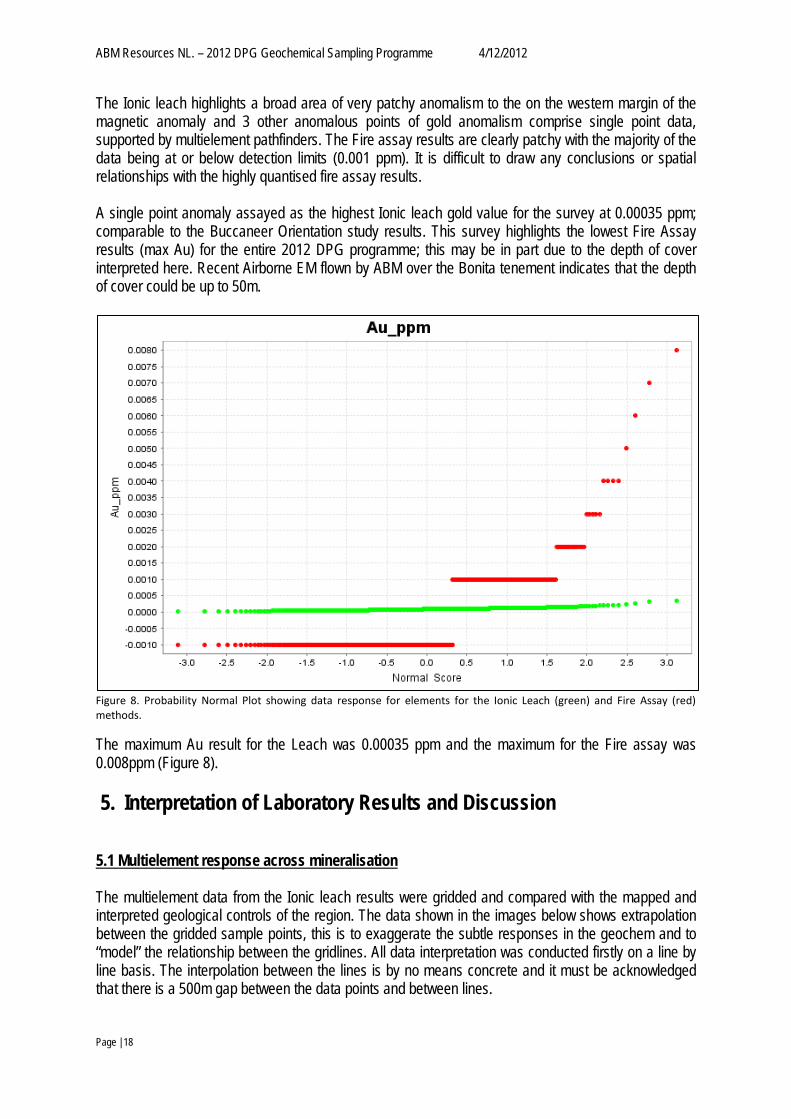
The Ionic leach highlights a broad area of very patchy anomalism to the on the western margin of the magnetic anomaly and 3 other anomalous points of gold anomalism comprise single point data, supported by multielement pathfinders. The Fire assay results are clearly patchy with the majority of the data being at or below detection limits (0.001 ppm). It is difficult to draw any conclusions or spatial relationships with the highly quantised fire assay results. A single point anomaly assayed as the highest Ionic leach gold value for the survey at 0.00035 ppm; comparable to the Buccaneer Orientation study results. This survey highlights the lowest Fire Assay results (max Au) for the entire 2012 DPG programme; this may be in part due to the depth of cover interpreted here. Recent Airborne EM flown by ABM over the Bonita tenement indicates that the depth of cover could be up to 50m.
Figure 8. Probability Normal Plot showing data response for elements for the Ionic Leach (green) and Fire Assay (red) methods.
The maximum Au result for the Leach was 0.00035 ppm and the maximum for the Fire assay was 0.008ppm (Figure 8). 5. Interpretation of Laboratory Results and Discussion
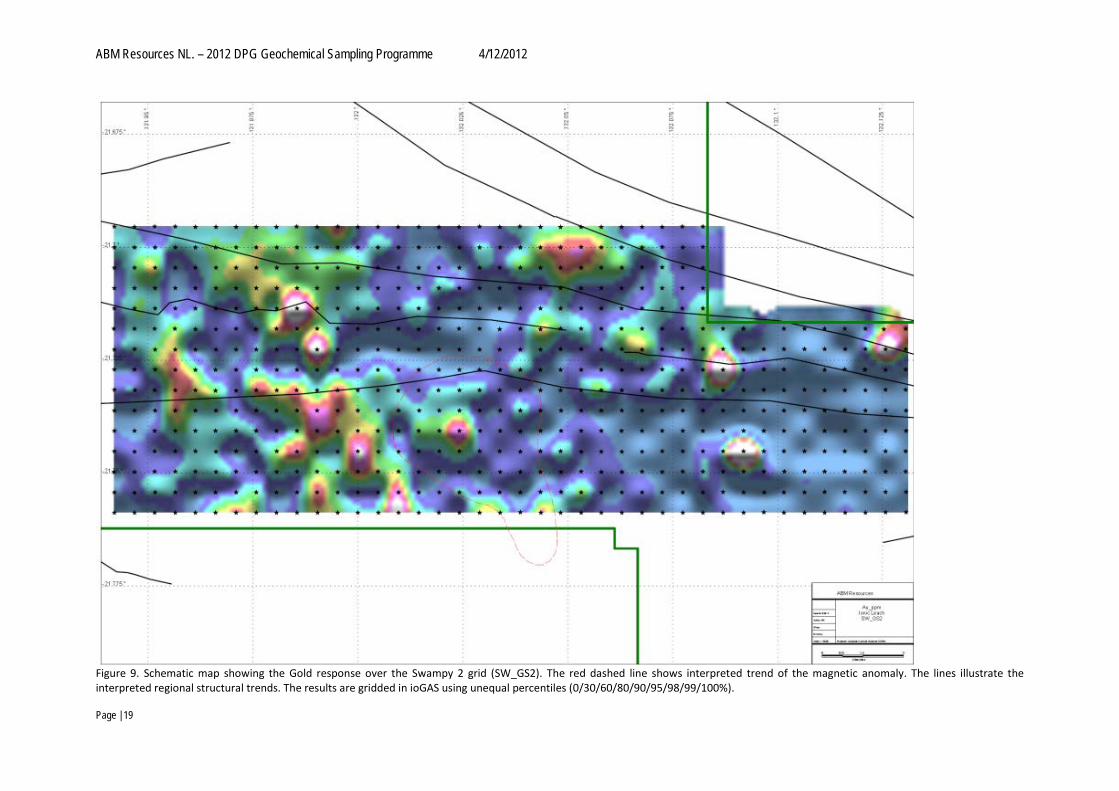
5.1 Multielement response across mineralisation The multielement data from the Ionic leach results were gridded and compared with the mapped and interpreted geological controls of the region. The data shown in the images below shows extrapolation between the gridded sample points, this is to exaggerate the subtle responses in the geochem and to “model” the relationship between the gridlines. All data interpretation was conducted firstly on a line by line basis. The interpolation between the lines is by no means concrete and it must be acknowledged that there is a 500m gap between the data points and between lines.
ABM Resources NL. – 2012 DPG Geochemical Sampling Programme 4/12/2012
Page | 19
Figure 9. Schematic map showing the Gold response over the Swampy 2 grid (SW_GS2). The red dashed line shows interpreted trend of the magnetic anomaly. The lines illustrate the interpreted regional structural trends. The results are gridded in ioGAS using unequal percentiles (0/30/60/80/90/95/98/99/100%).
ABM Resources NL. – 2012 DPG Geochemical Sampling Programme 4/12/2012
Page | 20
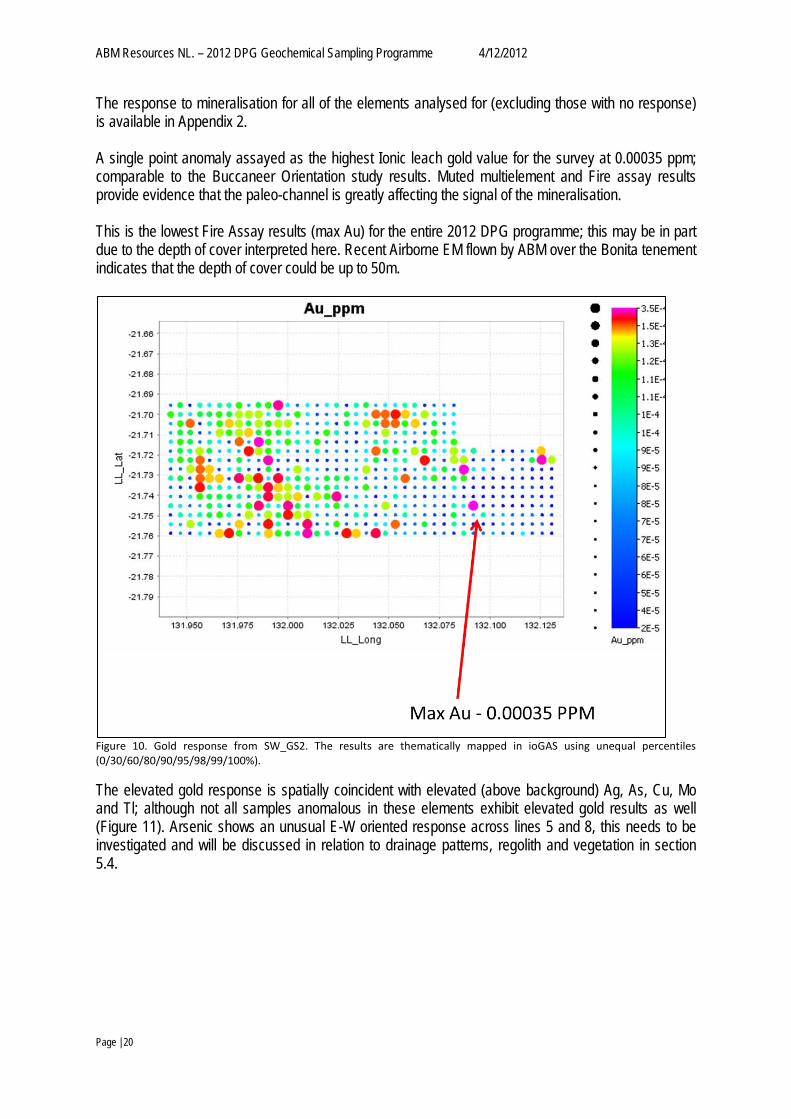
The response to mineralisation for all of the elements analysed for (excluding those with no response) is available in Appendix 2. A single point anomaly assayed as the highest Ionic leach gold value for the survey at 0.00035 ppm; comparable to the Buccaneer Orientation study results. Muted multielement and Fire assay results provide evidence that the paleo-channel is greatly affecting the signal of the mineralisation. This is the lowest Fire Assay results (max Au) for the entire 2012 DPG programme; this may be in part due to the depth of cover interpreted here. Recent Airborne EM flown by ABM over the Bonita tenement indicates that the depth of cover could be up to 50m.
Figure 10. Gold response from SW_GS2. The results are thematically mapped in ioGAS using unequal percentiles (0/30/60/80/90/95/98/99/100%).
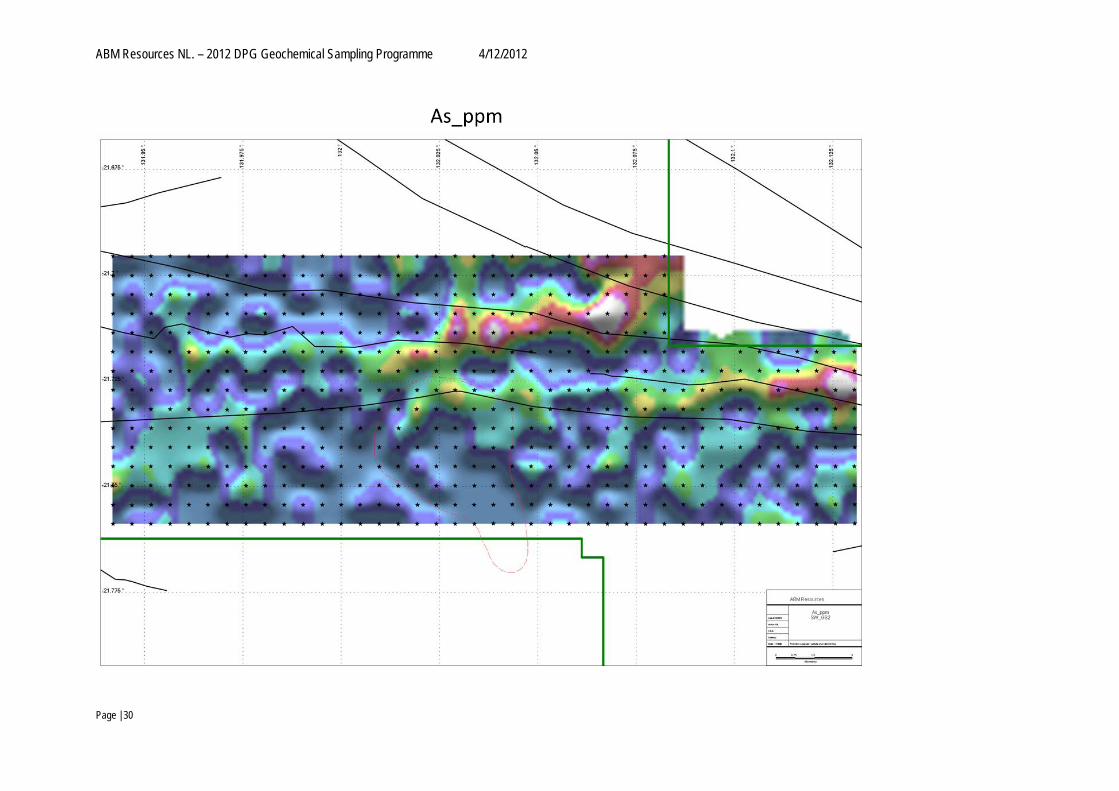
The elevated gold response is spatially coincident with elevated (above background) Ag, As, Cu, Mo and Tl; although not all samples anomalous in these elements exhibit elevated gold results as well (Figure 11). Arsenic shows an unusual E-W oriented response across lines 5 and 8, this needs to be investigated and will be discussed in relation to drainage patterns, regolith and vegetation in section 5.4.
ABM Resources NL. – 2012 DPG Geochemical Sampling Programme 4/12/2012
Page | 21
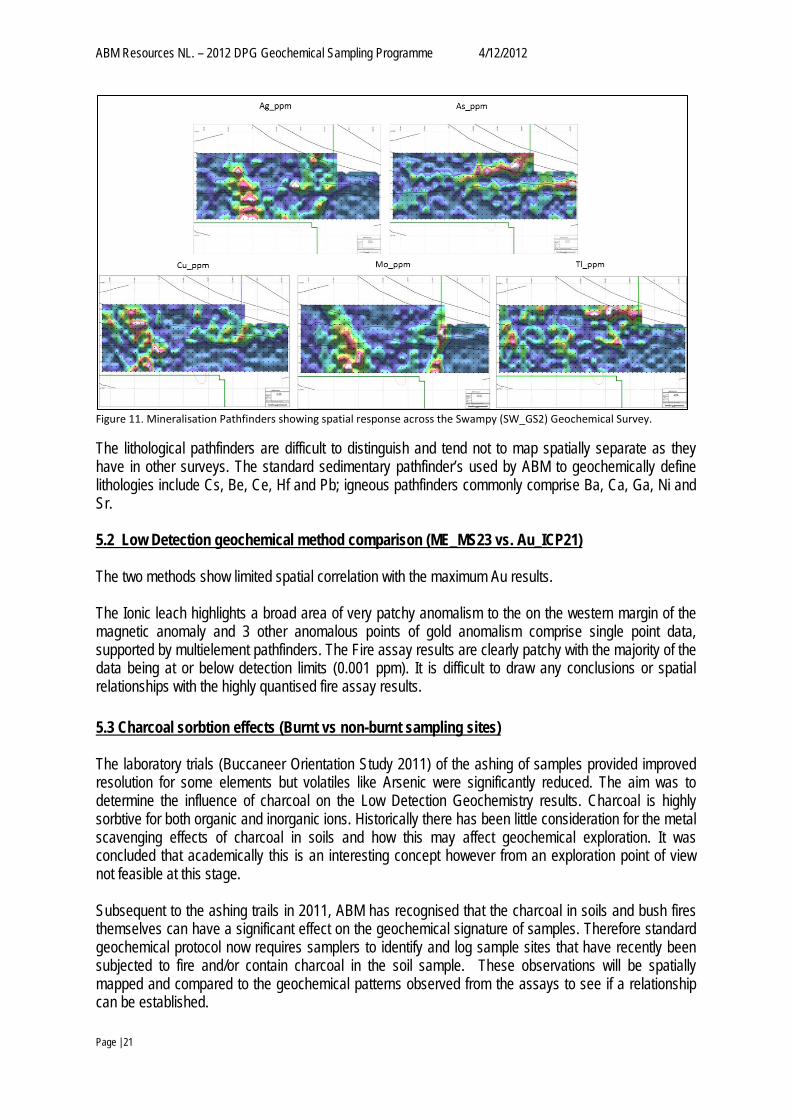
Figure 11. Mineralisation Pathfinders showing spatial response across the Swampy (SW_GS2) Geochemical Survey.
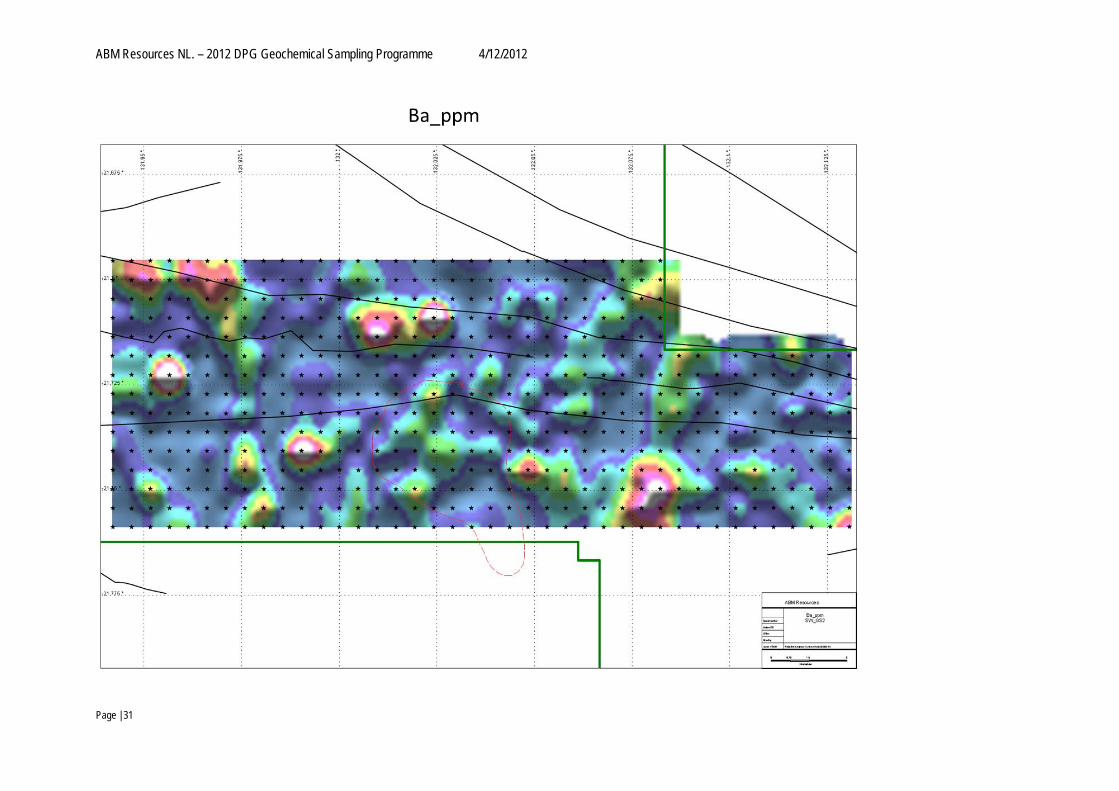
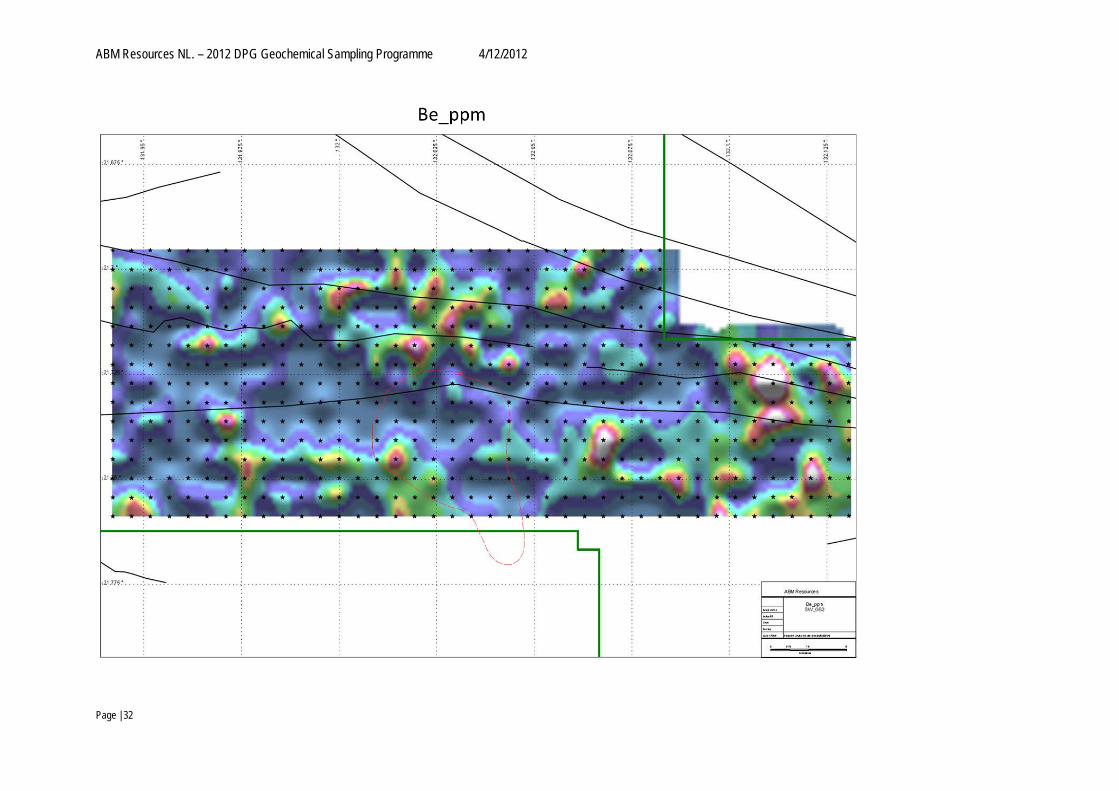
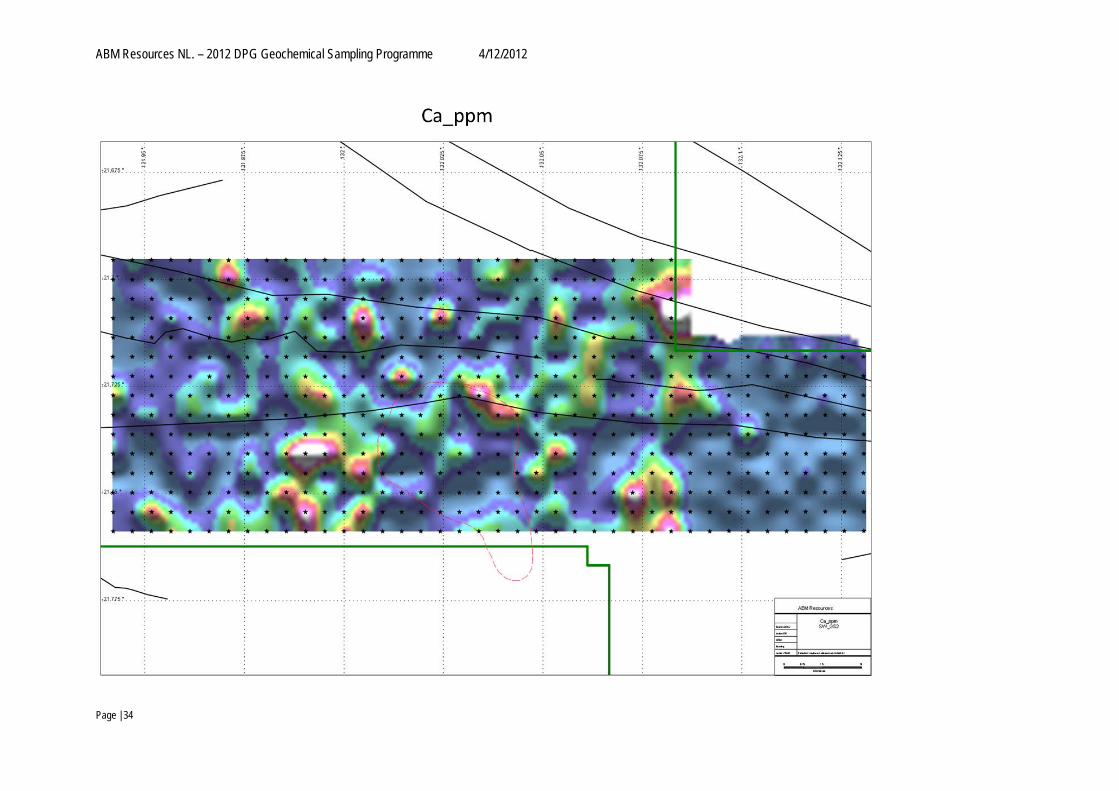
The lithological pathfinders are difficult to distinguish and tend not to map spatially separate as they have in other surveys. The standard sedimentary pathfinder’s used by ABM to geochemically define lithologies include Cs, Be, Ce, Hf and Pb; igneous pathfinders commonly comprise Ba, Ca, Ga, Ni and Sr. 5.2 Low Detection geochemical method comparison (ME_MS23 vs. Au_ICP21) The two methods show limited spatial correlation with the maximum Au results. The Ionic leach highlights a broad area of very patchy anomalism to the on the western margin of the magnetic anomaly and 3 other anomalous points of gold anomalism comprise single point data, supported by multielement pathfinders. The Fire assay results are clearly patchy with the majority of the data being at or below detection limits (0.001 ppm). It is difficult to draw any conclusions or spatial relationships with the highly quantised fire assay results. 5.3 Charcoal sorbtion effects (Burnt vs non-burnt sampling sites) The laboratory trials (Buccaneer Orientation Study 2011) of the ashing of samples provided improved resolution for some elements but volatiles like Arsenic were significantly reduced. The aim was to determine the influence of charcoal on the Low Detection Geochemistry results. Charcoal is highly sorbtive for both organic and inorganic ions. Historically there has been little consideration for the metal scavenging effects of charcoal in soils and how this may affect geochemical exploration. It was concluded that academically this is an interesting concept however from an exploration point of view not feasible at this stage. Subsequent to the ashing trails in 2011, ABM has recognised that the charcoal in soils and bush fires themselves can have a significant effect on the geochemical signature of samples. Therefore standard geochemical protocol now requires samplers to identify and log sample sites that have recently been subjected to fire and/or contain charcoal in the soil sample. These observations will be spatially mapped and compared to the geochemical patterns observed from the assays to see if a relationship can be established.
ABM Resources NL. – 2012 DPG Geochemical Sampling Programme 4/12/2012
Page | 22
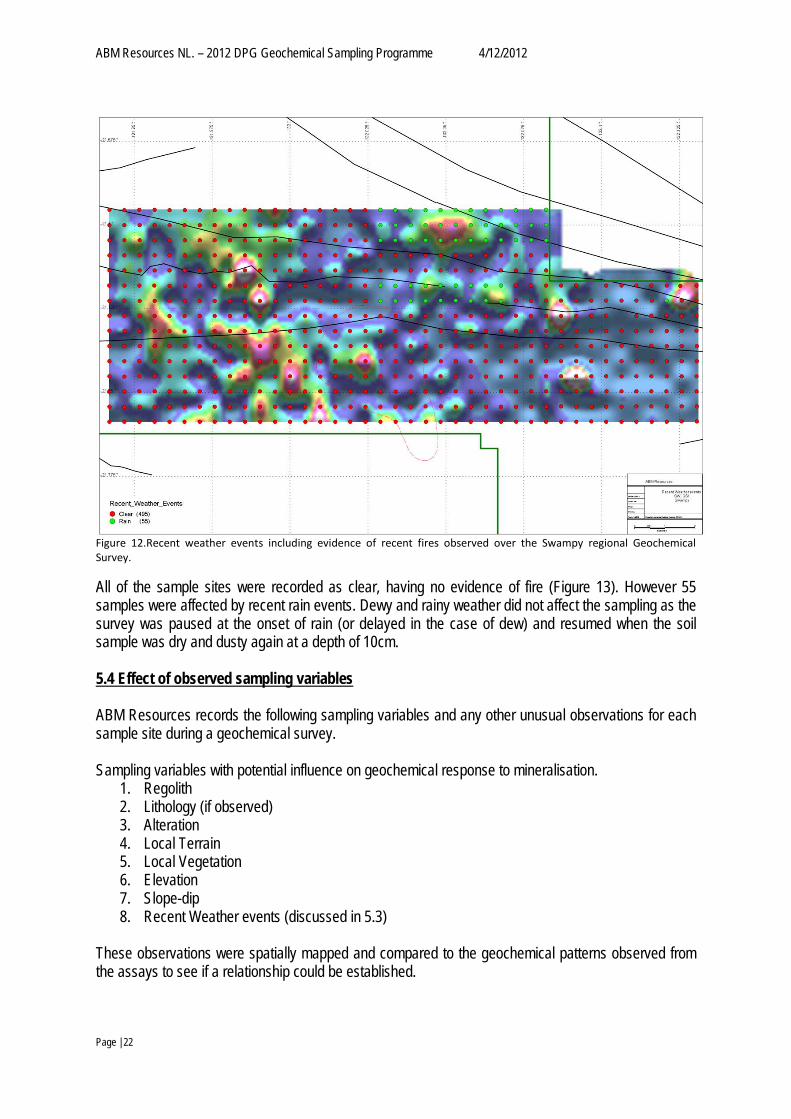
Figure 12.Recent weather events including evidence of recent fires observed over the Swampy regional Geochemical Survey.
All of the sample sites were recorded as clear, having no evidence of fire (Figure 13). However 55 samples were affected by recent rain events. Dewy and rainy weather did not affect the sampling as the survey was paused at the onset of rain (or delayed in the case of dew) and resumed when the soil sample was dry and dusty again at a depth of 10cm. 5.4 Effect of observed sampling variables ABM Resources records the following sampling variables and any other unusual observations for each sample site during a geochemical survey. Sampling variables with potential influence on geochemical response to mineralisation.
1. Regolith 2. Lithology (if observed) 3. Alteration 4. Local Terrain 5. Local Vegetation 6. Elevation 7. Slope-dip 8. Recent Weather events (discussed in 5.3)
These observations were spatially mapped and compared to the geochemical patterns observed from the assays to see if a relationship could be established.
ABM Resources NL. – 2012 DPG Geochemical Sampling Programme 4/12/2012
Page | 23
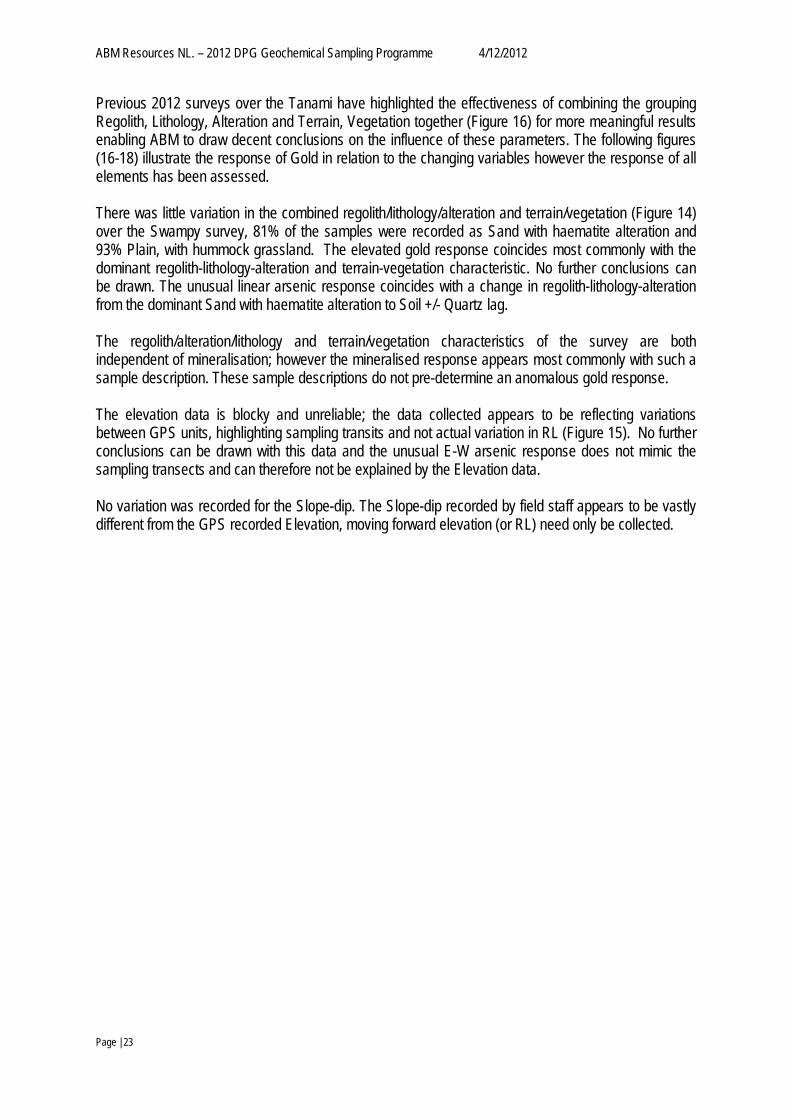
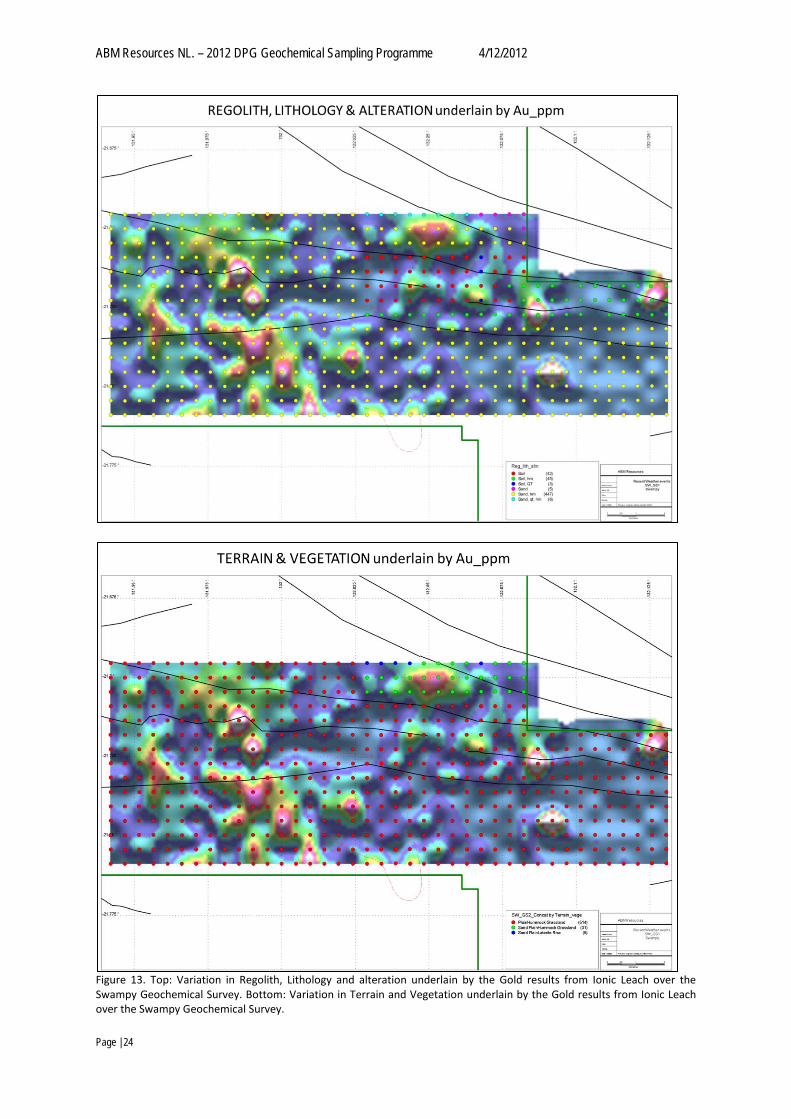
Previous 2012 surveys over the Tanami have highlighted the effectiveness of combining the grouping Regolith, Lithology, Alteration and Terrain, Vegetation together (Figure 16) for more meaningful results enabling ABM to draw decent conclusions on the influence of these parameters. The following figures (16-18) illustrate the response of Gold in relation to the changing variables however the response of all elements has been assessed. There was little variation in the combined regolith/lithology/alteration and terrain/vegetation (Figure 14) over the Swampy survey, 81% of the samples were recorded as Sand with haematite alteration and 93% Plain, with hummock grassland. The elevated gold response coincides most commonly with the dominant regolith-lithology-alteration and terrain-vegetation characteristic. No further conclusions can be drawn. The unusual linear arsenic response coincides with a change in regolith-lithology-alteration from the dominant Sand with haematite alteration to Soil +/- Quartz lag. The regolith/alteration/lithology and terrain/vegetation characteristics of the survey are both independent of mineralisation; however the mineralised response appears most commonly with such a sample description. These sample descriptions do not pre-determine an anomalous gold response. The elevation data is blocky and unreliable; the data collected appears to be reflecting variations between GPS units, highlighting sampling transits and not actual variation in RL (Figure 15). No further conclusions can be drawn with this data and the unusual E-W arsenic response does not mimic the sampling transects and can therefore not be explained by the Elevation data. No variation was recorded for the Slope-dip. The Slope-dip recorded by field staff appears to be vastly different from the GPS recorded Elevation, moving forward elevation (or RL) need only be collected.
ABM Resources NL. – 2012 DPG Geochemical Sampling Programme 4/12/2012
Page | 24
Figure 13. Top: Variation in Regolith, Lithology and alteration underlain by the Gold results from Ionic Leach over the Swampy Geochemical Survey. Bottom: Variation in Terrain and Vegetation underlain by the Gold results from Ionic Leach over the Swampy Geochemical Survey.
ABM Resources NL. – 2012 DPG Geochemical Sampling Programme 4/12/2012
Page | 25
Figure 14. Top - Elevation variation observed over the Swampy Geochemical Survey. Bottom– Gold results from Ionic Leach over the Swampy Geochemical Survey.
ABM Resources NL. – 2012 DPG Geochemical Sampling Programme 4/12/2012
Page | 26
6. Conclusions & Recommendations In conclusion the Geochemical Survey over Swampy (SW_GS2) shows a muted response to hypothesised mineralisation. A single point anomaly assayed as the highest Ionic leach gold value for the survey at 0.00035 ppm; comparable to the Buccaneer Orientation study results. Muted multielement and Fire assay results provide evidence that the paleo-channel is greatly affecting the signal of the mineralisation. This is the lowest Fire Assay results (max Au) for the entire 2012 DPG programme; this may be in part due to the depth of cover interpreted here. Recent Airborne EM flown by ABM over the Bonita tenement indicates that the depth of cover could be up to 50m. The elevated gold response is spatially coincident with elevated (above background) Ag, As, Cu, Mo and Tl; although not all samples anomalous in these elements exhibit elevated gold results. The lithological pathfinders are difficult to distinguish and tend not to map spatially separate as they have in other surveys. The standard sedimentary pathfinder’s used by ABM to geochemically define lithologies include Cs, Be, Ce, Hf and Pb; igneous pathfinders commonly comprise Ba, Ca, Ga, Ni and Sr. Recommendations: It is recommended that ABM review the underlying geology at Swampy and review the results from SW_GS1 survey before drawing conclusions as to the effectiveness of the survey. The nature of the regolith definitely indicates that the mineralisation if present would be incredibly muted by the thick cover over the magnetic target. 7. References
Lambeck, A., Huston, D., Maidment, D., Southgate, P., 2008. Sedimentary geochemistry, geochronology and sequence stratigraphy as tools to typecast stratigraphic units and constrain basin evolution in the gold mineralised Palaeoproterozoic Tanami Region, Northern Australia, Precambrian Research, 166, 1-4, 185-203. Lintern, M.J., Sheard, M.J., 1998. Silcrete — a potential new exploration sample medium: a case study from the Challenger gold deposit In: MESA Journal. October 2008, 16-20. Noble R.P. 2004. Removing bias from geochemical interpretation: the application of hypergeometric statistics. In: Roach I.C ed. 2004. Regolith2004. CRC LEME, 256-259. Richards, R (unpublished). 2011. DPG results 2011. Stanley C. R. & Noble R.R.P. 2007. Optimizing geochemical threshold selection while evaluating exploration techniques using a minimum hypergeometric probability method. Geochemistry: Exploration, Environment, Analysis, 7, 341-351. Stanley C.R. 2003. A statistical evaluation of anomaly recognition performance. Geochemistry: Exploration, Environment, Analysis, 3, 3-12.
ABM Resources NL. – 2012 DPG Geochemical Sampling Programme 4/12/2012
Page | 27
APPENDICES

ABM Resources NL. – 2012 DPG Geochemical Sampling Programme 4/12/2012
Page | 28
APPENDIX 1. Assay Techniques Assay techniques – ALS Laboratories Descriptions
Ionic leach SEL-ION - Digestion for ionic leach pH-MS23 - pH of MS23 Leach solution is measured. ME-MS23 - pH controlled IONIC Leach - Complete Package
Au-ICP21 FA-FUSPG1 - Fire assay fusion - lead flux with Ag collector - for Pt, Pd and Au. Nominal sample weight 30 g. FA Fusion for Pt Pd Au - 30g. Au-ICP21 - Au by fire assay and ICP-AES. 30 g nominal sample weight. Au 30g FA ICP-AES Finish
ABM Resources NL. – 2012 DPG Geochemical Sampling Programme 4/12/2012
Page | 29
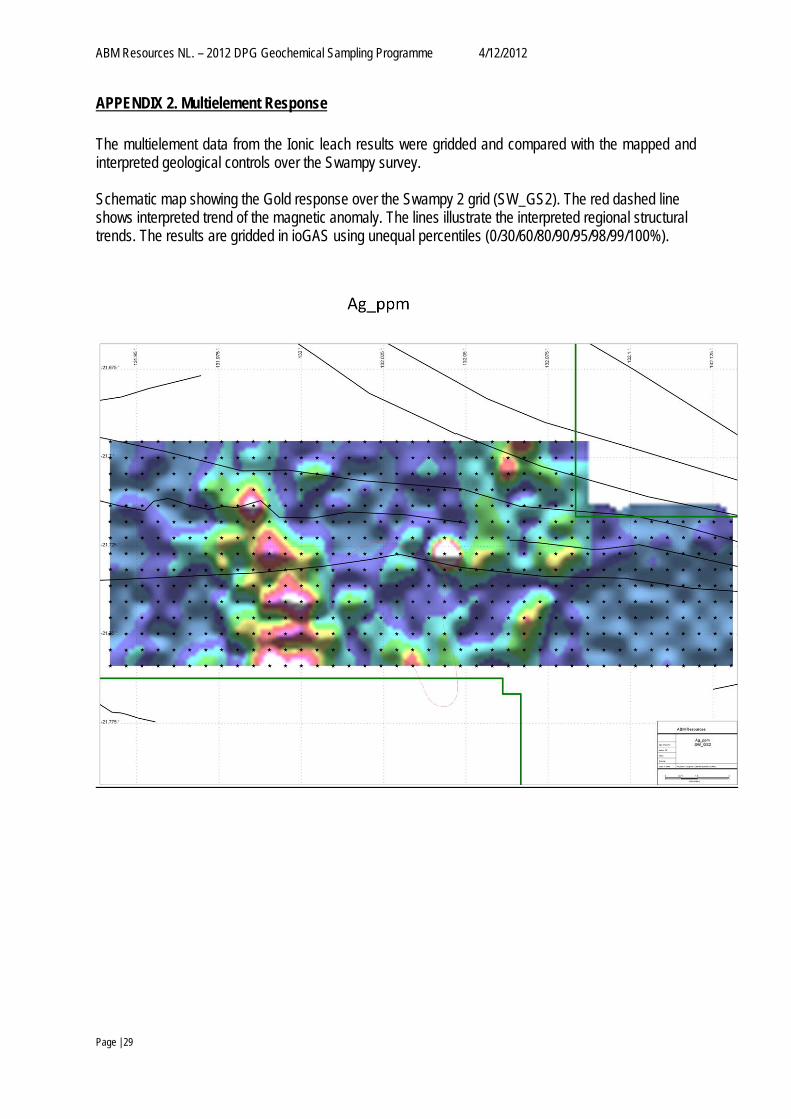
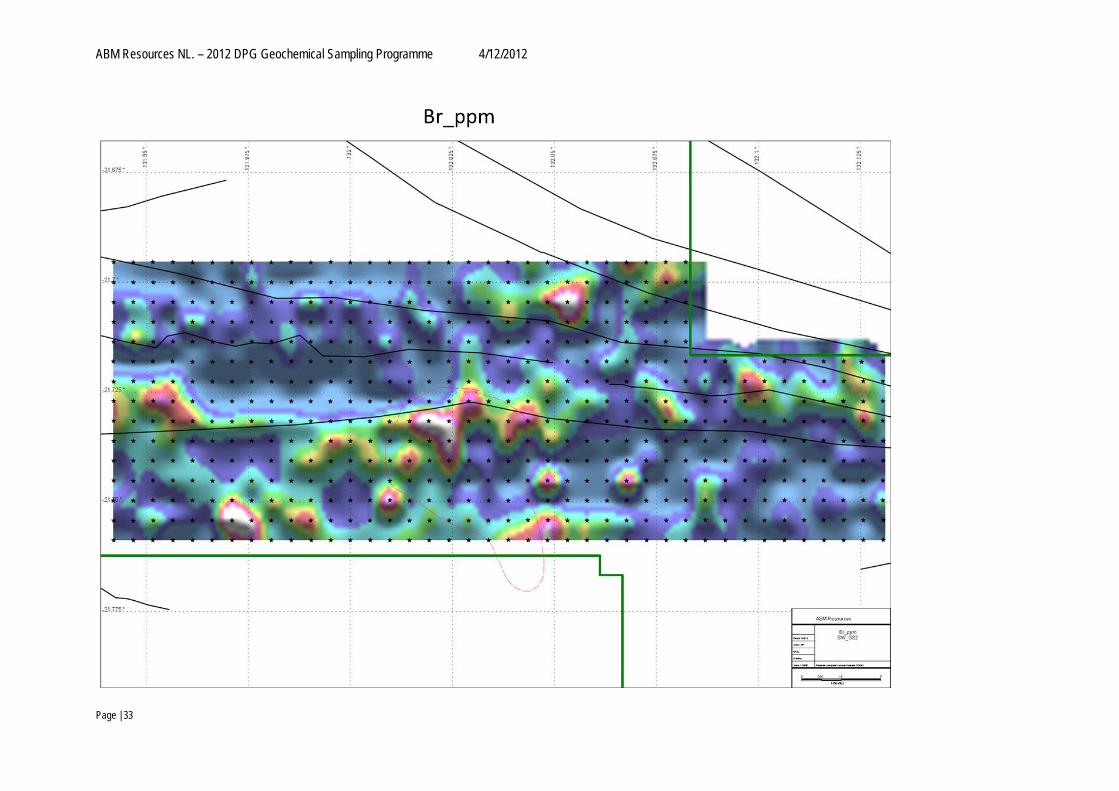
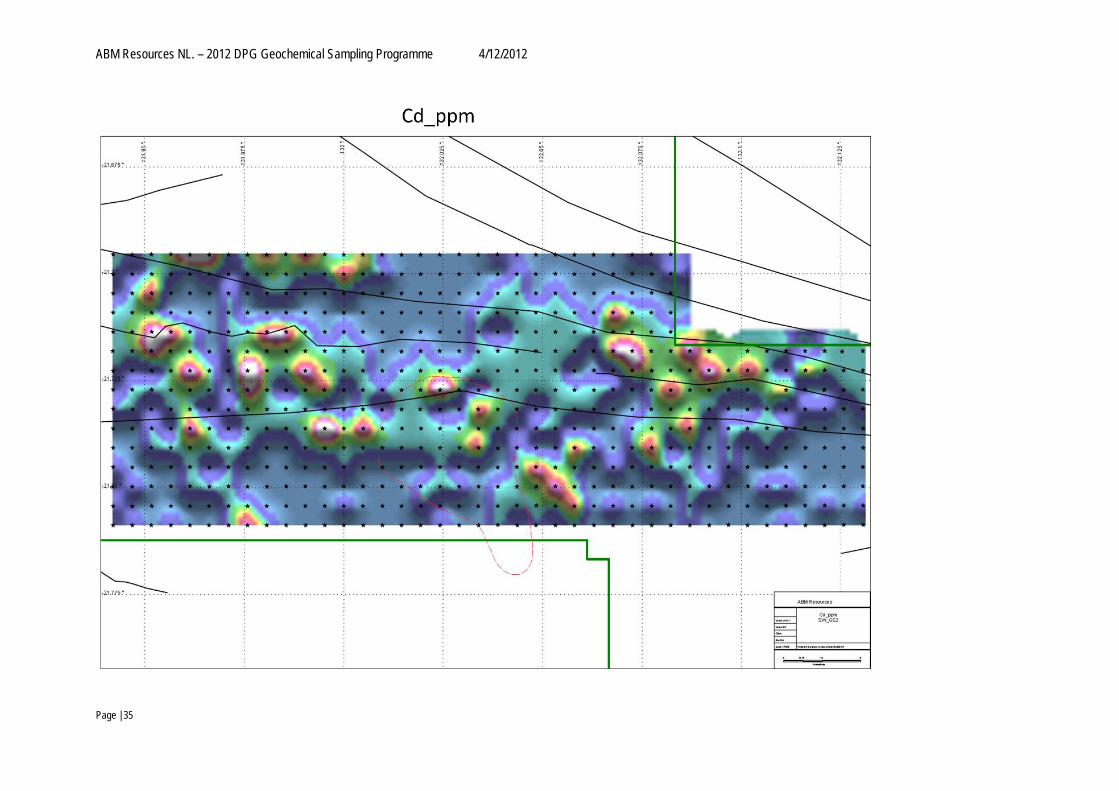
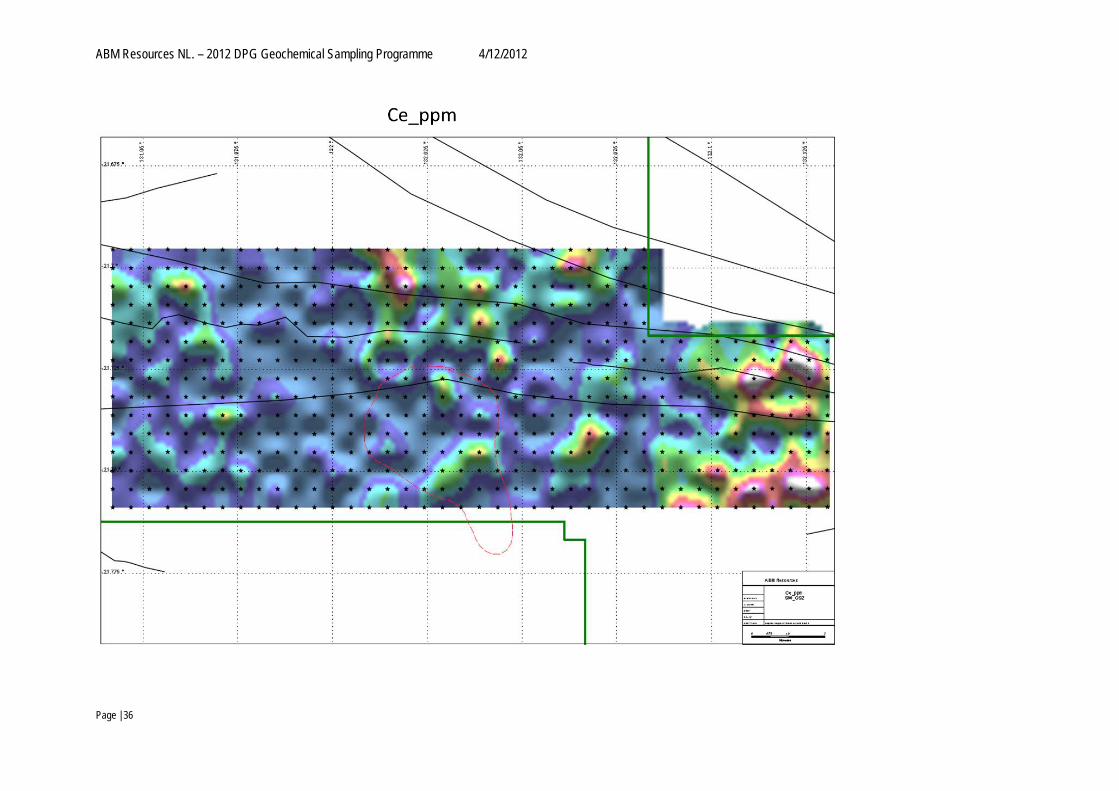
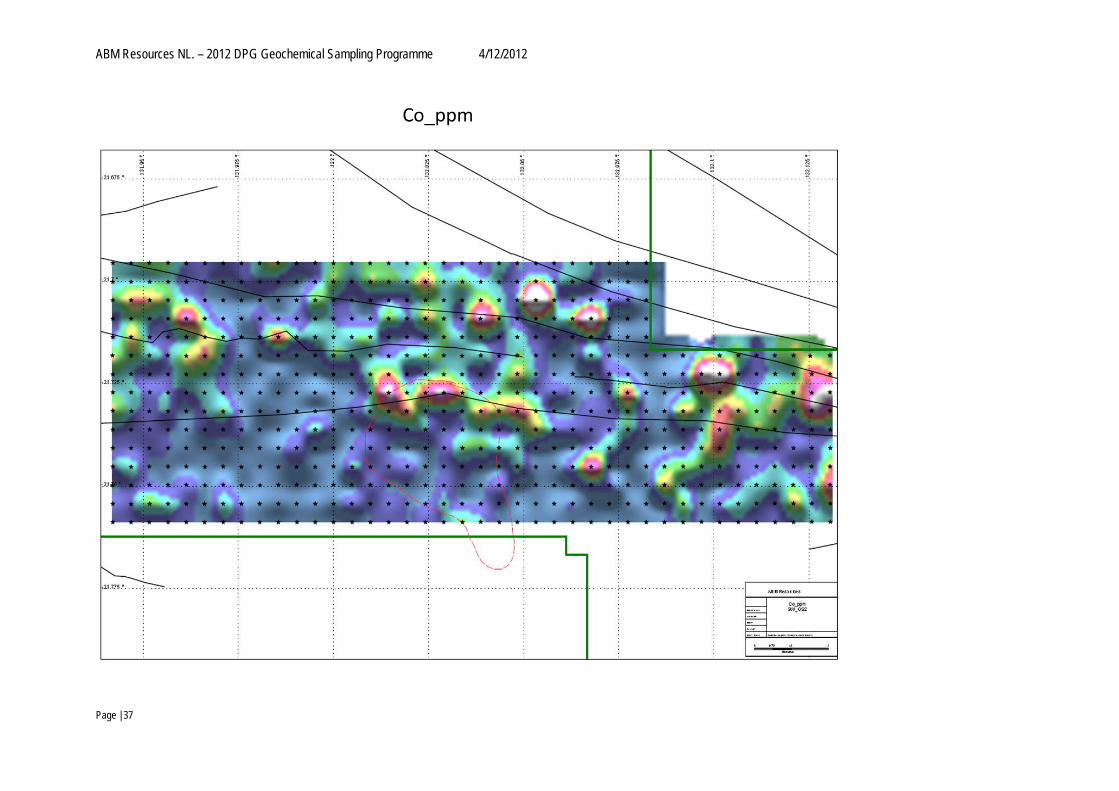
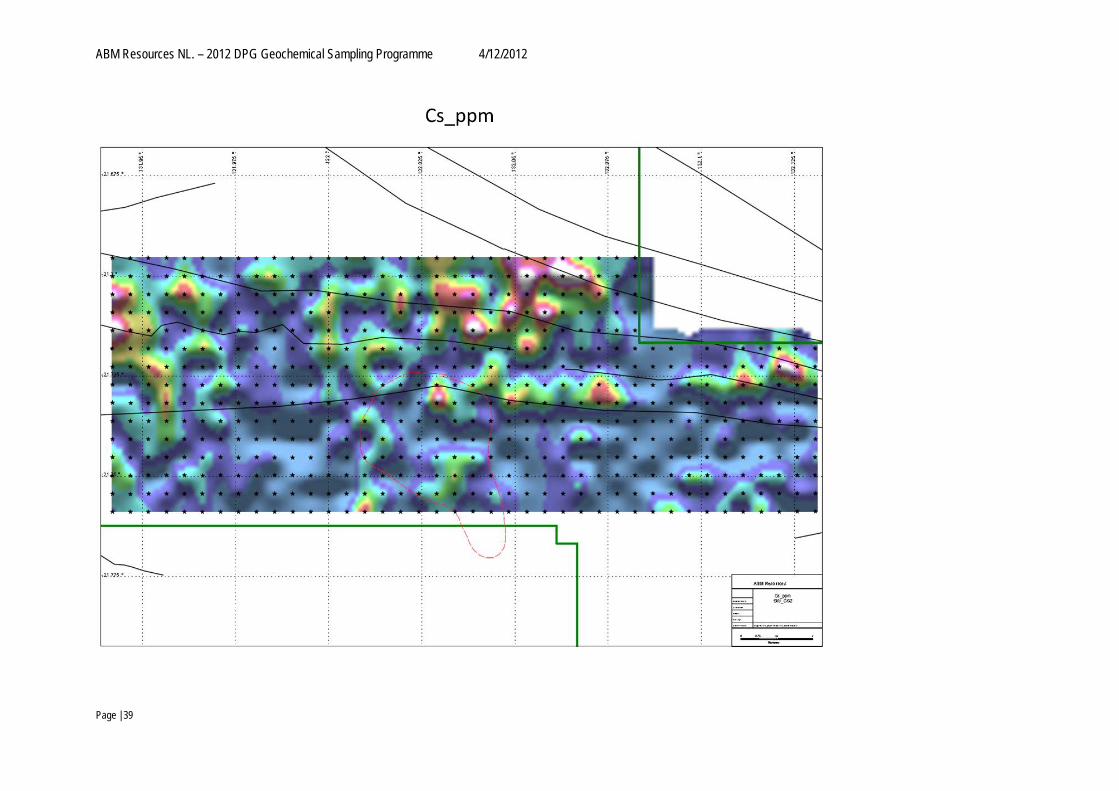
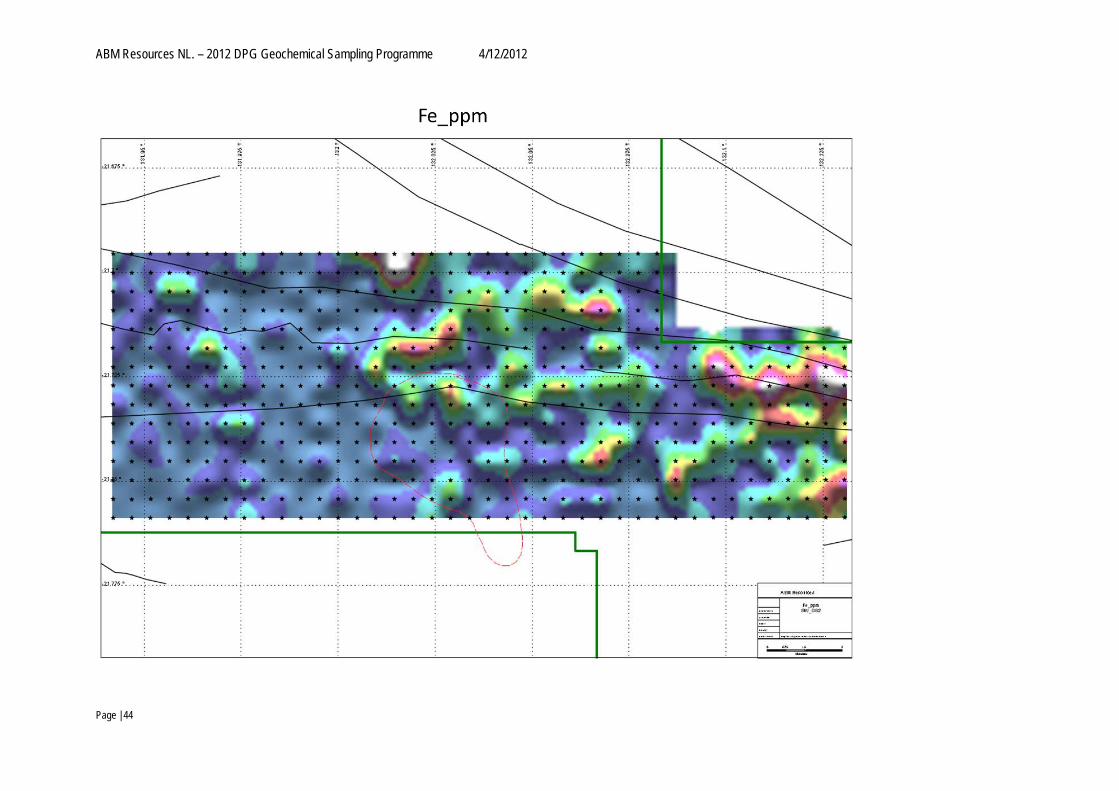
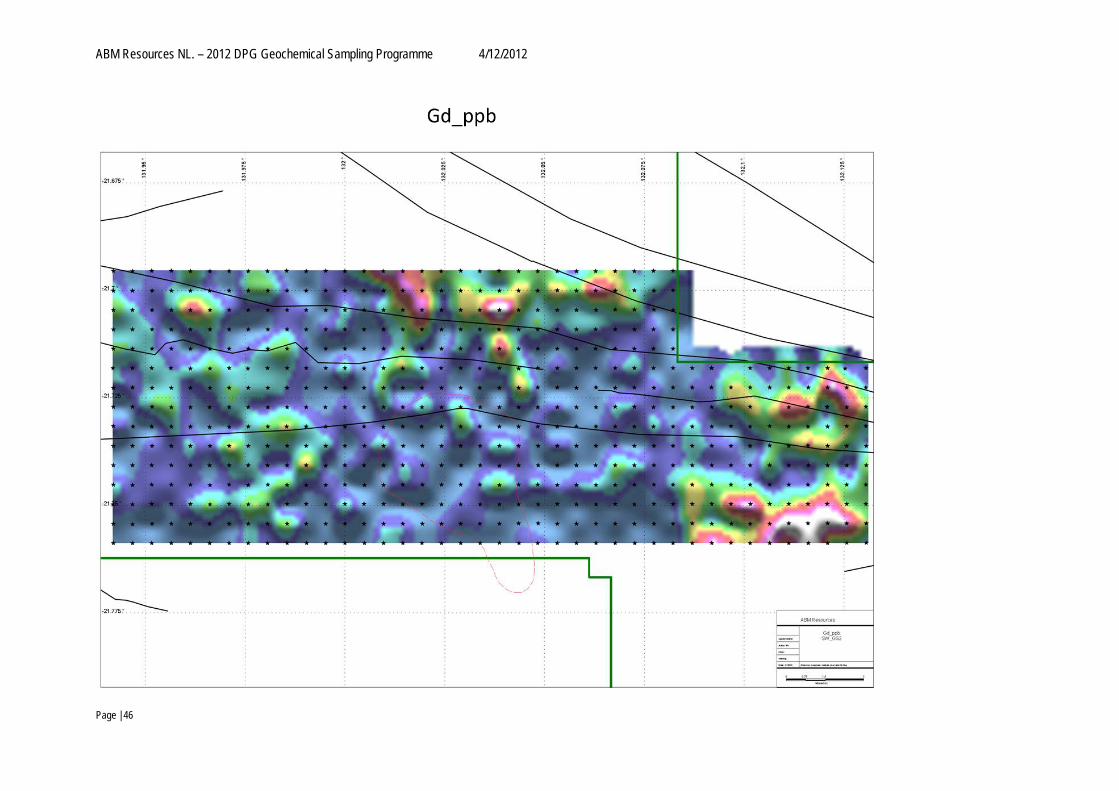
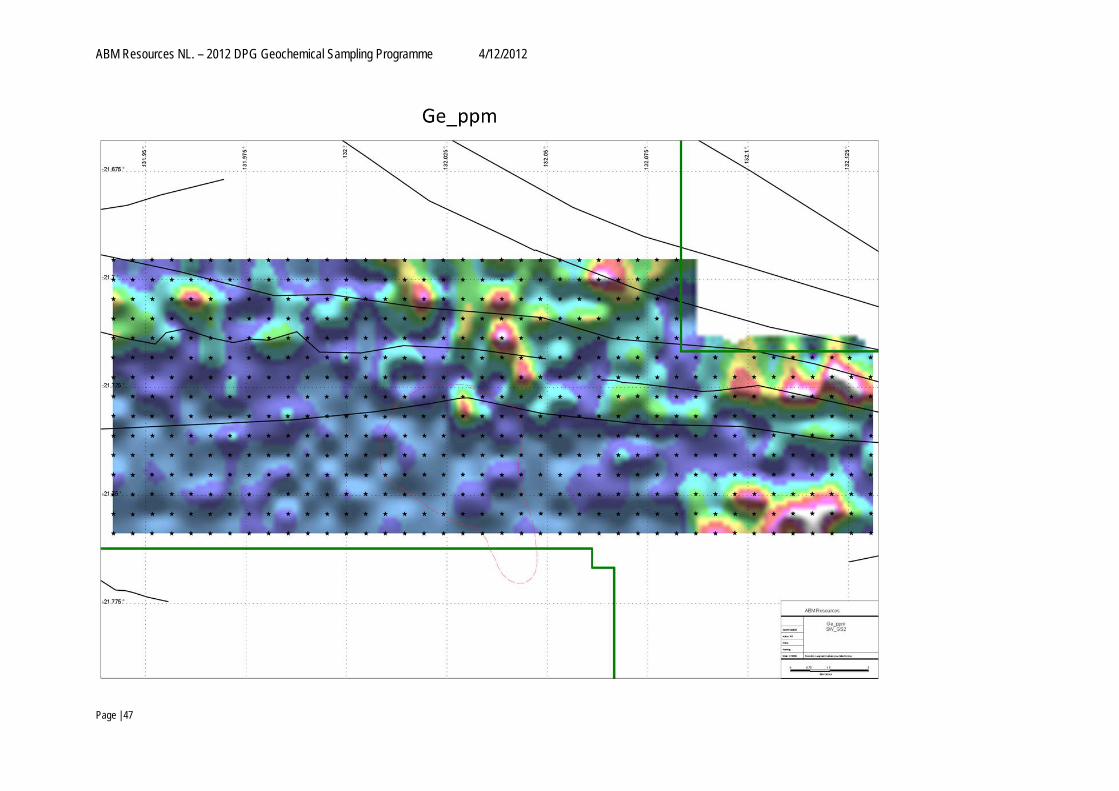
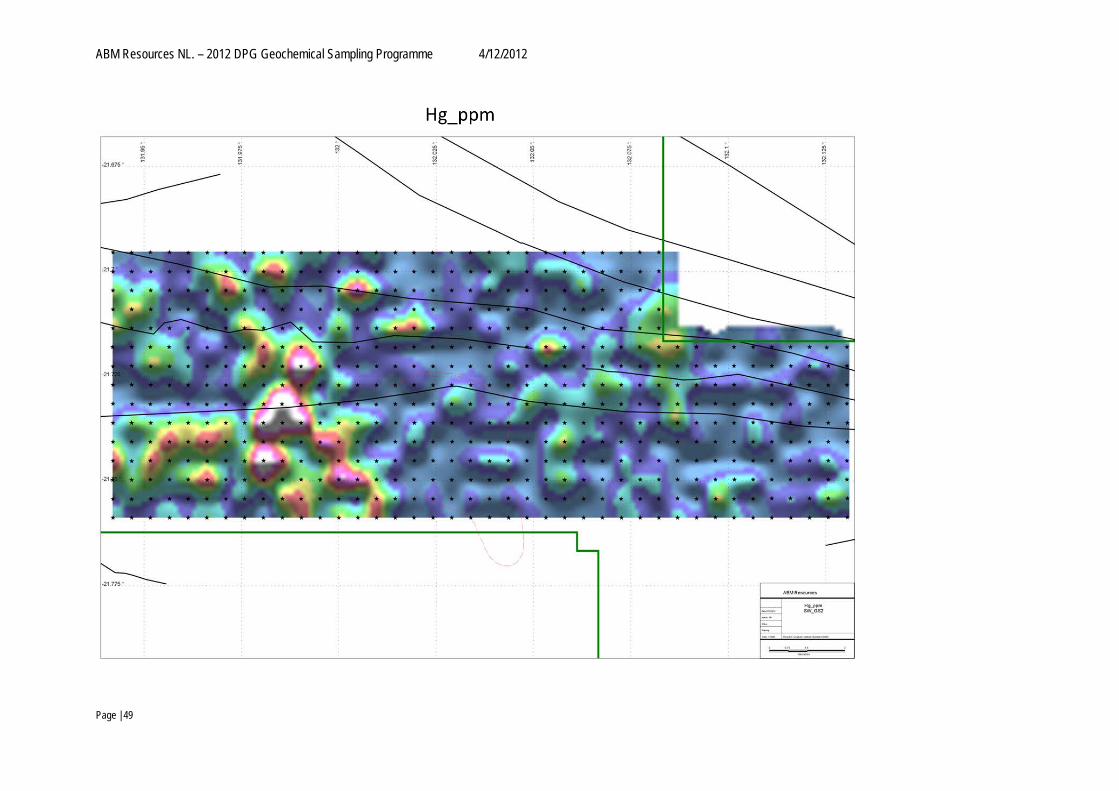
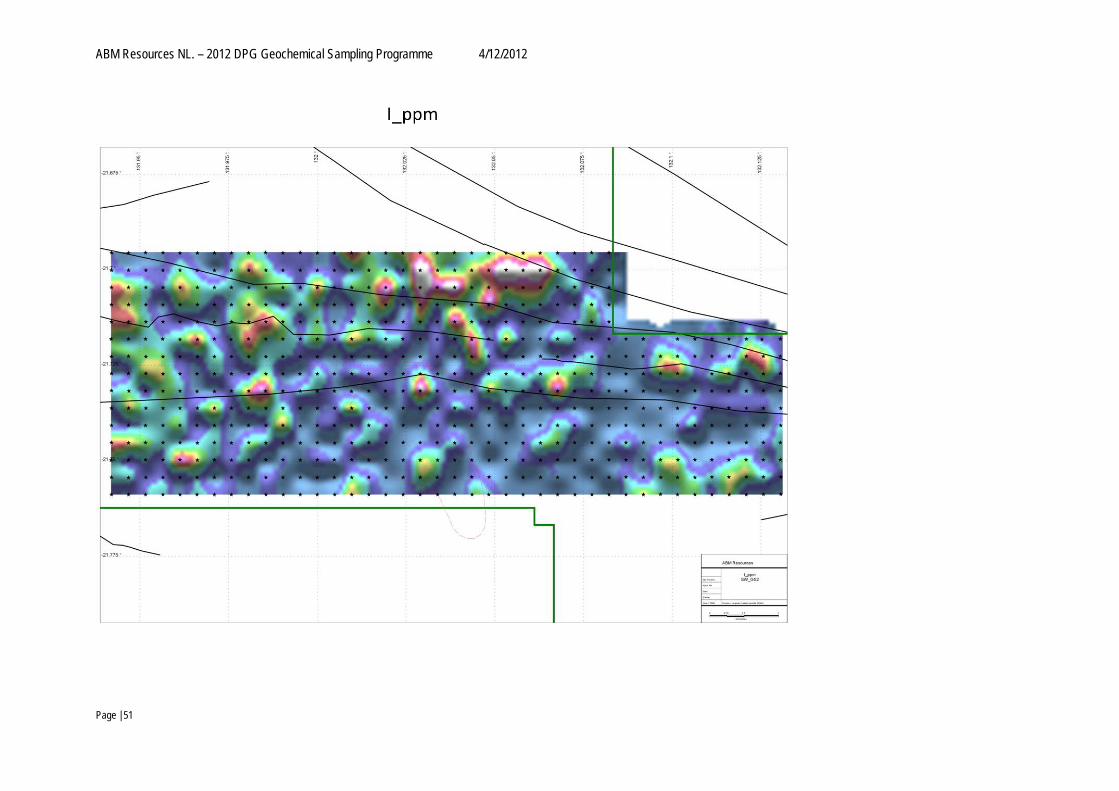
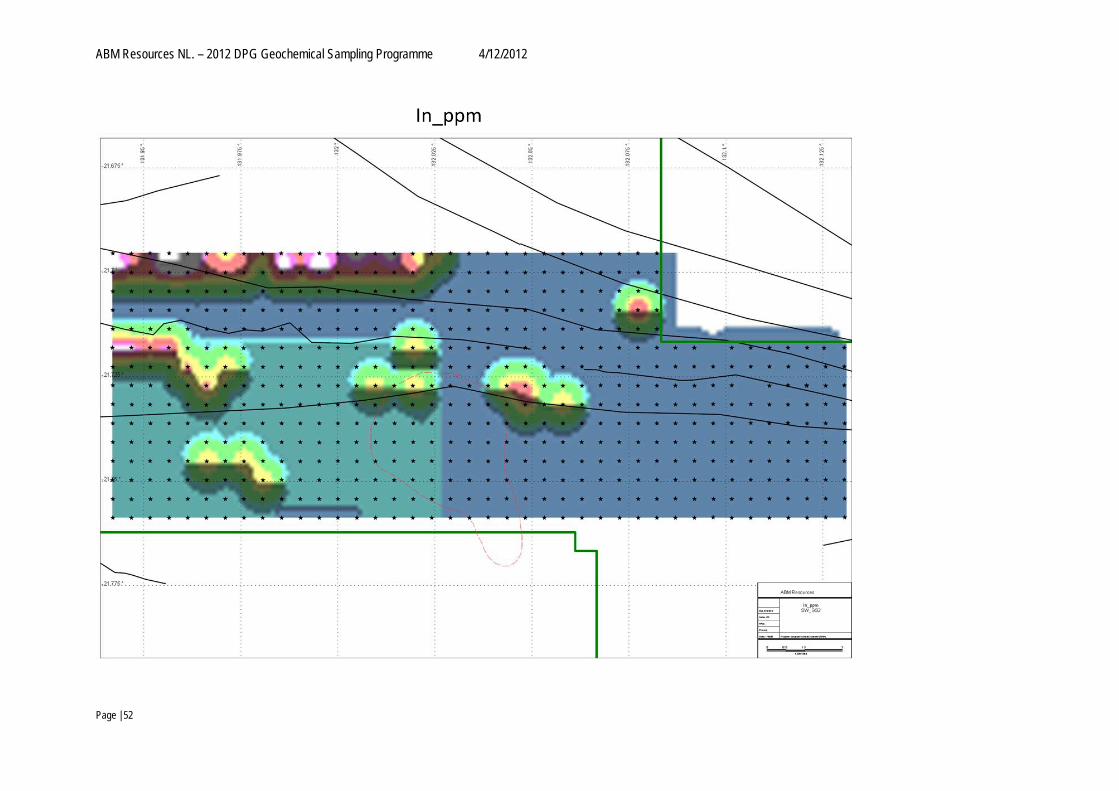
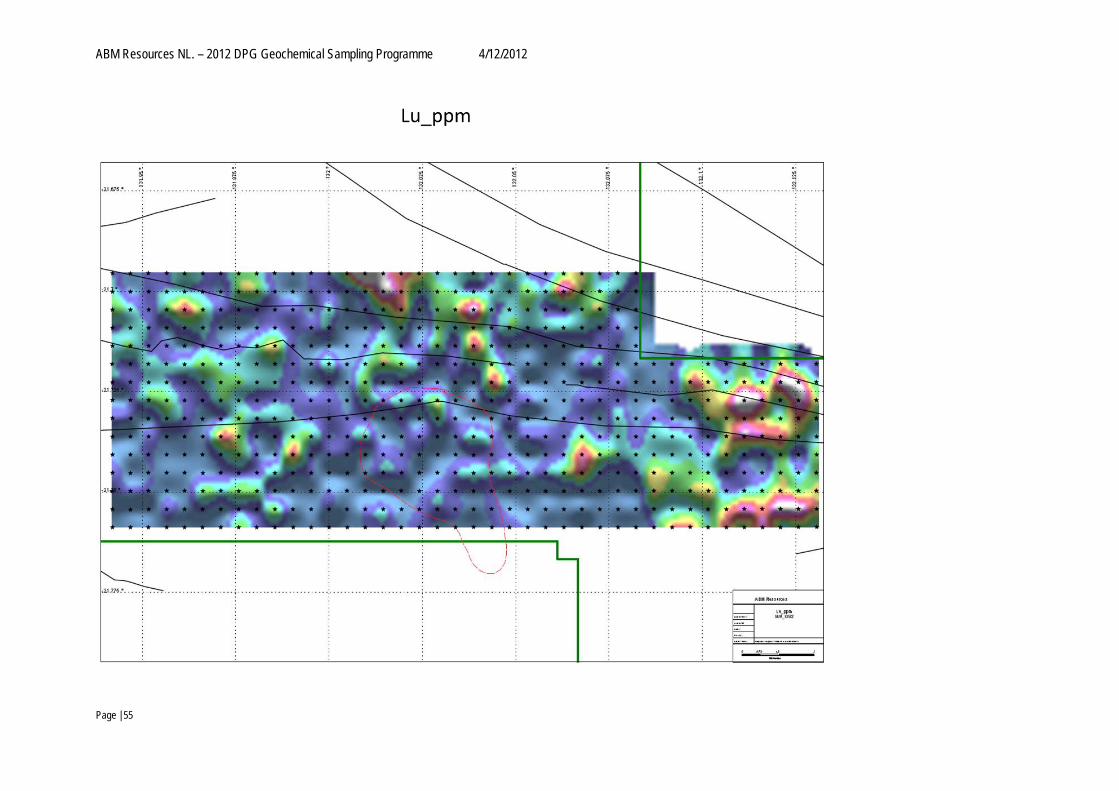
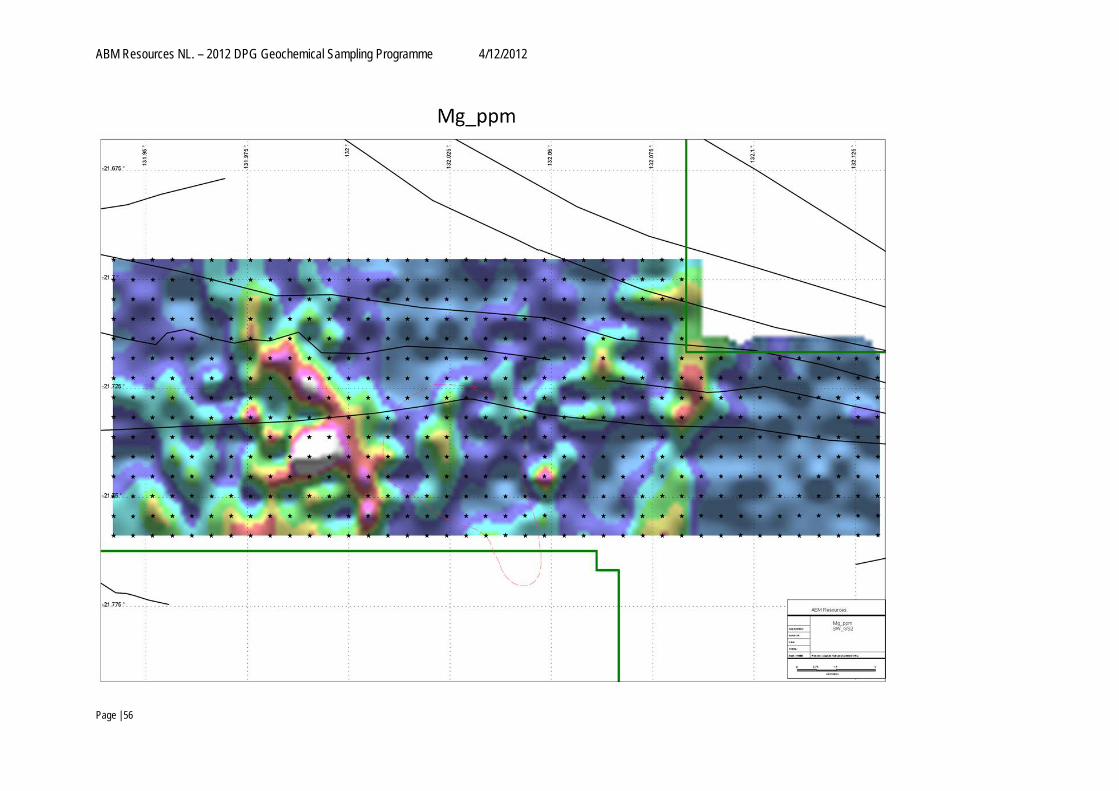
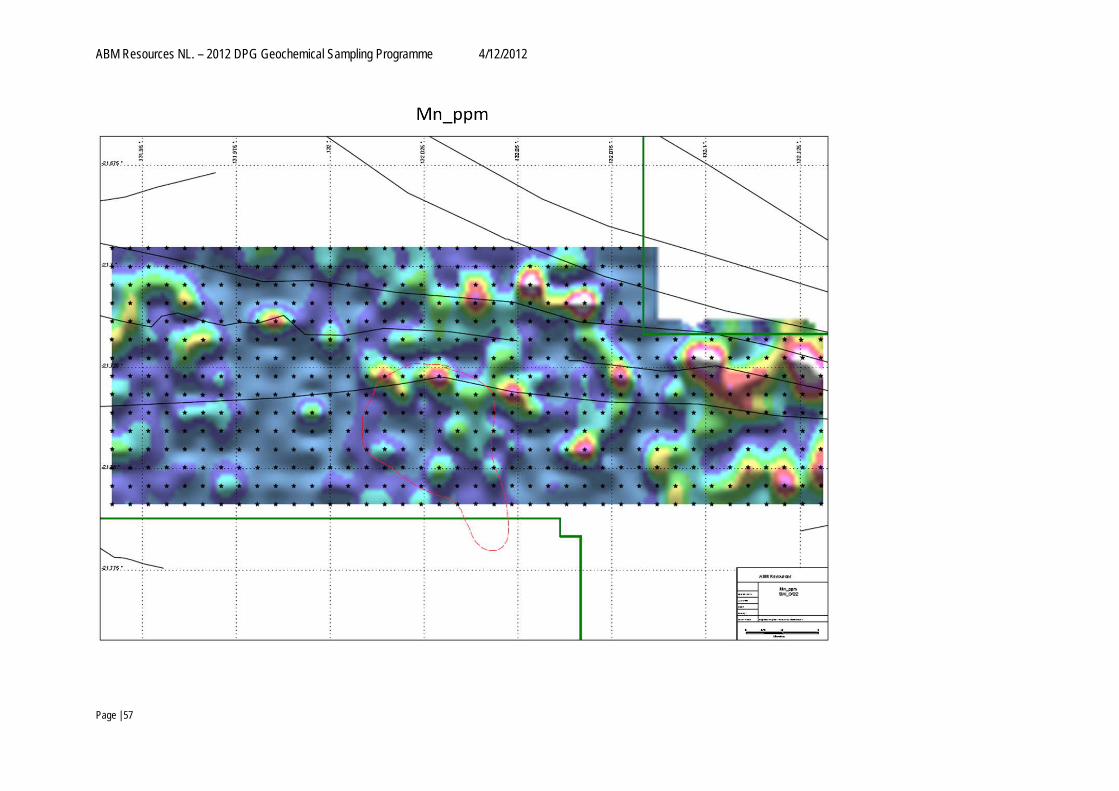
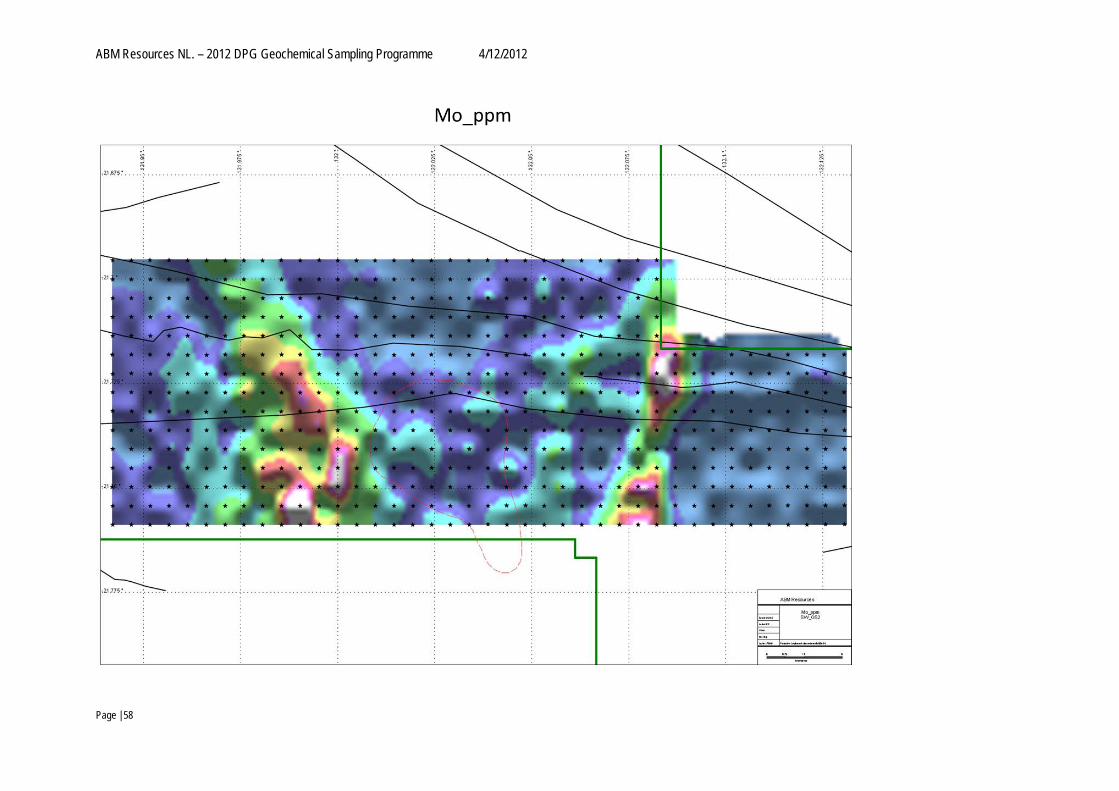
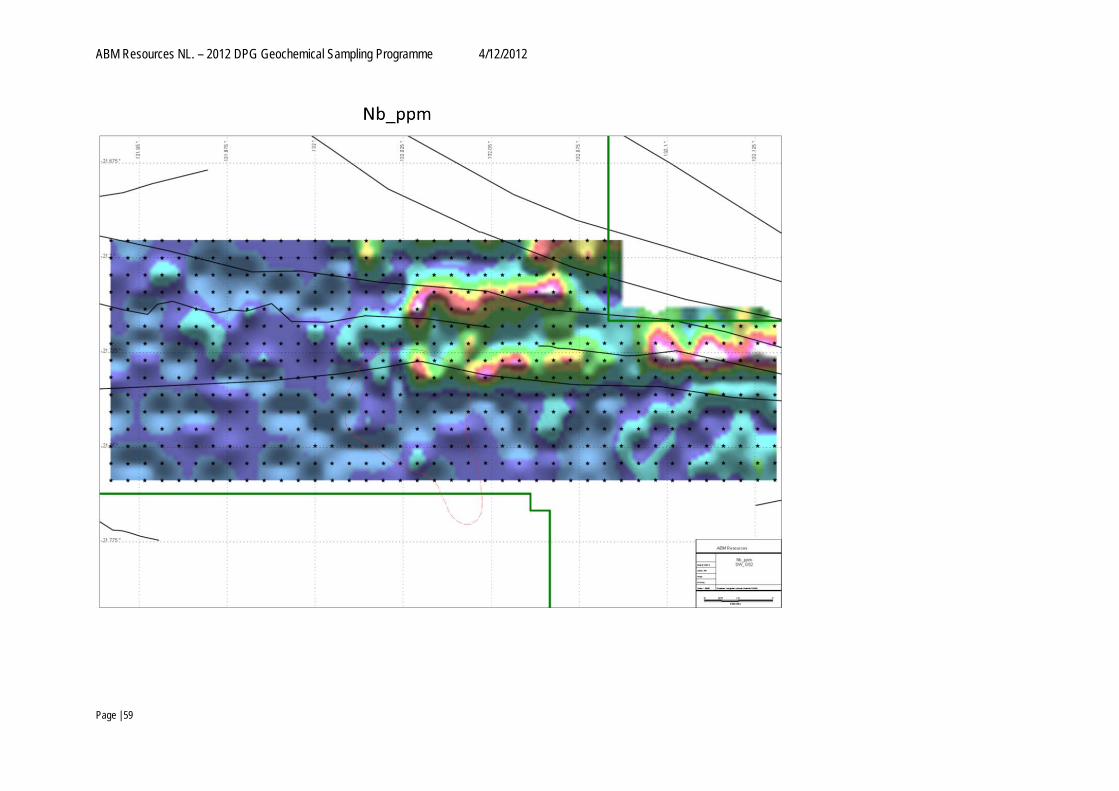
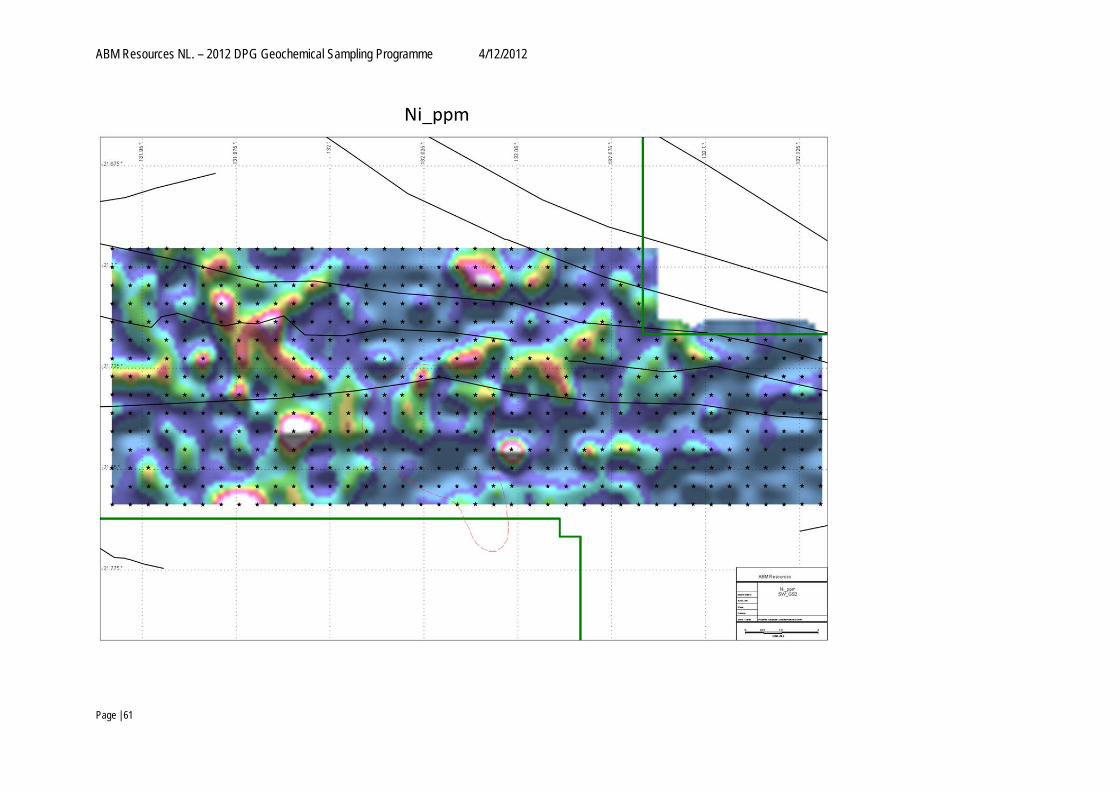
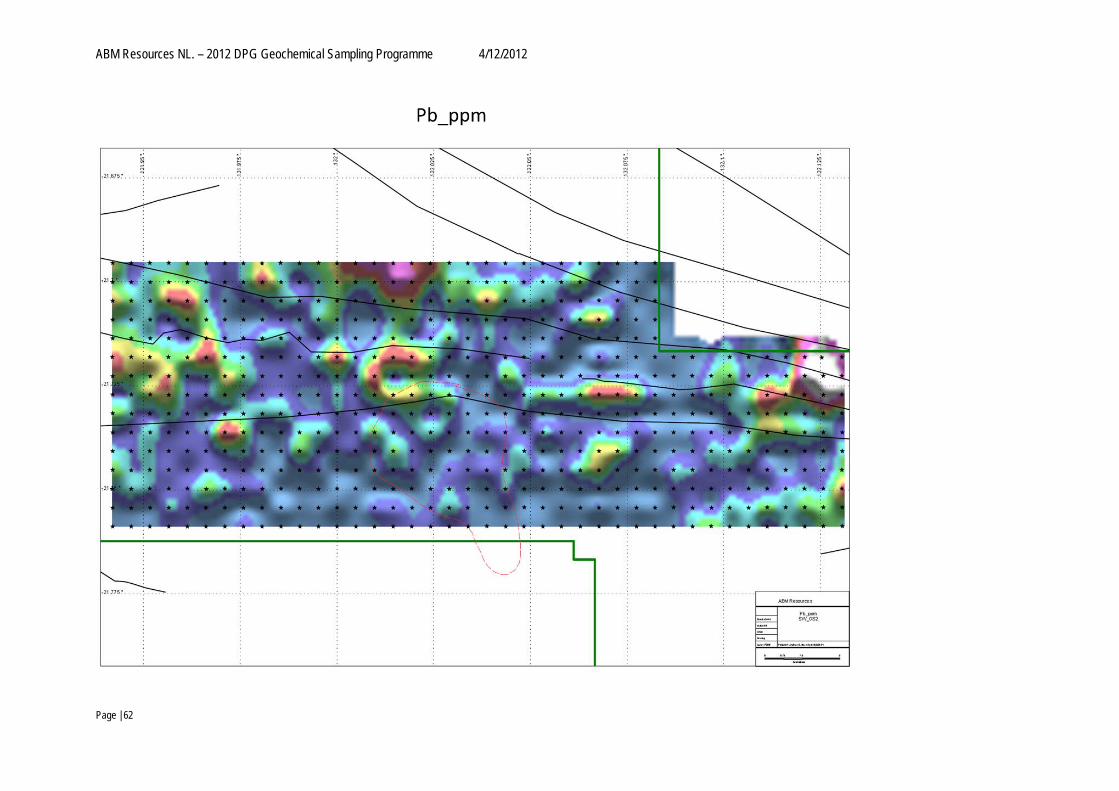
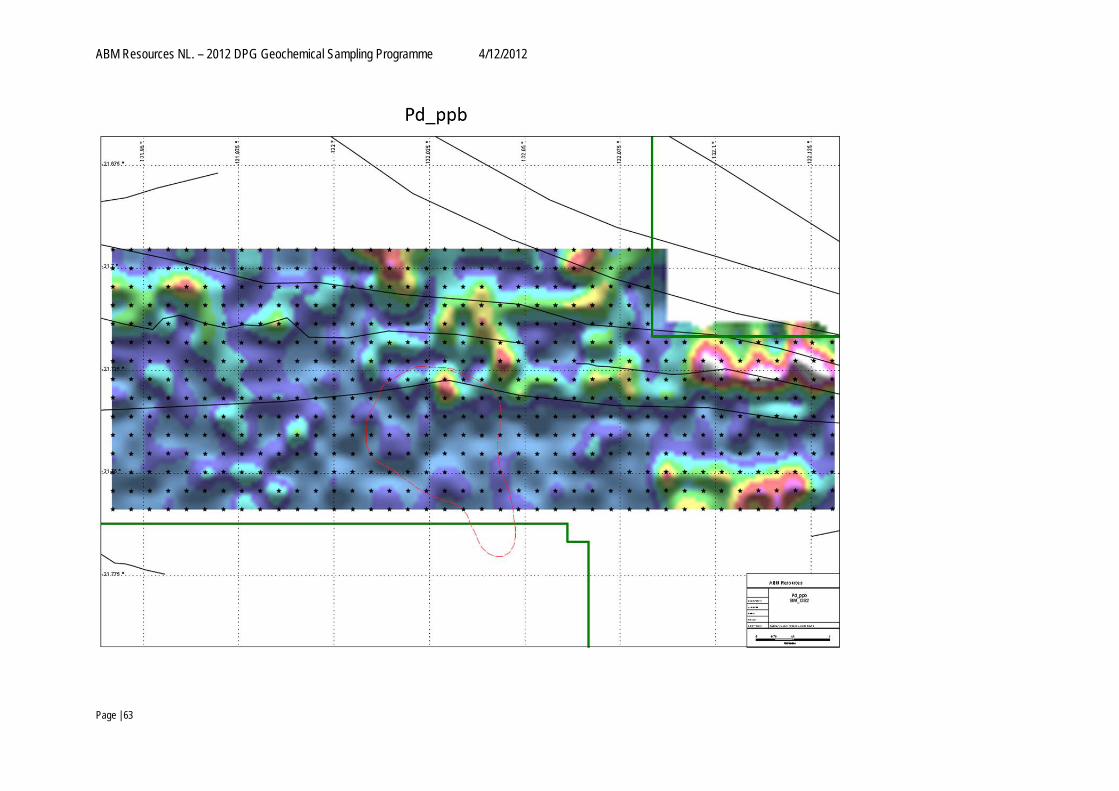
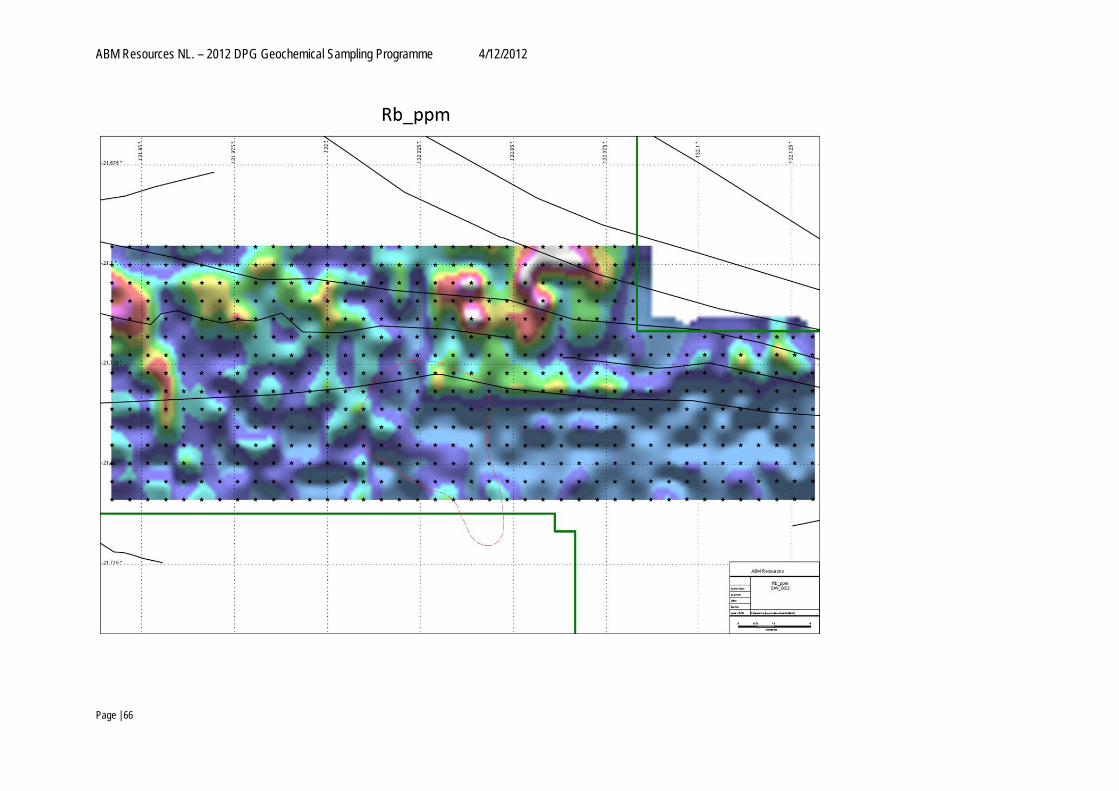
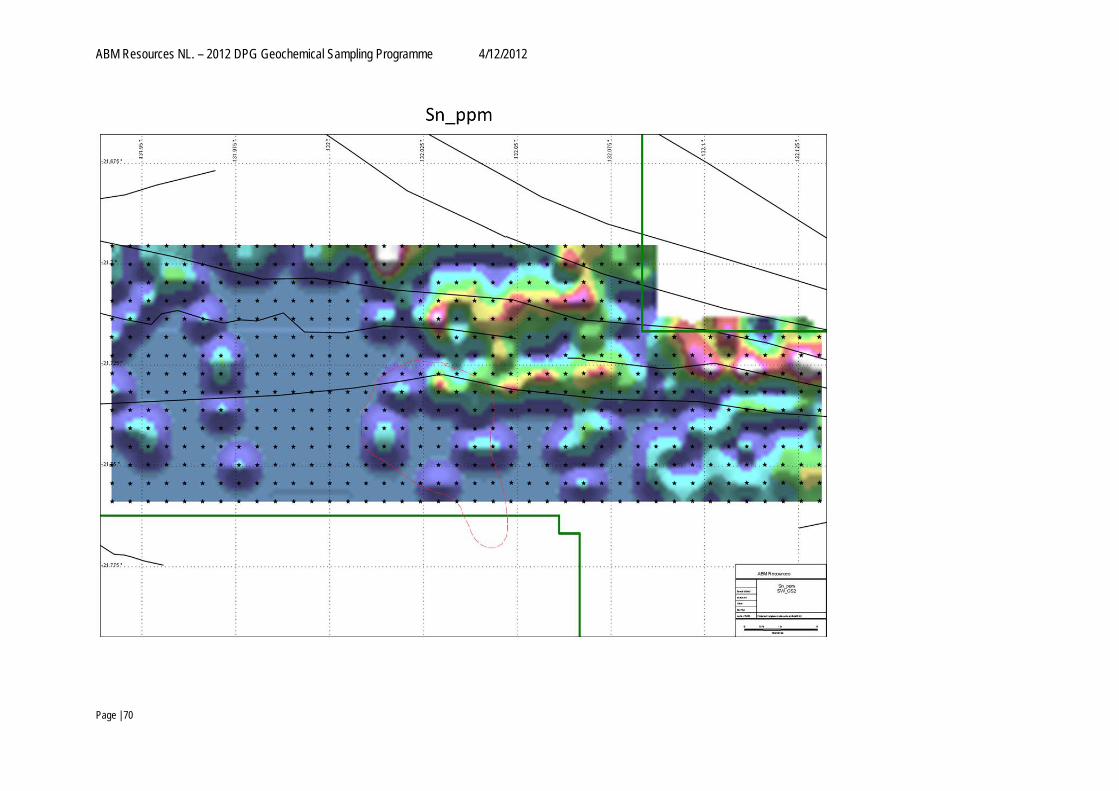
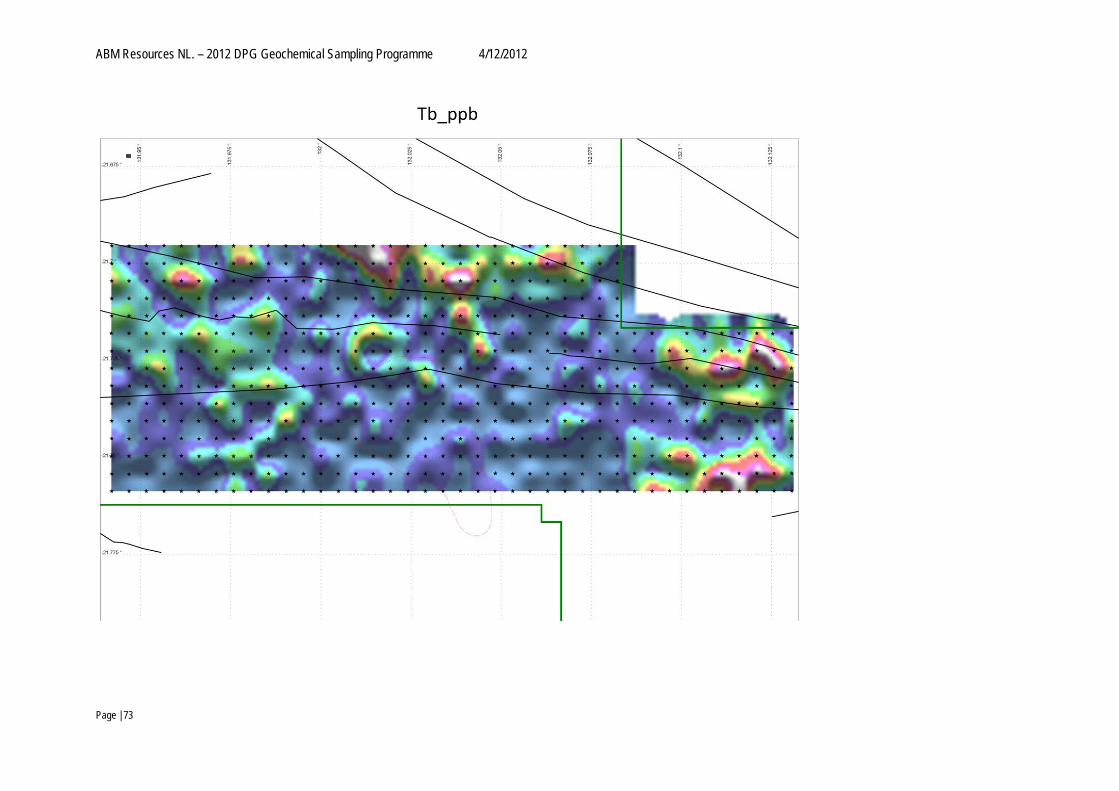
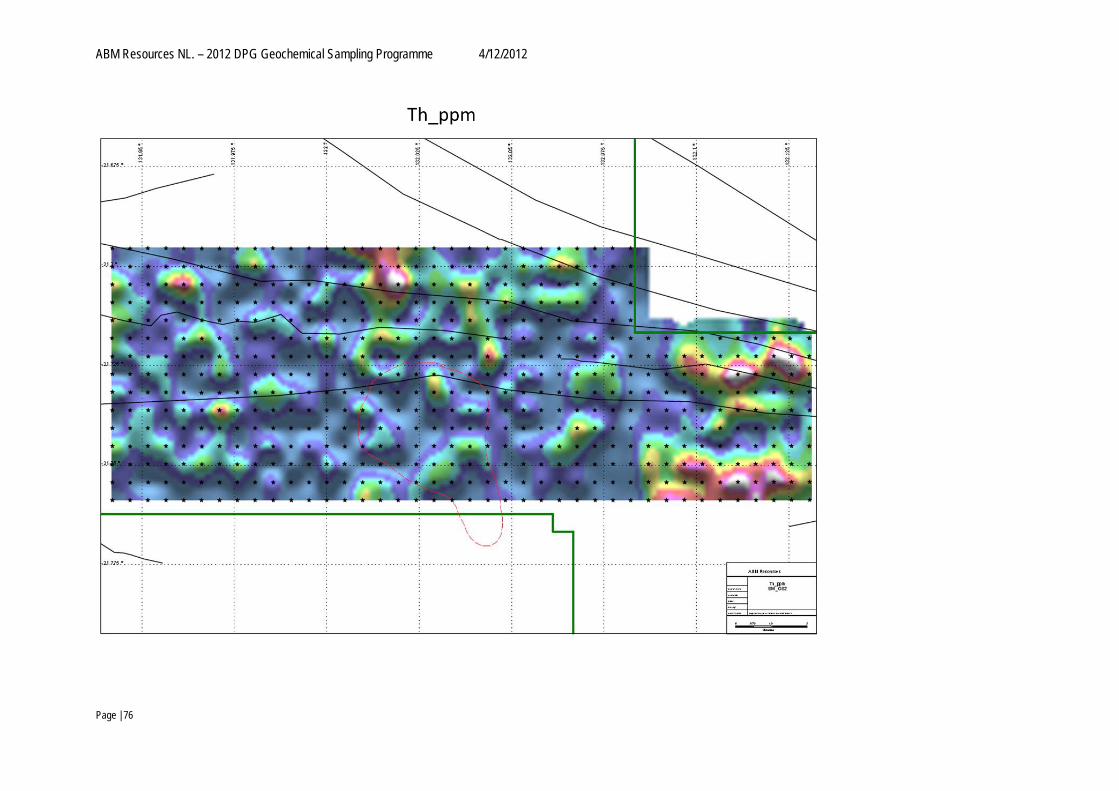
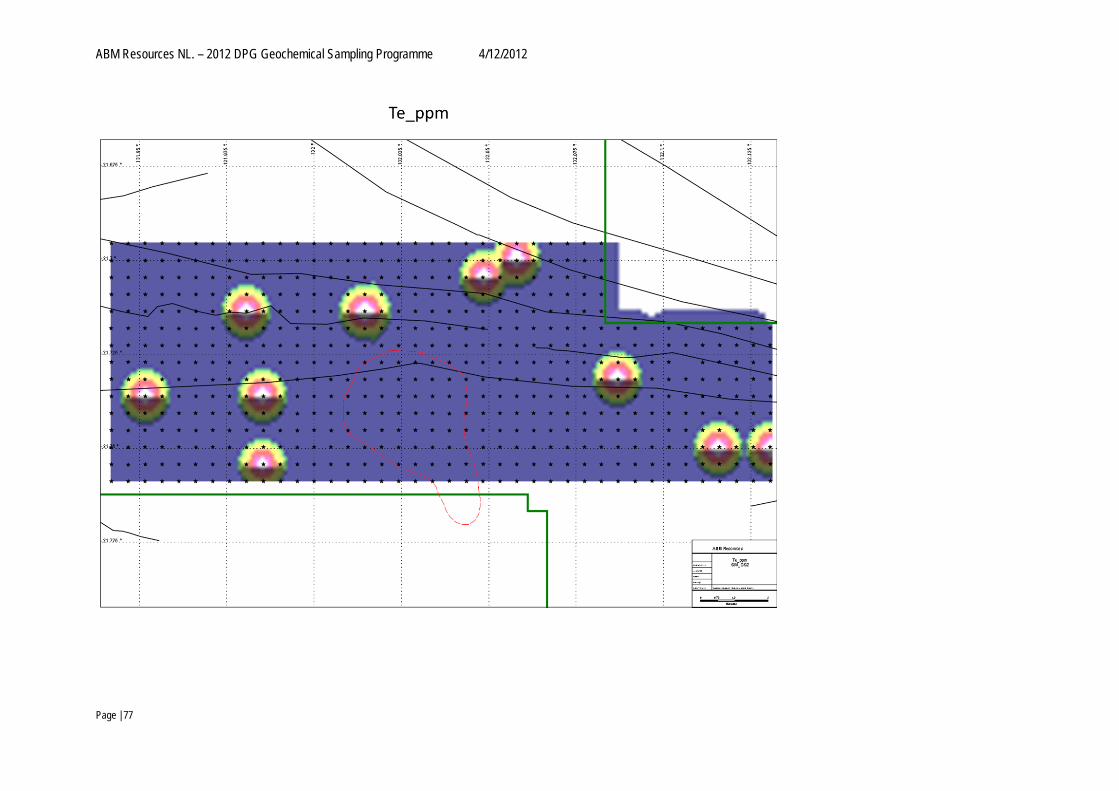
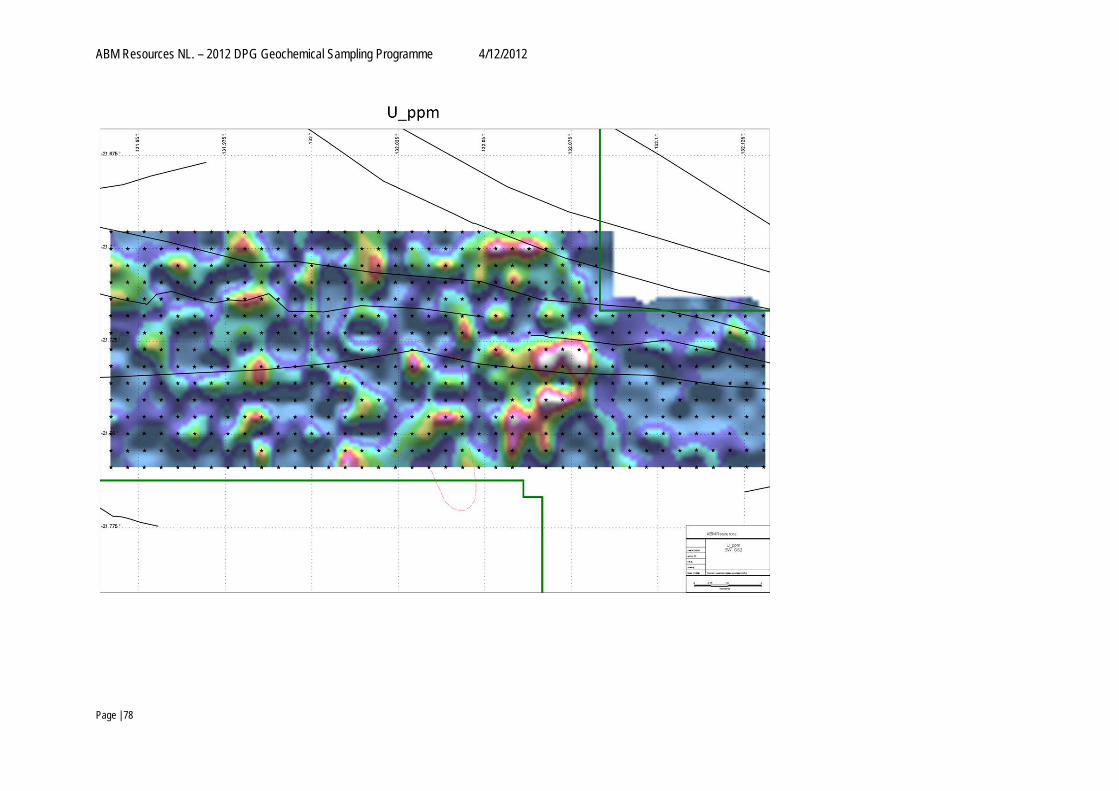
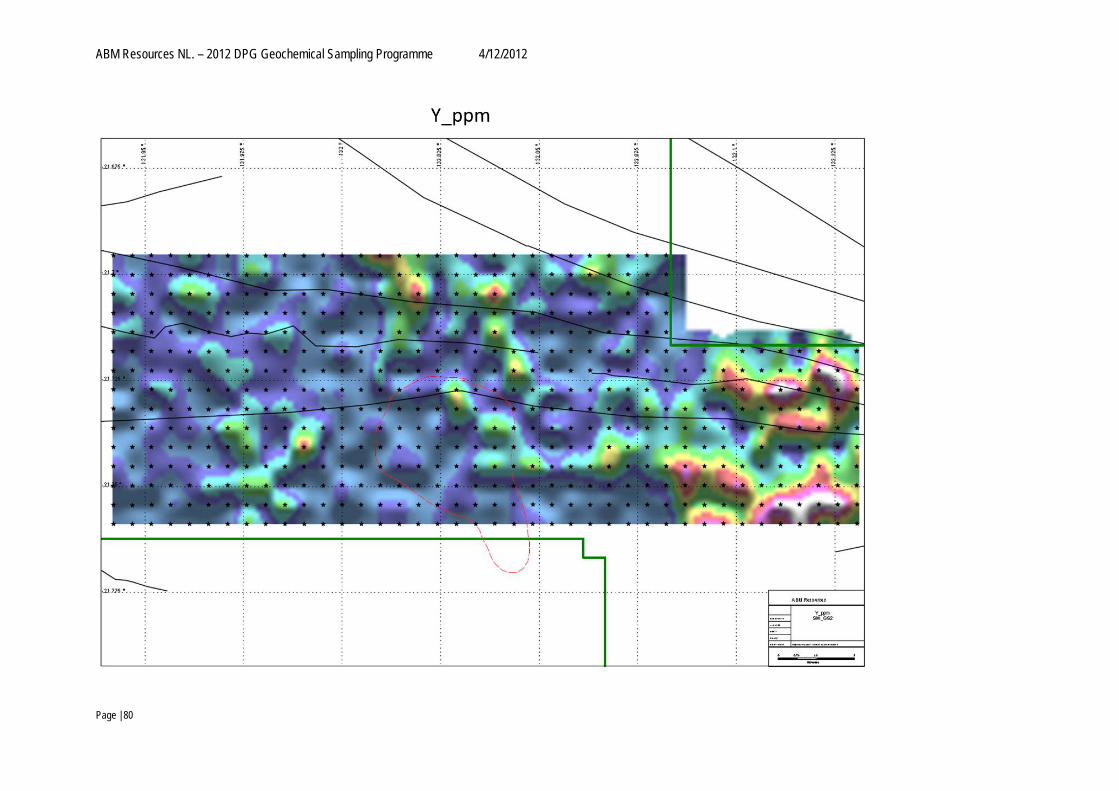
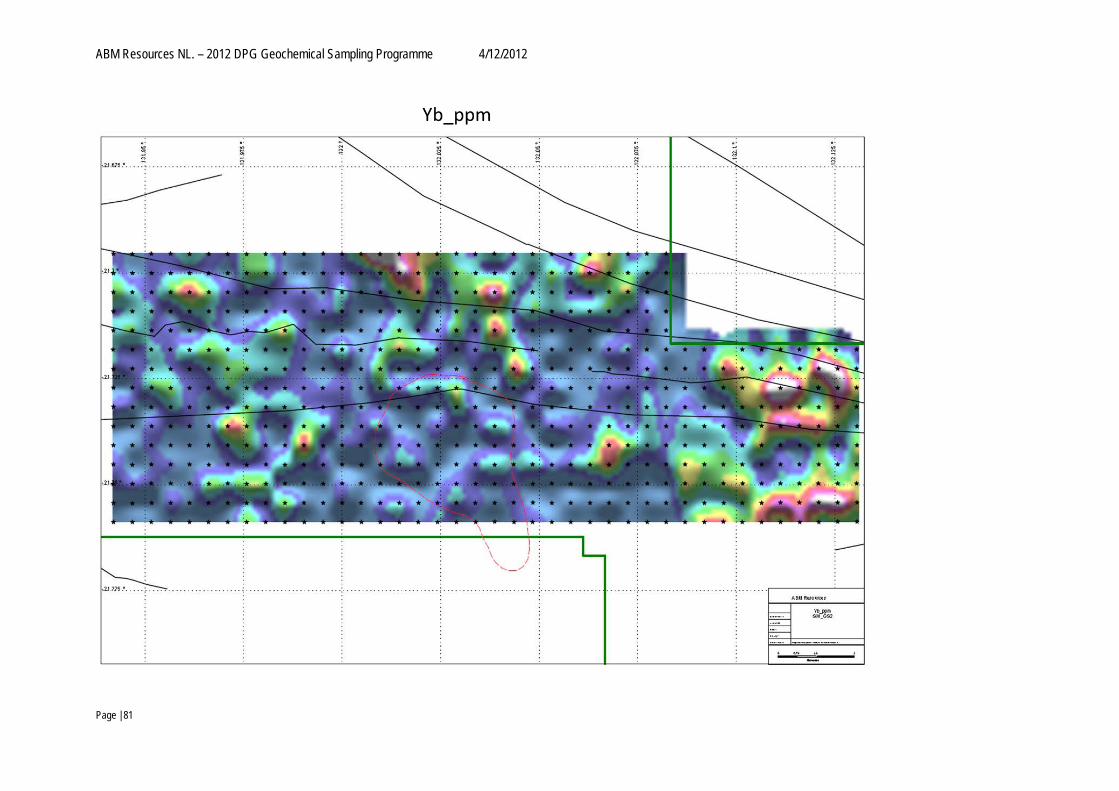
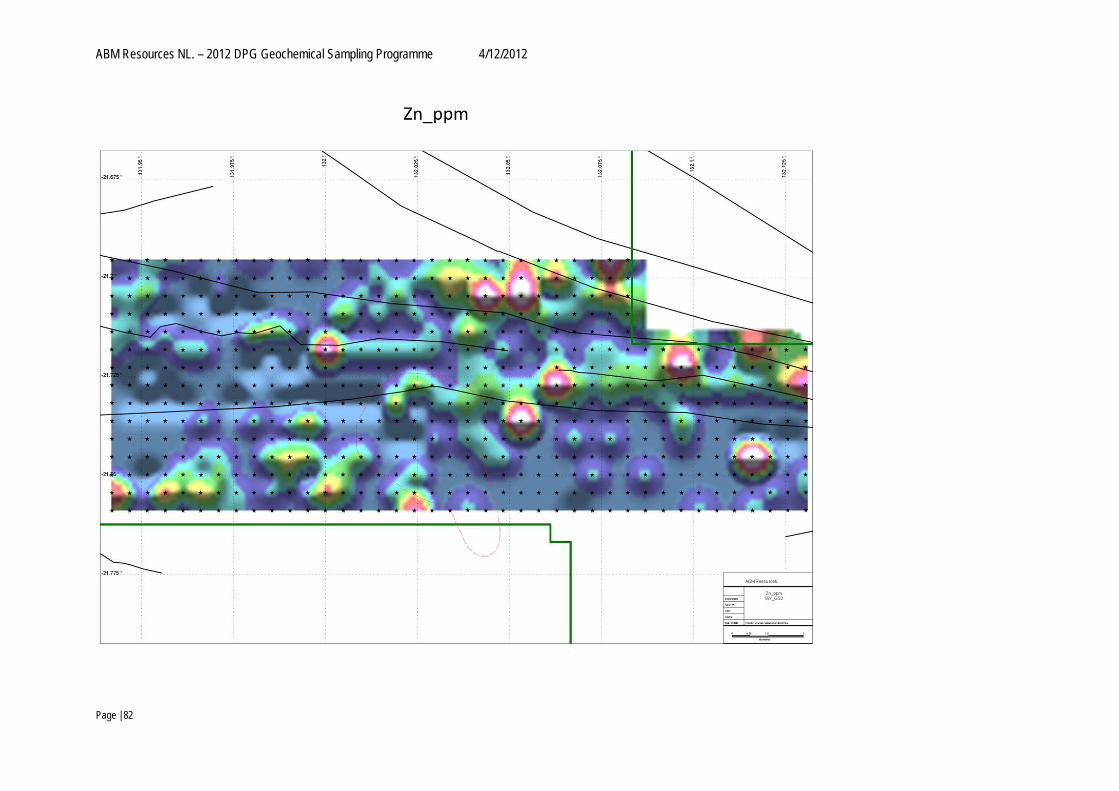
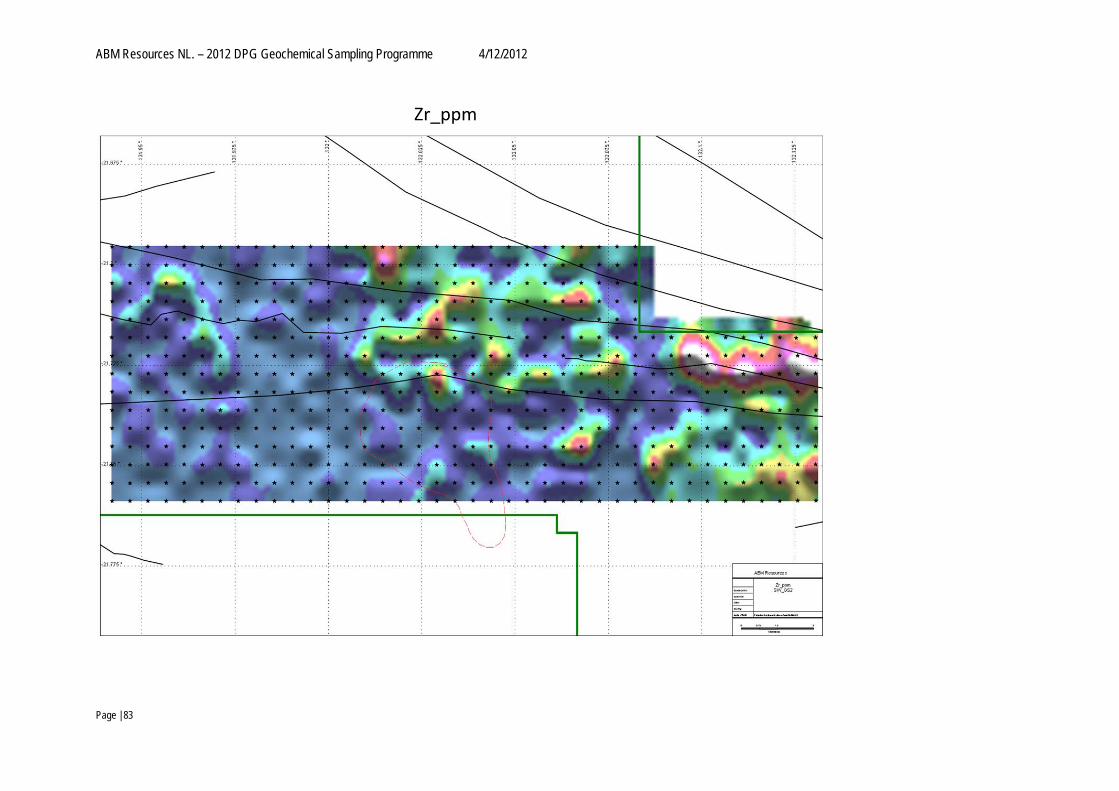
APPENDIX 2. Multielement Response The multielement data from the Ionic leach results were gridded and compared with the mapped and interpreted geological controls over the Swampy survey. Schematic map showing the Gold response over the Swampy 2 grid (SW_GS2). The red dashed line shows interpreted trend of the magnetic anomaly. The lines illustrate the interpreted regional structural trends. The results are gridded in ioGAS using unequal percentiles (0/30/60/80/90/95/98/99/100%).
ABM Resources NL. – 2012 DPG Geochemical Sampling Programme 4/12/2012
Page | 30
ABM Resources NL. – 2012 DPG Geochemical Sampling Programme 4/12/2012
Page | 31
ABM Resources NL. – 2012 DPG Geochemical Sampling Programme 4/12/2012
Page | 32
ABM Resources NL. – 2012 DPG Geochemical Sampling Programme 4/12/2012
Page | 33
ABM Resources NL. – 2012 DPG Geochemical Sampling Programme 4/12/2012
Page | 34
ABM Resources NL. – 2012 DPG Geochemical Sampling Programme 4/12/2012
Page | 35
ABM Resources NL. – 2012 DPG Geochemical Sampling Programme 4/12/2012
Page | 36
ABM Resources NL. – 2012 DPG Geochemical Sampling Programme 4/12/2012
Page | 37

ABM Resources NL. – 2012 DPG Geochemical Sampling Programme 4/12/2012
Page | 38
ABM Resources NL. – 2012 DPG Geochemical Sampling Programme 4/12/2012
Page | 39

ABM Resources NL. – 2012 DPG Geochemical Sampling Programme 4/12/2012
Page | 40

ABM Resources NL. – 2012 DPG Geochemical Sampling Programme 4/12/2012
Page | 41

ABM Resources NL. – 2012 DPG Geochemical Sampling Programme 4/12/2012
Page | 42

ABM Resources NL. – 2012 DPG Geochemical Sampling Programme 4/12/2012
Page | 43
ABM Resources NL. – 2012 DPG Geochemical Sampling Programme 4/12/2012
Page | 44

ABM Resources NL. – 2012 DPG Geochemical Sampling Programme 4/12/2012
Page | 45
ABM Resources NL. – 2012 DPG Geochemical Sampling Programme 4/12/2012
Page | 46
ABM Resources NL. – 2012 DPG Geochemical Sampling Programme 4/12/2012
Page | 47

ABM Resources NL. – 2012 DPG Geochemical Sampling Programme 4/12/2012
Page | 48
ABM Resources NL. – 2012 DPG Geochemical Sampling Programme 4/12/2012
Page | 49

ABM Resources NL. – 2012 DPG Geochemical Sampling Programme 4/12/2012
Page | 50
ABM Resources NL. – 2012 DPG Geochemical Sampling Programme 4/12/2012
Page | 51
ABM Resources NL. – 2012 DPG Geochemical Sampling Programme 4/12/2012
Page | 52

ABM Resources NL. – 2012 DPG Geochemical Sampling Programme 4/12/2012
Page | 53

ABM Resources NL. – 2012 DPG Geochemical Sampling Programme 4/12/2012
Page | 54
ABM Resources NL. – 2012 DPG Geochemical Sampling Programme 4/12/2012
Page | 55
ABM Resources NL. – 2012 DPG Geochemical Sampling Programme 4/12/2012
Page | 56
ABM Resources NL. – 2012 DPG Geochemical Sampling Programme 4/12/2012
Page | 57
ABM Resources NL. – 2012 DPG Geochemical Sampling Programme 4/12/2012
Page | 58
ABM Resources NL. – 2012 DPG Geochemical Sampling Programme 4/12/2012
Page | 59

ABM Resources NL. – 2012 DPG Geochemical Sampling Programme 4/12/2012
Page | 60
ABM Resources NL. – 2012 DPG Geochemical Sampling Programme 4/12/2012
Page | 61
ABM Resources NL. – 2012 DPG Geochemical Sampling Programme 4/12/2012
Page | 62
ABM Resources NL. – 2012 DPG Geochemical Sampling Programme 4/12/2012
Page | 63

ABM Resources NL. – 2012 DPG Geochemical Sampling Programme 4/12/2012
Page | 64

ABM Resources NL. – 2012 DPG Geochemical Sampling Programme 4/12/2012
Page | 65
ABM Resources NL. – 2012 DPG Geochemical Sampling Programme 4/12/2012
Page | 66

ABM Resources NL. – 2012 DPG Geochemical Sampling Programme 4/12/2012
Page | 67

ABM Resources NL. – 2012 DPG Geochemical Sampling Programme 4/12/2012
Page | 68

ABM Resources NL. – 2012 DPG Geochemical Sampling Programme 4/12/2012
Page | 69
ABM Resources NL. – 2012 DPG Geochemical Sampling Programme 4/12/2012
Page | 70

ABM Resources NL. – 2012 DPG Geochemical Sampling Programme 4/12/2012
Page | 71

ABM Resources NL. – 2012 DPG Geochemical Sampling Programme 4/12/2012
Page | 72
ABM Resources NL. – 2012 DPG Geochemical Sampling Programme 4/12/2012
Page | 73

ABM Resources NL. – 2012 DPG Geochemical Sampling Programme 4/12/2012
Page | 74

ABM Resources NL. – 2012 DPG Geochemical Sampling Programme 4/12/2012
Page | 75
ABM Resources NL. – 2012 DPG Geochemical Sampling Programme 4/12/2012
Page | 76
ABM Resources NL. – 2012 DPG Geochemical Sampling Programme 4/12/2012
Page | 77
ABM Resources NL. – 2012 DPG Geochemical Sampling Programme 4/12/2012
Page | 78

ABM Resources NL. – 2012 DPG Geochemical Sampling Programme 4/12/2012
Page | 79
ABM Resources NL. – 2012 DPG Geochemical Sampling Programme 4/12/2012
Page | 80
ABM Resources NL. – 2012 DPG Geochemical Sampling Programme 4/12/2012
Page | 81
ABM Resources NL. – 2012 DPG Geochemical Sampling Programme 4/12/2012
Page | 82
ABM Resources NL. – 2012 DPG Geochemical Sampling Programme 4/12/2012
Page | 83