symantec™ endpoint protection for microsoft windows
TRANSCRIPT
Symantec™ Endpoint Protection forMicrosoft® Windows Embedded Standard2009 (WES) and Windows® XP Embedded(XPe) User GuideHP thin clients

© Copyright 2008–2009 Hewlett-PackardDevelopment Company, L.P.
Microsoft and Windows are U.S. registeredtrademarks of Microsoft Corporation.Internet Explorer is either a registeredtrademark or trademark of MicrosoftCorporation in the United States and/or othercountries.
Intel and Pentium are trademarks of IntelCorporation in the U.S. and other countries.
The information contained herein is subjectto change without notice.
The only warranties for HP products andservices are set forth in the express warrantystatements accompanying such productsand services. Nothing herein should beconstrued as constituting an additionalwarranty. HP shall not be liable for technicalor editorial errors or omissions containedherein.
Symantec™ Endpoint Protection forMicrosoft® Windows EmbeddedStandard 2009 (WES) and Windows® XPEmbedded (XPe) User Guide
HP thin clients
Second Edition (March 2009)
First Edition (August 2008)
506030-002

About this bookThe software described in this book is furnished under a license agreement and may be used only inaccordance with the terms of the agreement.
Symantec Corporation, 20330 Stevens Creek Blvd., Cupertino, CA 95014, http://www.symantec.com
iii

iv About this book

Table of contents
1 System requirementsHardware requirements ........................................................................................................................ 1Software requirements ......................................................................................................................... 1
2 Introducing the agentAbout the Symantec Endpoint Protection for WES and XPe ............................................................... 2About security policies .......................................................................................................................... 2Key features of the agent ..................................................................................................................... 3
3 Agent basicsOpening the agent ................................................................................................................................ 4Navigating the main window ................................................................................................................. 4Using the menus and the toolbar ......................................................................................................... 5
Viewing traffic history ........................................................................................................... 6Displaying broadcast traffic .................................................................................................. 6Viewing currently running applications and services ........................................................... 6Displaying or hiding the message area ................................................................................ 7Viewing current security policy and communication status .................................................. 7
About the notification area icon ............................................................................................................ 8About responding to the flashing icon .................................................................................. 8Displaying the shortcut menu .............................................................................................. 8Disabling protection temporarily .......................................................................................... 9Changing security levels ...................................................................................................... 9Enabling password protection .............................................................................................. 9
Testing your endpoint ......................................................................................................................... 10
4 Responding to messages and warningsAbout message types ......................................................................................................................... 11
Application messages ........................................................................................................ 11Changed application messages ......................................................................................... 12
Responding to application messages ................................................................................................. 12Responding to Trojan horse warnings ................................................................................................ 13Responding to blocked traffic messages ............................................................................................ 14
v

Responding to permission status messages ...................................................................................... 14
5 Monitoring and loggingAbout logs .......................................................................................................................................... 15
About the Security log ........................................................................................................ 16About the Traffic log ........................................................................................................... 17About the Packet log .......................................................................................................... 18About the System log ......................................................................................................... 19
Viewing logs ....................................................................................................................................... 19Back tracing logged events ................................................................................................................ 20Exporting logs ..................................................................................................................................... 21Filtering logged events ....................................................................................................................... 21Stopping an active response .............................................................................................................. 22
6 Command Line ManagementThe command-line interface for the client service .............................................................................. 23Typing a parameter if the agent is password-protected ..................................................................... 24
Index ................................................................................................................................................................... 26
vi
1 System requirements
This chapter includes the following topics:
● Hardware requirements on page 1
● Software requirements on page 1
Hardware requirementsThe agent requires the following minimum hardware:
● Intel® Pentium® 133 MHz or equivalent
● 256 MB RAM
● 40 MB available hard disk space
● One Ethernet adapter (with TCP/IP installed)
Software requirementsThe agent requires the following software:
● Windows Embedded Standard 2009 (WES) operating system or
● Windows XP Embedded (XPe) operating system or
● Windows Embedded Point of Service operating system
● Windows Internet Explorer® 6.0
● TCP/IP Networking
● COM Base
● IP Security Services
● NDIS & NDSI User-mode I/O Driver
● OLE Dialog Interfaces
● User Interface Core
Hardware requirements 1

2 Introducing the agent
This chapter includes the following topics:
● About the Symantec Endpoint Protection for WES and XPe on page 2
● About security policies on page 2
● Key features of the agent on page 3
About the Symantec Endpoint Protection for WES andXPe
The Symantec Endpoint Protection for WES and XPe (the agent) is security software that is installedon embedded endpoints, such as ATMs, Point of Service systems, and thin clients, that run the WES,XPe, or the XPe Point of Service operating system.
The agent provides a customizable firewall that protects the endpoint from intrusion and misuse, whethermalicious or unintentional. It detects and identifies known Trojan horses, port scans, and other commonattacks. In response, it selectively allows or blocks traffic, or various networking services, applications,ports, and components.
About security policiesThe agent uses security policies, which include firewall rules, and security settings. These policiesprotect an individual endpoint from network traffic and the viruses that can cause harm. Firewall rulesdetermine whether your endpoint allows or blocks an incoming or outgoing application or service fromgaining access through your network connection. Firewall rules allow the agent to systematically allowor block incoming or outgoing applications and traffic from or to specific IP addresses and ports. Securitysettings detect and identify common attacks, send e-mail messages after an attack, displaycustomizable messages, and accomplish other related security tasks. The configuration of firewall ruleswith other security and antivirus settings results in a security agent that protects your endpoint.
2 Chapter 2 Introducing the agent

Key features of the agentThe agent can be used in the following networking environments:
● Directly connected to the local area network or wireless network
● Remotely connected using Virtual Private Network (VPN) or dial-up
● Completely disconnected from any network
The agent does not support location awareness or host integrity. Host integrity will be supported in alater release.
Key features of the agent 3

3 Agent basics
This chapter includes the following topics:
● Opening the agent on page 4
● Navigating the main window on page 4
● Using the menus and the toolbar on page 5
● About the notification area icon on page 8
● Testing your endpoint on page 10
Opening the agentThe agent is designed to start automatically when you turn on your endpoint, protecting you immediately.To configure your agent or review logs of potential attacks on your agent, you open the agent first.
To open the agent
1. On the Windows taskbar, click Start > Programs.
2. Click Symantec > Symantec Endpoint Protection for Windows XP Embedded agent.
Navigating the main windowOnce you open the agent, you see the main screen. The main screen provides real-time network trafficupdates, online status, links to logs, and access to various advanced rules, security settings, andantivirus settings.
The user interface changes depending on the different control modes of the agent, including user mode,admin mode, or mixed mode. In addition, some icons may not appear, depending on how your systemadministrator configured the agent.
The agent is resizable, so you can view it as a full-screen or part-screen image.
4 Chapter 3 Agent basics
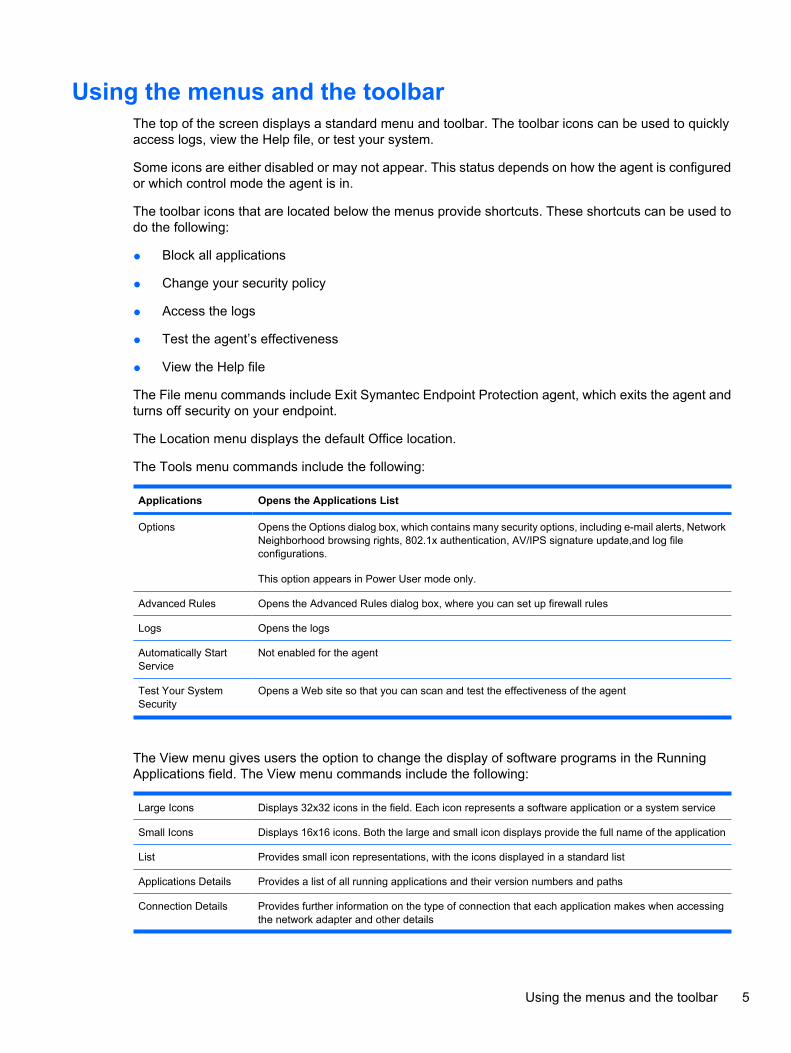
Using the menus and the toolbarThe top of the screen displays a standard menu and toolbar. The toolbar icons can be used to quicklyaccess logs, view the Help file, or test your system.
Some icons are either disabled or may not appear. This status depends on how the agent is configuredor which control mode the agent is in.
The toolbar icons that are located below the menus provide shortcuts. These shortcuts can be used todo the following:
● Block all applications
● Change your security policy
● Access the logs
● Test the agent’s effectiveness
● View the Help file
The File menu commands include Exit Symantec Endpoint Protection agent, which exits the agent andturns off security on your endpoint.
The Location menu displays the default Office location.
The Tools menu commands include the following:
Applications Opens the Applications List
Options Opens the Options dialog box, which contains many security options, including e-mail alerts, NetworkNeighborhood browsing rights, 802.1x authentication, AV/IPS signature update,and log fileconfigurations.
This option appears in Power User mode only.
Advanced Rules Opens the Advanced Rules dialog box, where you can set up firewall rules
Logs Opens the logs
Automatically StartService
Not enabled for the agent
Test Your SystemSecurity
Opens a Web site so that you can scan and test the effectiveness of the agent
The View menu gives users the option to change the display of software programs in the RunningApplications field. The View menu commands include the following:
Large Icons Displays 32x32 icons in the field. Each icon represents a software application or a system service
Small Icons Displays 16x16 icons. Both the large and small icon displays provide the full name of the application
List Provides small icon representations, with the icons displayed in a standard list
Applications Details Provides a list of all running applications and their version numbers and paths
Connection Details Provides further information on the type of connection that each application makes when accessingthe network adapter and other details
Using the menus and the toolbar 5
Hide WindowsServices
Toggles the display of Windows Services
Hide Broadcast Traffic Toggles the display of broadcast traffic
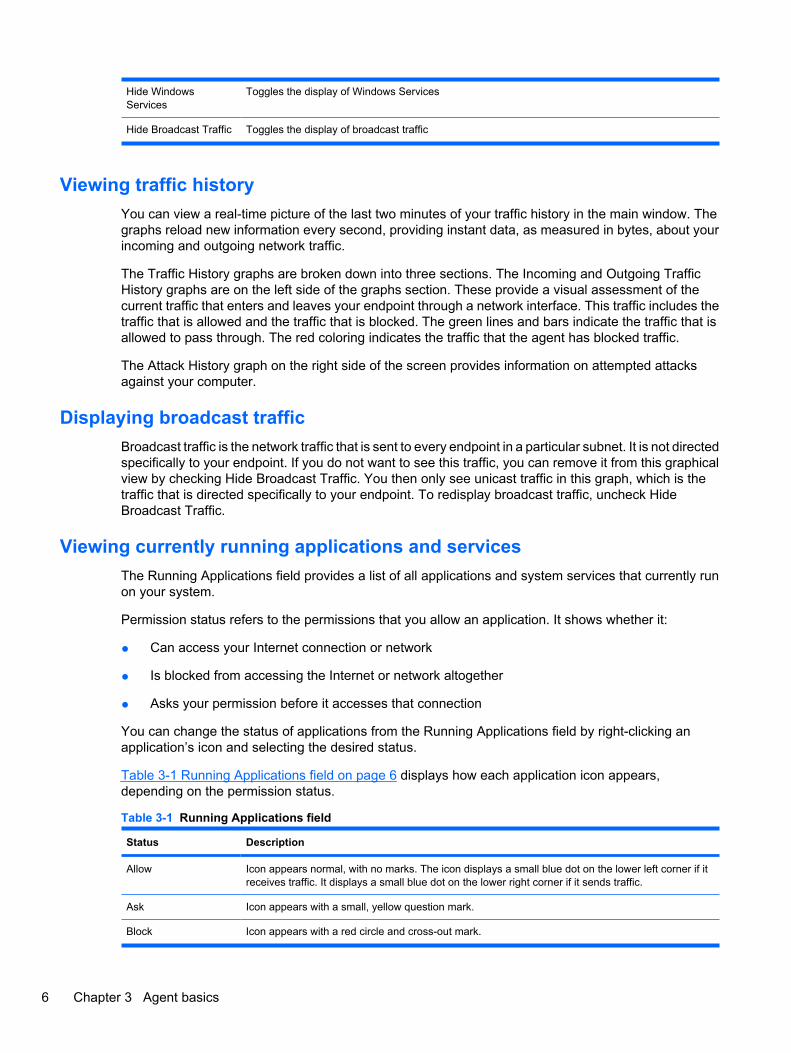
Viewing traffic historyYou can view a real-time picture of the last two minutes of your traffic history in the main window. Thegraphs reload new information every second, providing instant data, as measured in bytes, about yourincoming and outgoing network traffic.
The Traffic History graphs are broken down into three sections. The Incoming and Outgoing TrafficHistory graphs are on the left side of the graphs section. These provide a visual assessment of thecurrent traffic that enters and leaves your endpoint through a network interface. This traffic includes thetraffic that is allowed and the traffic that is blocked. The green lines and bars indicate the traffic that isallowed to pass through. The red coloring indicates the traffic that the agent has blocked traffic.
The Attack History graph on the right side of the screen provides information on attempted attacksagainst your computer.
Displaying broadcast trafficBroadcast traffic is the network traffic that is sent to every endpoint in a particular subnet. It is not directedspecifically to your endpoint. If you do not want to see this traffic, you can remove it from this graphicalview by checking Hide Broadcast Traffic. You then only see unicast traffic in this graph, which is thetraffic that is directed specifically to your endpoint. To redisplay broadcast traffic, uncheck HideBroadcast Traffic.
Viewing currently running applications and servicesThe Running Applications field provides a list of all applications and system services that currently runon your system.
Permission status refers to the permissions that you allow an application. It shows whether it:
● Can access your Internet connection or network
● Is blocked from accessing the Internet or network altogether
● Asks your permission before it accesses that connection
You can change the status of applications from the Running Applications field by right-clicking anapplication’s icon and selecting the desired status.
Table 3-1 Running Applications field on page 6 displays how each application icon appears,depending on the permission status.
Table 3-1 Running Applications field
Status Description
Allow Icon appears normal, with no marks. The icon displays a small blue dot on the lower left corner if itreceives traffic. It displays a small blue dot on the lower right corner if it sends traffic.
Ask Icon appears with a small, yellow question mark.
Block Icon appears with a red circle and cross-out mark.
6 Chapter 3 Agent basics
There are a number of services running at any given time. Since they are often crucial to the operationof your endpoint, you may want to allow them. You can show or hide them from the message console.
To hide system services
▲ Click Hide Windows Services.
To change the display of applications
▲ Right-click the Running Applications field and select the desired view.
To stop an application or service from running
▲ In the Running Applications field, right-click the application and click Terminate.
Displaying or hiding the message areaThe message area is located at the bottom of the main screen. It provides a real-time update of theserver-agent communication status. This update includes when the latest security policy is downloadedand the number of the policy serial numbers.
The message area is hidden by default.
To show or hide the message area
1. Below the Running Applications field, click Show Message Console. The message areaappears.
2. To hide the message area from view, click Hide Message Console. The message area collapsesand displays the Show Message Console icon.
Viewing current security policy and communication statusThis section explains how to view current security policy and communication status.
To view the current policy information
▲ On the bottom of the main screen, look for the status bar.
You can view a real-time update of the agent’s communication with the server. If green, the light indicatesthat the agent is online and communicating with the management server. If gray, the agent is notconnected to the management server.
To view the communication status
▲ In the right-hand corner of the status bar, look for the status icon.
Using the menus and the toolbar 7

About the notification area icon
RED The agent has blocked traffic.
GREEN Traffic flows uninterrupted by the agent.
GRAY No traffic flows in that direction. A green dot means that the agent is connected to the Symantec PolicyManager.
About responding to the flashing iconIf you see a flashing icon, the endpoint may be responding to an attempted attack. When you rest yourmouse over the flashing icon, a tool tip appears telling you that you are under an attack.
To make the icon stop flashing, double-click the icon. The Security log opens, displaying a new log entry.The icon stops flashing after one minute.
Displaying the shortcut menuThe agent has a notification area icon that is located in the lower-right corner of your desktop. Right-click this icon to show frequently used commands.
Table 3-2 Notification area icon shortcut menu on page 8 displays the following notification area iconshortcut menu and commands for the Server Control mode and Client Control mode. Commands onthe shortcut menu for the Power User mode vary depending on what options are set on the server.
Table 3-2 Notification area icon shortcut menu
Menu command Description Server Control mode Client Control mode
Symantec Protection Agent Opens the agent’s mainscreen
X X
Normal Allows network traffic to flowas normal
X
Block All Blocks all network traffic X
Applications pens the Applications list X X
Logs Opens the agent logs X X
Options Opens the Options dialog box,where you can configure thesettings for the agent
X
Advanced Rules Opens the Advanced Rulesdialog box, where you canwrite specific rules forallowing or blocking networkaccess
X
Help Topics Opens the online Help system X X
8 Chapter 3 Agent basics

Menu command Description Server Control mode Client Control mode
About Opens the About dialog box,providing information on yourversion of the agent
X X
Exit Symantec ProtectionAgent
Stops the agent from running.You need to restart the agentto protect your system
NOTE: This option mayappear dimmed or not at all.
X X
Disabling protection temporarilyYou may need to disable security on the agent so that the agent does not block outbound traffic. Youdisable security from the management server. You cannot do it from the agent. If you must disablesecurity from the agent, exit the agent.
To temporarily disable blocking
▲ Exit the agent.
Changing security levelsThe agent supports two security levels: Normal and Block All.
To change your security level
1. Click Security.
2. Click Block All or Normal.
Enabling password protectionYou can set your agent to require a password before you make any security changes or before you exitthe agent.
To enable password protection
1. Click the Tools > Options > General tab.
2. Click Set Password.
3. In the Password dialog box, type your new password in the New Password and Confirm NewPassword fields. You can disable password protection by leaving both fields blank.
4. Click OK.
5. To have the agent prompt you for a password before you exit the agent, on the General tab,click Ask password while exiting.
Table 3-2 Notification area icon shortcut menu (continued)
About the notification area icon 9

Testing your endpointYou can test the vulnerability of your system to outside threats by scanning your system. Assessingyour vulnerability to an attack is one of the most important steps that you can take. With what you learnfrom the tests, you can more effectively set the various options on your agent to protect your endpointfrom attack.
To test your endpoint
1. Do one of the following:
● On the toolbar, click Security Test.
● On the Tools menu, click Test Your System Security.
The Symantec Security Check scans your endpoint and tries to determine your IP address,operating system, Web browser, and other information about your system.
2. Choose one of the following scans:
● Security Scan
● Virus Detection
3. Click Start.
10 Chapter 3 Agent basics
4 Responding to messages andwarnings
This chapter includes the following topics:
● About message types on page 11
● Responding to application messages on page 12
● Responding to Trojan horse warnings on page 13
● Responding to blocked traffic messages on page 14
● Responding to permission status messages on page 14
About message typesYou may see several different types of messages on the endpoint. These messages usually describea situation and indicate how the agent tries to resolve the issue.
You may see the following types of messages:
● Application messages
● Changed application messages
● Fast user switch messages
Application messagesAn application-related message occurs for one of the following reasons:
● An application that the agent has never seen before, or that has been assigned the status of Ask,tries to access your network connection.
● An application that normally accesses your network connection has changed, possibly because ofa product upgrade.
● Your agent software is being updated.
● Your agent has detected a Trojan horse on your endpoint.
For example, you may see the following type of message when an application or service tries to accessyour endpoint, the port, and other information.
About message types 11

Internet Explorer (IEXPLORE.EXE) is trying to connect to www.symantec.com using remote port 80 (HTTP - World Wide Web). Do you want to allow this program to access the network?
This message appears because the application has been opened, either directly or indirectly by you, orby another application.
If you didn’t open any program or click any link and an application tries to access your networkconnection, there may be a number of different reasons. However, if you cannot see any reason thatapplication should try to access your network connection, it is always safest to click No. This messagemight indicate the presence of a Trojan horse on your endpoint, something that needs to be checkedimmediately.
Changed application messagesOccasionally, you might see a message that indicates an application has changed.
● Telnet Program has changed since the last time you opened it, this could be because you have updated it recently. Do you want to allow it to access the network?
The application that is listed on the message is trying to access your network connection. Although theagent recognizes the name of the application, something about the application has changed since thelast time the agent encountered it.
This change could be because you have upgraded the product recently. The agent uses an MD5checksum to determine the legitimacy of an application. An upgraded version might not pass thechecksum test because it may to have a different checksum value.
If you have not recently upgraded the application, your network may be under attack by a Trojan horse.
Responding to application messagesYou can change the status of the application at any time, either in the Running Applications field or inthe Applications List.
To respond to application messages
1. Click Detail to view more information about the application, including the file name, version number,and path name. The Detail section also displays whether the application tries to connect locally toyour endpoint or remotely to an outside destination. It shows the local and remote port numbersand IP addresses.
2. If you want the agent to remember your choice for the next time this application tries to access yournetwork connection, click Remember my answer, and do not ask me again for thisapplication.
3. Do one of the following actions: Depending on whether you select or don’t select the Remembermy answer, and do not ask me again for this application option and click the Yes or No icons,the application is assigned the following permission statuses.
● To allow the application to access the network connection, click Yes.
● To block the application from accessing the network connection, click No.
12 Chapter 4 Responding to messages and warnings
Responding to Trojan horse warningsIf the agent detects a known Trojan horse on your endpoint, it blocks the Trojan horse from accessingyour system and displays a message such as the following:
● “C:\WINNT\System32\UMGR32.EXE, a Trojan horse application has been detected on your computer. It has been blocked by the Symantec Protection Agent.”
This message means that a Trojan horse is present on your system and has been activated. Either youtried to open the program that was identified as a Trojan horse, or it has been triggered by anotherprogram on your endpoint. It is possible that the Trojan horse was on your endpoint when you installedthe agent. It is also possible that you have recently downloaded it through a legitimate application, suchas a Web browser. The Trojan horse tried to access your network connection, and has been blockedby the agent.
To respond to a Trojan horse warning
1. Click OK.
2. Immediately notify your IT department. The agent blocks the Trojan horse from sending anyinformation out of or into your endpoint. However, it is still important to remove it from your systemas soon as possible. The agent terminates the Trojan horse process automatically, but removalrequires the assistance of your IT department.
Responding to Trojan horse warnings 13
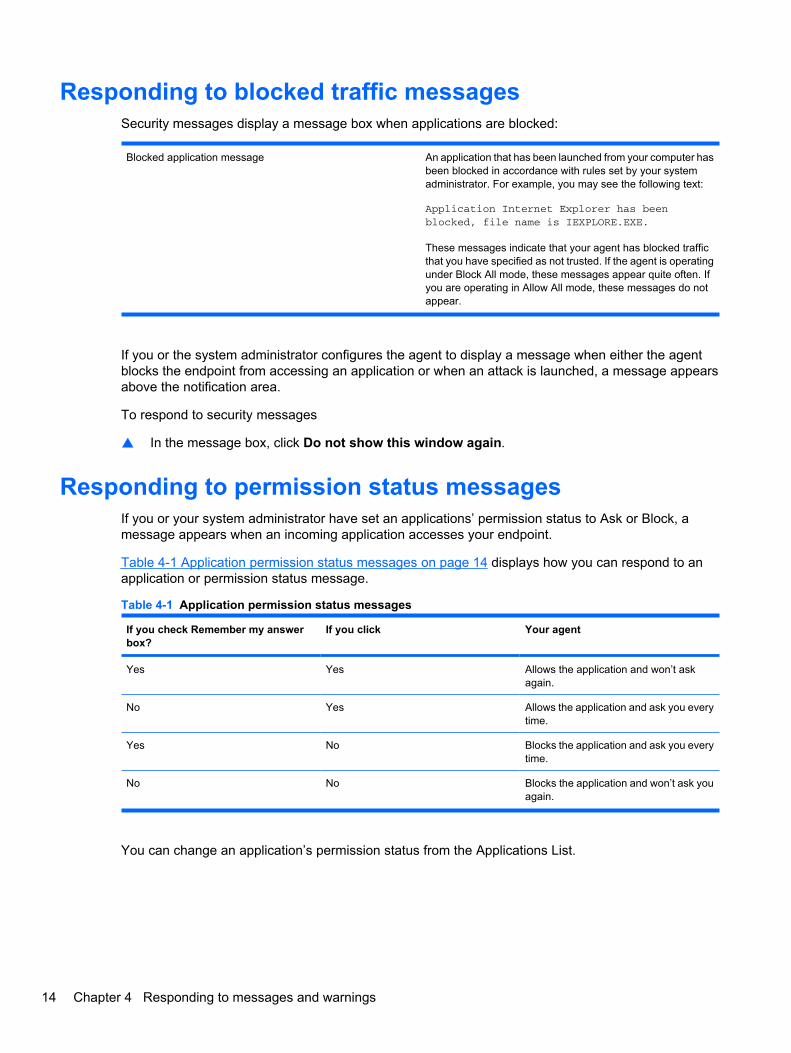
Responding to blocked traffic messagesSecurity messages display a message box when applications are blocked:
Blocked application message An application that has been launched from your computer hasbeen blocked in accordance with rules set by your systemadministrator. For example, you may see the following text:
Application Internet Explorer has been blocked, file name is IEXPLORE.EXE.
These messages indicate that your agent has blocked trafficthat you have specified as not trusted. If the agent is operatingunder Block All mode, these messages appear quite often. Ifyou are operating in Allow All mode, these messages do notappear.
If you or the system administrator configures the agent to display a message when either the agentblocks the endpoint from accessing an application or when an attack is launched, a message appearsabove the notification area.
To respond to security messages
▲ In the message box, click Do not show this window again.
Responding to permission status messagesIf you or your system administrator have set an applications’ permission status to Ask or Block, amessage appears when an incoming application accesses your endpoint.
Table 4-1 Application permission status messages on page 14 displays how you can respond to anapplication or permission status message.
Table 4-1 Application permission status messages
If you check Remember my answerbox?
If you click Your agent
Yes Yes Allows the application and won’t askagain.
No Yes Allows the application and ask you everytime.
Yes No Blocks the application and ask you everytime.
No No Blocks the application and won’t ask youagain.
You can change an application’s permission status from the Applications List.
14 Chapter 4 Responding to messages and warnings
5 Monitoring and logging
This chapter includes the following topics:
● About logs on page 15
● Viewing logs on page 19
● Back tracing logged events on page 20
● Exporting logs on page 21
● Filtering logged events on page 21
● Stopping an active response on page 22
About logsThe agent’s logs are an important method for tracking your endpoint’s activity and its interaction withother endpoints and networks. The logs record information about the agent’s status and about the trafficthat tries to enter or exit your endpoint through your network connection.
The agent’s logs perform the following tasks:
● Record information about the agent’s status and about the traffic that tries to enter or exit yourendpoint through your network connection.
● Track your endpoint’s activity and interaction with other endpoints and networks.
● Detect potentially threatening activity, such as port scanning.
● Help you troubleshoot connectivity problems or possible network attacks.
● Record the results of the management policies that are applied to your endpoint.
The agent includes the following types of logs:
Security Records potentially threatening activity that is directed towards your endpoint, denial-of-serviceattacks, port scans, executable file alterations, and Trojan horse attacks.
Traffic Records every connection your endpoint makes through the network.
Packet Captures every packet of data that enters or leaves a port on your endpoint.
System Records all operational changes for the agent, such as starting and stopping services, detectingnetwork applications, and configuring software.
About logs 15

About the Security logThe Security log records potentially threatening activity that is directed towards your endpoint, such asport scanning, virus attacks, or denial-of-service attacks. The Security log is probably the most importantlog in the agent.
The Security log records attacks in the following categories:
Critical attack
Major attack
Minor attack
Information
The Security log records the following information about each activity:
Time The exact date and time that the event was logged
Security Type Type of security alert, such as a DoS attack, executable file, Ping of Death, or virus attack
Severity The severity of the attack (either Critical, Major, Minor, or Information)
Direction Direction that the traffic was traveling in (incoming, outgoing, or unknown)—Most attacks areincoming, that is, they originate in another endpoint. Other attacks, like Trojan horses, areprograms that have been downloaded to your endpoint and therefore are already present; theyare considered outgoing. Still other attacks are unknown in direction; they include ActiveResponse or application executable changed.
Protocol Type of protocol—UDP, TCP, and ICMP
Remote Host IP address of the remote endpoint (only appears in Local View - this is the default)
Remote MAC MAC address of the remote endpoint. If outside the subnet, it is the MAC address of the router.(only appears in Local View - this is the default)
Local Host IP address of the local endpoint (only appears in Local View - this is the default)
Local MAC MAC address of the local endpoint (only appears in Local View - this is the default)
Application Name Name of the application associated with the attack
User Name User or endpoint that sent or received the traffic
Domain Domain of the user
Occurrences Number of occurrences of the attack method
Begin Time Time the attack began
End Time Time the attack ended
16 Chapter 5 Monitoring and logging

About the Traffic logWhenever your endpoint makes a connection through the network, this transaction is recorded in theTraffic log. The Traffic log includes information about incoming and outgoing traffic.
The Traffic log categorize different types of traffic as:
Incoming traffic; passed through the agent
Incoming traffic; blocked by the agent
Outgoing traffic; passed through the agent
Outgoing traffic; blocked by the agent
Traffic direction unknown; passed through the agent
Traffic direction unknown; blocked by the agent
The Traffic log records the following information about each activity:
Time The exact date and time that the event was logged
Severity The severity of the traffic
Direction Direction that the traffic travels (incoming or outgoing)
Protocol Type of protocol - UDP, TCP, and ICMP
Remote Host IP address of the remote endpoint (only appears in Local View- this is the default)
Remote MAC MAC address of the remote endpoint. If outside the subnet, itis the MAC address of the router. (only appears in Local View- this is the default)
Remote Port Port on the remote endpoint (only appears in Local View - thisis the default)
Local Host IP address of the local endpoint (only appears in Local View -this is the default)
Local MAC MAC address of the local endpoint (only appears in Local View- this is the default)
Local Port Port used on the endpoint (only appears in Local View - this isthe default)
Application Name Name of the application that is associated with the attack
User User’s log on name
About logs 17

Domain User’s domain name
Location The Location (Normal or Block All) that was in effect at the timeof the attack
Occurrences Number of packets each piece of traffic sends between thebeginning and ending time
Begin Time Time traffic starts matching the rule
End Time Time traffic stops matching the rule
Rule Name The rule that determined the passing or blockage of this traffic
About the Packet logThe Packet log captures every packet of data that enters or leaves a port on your endpoint. The Packetlog is disabled by default in the agent because of its potentially large size. You must enable the Packetlog before you can use it.
The Packet log uses the following icons to categorize data packets:
Full data packet captured
The Packet log records the following information about each data packet:
Time The exact date and time that the packet was logged
Remote Host Name of the remote endpoint (only appears in Local View - this is the default)
Remote Port Port on the remote host that sent/received the traffic (only appears in Local View - this is the default)
Local Host IP Address of the local endpoint (only appears in Local View - this is the default)
Local Port Port used on the endpoint for this packet (only appears in Local View - this is the default)
Source Host Name of the source endpoint (only appears in Source View)
Source Port Port on the source host that sent/received the traffic (only appears in Source View)
Destination Host IP Address of the destination endpoint (only appears in Source View)
Destination Port Port used on the destination endpoint for this packet (only appears in Source View)
Direction Direction that the traffic was traveling in (incoming or outgoing)
Action Action taken by the agent: Blocked or Allowed
Application Name Name of the application that is associated with the packet
Below the Log Viewer are two additional data fields that provide further detail regarding the selectedevent. The left field provides data on the type of packet logged. The right field displays the actual datapacket.
18 Chapter 5 Monitoring and logging

About the System logThe System log records all operational changes, such as the starting and stopping of services, detectionof network applications, software configuration modifications, and software execution errors. It also logscommunication with the Symantec Policy Manager, including connection and downloads. All informationthat is provided in the System log also appears in real time in the message area. The System log isespecially useful for troubleshooting the agent.
The System log records the following information about each system error:
Time The date and time that the event was logged
Type Type of event can be an error, warning, or information regarding the Symantec Policy Manager. Anerror indicates a problem with the source; a warning indicates a potential problem; and an informationpoint provides information about an event involving the agent.
ID ID assigned to the event by the agent
Summary Description of the event
Viewing logsThe following procedure explains how to view logs.
To view logs
1. Do one of the following:
● Click Tools > Logs.
● On the toolbar, click the drop-down arrow next to the Logs icon.
2. Click one of the log types. Each log opens the Log Viewer dialog box. The Log Viewer is a tablewhere each row represents a logged event and each column displays information regarding theevent.
3. In the Log Viewer dialog box, click the View menu and then click either Local View or SourceView. The fields in the log change depending on whether you choose the local view or source view.
4. To view a description of each event, select an event row
5. Click Refresh, or press F5 to update the log that you are viewing.
6. Click File > Exit.
Viewing logs 19
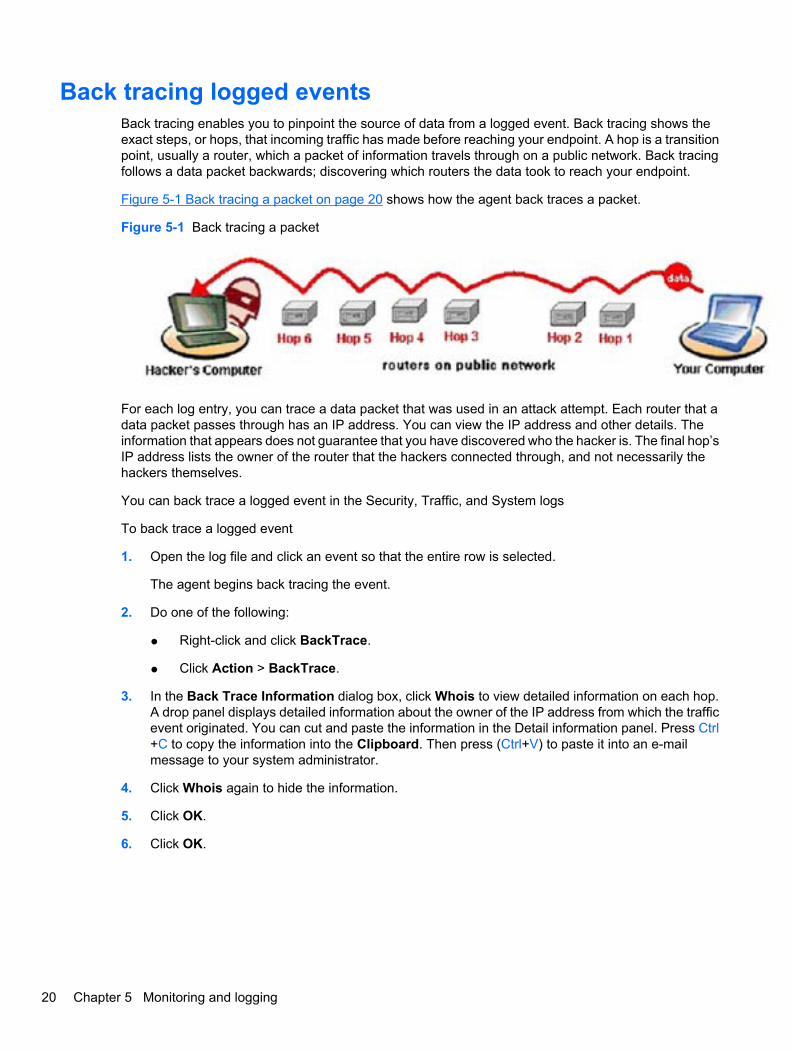
Back tracing logged eventsBack tracing enables you to pinpoint the source of data from a logged event. Back tracing shows theexact steps, or hops, that incoming traffic has made before reaching your endpoint. A hop is a transitionpoint, usually a router, which a packet of information travels through on a public network. Back tracingfollows a data packet backwards; discovering which routers the data took to reach your endpoint.
Figure 5-1 Back tracing a packet on page 20 shows how the agent back traces a packet.
Figure 5-1 Back tracing a packet
For each log entry, you can trace a data packet that was used in an attack attempt. Each router that adata packet passes through has an IP address. You can view the IP address and other details. Theinformation that appears does not guarantee that you have discovered who the hacker is. The final hop’sIP address lists the owner of the router that the hackers connected through, and not necessarily thehackers themselves.
You can back trace a logged event in the Security, Traffic, and System logs
To back trace a logged event
1. Open the log file and click an event so that the entire row is selected.
The agent begins back tracing the event.
2. Do one of the following:
● Right-click and click BackTrace.
● Click Action > BackTrace.
3. In the Back Trace Information dialog box, click Whois to view detailed information on each hop.A drop panel displays detailed information about the owner of the IP address from which the trafficevent originated. You can cut and paste the information in the Detail information panel. Press Ctrl+C to copy the information into the Clipboard. Then press (Ctrl+V) to paste it into an e-mailmessage to your system administrator.
4. Click Whois again to hide the information.
5. Click OK.
6. Click OK.
20 Chapter 5 Monitoring and logging

Exporting logsYou can save and export the contents of the logs to different locations. You may want to export logs tosave space or to perform a security review.
To export a log file
1. Open the log in the Log Viewer.
2. Click File > Export.
3. In the Save As dialog box, select the location and format type for the log file.
4. Click OK.
Filtering logged eventsYou can view the recorded events in the Log Viewer by the severity level of the attack and by a previousperiod of time.
To filter log events by severity
1. In the Log Viewer dialog box, click the Filter menu.
2. Click File > Export > Severity.
3. Click Severity.
4. In the Save As dialog box, select the location and format type for the log file.
You can view more than one type of event at one time. The Log Viewer is automatically reloaded.
5. Click the severity level(s) so that a check mark appears to the left of the severity level name. Youhave the following options:
● Critical (Security log only)
● Major
● Minor
● Error (System log only)
● Warning (System log only)
● Information
To filter log events by time period
1. In the Log Viewer dialog box, click the Filter menu.
2. Select the time period for which you want to view log events. For example, 2 Week Logs displaysthe events that were recorded over the past 14 days.
Exporting logs 21

Stopping an active responseIf the agent detects an attack, it triggers an active response. The active response automatically blocksthe IP address of a known intruder for a specific amount of time (from 1 to 2,147,483,647 seconds). Thedefault amount of time is 10 minutes. If you don’t want to wait the default amount of time to unblock theIP address, you can stop the active response immediately.
An active response can also be triggered by IPS signatures that are updated weekly and by denial ofservice signatures that can be updated with new builds, port scans, and MAC spoofing. However, aTrojan horse is not considered an attack because it is a program that runs on the same endpoint whereit was detected. It is considered a security alert rather than an attack.
You can stop active responses in the Security log only.
To stop an active response
1. Click Tools > Logs > Security.
2. Select the row for the application or service you want to unblock. Blocked traffic is specified asBlocked in the Action column.
3. On the Action menu, click Stop Active Response to block the selected application, or click StopAll Active Response if you want to unblock all blocked traffic.
4. When the Active Response dialog box appears, click OK.
22 Chapter 5 Monitoring and logging
6 Command Line Management
This chapter includes the following topics:
● The command-line interface for the client service
● Typing a parameter if the agent is password-protected
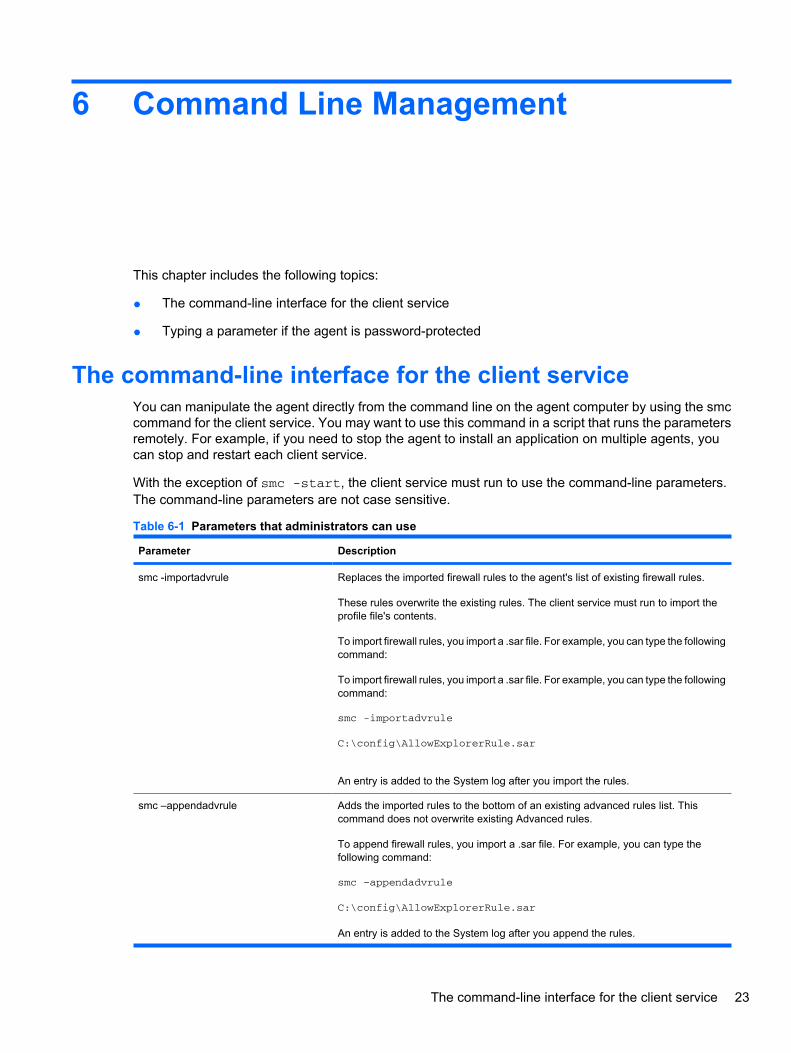
The command-line interface for the client serviceYou can manipulate the agent directly from the command line on the agent computer by using the smccommand for the client service. You may want to use this command in a script that runs the parametersremotely. For example, if you need to stop the agent to install an application on multiple agents, youcan stop and restart each client service.
With the exception of smc -start, the client service must run to use the command-line parameters.The command-line parameters are not case sensitive.
Table 6-1 Parameters that administrators can use
Parameter Description
smc -importadvrule Replaces the imported firewall rules to the agent's list of existing firewall rules.
These rules overwrite the existing rules. The client service must run to import theprofile file's contents.
To import firewall rules, you import a .sar file. For example, you can type the followingcommand:
To import firewall rules, you import a .sar file. For example, you can type the followingcommand:
smc -importadvrule
C:\config\AllowExplorerRule.sar
An entry is added to the System log after you import the rules.
smc –appendadvrule Adds the imported rules to the bottom of an existing advanced rules list. Thiscommand does not overwrite existing Advanced rules.
To append firewall rules, you import a .sar file. For example, you can type thefollowing command:
smc –appendadvrule
C:\config\AllowExplorerRule.sar
An entry is added to the System log after you append the rules.
The command-line interface for the client service 23

Parameter Description
smc -exportadvrule Exports the agent's firewall rules to a .sar file.
Agent rules are only exported from the agent when in Server Control mode.
You must specify the path name and file name. For example, you can type thefollowing command:
smc -exportadvrule
C:\config\AllowExplorerRule.sar
smc -importallconfig Imports the server and client profiles to the agent. The source folder must containboth serdef.xml and cltdef.xml.
This command replaces the current profile file's contents. Therefore, you can deploythe most current profile file without having to remove out-of-date firewall rules,antivirus scans, security settings, and user interface settings.
You must specify the path name and file name and extension. Any name or extensionis acceptable. For example, you can type the following command:
smc -importallconfig
C:\profile\source_folder\OfficeRules.xml
smc -exportallconfig Exports the server and client profiles to file and folder of your choice.
Exports the server and client profiles to file and folder of your choice.
You must specify the path name and file name and extension. Any name or extension is acceptable. For example, you can type the following command:
C:\profile\dest_folder\OfficeRules.xml
smc -start Starts the client service.
smc -stop Stops the client service.
When you import profile files and firewall rules, note that the following rules apply:
● You cannot import profile files or firewall rule files directly from a mapped network drive.
● The agent does not support UNC (universal naming convention) paths.
Typing a parameter if the agent is password-protectedYou can password-protect the agent computer for the following parameters:
-stop The agent asks for a password before you or the user stops the agent.
-importconfig The agent asks for a password before you can import the profile file.
-exportconfig The agent asks for a password before you can export the profile file.
NOTE: The password is limited to 15 characters or less.
Table 6-1 Parameters that administrators can use (continued)
24 Chapter 6 Command Line Management
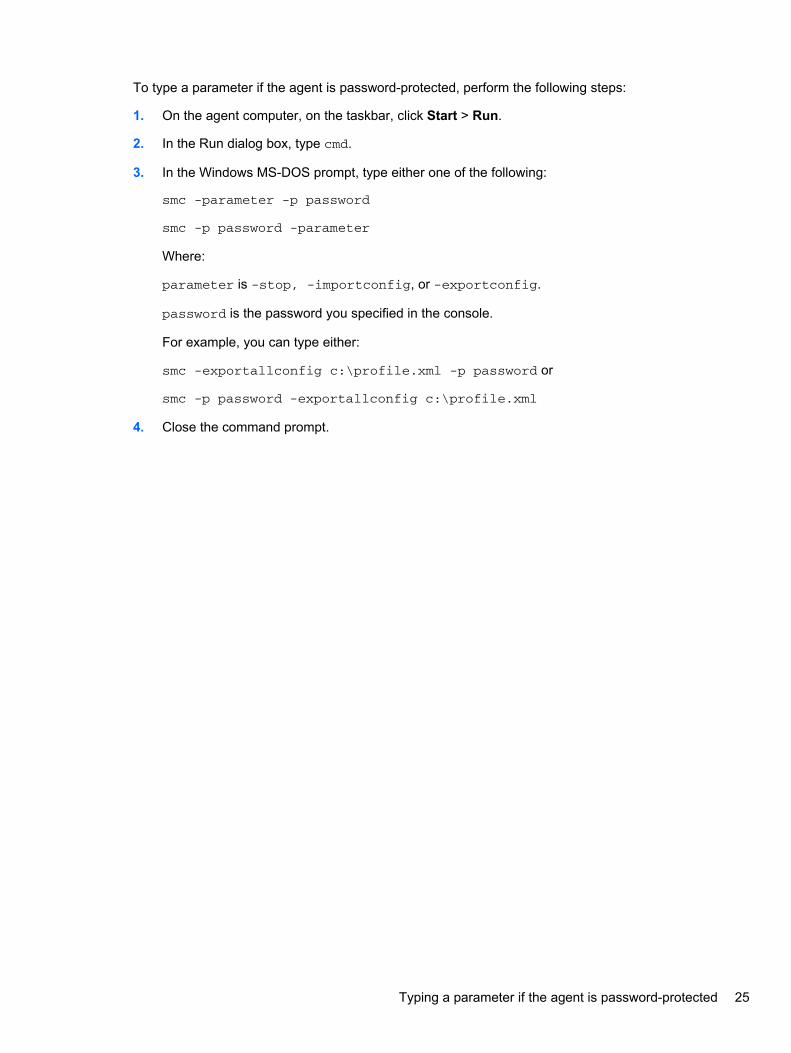
To type a parameter if the agent is password-protected, perform the following steps:
1. On the agent computer, on the taskbar, click Start > Run.
2. In the Run dialog box, type cmd.
3. In the Windows MS-DOS prompt, type either one of the following:
smc -parameter -p password
smc -p password -parameter
Where:
parameter is -stop, -importconfig, or -exportconfig.
password is the password you specified in the console.
For example, you can type either:
smc -exportallconfig c:\profile.xml -p password or
smc -p password -exportallconfig c:\profile.xml
4. Close the command prompt.
Typing a parameter if the agent is password-protected 25
Index
Aactive response, stopping 15agent
about 2basics 4commands 23features 2opening 4password-protected 24
application messages 11application messages,
changed 12applications, viewing running 6
Bback tracing logged events 15broadcast traffic 6
Cchanged application
messages 12changing security levels 9client service, command-line
interface for 23CMD 23command line management 23command-line interface 23communication status, viewing 7
Ddisabling protection 9
Eendpoint, testing 4events, filtering logged 15
FFile menu 5filtering logged events 15flashing icon 8
Hhardware requirements 1history, traffic 6
Iicon
flashing 8notification area 4
LLocation menu 5log
Packet 18Security 16System 19Traffic 17
logged eventsback tracing 15filtering 15
logging 15logs
about 15exporting 15viewing 15
Mmenu
File 5Location 5shortcut 8Tools 5View 5
menus, using 4message area
displaying 7hiding 7
messagesapplication 11blocked traffic 11changed application 12
permission status 11responding to 11responding to application 11types 11
monitoring 15
Nnavigating main window 4notification area icon 4
Oopening agent 4
PPacket log, about 18parameter, typing 24password protection 9password-protected agent 24policies, security 2protection, disabling 9
Rrequirements
hardware 1software 1system 1
responding toapplication messages 11blocked traffic messages 11flashing icon 8messages 11permission status
messages 11Trojan horse warnings 11warnings 11
response, stopping active 15
Ssecurity
changing levels 9
26 Index
disabling protection 9enabling password
protection 9policies 2viewing policy 7
Security log, about 16shortcut menu 8software requirements 1stopping active response 15System log, about 19system requirements 1
Ttesting endpoint 4toolbar, using 4Tools menu 5traffic
blocked messages 11broadcast 6history 6
Traffic log, about 17Trojan horse warnings 11typing parameter 24
VView menu 5viewing
communication status 7logs 15running applications 6security policy 7
Wwarnings, responding to 11
Index 27