synthesis and characterization of hydrophilic silicone...
TRANSCRIPT

Synthesis and characterization of hydrophilic silicone
copolymers
Master of Science Thesis in the Master Degree Program Materials and Nanotechnology
DARIJA SKAKIC
Department of Chemical and Biological Engineering
Division of Polymer Technology
CHALMERS UNIVERSITY OF TECHNOLOGY
Gothenburg Sweden 2012
Report No 402
Masters Thesis No 402
Department of Chemical and Biological Engineering Polymer Technology
Synthesis and characterization of hydrophilic
silicone copolymers
Syntes och karakterisering av hydrofila
silikon-copolymerer
In collaboration with Moumllnlycke Health Care AB
Conducted by
Darija Skakic
Supervisors
Dennis Hansson
Lars Lindgren
Examiner
Mats Andersson
Approved date
2012-04-13
Abbreviations AIBN ndash Azobisisobutyronitrile
DMAEMA ndash Dimethylaminoethyl Methacrylate
EtOAc ndash Ethyl acetate
GF31 ndash 3-(Trimethoxysilyl)propyl methacrylate
HEAA ndash N-Hydroxyethyl acrylamide
MAA ndash Methacrylic acid
MeOH ndash Methanol
NIPAM ndash N-isopropylacrylamide
PSA ndash Pressure sensitive adhesive
TRIS ndash 3-[Tris(trimethylsiloxy)silyl] propyl metharcylate
Abstract Wound dressings scar dressings and other medical applications are all applications were pressure
sensitive adhesives (PSA) may be used There are different types of PSAs and one type is the silicone
based where vinyl and hydride-containing polydimethylsiloxane (PDMS) are blended and let to react
Silicone PSAs are used to securely attach medical devices to the body and since they are highly
hydrophobic problems may arise under moist conditions Problems may be loss of adhesion to the
skin or risk of maceration In this project to improve wet adhesion of silicone PSAs hydrophilic
silicone compatible copolymers will be added to a standard silicone PSA
Hydrophilic silicone copolymers of poly(tris(trimethylsiloxysilyl propyl) metharcylate-co-methacrylic
acid) (TRISMAA) poly(tris(trimethylsiloxysilyl propyl) metharcylate-co-dimethylaminoethyl
methacrylate) (TRISDMAEMA) poly(tris(trimethylsiloxysilyl propyl) metharcylate-co-N-hydroxyethyl
acrylamide methacrylate) (TRISHEAA) poly(tris(trimethylsiloxysilyl propyl) metharcylate-co-N-
hydroxyethyl acrylamide methacrylate) and poly(tris(trimethylsiloxysilyl propyl) metharcylate-co-N-
isopropylacrylamide (TRISNIPAM) were synthesized by free radical polymerization in solution using
azobisisobutyronitrile (AIBN) as initiator
The effect of these copolymers as a component in silicone pressure sensitive adhesives was
evaluated by moisture vapor transmission rate (MVTR) and contact angle measurements Sole
copolymer was characterized by size exclusion chromatography (SEC) and nuclear magnetic
resonance (NMR)
The addition of the copolymers resulted in an increased MVTR of up to 139 for poly(TRIS-co-
DMAEMA (5 mol )) and poly(TRIS-co-NIPAM (5 mol )) when added in a 5 wt amount to a
standard two component silicone formulation from Nusil Contact angle did not differ significantly
from reference SEC confirmed large weight average molecular weight MW over 500 000 gmol
NMR showed traces of monomer residue after purification of the copolymers indicating that further
purification is needed
Keywords silicones pressure sensitive adhesives copolymers hydrophilic vapor permeability
List of contents 1 Introduction 1
Background 1
Aim 1
Delimitations 1
2 Theory 2
From sand to silicones 2
Silicone curing 3
Silicone physicochemical properties 3
Silicone biocompatibility 4
Adhesion 4
Physical adsorption 5
Mechanical interlocking 6
Monomers used in the project 6
TRIS 6
MAA 6
HEAA 6
NIPAM 7
DMAEMA 7
Initiator AIBN 7
Free radical polymerization in solution 7
Initiation 8
Propagation 8
Termination 8
Chain transfer 9
Copolymer equation 9
Characterization methods 10
Contact angle 10
Moisture vapor transmission rate (MVTR) 11
3 Experimental 12
Chemicals 12
Methodology 12
Synthesis and purification of copolymer 12
Formulation of copolymer and two component system 13
Contact angle measurements 13
Moisture vapor transmission rate (ID T-1070) 14
NMR and SEC 14
Failed method 14
4 Results and discussion 16
Polymerization 16
Yield 16
SEC ndash molecular weight 18
1H- NMR 19
Contact angle measurements 20
Moisture vapor transmission rate 21
5 Conclusions 23
6 Future work 24
7 Acknowledgments 25
References 26
Appendix I ndash Synthesis and purification 28
Purification by precipitation 29
First purification method 30
Appendix II ndash Formulation and contact angle 31
Formulation 31
Contact angle 32
Appendix III ndash Results 33
MVTR 33
SEC 34
1H- NMR 35
1
1 Introduction
Background Silicone pressure sensitive adhesives (PSA) are commonly used in wound dressings scar dressings
and other medical applications A PSA is an adhesive that when pressure is applied forms a bond
with the adherend These adhesives are generally a blend of vinyl and hydride-containing
polydimethylsiloxane (PDMS) cured via addition curing They are biocompatible and can securely
attach medical devices to the body The adhesives are also highly hydrophobic which can lead to
problems under moist conditions (such as skin perspiration) ndash the adhesives lose their adhesion to
skin This is a problem as there is a risk of maceration (softening and whitening of skin when kept
wet) and the adhesive may detach from the skin prematurely
Traditionally water absorbing fillers have been added to the PSAs However this often leads to
swelling of the adhesive loss in dry adhesion and leaking of the filler due to their affinity to water [1]
To improve the wet adhesion properties hydrophilic silicone compatible copolymers may be added to
the silicone pressure sensitive adhesives The copolymers will introduce hydrophilic properties to the
adhesive improving wet adhesion and since the copolymers are large molecules migration and
leakage can be avoided It would also allow better water vapor permeability and improve
transportation of eg antimicrobial additives
Aim The aim of this project is to evaluate a patent application [2] from the health care company Convatec
Technologies Inc claiming the first time ever synthesis of a unique amphiphilic silicone copolymer
used in a pressure sensitive adhesive In this project synthesis of amphiphilic copolymers will be
carried out and the copolymers will be evaluated to determine how they affect the properties of
PSAs The goal of the copolymers is to contribute to better wet adhesion and water vapor
permeability as claimed in the patent application
Delimitations This master thesis is delimited to some of the monomers solvents and the initiator presented in the
patent application [2] see Chapter Monomers in the project The standard silicone PSA used in this
project will be MED 6350 a commercial PDMS polymer from Nusil
2
2 Theory
From sand to silicones The term silicone originates from the word silicon and ketone and refers to polysiloxanes Silicones
belong to the category of synthetic polymers whose backbone constitutes of Si-O-Si linkages The
silicon atoms can also be bonded to organic groups such as methyl groups (see Table 1) This basic
repeating unit is known as siloxane The most common silicone (and in largest volume produced) is
polydimethylsiloxane PDMS The silicone industry became viable after Rochows discovery in 1940
of the direct process where elemental silicon reacts with methylene chloride (MeCl) to form
methylchlorosilanes [3-5] When silica (sand) is reduced according to Scheme 1 in a carbo-electro
reduction process chemical grade silicon is produced The methyl chlorosilane (MCS) reaction is
shown in Scheme 2 [3]
Scheme 1 Carbo-electro reduction process
A critical factor in the MSC reaction is the selectivity for the dimethyldichlorosilane (Di) as PDMS is
made from hydrolysis of Di [3]
Scheme 2 MSC reaction
Silicon is tetravalent and may thus have one two or three organic substituents where the methyl
silicones have the most practical applications see Table 1
Table 1 Structural units of silicones
SiO2 + C SiO + SiC Si + CO
High voltage
gt 1200 degC
Si + MeCl
Me2SiCl2 (Di)
MeSiCl3 (Tri)
Me3SiCl (Mono)
MeHSiCl2 (MH)
Me2HSiCl (M2H)
Cu (3-5)
Zn (400-2000 ppm)
Sn (5-30 ppm)
Al (500-4000 ppm)
290-305 degC
3
Silicone curing The copolymers synthesized in this project will be formulated into a silicone based two component
system Blending of the two components (A and B) results in a hydrophobic cross-linked system
which is a PDMS crosslinked elastomer
Addition curing also known as hydrosilylation are two component systems based on a Pt-catalyzed
reaction that takes place between vinyl endblocked polymers and Si ndash H oligosiloxanes Both
components contain the vinyl endblocked polymer but one (component A) contains the catalyst (Pt)
and the other (component B) contains the crosslinker The crosslinking in this system is a
spontaneous reaction at room temperature but the rate can be increased if the temperature is
raised This leads to a far more shortened curing time The mechanism of the network formation
through addition curing is showed in Scheme 3 [4]
Scheme 3 Network formation through addition curing (Redrawn from [4])
Advantages using addition curing instead of other methods such as cross-linking by condensation
are that this method eliminates shrinkage as there are no by-products formed [5]
Silicone physicochemical properties
The element silicon is positioned just under carbon in the periodic table and this led to a belief that
silicon could replace carbon However there are very few similarities between silicon and carbon For
instance the Si-X bond is much larger than the C-X bond Si also has a lower electronegativity than C
and has thus more polar bonds The bond polarity contributes to strong
silicon bonding [5]
Silicones have the unusual combination of both high surface energy properties and low surface
energy properties The high surface energy comes from the inorganic chain similar to silicates
whereas the methyl groups which are organic contribute to the low surface energy Since the Si-O
bonds are polar they would lead to strong intermolecular interactions had they not been shielded by
the methyl groups The shielding is made easy by the high flexibility of the silicone chain There is
4
nearly free rotation around the Me2Si-O bond Despite the polar chain of silicones they have a low
critical surface tension of wetting [5]
Silicone biocompatibility
The definition of biocompatibility is the ability of a material to perform with an appropriate host
response in a specific application [6]
It was discovered in the mid-1940s that silicones due to their hydrophobic property prevented blood
from coagulating Silicones are used in long term implantations as they are chemically stable and
highly elastic and the first report of silicone elastomers being implanted in humans was in 1946 Dr
Frank H used silicone in a bile duct repair and reported that It is flexible it will stretch it will bounce
like a rubber and it can be cast into any shape [5] In 1948 Dr DeNicola implanted an artificial
urethra tube and reported 14 months after the implantation that the artificial urethra had been
retained with normal genito-urinary function [5] and that There is no evidence at this time that
the tube is acting as a foreign body irritant [5]
Silicones are widely used in various medical applications due to properties such as biocompatibility
and biodurability ndash which originate from silicones being hydrophobic chemically and thermally stable
materials with a low surface tension [5]
Adhesion When there is energy required to separate two bodies the two bodies are said to adhere and the
force necessary to break the bond between the two bodies is called practical adhesion Adhesion is
physical attraction between the surfaces of two materials and is dependent on the character of the
physical forces holding the atoms and molecules together [7 8]
So what is an adhesive Basically it is a material which joins materials when applied to their
surfaces and resist separation There are two characteristic properties an adhesive must possess [9]
1 An adhesive must spread on a surface having a contact angle approaching zero ndash it must wet
the surface The adhesive will be liquid of low viscosity when applied
2 The adhesive must harden and have high cohesive strength which is the strength of like
molecules to stick together The hardening can be achieved by loss of solvent chemical
reactions or by cooling if the adhesive is a hot melt There is one exception to this second
property and that is pressure-sensitive adhesives These are permanently sticky
There are six theories of adhesion which are physical adsorption chemical bonding electrostatic
attraction mechanical interlocking inter-diffusion and weak boundary layer theories For this
project the most relevant adhesion theories are physical adsorption and mechanical interlocking
These will be further described below
5
Figure 1 (a) mechanical interlocking (b) interdiffusion of chains (c) electrical interactions (d) chemical interactions (Redrawn from [10])
Physical adsorption
This theory involves van der Waals forces across the interface and attractions between permanent
and induced dipoles Since all materials have different polarities resulting from their electron cloud
they also have different adhesion An example is between metal and paper which are polar materials
and polyethylene (PE) and silicone which are non-polar Metal and paper easily adhere by any
adhesive while PE and silicone are more difficult to bond [9 11]
There are three types of forces of attraction between dipoles EPP (permanent dipoles) Epi
(permanent dipole and corresponding induced dipole) and Eii (instantaneously induced dipoles)
Between a pair of permanent dipoles distance r at their centers there is a potential energy EPP given
by equation (1)
(1)
where micro1 and micro2 are the dipole moments and ε0 is the permittivity in vacuum k the Boltzmanns
constant and T the absolute temperature
If there is a non-polar molecule close to a polar molecule then the latter will induce a dipole in the
former Equation (2) gives the induced dipole moment where E is the electric field and α is the
polarizability of the non-polar molecule
(2)
The potential energy in this case is Epi and given in equation (3) where micro1 is the dipole moment of the
permanent dipole
(3)
The third type of physical adsorption interaction is between two instantaneous dipoles These types
of dipoles exist in non-polar molecule as a result of fluctuating distribution of electrons The potential
energy is given by equation (4)
(4)
6
where α1 and α2 are the molecules polarizabilities and I1 and I2 are their ionization potentials [9]
Mechanical interlocking
A soft tacky adhesive can enter irregularities found in substrates with irregular surface see Figure 1
(a) This is called mechanical interlocking and it occurs when an adhesive can wet a surface creating
a bonding force Silicone pressure sensitive adhesives as silicones flow readily can penetrate into a
porous or rough substrate (such as skin) and create a mechanical bond [9 11]
Monomers used in the project
TRIS
3-[Tris(trimethylsiloxy)silyl]propyl methacrylate (TRIS) is a silicone based monomer with the chemical
formula C16H38O5Si4 Figure 2 illustrates the chemical structure TRIS is used as the basemonomer
and constitutes the largest part in the copolymers This is because TRIS has TMS groups short for
trimethylsilyl -Si(CH3)3 which makes it similar to PDMS and thus contributes to the good miscibility
with the PDMS [12]
Figure 2 TRIS monomer
TRIS belongs to the acrylate family and contains a vinyl group which is crucial for free radical
polymerization (see Chapter 2 Free radical polymerization in solution)
MAA
Metharcylic acid (MAA) is also a member of the acrylate family and has the chemical formula C4H6O2
Figure 3 illustrates the chemical structure of MAA [13]
Figure 3 MAA monomer
HEAA
N-Hydroxyethyl acrylamide (HEAA) with the chemical formula C5H9NO2 is an acrylamide having one
nitrogen replacing the oxygen seen in acrylates The chemical structure of HEAA is seen in Figure 4
[14]
7
Figure 4 HEAA monomer
NIPAM
N-Isopropylacrylamide (NIPAM) chemical formula C6H11NO and chemical structure illustrated in
Figure 5 [15]
Figure 5 NIPAM monomer
DMAEMA
2-(Dimethylamino)ethyl methacrylate (DMAEMA) C8H15NO2 This acrylate has the chemical structure
shown in Figure 6 [16]
Figure 6 DMAEMA monomer
Initiator AIBN
Azobisisobutyronitrile (AIBN) is a common initiator used in free radical polymerization Chemical
structure can be seen in Figure 7 [17]
Figure 7 AIBN initiator
Free radical polymerization in solution In free radical polymerization polymers are formed by the addition of free radical building blocks in
this project it is vinyl monomers added onto a growing chain When the polymerization is in a
solution the solvent facilitates heat transfer and also reduces viscosity of the medium However
complications of chain transfer may arise and thus selection of solvent must be carefully made
The polymerization proceeds in three stages (1) initiation an active center which acts as a chain
carrier is formed (2) propagation growth of the macromolecule by a kinetic chain mechanism where
monomers are added to the growing chain (3) termination the active center is transferred or
neutralized which stops the progress of the kinetic chain [18]
8
Initiation
The initiation step begins with an initiator that decomposes into free radicals R when subjected to
heat electromagnetic radiation or a chemical process see reaction (1) The free radical will have an
active center which is the location of the unpaired electrons The instability of the carbon double
bond of the monomer M makes it susceptive to reaction with the free radicalrsquos unpaired electrons
hence the active center of the free radical can ldquograbrdquo one electron from the double bond of the
monomer creating a new active center at the end of the chain as it leaves an unpaired electron [19]
(1)
The amount of generated radicals effective in the creation of a kinetic chain can be expressed as the
efficiency factor f (0-1) A low efficiency factor will lead to inefficient chain propagation and can be
due to several factors where one is primary recombination which is a result of to radicals combining
see reaction (2)
(2)
This can occur if the solution impedes the radical fragments leading to a cage effect The solvent
plays an important part in solution free-radical polymerization as the extent of decomposition of the
initiator varies with the solvent An example is the decomposition of benzoyl peroxide where in
tetrachloroethylene it only decomposes up to 35 while it is 85 in ethyl acetate [18]
Propagation
When the synthesis has been initiated it is followed by the propagation reaction In free radical
polymerization the propagation process usually takes place within a fraction of a second The
propagation steps are similar to the initiation where electrons are transferred and the active center
is moved down the chain see reaction (3)
(3)
The propagation comes to an end when the termination occurs [18]
Termination
The termination is the step where the active center is either transferred to another chain or
neutralized There are two ways in which the termination can take place by combination or
disproportionation
Combination
The termination reaction combination is between two end chains where they couple together to
form one long chain as seen in Scheme 4
9
Scheme 4 Combination of two growing chains into one polymer
Disproportionation
This occurs when hydrogen abstractions takes place in one end forming a carbon double bond and
resulting in two dead polymer chains see Scheme 5 [18]
Scheme 5 Disproportionation of two growing chains into two dead polymer chains
Chain transfer
Chain transfer occurs when the active center of a growing polymer is transferred to another species
through a collision There are several types of chain transfer In general hydrogen abstraction from
monomer initiator polymer solvent and modifier There are five concepts of chain transfer transfer
to monomer transfer to initiator transfer to polymer transfer to modifier and transfer to solvent
[18]
Copolymer equation When using two or more monomers in a free radical polymerization the term is known as
copolymerization By copolymerizing two monomers the properties of the resulting polymer are
often better than the properties for the parent homopolymers The simplest case of
copolymerization involves two monomers (eg M1 and M2) but can be presented in several different
structures within the copolymer such as Statistical copolymer Alternating copolymers Block
copolymers Graft copolymers and Stereoblock copolymer [18]
The copolymerization between two monomers M1 and M2 is presented in equations (51)-(54)
where k11k22 and k12k21 correspond to self-propagating and cross-propagating rate constants
respectively [18]
(51)
(52)
(53)
(54)
The rate of consumption of M1 can be determined according to equation (6) if steady state
conditions prevail and the radical activity only depends on the nature of the terminal unit [18]
10
(6)
The rate of consumption for M2 is then
(7)
By assuming that
the copolymer equation is obtained by dividing
equation (6) by equation (7) so that
(8)
where r1 and r2 represent relative reactivity ratios from and
Several limiting cases of r can be derived
block copolymerization since both reactivity ratios are larger than unity the propagating monomers prefer to react with themselves forming blocks of M1 and M2
block copolymerization since the reactivity ratios are much higher than unity there is no inclination for the monomers to react with each other leading to two homopolymers
ideal copolymerization the propagating species M1 and M2 have the same preference for adding one or the other resulting in a random copolymer
alternating copolymerization each of the two propagating species prefers adding the other monomer
M1 is more reactive toward both propagating species and the copolymer will contain more of the reactive monomer in statistical placement [20]
Characterization methods
Contact angle
The spreading or deformation of a water droplet on a solid surface is determined by the surface and
interfacial energies The contact angle θ is the angle under which the droplet meets the surface and
may be evaluated by taking into account the three interfacial tensions in Figure 8
ndash between surface and liquid
ndash between surface and gas
ndash between liquid and gas
Figure 8 Different contact angles of a water droplet on a solid surface
11
The contact angle is also a quantification of the wetting of the solid by the liquid and is determined
by Youngs equation
(9)
The lower θ the better the wetting Poorly wetting systems may eg be water on Teflon where the
water droplet rolls off the surface hence θ approaches 180deg The other opposite is when the liquid
spreads and covers the surface complete wetting is achieved and θ approaches 0deg [21 22]
Moisture vapor transmission rate (MVTR)
The definition of moisture vapor transmission rate (also water vapor transmission rate) is as follows
The rate of water vapor flow under steady specified conditions through a unit area of a material
between its two parallel surfaces and normal to the surfaces [23]
And the metric unit of measurements is
12
TRIS
MAA
5 mol
10 mol
15 mol
DMAEMA
5 mol
10 mol
15 mol
NIPAM
5 mol
10 mol
15 mol
HEAA
5 mol
10 mol
15 mol
3 Experimental
Chemicals Table 2 Chemicals used in this project
Monomers Solvents Initiator Silicone PSA
TRIS (from Sigma-Aldrich) EtOAc (from Sigma-Aldrich) AIBN (from
Chalmers) MED 6350 (from Nusil)
NIPAM (from Sigma-Aldrich) MeOH (from Sigma-Aldrich)
DMAEMA (from Sigma-
Aldrich)
MAA (from Sigma-Aldrich)
HEAA (from Sigma-Aldrich)
Methodology
Synthesis and purification of copolymer
In the synthesis of the copolymer monomer weight was kept at 50 g for all the experiments Amount
of initiator was kept at approximately 0087 g and the solvent was kept at 120 g generating a 30 wt
solution
The synthesis was carried out in a round bottom flask see Picture 1 placed in an oil bath holding 65
degC The two monomers (TRIS and MAADMAEMANIPAMHEAA) see Figure 9 were added to the
flask with solvent and initiator Stirring was important throughout the entire synthesis to promote
good mixing The synthesis for each copolymer lasted for six hours For more detailed description see
Appendix I
The copolymer solution was purified by precipitation in methanol see Picture 2 This is because the
copolymer is not soluble in methanol while the pure monomers are In Picture 3 the precipitated
copolymer is shown
Figure 9 A scheme of poly[TRIS]-combinations and molar percentages of MAADMAEMANIPAMHEAA
13
Formulation of copolymer and two component system Each copolymer was blended with MED 6350 (a commercial PDMS polymer) in a 120 ratio of
copolymer to MED 6350 The blends were cast onto PUR-films and then cured on a heating plate to
generate the final PSA For more details see Appendix II
Contact angle measurements The contact angle measurements were performed on the formulations above and not on the pure
copolymers Each formulated film was measured with the EASYDROP Contact angle Measurement
System see Picture 4 using deionized water Three positions were measured for every formulated
film during 60 seconds to ensure a correct average contact angle More details in Appendix II
Picture 1 Synthesis reaction set-up Picture 2 Copolymer purification set-up
Picture 3 A close-up of the precipitated copolymer
14
Picture 4 Contact angle measurement equipment
Moisture vapor transmission rate (ID T-1070)
A cylinder was filled with deionized water up to a level leaving a 5 mm air gap The produced films
from the formulations three specimens of each were punched out in a circular shape larger than the
opening of the cylinders The cylinder was covered with the specimen weighed and placed in an
oven (37degC) for 24 hours After 24 hours the cylinder with the specimen was weighed again and
moisture vapor transmission rate could be obtained by calculating the loss of water
NMR and SEC 1H NMR spectrum was recorded on a Varian 400 spectrometer The samples were dissolved in CDCl3
and the 1H NMR spectra were obtained at 298 K with CDCl3 as internal standard Size-exclusion
chromatography (SEC) was performed on a Waters Alliance 2000 GPCV at 135degC with 124-
trichlorobenzene as eluent at 1 mLmin using an RI-detector It was calibrated using polystyrene
standards
Failed method GF31 is a chemical similar to TRIS but much cheaper see Figure 10 and 11 The first synthesis was
therefore done with GF31 instead of TRIS The first polymerization was between GF31 and MAA
Table 3
Table 3 First synthesis between GF31 and MAA
Chemical Amount
GF31 11195 (g)
MAA 3754 (g)
EtOAc 350 (g) (+ 400 mL)
AIBN 095 (g)
This first synthesis was done in a batch size of 500 g A reactor with a built in heat controlled oil
circulation was used with a SVL multi-joint lid 5-NECK on top Through the center neck a mechanical
stirrer passed and through the others nitrogen gas was connected and in-let of chemicals occurred
15
the rest were sealed The synthesis progressed in the same manner as described in Chapter 3 ndash
Synthesis and purification of copolymer Problems faced here were leakage of solvent and GF31
interaction with MAA As seen in Table 3 an extra amount (400 mL) of EtOAc was added during the
synthesis due to fact that 80 of the solvent (EtOAc) had evaporated within six hours GF31 (since it
is different from TRIS) formed a type of hard brittle white copolymer instead of the expected clear
tough and rubbery copolymer The ndashSi-O-Me groups of GF31 are probably more reactive than the
TMS groups of TRIS leading to the hard brittle copolymer formed However the side group of
monomer GF31 is not flexible enough to form a soft polymer and less MAA would improve the
softness Even though later on the leakage problem was solved (by sealing the center neck better)
the reactor was disregarded as an optimal set-up and was replaced by round bottom flask (reactor
with batch size 150 g) with a rubber septa using TRIS instead of GF31
Figure 10 Chemical structure of TRIS Figure 11 Chemical structure of GF31
16
4 Results and discussion
Polymerization
Yield
The yield does not take into consideration amount of monomer left in the copolymer In Chapter 4 ndash
NMR calculations of copolymer composition and percentage of monomer left are made For some
copolymers eg sample 1 the yield is much lower than for the rest as seen in Table 4 This may be
due to loss of copolymer in the first purification method see Appendix I Sample 1 (15 MAA)
showed some solubility in MeOH which means that when excess MeOHEtOAc was poured off some
polymer residue may also have been poured off hence the lower yield Also in the precipitation
method the solution started to become turbid when all copolymer solution had been blended with
the MeOH this was a fact for all copolymers The EtOAc to MeOH ratio was probably too small and
the copolymer started to dissolve There was most likely some loss of copolymer in this step too It
would probably have been better to use a larger quantity MeOH to avoid dissolution of the
copolymer
The best yield was expected for sample 8-9 as they had not been purified by the first method first
and hence the loss of polymer was strictly restricted to the new method But as seen the yield is 63
for Sample 8 and 70 for sample 9
Sample 7-9 are the poly[TRIS-co-HEAA] copolymers Amount of HEAA increases from sample 7 to
sample 9 and hence increased hydrophilicity The reason to why there is a loss of polymer in the
purification step could be that the copolymer (as the HEAA increases) became more soluble in
MeOH But as seen in Table 4 sample 7-9 are the copolymers containing the highest amount of TRIS
This speaks against the possibility of increasing HEAA contributing to increased hydrophilicity and
thus making the copolymer soluble in MeOH Also sample 9 should be more soluble in MeOH than
sample 8 as it contains more HEAA The same behavior is seen in sample 4-6 (poly[TRIS-co-NIPAM])
where there is a larger loss of copolymer for sample 4 than for sample 6 It seems that the yield is
somewhat circumstantial
17
Table 4 Results from all evaluations
18
SEC ndash molecular weight
According to the patent application it is stated that the molecular weight is larger than 10 000 gmol
In Figure 12 and 13 and Appendix III Figure 16-17 all values show a MW well above 10 000 gmol at
the lowest 360 000 gmol and for the highest at 508 000 gmol SEC was only done on Sample A-C
see Table 4 and Sample 2 as the copolymers are TRIS-based it is assumed that the rest of the
copolymers possess a similar molecular weight The second peak in both figures represents some
low molecular substance probably monomer residue Before H-NMR measurements Sample 2 was
purified one more time see Appendix I First purification method
Figure 12 SEC of Sample 2 Mw = 360 000 gmol
Figure 13 SEC of Sample A MW= 485 000 gmol
19
1H- NMR
Figure 14 NMR of Sample 1
1H- NMR was done to be able to calculate the composition in the copolymer Calculations are shown
below on Figure 14
(10)
where xT and xM are fractions of TRIS and MAA in the copolymer respectively
(11)
Applying equation (10) into equation (11) and
(expected value is 85 )
The two peaks at 610 ppm and 554 ppm are from the double bonds in the two monomers
(12)
Where xMo is the fraction of monomer left in the copolymer
20
Since xT is 8075 of the copolymer composition xMo is then
According to the calculations above there is approximately 392 monomer residue left in the
copolymer That is quite a large difference to 108 left in sample A (calculated in the same manner
as above) which was purified by the first purification method see Appendix I First purification
method
Table 4 presents the copolymer compositions for each copolymer These data are not exact as the
integrals were calculated by hand in MestreNova an analytical chemistry software suite This results
in an inaccuracy that has to be taken into account and the data showed above has to be considered
as approximate values For all the copolymers there is a continuous increase of the comonomer
which is consistent with the expected values
One copolymer is standing out from the others and it is poly[TRIS-co-HEAA] (sample 7-9) The
expected (the input) percentage of HEAA was 5 ndash 10 ndash 15 but the output was approximately 3 ndash 5 ndash
10 which means that TRIS has less affinity for HEAA than for the rest of the monomers Hence one
can assume leading to TRIS being more reactive toward both propagating species
and the copolymer will contain more of the reactive monomer (TRIS) in statistical placement In
comparison TRIS to the other monomers the r values were as can be seen in
Table 4 where the output was larger than 5 ndash 10 ndash 15 for the comonomers (exception DMAEMA
where 5 was input and 239 was output)
As seen in Table 4 the amount of monomer left in the copolymer varies between 077 ndash 392 for
the polymer purified by precipitation For copolymers A-C the level of monomers left are much
higher (85 ndash 137 ) and this proves that the first purification method was insufficient
Contact angle measurements All contact angle measurements were performed on the formulated films and not on the pure
copolymers
As seen in Table 4 the contact angle (deg) of the copolymer formulations does not differ from the
reference formulation (pure MED 6350) especially much The contact angle was expected to be lower
than the reference but as seen it is higher for sample 7 The contact angle is in the interval 121deg -
128deg and is too narrow to say anything about whether the contact angle actually has been modified
or not One reason to why these measurements may not have been very accurate is the fact that the
angle was measured on a droplet that was out in the open Lights from the surroundings and air
conditioning in the room could have affected the measurements Observed during the measurement
was that the droplet size steadily decreased which either means that the droplet evaporates or that
the surface has changed Had these measurements been done in a closed environment of the
droplet then perhaps there would have been different values
Another fact to why there is such little change in the contact angle is that silicones are highly
hydrophobic materials and since there is a very small amount of hydrophilic material integrated in
the silicone a large difference in the contact angle is really not expected Had there been a large
21
difference in contact angle the possibility of migration within the formulation of the hydrophilic
copolymer could be a reason However that was not the case and is very unlikely since the
copolymers are large molecules and the probability of migration is therefore small
Moisture vapor transmission rate The higher MVTR the better vapor transmission As seen in Table 4 all formulations show higher
MVTR than the reference This means that the formulations containing the hydrophilic copolymers
actually breathe better and are more likely to let vapor through Sample 4 [poly(TRIS-co-NIPAM(5
mol))] has an MVTR that is 139 better than the reference The rest of the formulations show an
improvement between 6 ndash 90 As only three tests on each formulation was done it is not
statistically correct to say that there has been an improvement of the MVTR as there is no clear
standard deviation to take into account However all formulations show higher MVTR than the
reference
Figure 15 MVTR data for all samples Blue = values for each test Red = average
In the investigated patent application there was no MVTR-testing done However testing of wet
adhesion was done by taking a 1-inch by 15-inch strip of adhesive and attach it to the abdominal skin
of a human subject and removing it after 40-60 min of aerobic activity [2] According to their results
good wet adhesion was achieved with the formulation containing 5 mol NIPAM and weak wet
adhesion was achieved with the formulation containing 5 mol DMAEMA sample 4 (MVTR = 1058)
and 2 (MVTR = 838) respectively in this project These two formulations showed best MVTR results
and are in accordance with the patent application investigated Why the formulations with lower
amount of polar part showed the best MVTR values must be due to morphology However due to
monomer residue wet adhesion testing on humans was not possible
22
There were some formulations with bubbles in the film seen Picture 5 and 6 Especially sample 2 4
and 8 This may have affected the MVTR and contributed to a higher value than expected
Formulation 8 had also a large amount of bubbles but a low MVTR The bubbles may have been
caused by solvent or monomer evaporating or air that has been trapped during the speed mixing As
seen in Figure 15 there is one value for sample 4 that is well above the others Since the value is
almost 50 larger than the second highest value it could be faulty perhaps an increased amount of
bubbles in the film or leakage of the cylinder
Picture 5 From MVTR Representing sample 9 - 7 from left to right
Picture 6 From MVTR Representing sample 2 - 4 from left to right
23
5 Conclusions This study showed that synthesis of hydrophilic silicone copolymers can be relatively easy
performed and the molecular weight achieved was high (Mw gt 500 000 gmol)
1H- NMR showed that the composition in the copolymers was not as the feed monomer composition
For poly[TRIS-co-MAA] and poly[TRIS-co-NIPAM] there was a higher percentage of comonomer than
assumed while the values varied for poly[TRIS-co-DMAEMA] and for poly[TRIS-co-HEAA] there was a
lower percentage of comonomer NMR also indicated monomer residue left in the copolymers
between 077 ndash 392 indicating that the purification step needs to be optimized or repeated more
than once to remove monomers left in the copolymer
According to contact angle measurements wetting of the silicone surface was not greatly affected
As the addition of copolymer was only 5 wt and of those 5 wt only 5 ndash 15 mol contained a
hydrophilic part a large change in contact angle was not expected The contact angle was evaluated
as the patent application [2] stated large change in wet adhesion
The most relevant results for this project were the MVTR results as they portrayed the improvement
of the silicone PSA (pure MED 6350) The MVTR values showed an large increase in water vapor
permeability for sample 2 and 4 5 mol DMAEMA and 5 mol NIPAM respectively If there is a
correlation between good wet adhesion and MVTR = 1058 (sample 4) contra weak wet adhesion
and MVTR = 838 (sample 2) then it is possible to conclude that for the rest of the copolymer samples
(MVTR ltlt 800) no or little wet adhesion was achieved Why there was no radical improvement for
sample C and 3 and sample 5 and 6 (DMAEMA 10-15 mol and NIPAM 10-15 mol respectively)
can be due to the results of sample 2 and 4 being faulty The explanation could also be that the
values are correct and that the addition of only 5 mol was enough to change the morphology of
the film in a way generating a higher MVTR and increasing the mol of comonomer did not change
the morphology in the same way thus not generating a higher MVTR
Overall it can be concluded that this method is not optimal for increasing hydrophilicity of PSAs as
the method is somewhat complicated to perform and the purification of the copolymers is time
consuming and unsatisfactory However silicone compatible copolymers were successfully
synthesized and characterized Taking the data retrieved in regard many questions about the quality
of the patent application are raised
24
6 Future work For this project future work would be to further purify the copolymers and then evaluate their
adhesive properties directly on the skin This would give more realistic values to whether or not the
modified PSAs have achieved better wet adhesion or not Also to redo the formulations without
bubbles and once again measure MVTR To add more analysis in form of morphology analysis to se
whether or not there is a difference in structure between the different formulations
Another project of future work is to evaluate the new patent application from Convatec Technlogies
Inc [24] where PSAs are modified by the addition of a low molecular weight organic hydroxy
containing compound This method is more straight on and does not involve any complicated
synthesis or purification steps It is simply addition of a hydroxy containing compound to a PSA prior
to curing This may be an interesting study for future work
25
7 Acknowledgments Many people have been involved in this master thesis and I would like to thank them for their
support and help
Thanks to
Dennis Hansson and Lars Lindgren my supervisors at Moumllnlycke Health Care that have always been
available for questions taken a great interest in my work and been a great support
Everyone at the Columbus group at Moumllnlycke Health Care thanks for making my time here fun and
interesting
Anders Maringrtensson for helping me with SEC analysis at Chalmers
Renee Kroon for helping me with NMR analysis at Chalmers
Mats Andersson my examiner
Friends and family
26
References [1] Mechan S et al Amphiphilic Silicone Copolymers for Pressure Sensitive Adhesive Applications
Journal of Applied Polymer Science 2010 116 3265-3270
[2] Convatec Technologies Inc Pressure Sensitive Silicone Adhesives with Amphiphilic copolymers
WO2011005839A1 Publication date 13 January 2011
[3] Clarson J S et al Silicones and Silicone-Modified Materials American Chemical Society
Washington (2000)
[4] Pachaly B Achenbach F Herzig C Mautner K Silicones WILEY-VCH Wienheim (2005)
[5] Colas A and Curtis J Silicone Biomaterials History and Chemistry amp Medical Applications of
Silicones httpwwwdowcorningcomcontentpublishedlit52-1069-01pdf 2012-01-17
[6] Ratner Buddy D et al Biomaterials Science ndash An introduction to Materials in Medicine Elsevier
London (2004)
[7] Gay C Stickiness ndash some fundamentals of adhesion Integrative and Comparative Biology 2002
42 1123-1126
[8] V Pocius A Adhesion Kirk-Othmer Encyclopedia of Chemical Technology Vol 1 Page 501
(2002)
[9] John Comyn Adhesion Science Royal Society of Chemistry Paperbacks 1997
[10] Garbassi F et al Polymer surfaces ndash From Physics to Technology John Wiley amp Sons Chichester
(1998)
[11] Covert P Principles of Pressure Sensitive Adhesion httpwwwgluemachinerycomprinciples-
of-pressure-sensitive-adhesionhtml 2012-02-08
[12] TRIS
httpwwwsigmaaldrichcomcatalogProductDetaildoD7=0ampN5=SEARCH_CONCAT_PNO7CBRA
ND_KEYampN4=4461307CALDRICHampN25=0ampQS=ONampF=SPEC 2012-02-08
[13] MAA
httpwwwsigmaaldrichcomcatalogProductDetaildoD7=0ampN5=SEARCH_CONCAT_PNO7CBRA
ND_KEYampN4=640507CFLUKAampN25=0ampQS=ONampF=SPEC 2012-02-08
[14] HEAA
httpwwwsigmaaldrichcomcatalogProductDetaildoD7=0ampN5=SEARCH_CONCAT_PNO7CBRA
ND_KEYampN4=6979317CALDRICHampN25=0ampQS=ONampF=SPEC 2012-02-08
[15] NIPAM
httpwwwsigmaaldrichcomcatalogProductDetaildoD7=0ampN5=SEARCH_CONCAT_PNO7CBRA
ND_KEYampN4=4153247CALDRICHampN25=0ampQS=ONampF=SPEC 2012-02-08
27
[16] DMAEMA
httpwwwsigmaaldrichcomcatalogProductDetaildoD7=0ampN5=SEARCH_CONCAT_PNO7CBRA
ND_KEYampN4=2349077CALDRICHampN25=0ampQS=ONampF=SPEC 2012-02-08
[17] AIBN
httpwwwsigmaaldrichcomcatalogProductDetaildolang=enampN4=441090|ALDRICHampN5=SEARC
H_CONCAT_PNO|BRAND_KEYampF=SPEC 2012-02-09
[18] Cowie JMG and Arrighi V Polymers Chemistry and physics of modern materials Taylor amp
Francis Group (2008)
[19] Wound Care ndash MepilexreghttpwwwmolnlyckecomgbWound-Care-ProductsProduct-
selector---Wound-divisionTabsProductsMepilexactiveTab=3 2011-10-24
[20] Chain copolymerization
httpcesysueducnechemipolychemuploadfilesE585B1E8819AE59088pdf
2012-02-09
[21] Israelachivli Jacob N Intermolecular and surface forcesAcademic Press Burlington (2011)
[22] Lyklema J et al Fundamentals of interface and colloid science Academic press San Diego
(2000)
[23] Gooch Jan W Encyclopedic dictionary of polymers 2 Part 13 Page 815 (2011)
[24] Convatec Technologies Inc Silicone Gel Adhesive with Organic Polyhydroxy Compounds
WO2012003028A1 Publication date 5 January 2012
28
Appendix I ndash Synthesis and purification
The synthesis was carried out by combining TRIS with the other monomers see Figure 9 The
combination resulted in four copolymers divided into three categories variations of 95 90 and 85
mol of TRIS
The procedure for the synthesis of poly[TRIS]-based copolymers by free radical polymerization using
poly[TRIS-co-MAA] as an example is as follows
1 4947 g of TRIS and 056 g of MAA was added to a 250 ml round bottomed flask containing a
magnetic stirring bar
2 To the flask was added 120 g of EtOAc to afford a 30 wt solution
3 The flask was sealed with a rubber septa and flushed with with nitrogen for 10 minutes
4 The flask was then placed in an oil bath as seen in Picture 1
5 0087 g of AIBN dissolved in EtOAc was added to the flask when the temperature of the oil
bath reached 65
6 The reaction was continued for 6 hours and stirred at 65 under N2 atmosphere
7 The solution was poured into a plastic jar sealed and let to cool down to room temperature
Calculations of amount of TRIS and MAA needed for the poly(TRIS-co-MAA) sample 1 see below
(1)
MTRIS = 42281 gmol
MDMAEMA = 15721 gmol
MNIPAM = 11316 gmol
MMAA = 8606 gmol
MHEAA = 11513 gmol
(2)
(3)
(4)
=012316
29
See Table 5-8 for detailed composition of all monomers
Table 5 poly(TRIS-co-MAA)
Monomer Sample A Sample B Sample 1
TRIS (g) 4947 4890 4828
MAA (g) 056 111 178
AIBN (g) 0087 0088 0087
EtOAc (g) 120 120 120
Molar fraction (TRISMAA) 09470053 08990101 08470153
Table 6 poly(TRIS-co-DMAEMA)
Monomer Sample 2 Sample C Sample 3
TRIS (g) 4904 4802 4692
DMAEMA (g) 096 200 308
AIBN (g) 0087 0087 0087
EtOAc (g) 120 120 120
Molar fraction (TRISDMAEMA) 09505 089011 085015
Table 7 poly(TRIS-co-NIPAM)
Monomer Sample 4 Sample 5 Sample 6
TRIS (g) 4932 4856 4775
NIPAM (g) 070 144 225
AIBN (g) 0087 0087 0088
EtOAc (g) 120 120 120
Molar fraction (TRISNIPAM) 095005 090010 08515 Table 8 poly(TRIS-co-HEAA)
Monomer Sample 7 Sample 8 Sample 9
TRIS (g) 4929 4853 4772
HEAA (g) 072 144 230
AIBN (g) 0087 0087 0087
EtOAc (g) 120 120 120
Molar fraction (TRISHEAA) 095005 090010 085015
Sample A B and C were not further evaluated
Purification by precipitation
1 The weight of the crude polymer was adjusted to a 30 wt solution and added to a 250 mL
glass separation funnel
2 1500 mL of MeOH was added to a 2000 mL beaker
3 The copolymer solution was drop wise precipitated into the MeOH while constant stirring as
seen in Picture 2
4 The copolymer seen in Picture 3 (a white tacky soft solid) was then retrieved by pouring off
the solution and picking up the polymer and stored in a sealed cup
30
Some observations made during the purification step are
1 The copolymer precipitates as white threads 2 The copolymer is quite firm and non-sticky 3 The solution is clear until the end where it turns turbid and the copolymer is more tacky and
sticky
First purification method Sample A B and C were not further evaluated as they were purified by another method that proved
to be insufficient to purify polymers In the patent application the purification step was described as
washing the copolymer with MeOH hence in this project the procedure was interpreted into the
following
The copolymer was dried after the synthesis and then dissolved in 20 g EtOAc on that was added the
double amount of MeOH (40 g) The solution was stirred manually with a spoon or such and left to sit
for 24 hours The excess MeOHEtOAc was poured off after 24 hours and 40 g of MeOH was added
again In total the procedure was repeated three times According to NMR spectra there was more
than 10 monomer left after this purification step and that is why the method was disregarded
Sample A B C and 2 were purified by this method but since there was no time left to purify sample
A B and C according to the purification described above they were not further evaluated
As this method showed to be insufficient it was decided to proceed with a more commonly used
method see Chapter 3 - Synthesis and purification of copolymer
31
Appendix II ndash Formulation and contact angle
Formulation The copolymers were blended with a silicone adhesive (two component system) in ratio 120 The
procedure is as follows (poly[TRIS-co-MAA] is set as an example)
1 0798 g of copolymer was blended with a conventional PDMS at 5 wt (5016 g of component A and 5014 g of component B) prior to curing
2 The blend was mixed in a SpeedMixer DAC 150 FVX-K for 30 seconds at speed of 3 500 rpm 3 It was cast onto a PUR-coated film (thickness 20 microm) coating thickness of 300 microm 4 The film was cured on a heating plate 150 degC for 15 minutes
Since the copolymers (after purification) where not dried to a 100 calculations of the percentage of
solvent left had to be done before any formulations could be made
Calculating percentage of solvent left in the wet copolymer was performed as follows (taking Sample
1 as example)
1 343 g of copolymer was set to dry in an oven at 45degC 2 After one day the sample was weighted to 201 g 3 The weight difference is the amount of solvent in the wet copolymer
Table 9 Wt solvent in copolymer after purification
Sample Wet
weight (g) Dry
weight (g) wt solvent in wet
copolymer wt solvent in wet copolymer after
removal of some solvent [FINAL]
1 343 201 4139 3735
2 381 278 2703 2430
3 363 249 3140 2757
4 363 252 3057 2660
5 500 335 3300 1899
6 357 227 3641 2812
7 362 219 3950 2298
8 301 205 3189 2938
9 487 291 4024 3425 Table 10 (g) copolymer needed to acheive a 5 wt in the formulation blend (based on Table 10 last column)
Formulation (sample)
Wet copolymer (g) Component A (g) Component B (g) wt copolymer in
blend
1 0798 5016 5014 475
2 0655 5036 5057 468
3 0692 5018 5037 475
4 0678 5013 5024 472
5 0615 5028 5020 472
6 0698 5029 5023 475
7 0699 5027 5034 507
8 0716 5018 5050 478
9 0761 4968 4934 482
32
Contact angle Contact angle measurements were performed on a EASYDROP Contact Angle Measurement System
from KRUumlSS with DSA1 control and evaluating software
1 A sample size 2 cm x 5 cm was taken from each formulation 2 One sample at a time was put on the sample table see Picture 4 3 The sample was illuminated with a PC-controlled illumination 4 The syringe was filled with deionized water and a droplet size 3 microL was produced at the tip
of the needle and applied on the surface 5 Pressing start in the computer software system the measurements started and proceeded for
one minute 6 Three positions were tested on each sample
33
Appendix III ndash Results
MVTR For the calculations of the MVTR values Equation (1) was applied
(1)
where
In this experimental setup deionized water was used as liquid and the test period was set to 24
hours
Table 11 MVTR raw data (red-marked number is disregarded)
Formulation W1 (g) W2 (g) W1-W2 (g) Average (g)
1
2119196 2114015 05181
05299 2123917 2118254 05663
2130770 2125716 05054
2
2120806 2111452 09354
08383 2128864 2121294 0757
2114589 2106363 08226
3
2137987 2133518 04469
04917 2119481 2114588 04893
2134925 2129537 05388
4
2134925 2121103 13822
1058 2134836 2125515 09321
1938189 1929592 08597
5
2140372 2135713 04659
04681 2138197 2133245 04952
2124946 2120513 04433
6
2127705 2121994 05711
05937 2124817 2117913 06904
2147531 2142335 05196
7
2116362 2111662 04700
04701 2121055 2116317 04738
2126865 2122200 04665
8
2138735 2133730 05005
05050 2134656 2129915 04741
2107122 2101718 05404
9
2121140 2116611 04529
04998 2140479 2134419 06060
2135159 2130754 04405
R 2127272 2122760 04512
04412 2138336 2134024 04312
34
SEC
Figure 16 SEC of Sample B MW = 508 456 gmol
Figure 17 SEC of Sample C MW = 443 117 gmol
35
1H- NMR
Figure 18 NMR of Sample A
Figure 19 NMR of Sample B
36
Figure 20 NMR of Sample 2
Figure 21 NMR of Sample C
37
Figure 22 NMR of Sample 3
Figure 23 NMR of Sample 4
38
Figure 24 NMR of Sample 5
Figure 25 NMR of Sample 6
39
Figure 26 NMR of Sample 7
Figure 27 NMR of Sample 8
40
Figure 28 NMR of Sample 9

1
1 Introduction
Background Silicone pressure sensitive adhesives (PSA) are commonly used in wound dressings scar dressings
and other medical applications A PSA is an adhesive that when pressure is applied forms a bond
with the adherend These adhesives are generally a blend of vinyl and hydride-containing
polydimethylsiloxane (PDMS) cured via addition curing They are biocompatible and can securely
attach medical devices to the body The adhesives are also highly hydrophobic which can lead to
problems under moist conditions (such as skin perspiration) ndash the adhesives lose their adhesion to
skin This is a problem as there is a risk of maceration (softening and whitening of skin when kept
wet) and the adhesive may detach from the skin prematurely
Traditionally water absorbing fillers have been added to the PSAs However this often leads to
swelling of the adhesive loss in dry adhesion and leaking of the filler due to their affinity to water [1]
To improve the wet adhesion properties hydrophilic silicone compatible copolymers may be added to
the silicone pressure sensitive adhesives The copolymers will introduce hydrophilic properties to the
adhesive improving wet adhesion and since the copolymers are large molecules migration and
leakage can be avoided It would also allow better water vapor permeability and improve
transportation of eg antimicrobial additives
Aim The aim of this project is to evaluate a patent application [2] from the health care company Convatec
Technologies Inc claiming the first time ever synthesis of a unique amphiphilic silicone copolymer
used in a pressure sensitive adhesive In this project synthesis of amphiphilic copolymers will be
carried out and the copolymers will be evaluated to determine how they affect the properties of
PSAs The goal of the copolymers is to contribute to better wet adhesion and water vapor
permeability as claimed in the patent application
Delimitations This master thesis is delimited to some of the monomers solvents and the initiator presented in the
patent application [2] see Chapter Monomers in the project The standard silicone PSA used in this
project will be MED 6350 a commercial PDMS polymer from Nusil
2
2 Theory
From sand to silicones The term silicone originates from the word silicon and ketone and refers to polysiloxanes Silicones
belong to the category of synthetic polymers whose backbone constitutes of Si-O-Si linkages The
silicon atoms can also be bonded to organic groups such as methyl groups (see Table 1) This basic
repeating unit is known as siloxane The most common silicone (and in largest volume produced) is
polydimethylsiloxane PDMS The silicone industry became viable after Rochows discovery in 1940
of the direct process where elemental silicon reacts with methylene chloride (MeCl) to form
methylchlorosilanes [3-5] When silica (sand) is reduced according to Scheme 1 in a carbo-electro
reduction process chemical grade silicon is produced The methyl chlorosilane (MCS) reaction is
shown in Scheme 2 [3]
Scheme 1 Carbo-electro reduction process
A critical factor in the MSC reaction is the selectivity for the dimethyldichlorosilane (Di) as PDMS is
made from hydrolysis of Di [3]
Scheme 2 MSC reaction
Silicon is tetravalent and may thus have one two or three organic substituents where the methyl
silicones have the most practical applications see Table 1
Table 1 Structural units of silicones
SiO2 + C SiO + SiC Si + CO
High voltage
gt 1200 degC
Si + MeCl
Me2SiCl2 (Di)
MeSiCl3 (Tri)
Me3SiCl (Mono)
MeHSiCl2 (MH)
Me2HSiCl (M2H)
Cu (3-5)
Zn (400-2000 ppm)
Sn (5-30 ppm)
Al (500-4000 ppm)
290-305 degC
3
Silicone curing The copolymers synthesized in this project will be formulated into a silicone based two component
system Blending of the two components (A and B) results in a hydrophobic cross-linked system
which is a PDMS crosslinked elastomer
Addition curing also known as hydrosilylation are two component systems based on a Pt-catalyzed
reaction that takes place between vinyl endblocked polymers and Si ndash H oligosiloxanes Both
components contain the vinyl endblocked polymer but one (component A) contains the catalyst (Pt)
and the other (component B) contains the crosslinker The crosslinking in this system is a
spontaneous reaction at room temperature but the rate can be increased if the temperature is
raised This leads to a far more shortened curing time The mechanism of the network formation
through addition curing is showed in Scheme 3 [4]
Scheme 3 Network formation through addition curing (Redrawn from [4])
Advantages using addition curing instead of other methods such as cross-linking by condensation
are that this method eliminates shrinkage as there are no by-products formed [5]
Silicone physicochemical properties
The element silicon is positioned just under carbon in the periodic table and this led to a belief that
silicon could replace carbon However there are very few similarities between silicon and carbon For
instance the Si-X bond is much larger than the C-X bond Si also has a lower electronegativity than C
and has thus more polar bonds The bond polarity contributes to strong
silicon bonding [5]
Silicones have the unusual combination of both high surface energy properties and low surface
energy properties The high surface energy comes from the inorganic chain similar to silicates
whereas the methyl groups which are organic contribute to the low surface energy Since the Si-O
bonds are polar they would lead to strong intermolecular interactions had they not been shielded by
the methyl groups The shielding is made easy by the high flexibility of the silicone chain There is
4
nearly free rotation around the Me2Si-O bond Despite the polar chain of silicones they have a low
critical surface tension of wetting [5]
Silicone biocompatibility
The definition of biocompatibility is the ability of a material to perform with an appropriate host
response in a specific application [6]
It was discovered in the mid-1940s that silicones due to their hydrophobic property prevented blood
from coagulating Silicones are used in long term implantations as they are chemically stable and
highly elastic and the first report of silicone elastomers being implanted in humans was in 1946 Dr
Frank H used silicone in a bile duct repair and reported that It is flexible it will stretch it will bounce
like a rubber and it can be cast into any shape [5] In 1948 Dr DeNicola implanted an artificial
urethra tube and reported 14 months after the implantation that the artificial urethra had been
retained with normal genito-urinary function [5] and that There is no evidence at this time that
the tube is acting as a foreign body irritant [5]
Silicones are widely used in various medical applications due to properties such as biocompatibility
and biodurability ndash which originate from silicones being hydrophobic chemically and thermally stable
materials with a low surface tension [5]
Adhesion When there is energy required to separate two bodies the two bodies are said to adhere and the
force necessary to break the bond between the two bodies is called practical adhesion Adhesion is
physical attraction between the surfaces of two materials and is dependent on the character of the
physical forces holding the atoms and molecules together [7 8]
So what is an adhesive Basically it is a material which joins materials when applied to their
surfaces and resist separation There are two characteristic properties an adhesive must possess [9]
1 An adhesive must spread on a surface having a contact angle approaching zero ndash it must wet
the surface The adhesive will be liquid of low viscosity when applied
2 The adhesive must harden and have high cohesive strength which is the strength of like
molecules to stick together The hardening can be achieved by loss of solvent chemical
reactions or by cooling if the adhesive is a hot melt There is one exception to this second
property and that is pressure-sensitive adhesives These are permanently sticky
There are six theories of adhesion which are physical adsorption chemical bonding electrostatic
attraction mechanical interlocking inter-diffusion and weak boundary layer theories For this
project the most relevant adhesion theories are physical adsorption and mechanical interlocking
These will be further described below
5
Figure 1 (a) mechanical interlocking (b) interdiffusion of chains (c) electrical interactions (d) chemical interactions (Redrawn from [10])
Physical adsorption
This theory involves van der Waals forces across the interface and attractions between permanent
and induced dipoles Since all materials have different polarities resulting from their electron cloud
they also have different adhesion An example is between metal and paper which are polar materials
and polyethylene (PE) and silicone which are non-polar Metal and paper easily adhere by any
adhesive while PE and silicone are more difficult to bond [9 11]
There are three types of forces of attraction between dipoles EPP (permanent dipoles) Epi
(permanent dipole and corresponding induced dipole) and Eii (instantaneously induced dipoles)
Between a pair of permanent dipoles distance r at their centers there is a potential energy EPP given
by equation (1)
(1)
where micro1 and micro2 are the dipole moments and ε0 is the permittivity in vacuum k the Boltzmanns
constant and T the absolute temperature
If there is a non-polar molecule close to a polar molecule then the latter will induce a dipole in the
former Equation (2) gives the induced dipole moment where E is the electric field and α is the
polarizability of the non-polar molecule
(2)
The potential energy in this case is Epi and given in equation (3) where micro1 is the dipole moment of the
permanent dipole
(3)
The third type of physical adsorption interaction is between two instantaneous dipoles These types
of dipoles exist in non-polar molecule as a result of fluctuating distribution of electrons The potential
energy is given by equation (4)
(4)
6
where α1 and α2 are the molecules polarizabilities and I1 and I2 are their ionization potentials [9]
Mechanical interlocking
A soft tacky adhesive can enter irregularities found in substrates with irregular surface see Figure 1
(a) This is called mechanical interlocking and it occurs when an adhesive can wet a surface creating
a bonding force Silicone pressure sensitive adhesives as silicones flow readily can penetrate into a
porous or rough substrate (such as skin) and create a mechanical bond [9 11]
Monomers used in the project
TRIS
3-[Tris(trimethylsiloxy)silyl]propyl methacrylate (TRIS) is a silicone based monomer with the chemical
formula C16H38O5Si4 Figure 2 illustrates the chemical structure TRIS is used as the basemonomer
and constitutes the largest part in the copolymers This is because TRIS has TMS groups short for
trimethylsilyl -Si(CH3)3 which makes it similar to PDMS and thus contributes to the good miscibility
with the PDMS [12]
Figure 2 TRIS monomer
TRIS belongs to the acrylate family and contains a vinyl group which is crucial for free radical
polymerization (see Chapter 2 Free radical polymerization in solution)
MAA
Metharcylic acid (MAA) is also a member of the acrylate family and has the chemical formula C4H6O2
Figure 3 illustrates the chemical structure of MAA [13]
Figure 3 MAA monomer
HEAA
N-Hydroxyethyl acrylamide (HEAA) with the chemical formula C5H9NO2 is an acrylamide having one
nitrogen replacing the oxygen seen in acrylates The chemical structure of HEAA is seen in Figure 4
[14]
7
Figure 4 HEAA monomer
NIPAM
N-Isopropylacrylamide (NIPAM) chemical formula C6H11NO and chemical structure illustrated in
Figure 5 [15]
Figure 5 NIPAM monomer
DMAEMA
2-(Dimethylamino)ethyl methacrylate (DMAEMA) C8H15NO2 This acrylate has the chemical structure
shown in Figure 6 [16]
Figure 6 DMAEMA monomer
Initiator AIBN
Azobisisobutyronitrile (AIBN) is a common initiator used in free radical polymerization Chemical
structure can be seen in Figure 7 [17]
Figure 7 AIBN initiator
Free radical polymerization in solution In free radical polymerization polymers are formed by the addition of free radical building blocks in
this project it is vinyl monomers added onto a growing chain When the polymerization is in a
solution the solvent facilitates heat transfer and also reduces viscosity of the medium However
complications of chain transfer may arise and thus selection of solvent must be carefully made
The polymerization proceeds in three stages (1) initiation an active center which acts as a chain
carrier is formed (2) propagation growth of the macromolecule by a kinetic chain mechanism where
monomers are added to the growing chain (3) termination the active center is transferred or
neutralized which stops the progress of the kinetic chain [18]
8
Initiation
The initiation step begins with an initiator that decomposes into free radicals R when subjected to
heat electromagnetic radiation or a chemical process see reaction (1) The free radical will have an
active center which is the location of the unpaired electrons The instability of the carbon double
bond of the monomer M makes it susceptive to reaction with the free radicalrsquos unpaired electrons
hence the active center of the free radical can ldquograbrdquo one electron from the double bond of the
monomer creating a new active center at the end of the chain as it leaves an unpaired electron [19]
(1)
The amount of generated radicals effective in the creation of a kinetic chain can be expressed as the
efficiency factor f (0-1) A low efficiency factor will lead to inefficient chain propagation and can be
due to several factors where one is primary recombination which is a result of to radicals combining
see reaction (2)
(2)
This can occur if the solution impedes the radical fragments leading to a cage effect The solvent
plays an important part in solution free-radical polymerization as the extent of decomposition of the
initiator varies with the solvent An example is the decomposition of benzoyl peroxide where in
tetrachloroethylene it only decomposes up to 35 while it is 85 in ethyl acetate [18]
Propagation
When the synthesis has been initiated it is followed by the propagation reaction In free radical
polymerization the propagation process usually takes place within a fraction of a second The
propagation steps are similar to the initiation where electrons are transferred and the active center
is moved down the chain see reaction (3)
(3)
The propagation comes to an end when the termination occurs [18]
Termination
The termination is the step where the active center is either transferred to another chain or
neutralized There are two ways in which the termination can take place by combination or
disproportionation
Combination
The termination reaction combination is between two end chains where they couple together to
form one long chain as seen in Scheme 4
9
Scheme 4 Combination of two growing chains into one polymer
Disproportionation
This occurs when hydrogen abstractions takes place in one end forming a carbon double bond and
resulting in two dead polymer chains see Scheme 5 [18]
Scheme 5 Disproportionation of two growing chains into two dead polymer chains
Chain transfer
Chain transfer occurs when the active center of a growing polymer is transferred to another species
through a collision There are several types of chain transfer In general hydrogen abstraction from
monomer initiator polymer solvent and modifier There are five concepts of chain transfer transfer
to monomer transfer to initiator transfer to polymer transfer to modifier and transfer to solvent
[18]
Copolymer equation When using two or more monomers in a free radical polymerization the term is known as
copolymerization By copolymerizing two monomers the properties of the resulting polymer are
often better than the properties for the parent homopolymers The simplest case of
copolymerization involves two monomers (eg M1 and M2) but can be presented in several different
structures within the copolymer such as Statistical copolymer Alternating copolymers Block
copolymers Graft copolymers and Stereoblock copolymer [18]
The copolymerization between two monomers M1 and M2 is presented in equations (51)-(54)
where k11k22 and k12k21 correspond to self-propagating and cross-propagating rate constants
respectively [18]
(51)
(52)
(53)
(54)
The rate of consumption of M1 can be determined according to equation (6) if steady state
conditions prevail and the radical activity only depends on the nature of the terminal unit [18]
10
(6)
The rate of consumption for M2 is then
(7)
By assuming that
the copolymer equation is obtained by dividing
equation (6) by equation (7) so that
(8)
where r1 and r2 represent relative reactivity ratios from and
Several limiting cases of r can be derived
block copolymerization since both reactivity ratios are larger than unity the propagating monomers prefer to react with themselves forming blocks of M1 and M2
block copolymerization since the reactivity ratios are much higher than unity there is no inclination for the monomers to react with each other leading to two homopolymers
ideal copolymerization the propagating species M1 and M2 have the same preference for adding one or the other resulting in a random copolymer
alternating copolymerization each of the two propagating species prefers adding the other monomer
M1 is more reactive toward both propagating species and the copolymer will contain more of the reactive monomer in statistical placement [20]
Characterization methods
Contact angle
The spreading or deformation of a water droplet on a solid surface is determined by the surface and
interfacial energies The contact angle θ is the angle under which the droplet meets the surface and
may be evaluated by taking into account the three interfacial tensions in Figure 8
ndash between surface and liquid
ndash between surface and gas
ndash between liquid and gas
Figure 8 Different contact angles of a water droplet on a solid surface
11
The contact angle is also a quantification of the wetting of the solid by the liquid and is determined
by Youngs equation
(9)
The lower θ the better the wetting Poorly wetting systems may eg be water on Teflon where the
water droplet rolls off the surface hence θ approaches 180deg The other opposite is when the liquid
spreads and covers the surface complete wetting is achieved and θ approaches 0deg [21 22]
Moisture vapor transmission rate (MVTR)
The definition of moisture vapor transmission rate (also water vapor transmission rate) is as follows
The rate of water vapor flow under steady specified conditions through a unit area of a material
between its two parallel surfaces and normal to the surfaces [23]
And the metric unit of measurements is
12
TRIS
MAA
5 mol
10 mol
15 mol
DMAEMA
5 mol
10 mol
15 mol
NIPAM
5 mol
10 mol
15 mol
HEAA
5 mol
10 mol
15 mol
3 Experimental
Chemicals Table 2 Chemicals used in this project
Monomers Solvents Initiator Silicone PSA
TRIS (from Sigma-Aldrich) EtOAc (from Sigma-Aldrich) AIBN (from
Chalmers) MED 6350 (from Nusil)
NIPAM (from Sigma-Aldrich) MeOH (from Sigma-Aldrich)
DMAEMA (from Sigma-
Aldrich)
MAA (from Sigma-Aldrich)
HEAA (from Sigma-Aldrich)
Methodology
Synthesis and purification of copolymer
In the synthesis of the copolymer monomer weight was kept at 50 g for all the experiments Amount
of initiator was kept at approximately 0087 g and the solvent was kept at 120 g generating a 30 wt
solution
The synthesis was carried out in a round bottom flask see Picture 1 placed in an oil bath holding 65
degC The two monomers (TRIS and MAADMAEMANIPAMHEAA) see Figure 9 were added to the
flask with solvent and initiator Stirring was important throughout the entire synthesis to promote
good mixing The synthesis for each copolymer lasted for six hours For more detailed description see
Appendix I
The copolymer solution was purified by precipitation in methanol see Picture 2 This is because the
copolymer is not soluble in methanol while the pure monomers are In Picture 3 the precipitated
copolymer is shown
Figure 9 A scheme of poly[TRIS]-combinations and molar percentages of MAADMAEMANIPAMHEAA
13
Formulation of copolymer and two component system Each copolymer was blended with MED 6350 (a commercial PDMS polymer) in a 120 ratio of
copolymer to MED 6350 The blends were cast onto PUR-films and then cured on a heating plate to
generate the final PSA For more details see Appendix II
Contact angle measurements The contact angle measurements were performed on the formulations above and not on the pure
copolymers Each formulated film was measured with the EASYDROP Contact angle Measurement
System see Picture 4 using deionized water Three positions were measured for every formulated
film during 60 seconds to ensure a correct average contact angle More details in Appendix II
Picture 1 Synthesis reaction set-up Picture 2 Copolymer purification set-up
Picture 3 A close-up of the precipitated copolymer
14
Picture 4 Contact angle measurement equipment
Moisture vapor transmission rate (ID T-1070)
A cylinder was filled with deionized water up to a level leaving a 5 mm air gap The produced films
from the formulations three specimens of each were punched out in a circular shape larger than the
opening of the cylinders The cylinder was covered with the specimen weighed and placed in an
oven (37degC) for 24 hours After 24 hours the cylinder with the specimen was weighed again and
moisture vapor transmission rate could be obtained by calculating the loss of water
NMR and SEC 1H NMR spectrum was recorded on a Varian 400 spectrometer The samples were dissolved in CDCl3
and the 1H NMR spectra were obtained at 298 K with CDCl3 as internal standard Size-exclusion
chromatography (SEC) was performed on a Waters Alliance 2000 GPCV at 135degC with 124-
trichlorobenzene as eluent at 1 mLmin using an RI-detector It was calibrated using polystyrene
standards
Failed method GF31 is a chemical similar to TRIS but much cheaper see Figure 10 and 11 The first synthesis was
therefore done with GF31 instead of TRIS The first polymerization was between GF31 and MAA
Table 3
Table 3 First synthesis between GF31 and MAA
Chemical Amount
GF31 11195 (g)
MAA 3754 (g)
EtOAc 350 (g) (+ 400 mL)
AIBN 095 (g)
This first synthesis was done in a batch size of 500 g A reactor with a built in heat controlled oil
circulation was used with a SVL multi-joint lid 5-NECK on top Through the center neck a mechanical
stirrer passed and through the others nitrogen gas was connected and in-let of chemicals occurred
15
the rest were sealed The synthesis progressed in the same manner as described in Chapter 3 ndash
Synthesis and purification of copolymer Problems faced here were leakage of solvent and GF31
interaction with MAA As seen in Table 3 an extra amount (400 mL) of EtOAc was added during the
synthesis due to fact that 80 of the solvent (EtOAc) had evaporated within six hours GF31 (since it
is different from TRIS) formed a type of hard brittle white copolymer instead of the expected clear
tough and rubbery copolymer The ndashSi-O-Me groups of GF31 are probably more reactive than the
TMS groups of TRIS leading to the hard brittle copolymer formed However the side group of
monomer GF31 is not flexible enough to form a soft polymer and less MAA would improve the
softness Even though later on the leakage problem was solved (by sealing the center neck better)
the reactor was disregarded as an optimal set-up and was replaced by round bottom flask (reactor
with batch size 150 g) with a rubber septa using TRIS instead of GF31
Figure 10 Chemical structure of TRIS Figure 11 Chemical structure of GF31
16
4 Results and discussion
Polymerization
Yield
The yield does not take into consideration amount of monomer left in the copolymer In Chapter 4 ndash
NMR calculations of copolymer composition and percentage of monomer left are made For some
copolymers eg sample 1 the yield is much lower than for the rest as seen in Table 4 This may be
due to loss of copolymer in the first purification method see Appendix I Sample 1 (15 MAA)
showed some solubility in MeOH which means that when excess MeOHEtOAc was poured off some
polymer residue may also have been poured off hence the lower yield Also in the precipitation
method the solution started to become turbid when all copolymer solution had been blended with
the MeOH this was a fact for all copolymers The EtOAc to MeOH ratio was probably too small and
the copolymer started to dissolve There was most likely some loss of copolymer in this step too It
would probably have been better to use a larger quantity MeOH to avoid dissolution of the
copolymer
The best yield was expected for sample 8-9 as they had not been purified by the first method first
and hence the loss of polymer was strictly restricted to the new method But as seen the yield is 63
for Sample 8 and 70 for sample 9
Sample 7-9 are the poly[TRIS-co-HEAA] copolymers Amount of HEAA increases from sample 7 to
sample 9 and hence increased hydrophilicity The reason to why there is a loss of polymer in the
purification step could be that the copolymer (as the HEAA increases) became more soluble in
MeOH But as seen in Table 4 sample 7-9 are the copolymers containing the highest amount of TRIS
This speaks against the possibility of increasing HEAA contributing to increased hydrophilicity and
thus making the copolymer soluble in MeOH Also sample 9 should be more soluble in MeOH than
sample 8 as it contains more HEAA The same behavior is seen in sample 4-6 (poly[TRIS-co-NIPAM])
where there is a larger loss of copolymer for sample 4 than for sample 6 It seems that the yield is
somewhat circumstantial
17
Table 4 Results from all evaluations
18
SEC ndash molecular weight
According to the patent application it is stated that the molecular weight is larger than 10 000 gmol
In Figure 12 and 13 and Appendix III Figure 16-17 all values show a MW well above 10 000 gmol at
the lowest 360 000 gmol and for the highest at 508 000 gmol SEC was only done on Sample A-C
see Table 4 and Sample 2 as the copolymers are TRIS-based it is assumed that the rest of the
copolymers possess a similar molecular weight The second peak in both figures represents some
low molecular substance probably monomer residue Before H-NMR measurements Sample 2 was
purified one more time see Appendix I First purification method
Figure 12 SEC of Sample 2 Mw = 360 000 gmol
Figure 13 SEC of Sample A MW= 485 000 gmol
19
1H- NMR
Figure 14 NMR of Sample 1
1H- NMR was done to be able to calculate the composition in the copolymer Calculations are shown
below on Figure 14
(10)
where xT and xM are fractions of TRIS and MAA in the copolymer respectively
(11)
Applying equation (10) into equation (11) and
(expected value is 85 )
The two peaks at 610 ppm and 554 ppm are from the double bonds in the two monomers
(12)
Where xMo is the fraction of monomer left in the copolymer
20
Since xT is 8075 of the copolymer composition xMo is then
According to the calculations above there is approximately 392 monomer residue left in the
copolymer That is quite a large difference to 108 left in sample A (calculated in the same manner
as above) which was purified by the first purification method see Appendix I First purification
method
Table 4 presents the copolymer compositions for each copolymer These data are not exact as the
integrals were calculated by hand in MestreNova an analytical chemistry software suite This results
in an inaccuracy that has to be taken into account and the data showed above has to be considered
as approximate values For all the copolymers there is a continuous increase of the comonomer
which is consistent with the expected values
One copolymer is standing out from the others and it is poly[TRIS-co-HEAA] (sample 7-9) The
expected (the input) percentage of HEAA was 5 ndash 10 ndash 15 but the output was approximately 3 ndash 5 ndash
10 which means that TRIS has less affinity for HEAA than for the rest of the monomers Hence one
can assume leading to TRIS being more reactive toward both propagating species
and the copolymer will contain more of the reactive monomer (TRIS) in statistical placement In
comparison TRIS to the other monomers the r values were as can be seen in
Table 4 where the output was larger than 5 ndash 10 ndash 15 for the comonomers (exception DMAEMA
where 5 was input and 239 was output)
As seen in Table 4 the amount of monomer left in the copolymer varies between 077 ndash 392 for
the polymer purified by precipitation For copolymers A-C the level of monomers left are much
higher (85 ndash 137 ) and this proves that the first purification method was insufficient
Contact angle measurements All contact angle measurements were performed on the formulated films and not on the pure
copolymers
As seen in Table 4 the contact angle (deg) of the copolymer formulations does not differ from the
reference formulation (pure MED 6350) especially much The contact angle was expected to be lower
than the reference but as seen it is higher for sample 7 The contact angle is in the interval 121deg -
128deg and is too narrow to say anything about whether the contact angle actually has been modified
or not One reason to why these measurements may not have been very accurate is the fact that the
angle was measured on a droplet that was out in the open Lights from the surroundings and air
conditioning in the room could have affected the measurements Observed during the measurement
was that the droplet size steadily decreased which either means that the droplet evaporates or that
the surface has changed Had these measurements been done in a closed environment of the
droplet then perhaps there would have been different values
Another fact to why there is such little change in the contact angle is that silicones are highly
hydrophobic materials and since there is a very small amount of hydrophilic material integrated in
the silicone a large difference in the contact angle is really not expected Had there been a large
21
difference in contact angle the possibility of migration within the formulation of the hydrophilic
copolymer could be a reason However that was not the case and is very unlikely since the
copolymers are large molecules and the probability of migration is therefore small
Moisture vapor transmission rate The higher MVTR the better vapor transmission As seen in Table 4 all formulations show higher
MVTR than the reference This means that the formulations containing the hydrophilic copolymers
actually breathe better and are more likely to let vapor through Sample 4 [poly(TRIS-co-NIPAM(5
mol))] has an MVTR that is 139 better than the reference The rest of the formulations show an
improvement between 6 ndash 90 As only three tests on each formulation was done it is not
statistically correct to say that there has been an improvement of the MVTR as there is no clear
standard deviation to take into account However all formulations show higher MVTR than the
reference
Figure 15 MVTR data for all samples Blue = values for each test Red = average
In the investigated patent application there was no MVTR-testing done However testing of wet
adhesion was done by taking a 1-inch by 15-inch strip of adhesive and attach it to the abdominal skin
of a human subject and removing it after 40-60 min of aerobic activity [2] According to their results
good wet adhesion was achieved with the formulation containing 5 mol NIPAM and weak wet
adhesion was achieved with the formulation containing 5 mol DMAEMA sample 4 (MVTR = 1058)
and 2 (MVTR = 838) respectively in this project These two formulations showed best MVTR results
and are in accordance with the patent application investigated Why the formulations with lower
amount of polar part showed the best MVTR values must be due to morphology However due to
monomer residue wet adhesion testing on humans was not possible
22
There were some formulations with bubbles in the film seen Picture 5 and 6 Especially sample 2 4
and 8 This may have affected the MVTR and contributed to a higher value than expected
Formulation 8 had also a large amount of bubbles but a low MVTR The bubbles may have been
caused by solvent or monomer evaporating or air that has been trapped during the speed mixing As
seen in Figure 15 there is one value for sample 4 that is well above the others Since the value is
almost 50 larger than the second highest value it could be faulty perhaps an increased amount of
bubbles in the film or leakage of the cylinder
Picture 5 From MVTR Representing sample 9 - 7 from left to right
Picture 6 From MVTR Representing sample 2 - 4 from left to right
23
5 Conclusions This study showed that synthesis of hydrophilic silicone copolymers can be relatively easy
performed and the molecular weight achieved was high (Mw gt 500 000 gmol)
1H- NMR showed that the composition in the copolymers was not as the feed monomer composition
For poly[TRIS-co-MAA] and poly[TRIS-co-NIPAM] there was a higher percentage of comonomer than
assumed while the values varied for poly[TRIS-co-DMAEMA] and for poly[TRIS-co-HEAA] there was a
lower percentage of comonomer NMR also indicated monomer residue left in the copolymers
between 077 ndash 392 indicating that the purification step needs to be optimized or repeated more
than once to remove monomers left in the copolymer
According to contact angle measurements wetting of the silicone surface was not greatly affected
As the addition of copolymer was only 5 wt and of those 5 wt only 5 ndash 15 mol contained a
hydrophilic part a large change in contact angle was not expected The contact angle was evaluated
as the patent application [2] stated large change in wet adhesion
The most relevant results for this project were the MVTR results as they portrayed the improvement
of the silicone PSA (pure MED 6350) The MVTR values showed an large increase in water vapor
permeability for sample 2 and 4 5 mol DMAEMA and 5 mol NIPAM respectively If there is a
correlation between good wet adhesion and MVTR = 1058 (sample 4) contra weak wet adhesion
and MVTR = 838 (sample 2) then it is possible to conclude that for the rest of the copolymer samples
(MVTR ltlt 800) no or little wet adhesion was achieved Why there was no radical improvement for
sample C and 3 and sample 5 and 6 (DMAEMA 10-15 mol and NIPAM 10-15 mol respectively)
can be due to the results of sample 2 and 4 being faulty The explanation could also be that the
values are correct and that the addition of only 5 mol was enough to change the morphology of
the film in a way generating a higher MVTR and increasing the mol of comonomer did not change
the morphology in the same way thus not generating a higher MVTR
Overall it can be concluded that this method is not optimal for increasing hydrophilicity of PSAs as
the method is somewhat complicated to perform and the purification of the copolymers is time
consuming and unsatisfactory However silicone compatible copolymers were successfully
synthesized and characterized Taking the data retrieved in regard many questions about the quality
of the patent application are raised
24
6 Future work For this project future work would be to further purify the copolymers and then evaluate their
adhesive properties directly on the skin This would give more realistic values to whether or not the
modified PSAs have achieved better wet adhesion or not Also to redo the formulations without
bubbles and once again measure MVTR To add more analysis in form of morphology analysis to se
whether or not there is a difference in structure between the different formulations
Another project of future work is to evaluate the new patent application from Convatec Technlogies
Inc [24] where PSAs are modified by the addition of a low molecular weight organic hydroxy
containing compound This method is more straight on and does not involve any complicated
synthesis or purification steps It is simply addition of a hydroxy containing compound to a PSA prior
to curing This may be an interesting study for future work
25
7 Acknowledgments Many people have been involved in this master thesis and I would like to thank them for their
support and help
Thanks to
Dennis Hansson and Lars Lindgren my supervisors at Moumllnlycke Health Care that have always been
available for questions taken a great interest in my work and been a great support
Everyone at the Columbus group at Moumllnlycke Health Care thanks for making my time here fun and
interesting
Anders Maringrtensson for helping me with SEC analysis at Chalmers
Renee Kroon for helping me with NMR analysis at Chalmers
Mats Andersson my examiner
Friends and family
26
References [1] Mechan S et al Amphiphilic Silicone Copolymers for Pressure Sensitive Adhesive Applications
Journal of Applied Polymer Science 2010 116 3265-3270
[2] Convatec Technologies Inc Pressure Sensitive Silicone Adhesives with Amphiphilic copolymers
WO2011005839A1 Publication date 13 January 2011
[3] Clarson J S et al Silicones and Silicone-Modified Materials American Chemical Society
Washington (2000)
[4] Pachaly B Achenbach F Herzig C Mautner K Silicones WILEY-VCH Wienheim (2005)
[5] Colas A and Curtis J Silicone Biomaterials History and Chemistry amp Medical Applications of
Silicones httpwwwdowcorningcomcontentpublishedlit52-1069-01pdf 2012-01-17
[6] Ratner Buddy D et al Biomaterials Science ndash An introduction to Materials in Medicine Elsevier
London (2004)
[7] Gay C Stickiness ndash some fundamentals of adhesion Integrative and Comparative Biology 2002
42 1123-1126
[8] V Pocius A Adhesion Kirk-Othmer Encyclopedia of Chemical Technology Vol 1 Page 501
(2002)
[9] John Comyn Adhesion Science Royal Society of Chemistry Paperbacks 1997
[10] Garbassi F et al Polymer surfaces ndash From Physics to Technology John Wiley amp Sons Chichester
(1998)
[11] Covert P Principles of Pressure Sensitive Adhesion httpwwwgluemachinerycomprinciples-
of-pressure-sensitive-adhesionhtml 2012-02-08
[12] TRIS
httpwwwsigmaaldrichcomcatalogProductDetaildoD7=0ampN5=SEARCH_CONCAT_PNO7CBRA
ND_KEYampN4=4461307CALDRICHampN25=0ampQS=ONampF=SPEC 2012-02-08
[13] MAA
httpwwwsigmaaldrichcomcatalogProductDetaildoD7=0ampN5=SEARCH_CONCAT_PNO7CBRA
ND_KEYampN4=640507CFLUKAampN25=0ampQS=ONampF=SPEC 2012-02-08
[14] HEAA
httpwwwsigmaaldrichcomcatalogProductDetaildoD7=0ampN5=SEARCH_CONCAT_PNO7CBRA
ND_KEYampN4=6979317CALDRICHampN25=0ampQS=ONampF=SPEC 2012-02-08
[15] NIPAM
httpwwwsigmaaldrichcomcatalogProductDetaildoD7=0ampN5=SEARCH_CONCAT_PNO7CBRA
ND_KEYampN4=4153247CALDRICHampN25=0ampQS=ONampF=SPEC 2012-02-08
27
[16] DMAEMA
httpwwwsigmaaldrichcomcatalogProductDetaildoD7=0ampN5=SEARCH_CONCAT_PNO7CBRA
ND_KEYampN4=2349077CALDRICHampN25=0ampQS=ONampF=SPEC 2012-02-08
[17] AIBN
httpwwwsigmaaldrichcomcatalogProductDetaildolang=enampN4=441090|ALDRICHampN5=SEARC
H_CONCAT_PNO|BRAND_KEYampF=SPEC 2012-02-09
[18] Cowie JMG and Arrighi V Polymers Chemistry and physics of modern materials Taylor amp
Francis Group (2008)
[19] Wound Care ndash MepilexreghttpwwwmolnlyckecomgbWound-Care-ProductsProduct-
selector---Wound-divisionTabsProductsMepilexactiveTab=3 2011-10-24
[20] Chain copolymerization
httpcesysueducnechemipolychemuploadfilesE585B1E8819AE59088pdf
2012-02-09
[21] Israelachivli Jacob N Intermolecular and surface forcesAcademic Press Burlington (2011)
[22] Lyklema J et al Fundamentals of interface and colloid science Academic press San Diego
(2000)
[23] Gooch Jan W Encyclopedic dictionary of polymers 2 Part 13 Page 815 (2011)
[24] Convatec Technologies Inc Silicone Gel Adhesive with Organic Polyhydroxy Compounds
WO2012003028A1 Publication date 5 January 2012
28
Appendix I ndash Synthesis and purification
The synthesis was carried out by combining TRIS with the other monomers see Figure 9 The
combination resulted in four copolymers divided into three categories variations of 95 90 and 85
mol of TRIS
The procedure for the synthesis of poly[TRIS]-based copolymers by free radical polymerization using
poly[TRIS-co-MAA] as an example is as follows
1 4947 g of TRIS and 056 g of MAA was added to a 250 ml round bottomed flask containing a
magnetic stirring bar
2 To the flask was added 120 g of EtOAc to afford a 30 wt solution
3 The flask was sealed with a rubber septa and flushed with with nitrogen for 10 minutes
4 The flask was then placed in an oil bath as seen in Picture 1
5 0087 g of AIBN dissolved in EtOAc was added to the flask when the temperature of the oil
bath reached 65
6 The reaction was continued for 6 hours and stirred at 65 under N2 atmosphere
7 The solution was poured into a plastic jar sealed and let to cool down to room temperature
Calculations of amount of TRIS and MAA needed for the poly(TRIS-co-MAA) sample 1 see below
(1)
MTRIS = 42281 gmol
MDMAEMA = 15721 gmol
MNIPAM = 11316 gmol
MMAA = 8606 gmol
MHEAA = 11513 gmol
(2)
(3)
(4)
=012316
29
See Table 5-8 for detailed composition of all monomers
Table 5 poly(TRIS-co-MAA)
Monomer Sample A Sample B Sample 1
TRIS (g) 4947 4890 4828
MAA (g) 056 111 178
AIBN (g) 0087 0088 0087
EtOAc (g) 120 120 120
Molar fraction (TRISMAA) 09470053 08990101 08470153
Table 6 poly(TRIS-co-DMAEMA)
Monomer Sample 2 Sample C Sample 3
TRIS (g) 4904 4802 4692
DMAEMA (g) 096 200 308
AIBN (g) 0087 0087 0087
EtOAc (g) 120 120 120
Molar fraction (TRISDMAEMA) 09505 089011 085015
Table 7 poly(TRIS-co-NIPAM)
Monomer Sample 4 Sample 5 Sample 6
TRIS (g) 4932 4856 4775
NIPAM (g) 070 144 225
AIBN (g) 0087 0087 0088
EtOAc (g) 120 120 120
Molar fraction (TRISNIPAM) 095005 090010 08515 Table 8 poly(TRIS-co-HEAA)
Monomer Sample 7 Sample 8 Sample 9
TRIS (g) 4929 4853 4772
HEAA (g) 072 144 230
AIBN (g) 0087 0087 0087
EtOAc (g) 120 120 120
Molar fraction (TRISHEAA) 095005 090010 085015
Sample A B and C were not further evaluated
Purification by precipitation
1 The weight of the crude polymer was adjusted to a 30 wt solution and added to a 250 mL
glass separation funnel
2 1500 mL of MeOH was added to a 2000 mL beaker
3 The copolymer solution was drop wise precipitated into the MeOH while constant stirring as
seen in Picture 2
4 The copolymer seen in Picture 3 (a white tacky soft solid) was then retrieved by pouring off
the solution and picking up the polymer and stored in a sealed cup
30
Some observations made during the purification step are
1 The copolymer precipitates as white threads 2 The copolymer is quite firm and non-sticky 3 The solution is clear until the end where it turns turbid and the copolymer is more tacky and
sticky
First purification method Sample A B and C were not further evaluated as they were purified by another method that proved
to be insufficient to purify polymers In the patent application the purification step was described as
washing the copolymer with MeOH hence in this project the procedure was interpreted into the
following
The copolymer was dried after the synthesis and then dissolved in 20 g EtOAc on that was added the
double amount of MeOH (40 g) The solution was stirred manually with a spoon or such and left to sit
for 24 hours The excess MeOHEtOAc was poured off after 24 hours and 40 g of MeOH was added
again In total the procedure was repeated three times According to NMR spectra there was more
than 10 monomer left after this purification step and that is why the method was disregarded
Sample A B C and 2 were purified by this method but since there was no time left to purify sample
A B and C according to the purification described above they were not further evaluated
As this method showed to be insufficient it was decided to proceed with a more commonly used
method see Chapter 3 - Synthesis and purification of copolymer
31
Appendix II ndash Formulation and contact angle
Formulation The copolymers were blended with a silicone adhesive (two component system) in ratio 120 The
procedure is as follows (poly[TRIS-co-MAA] is set as an example)
1 0798 g of copolymer was blended with a conventional PDMS at 5 wt (5016 g of component A and 5014 g of component B) prior to curing
2 The blend was mixed in a SpeedMixer DAC 150 FVX-K for 30 seconds at speed of 3 500 rpm 3 It was cast onto a PUR-coated film (thickness 20 microm) coating thickness of 300 microm 4 The film was cured on a heating plate 150 degC for 15 minutes
Since the copolymers (after purification) where not dried to a 100 calculations of the percentage of
solvent left had to be done before any formulations could be made
Calculating percentage of solvent left in the wet copolymer was performed as follows (taking Sample
1 as example)
1 343 g of copolymer was set to dry in an oven at 45degC 2 After one day the sample was weighted to 201 g 3 The weight difference is the amount of solvent in the wet copolymer
Table 9 Wt solvent in copolymer after purification
Sample Wet
weight (g) Dry
weight (g) wt solvent in wet
copolymer wt solvent in wet copolymer after
removal of some solvent [FINAL]
1 343 201 4139 3735
2 381 278 2703 2430
3 363 249 3140 2757
4 363 252 3057 2660
5 500 335 3300 1899
6 357 227 3641 2812
7 362 219 3950 2298
8 301 205 3189 2938
9 487 291 4024 3425 Table 10 (g) copolymer needed to acheive a 5 wt in the formulation blend (based on Table 10 last column)
Formulation (sample)
Wet copolymer (g) Component A (g) Component B (g) wt copolymer in
blend
1 0798 5016 5014 475
2 0655 5036 5057 468
3 0692 5018 5037 475
4 0678 5013 5024 472
5 0615 5028 5020 472
6 0698 5029 5023 475
7 0699 5027 5034 507
8 0716 5018 5050 478
9 0761 4968 4934 482
32
Contact angle Contact angle measurements were performed on a EASYDROP Contact Angle Measurement System
from KRUumlSS with DSA1 control and evaluating software
1 A sample size 2 cm x 5 cm was taken from each formulation 2 One sample at a time was put on the sample table see Picture 4 3 The sample was illuminated with a PC-controlled illumination 4 The syringe was filled with deionized water and a droplet size 3 microL was produced at the tip
of the needle and applied on the surface 5 Pressing start in the computer software system the measurements started and proceeded for
one minute 6 Three positions were tested on each sample
33
Appendix III ndash Results
MVTR For the calculations of the MVTR values Equation (1) was applied
(1)
where
In this experimental setup deionized water was used as liquid and the test period was set to 24
hours
Table 11 MVTR raw data (red-marked number is disregarded)
Formulation W1 (g) W2 (g) W1-W2 (g) Average (g)
1
2119196 2114015 05181
05299 2123917 2118254 05663
2130770 2125716 05054
2
2120806 2111452 09354
08383 2128864 2121294 0757
2114589 2106363 08226
3
2137987 2133518 04469
04917 2119481 2114588 04893
2134925 2129537 05388
4
2134925 2121103 13822
1058 2134836 2125515 09321
1938189 1929592 08597
5
2140372 2135713 04659
04681 2138197 2133245 04952
2124946 2120513 04433
6
2127705 2121994 05711
05937 2124817 2117913 06904
2147531 2142335 05196
7
2116362 2111662 04700
04701 2121055 2116317 04738
2126865 2122200 04665
8
2138735 2133730 05005
05050 2134656 2129915 04741
2107122 2101718 05404
9
2121140 2116611 04529
04998 2140479 2134419 06060
2135159 2130754 04405
R 2127272 2122760 04512
04412 2138336 2134024 04312
34
SEC
Figure 16 SEC of Sample B MW = 508 456 gmol
Figure 17 SEC of Sample C MW = 443 117 gmol
35
1H- NMR
Figure 18 NMR of Sample A
Figure 19 NMR of Sample B
36
Figure 20 NMR of Sample 2
Figure 21 NMR of Sample C
37
Figure 22 NMR of Sample 3
Figure 23 NMR of Sample 4
38
Figure 24 NMR of Sample 5
Figure 25 NMR of Sample 6
39
Figure 26 NMR of Sample 7
Figure 27 NMR of Sample 8
40
Figure 28 NMR of Sample 9

2
2 Theory
From sand to silicones The term silicone originates from the word silicon and ketone and refers to polysiloxanes Silicones
belong to the category of synthetic polymers whose backbone constitutes of Si-O-Si linkages The
silicon atoms can also be bonded to organic groups such as methyl groups (see Table 1) This basic
repeating unit is known as siloxane The most common silicone (and in largest volume produced) is
polydimethylsiloxane PDMS The silicone industry became viable after Rochows discovery in 1940
of the direct process where elemental silicon reacts with methylene chloride (MeCl) to form
methylchlorosilanes [3-5] When silica (sand) is reduced according to Scheme 1 in a carbo-electro
reduction process chemical grade silicon is produced The methyl chlorosilane (MCS) reaction is
shown in Scheme 2 [3]
Scheme 1 Carbo-electro reduction process
A critical factor in the MSC reaction is the selectivity for the dimethyldichlorosilane (Di) as PDMS is
made from hydrolysis of Di [3]
Scheme 2 MSC reaction
Silicon is tetravalent and may thus have one two or three organic substituents where the methyl
silicones have the most practical applications see Table 1
Table 1 Structural units of silicones
SiO2 + C SiO + SiC Si + CO
High voltage
gt 1200 degC
Si + MeCl
Me2SiCl2 (Di)
MeSiCl3 (Tri)
Me3SiCl (Mono)
MeHSiCl2 (MH)
Me2HSiCl (M2H)
Cu (3-5)
Zn (400-2000 ppm)
Sn (5-30 ppm)
Al (500-4000 ppm)
290-305 degC
3
Silicone curing The copolymers synthesized in this project will be formulated into a silicone based two component
system Blending of the two components (A and B) results in a hydrophobic cross-linked system
which is a PDMS crosslinked elastomer
Addition curing also known as hydrosilylation are two component systems based on a Pt-catalyzed
reaction that takes place between vinyl endblocked polymers and Si ndash H oligosiloxanes Both
components contain the vinyl endblocked polymer but one (component A) contains the catalyst (Pt)
and the other (component B) contains the crosslinker The crosslinking in this system is a
spontaneous reaction at room temperature but the rate can be increased if the temperature is
raised This leads to a far more shortened curing time The mechanism of the network formation
through addition curing is showed in Scheme 3 [4]
Scheme 3 Network formation through addition curing (Redrawn from [4])
Advantages using addition curing instead of other methods such as cross-linking by condensation
are that this method eliminates shrinkage as there are no by-products formed [5]
Silicone physicochemical properties
The element silicon is positioned just under carbon in the periodic table and this led to a belief that
silicon could replace carbon However there are very few similarities between silicon and carbon For
instance the Si-X bond is much larger than the C-X bond Si also has a lower electronegativity than C
and has thus more polar bonds The bond polarity contributes to strong
silicon bonding [5]
Silicones have the unusual combination of both high surface energy properties and low surface
energy properties The high surface energy comes from the inorganic chain similar to silicates
whereas the methyl groups which are organic contribute to the low surface energy Since the Si-O
bonds are polar they would lead to strong intermolecular interactions had they not been shielded by
the methyl groups The shielding is made easy by the high flexibility of the silicone chain There is
4
nearly free rotation around the Me2Si-O bond Despite the polar chain of silicones they have a low
critical surface tension of wetting [5]
Silicone biocompatibility
The definition of biocompatibility is the ability of a material to perform with an appropriate host
response in a specific application [6]
It was discovered in the mid-1940s that silicones due to their hydrophobic property prevented blood
from coagulating Silicones are used in long term implantations as they are chemically stable and
highly elastic and the first report of silicone elastomers being implanted in humans was in 1946 Dr
Frank H used silicone in a bile duct repair and reported that It is flexible it will stretch it will bounce
like a rubber and it can be cast into any shape [5] In 1948 Dr DeNicola implanted an artificial
urethra tube and reported 14 months after the implantation that the artificial urethra had been
retained with normal genito-urinary function [5] and that There is no evidence at this time that
the tube is acting as a foreign body irritant [5]
Silicones are widely used in various medical applications due to properties such as biocompatibility
and biodurability ndash which originate from silicones being hydrophobic chemically and thermally stable
materials with a low surface tension [5]
Adhesion When there is energy required to separate two bodies the two bodies are said to adhere and the
force necessary to break the bond between the two bodies is called practical adhesion Adhesion is
physical attraction between the surfaces of two materials and is dependent on the character of the
physical forces holding the atoms and molecules together [7 8]
So what is an adhesive Basically it is a material which joins materials when applied to their
surfaces and resist separation There are two characteristic properties an adhesive must possess [9]
1 An adhesive must spread on a surface having a contact angle approaching zero ndash it must wet
the surface The adhesive will be liquid of low viscosity when applied
2 The adhesive must harden and have high cohesive strength which is the strength of like
molecules to stick together The hardening can be achieved by loss of solvent chemical
reactions or by cooling if the adhesive is a hot melt There is one exception to this second
property and that is pressure-sensitive adhesives These are permanently sticky
There are six theories of adhesion which are physical adsorption chemical bonding electrostatic
attraction mechanical interlocking inter-diffusion and weak boundary layer theories For this
project the most relevant adhesion theories are physical adsorption and mechanical interlocking
These will be further described below
5
Figure 1 (a) mechanical interlocking (b) interdiffusion of chains (c) electrical interactions (d) chemical interactions (Redrawn from [10])
Physical adsorption
This theory involves van der Waals forces across the interface and attractions between permanent
and induced dipoles Since all materials have different polarities resulting from their electron cloud
they also have different adhesion An example is between metal and paper which are polar materials
and polyethylene (PE) and silicone which are non-polar Metal and paper easily adhere by any
adhesive while PE and silicone are more difficult to bond [9 11]
There are three types of forces of attraction between dipoles EPP (permanent dipoles) Epi
(permanent dipole and corresponding induced dipole) and Eii (instantaneously induced dipoles)
Between a pair of permanent dipoles distance r at their centers there is a potential energy EPP given
by equation (1)
(1)
where micro1 and micro2 are the dipole moments and ε0 is the permittivity in vacuum k the Boltzmanns
constant and T the absolute temperature
If there is a non-polar molecule close to a polar molecule then the latter will induce a dipole in the
former Equation (2) gives the induced dipole moment where E is the electric field and α is the
polarizability of the non-polar molecule
(2)
The potential energy in this case is Epi and given in equation (3) where micro1 is the dipole moment of the
permanent dipole
(3)
The third type of physical adsorption interaction is between two instantaneous dipoles These types
of dipoles exist in non-polar molecule as a result of fluctuating distribution of electrons The potential
energy is given by equation (4)
(4)
6
where α1 and α2 are the molecules polarizabilities and I1 and I2 are their ionization potentials [9]
Mechanical interlocking
A soft tacky adhesive can enter irregularities found in substrates with irregular surface see Figure 1
(a) This is called mechanical interlocking and it occurs when an adhesive can wet a surface creating
a bonding force Silicone pressure sensitive adhesives as silicones flow readily can penetrate into a
porous or rough substrate (such as skin) and create a mechanical bond [9 11]
Monomers used in the project
TRIS
3-[Tris(trimethylsiloxy)silyl]propyl methacrylate (TRIS) is a silicone based monomer with the chemical
formula C16H38O5Si4 Figure 2 illustrates the chemical structure TRIS is used as the basemonomer
and constitutes the largest part in the copolymers This is because TRIS has TMS groups short for
trimethylsilyl -Si(CH3)3 which makes it similar to PDMS and thus contributes to the good miscibility
with the PDMS [12]
Figure 2 TRIS monomer
TRIS belongs to the acrylate family and contains a vinyl group which is crucial for free radical
polymerization (see Chapter 2 Free radical polymerization in solution)
MAA
Metharcylic acid (MAA) is also a member of the acrylate family and has the chemical formula C4H6O2
Figure 3 illustrates the chemical structure of MAA [13]
Figure 3 MAA monomer
HEAA
N-Hydroxyethyl acrylamide (HEAA) with the chemical formula C5H9NO2 is an acrylamide having one
nitrogen replacing the oxygen seen in acrylates The chemical structure of HEAA is seen in Figure 4
[14]
7
Figure 4 HEAA monomer
NIPAM
N-Isopropylacrylamide (NIPAM) chemical formula C6H11NO and chemical structure illustrated in
Figure 5 [15]
Figure 5 NIPAM monomer
DMAEMA
2-(Dimethylamino)ethyl methacrylate (DMAEMA) C8H15NO2 This acrylate has the chemical structure
shown in Figure 6 [16]
Figure 6 DMAEMA monomer
Initiator AIBN
Azobisisobutyronitrile (AIBN) is a common initiator used in free radical polymerization Chemical
structure can be seen in Figure 7 [17]
Figure 7 AIBN initiator
Free radical polymerization in solution In free radical polymerization polymers are formed by the addition of free radical building blocks in
this project it is vinyl monomers added onto a growing chain When the polymerization is in a
solution the solvent facilitates heat transfer and also reduces viscosity of the medium However
complications of chain transfer may arise and thus selection of solvent must be carefully made
The polymerization proceeds in three stages (1) initiation an active center which acts as a chain
carrier is formed (2) propagation growth of the macromolecule by a kinetic chain mechanism where
monomers are added to the growing chain (3) termination the active center is transferred or
neutralized which stops the progress of the kinetic chain [18]
8
Initiation
The initiation step begins with an initiator that decomposes into free radicals R when subjected to
heat electromagnetic radiation or a chemical process see reaction (1) The free radical will have an
active center which is the location of the unpaired electrons The instability of the carbon double
bond of the monomer M makes it susceptive to reaction with the free radicalrsquos unpaired electrons
hence the active center of the free radical can ldquograbrdquo one electron from the double bond of the
monomer creating a new active center at the end of the chain as it leaves an unpaired electron [19]
(1)
The amount of generated radicals effective in the creation of a kinetic chain can be expressed as the
efficiency factor f (0-1) A low efficiency factor will lead to inefficient chain propagation and can be
due to several factors where one is primary recombination which is a result of to radicals combining
see reaction (2)
(2)
This can occur if the solution impedes the radical fragments leading to a cage effect The solvent
plays an important part in solution free-radical polymerization as the extent of decomposition of the
initiator varies with the solvent An example is the decomposition of benzoyl peroxide where in
tetrachloroethylene it only decomposes up to 35 while it is 85 in ethyl acetate [18]
Propagation
When the synthesis has been initiated it is followed by the propagation reaction In free radical
polymerization the propagation process usually takes place within a fraction of a second The
propagation steps are similar to the initiation where electrons are transferred and the active center
is moved down the chain see reaction (3)
(3)
The propagation comes to an end when the termination occurs [18]
Termination
The termination is the step where the active center is either transferred to another chain or
neutralized There are two ways in which the termination can take place by combination or
disproportionation
Combination
The termination reaction combination is between two end chains where they couple together to
form one long chain as seen in Scheme 4
9
Scheme 4 Combination of two growing chains into one polymer
Disproportionation
This occurs when hydrogen abstractions takes place in one end forming a carbon double bond and
resulting in two dead polymer chains see Scheme 5 [18]
Scheme 5 Disproportionation of two growing chains into two dead polymer chains
Chain transfer
Chain transfer occurs when the active center of a growing polymer is transferred to another species
through a collision There are several types of chain transfer In general hydrogen abstraction from
monomer initiator polymer solvent and modifier There are five concepts of chain transfer transfer
to monomer transfer to initiator transfer to polymer transfer to modifier and transfer to solvent
[18]
Copolymer equation When using two or more monomers in a free radical polymerization the term is known as
copolymerization By copolymerizing two monomers the properties of the resulting polymer are
often better than the properties for the parent homopolymers The simplest case of
copolymerization involves two monomers (eg M1 and M2) but can be presented in several different
structures within the copolymer such as Statistical copolymer Alternating copolymers Block
copolymers Graft copolymers and Stereoblock copolymer [18]
The copolymerization between two monomers M1 and M2 is presented in equations (51)-(54)
where k11k22 and k12k21 correspond to self-propagating and cross-propagating rate constants
respectively [18]
(51)
(52)
(53)
(54)
The rate of consumption of M1 can be determined according to equation (6) if steady state
conditions prevail and the radical activity only depends on the nature of the terminal unit [18]
10
(6)
The rate of consumption for M2 is then
(7)
By assuming that
the copolymer equation is obtained by dividing
equation (6) by equation (7) so that
(8)
where r1 and r2 represent relative reactivity ratios from and
Several limiting cases of r can be derived
block copolymerization since both reactivity ratios are larger than unity the propagating monomers prefer to react with themselves forming blocks of M1 and M2
block copolymerization since the reactivity ratios are much higher than unity there is no inclination for the monomers to react with each other leading to two homopolymers
ideal copolymerization the propagating species M1 and M2 have the same preference for adding one or the other resulting in a random copolymer
alternating copolymerization each of the two propagating species prefers adding the other monomer
M1 is more reactive toward both propagating species and the copolymer will contain more of the reactive monomer in statistical placement [20]
Characterization methods
Contact angle
The spreading or deformation of a water droplet on a solid surface is determined by the surface and
interfacial energies The contact angle θ is the angle under which the droplet meets the surface and
may be evaluated by taking into account the three interfacial tensions in Figure 8
ndash between surface and liquid
ndash between surface and gas
ndash between liquid and gas
Figure 8 Different contact angles of a water droplet on a solid surface
11
The contact angle is also a quantification of the wetting of the solid by the liquid and is determined
by Youngs equation
(9)
The lower θ the better the wetting Poorly wetting systems may eg be water on Teflon where the
water droplet rolls off the surface hence θ approaches 180deg The other opposite is when the liquid
spreads and covers the surface complete wetting is achieved and θ approaches 0deg [21 22]
Moisture vapor transmission rate (MVTR)
The definition of moisture vapor transmission rate (also water vapor transmission rate) is as follows
The rate of water vapor flow under steady specified conditions through a unit area of a material
between its two parallel surfaces and normal to the surfaces [23]
And the metric unit of measurements is
12
TRIS
MAA
5 mol
10 mol
15 mol
DMAEMA
5 mol
10 mol
15 mol
NIPAM
5 mol
10 mol
15 mol
HEAA
5 mol
10 mol
15 mol
3 Experimental
Chemicals Table 2 Chemicals used in this project
Monomers Solvents Initiator Silicone PSA
TRIS (from Sigma-Aldrich) EtOAc (from Sigma-Aldrich) AIBN (from
Chalmers) MED 6350 (from Nusil)
NIPAM (from Sigma-Aldrich) MeOH (from Sigma-Aldrich)
DMAEMA (from Sigma-
Aldrich)
MAA (from Sigma-Aldrich)
HEAA (from Sigma-Aldrich)
Methodology
Synthesis and purification of copolymer
In the synthesis of the copolymer monomer weight was kept at 50 g for all the experiments Amount
of initiator was kept at approximately 0087 g and the solvent was kept at 120 g generating a 30 wt
solution
The synthesis was carried out in a round bottom flask see Picture 1 placed in an oil bath holding 65
degC The two monomers (TRIS and MAADMAEMANIPAMHEAA) see Figure 9 were added to the
flask with solvent and initiator Stirring was important throughout the entire synthesis to promote
good mixing The synthesis for each copolymer lasted for six hours For more detailed description see
Appendix I
The copolymer solution was purified by precipitation in methanol see Picture 2 This is because the
copolymer is not soluble in methanol while the pure monomers are In Picture 3 the precipitated
copolymer is shown
Figure 9 A scheme of poly[TRIS]-combinations and molar percentages of MAADMAEMANIPAMHEAA
13
Formulation of copolymer and two component system Each copolymer was blended with MED 6350 (a commercial PDMS polymer) in a 120 ratio of
copolymer to MED 6350 The blends were cast onto PUR-films and then cured on a heating plate to
generate the final PSA For more details see Appendix II
Contact angle measurements The contact angle measurements were performed on the formulations above and not on the pure
copolymers Each formulated film was measured with the EASYDROP Contact angle Measurement
System see Picture 4 using deionized water Three positions were measured for every formulated
film during 60 seconds to ensure a correct average contact angle More details in Appendix II
Picture 1 Synthesis reaction set-up Picture 2 Copolymer purification set-up
Picture 3 A close-up of the precipitated copolymer
14
Picture 4 Contact angle measurement equipment
Moisture vapor transmission rate (ID T-1070)
A cylinder was filled with deionized water up to a level leaving a 5 mm air gap The produced films
from the formulations three specimens of each were punched out in a circular shape larger than the
opening of the cylinders The cylinder was covered with the specimen weighed and placed in an
oven (37degC) for 24 hours After 24 hours the cylinder with the specimen was weighed again and
moisture vapor transmission rate could be obtained by calculating the loss of water
NMR and SEC 1H NMR spectrum was recorded on a Varian 400 spectrometer The samples were dissolved in CDCl3
and the 1H NMR spectra were obtained at 298 K with CDCl3 as internal standard Size-exclusion
chromatography (SEC) was performed on a Waters Alliance 2000 GPCV at 135degC with 124-
trichlorobenzene as eluent at 1 mLmin using an RI-detector It was calibrated using polystyrene
standards
Failed method GF31 is a chemical similar to TRIS but much cheaper see Figure 10 and 11 The first synthesis was
therefore done with GF31 instead of TRIS The first polymerization was between GF31 and MAA
Table 3
Table 3 First synthesis between GF31 and MAA
Chemical Amount
GF31 11195 (g)
MAA 3754 (g)
EtOAc 350 (g) (+ 400 mL)
AIBN 095 (g)
This first synthesis was done in a batch size of 500 g A reactor with a built in heat controlled oil
circulation was used with a SVL multi-joint lid 5-NECK on top Through the center neck a mechanical
stirrer passed and through the others nitrogen gas was connected and in-let of chemicals occurred
15
the rest were sealed The synthesis progressed in the same manner as described in Chapter 3 ndash
Synthesis and purification of copolymer Problems faced here were leakage of solvent and GF31
interaction with MAA As seen in Table 3 an extra amount (400 mL) of EtOAc was added during the
synthesis due to fact that 80 of the solvent (EtOAc) had evaporated within six hours GF31 (since it
is different from TRIS) formed a type of hard brittle white copolymer instead of the expected clear
tough and rubbery copolymer The ndashSi-O-Me groups of GF31 are probably more reactive than the
TMS groups of TRIS leading to the hard brittle copolymer formed However the side group of
monomer GF31 is not flexible enough to form a soft polymer and less MAA would improve the
softness Even though later on the leakage problem was solved (by sealing the center neck better)
the reactor was disregarded as an optimal set-up and was replaced by round bottom flask (reactor
with batch size 150 g) with a rubber septa using TRIS instead of GF31
Figure 10 Chemical structure of TRIS Figure 11 Chemical structure of GF31
16
4 Results and discussion
Polymerization
Yield
The yield does not take into consideration amount of monomer left in the copolymer In Chapter 4 ndash
NMR calculations of copolymer composition and percentage of monomer left are made For some
copolymers eg sample 1 the yield is much lower than for the rest as seen in Table 4 This may be
due to loss of copolymer in the first purification method see Appendix I Sample 1 (15 MAA)
showed some solubility in MeOH which means that when excess MeOHEtOAc was poured off some
polymer residue may also have been poured off hence the lower yield Also in the precipitation
method the solution started to become turbid when all copolymer solution had been blended with
the MeOH this was a fact for all copolymers The EtOAc to MeOH ratio was probably too small and
the copolymer started to dissolve There was most likely some loss of copolymer in this step too It
would probably have been better to use a larger quantity MeOH to avoid dissolution of the
copolymer
The best yield was expected for sample 8-9 as they had not been purified by the first method first
and hence the loss of polymer was strictly restricted to the new method But as seen the yield is 63
for Sample 8 and 70 for sample 9
Sample 7-9 are the poly[TRIS-co-HEAA] copolymers Amount of HEAA increases from sample 7 to
sample 9 and hence increased hydrophilicity The reason to why there is a loss of polymer in the
purification step could be that the copolymer (as the HEAA increases) became more soluble in
MeOH But as seen in Table 4 sample 7-9 are the copolymers containing the highest amount of TRIS
This speaks against the possibility of increasing HEAA contributing to increased hydrophilicity and
thus making the copolymer soluble in MeOH Also sample 9 should be more soluble in MeOH than
sample 8 as it contains more HEAA The same behavior is seen in sample 4-6 (poly[TRIS-co-NIPAM])
where there is a larger loss of copolymer for sample 4 than for sample 6 It seems that the yield is
somewhat circumstantial
17
Table 4 Results from all evaluations
18
SEC ndash molecular weight
According to the patent application it is stated that the molecular weight is larger than 10 000 gmol
In Figure 12 and 13 and Appendix III Figure 16-17 all values show a MW well above 10 000 gmol at
the lowest 360 000 gmol and for the highest at 508 000 gmol SEC was only done on Sample A-C
see Table 4 and Sample 2 as the copolymers are TRIS-based it is assumed that the rest of the
copolymers possess a similar molecular weight The second peak in both figures represents some
low molecular substance probably monomer residue Before H-NMR measurements Sample 2 was
purified one more time see Appendix I First purification method
Figure 12 SEC of Sample 2 Mw = 360 000 gmol
Figure 13 SEC of Sample A MW= 485 000 gmol
19
1H- NMR
Figure 14 NMR of Sample 1
1H- NMR was done to be able to calculate the composition in the copolymer Calculations are shown
below on Figure 14
(10)
where xT and xM are fractions of TRIS and MAA in the copolymer respectively
(11)
Applying equation (10) into equation (11) and
(expected value is 85 )
The two peaks at 610 ppm and 554 ppm are from the double bonds in the two monomers
(12)
Where xMo is the fraction of monomer left in the copolymer
20
Since xT is 8075 of the copolymer composition xMo is then
According to the calculations above there is approximately 392 monomer residue left in the
copolymer That is quite a large difference to 108 left in sample A (calculated in the same manner
as above) which was purified by the first purification method see Appendix I First purification
method
Table 4 presents the copolymer compositions for each copolymer These data are not exact as the
integrals were calculated by hand in MestreNova an analytical chemistry software suite This results
in an inaccuracy that has to be taken into account and the data showed above has to be considered
as approximate values For all the copolymers there is a continuous increase of the comonomer
which is consistent with the expected values
One copolymer is standing out from the others and it is poly[TRIS-co-HEAA] (sample 7-9) The
expected (the input) percentage of HEAA was 5 ndash 10 ndash 15 but the output was approximately 3 ndash 5 ndash
10 which means that TRIS has less affinity for HEAA than for the rest of the monomers Hence one
can assume leading to TRIS being more reactive toward both propagating species
and the copolymer will contain more of the reactive monomer (TRIS) in statistical placement In
comparison TRIS to the other monomers the r values were as can be seen in
Table 4 where the output was larger than 5 ndash 10 ndash 15 for the comonomers (exception DMAEMA
where 5 was input and 239 was output)
As seen in Table 4 the amount of monomer left in the copolymer varies between 077 ndash 392 for
the polymer purified by precipitation For copolymers A-C the level of monomers left are much
higher (85 ndash 137 ) and this proves that the first purification method was insufficient
Contact angle measurements All contact angle measurements were performed on the formulated films and not on the pure
copolymers
As seen in Table 4 the contact angle (deg) of the copolymer formulations does not differ from the
reference formulation (pure MED 6350) especially much The contact angle was expected to be lower
than the reference but as seen it is higher for sample 7 The contact angle is in the interval 121deg -
128deg and is too narrow to say anything about whether the contact angle actually has been modified
or not One reason to why these measurements may not have been very accurate is the fact that the
angle was measured on a droplet that was out in the open Lights from the surroundings and air
conditioning in the room could have affected the measurements Observed during the measurement
was that the droplet size steadily decreased which either means that the droplet evaporates or that
the surface has changed Had these measurements been done in a closed environment of the
droplet then perhaps there would have been different values
Another fact to why there is such little change in the contact angle is that silicones are highly
hydrophobic materials and since there is a very small amount of hydrophilic material integrated in
the silicone a large difference in the contact angle is really not expected Had there been a large
21
difference in contact angle the possibility of migration within the formulation of the hydrophilic
copolymer could be a reason However that was not the case and is very unlikely since the
copolymers are large molecules and the probability of migration is therefore small
Moisture vapor transmission rate The higher MVTR the better vapor transmission As seen in Table 4 all formulations show higher
MVTR than the reference This means that the formulations containing the hydrophilic copolymers
actually breathe better and are more likely to let vapor through Sample 4 [poly(TRIS-co-NIPAM(5
mol))] has an MVTR that is 139 better than the reference The rest of the formulations show an
improvement between 6 ndash 90 As only three tests on each formulation was done it is not
statistically correct to say that there has been an improvement of the MVTR as there is no clear
standard deviation to take into account However all formulations show higher MVTR than the
reference
Figure 15 MVTR data for all samples Blue = values for each test Red = average
In the investigated patent application there was no MVTR-testing done However testing of wet
adhesion was done by taking a 1-inch by 15-inch strip of adhesive and attach it to the abdominal skin
of a human subject and removing it after 40-60 min of aerobic activity [2] According to their results
good wet adhesion was achieved with the formulation containing 5 mol NIPAM and weak wet
adhesion was achieved with the formulation containing 5 mol DMAEMA sample 4 (MVTR = 1058)
and 2 (MVTR = 838) respectively in this project These two formulations showed best MVTR results
and are in accordance with the patent application investigated Why the formulations with lower
amount of polar part showed the best MVTR values must be due to morphology However due to
monomer residue wet adhesion testing on humans was not possible
22
There were some formulations with bubbles in the film seen Picture 5 and 6 Especially sample 2 4
and 8 This may have affected the MVTR and contributed to a higher value than expected
Formulation 8 had also a large amount of bubbles but a low MVTR The bubbles may have been
caused by solvent or monomer evaporating or air that has been trapped during the speed mixing As
seen in Figure 15 there is one value for sample 4 that is well above the others Since the value is
almost 50 larger than the second highest value it could be faulty perhaps an increased amount of
bubbles in the film or leakage of the cylinder
Picture 5 From MVTR Representing sample 9 - 7 from left to right
Picture 6 From MVTR Representing sample 2 - 4 from left to right
23
5 Conclusions This study showed that synthesis of hydrophilic silicone copolymers can be relatively easy
performed and the molecular weight achieved was high (Mw gt 500 000 gmol)
1H- NMR showed that the composition in the copolymers was not as the feed monomer composition
For poly[TRIS-co-MAA] and poly[TRIS-co-NIPAM] there was a higher percentage of comonomer than
assumed while the values varied for poly[TRIS-co-DMAEMA] and for poly[TRIS-co-HEAA] there was a
lower percentage of comonomer NMR also indicated monomer residue left in the copolymers
between 077 ndash 392 indicating that the purification step needs to be optimized or repeated more
than once to remove monomers left in the copolymer
According to contact angle measurements wetting of the silicone surface was not greatly affected
As the addition of copolymer was only 5 wt and of those 5 wt only 5 ndash 15 mol contained a
hydrophilic part a large change in contact angle was not expected The contact angle was evaluated
as the patent application [2] stated large change in wet adhesion
The most relevant results for this project were the MVTR results as they portrayed the improvement
of the silicone PSA (pure MED 6350) The MVTR values showed an large increase in water vapor
permeability for sample 2 and 4 5 mol DMAEMA and 5 mol NIPAM respectively If there is a
correlation between good wet adhesion and MVTR = 1058 (sample 4) contra weak wet adhesion
and MVTR = 838 (sample 2) then it is possible to conclude that for the rest of the copolymer samples
(MVTR ltlt 800) no or little wet adhesion was achieved Why there was no radical improvement for
sample C and 3 and sample 5 and 6 (DMAEMA 10-15 mol and NIPAM 10-15 mol respectively)
can be due to the results of sample 2 and 4 being faulty The explanation could also be that the
values are correct and that the addition of only 5 mol was enough to change the morphology of
the film in a way generating a higher MVTR and increasing the mol of comonomer did not change
the morphology in the same way thus not generating a higher MVTR
Overall it can be concluded that this method is not optimal for increasing hydrophilicity of PSAs as
the method is somewhat complicated to perform and the purification of the copolymers is time
consuming and unsatisfactory However silicone compatible copolymers were successfully
synthesized and characterized Taking the data retrieved in regard many questions about the quality
of the patent application are raised
24
6 Future work For this project future work would be to further purify the copolymers and then evaluate their
adhesive properties directly on the skin This would give more realistic values to whether or not the
modified PSAs have achieved better wet adhesion or not Also to redo the formulations without
bubbles and once again measure MVTR To add more analysis in form of morphology analysis to se
whether or not there is a difference in structure between the different formulations
Another project of future work is to evaluate the new patent application from Convatec Technlogies
Inc [24] where PSAs are modified by the addition of a low molecular weight organic hydroxy
containing compound This method is more straight on and does not involve any complicated
synthesis or purification steps It is simply addition of a hydroxy containing compound to a PSA prior
to curing This may be an interesting study for future work
25
7 Acknowledgments Many people have been involved in this master thesis and I would like to thank them for their
support and help
Thanks to
Dennis Hansson and Lars Lindgren my supervisors at Moumllnlycke Health Care that have always been
available for questions taken a great interest in my work and been a great support
Everyone at the Columbus group at Moumllnlycke Health Care thanks for making my time here fun and
interesting
Anders Maringrtensson for helping me with SEC analysis at Chalmers
Renee Kroon for helping me with NMR analysis at Chalmers
Mats Andersson my examiner
Friends and family
26
References [1] Mechan S et al Amphiphilic Silicone Copolymers for Pressure Sensitive Adhesive Applications
Journal of Applied Polymer Science 2010 116 3265-3270
[2] Convatec Technologies Inc Pressure Sensitive Silicone Adhesives with Amphiphilic copolymers
WO2011005839A1 Publication date 13 January 2011
[3] Clarson J S et al Silicones and Silicone-Modified Materials American Chemical Society
Washington (2000)
[4] Pachaly B Achenbach F Herzig C Mautner K Silicones WILEY-VCH Wienheim (2005)
[5] Colas A and Curtis J Silicone Biomaterials History and Chemistry amp Medical Applications of
Silicones httpwwwdowcorningcomcontentpublishedlit52-1069-01pdf 2012-01-17
[6] Ratner Buddy D et al Biomaterials Science ndash An introduction to Materials in Medicine Elsevier
London (2004)
[7] Gay C Stickiness ndash some fundamentals of adhesion Integrative and Comparative Biology 2002
42 1123-1126
[8] V Pocius A Adhesion Kirk-Othmer Encyclopedia of Chemical Technology Vol 1 Page 501
(2002)
[9] John Comyn Adhesion Science Royal Society of Chemistry Paperbacks 1997
[10] Garbassi F et al Polymer surfaces ndash From Physics to Technology John Wiley amp Sons Chichester
(1998)
[11] Covert P Principles of Pressure Sensitive Adhesion httpwwwgluemachinerycomprinciples-
of-pressure-sensitive-adhesionhtml 2012-02-08
[12] TRIS
httpwwwsigmaaldrichcomcatalogProductDetaildoD7=0ampN5=SEARCH_CONCAT_PNO7CBRA
ND_KEYampN4=4461307CALDRICHampN25=0ampQS=ONampF=SPEC 2012-02-08
[13] MAA
httpwwwsigmaaldrichcomcatalogProductDetaildoD7=0ampN5=SEARCH_CONCAT_PNO7CBRA
ND_KEYampN4=640507CFLUKAampN25=0ampQS=ONampF=SPEC 2012-02-08
[14] HEAA
httpwwwsigmaaldrichcomcatalogProductDetaildoD7=0ampN5=SEARCH_CONCAT_PNO7CBRA
ND_KEYampN4=6979317CALDRICHampN25=0ampQS=ONampF=SPEC 2012-02-08
[15] NIPAM
httpwwwsigmaaldrichcomcatalogProductDetaildoD7=0ampN5=SEARCH_CONCAT_PNO7CBRA
ND_KEYampN4=4153247CALDRICHampN25=0ampQS=ONampF=SPEC 2012-02-08
27
[16] DMAEMA
httpwwwsigmaaldrichcomcatalogProductDetaildoD7=0ampN5=SEARCH_CONCAT_PNO7CBRA
ND_KEYampN4=2349077CALDRICHampN25=0ampQS=ONampF=SPEC 2012-02-08
[17] AIBN
httpwwwsigmaaldrichcomcatalogProductDetaildolang=enampN4=441090|ALDRICHampN5=SEARC
H_CONCAT_PNO|BRAND_KEYampF=SPEC 2012-02-09
[18] Cowie JMG and Arrighi V Polymers Chemistry and physics of modern materials Taylor amp
Francis Group (2008)
[19] Wound Care ndash MepilexreghttpwwwmolnlyckecomgbWound-Care-ProductsProduct-
selector---Wound-divisionTabsProductsMepilexactiveTab=3 2011-10-24
[20] Chain copolymerization
httpcesysueducnechemipolychemuploadfilesE585B1E8819AE59088pdf
2012-02-09
[21] Israelachivli Jacob N Intermolecular and surface forcesAcademic Press Burlington (2011)
[22] Lyklema J et al Fundamentals of interface and colloid science Academic press San Diego
(2000)
[23] Gooch Jan W Encyclopedic dictionary of polymers 2 Part 13 Page 815 (2011)
[24] Convatec Technologies Inc Silicone Gel Adhesive with Organic Polyhydroxy Compounds
WO2012003028A1 Publication date 5 January 2012
28
Appendix I ndash Synthesis and purification
The synthesis was carried out by combining TRIS with the other monomers see Figure 9 The
combination resulted in four copolymers divided into three categories variations of 95 90 and 85
mol of TRIS
The procedure for the synthesis of poly[TRIS]-based copolymers by free radical polymerization using
poly[TRIS-co-MAA] as an example is as follows
1 4947 g of TRIS and 056 g of MAA was added to a 250 ml round bottomed flask containing a
magnetic stirring bar
2 To the flask was added 120 g of EtOAc to afford a 30 wt solution
3 The flask was sealed with a rubber septa and flushed with with nitrogen for 10 minutes
4 The flask was then placed in an oil bath as seen in Picture 1
5 0087 g of AIBN dissolved in EtOAc was added to the flask when the temperature of the oil
bath reached 65
6 The reaction was continued for 6 hours and stirred at 65 under N2 atmosphere
7 The solution was poured into a plastic jar sealed and let to cool down to room temperature
Calculations of amount of TRIS and MAA needed for the poly(TRIS-co-MAA) sample 1 see below
(1)
MTRIS = 42281 gmol
MDMAEMA = 15721 gmol
MNIPAM = 11316 gmol
MMAA = 8606 gmol
MHEAA = 11513 gmol
(2)
(3)
(4)
=012316
29
See Table 5-8 for detailed composition of all monomers
Table 5 poly(TRIS-co-MAA)
Monomer Sample A Sample B Sample 1
TRIS (g) 4947 4890 4828
MAA (g) 056 111 178
AIBN (g) 0087 0088 0087
EtOAc (g) 120 120 120
Molar fraction (TRISMAA) 09470053 08990101 08470153
Table 6 poly(TRIS-co-DMAEMA)
Monomer Sample 2 Sample C Sample 3
TRIS (g) 4904 4802 4692
DMAEMA (g) 096 200 308
AIBN (g) 0087 0087 0087
EtOAc (g) 120 120 120
Molar fraction (TRISDMAEMA) 09505 089011 085015
Table 7 poly(TRIS-co-NIPAM)
Monomer Sample 4 Sample 5 Sample 6
TRIS (g) 4932 4856 4775
NIPAM (g) 070 144 225
AIBN (g) 0087 0087 0088
EtOAc (g) 120 120 120
Molar fraction (TRISNIPAM) 095005 090010 08515 Table 8 poly(TRIS-co-HEAA)
Monomer Sample 7 Sample 8 Sample 9
TRIS (g) 4929 4853 4772
HEAA (g) 072 144 230
AIBN (g) 0087 0087 0087
EtOAc (g) 120 120 120
Molar fraction (TRISHEAA) 095005 090010 085015
Sample A B and C were not further evaluated
Purification by precipitation
1 The weight of the crude polymer was adjusted to a 30 wt solution and added to a 250 mL
glass separation funnel
2 1500 mL of MeOH was added to a 2000 mL beaker
3 The copolymer solution was drop wise precipitated into the MeOH while constant stirring as
seen in Picture 2
4 The copolymer seen in Picture 3 (a white tacky soft solid) was then retrieved by pouring off
the solution and picking up the polymer and stored in a sealed cup
30
Some observations made during the purification step are
1 The copolymer precipitates as white threads 2 The copolymer is quite firm and non-sticky 3 The solution is clear until the end where it turns turbid and the copolymer is more tacky and
sticky
First purification method Sample A B and C were not further evaluated as they were purified by another method that proved
to be insufficient to purify polymers In the patent application the purification step was described as
washing the copolymer with MeOH hence in this project the procedure was interpreted into the
following
The copolymer was dried after the synthesis and then dissolved in 20 g EtOAc on that was added the
double amount of MeOH (40 g) The solution was stirred manually with a spoon or such and left to sit
for 24 hours The excess MeOHEtOAc was poured off after 24 hours and 40 g of MeOH was added
again In total the procedure was repeated three times According to NMR spectra there was more
than 10 monomer left after this purification step and that is why the method was disregarded
Sample A B C and 2 were purified by this method but since there was no time left to purify sample
A B and C according to the purification described above they were not further evaluated
As this method showed to be insufficient it was decided to proceed with a more commonly used
method see Chapter 3 - Synthesis and purification of copolymer
31
Appendix II ndash Formulation and contact angle
Formulation The copolymers were blended with a silicone adhesive (two component system) in ratio 120 The
procedure is as follows (poly[TRIS-co-MAA] is set as an example)
1 0798 g of copolymer was blended with a conventional PDMS at 5 wt (5016 g of component A and 5014 g of component B) prior to curing
2 The blend was mixed in a SpeedMixer DAC 150 FVX-K for 30 seconds at speed of 3 500 rpm 3 It was cast onto a PUR-coated film (thickness 20 microm) coating thickness of 300 microm 4 The film was cured on a heating plate 150 degC for 15 minutes
Since the copolymers (after purification) where not dried to a 100 calculations of the percentage of
solvent left had to be done before any formulations could be made
Calculating percentage of solvent left in the wet copolymer was performed as follows (taking Sample
1 as example)
1 343 g of copolymer was set to dry in an oven at 45degC 2 After one day the sample was weighted to 201 g 3 The weight difference is the amount of solvent in the wet copolymer
Table 9 Wt solvent in copolymer after purification
Sample Wet
weight (g) Dry
weight (g) wt solvent in wet
copolymer wt solvent in wet copolymer after
removal of some solvent [FINAL]
1 343 201 4139 3735
2 381 278 2703 2430
3 363 249 3140 2757
4 363 252 3057 2660
5 500 335 3300 1899
6 357 227 3641 2812
7 362 219 3950 2298
8 301 205 3189 2938
9 487 291 4024 3425 Table 10 (g) copolymer needed to acheive a 5 wt in the formulation blend (based on Table 10 last column)
Formulation (sample)
Wet copolymer (g) Component A (g) Component B (g) wt copolymer in
blend
1 0798 5016 5014 475
2 0655 5036 5057 468
3 0692 5018 5037 475
4 0678 5013 5024 472
5 0615 5028 5020 472
6 0698 5029 5023 475
7 0699 5027 5034 507
8 0716 5018 5050 478
9 0761 4968 4934 482
32
Contact angle Contact angle measurements were performed on a EASYDROP Contact Angle Measurement System
from KRUumlSS with DSA1 control and evaluating software
1 A sample size 2 cm x 5 cm was taken from each formulation 2 One sample at a time was put on the sample table see Picture 4 3 The sample was illuminated with a PC-controlled illumination 4 The syringe was filled with deionized water and a droplet size 3 microL was produced at the tip
of the needle and applied on the surface 5 Pressing start in the computer software system the measurements started and proceeded for
one minute 6 Three positions were tested on each sample
33
Appendix III ndash Results
MVTR For the calculations of the MVTR values Equation (1) was applied
(1)
where
In this experimental setup deionized water was used as liquid and the test period was set to 24
hours
Table 11 MVTR raw data (red-marked number is disregarded)
Formulation W1 (g) W2 (g) W1-W2 (g) Average (g)
1
2119196 2114015 05181
05299 2123917 2118254 05663
2130770 2125716 05054
2
2120806 2111452 09354
08383 2128864 2121294 0757
2114589 2106363 08226
3
2137987 2133518 04469
04917 2119481 2114588 04893
2134925 2129537 05388
4
2134925 2121103 13822
1058 2134836 2125515 09321
1938189 1929592 08597
5
2140372 2135713 04659
04681 2138197 2133245 04952
2124946 2120513 04433
6
2127705 2121994 05711
05937 2124817 2117913 06904
2147531 2142335 05196
7
2116362 2111662 04700
04701 2121055 2116317 04738
2126865 2122200 04665
8
2138735 2133730 05005
05050 2134656 2129915 04741
2107122 2101718 05404
9
2121140 2116611 04529
04998 2140479 2134419 06060
2135159 2130754 04405
R 2127272 2122760 04512
04412 2138336 2134024 04312
34
SEC
Figure 16 SEC of Sample B MW = 508 456 gmol
Figure 17 SEC of Sample C MW = 443 117 gmol
35
1H- NMR
Figure 18 NMR of Sample A
Figure 19 NMR of Sample B
36
Figure 20 NMR of Sample 2
Figure 21 NMR of Sample C
37
Figure 22 NMR of Sample 3
Figure 23 NMR of Sample 4
38
Figure 24 NMR of Sample 5
Figure 25 NMR of Sample 6
39
Figure 26 NMR of Sample 7
Figure 27 NMR of Sample 8
40
Figure 28 NMR of Sample 9

3
Silicone curing The copolymers synthesized in this project will be formulated into a silicone based two component
system Blending of the two components (A and B) results in a hydrophobic cross-linked system
which is a PDMS crosslinked elastomer
Addition curing also known as hydrosilylation are two component systems based on a Pt-catalyzed
reaction that takes place between vinyl endblocked polymers and Si ndash H oligosiloxanes Both
components contain the vinyl endblocked polymer but one (component A) contains the catalyst (Pt)
and the other (component B) contains the crosslinker The crosslinking in this system is a
spontaneous reaction at room temperature but the rate can be increased if the temperature is
raised This leads to a far more shortened curing time The mechanism of the network formation
through addition curing is showed in Scheme 3 [4]
Scheme 3 Network formation through addition curing (Redrawn from [4])
Advantages using addition curing instead of other methods such as cross-linking by condensation
are that this method eliminates shrinkage as there are no by-products formed [5]
Silicone physicochemical properties
The element silicon is positioned just under carbon in the periodic table and this led to a belief that
silicon could replace carbon However there are very few similarities between silicon and carbon For
instance the Si-X bond is much larger than the C-X bond Si also has a lower electronegativity than C
and has thus more polar bonds The bond polarity contributes to strong
silicon bonding [5]
Silicones have the unusual combination of both high surface energy properties and low surface
energy properties The high surface energy comes from the inorganic chain similar to silicates
whereas the methyl groups which are organic contribute to the low surface energy Since the Si-O
bonds are polar they would lead to strong intermolecular interactions had they not been shielded by
the methyl groups The shielding is made easy by the high flexibility of the silicone chain There is
4
nearly free rotation around the Me2Si-O bond Despite the polar chain of silicones they have a low
critical surface tension of wetting [5]
Silicone biocompatibility
The definition of biocompatibility is the ability of a material to perform with an appropriate host
response in a specific application [6]
It was discovered in the mid-1940s that silicones due to their hydrophobic property prevented blood
from coagulating Silicones are used in long term implantations as they are chemically stable and
highly elastic and the first report of silicone elastomers being implanted in humans was in 1946 Dr
Frank H used silicone in a bile duct repair and reported that It is flexible it will stretch it will bounce
like a rubber and it can be cast into any shape [5] In 1948 Dr DeNicola implanted an artificial
urethra tube and reported 14 months after the implantation that the artificial urethra had been
retained with normal genito-urinary function [5] and that There is no evidence at this time that
the tube is acting as a foreign body irritant [5]
Silicones are widely used in various medical applications due to properties such as biocompatibility
and biodurability ndash which originate from silicones being hydrophobic chemically and thermally stable
materials with a low surface tension [5]
Adhesion When there is energy required to separate two bodies the two bodies are said to adhere and the
force necessary to break the bond between the two bodies is called practical adhesion Adhesion is
physical attraction between the surfaces of two materials and is dependent on the character of the
physical forces holding the atoms and molecules together [7 8]
So what is an adhesive Basically it is a material which joins materials when applied to their
surfaces and resist separation There are two characteristic properties an adhesive must possess [9]
1 An adhesive must spread on a surface having a contact angle approaching zero ndash it must wet
the surface The adhesive will be liquid of low viscosity when applied
2 The adhesive must harden and have high cohesive strength which is the strength of like
molecules to stick together The hardening can be achieved by loss of solvent chemical
reactions or by cooling if the adhesive is a hot melt There is one exception to this second
property and that is pressure-sensitive adhesives These are permanently sticky
There are six theories of adhesion which are physical adsorption chemical bonding electrostatic
attraction mechanical interlocking inter-diffusion and weak boundary layer theories For this
project the most relevant adhesion theories are physical adsorption and mechanical interlocking
These will be further described below
5
Figure 1 (a) mechanical interlocking (b) interdiffusion of chains (c) electrical interactions (d) chemical interactions (Redrawn from [10])
Physical adsorption
This theory involves van der Waals forces across the interface and attractions between permanent
and induced dipoles Since all materials have different polarities resulting from their electron cloud
they also have different adhesion An example is between metal and paper which are polar materials
and polyethylene (PE) and silicone which are non-polar Metal and paper easily adhere by any
adhesive while PE and silicone are more difficult to bond [9 11]
There are three types of forces of attraction between dipoles EPP (permanent dipoles) Epi
(permanent dipole and corresponding induced dipole) and Eii (instantaneously induced dipoles)
Between a pair of permanent dipoles distance r at their centers there is a potential energy EPP given
by equation (1)
(1)
where micro1 and micro2 are the dipole moments and ε0 is the permittivity in vacuum k the Boltzmanns
constant and T the absolute temperature
If there is a non-polar molecule close to a polar molecule then the latter will induce a dipole in the
former Equation (2) gives the induced dipole moment where E is the electric field and α is the
polarizability of the non-polar molecule
(2)
The potential energy in this case is Epi and given in equation (3) where micro1 is the dipole moment of the
permanent dipole
(3)
The third type of physical adsorption interaction is between two instantaneous dipoles These types
of dipoles exist in non-polar molecule as a result of fluctuating distribution of electrons The potential
energy is given by equation (4)
(4)
6
where α1 and α2 are the molecules polarizabilities and I1 and I2 are their ionization potentials [9]
Mechanical interlocking
A soft tacky adhesive can enter irregularities found in substrates with irregular surface see Figure 1
(a) This is called mechanical interlocking and it occurs when an adhesive can wet a surface creating
a bonding force Silicone pressure sensitive adhesives as silicones flow readily can penetrate into a
porous or rough substrate (such as skin) and create a mechanical bond [9 11]
Monomers used in the project
TRIS
3-[Tris(trimethylsiloxy)silyl]propyl methacrylate (TRIS) is a silicone based monomer with the chemical
formula C16H38O5Si4 Figure 2 illustrates the chemical structure TRIS is used as the basemonomer
and constitutes the largest part in the copolymers This is because TRIS has TMS groups short for
trimethylsilyl -Si(CH3)3 which makes it similar to PDMS and thus contributes to the good miscibility
with the PDMS [12]
Figure 2 TRIS monomer
TRIS belongs to the acrylate family and contains a vinyl group which is crucial for free radical
polymerization (see Chapter 2 Free radical polymerization in solution)
MAA
Metharcylic acid (MAA) is also a member of the acrylate family and has the chemical formula C4H6O2
Figure 3 illustrates the chemical structure of MAA [13]
Figure 3 MAA monomer
HEAA
N-Hydroxyethyl acrylamide (HEAA) with the chemical formula C5H9NO2 is an acrylamide having one
nitrogen replacing the oxygen seen in acrylates The chemical structure of HEAA is seen in Figure 4
[14]
7
Figure 4 HEAA monomer
NIPAM
N-Isopropylacrylamide (NIPAM) chemical formula C6H11NO and chemical structure illustrated in
Figure 5 [15]
Figure 5 NIPAM monomer
DMAEMA
2-(Dimethylamino)ethyl methacrylate (DMAEMA) C8H15NO2 This acrylate has the chemical structure
shown in Figure 6 [16]
Figure 6 DMAEMA monomer
Initiator AIBN
Azobisisobutyronitrile (AIBN) is a common initiator used in free radical polymerization Chemical
structure can be seen in Figure 7 [17]
Figure 7 AIBN initiator
Free radical polymerization in solution In free radical polymerization polymers are formed by the addition of free radical building blocks in
this project it is vinyl monomers added onto a growing chain When the polymerization is in a
solution the solvent facilitates heat transfer and also reduces viscosity of the medium However
complications of chain transfer may arise and thus selection of solvent must be carefully made
The polymerization proceeds in three stages (1) initiation an active center which acts as a chain
carrier is formed (2) propagation growth of the macromolecule by a kinetic chain mechanism where
monomers are added to the growing chain (3) termination the active center is transferred or
neutralized which stops the progress of the kinetic chain [18]
8
Initiation
The initiation step begins with an initiator that decomposes into free radicals R when subjected to
heat electromagnetic radiation or a chemical process see reaction (1) The free radical will have an
active center which is the location of the unpaired electrons The instability of the carbon double
bond of the monomer M makes it susceptive to reaction with the free radicalrsquos unpaired electrons
hence the active center of the free radical can ldquograbrdquo one electron from the double bond of the
monomer creating a new active center at the end of the chain as it leaves an unpaired electron [19]
(1)
The amount of generated radicals effective in the creation of a kinetic chain can be expressed as the
efficiency factor f (0-1) A low efficiency factor will lead to inefficient chain propagation and can be
due to several factors where one is primary recombination which is a result of to radicals combining
see reaction (2)
(2)
This can occur if the solution impedes the radical fragments leading to a cage effect The solvent
plays an important part in solution free-radical polymerization as the extent of decomposition of the
initiator varies with the solvent An example is the decomposition of benzoyl peroxide where in
tetrachloroethylene it only decomposes up to 35 while it is 85 in ethyl acetate [18]
Propagation
When the synthesis has been initiated it is followed by the propagation reaction In free radical
polymerization the propagation process usually takes place within a fraction of a second The
propagation steps are similar to the initiation where electrons are transferred and the active center
is moved down the chain see reaction (3)
(3)
The propagation comes to an end when the termination occurs [18]
Termination
The termination is the step where the active center is either transferred to another chain or
neutralized There are two ways in which the termination can take place by combination or
disproportionation
Combination
The termination reaction combination is between two end chains where they couple together to
form one long chain as seen in Scheme 4
9
Scheme 4 Combination of two growing chains into one polymer
Disproportionation
This occurs when hydrogen abstractions takes place in one end forming a carbon double bond and
resulting in two dead polymer chains see Scheme 5 [18]
Scheme 5 Disproportionation of two growing chains into two dead polymer chains
Chain transfer
Chain transfer occurs when the active center of a growing polymer is transferred to another species
through a collision There are several types of chain transfer In general hydrogen abstraction from
monomer initiator polymer solvent and modifier There are five concepts of chain transfer transfer
to monomer transfer to initiator transfer to polymer transfer to modifier and transfer to solvent
[18]
Copolymer equation When using two or more monomers in a free radical polymerization the term is known as
copolymerization By copolymerizing two monomers the properties of the resulting polymer are
often better than the properties for the parent homopolymers The simplest case of
copolymerization involves two monomers (eg M1 and M2) but can be presented in several different
structures within the copolymer such as Statistical copolymer Alternating copolymers Block
copolymers Graft copolymers and Stereoblock copolymer [18]
The copolymerization between two monomers M1 and M2 is presented in equations (51)-(54)
where k11k22 and k12k21 correspond to self-propagating and cross-propagating rate constants
respectively [18]
(51)
(52)
(53)
(54)
The rate of consumption of M1 can be determined according to equation (6) if steady state
conditions prevail and the radical activity only depends on the nature of the terminal unit [18]
10
(6)
The rate of consumption for M2 is then
(7)
By assuming that
the copolymer equation is obtained by dividing
equation (6) by equation (7) so that
(8)
where r1 and r2 represent relative reactivity ratios from and
Several limiting cases of r can be derived
block copolymerization since both reactivity ratios are larger than unity the propagating monomers prefer to react with themselves forming blocks of M1 and M2
block copolymerization since the reactivity ratios are much higher than unity there is no inclination for the monomers to react with each other leading to two homopolymers
ideal copolymerization the propagating species M1 and M2 have the same preference for adding one or the other resulting in a random copolymer
alternating copolymerization each of the two propagating species prefers adding the other monomer
M1 is more reactive toward both propagating species and the copolymer will contain more of the reactive monomer in statistical placement [20]
Characterization methods
Contact angle
The spreading or deformation of a water droplet on a solid surface is determined by the surface and
interfacial energies The contact angle θ is the angle under which the droplet meets the surface and
may be evaluated by taking into account the three interfacial tensions in Figure 8
ndash between surface and liquid
ndash between surface and gas
ndash between liquid and gas
Figure 8 Different contact angles of a water droplet on a solid surface
11
The contact angle is also a quantification of the wetting of the solid by the liquid and is determined
by Youngs equation
(9)
The lower θ the better the wetting Poorly wetting systems may eg be water on Teflon where the
water droplet rolls off the surface hence θ approaches 180deg The other opposite is when the liquid
spreads and covers the surface complete wetting is achieved and θ approaches 0deg [21 22]
Moisture vapor transmission rate (MVTR)
The definition of moisture vapor transmission rate (also water vapor transmission rate) is as follows
The rate of water vapor flow under steady specified conditions through a unit area of a material
between its two parallel surfaces and normal to the surfaces [23]
And the metric unit of measurements is
12
TRIS
MAA
5 mol
10 mol
15 mol
DMAEMA
5 mol
10 mol
15 mol
NIPAM
5 mol
10 mol
15 mol
HEAA
5 mol
10 mol
15 mol
3 Experimental
Chemicals Table 2 Chemicals used in this project
Monomers Solvents Initiator Silicone PSA
TRIS (from Sigma-Aldrich) EtOAc (from Sigma-Aldrich) AIBN (from
Chalmers) MED 6350 (from Nusil)
NIPAM (from Sigma-Aldrich) MeOH (from Sigma-Aldrich)
DMAEMA (from Sigma-
Aldrich)
MAA (from Sigma-Aldrich)
HEAA (from Sigma-Aldrich)
Methodology
Synthesis and purification of copolymer
In the synthesis of the copolymer monomer weight was kept at 50 g for all the experiments Amount
of initiator was kept at approximately 0087 g and the solvent was kept at 120 g generating a 30 wt
solution
The synthesis was carried out in a round bottom flask see Picture 1 placed in an oil bath holding 65
degC The two monomers (TRIS and MAADMAEMANIPAMHEAA) see Figure 9 were added to the
flask with solvent and initiator Stirring was important throughout the entire synthesis to promote
good mixing The synthesis for each copolymer lasted for six hours For more detailed description see
Appendix I
The copolymer solution was purified by precipitation in methanol see Picture 2 This is because the
copolymer is not soluble in methanol while the pure monomers are In Picture 3 the precipitated
copolymer is shown
Figure 9 A scheme of poly[TRIS]-combinations and molar percentages of MAADMAEMANIPAMHEAA
13
Formulation of copolymer and two component system Each copolymer was blended with MED 6350 (a commercial PDMS polymer) in a 120 ratio of
copolymer to MED 6350 The blends were cast onto PUR-films and then cured on a heating plate to
generate the final PSA For more details see Appendix II
Contact angle measurements The contact angle measurements were performed on the formulations above and not on the pure
copolymers Each formulated film was measured with the EASYDROP Contact angle Measurement
System see Picture 4 using deionized water Three positions were measured for every formulated
film during 60 seconds to ensure a correct average contact angle More details in Appendix II
Picture 1 Synthesis reaction set-up Picture 2 Copolymer purification set-up
Picture 3 A close-up of the precipitated copolymer
14
Picture 4 Contact angle measurement equipment
Moisture vapor transmission rate (ID T-1070)
A cylinder was filled with deionized water up to a level leaving a 5 mm air gap The produced films
from the formulations three specimens of each were punched out in a circular shape larger than the
opening of the cylinders The cylinder was covered with the specimen weighed and placed in an
oven (37degC) for 24 hours After 24 hours the cylinder with the specimen was weighed again and
moisture vapor transmission rate could be obtained by calculating the loss of water
NMR and SEC 1H NMR spectrum was recorded on a Varian 400 spectrometer The samples were dissolved in CDCl3
and the 1H NMR spectra were obtained at 298 K with CDCl3 as internal standard Size-exclusion
chromatography (SEC) was performed on a Waters Alliance 2000 GPCV at 135degC with 124-
trichlorobenzene as eluent at 1 mLmin using an RI-detector It was calibrated using polystyrene
standards
Failed method GF31 is a chemical similar to TRIS but much cheaper see Figure 10 and 11 The first synthesis was
therefore done with GF31 instead of TRIS The first polymerization was between GF31 and MAA
Table 3
Table 3 First synthesis between GF31 and MAA
Chemical Amount
GF31 11195 (g)
MAA 3754 (g)
EtOAc 350 (g) (+ 400 mL)
AIBN 095 (g)
This first synthesis was done in a batch size of 500 g A reactor with a built in heat controlled oil
circulation was used with a SVL multi-joint lid 5-NECK on top Through the center neck a mechanical
stirrer passed and through the others nitrogen gas was connected and in-let of chemicals occurred
15
the rest were sealed The synthesis progressed in the same manner as described in Chapter 3 ndash
Synthesis and purification of copolymer Problems faced here were leakage of solvent and GF31
interaction with MAA As seen in Table 3 an extra amount (400 mL) of EtOAc was added during the
synthesis due to fact that 80 of the solvent (EtOAc) had evaporated within six hours GF31 (since it
is different from TRIS) formed a type of hard brittle white copolymer instead of the expected clear
tough and rubbery copolymer The ndashSi-O-Me groups of GF31 are probably more reactive than the
TMS groups of TRIS leading to the hard brittle copolymer formed However the side group of
monomer GF31 is not flexible enough to form a soft polymer and less MAA would improve the
softness Even though later on the leakage problem was solved (by sealing the center neck better)
the reactor was disregarded as an optimal set-up and was replaced by round bottom flask (reactor
with batch size 150 g) with a rubber septa using TRIS instead of GF31
Figure 10 Chemical structure of TRIS Figure 11 Chemical structure of GF31
16
4 Results and discussion
Polymerization
Yield
The yield does not take into consideration amount of monomer left in the copolymer In Chapter 4 ndash
NMR calculations of copolymer composition and percentage of monomer left are made For some
copolymers eg sample 1 the yield is much lower than for the rest as seen in Table 4 This may be
due to loss of copolymer in the first purification method see Appendix I Sample 1 (15 MAA)
showed some solubility in MeOH which means that when excess MeOHEtOAc was poured off some
polymer residue may also have been poured off hence the lower yield Also in the precipitation
method the solution started to become turbid when all copolymer solution had been blended with
the MeOH this was a fact for all copolymers The EtOAc to MeOH ratio was probably too small and
the copolymer started to dissolve There was most likely some loss of copolymer in this step too It
would probably have been better to use a larger quantity MeOH to avoid dissolution of the
copolymer
The best yield was expected for sample 8-9 as they had not been purified by the first method first
and hence the loss of polymer was strictly restricted to the new method But as seen the yield is 63
for Sample 8 and 70 for sample 9
Sample 7-9 are the poly[TRIS-co-HEAA] copolymers Amount of HEAA increases from sample 7 to
sample 9 and hence increased hydrophilicity The reason to why there is a loss of polymer in the
purification step could be that the copolymer (as the HEAA increases) became more soluble in
MeOH But as seen in Table 4 sample 7-9 are the copolymers containing the highest amount of TRIS
This speaks against the possibility of increasing HEAA contributing to increased hydrophilicity and
thus making the copolymer soluble in MeOH Also sample 9 should be more soluble in MeOH than
sample 8 as it contains more HEAA The same behavior is seen in sample 4-6 (poly[TRIS-co-NIPAM])
where there is a larger loss of copolymer for sample 4 than for sample 6 It seems that the yield is
somewhat circumstantial
17
Table 4 Results from all evaluations
18
SEC ndash molecular weight
According to the patent application it is stated that the molecular weight is larger than 10 000 gmol
In Figure 12 and 13 and Appendix III Figure 16-17 all values show a MW well above 10 000 gmol at
the lowest 360 000 gmol and for the highest at 508 000 gmol SEC was only done on Sample A-C
see Table 4 and Sample 2 as the copolymers are TRIS-based it is assumed that the rest of the
copolymers possess a similar molecular weight The second peak in both figures represents some
low molecular substance probably monomer residue Before H-NMR measurements Sample 2 was
purified one more time see Appendix I First purification method
Figure 12 SEC of Sample 2 Mw = 360 000 gmol
Figure 13 SEC of Sample A MW= 485 000 gmol
19
1H- NMR
Figure 14 NMR of Sample 1
1H- NMR was done to be able to calculate the composition in the copolymer Calculations are shown
below on Figure 14
(10)
where xT and xM are fractions of TRIS and MAA in the copolymer respectively
(11)
Applying equation (10) into equation (11) and
(expected value is 85 )
The two peaks at 610 ppm and 554 ppm are from the double bonds in the two monomers
(12)
Where xMo is the fraction of monomer left in the copolymer
20
Since xT is 8075 of the copolymer composition xMo is then
According to the calculations above there is approximately 392 monomer residue left in the
copolymer That is quite a large difference to 108 left in sample A (calculated in the same manner
as above) which was purified by the first purification method see Appendix I First purification
method
Table 4 presents the copolymer compositions for each copolymer These data are not exact as the
integrals were calculated by hand in MestreNova an analytical chemistry software suite This results
in an inaccuracy that has to be taken into account and the data showed above has to be considered
as approximate values For all the copolymers there is a continuous increase of the comonomer
which is consistent with the expected values
One copolymer is standing out from the others and it is poly[TRIS-co-HEAA] (sample 7-9) The
expected (the input) percentage of HEAA was 5 ndash 10 ndash 15 but the output was approximately 3 ndash 5 ndash
10 which means that TRIS has less affinity for HEAA than for the rest of the monomers Hence one
can assume leading to TRIS being more reactive toward both propagating species
and the copolymer will contain more of the reactive monomer (TRIS) in statistical placement In
comparison TRIS to the other monomers the r values were as can be seen in
Table 4 where the output was larger than 5 ndash 10 ndash 15 for the comonomers (exception DMAEMA
where 5 was input and 239 was output)
As seen in Table 4 the amount of monomer left in the copolymer varies between 077 ndash 392 for
the polymer purified by precipitation For copolymers A-C the level of monomers left are much
higher (85 ndash 137 ) and this proves that the first purification method was insufficient
Contact angle measurements All contact angle measurements were performed on the formulated films and not on the pure
copolymers
As seen in Table 4 the contact angle (deg) of the copolymer formulations does not differ from the
reference formulation (pure MED 6350) especially much The contact angle was expected to be lower
than the reference but as seen it is higher for sample 7 The contact angle is in the interval 121deg -
128deg and is too narrow to say anything about whether the contact angle actually has been modified
or not One reason to why these measurements may not have been very accurate is the fact that the
angle was measured on a droplet that was out in the open Lights from the surroundings and air
conditioning in the room could have affected the measurements Observed during the measurement
was that the droplet size steadily decreased which either means that the droplet evaporates or that
the surface has changed Had these measurements been done in a closed environment of the
droplet then perhaps there would have been different values
Another fact to why there is such little change in the contact angle is that silicones are highly
hydrophobic materials and since there is a very small amount of hydrophilic material integrated in
the silicone a large difference in the contact angle is really not expected Had there been a large
21
difference in contact angle the possibility of migration within the formulation of the hydrophilic
copolymer could be a reason However that was not the case and is very unlikely since the
copolymers are large molecules and the probability of migration is therefore small
Moisture vapor transmission rate The higher MVTR the better vapor transmission As seen in Table 4 all formulations show higher
MVTR than the reference This means that the formulations containing the hydrophilic copolymers
actually breathe better and are more likely to let vapor through Sample 4 [poly(TRIS-co-NIPAM(5
mol))] has an MVTR that is 139 better than the reference The rest of the formulations show an
improvement between 6 ndash 90 As only three tests on each formulation was done it is not
statistically correct to say that there has been an improvement of the MVTR as there is no clear
standard deviation to take into account However all formulations show higher MVTR than the
reference
Figure 15 MVTR data for all samples Blue = values for each test Red = average
In the investigated patent application there was no MVTR-testing done However testing of wet
adhesion was done by taking a 1-inch by 15-inch strip of adhesive and attach it to the abdominal skin
of a human subject and removing it after 40-60 min of aerobic activity [2] According to their results
good wet adhesion was achieved with the formulation containing 5 mol NIPAM and weak wet
adhesion was achieved with the formulation containing 5 mol DMAEMA sample 4 (MVTR = 1058)
and 2 (MVTR = 838) respectively in this project These two formulations showed best MVTR results
and are in accordance with the patent application investigated Why the formulations with lower
amount of polar part showed the best MVTR values must be due to morphology However due to
monomer residue wet adhesion testing on humans was not possible
22
There were some formulations with bubbles in the film seen Picture 5 and 6 Especially sample 2 4
and 8 This may have affected the MVTR and contributed to a higher value than expected
Formulation 8 had also a large amount of bubbles but a low MVTR The bubbles may have been
caused by solvent or monomer evaporating or air that has been trapped during the speed mixing As
seen in Figure 15 there is one value for sample 4 that is well above the others Since the value is
almost 50 larger than the second highest value it could be faulty perhaps an increased amount of
bubbles in the film or leakage of the cylinder
Picture 5 From MVTR Representing sample 9 - 7 from left to right
Picture 6 From MVTR Representing sample 2 - 4 from left to right
23
5 Conclusions This study showed that synthesis of hydrophilic silicone copolymers can be relatively easy
performed and the molecular weight achieved was high (Mw gt 500 000 gmol)
1H- NMR showed that the composition in the copolymers was not as the feed monomer composition
For poly[TRIS-co-MAA] and poly[TRIS-co-NIPAM] there was a higher percentage of comonomer than
assumed while the values varied for poly[TRIS-co-DMAEMA] and for poly[TRIS-co-HEAA] there was a
lower percentage of comonomer NMR also indicated monomer residue left in the copolymers
between 077 ndash 392 indicating that the purification step needs to be optimized or repeated more
than once to remove monomers left in the copolymer
According to contact angle measurements wetting of the silicone surface was not greatly affected
As the addition of copolymer was only 5 wt and of those 5 wt only 5 ndash 15 mol contained a
hydrophilic part a large change in contact angle was not expected The contact angle was evaluated
as the patent application [2] stated large change in wet adhesion
The most relevant results for this project were the MVTR results as they portrayed the improvement
of the silicone PSA (pure MED 6350) The MVTR values showed an large increase in water vapor
permeability for sample 2 and 4 5 mol DMAEMA and 5 mol NIPAM respectively If there is a
correlation between good wet adhesion and MVTR = 1058 (sample 4) contra weak wet adhesion
and MVTR = 838 (sample 2) then it is possible to conclude that for the rest of the copolymer samples
(MVTR ltlt 800) no or little wet adhesion was achieved Why there was no radical improvement for
sample C and 3 and sample 5 and 6 (DMAEMA 10-15 mol and NIPAM 10-15 mol respectively)
can be due to the results of sample 2 and 4 being faulty The explanation could also be that the
values are correct and that the addition of only 5 mol was enough to change the morphology of
the film in a way generating a higher MVTR and increasing the mol of comonomer did not change
the morphology in the same way thus not generating a higher MVTR
Overall it can be concluded that this method is not optimal for increasing hydrophilicity of PSAs as
the method is somewhat complicated to perform and the purification of the copolymers is time
consuming and unsatisfactory However silicone compatible copolymers were successfully
synthesized and characterized Taking the data retrieved in regard many questions about the quality
of the patent application are raised
24
6 Future work For this project future work would be to further purify the copolymers and then evaluate their
adhesive properties directly on the skin This would give more realistic values to whether or not the
modified PSAs have achieved better wet adhesion or not Also to redo the formulations without
bubbles and once again measure MVTR To add more analysis in form of morphology analysis to se
whether or not there is a difference in structure between the different formulations
Another project of future work is to evaluate the new patent application from Convatec Technlogies
Inc [24] where PSAs are modified by the addition of a low molecular weight organic hydroxy
containing compound This method is more straight on and does not involve any complicated
synthesis or purification steps It is simply addition of a hydroxy containing compound to a PSA prior
to curing This may be an interesting study for future work
25
7 Acknowledgments Many people have been involved in this master thesis and I would like to thank them for their
support and help
Thanks to
Dennis Hansson and Lars Lindgren my supervisors at Moumllnlycke Health Care that have always been
available for questions taken a great interest in my work and been a great support
Everyone at the Columbus group at Moumllnlycke Health Care thanks for making my time here fun and
interesting
Anders Maringrtensson for helping me with SEC analysis at Chalmers
Renee Kroon for helping me with NMR analysis at Chalmers
Mats Andersson my examiner
Friends and family
26
References [1] Mechan S et al Amphiphilic Silicone Copolymers for Pressure Sensitive Adhesive Applications
Journal of Applied Polymer Science 2010 116 3265-3270
[2] Convatec Technologies Inc Pressure Sensitive Silicone Adhesives with Amphiphilic copolymers
WO2011005839A1 Publication date 13 January 2011
[3] Clarson J S et al Silicones and Silicone-Modified Materials American Chemical Society
Washington (2000)
[4] Pachaly B Achenbach F Herzig C Mautner K Silicones WILEY-VCH Wienheim (2005)
[5] Colas A and Curtis J Silicone Biomaterials History and Chemistry amp Medical Applications of
Silicones httpwwwdowcorningcomcontentpublishedlit52-1069-01pdf 2012-01-17
[6] Ratner Buddy D et al Biomaterials Science ndash An introduction to Materials in Medicine Elsevier
London (2004)
[7] Gay C Stickiness ndash some fundamentals of adhesion Integrative and Comparative Biology 2002
42 1123-1126
[8] V Pocius A Adhesion Kirk-Othmer Encyclopedia of Chemical Technology Vol 1 Page 501
(2002)
[9] John Comyn Adhesion Science Royal Society of Chemistry Paperbacks 1997
[10] Garbassi F et al Polymer surfaces ndash From Physics to Technology John Wiley amp Sons Chichester
(1998)
[11] Covert P Principles of Pressure Sensitive Adhesion httpwwwgluemachinerycomprinciples-
of-pressure-sensitive-adhesionhtml 2012-02-08
[12] TRIS
httpwwwsigmaaldrichcomcatalogProductDetaildoD7=0ampN5=SEARCH_CONCAT_PNO7CBRA
ND_KEYampN4=4461307CALDRICHampN25=0ampQS=ONampF=SPEC 2012-02-08
[13] MAA
httpwwwsigmaaldrichcomcatalogProductDetaildoD7=0ampN5=SEARCH_CONCAT_PNO7CBRA
ND_KEYampN4=640507CFLUKAampN25=0ampQS=ONampF=SPEC 2012-02-08
[14] HEAA
httpwwwsigmaaldrichcomcatalogProductDetaildoD7=0ampN5=SEARCH_CONCAT_PNO7CBRA
ND_KEYampN4=6979317CALDRICHampN25=0ampQS=ONampF=SPEC 2012-02-08
[15] NIPAM
httpwwwsigmaaldrichcomcatalogProductDetaildoD7=0ampN5=SEARCH_CONCAT_PNO7CBRA
ND_KEYampN4=4153247CALDRICHampN25=0ampQS=ONampF=SPEC 2012-02-08
27
[16] DMAEMA
httpwwwsigmaaldrichcomcatalogProductDetaildoD7=0ampN5=SEARCH_CONCAT_PNO7CBRA
ND_KEYampN4=2349077CALDRICHampN25=0ampQS=ONampF=SPEC 2012-02-08
[17] AIBN
httpwwwsigmaaldrichcomcatalogProductDetaildolang=enampN4=441090|ALDRICHampN5=SEARC
H_CONCAT_PNO|BRAND_KEYampF=SPEC 2012-02-09
[18] Cowie JMG and Arrighi V Polymers Chemistry and physics of modern materials Taylor amp
Francis Group (2008)
[19] Wound Care ndash MepilexreghttpwwwmolnlyckecomgbWound-Care-ProductsProduct-
selector---Wound-divisionTabsProductsMepilexactiveTab=3 2011-10-24
[20] Chain copolymerization
httpcesysueducnechemipolychemuploadfilesE585B1E8819AE59088pdf
2012-02-09
[21] Israelachivli Jacob N Intermolecular and surface forcesAcademic Press Burlington (2011)
[22] Lyklema J et al Fundamentals of interface and colloid science Academic press San Diego
(2000)
[23] Gooch Jan W Encyclopedic dictionary of polymers 2 Part 13 Page 815 (2011)
[24] Convatec Technologies Inc Silicone Gel Adhesive with Organic Polyhydroxy Compounds
WO2012003028A1 Publication date 5 January 2012
28
Appendix I ndash Synthesis and purification
The synthesis was carried out by combining TRIS with the other monomers see Figure 9 The
combination resulted in four copolymers divided into three categories variations of 95 90 and 85
mol of TRIS
The procedure for the synthesis of poly[TRIS]-based copolymers by free radical polymerization using
poly[TRIS-co-MAA] as an example is as follows
1 4947 g of TRIS and 056 g of MAA was added to a 250 ml round bottomed flask containing a
magnetic stirring bar
2 To the flask was added 120 g of EtOAc to afford a 30 wt solution
3 The flask was sealed with a rubber septa and flushed with with nitrogen for 10 minutes
4 The flask was then placed in an oil bath as seen in Picture 1
5 0087 g of AIBN dissolved in EtOAc was added to the flask when the temperature of the oil
bath reached 65
6 The reaction was continued for 6 hours and stirred at 65 under N2 atmosphere
7 The solution was poured into a plastic jar sealed and let to cool down to room temperature
Calculations of amount of TRIS and MAA needed for the poly(TRIS-co-MAA) sample 1 see below
(1)
MTRIS = 42281 gmol
MDMAEMA = 15721 gmol
MNIPAM = 11316 gmol
MMAA = 8606 gmol
MHEAA = 11513 gmol
(2)
(3)
(4)
=012316
29
See Table 5-8 for detailed composition of all monomers
Table 5 poly(TRIS-co-MAA)
Monomer Sample A Sample B Sample 1
TRIS (g) 4947 4890 4828
MAA (g) 056 111 178
AIBN (g) 0087 0088 0087
EtOAc (g) 120 120 120
Molar fraction (TRISMAA) 09470053 08990101 08470153
Table 6 poly(TRIS-co-DMAEMA)
Monomer Sample 2 Sample C Sample 3
TRIS (g) 4904 4802 4692
DMAEMA (g) 096 200 308
AIBN (g) 0087 0087 0087
EtOAc (g) 120 120 120
Molar fraction (TRISDMAEMA) 09505 089011 085015
Table 7 poly(TRIS-co-NIPAM)
Monomer Sample 4 Sample 5 Sample 6
TRIS (g) 4932 4856 4775
NIPAM (g) 070 144 225
AIBN (g) 0087 0087 0088
EtOAc (g) 120 120 120
Molar fraction (TRISNIPAM) 095005 090010 08515 Table 8 poly(TRIS-co-HEAA)
Monomer Sample 7 Sample 8 Sample 9
TRIS (g) 4929 4853 4772
HEAA (g) 072 144 230
AIBN (g) 0087 0087 0087
EtOAc (g) 120 120 120
Molar fraction (TRISHEAA) 095005 090010 085015
Sample A B and C were not further evaluated
Purification by precipitation
1 The weight of the crude polymer was adjusted to a 30 wt solution and added to a 250 mL
glass separation funnel
2 1500 mL of MeOH was added to a 2000 mL beaker
3 The copolymer solution was drop wise precipitated into the MeOH while constant stirring as
seen in Picture 2
4 The copolymer seen in Picture 3 (a white tacky soft solid) was then retrieved by pouring off
the solution and picking up the polymer and stored in a sealed cup
30
Some observations made during the purification step are
1 The copolymer precipitates as white threads 2 The copolymer is quite firm and non-sticky 3 The solution is clear until the end where it turns turbid and the copolymer is more tacky and
sticky
First purification method Sample A B and C were not further evaluated as they were purified by another method that proved
to be insufficient to purify polymers In the patent application the purification step was described as
washing the copolymer with MeOH hence in this project the procedure was interpreted into the
following
The copolymer was dried after the synthesis and then dissolved in 20 g EtOAc on that was added the
double amount of MeOH (40 g) The solution was stirred manually with a spoon or such and left to sit
for 24 hours The excess MeOHEtOAc was poured off after 24 hours and 40 g of MeOH was added
again In total the procedure was repeated three times According to NMR spectra there was more
than 10 monomer left after this purification step and that is why the method was disregarded
Sample A B C and 2 were purified by this method but since there was no time left to purify sample
A B and C according to the purification described above they were not further evaluated
As this method showed to be insufficient it was decided to proceed with a more commonly used
method see Chapter 3 - Synthesis and purification of copolymer
31
Appendix II ndash Formulation and contact angle
Formulation The copolymers were blended with a silicone adhesive (two component system) in ratio 120 The
procedure is as follows (poly[TRIS-co-MAA] is set as an example)
1 0798 g of copolymer was blended with a conventional PDMS at 5 wt (5016 g of component A and 5014 g of component B) prior to curing
2 The blend was mixed in a SpeedMixer DAC 150 FVX-K for 30 seconds at speed of 3 500 rpm 3 It was cast onto a PUR-coated film (thickness 20 microm) coating thickness of 300 microm 4 The film was cured on a heating plate 150 degC for 15 minutes
Since the copolymers (after purification) where not dried to a 100 calculations of the percentage of
solvent left had to be done before any formulations could be made
Calculating percentage of solvent left in the wet copolymer was performed as follows (taking Sample
1 as example)
1 343 g of copolymer was set to dry in an oven at 45degC 2 After one day the sample was weighted to 201 g 3 The weight difference is the amount of solvent in the wet copolymer
Table 9 Wt solvent in copolymer after purification
Sample Wet
weight (g) Dry
weight (g) wt solvent in wet
copolymer wt solvent in wet copolymer after
removal of some solvent [FINAL]
1 343 201 4139 3735
2 381 278 2703 2430
3 363 249 3140 2757
4 363 252 3057 2660
5 500 335 3300 1899
6 357 227 3641 2812
7 362 219 3950 2298
8 301 205 3189 2938
9 487 291 4024 3425 Table 10 (g) copolymer needed to acheive a 5 wt in the formulation blend (based on Table 10 last column)
Formulation (sample)
Wet copolymer (g) Component A (g) Component B (g) wt copolymer in
blend
1 0798 5016 5014 475
2 0655 5036 5057 468
3 0692 5018 5037 475
4 0678 5013 5024 472
5 0615 5028 5020 472
6 0698 5029 5023 475
7 0699 5027 5034 507
8 0716 5018 5050 478
9 0761 4968 4934 482
32
Contact angle Contact angle measurements were performed on a EASYDROP Contact Angle Measurement System
from KRUumlSS with DSA1 control and evaluating software
1 A sample size 2 cm x 5 cm was taken from each formulation 2 One sample at a time was put on the sample table see Picture 4 3 The sample was illuminated with a PC-controlled illumination 4 The syringe was filled with deionized water and a droplet size 3 microL was produced at the tip
of the needle and applied on the surface 5 Pressing start in the computer software system the measurements started and proceeded for
one minute 6 Three positions were tested on each sample
33
Appendix III ndash Results
MVTR For the calculations of the MVTR values Equation (1) was applied
(1)
where
In this experimental setup deionized water was used as liquid and the test period was set to 24
hours
Table 11 MVTR raw data (red-marked number is disregarded)
Formulation W1 (g) W2 (g) W1-W2 (g) Average (g)
1
2119196 2114015 05181
05299 2123917 2118254 05663
2130770 2125716 05054
2
2120806 2111452 09354
08383 2128864 2121294 0757
2114589 2106363 08226
3
2137987 2133518 04469
04917 2119481 2114588 04893
2134925 2129537 05388
4
2134925 2121103 13822
1058 2134836 2125515 09321
1938189 1929592 08597
5
2140372 2135713 04659
04681 2138197 2133245 04952
2124946 2120513 04433
6
2127705 2121994 05711
05937 2124817 2117913 06904
2147531 2142335 05196
7
2116362 2111662 04700
04701 2121055 2116317 04738
2126865 2122200 04665
8
2138735 2133730 05005
05050 2134656 2129915 04741
2107122 2101718 05404
9
2121140 2116611 04529
04998 2140479 2134419 06060
2135159 2130754 04405
R 2127272 2122760 04512
04412 2138336 2134024 04312
34
SEC
Figure 16 SEC of Sample B MW = 508 456 gmol
Figure 17 SEC of Sample C MW = 443 117 gmol
35
1H- NMR
Figure 18 NMR of Sample A
Figure 19 NMR of Sample B
36
Figure 20 NMR of Sample 2
Figure 21 NMR of Sample C
37
Figure 22 NMR of Sample 3
Figure 23 NMR of Sample 4
38
Figure 24 NMR of Sample 5
Figure 25 NMR of Sample 6
39
Figure 26 NMR of Sample 7
Figure 27 NMR of Sample 8
40
Figure 28 NMR of Sample 9

4
nearly free rotation around the Me2Si-O bond Despite the polar chain of silicones they have a low
critical surface tension of wetting [5]
Silicone biocompatibility
The definition of biocompatibility is the ability of a material to perform with an appropriate host
response in a specific application [6]
It was discovered in the mid-1940s that silicones due to their hydrophobic property prevented blood
from coagulating Silicones are used in long term implantations as they are chemically stable and
highly elastic and the first report of silicone elastomers being implanted in humans was in 1946 Dr
Frank H used silicone in a bile duct repair and reported that It is flexible it will stretch it will bounce
like a rubber and it can be cast into any shape [5] In 1948 Dr DeNicola implanted an artificial
urethra tube and reported 14 months after the implantation that the artificial urethra had been
retained with normal genito-urinary function [5] and that There is no evidence at this time that
the tube is acting as a foreign body irritant [5]
Silicones are widely used in various medical applications due to properties such as biocompatibility
and biodurability ndash which originate from silicones being hydrophobic chemically and thermally stable
materials with a low surface tension [5]
Adhesion When there is energy required to separate two bodies the two bodies are said to adhere and the
force necessary to break the bond between the two bodies is called practical adhesion Adhesion is
physical attraction between the surfaces of two materials and is dependent on the character of the
physical forces holding the atoms and molecules together [7 8]
So what is an adhesive Basically it is a material which joins materials when applied to their
surfaces and resist separation There are two characteristic properties an adhesive must possess [9]
1 An adhesive must spread on a surface having a contact angle approaching zero ndash it must wet
the surface The adhesive will be liquid of low viscosity when applied
2 The adhesive must harden and have high cohesive strength which is the strength of like
molecules to stick together The hardening can be achieved by loss of solvent chemical
reactions or by cooling if the adhesive is a hot melt There is one exception to this second
property and that is pressure-sensitive adhesives These are permanently sticky
There are six theories of adhesion which are physical adsorption chemical bonding electrostatic
attraction mechanical interlocking inter-diffusion and weak boundary layer theories For this
project the most relevant adhesion theories are physical adsorption and mechanical interlocking
These will be further described below
5
Figure 1 (a) mechanical interlocking (b) interdiffusion of chains (c) electrical interactions (d) chemical interactions (Redrawn from [10])
Physical adsorption
This theory involves van der Waals forces across the interface and attractions between permanent
and induced dipoles Since all materials have different polarities resulting from their electron cloud
they also have different adhesion An example is between metal and paper which are polar materials
and polyethylene (PE) and silicone which are non-polar Metal and paper easily adhere by any
adhesive while PE and silicone are more difficult to bond [9 11]
There are three types of forces of attraction between dipoles EPP (permanent dipoles) Epi
(permanent dipole and corresponding induced dipole) and Eii (instantaneously induced dipoles)
Between a pair of permanent dipoles distance r at their centers there is a potential energy EPP given
by equation (1)
(1)
where micro1 and micro2 are the dipole moments and ε0 is the permittivity in vacuum k the Boltzmanns
constant and T the absolute temperature
If there is a non-polar molecule close to a polar molecule then the latter will induce a dipole in the
former Equation (2) gives the induced dipole moment where E is the electric field and α is the
polarizability of the non-polar molecule
(2)
The potential energy in this case is Epi and given in equation (3) where micro1 is the dipole moment of the
permanent dipole
(3)
The third type of physical adsorption interaction is between two instantaneous dipoles These types
of dipoles exist in non-polar molecule as a result of fluctuating distribution of electrons The potential
energy is given by equation (4)
(4)
6
where α1 and α2 are the molecules polarizabilities and I1 and I2 are their ionization potentials [9]
Mechanical interlocking
A soft tacky adhesive can enter irregularities found in substrates with irregular surface see Figure 1
(a) This is called mechanical interlocking and it occurs when an adhesive can wet a surface creating
a bonding force Silicone pressure sensitive adhesives as silicones flow readily can penetrate into a
porous or rough substrate (such as skin) and create a mechanical bond [9 11]
Monomers used in the project
TRIS
3-[Tris(trimethylsiloxy)silyl]propyl methacrylate (TRIS) is a silicone based monomer with the chemical
formula C16H38O5Si4 Figure 2 illustrates the chemical structure TRIS is used as the basemonomer
and constitutes the largest part in the copolymers This is because TRIS has TMS groups short for
trimethylsilyl -Si(CH3)3 which makes it similar to PDMS and thus contributes to the good miscibility
with the PDMS [12]
Figure 2 TRIS monomer
TRIS belongs to the acrylate family and contains a vinyl group which is crucial for free radical
polymerization (see Chapter 2 Free radical polymerization in solution)
MAA
Metharcylic acid (MAA) is also a member of the acrylate family and has the chemical formula C4H6O2
Figure 3 illustrates the chemical structure of MAA [13]
Figure 3 MAA monomer
HEAA
N-Hydroxyethyl acrylamide (HEAA) with the chemical formula C5H9NO2 is an acrylamide having one
nitrogen replacing the oxygen seen in acrylates The chemical structure of HEAA is seen in Figure 4
[14]
7
Figure 4 HEAA monomer
NIPAM
N-Isopropylacrylamide (NIPAM) chemical formula C6H11NO and chemical structure illustrated in
Figure 5 [15]
Figure 5 NIPAM monomer
DMAEMA
2-(Dimethylamino)ethyl methacrylate (DMAEMA) C8H15NO2 This acrylate has the chemical structure
shown in Figure 6 [16]
Figure 6 DMAEMA monomer
Initiator AIBN
Azobisisobutyronitrile (AIBN) is a common initiator used in free radical polymerization Chemical
structure can be seen in Figure 7 [17]
Figure 7 AIBN initiator
Free radical polymerization in solution In free radical polymerization polymers are formed by the addition of free radical building blocks in
this project it is vinyl monomers added onto a growing chain When the polymerization is in a
solution the solvent facilitates heat transfer and also reduces viscosity of the medium However
complications of chain transfer may arise and thus selection of solvent must be carefully made
The polymerization proceeds in three stages (1) initiation an active center which acts as a chain
carrier is formed (2) propagation growth of the macromolecule by a kinetic chain mechanism where
monomers are added to the growing chain (3) termination the active center is transferred or
neutralized which stops the progress of the kinetic chain [18]
8
Initiation
The initiation step begins with an initiator that decomposes into free radicals R when subjected to
heat electromagnetic radiation or a chemical process see reaction (1) The free radical will have an
active center which is the location of the unpaired electrons The instability of the carbon double
bond of the monomer M makes it susceptive to reaction with the free radicalrsquos unpaired electrons
hence the active center of the free radical can ldquograbrdquo one electron from the double bond of the
monomer creating a new active center at the end of the chain as it leaves an unpaired electron [19]
(1)
The amount of generated radicals effective in the creation of a kinetic chain can be expressed as the
efficiency factor f (0-1) A low efficiency factor will lead to inefficient chain propagation and can be
due to several factors where one is primary recombination which is a result of to radicals combining
see reaction (2)
(2)
This can occur if the solution impedes the radical fragments leading to a cage effect The solvent
plays an important part in solution free-radical polymerization as the extent of decomposition of the
initiator varies with the solvent An example is the decomposition of benzoyl peroxide where in
tetrachloroethylene it only decomposes up to 35 while it is 85 in ethyl acetate [18]
Propagation
When the synthesis has been initiated it is followed by the propagation reaction In free radical
polymerization the propagation process usually takes place within a fraction of a second The
propagation steps are similar to the initiation where electrons are transferred and the active center
is moved down the chain see reaction (3)
(3)
The propagation comes to an end when the termination occurs [18]
Termination
The termination is the step where the active center is either transferred to another chain or
neutralized There are two ways in which the termination can take place by combination or
disproportionation
Combination
The termination reaction combination is between two end chains where they couple together to
form one long chain as seen in Scheme 4
9
Scheme 4 Combination of two growing chains into one polymer
Disproportionation
This occurs when hydrogen abstractions takes place in one end forming a carbon double bond and
resulting in two dead polymer chains see Scheme 5 [18]
Scheme 5 Disproportionation of two growing chains into two dead polymer chains
Chain transfer
Chain transfer occurs when the active center of a growing polymer is transferred to another species
through a collision There are several types of chain transfer In general hydrogen abstraction from
monomer initiator polymer solvent and modifier There are five concepts of chain transfer transfer
to monomer transfer to initiator transfer to polymer transfer to modifier and transfer to solvent
[18]
Copolymer equation When using two or more monomers in a free radical polymerization the term is known as
copolymerization By copolymerizing two monomers the properties of the resulting polymer are
often better than the properties for the parent homopolymers The simplest case of
copolymerization involves two monomers (eg M1 and M2) but can be presented in several different
structures within the copolymer such as Statistical copolymer Alternating copolymers Block
copolymers Graft copolymers and Stereoblock copolymer [18]
The copolymerization between two monomers M1 and M2 is presented in equations (51)-(54)
where k11k22 and k12k21 correspond to self-propagating and cross-propagating rate constants
respectively [18]
(51)
(52)
(53)
(54)
The rate of consumption of M1 can be determined according to equation (6) if steady state
conditions prevail and the radical activity only depends on the nature of the terminal unit [18]
10
(6)
The rate of consumption for M2 is then
(7)
By assuming that
the copolymer equation is obtained by dividing
equation (6) by equation (7) so that
(8)
where r1 and r2 represent relative reactivity ratios from and
Several limiting cases of r can be derived
block copolymerization since both reactivity ratios are larger than unity the propagating monomers prefer to react with themselves forming blocks of M1 and M2
block copolymerization since the reactivity ratios are much higher than unity there is no inclination for the monomers to react with each other leading to two homopolymers
ideal copolymerization the propagating species M1 and M2 have the same preference for adding one or the other resulting in a random copolymer
alternating copolymerization each of the two propagating species prefers adding the other monomer
M1 is more reactive toward both propagating species and the copolymer will contain more of the reactive monomer in statistical placement [20]
Characterization methods
Contact angle
The spreading or deformation of a water droplet on a solid surface is determined by the surface and
interfacial energies The contact angle θ is the angle under which the droplet meets the surface and
may be evaluated by taking into account the three interfacial tensions in Figure 8
ndash between surface and liquid
ndash between surface and gas
ndash between liquid and gas
Figure 8 Different contact angles of a water droplet on a solid surface
11
The contact angle is also a quantification of the wetting of the solid by the liquid and is determined
by Youngs equation
(9)
The lower θ the better the wetting Poorly wetting systems may eg be water on Teflon where the
water droplet rolls off the surface hence θ approaches 180deg The other opposite is when the liquid
spreads and covers the surface complete wetting is achieved and θ approaches 0deg [21 22]
Moisture vapor transmission rate (MVTR)
The definition of moisture vapor transmission rate (also water vapor transmission rate) is as follows
The rate of water vapor flow under steady specified conditions through a unit area of a material
between its two parallel surfaces and normal to the surfaces [23]
And the metric unit of measurements is
12
TRIS
MAA
5 mol
10 mol
15 mol
DMAEMA
5 mol
10 mol
15 mol
NIPAM
5 mol
10 mol
15 mol
HEAA
5 mol
10 mol
15 mol
3 Experimental
Chemicals Table 2 Chemicals used in this project
Monomers Solvents Initiator Silicone PSA
TRIS (from Sigma-Aldrich) EtOAc (from Sigma-Aldrich) AIBN (from
Chalmers) MED 6350 (from Nusil)
NIPAM (from Sigma-Aldrich) MeOH (from Sigma-Aldrich)
DMAEMA (from Sigma-
Aldrich)
MAA (from Sigma-Aldrich)
HEAA (from Sigma-Aldrich)
Methodology
Synthesis and purification of copolymer
In the synthesis of the copolymer monomer weight was kept at 50 g for all the experiments Amount
of initiator was kept at approximately 0087 g and the solvent was kept at 120 g generating a 30 wt
solution
The synthesis was carried out in a round bottom flask see Picture 1 placed in an oil bath holding 65
degC The two monomers (TRIS and MAADMAEMANIPAMHEAA) see Figure 9 were added to the
flask with solvent and initiator Stirring was important throughout the entire synthesis to promote
good mixing The synthesis for each copolymer lasted for six hours For more detailed description see
Appendix I
The copolymer solution was purified by precipitation in methanol see Picture 2 This is because the
copolymer is not soluble in methanol while the pure monomers are In Picture 3 the precipitated
copolymer is shown
Figure 9 A scheme of poly[TRIS]-combinations and molar percentages of MAADMAEMANIPAMHEAA
13
Formulation of copolymer and two component system Each copolymer was blended with MED 6350 (a commercial PDMS polymer) in a 120 ratio of
copolymer to MED 6350 The blends were cast onto PUR-films and then cured on a heating plate to
generate the final PSA For more details see Appendix II
Contact angle measurements The contact angle measurements were performed on the formulations above and not on the pure
copolymers Each formulated film was measured with the EASYDROP Contact angle Measurement
System see Picture 4 using deionized water Three positions were measured for every formulated
film during 60 seconds to ensure a correct average contact angle More details in Appendix II
Picture 1 Synthesis reaction set-up Picture 2 Copolymer purification set-up
Picture 3 A close-up of the precipitated copolymer
14
Picture 4 Contact angle measurement equipment
Moisture vapor transmission rate (ID T-1070)
A cylinder was filled with deionized water up to a level leaving a 5 mm air gap The produced films
from the formulations three specimens of each were punched out in a circular shape larger than the
opening of the cylinders The cylinder was covered with the specimen weighed and placed in an
oven (37degC) for 24 hours After 24 hours the cylinder with the specimen was weighed again and
moisture vapor transmission rate could be obtained by calculating the loss of water
NMR and SEC 1H NMR spectrum was recorded on a Varian 400 spectrometer The samples were dissolved in CDCl3
and the 1H NMR spectra were obtained at 298 K with CDCl3 as internal standard Size-exclusion
chromatography (SEC) was performed on a Waters Alliance 2000 GPCV at 135degC with 124-
trichlorobenzene as eluent at 1 mLmin using an RI-detector It was calibrated using polystyrene
standards
Failed method GF31 is a chemical similar to TRIS but much cheaper see Figure 10 and 11 The first synthesis was
therefore done with GF31 instead of TRIS The first polymerization was between GF31 and MAA
Table 3
Table 3 First synthesis between GF31 and MAA
Chemical Amount
GF31 11195 (g)
MAA 3754 (g)
EtOAc 350 (g) (+ 400 mL)
AIBN 095 (g)
This first synthesis was done in a batch size of 500 g A reactor with a built in heat controlled oil
circulation was used with a SVL multi-joint lid 5-NECK on top Through the center neck a mechanical
stirrer passed and through the others nitrogen gas was connected and in-let of chemicals occurred
15
the rest were sealed The synthesis progressed in the same manner as described in Chapter 3 ndash
Synthesis and purification of copolymer Problems faced here were leakage of solvent and GF31
interaction with MAA As seen in Table 3 an extra amount (400 mL) of EtOAc was added during the
synthesis due to fact that 80 of the solvent (EtOAc) had evaporated within six hours GF31 (since it
is different from TRIS) formed a type of hard brittle white copolymer instead of the expected clear
tough and rubbery copolymer The ndashSi-O-Me groups of GF31 are probably more reactive than the
TMS groups of TRIS leading to the hard brittle copolymer formed However the side group of
monomer GF31 is not flexible enough to form a soft polymer and less MAA would improve the
softness Even though later on the leakage problem was solved (by sealing the center neck better)
the reactor was disregarded as an optimal set-up and was replaced by round bottom flask (reactor
with batch size 150 g) with a rubber septa using TRIS instead of GF31
Figure 10 Chemical structure of TRIS Figure 11 Chemical structure of GF31
16
4 Results and discussion
Polymerization
Yield
The yield does not take into consideration amount of monomer left in the copolymer In Chapter 4 ndash
NMR calculations of copolymer composition and percentage of monomer left are made For some
copolymers eg sample 1 the yield is much lower than for the rest as seen in Table 4 This may be
due to loss of copolymer in the first purification method see Appendix I Sample 1 (15 MAA)
showed some solubility in MeOH which means that when excess MeOHEtOAc was poured off some
polymer residue may also have been poured off hence the lower yield Also in the precipitation
method the solution started to become turbid when all copolymer solution had been blended with
the MeOH this was a fact for all copolymers The EtOAc to MeOH ratio was probably too small and
the copolymer started to dissolve There was most likely some loss of copolymer in this step too It
would probably have been better to use a larger quantity MeOH to avoid dissolution of the
copolymer
The best yield was expected for sample 8-9 as they had not been purified by the first method first
and hence the loss of polymer was strictly restricted to the new method But as seen the yield is 63
for Sample 8 and 70 for sample 9
Sample 7-9 are the poly[TRIS-co-HEAA] copolymers Amount of HEAA increases from sample 7 to
sample 9 and hence increased hydrophilicity The reason to why there is a loss of polymer in the
purification step could be that the copolymer (as the HEAA increases) became more soluble in
MeOH But as seen in Table 4 sample 7-9 are the copolymers containing the highest amount of TRIS
This speaks against the possibility of increasing HEAA contributing to increased hydrophilicity and
thus making the copolymer soluble in MeOH Also sample 9 should be more soluble in MeOH than
sample 8 as it contains more HEAA The same behavior is seen in sample 4-6 (poly[TRIS-co-NIPAM])
where there is a larger loss of copolymer for sample 4 than for sample 6 It seems that the yield is
somewhat circumstantial
17
Table 4 Results from all evaluations
18
SEC ndash molecular weight
According to the patent application it is stated that the molecular weight is larger than 10 000 gmol
In Figure 12 and 13 and Appendix III Figure 16-17 all values show a MW well above 10 000 gmol at
the lowest 360 000 gmol and for the highest at 508 000 gmol SEC was only done on Sample A-C
see Table 4 and Sample 2 as the copolymers are TRIS-based it is assumed that the rest of the
copolymers possess a similar molecular weight The second peak in both figures represents some
low molecular substance probably monomer residue Before H-NMR measurements Sample 2 was
purified one more time see Appendix I First purification method
Figure 12 SEC of Sample 2 Mw = 360 000 gmol
Figure 13 SEC of Sample A MW= 485 000 gmol
19
1H- NMR
Figure 14 NMR of Sample 1
1H- NMR was done to be able to calculate the composition in the copolymer Calculations are shown
below on Figure 14
(10)
where xT and xM are fractions of TRIS and MAA in the copolymer respectively
(11)
Applying equation (10) into equation (11) and
(expected value is 85 )
The two peaks at 610 ppm and 554 ppm are from the double bonds in the two monomers
(12)
Where xMo is the fraction of monomer left in the copolymer
20
Since xT is 8075 of the copolymer composition xMo is then
According to the calculations above there is approximately 392 monomer residue left in the
copolymer That is quite a large difference to 108 left in sample A (calculated in the same manner
as above) which was purified by the first purification method see Appendix I First purification
method
Table 4 presents the copolymer compositions for each copolymer These data are not exact as the
integrals were calculated by hand in MestreNova an analytical chemistry software suite This results
in an inaccuracy that has to be taken into account and the data showed above has to be considered
as approximate values For all the copolymers there is a continuous increase of the comonomer
which is consistent with the expected values
One copolymer is standing out from the others and it is poly[TRIS-co-HEAA] (sample 7-9) The
expected (the input) percentage of HEAA was 5 ndash 10 ndash 15 but the output was approximately 3 ndash 5 ndash
10 which means that TRIS has less affinity for HEAA than for the rest of the monomers Hence one
can assume leading to TRIS being more reactive toward both propagating species
and the copolymer will contain more of the reactive monomer (TRIS) in statistical placement In
comparison TRIS to the other monomers the r values were as can be seen in
Table 4 where the output was larger than 5 ndash 10 ndash 15 for the comonomers (exception DMAEMA
where 5 was input and 239 was output)
As seen in Table 4 the amount of monomer left in the copolymer varies between 077 ndash 392 for
the polymer purified by precipitation For copolymers A-C the level of monomers left are much
higher (85 ndash 137 ) and this proves that the first purification method was insufficient
Contact angle measurements All contact angle measurements were performed on the formulated films and not on the pure
copolymers
As seen in Table 4 the contact angle (deg) of the copolymer formulations does not differ from the
reference formulation (pure MED 6350) especially much The contact angle was expected to be lower
than the reference but as seen it is higher for sample 7 The contact angle is in the interval 121deg -
128deg and is too narrow to say anything about whether the contact angle actually has been modified
or not One reason to why these measurements may not have been very accurate is the fact that the
angle was measured on a droplet that was out in the open Lights from the surroundings and air
conditioning in the room could have affected the measurements Observed during the measurement
was that the droplet size steadily decreased which either means that the droplet evaporates or that
the surface has changed Had these measurements been done in a closed environment of the
droplet then perhaps there would have been different values
Another fact to why there is such little change in the contact angle is that silicones are highly
hydrophobic materials and since there is a very small amount of hydrophilic material integrated in
the silicone a large difference in the contact angle is really not expected Had there been a large
21
difference in contact angle the possibility of migration within the formulation of the hydrophilic
copolymer could be a reason However that was not the case and is very unlikely since the
copolymers are large molecules and the probability of migration is therefore small
Moisture vapor transmission rate The higher MVTR the better vapor transmission As seen in Table 4 all formulations show higher
MVTR than the reference This means that the formulations containing the hydrophilic copolymers
actually breathe better and are more likely to let vapor through Sample 4 [poly(TRIS-co-NIPAM(5
mol))] has an MVTR that is 139 better than the reference The rest of the formulations show an
improvement between 6 ndash 90 As only three tests on each formulation was done it is not
statistically correct to say that there has been an improvement of the MVTR as there is no clear
standard deviation to take into account However all formulations show higher MVTR than the
reference
Figure 15 MVTR data for all samples Blue = values for each test Red = average
In the investigated patent application there was no MVTR-testing done However testing of wet
adhesion was done by taking a 1-inch by 15-inch strip of adhesive and attach it to the abdominal skin
of a human subject and removing it after 40-60 min of aerobic activity [2] According to their results
good wet adhesion was achieved with the formulation containing 5 mol NIPAM and weak wet
adhesion was achieved with the formulation containing 5 mol DMAEMA sample 4 (MVTR = 1058)
and 2 (MVTR = 838) respectively in this project These two formulations showed best MVTR results
and are in accordance with the patent application investigated Why the formulations with lower
amount of polar part showed the best MVTR values must be due to morphology However due to
monomer residue wet adhesion testing on humans was not possible
22
There were some formulations with bubbles in the film seen Picture 5 and 6 Especially sample 2 4
and 8 This may have affected the MVTR and contributed to a higher value than expected
Formulation 8 had also a large amount of bubbles but a low MVTR The bubbles may have been
caused by solvent or monomer evaporating or air that has been trapped during the speed mixing As
seen in Figure 15 there is one value for sample 4 that is well above the others Since the value is
almost 50 larger than the second highest value it could be faulty perhaps an increased amount of
bubbles in the film or leakage of the cylinder
Picture 5 From MVTR Representing sample 9 - 7 from left to right
Picture 6 From MVTR Representing sample 2 - 4 from left to right
23
5 Conclusions This study showed that synthesis of hydrophilic silicone copolymers can be relatively easy
performed and the molecular weight achieved was high (Mw gt 500 000 gmol)
1H- NMR showed that the composition in the copolymers was not as the feed monomer composition
For poly[TRIS-co-MAA] and poly[TRIS-co-NIPAM] there was a higher percentage of comonomer than
assumed while the values varied for poly[TRIS-co-DMAEMA] and for poly[TRIS-co-HEAA] there was a
lower percentage of comonomer NMR also indicated monomer residue left in the copolymers
between 077 ndash 392 indicating that the purification step needs to be optimized or repeated more
than once to remove monomers left in the copolymer
According to contact angle measurements wetting of the silicone surface was not greatly affected
As the addition of copolymer was only 5 wt and of those 5 wt only 5 ndash 15 mol contained a
hydrophilic part a large change in contact angle was not expected The contact angle was evaluated
as the patent application [2] stated large change in wet adhesion
The most relevant results for this project were the MVTR results as they portrayed the improvement
of the silicone PSA (pure MED 6350) The MVTR values showed an large increase in water vapor
permeability for sample 2 and 4 5 mol DMAEMA and 5 mol NIPAM respectively If there is a
correlation between good wet adhesion and MVTR = 1058 (sample 4) contra weak wet adhesion
and MVTR = 838 (sample 2) then it is possible to conclude that for the rest of the copolymer samples
(MVTR ltlt 800) no or little wet adhesion was achieved Why there was no radical improvement for
sample C and 3 and sample 5 and 6 (DMAEMA 10-15 mol and NIPAM 10-15 mol respectively)
can be due to the results of sample 2 and 4 being faulty The explanation could also be that the
values are correct and that the addition of only 5 mol was enough to change the morphology of
the film in a way generating a higher MVTR and increasing the mol of comonomer did not change
the morphology in the same way thus not generating a higher MVTR
Overall it can be concluded that this method is not optimal for increasing hydrophilicity of PSAs as
the method is somewhat complicated to perform and the purification of the copolymers is time
consuming and unsatisfactory However silicone compatible copolymers were successfully
synthesized and characterized Taking the data retrieved in regard many questions about the quality
of the patent application are raised
24
6 Future work For this project future work would be to further purify the copolymers and then evaluate their
adhesive properties directly on the skin This would give more realistic values to whether or not the
modified PSAs have achieved better wet adhesion or not Also to redo the formulations without
bubbles and once again measure MVTR To add more analysis in form of morphology analysis to se
whether or not there is a difference in structure between the different formulations
Another project of future work is to evaluate the new patent application from Convatec Technlogies
Inc [24] where PSAs are modified by the addition of a low molecular weight organic hydroxy
containing compound This method is more straight on and does not involve any complicated
synthesis or purification steps It is simply addition of a hydroxy containing compound to a PSA prior
to curing This may be an interesting study for future work
25
7 Acknowledgments Many people have been involved in this master thesis and I would like to thank them for their
support and help
Thanks to
Dennis Hansson and Lars Lindgren my supervisors at Moumllnlycke Health Care that have always been
available for questions taken a great interest in my work and been a great support
Everyone at the Columbus group at Moumllnlycke Health Care thanks for making my time here fun and
interesting
Anders Maringrtensson for helping me with SEC analysis at Chalmers
Renee Kroon for helping me with NMR analysis at Chalmers
Mats Andersson my examiner
Friends and family
26
References [1] Mechan S et al Amphiphilic Silicone Copolymers for Pressure Sensitive Adhesive Applications
Journal of Applied Polymer Science 2010 116 3265-3270
[2] Convatec Technologies Inc Pressure Sensitive Silicone Adhesives with Amphiphilic copolymers
WO2011005839A1 Publication date 13 January 2011
[3] Clarson J S et al Silicones and Silicone-Modified Materials American Chemical Society
Washington (2000)
[4] Pachaly B Achenbach F Herzig C Mautner K Silicones WILEY-VCH Wienheim (2005)
[5] Colas A and Curtis J Silicone Biomaterials History and Chemistry amp Medical Applications of
Silicones httpwwwdowcorningcomcontentpublishedlit52-1069-01pdf 2012-01-17
[6] Ratner Buddy D et al Biomaterials Science ndash An introduction to Materials in Medicine Elsevier
London (2004)
[7] Gay C Stickiness ndash some fundamentals of adhesion Integrative and Comparative Biology 2002
42 1123-1126
[8] V Pocius A Adhesion Kirk-Othmer Encyclopedia of Chemical Technology Vol 1 Page 501
(2002)
[9] John Comyn Adhesion Science Royal Society of Chemistry Paperbacks 1997
[10] Garbassi F et al Polymer surfaces ndash From Physics to Technology John Wiley amp Sons Chichester
(1998)
[11] Covert P Principles of Pressure Sensitive Adhesion httpwwwgluemachinerycomprinciples-
of-pressure-sensitive-adhesionhtml 2012-02-08
[12] TRIS
httpwwwsigmaaldrichcomcatalogProductDetaildoD7=0ampN5=SEARCH_CONCAT_PNO7CBRA
ND_KEYampN4=4461307CALDRICHampN25=0ampQS=ONampF=SPEC 2012-02-08
[13] MAA
httpwwwsigmaaldrichcomcatalogProductDetaildoD7=0ampN5=SEARCH_CONCAT_PNO7CBRA
ND_KEYampN4=640507CFLUKAampN25=0ampQS=ONampF=SPEC 2012-02-08
[14] HEAA
httpwwwsigmaaldrichcomcatalogProductDetaildoD7=0ampN5=SEARCH_CONCAT_PNO7CBRA
ND_KEYampN4=6979317CALDRICHampN25=0ampQS=ONampF=SPEC 2012-02-08
[15] NIPAM
httpwwwsigmaaldrichcomcatalogProductDetaildoD7=0ampN5=SEARCH_CONCAT_PNO7CBRA
ND_KEYampN4=4153247CALDRICHampN25=0ampQS=ONampF=SPEC 2012-02-08
27
[16] DMAEMA
httpwwwsigmaaldrichcomcatalogProductDetaildoD7=0ampN5=SEARCH_CONCAT_PNO7CBRA
ND_KEYampN4=2349077CALDRICHampN25=0ampQS=ONampF=SPEC 2012-02-08
[17] AIBN
httpwwwsigmaaldrichcomcatalogProductDetaildolang=enampN4=441090|ALDRICHampN5=SEARC
H_CONCAT_PNO|BRAND_KEYampF=SPEC 2012-02-09
[18] Cowie JMG and Arrighi V Polymers Chemistry and physics of modern materials Taylor amp
Francis Group (2008)
[19] Wound Care ndash MepilexreghttpwwwmolnlyckecomgbWound-Care-ProductsProduct-
selector---Wound-divisionTabsProductsMepilexactiveTab=3 2011-10-24
[20] Chain copolymerization
httpcesysueducnechemipolychemuploadfilesE585B1E8819AE59088pdf
2012-02-09
[21] Israelachivli Jacob N Intermolecular and surface forcesAcademic Press Burlington (2011)
[22] Lyklema J et al Fundamentals of interface and colloid science Academic press San Diego
(2000)
[23] Gooch Jan W Encyclopedic dictionary of polymers 2 Part 13 Page 815 (2011)
[24] Convatec Technologies Inc Silicone Gel Adhesive with Organic Polyhydroxy Compounds
WO2012003028A1 Publication date 5 January 2012
28
Appendix I ndash Synthesis and purification
The synthesis was carried out by combining TRIS with the other monomers see Figure 9 The
combination resulted in four copolymers divided into three categories variations of 95 90 and 85
mol of TRIS
The procedure for the synthesis of poly[TRIS]-based copolymers by free radical polymerization using
poly[TRIS-co-MAA] as an example is as follows
1 4947 g of TRIS and 056 g of MAA was added to a 250 ml round bottomed flask containing a
magnetic stirring bar
2 To the flask was added 120 g of EtOAc to afford a 30 wt solution
3 The flask was sealed with a rubber septa and flushed with with nitrogen for 10 minutes
4 The flask was then placed in an oil bath as seen in Picture 1
5 0087 g of AIBN dissolved in EtOAc was added to the flask when the temperature of the oil
bath reached 65
6 The reaction was continued for 6 hours and stirred at 65 under N2 atmosphere
7 The solution was poured into a plastic jar sealed and let to cool down to room temperature
Calculations of amount of TRIS and MAA needed for the poly(TRIS-co-MAA) sample 1 see below
(1)
MTRIS = 42281 gmol
MDMAEMA = 15721 gmol
MNIPAM = 11316 gmol
MMAA = 8606 gmol
MHEAA = 11513 gmol
(2)
(3)
(4)
=012316
29
See Table 5-8 for detailed composition of all monomers
Table 5 poly(TRIS-co-MAA)
Monomer Sample A Sample B Sample 1
TRIS (g) 4947 4890 4828
MAA (g) 056 111 178
AIBN (g) 0087 0088 0087
EtOAc (g) 120 120 120
Molar fraction (TRISMAA) 09470053 08990101 08470153
Table 6 poly(TRIS-co-DMAEMA)
Monomer Sample 2 Sample C Sample 3
TRIS (g) 4904 4802 4692
DMAEMA (g) 096 200 308
AIBN (g) 0087 0087 0087
EtOAc (g) 120 120 120
Molar fraction (TRISDMAEMA) 09505 089011 085015
Table 7 poly(TRIS-co-NIPAM)
Monomer Sample 4 Sample 5 Sample 6
TRIS (g) 4932 4856 4775
NIPAM (g) 070 144 225
AIBN (g) 0087 0087 0088
EtOAc (g) 120 120 120
Molar fraction (TRISNIPAM) 095005 090010 08515 Table 8 poly(TRIS-co-HEAA)
Monomer Sample 7 Sample 8 Sample 9
TRIS (g) 4929 4853 4772
HEAA (g) 072 144 230
AIBN (g) 0087 0087 0087
EtOAc (g) 120 120 120
Molar fraction (TRISHEAA) 095005 090010 085015
Sample A B and C were not further evaluated
Purification by precipitation
1 The weight of the crude polymer was adjusted to a 30 wt solution and added to a 250 mL
glass separation funnel
2 1500 mL of MeOH was added to a 2000 mL beaker
3 The copolymer solution was drop wise precipitated into the MeOH while constant stirring as
seen in Picture 2
4 The copolymer seen in Picture 3 (a white tacky soft solid) was then retrieved by pouring off
the solution and picking up the polymer and stored in a sealed cup
30
Some observations made during the purification step are
1 The copolymer precipitates as white threads 2 The copolymer is quite firm and non-sticky 3 The solution is clear until the end where it turns turbid and the copolymer is more tacky and
sticky
First purification method Sample A B and C were not further evaluated as they were purified by another method that proved
to be insufficient to purify polymers In the patent application the purification step was described as
washing the copolymer with MeOH hence in this project the procedure was interpreted into the
following
The copolymer was dried after the synthesis and then dissolved in 20 g EtOAc on that was added the
double amount of MeOH (40 g) The solution was stirred manually with a spoon or such and left to sit
for 24 hours The excess MeOHEtOAc was poured off after 24 hours and 40 g of MeOH was added
again In total the procedure was repeated three times According to NMR spectra there was more
than 10 monomer left after this purification step and that is why the method was disregarded
Sample A B C and 2 were purified by this method but since there was no time left to purify sample
A B and C according to the purification described above they were not further evaluated
As this method showed to be insufficient it was decided to proceed with a more commonly used
method see Chapter 3 - Synthesis and purification of copolymer
31
Appendix II ndash Formulation and contact angle
Formulation The copolymers were blended with a silicone adhesive (two component system) in ratio 120 The
procedure is as follows (poly[TRIS-co-MAA] is set as an example)
1 0798 g of copolymer was blended with a conventional PDMS at 5 wt (5016 g of component A and 5014 g of component B) prior to curing
2 The blend was mixed in a SpeedMixer DAC 150 FVX-K for 30 seconds at speed of 3 500 rpm 3 It was cast onto a PUR-coated film (thickness 20 microm) coating thickness of 300 microm 4 The film was cured on a heating plate 150 degC for 15 minutes
Since the copolymers (after purification) where not dried to a 100 calculations of the percentage of
solvent left had to be done before any formulations could be made
Calculating percentage of solvent left in the wet copolymer was performed as follows (taking Sample
1 as example)
1 343 g of copolymer was set to dry in an oven at 45degC 2 After one day the sample was weighted to 201 g 3 The weight difference is the amount of solvent in the wet copolymer
Table 9 Wt solvent in copolymer after purification
Sample Wet
weight (g) Dry
weight (g) wt solvent in wet
copolymer wt solvent in wet copolymer after
removal of some solvent [FINAL]
1 343 201 4139 3735
2 381 278 2703 2430
3 363 249 3140 2757
4 363 252 3057 2660
5 500 335 3300 1899
6 357 227 3641 2812
7 362 219 3950 2298
8 301 205 3189 2938
9 487 291 4024 3425 Table 10 (g) copolymer needed to acheive a 5 wt in the formulation blend (based on Table 10 last column)
Formulation (sample)
Wet copolymer (g) Component A (g) Component B (g) wt copolymer in
blend
1 0798 5016 5014 475
2 0655 5036 5057 468
3 0692 5018 5037 475
4 0678 5013 5024 472
5 0615 5028 5020 472
6 0698 5029 5023 475
7 0699 5027 5034 507
8 0716 5018 5050 478
9 0761 4968 4934 482
32
Contact angle Contact angle measurements were performed on a EASYDROP Contact Angle Measurement System
from KRUumlSS with DSA1 control and evaluating software
1 A sample size 2 cm x 5 cm was taken from each formulation 2 One sample at a time was put on the sample table see Picture 4 3 The sample was illuminated with a PC-controlled illumination 4 The syringe was filled with deionized water and a droplet size 3 microL was produced at the tip
of the needle and applied on the surface 5 Pressing start in the computer software system the measurements started and proceeded for
one minute 6 Three positions were tested on each sample
33
Appendix III ndash Results
MVTR For the calculations of the MVTR values Equation (1) was applied
(1)
where
In this experimental setup deionized water was used as liquid and the test period was set to 24
hours
Table 11 MVTR raw data (red-marked number is disregarded)
Formulation W1 (g) W2 (g) W1-W2 (g) Average (g)
1
2119196 2114015 05181
05299 2123917 2118254 05663
2130770 2125716 05054
2
2120806 2111452 09354
08383 2128864 2121294 0757
2114589 2106363 08226
3
2137987 2133518 04469
04917 2119481 2114588 04893
2134925 2129537 05388
4
2134925 2121103 13822
1058 2134836 2125515 09321
1938189 1929592 08597
5
2140372 2135713 04659
04681 2138197 2133245 04952
2124946 2120513 04433
6
2127705 2121994 05711
05937 2124817 2117913 06904
2147531 2142335 05196
7
2116362 2111662 04700
04701 2121055 2116317 04738
2126865 2122200 04665
8
2138735 2133730 05005
05050 2134656 2129915 04741
2107122 2101718 05404
9
2121140 2116611 04529
04998 2140479 2134419 06060
2135159 2130754 04405
R 2127272 2122760 04512
04412 2138336 2134024 04312
34
SEC
Figure 16 SEC of Sample B MW = 508 456 gmol
Figure 17 SEC of Sample C MW = 443 117 gmol
35
1H- NMR
Figure 18 NMR of Sample A
Figure 19 NMR of Sample B
36
Figure 20 NMR of Sample 2
Figure 21 NMR of Sample C
37
Figure 22 NMR of Sample 3
Figure 23 NMR of Sample 4
38
Figure 24 NMR of Sample 5
Figure 25 NMR of Sample 6
39
Figure 26 NMR of Sample 7
Figure 27 NMR of Sample 8
40
Figure 28 NMR of Sample 9

5
Figure 1 (a) mechanical interlocking (b) interdiffusion of chains (c) electrical interactions (d) chemical interactions (Redrawn from [10])
Physical adsorption
This theory involves van der Waals forces across the interface and attractions between permanent
and induced dipoles Since all materials have different polarities resulting from their electron cloud
they also have different adhesion An example is between metal and paper which are polar materials
and polyethylene (PE) and silicone which are non-polar Metal and paper easily adhere by any
adhesive while PE and silicone are more difficult to bond [9 11]
There are three types of forces of attraction between dipoles EPP (permanent dipoles) Epi
(permanent dipole and corresponding induced dipole) and Eii (instantaneously induced dipoles)
Between a pair of permanent dipoles distance r at their centers there is a potential energy EPP given
by equation (1)
(1)
where micro1 and micro2 are the dipole moments and ε0 is the permittivity in vacuum k the Boltzmanns
constant and T the absolute temperature
If there is a non-polar molecule close to a polar molecule then the latter will induce a dipole in the
former Equation (2) gives the induced dipole moment where E is the electric field and α is the
polarizability of the non-polar molecule
(2)
The potential energy in this case is Epi and given in equation (3) where micro1 is the dipole moment of the
permanent dipole
(3)
The third type of physical adsorption interaction is between two instantaneous dipoles These types
of dipoles exist in non-polar molecule as a result of fluctuating distribution of electrons The potential
energy is given by equation (4)
(4)
6
where α1 and α2 are the molecules polarizabilities and I1 and I2 are their ionization potentials [9]
Mechanical interlocking
A soft tacky adhesive can enter irregularities found in substrates with irregular surface see Figure 1
(a) This is called mechanical interlocking and it occurs when an adhesive can wet a surface creating
a bonding force Silicone pressure sensitive adhesives as silicones flow readily can penetrate into a
porous or rough substrate (such as skin) and create a mechanical bond [9 11]
Monomers used in the project
TRIS
3-[Tris(trimethylsiloxy)silyl]propyl methacrylate (TRIS) is a silicone based monomer with the chemical
formula C16H38O5Si4 Figure 2 illustrates the chemical structure TRIS is used as the basemonomer
and constitutes the largest part in the copolymers This is because TRIS has TMS groups short for
trimethylsilyl -Si(CH3)3 which makes it similar to PDMS and thus contributes to the good miscibility
with the PDMS [12]
Figure 2 TRIS monomer
TRIS belongs to the acrylate family and contains a vinyl group which is crucial for free radical
polymerization (see Chapter 2 Free radical polymerization in solution)
MAA
Metharcylic acid (MAA) is also a member of the acrylate family and has the chemical formula C4H6O2
Figure 3 illustrates the chemical structure of MAA [13]
Figure 3 MAA monomer
HEAA
N-Hydroxyethyl acrylamide (HEAA) with the chemical formula C5H9NO2 is an acrylamide having one
nitrogen replacing the oxygen seen in acrylates The chemical structure of HEAA is seen in Figure 4
[14]
7
Figure 4 HEAA monomer
NIPAM
N-Isopropylacrylamide (NIPAM) chemical formula C6H11NO and chemical structure illustrated in
Figure 5 [15]
Figure 5 NIPAM monomer
DMAEMA
2-(Dimethylamino)ethyl methacrylate (DMAEMA) C8H15NO2 This acrylate has the chemical structure
shown in Figure 6 [16]
Figure 6 DMAEMA monomer
Initiator AIBN
Azobisisobutyronitrile (AIBN) is a common initiator used in free radical polymerization Chemical
structure can be seen in Figure 7 [17]
Figure 7 AIBN initiator
Free radical polymerization in solution In free radical polymerization polymers are formed by the addition of free radical building blocks in
this project it is vinyl monomers added onto a growing chain When the polymerization is in a
solution the solvent facilitates heat transfer and also reduces viscosity of the medium However
complications of chain transfer may arise and thus selection of solvent must be carefully made
The polymerization proceeds in three stages (1) initiation an active center which acts as a chain
carrier is formed (2) propagation growth of the macromolecule by a kinetic chain mechanism where
monomers are added to the growing chain (3) termination the active center is transferred or
neutralized which stops the progress of the kinetic chain [18]
8
Initiation
The initiation step begins with an initiator that decomposes into free radicals R when subjected to
heat electromagnetic radiation or a chemical process see reaction (1) The free radical will have an
active center which is the location of the unpaired electrons The instability of the carbon double
bond of the monomer M makes it susceptive to reaction with the free radicalrsquos unpaired electrons
hence the active center of the free radical can ldquograbrdquo one electron from the double bond of the
monomer creating a new active center at the end of the chain as it leaves an unpaired electron [19]
(1)
The amount of generated radicals effective in the creation of a kinetic chain can be expressed as the
efficiency factor f (0-1) A low efficiency factor will lead to inefficient chain propagation and can be
due to several factors where one is primary recombination which is a result of to radicals combining
see reaction (2)
(2)
This can occur if the solution impedes the radical fragments leading to a cage effect The solvent
plays an important part in solution free-radical polymerization as the extent of decomposition of the
initiator varies with the solvent An example is the decomposition of benzoyl peroxide where in
tetrachloroethylene it only decomposes up to 35 while it is 85 in ethyl acetate [18]
Propagation
When the synthesis has been initiated it is followed by the propagation reaction In free radical
polymerization the propagation process usually takes place within a fraction of a second The
propagation steps are similar to the initiation where electrons are transferred and the active center
is moved down the chain see reaction (3)
(3)
The propagation comes to an end when the termination occurs [18]
Termination
The termination is the step where the active center is either transferred to another chain or
neutralized There are two ways in which the termination can take place by combination or
disproportionation
Combination
The termination reaction combination is between two end chains where they couple together to
form one long chain as seen in Scheme 4
9
Scheme 4 Combination of two growing chains into one polymer
Disproportionation
This occurs when hydrogen abstractions takes place in one end forming a carbon double bond and
resulting in two dead polymer chains see Scheme 5 [18]
Scheme 5 Disproportionation of two growing chains into two dead polymer chains
Chain transfer
Chain transfer occurs when the active center of a growing polymer is transferred to another species
through a collision There are several types of chain transfer In general hydrogen abstraction from
monomer initiator polymer solvent and modifier There are five concepts of chain transfer transfer
to monomer transfer to initiator transfer to polymer transfer to modifier and transfer to solvent
[18]
Copolymer equation When using two or more monomers in a free radical polymerization the term is known as
copolymerization By copolymerizing two monomers the properties of the resulting polymer are
often better than the properties for the parent homopolymers The simplest case of
copolymerization involves two monomers (eg M1 and M2) but can be presented in several different
structures within the copolymer such as Statistical copolymer Alternating copolymers Block
copolymers Graft copolymers and Stereoblock copolymer [18]
The copolymerization between two monomers M1 and M2 is presented in equations (51)-(54)
where k11k22 and k12k21 correspond to self-propagating and cross-propagating rate constants
respectively [18]
(51)
(52)
(53)
(54)
The rate of consumption of M1 can be determined according to equation (6) if steady state
conditions prevail and the radical activity only depends on the nature of the terminal unit [18]
10
(6)
The rate of consumption for M2 is then
(7)
By assuming that
the copolymer equation is obtained by dividing
equation (6) by equation (7) so that
(8)
where r1 and r2 represent relative reactivity ratios from and
Several limiting cases of r can be derived
block copolymerization since both reactivity ratios are larger than unity the propagating monomers prefer to react with themselves forming blocks of M1 and M2
block copolymerization since the reactivity ratios are much higher than unity there is no inclination for the monomers to react with each other leading to two homopolymers
ideal copolymerization the propagating species M1 and M2 have the same preference for adding one or the other resulting in a random copolymer
alternating copolymerization each of the two propagating species prefers adding the other monomer
M1 is more reactive toward both propagating species and the copolymer will contain more of the reactive monomer in statistical placement [20]
Characterization methods
Contact angle
The spreading or deformation of a water droplet on a solid surface is determined by the surface and
interfacial energies The contact angle θ is the angle under which the droplet meets the surface and
may be evaluated by taking into account the three interfacial tensions in Figure 8
ndash between surface and liquid
ndash between surface and gas
ndash between liquid and gas
Figure 8 Different contact angles of a water droplet on a solid surface
11
The contact angle is also a quantification of the wetting of the solid by the liquid and is determined
by Youngs equation
(9)
The lower θ the better the wetting Poorly wetting systems may eg be water on Teflon where the
water droplet rolls off the surface hence θ approaches 180deg The other opposite is when the liquid
spreads and covers the surface complete wetting is achieved and θ approaches 0deg [21 22]
Moisture vapor transmission rate (MVTR)
The definition of moisture vapor transmission rate (also water vapor transmission rate) is as follows
The rate of water vapor flow under steady specified conditions through a unit area of a material
between its two parallel surfaces and normal to the surfaces [23]
And the metric unit of measurements is
12
TRIS
MAA
5 mol
10 mol
15 mol
DMAEMA
5 mol
10 mol
15 mol
NIPAM
5 mol
10 mol
15 mol
HEAA
5 mol
10 mol
15 mol
3 Experimental
Chemicals Table 2 Chemicals used in this project
Monomers Solvents Initiator Silicone PSA
TRIS (from Sigma-Aldrich) EtOAc (from Sigma-Aldrich) AIBN (from
Chalmers) MED 6350 (from Nusil)
NIPAM (from Sigma-Aldrich) MeOH (from Sigma-Aldrich)
DMAEMA (from Sigma-
Aldrich)
MAA (from Sigma-Aldrich)
HEAA (from Sigma-Aldrich)
Methodology
Synthesis and purification of copolymer
In the synthesis of the copolymer monomer weight was kept at 50 g for all the experiments Amount
of initiator was kept at approximately 0087 g and the solvent was kept at 120 g generating a 30 wt
solution
The synthesis was carried out in a round bottom flask see Picture 1 placed in an oil bath holding 65
degC The two monomers (TRIS and MAADMAEMANIPAMHEAA) see Figure 9 were added to the
flask with solvent and initiator Stirring was important throughout the entire synthesis to promote
good mixing The synthesis for each copolymer lasted for six hours For more detailed description see
Appendix I
The copolymer solution was purified by precipitation in methanol see Picture 2 This is because the
copolymer is not soluble in methanol while the pure monomers are In Picture 3 the precipitated
copolymer is shown
Figure 9 A scheme of poly[TRIS]-combinations and molar percentages of MAADMAEMANIPAMHEAA
13
Formulation of copolymer and two component system Each copolymer was blended with MED 6350 (a commercial PDMS polymer) in a 120 ratio of
copolymer to MED 6350 The blends were cast onto PUR-films and then cured on a heating plate to
generate the final PSA For more details see Appendix II
Contact angle measurements The contact angle measurements were performed on the formulations above and not on the pure
copolymers Each formulated film was measured with the EASYDROP Contact angle Measurement
System see Picture 4 using deionized water Three positions were measured for every formulated
film during 60 seconds to ensure a correct average contact angle More details in Appendix II
Picture 1 Synthesis reaction set-up Picture 2 Copolymer purification set-up
Picture 3 A close-up of the precipitated copolymer
14
Picture 4 Contact angle measurement equipment
Moisture vapor transmission rate (ID T-1070)
A cylinder was filled with deionized water up to a level leaving a 5 mm air gap The produced films
from the formulations three specimens of each were punched out in a circular shape larger than the
opening of the cylinders The cylinder was covered with the specimen weighed and placed in an
oven (37degC) for 24 hours After 24 hours the cylinder with the specimen was weighed again and
moisture vapor transmission rate could be obtained by calculating the loss of water
NMR and SEC 1H NMR spectrum was recorded on a Varian 400 spectrometer The samples were dissolved in CDCl3
and the 1H NMR spectra were obtained at 298 K with CDCl3 as internal standard Size-exclusion
chromatography (SEC) was performed on a Waters Alliance 2000 GPCV at 135degC with 124-
trichlorobenzene as eluent at 1 mLmin using an RI-detector It was calibrated using polystyrene
standards
Failed method GF31 is a chemical similar to TRIS but much cheaper see Figure 10 and 11 The first synthesis was
therefore done with GF31 instead of TRIS The first polymerization was between GF31 and MAA
Table 3
Table 3 First synthesis between GF31 and MAA
Chemical Amount
GF31 11195 (g)
MAA 3754 (g)
EtOAc 350 (g) (+ 400 mL)
AIBN 095 (g)
This first synthesis was done in a batch size of 500 g A reactor with a built in heat controlled oil
circulation was used with a SVL multi-joint lid 5-NECK on top Through the center neck a mechanical
stirrer passed and through the others nitrogen gas was connected and in-let of chemicals occurred
15
the rest were sealed The synthesis progressed in the same manner as described in Chapter 3 ndash
Synthesis and purification of copolymer Problems faced here were leakage of solvent and GF31
interaction with MAA As seen in Table 3 an extra amount (400 mL) of EtOAc was added during the
synthesis due to fact that 80 of the solvent (EtOAc) had evaporated within six hours GF31 (since it
is different from TRIS) formed a type of hard brittle white copolymer instead of the expected clear
tough and rubbery copolymer The ndashSi-O-Me groups of GF31 are probably more reactive than the
TMS groups of TRIS leading to the hard brittle copolymer formed However the side group of
monomer GF31 is not flexible enough to form a soft polymer and less MAA would improve the
softness Even though later on the leakage problem was solved (by sealing the center neck better)
the reactor was disregarded as an optimal set-up and was replaced by round bottom flask (reactor
with batch size 150 g) with a rubber septa using TRIS instead of GF31
Figure 10 Chemical structure of TRIS Figure 11 Chemical structure of GF31
16
4 Results and discussion
Polymerization
Yield
The yield does not take into consideration amount of monomer left in the copolymer In Chapter 4 ndash
NMR calculations of copolymer composition and percentage of monomer left are made For some
copolymers eg sample 1 the yield is much lower than for the rest as seen in Table 4 This may be
due to loss of copolymer in the first purification method see Appendix I Sample 1 (15 MAA)
showed some solubility in MeOH which means that when excess MeOHEtOAc was poured off some
polymer residue may also have been poured off hence the lower yield Also in the precipitation
method the solution started to become turbid when all copolymer solution had been blended with
the MeOH this was a fact for all copolymers The EtOAc to MeOH ratio was probably too small and
the copolymer started to dissolve There was most likely some loss of copolymer in this step too It
would probably have been better to use a larger quantity MeOH to avoid dissolution of the
copolymer
The best yield was expected for sample 8-9 as they had not been purified by the first method first
and hence the loss of polymer was strictly restricted to the new method But as seen the yield is 63
for Sample 8 and 70 for sample 9
Sample 7-9 are the poly[TRIS-co-HEAA] copolymers Amount of HEAA increases from sample 7 to
sample 9 and hence increased hydrophilicity The reason to why there is a loss of polymer in the
purification step could be that the copolymer (as the HEAA increases) became more soluble in
MeOH But as seen in Table 4 sample 7-9 are the copolymers containing the highest amount of TRIS
This speaks against the possibility of increasing HEAA contributing to increased hydrophilicity and
thus making the copolymer soluble in MeOH Also sample 9 should be more soluble in MeOH than
sample 8 as it contains more HEAA The same behavior is seen in sample 4-6 (poly[TRIS-co-NIPAM])
where there is a larger loss of copolymer for sample 4 than for sample 6 It seems that the yield is
somewhat circumstantial
17
Table 4 Results from all evaluations
18
SEC ndash molecular weight
According to the patent application it is stated that the molecular weight is larger than 10 000 gmol
In Figure 12 and 13 and Appendix III Figure 16-17 all values show a MW well above 10 000 gmol at
the lowest 360 000 gmol and for the highest at 508 000 gmol SEC was only done on Sample A-C
see Table 4 and Sample 2 as the copolymers are TRIS-based it is assumed that the rest of the
copolymers possess a similar molecular weight The second peak in both figures represents some
low molecular substance probably monomer residue Before H-NMR measurements Sample 2 was
purified one more time see Appendix I First purification method
Figure 12 SEC of Sample 2 Mw = 360 000 gmol
Figure 13 SEC of Sample A MW= 485 000 gmol
19
1H- NMR
Figure 14 NMR of Sample 1
1H- NMR was done to be able to calculate the composition in the copolymer Calculations are shown
below on Figure 14
(10)
where xT and xM are fractions of TRIS and MAA in the copolymer respectively
(11)
Applying equation (10) into equation (11) and
(expected value is 85 )
The two peaks at 610 ppm and 554 ppm are from the double bonds in the two monomers
(12)
Where xMo is the fraction of monomer left in the copolymer
20
Since xT is 8075 of the copolymer composition xMo is then
According to the calculations above there is approximately 392 monomer residue left in the
copolymer That is quite a large difference to 108 left in sample A (calculated in the same manner
as above) which was purified by the first purification method see Appendix I First purification
method
Table 4 presents the copolymer compositions for each copolymer These data are not exact as the
integrals were calculated by hand in MestreNova an analytical chemistry software suite This results
in an inaccuracy that has to be taken into account and the data showed above has to be considered
as approximate values For all the copolymers there is a continuous increase of the comonomer
which is consistent with the expected values
One copolymer is standing out from the others and it is poly[TRIS-co-HEAA] (sample 7-9) The
expected (the input) percentage of HEAA was 5 ndash 10 ndash 15 but the output was approximately 3 ndash 5 ndash
10 which means that TRIS has less affinity for HEAA than for the rest of the monomers Hence one
can assume leading to TRIS being more reactive toward both propagating species
and the copolymer will contain more of the reactive monomer (TRIS) in statistical placement In
comparison TRIS to the other monomers the r values were as can be seen in
Table 4 where the output was larger than 5 ndash 10 ndash 15 for the comonomers (exception DMAEMA
where 5 was input and 239 was output)
As seen in Table 4 the amount of monomer left in the copolymer varies between 077 ndash 392 for
the polymer purified by precipitation For copolymers A-C the level of monomers left are much
higher (85 ndash 137 ) and this proves that the first purification method was insufficient
Contact angle measurements All contact angle measurements were performed on the formulated films and not on the pure
copolymers
As seen in Table 4 the contact angle (deg) of the copolymer formulations does not differ from the
reference formulation (pure MED 6350) especially much The contact angle was expected to be lower
than the reference but as seen it is higher for sample 7 The contact angle is in the interval 121deg -
128deg and is too narrow to say anything about whether the contact angle actually has been modified
or not One reason to why these measurements may not have been very accurate is the fact that the
angle was measured on a droplet that was out in the open Lights from the surroundings and air
conditioning in the room could have affected the measurements Observed during the measurement
was that the droplet size steadily decreased which either means that the droplet evaporates or that
the surface has changed Had these measurements been done in a closed environment of the
droplet then perhaps there would have been different values
Another fact to why there is such little change in the contact angle is that silicones are highly
hydrophobic materials and since there is a very small amount of hydrophilic material integrated in
the silicone a large difference in the contact angle is really not expected Had there been a large
21
difference in contact angle the possibility of migration within the formulation of the hydrophilic
copolymer could be a reason However that was not the case and is very unlikely since the
copolymers are large molecules and the probability of migration is therefore small
Moisture vapor transmission rate The higher MVTR the better vapor transmission As seen in Table 4 all formulations show higher
MVTR than the reference This means that the formulations containing the hydrophilic copolymers
actually breathe better and are more likely to let vapor through Sample 4 [poly(TRIS-co-NIPAM(5
mol))] has an MVTR that is 139 better than the reference The rest of the formulations show an
improvement between 6 ndash 90 As only three tests on each formulation was done it is not
statistically correct to say that there has been an improvement of the MVTR as there is no clear
standard deviation to take into account However all formulations show higher MVTR than the
reference
Figure 15 MVTR data for all samples Blue = values for each test Red = average
In the investigated patent application there was no MVTR-testing done However testing of wet
adhesion was done by taking a 1-inch by 15-inch strip of adhesive and attach it to the abdominal skin
of a human subject and removing it after 40-60 min of aerobic activity [2] According to their results
good wet adhesion was achieved with the formulation containing 5 mol NIPAM and weak wet
adhesion was achieved with the formulation containing 5 mol DMAEMA sample 4 (MVTR = 1058)
and 2 (MVTR = 838) respectively in this project These two formulations showed best MVTR results
and are in accordance with the patent application investigated Why the formulations with lower
amount of polar part showed the best MVTR values must be due to morphology However due to
monomer residue wet adhesion testing on humans was not possible
22
There were some formulations with bubbles in the film seen Picture 5 and 6 Especially sample 2 4
and 8 This may have affected the MVTR and contributed to a higher value than expected
Formulation 8 had also a large amount of bubbles but a low MVTR The bubbles may have been
caused by solvent or monomer evaporating or air that has been trapped during the speed mixing As
seen in Figure 15 there is one value for sample 4 that is well above the others Since the value is
almost 50 larger than the second highest value it could be faulty perhaps an increased amount of
bubbles in the film or leakage of the cylinder
Picture 5 From MVTR Representing sample 9 - 7 from left to right
Picture 6 From MVTR Representing sample 2 - 4 from left to right
23
5 Conclusions This study showed that synthesis of hydrophilic silicone copolymers can be relatively easy
performed and the molecular weight achieved was high (Mw gt 500 000 gmol)
1H- NMR showed that the composition in the copolymers was not as the feed monomer composition
For poly[TRIS-co-MAA] and poly[TRIS-co-NIPAM] there was a higher percentage of comonomer than
assumed while the values varied for poly[TRIS-co-DMAEMA] and for poly[TRIS-co-HEAA] there was a
lower percentage of comonomer NMR also indicated monomer residue left in the copolymers
between 077 ndash 392 indicating that the purification step needs to be optimized or repeated more
than once to remove monomers left in the copolymer
According to contact angle measurements wetting of the silicone surface was not greatly affected
As the addition of copolymer was only 5 wt and of those 5 wt only 5 ndash 15 mol contained a
hydrophilic part a large change in contact angle was not expected The contact angle was evaluated
as the patent application [2] stated large change in wet adhesion
The most relevant results for this project were the MVTR results as they portrayed the improvement
of the silicone PSA (pure MED 6350) The MVTR values showed an large increase in water vapor
permeability for sample 2 and 4 5 mol DMAEMA and 5 mol NIPAM respectively If there is a
correlation between good wet adhesion and MVTR = 1058 (sample 4) contra weak wet adhesion
and MVTR = 838 (sample 2) then it is possible to conclude that for the rest of the copolymer samples
(MVTR ltlt 800) no or little wet adhesion was achieved Why there was no radical improvement for
sample C and 3 and sample 5 and 6 (DMAEMA 10-15 mol and NIPAM 10-15 mol respectively)
can be due to the results of sample 2 and 4 being faulty The explanation could also be that the
values are correct and that the addition of only 5 mol was enough to change the morphology of
the film in a way generating a higher MVTR and increasing the mol of comonomer did not change
the morphology in the same way thus not generating a higher MVTR
Overall it can be concluded that this method is not optimal for increasing hydrophilicity of PSAs as
the method is somewhat complicated to perform and the purification of the copolymers is time
consuming and unsatisfactory However silicone compatible copolymers were successfully
synthesized and characterized Taking the data retrieved in regard many questions about the quality
of the patent application are raised
24
6 Future work For this project future work would be to further purify the copolymers and then evaluate their
adhesive properties directly on the skin This would give more realistic values to whether or not the
modified PSAs have achieved better wet adhesion or not Also to redo the formulations without
bubbles and once again measure MVTR To add more analysis in form of morphology analysis to se
whether or not there is a difference in structure between the different formulations
Another project of future work is to evaluate the new patent application from Convatec Technlogies
Inc [24] where PSAs are modified by the addition of a low molecular weight organic hydroxy
containing compound This method is more straight on and does not involve any complicated
synthesis or purification steps It is simply addition of a hydroxy containing compound to a PSA prior
to curing This may be an interesting study for future work
25
7 Acknowledgments Many people have been involved in this master thesis and I would like to thank them for their
support and help
Thanks to
Dennis Hansson and Lars Lindgren my supervisors at Moumllnlycke Health Care that have always been
available for questions taken a great interest in my work and been a great support
Everyone at the Columbus group at Moumllnlycke Health Care thanks for making my time here fun and
interesting
Anders Maringrtensson for helping me with SEC analysis at Chalmers
Renee Kroon for helping me with NMR analysis at Chalmers
Mats Andersson my examiner
Friends and family
26
References [1] Mechan S et al Amphiphilic Silicone Copolymers for Pressure Sensitive Adhesive Applications
Journal of Applied Polymer Science 2010 116 3265-3270
[2] Convatec Technologies Inc Pressure Sensitive Silicone Adhesives with Amphiphilic copolymers
WO2011005839A1 Publication date 13 January 2011
[3] Clarson J S et al Silicones and Silicone-Modified Materials American Chemical Society
Washington (2000)
[4] Pachaly B Achenbach F Herzig C Mautner K Silicones WILEY-VCH Wienheim (2005)
[5] Colas A and Curtis J Silicone Biomaterials History and Chemistry amp Medical Applications of
Silicones httpwwwdowcorningcomcontentpublishedlit52-1069-01pdf 2012-01-17
[6] Ratner Buddy D et al Biomaterials Science ndash An introduction to Materials in Medicine Elsevier
London (2004)
[7] Gay C Stickiness ndash some fundamentals of adhesion Integrative and Comparative Biology 2002
42 1123-1126
[8] V Pocius A Adhesion Kirk-Othmer Encyclopedia of Chemical Technology Vol 1 Page 501
(2002)
[9] John Comyn Adhesion Science Royal Society of Chemistry Paperbacks 1997
[10] Garbassi F et al Polymer surfaces ndash From Physics to Technology John Wiley amp Sons Chichester
(1998)
[11] Covert P Principles of Pressure Sensitive Adhesion httpwwwgluemachinerycomprinciples-
of-pressure-sensitive-adhesionhtml 2012-02-08
[12] TRIS
httpwwwsigmaaldrichcomcatalogProductDetaildoD7=0ampN5=SEARCH_CONCAT_PNO7CBRA
ND_KEYampN4=4461307CALDRICHampN25=0ampQS=ONampF=SPEC 2012-02-08
[13] MAA
httpwwwsigmaaldrichcomcatalogProductDetaildoD7=0ampN5=SEARCH_CONCAT_PNO7CBRA
ND_KEYampN4=640507CFLUKAampN25=0ampQS=ONampF=SPEC 2012-02-08
[14] HEAA
httpwwwsigmaaldrichcomcatalogProductDetaildoD7=0ampN5=SEARCH_CONCAT_PNO7CBRA
ND_KEYampN4=6979317CALDRICHampN25=0ampQS=ONampF=SPEC 2012-02-08
[15] NIPAM
httpwwwsigmaaldrichcomcatalogProductDetaildoD7=0ampN5=SEARCH_CONCAT_PNO7CBRA
ND_KEYampN4=4153247CALDRICHampN25=0ampQS=ONampF=SPEC 2012-02-08
27
[16] DMAEMA
httpwwwsigmaaldrichcomcatalogProductDetaildoD7=0ampN5=SEARCH_CONCAT_PNO7CBRA
ND_KEYampN4=2349077CALDRICHampN25=0ampQS=ONampF=SPEC 2012-02-08
[17] AIBN
httpwwwsigmaaldrichcomcatalogProductDetaildolang=enampN4=441090|ALDRICHampN5=SEARC
H_CONCAT_PNO|BRAND_KEYampF=SPEC 2012-02-09
[18] Cowie JMG and Arrighi V Polymers Chemistry and physics of modern materials Taylor amp
Francis Group (2008)
[19] Wound Care ndash MepilexreghttpwwwmolnlyckecomgbWound-Care-ProductsProduct-
selector---Wound-divisionTabsProductsMepilexactiveTab=3 2011-10-24
[20] Chain copolymerization
httpcesysueducnechemipolychemuploadfilesE585B1E8819AE59088pdf
2012-02-09
[21] Israelachivli Jacob N Intermolecular and surface forcesAcademic Press Burlington (2011)
[22] Lyklema J et al Fundamentals of interface and colloid science Academic press San Diego
(2000)
[23] Gooch Jan W Encyclopedic dictionary of polymers 2 Part 13 Page 815 (2011)
[24] Convatec Technologies Inc Silicone Gel Adhesive with Organic Polyhydroxy Compounds
WO2012003028A1 Publication date 5 January 2012
28
Appendix I ndash Synthesis and purification
The synthesis was carried out by combining TRIS with the other monomers see Figure 9 The
combination resulted in four copolymers divided into three categories variations of 95 90 and 85
mol of TRIS
The procedure for the synthesis of poly[TRIS]-based copolymers by free radical polymerization using
poly[TRIS-co-MAA] as an example is as follows
1 4947 g of TRIS and 056 g of MAA was added to a 250 ml round bottomed flask containing a
magnetic stirring bar
2 To the flask was added 120 g of EtOAc to afford a 30 wt solution
3 The flask was sealed with a rubber septa and flushed with with nitrogen for 10 minutes
4 The flask was then placed in an oil bath as seen in Picture 1
5 0087 g of AIBN dissolved in EtOAc was added to the flask when the temperature of the oil
bath reached 65
6 The reaction was continued for 6 hours and stirred at 65 under N2 atmosphere
7 The solution was poured into a plastic jar sealed and let to cool down to room temperature
Calculations of amount of TRIS and MAA needed for the poly(TRIS-co-MAA) sample 1 see below
(1)
MTRIS = 42281 gmol
MDMAEMA = 15721 gmol
MNIPAM = 11316 gmol
MMAA = 8606 gmol
MHEAA = 11513 gmol
(2)
(3)
(4)
=012316
29
See Table 5-8 for detailed composition of all monomers
Table 5 poly(TRIS-co-MAA)
Monomer Sample A Sample B Sample 1
TRIS (g) 4947 4890 4828
MAA (g) 056 111 178
AIBN (g) 0087 0088 0087
EtOAc (g) 120 120 120
Molar fraction (TRISMAA) 09470053 08990101 08470153
Table 6 poly(TRIS-co-DMAEMA)
Monomer Sample 2 Sample C Sample 3
TRIS (g) 4904 4802 4692
DMAEMA (g) 096 200 308
AIBN (g) 0087 0087 0087
EtOAc (g) 120 120 120
Molar fraction (TRISDMAEMA) 09505 089011 085015
Table 7 poly(TRIS-co-NIPAM)
Monomer Sample 4 Sample 5 Sample 6
TRIS (g) 4932 4856 4775
NIPAM (g) 070 144 225
AIBN (g) 0087 0087 0088
EtOAc (g) 120 120 120
Molar fraction (TRISNIPAM) 095005 090010 08515 Table 8 poly(TRIS-co-HEAA)
Monomer Sample 7 Sample 8 Sample 9
TRIS (g) 4929 4853 4772
HEAA (g) 072 144 230
AIBN (g) 0087 0087 0087
EtOAc (g) 120 120 120
Molar fraction (TRISHEAA) 095005 090010 085015
Sample A B and C were not further evaluated
Purification by precipitation
1 The weight of the crude polymer was adjusted to a 30 wt solution and added to a 250 mL
glass separation funnel
2 1500 mL of MeOH was added to a 2000 mL beaker
3 The copolymer solution was drop wise precipitated into the MeOH while constant stirring as
seen in Picture 2
4 The copolymer seen in Picture 3 (a white tacky soft solid) was then retrieved by pouring off
the solution and picking up the polymer and stored in a sealed cup
30
Some observations made during the purification step are
1 The copolymer precipitates as white threads 2 The copolymer is quite firm and non-sticky 3 The solution is clear until the end where it turns turbid and the copolymer is more tacky and
sticky
First purification method Sample A B and C were not further evaluated as they were purified by another method that proved
to be insufficient to purify polymers In the patent application the purification step was described as
washing the copolymer with MeOH hence in this project the procedure was interpreted into the
following
The copolymer was dried after the synthesis and then dissolved in 20 g EtOAc on that was added the
double amount of MeOH (40 g) The solution was stirred manually with a spoon or such and left to sit
for 24 hours The excess MeOHEtOAc was poured off after 24 hours and 40 g of MeOH was added
again In total the procedure was repeated three times According to NMR spectra there was more
than 10 monomer left after this purification step and that is why the method was disregarded
Sample A B C and 2 were purified by this method but since there was no time left to purify sample
A B and C according to the purification described above they were not further evaluated
As this method showed to be insufficient it was decided to proceed with a more commonly used
method see Chapter 3 - Synthesis and purification of copolymer
31
Appendix II ndash Formulation and contact angle
Formulation The copolymers were blended with a silicone adhesive (two component system) in ratio 120 The
procedure is as follows (poly[TRIS-co-MAA] is set as an example)
1 0798 g of copolymer was blended with a conventional PDMS at 5 wt (5016 g of component A and 5014 g of component B) prior to curing
2 The blend was mixed in a SpeedMixer DAC 150 FVX-K for 30 seconds at speed of 3 500 rpm 3 It was cast onto a PUR-coated film (thickness 20 microm) coating thickness of 300 microm 4 The film was cured on a heating plate 150 degC for 15 minutes
Since the copolymers (after purification) where not dried to a 100 calculations of the percentage of
solvent left had to be done before any formulations could be made
Calculating percentage of solvent left in the wet copolymer was performed as follows (taking Sample
1 as example)
1 343 g of copolymer was set to dry in an oven at 45degC 2 After one day the sample was weighted to 201 g 3 The weight difference is the amount of solvent in the wet copolymer
Table 9 Wt solvent in copolymer after purification
Sample Wet
weight (g) Dry
weight (g) wt solvent in wet
copolymer wt solvent in wet copolymer after
removal of some solvent [FINAL]
1 343 201 4139 3735
2 381 278 2703 2430
3 363 249 3140 2757
4 363 252 3057 2660
5 500 335 3300 1899
6 357 227 3641 2812
7 362 219 3950 2298
8 301 205 3189 2938
9 487 291 4024 3425 Table 10 (g) copolymer needed to acheive a 5 wt in the formulation blend (based on Table 10 last column)
Formulation (sample)
Wet copolymer (g) Component A (g) Component B (g) wt copolymer in
blend
1 0798 5016 5014 475
2 0655 5036 5057 468
3 0692 5018 5037 475
4 0678 5013 5024 472
5 0615 5028 5020 472
6 0698 5029 5023 475
7 0699 5027 5034 507
8 0716 5018 5050 478
9 0761 4968 4934 482
32
Contact angle Contact angle measurements were performed on a EASYDROP Contact Angle Measurement System
from KRUumlSS with DSA1 control and evaluating software
1 A sample size 2 cm x 5 cm was taken from each formulation 2 One sample at a time was put on the sample table see Picture 4 3 The sample was illuminated with a PC-controlled illumination 4 The syringe was filled with deionized water and a droplet size 3 microL was produced at the tip
of the needle and applied on the surface 5 Pressing start in the computer software system the measurements started and proceeded for
one minute 6 Three positions were tested on each sample
33
Appendix III ndash Results
MVTR For the calculations of the MVTR values Equation (1) was applied
(1)
where
In this experimental setup deionized water was used as liquid and the test period was set to 24
hours
Table 11 MVTR raw data (red-marked number is disregarded)
Formulation W1 (g) W2 (g) W1-W2 (g) Average (g)
1
2119196 2114015 05181
05299 2123917 2118254 05663
2130770 2125716 05054
2
2120806 2111452 09354
08383 2128864 2121294 0757
2114589 2106363 08226
3
2137987 2133518 04469
04917 2119481 2114588 04893
2134925 2129537 05388
4
2134925 2121103 13822
1058 2134836 2125515 09321
1938189 1929592 08597
5
2140372 2135713 04659
04681 2138197 2133245 04952
2124946 2120513 04433
6
2127705 2121994 05711
05937 2124817 2117913 06904
2147531 2142335 05196
7
2116362 2111662 04700
04701 2121055 2116317 04738
2126865 2122200 04665
8
2138735 2133730 05005
05050 2134656 2129915 04741
2107122 2101718 05404
9
2121140 2116611 04529
04998 2140479 2134419 06060
2135159 2130754 04405
R 2127272 2122760 04512
04412 2138336 2134024 04312
34
SEC
Figure 16 SEC of Sample B MW = 508 456 gmol
Figure 17 SEC of Sample C MW = 443 117 gmol
35
1H- NMR
Figure 18 NMR of Sample A
Figure 19 NMR of Sample B
36
Figure 20 NMR of Sample 2
Figure 21 NMR of Sample C
37
Figure 22 NMR of Sample 3
Figure 23 NMR of Sample 4
38
Figure 24 NMR of Sample 5
Figure 25 NMR of Sample 6
39
Figure 26 NMR of Sample 7
Figure 27 NMR of Sample 8
40
Figure 28 NMR of Sample 9

6
where α1 and α2 are the molecules polarizabilities and I1 and I2 are their ionization potentials [9]
Mechanical interlocking
A soft tacky adhesive can enter irregularities found in substrates with irregular surface see Figure 1
(a) This is called mechanical interlocking and it occurs when an adhesive can wet a surface creating
a bonding force Silicone pressure sensitive adhesives as silicones flow readily can penetrate into a
porous or rough substrate (such as skin) and create a mechanical bond [9 11]
Monomers used in the project
TRIS
3-[Tris(trimethylsiloxy)silyl]propyl methacrylate (TRIS) is a silicone based monomer with the chemical
formula C16H38O5Si4 Figure 2 illustrates the chemical structure TRIS is used as the basemonomer
and constitutes the largest part in the copolymers This is because TRIS has TMS groups short for
trimethylsilyl -Si(CH3)3 which makes it similar to PDMS and thus contributes to the good miscibility
with the PDMS [12]
Figure 2 TRIS monomer
TRIS belongs to the acrylate family and contains a vinyl group which is crucial for free radical
polymerization (see Chapter 2 Free radical polymerization in solution)
MAA
Metharcylic acid (MAA) is also a member of the acrylate family and has the chemical formula C4H6O2
Figure 3 illustrates the chemical structure of MAA [13]
Figure 3 MAA monomer
HEAA
N-Hydroxyethyl acrylamide (HEAA) with the chemical formula C5H9NO2 is an acrylamide having one
nitrogen replacing the oxygen seen in acrylates The chemical structure of HEAA is seen in Figure 4
[14]
7
Figure 4 HEAA monomer
NIPAM
N-Isopropylacrylamide (NIPAM) chemical formula C6H11NO and chemical structure illustrated in
Figure 5 [15]
Figure 5 NIPAM monomer
DMAEMA
2-(Dimethylamino)ethyl methacrylate (DMAEMA) C8H15NO2 This acrylate has the chemical structure
shown in Figure 6 [16]
Figure 6 DMAEMA monomer
Initiator AIBN
Azobisisobutyronitrile (AIBN) is a common initiator used in free radical polymerization Chemical
structure can be seen in Figure 7 [17]
Figure 7 AIBN initiator
Free radical polymerization in solution In free radical polymerization polymers are formed by the addition of free radical building blocks in
this project it is vinyl monomers added onto a growing chain When the polymerization is in a
solution the solvent facilitates heat transfer and also reduces viscosity of the medium However
complications of chain transfer may arise and thus selection of solvent must be carefully made
The polymerization proceeds in three stages (1) initiation an active center which acts as a chain
carrier is formed (2) propagation growth of the macromolecule by a kinetic chain mechanism where
monomers are added to the growing chain (3) termination the active center is transferred or
neutralized which stops the progress of the kinetic chain [18]
8
Initiation
The initiation step begins with an initiator that decomposes into free radicals R when subjected to
heat electromagnetic radiation or a chemical process see reaction (1) The free radical will have an
active center which is the location of the unpaired electrons The instability of the carbon double
bond of the monomer M makes it susceptive to reaction with the free radicalrsquos unpaired electrons
hence the active center of the free radical can ldquograbrdquo one electron from the double bond of the
monomer creating a new active center at the end of the chain as it leaves an unpaired electron [19]
(1)
The amount of generated radicals effective in the creation of a kinetic chain can be expressed as the
efficiency factor f (0-1) A low efficiency factor will lead to inefficient chain propagation and can be
due to several factors where one is primary recombination which is a result of to radicals combining
see reaction (2)
(2)
This can occur if the solution impedes the radical fragments leading to a cage effect The solvent
plays an important part in solution free-radical polymerization as the extent of decomposition of the
initiator varies with the solvent An example is the decomposition of benzoyl peroxide where in
tetrachloroethylene it only decomposes up to 35 while it is 85 in ethyl acetate [18]
Propagation
When the synthesis has been initiated it is followed by the propagation reaction In free radical
polymerization the propagation process usually takes place within a fraction of a second The
propagation steps are similar to the initiation where electrons are transferred and the active center
is moved down the chain see reaction (3)
(3)
The propagation comes to an end when the termination occurs [18]
Termination
The termination is the step where the active center is either transferred to another chain or
neutralized There are two ways in which the termination can take place by combination or
disproportionation
Combination
The termination reaction combination is between two end chains where they couple together to
form one long chain as seen in Scheme 4
9
Scheme 4 Combination of two growing chains into one polymer
Disproportionation
This occurs when hydrogen abstractions takes place in one end forming a carbon double bond and
resulting in two dead polymer chains see Scheme 5 [18]
Scheme 5 Disproportionation of two growing chains into two dead polymer chains
Chain transfer
Chain transfer occurs when the active center of a growing polymer is transferred to another species
through a collision There are several types of chain transfer In general hydrogen abstraction from
monomer initiator polymer solvent and modifier There are five concepts of chain transfer transfer
to monomer transfer to initiator transfer to polymer transfer to modifier and transfer to solvent
[18]
Copolymer equation When using two or more monomers in a free radical polymerization the term is known as
copolymerization By copolymerizing two monomers the properties of the resulting polymer are
often better than the properties for the parent homopolymers The simplest case of
copolymerization involves two monomers (eg M1 and M2) but can be presented in several different
structures within the copolymer such as Statistical copolymer Alternating copolymers Block
copolymers Graft copolymers and Stereoblock copolymer [18]
The copolymerization between two monomers M1 and M2 is presented in equations (51)-(54)
where k11k22 and k12k21 correspond to self-propagating and cross-propagating rate constants
respectively [18]
(51)
(52)
(53)
(54)
The rate of consumption of M1 can be determined according to equation (6) if steady state
conditions prevail and the radical activity only depends on the nature of the terminal unit [18]
10
(6)
The rate of consumption for M2 is then
(7)
By assuming that
the copolymer equation is obtained by dividing
equation (6) by equation (7) so that
(8)
where r1 and r2 represent relative reactivity ratios from and
Several limiting cases of r can be derived
block copolymerization since both reactivity ratios are larger than unity the propagating monomers prefer to react with themselves forming blocks of M1 and M2
block copolymerization since the reactivity ratios are much higher than unity there is no inclination for the monomers to react with each other leading to two homopolymers
ideal copolymerization the propagating species M1 and M2 have the same preference for adding one or the other resulting in a random copolymer
alternating copolymerization each of the two propagating species prefers adding the other monomer
M1 is more reactive toward both propagating species and the copolymer will contain more of the reactive monomer in statistical placement [20]
Characterization methods
Contact angle
The spreading or deformation of a water droplet on a solid surface is determined by the surface and
interfacial energies The contact angle θ is the angle under which the droplet meets the surface and
may be evaluated by taking into account the three interfacial tensions in Figure 8
ndash between surface and liquid
ndash between surface and gas
ndash between liquid and gas
Figure 8 Different contact angles of a water droplet on a solid surface
11
The contact angle is also a quantification of the wetting of the solid by the liquid and is determined
by Youngs equation
(9)
The lower θ the better the wetting Poorly wetting systems may eg be water on Teflon where the
water droplet rolls off the surface hence θ approaches 180deg The other opposite is when the liquid
spreads and covers the surface complete wetting is achieved and θ approaches 0deg [21 22]
Moisture vapor transmission rate (MVTR)
The definition of moisture vapor transmission rate (also water vapor transmission rate) is as follows
The rate of water vapor flow under steady specified conditions through a unit area of a material
between its two parallel surfaces and normal to the surfaces [23]
And the metric unit of measurements is
12
TRIS
MAA
5 mol
10 mol
15 mol
DMAEMA
5 mol
10 mol
15 mol
NIPAM
5 mol
10 mol
15 mol
HEAA
5 mol
10 mol
15 mol
3 Experimental
Chemicals Table 2 Chemicals used in this project
Monomers Solvents Initiator Silicone PSA
TRIS (from Sigma-Aldrich) EtOAc (from Sigma-Aldrich) AIBN (from
Chalmers) MED 6350 (from Nusil)
NIPAM (from Sigma-Aldrich) MeOH (from Sigma-Aldrich)
DMAEMA (from Sigma-
Aldrich)
MAA (from Sigma-Aldrich)
HEAA (from Sigma-Aldrich)
Methodology
Synthesis and purification of copolymer
In the synthesis of the copolymer monomer weight was kept at 50 g for all the experiments Amount
of initiator was kept at approximately 0087 g and the solvent was kept at 120 g generating a 30 wt
solution
The synthesis was carried out in a round bottom flask see Picture 1 placed in an oil bath holding 65
degC The two monomers (TRIS and MAADMAEMANIPAMHEAA) see Figure 9 were added to the
flask with solvent and initiator Stirring was important throughout the entire synthesis to promote
good mixing The synthesis for each copolymer lasted for six hours For more detailed description see
Appendix I
The copolymer solution was purified by precipitation in methanol see Picture 2 This is because the
copolymer is not soluble in methanol while the pure monomers are In Picture 3 the precipitated
copolymer is shown
Figure 9 A scheme of poly[TRIS]-combinations and molar percentages of MAADMAEMANIPAMHEAA
13
Formulation of copolymer and two component system Each copolymer was blended with MED 6350 (a commercial PDMS polymer) in a 120 ratio of
copolymer to MED 6350 The blends were cast onto PUR-films and then cured on a heating plate to
generate the final PSA For more details see Appendix II
Contact angle measurements The contact angle measurements were performed on the formulations above and not on the pure
copolymers Each formulated film was measured with the EASYDROP Contact angle Measurement
System see Picture 4 using deionized water Three positions were measured for every formulated
film during 60 seconds to ensure a correct average contact angle More details in Appendix II
Picture 1 Synthesis reaction set-up Picture 2 Copolymer purification set-up
Picture 3 A close-up of the precipitated copolymer
14
Picture 4 Contact angle measurement equipment
Moisture vapor transmission rate (ID T-1070)
A cylinder was filled with deionized water up to a level leaving a 5 mm air gap The produced films
from the formulations three specimens of each were punched out in a circular shape larger than the
opening of the cylinders The cylinder was covered with the specimen weighed and placed in an
oven (37degC) for 24 hours After 24 hours the cylinder with the specimen was weighed again and
moisture vapor transmission rate could be obtained by calculating the loss of water
NMR and SEC 1H NMR spectrum was recorded on a Varian 400 spectrometer The samples were dissolved in CDCl3
and the 1H NMR spectra were obtained at 298 K with CDCl3 as internal standard Size-exclusion
chromatography (SEC) was performed on a Waters Alliance 2000 GPCV at 135degC with 124-
trichlorobenzene as eluent at 1 mLmin using an RI-detector It was calibrated using polystyrene
standards
Failed method GF31 is a chemical similar to TRIS but much cheaper see Figure 10 and 11 The first synthesis was
therefore done with GF31 instead of TRIS The first polymerization was between GF31 and MAA
Table 3
Table 3 First synthesis between GF31 and MAA
Chemical Amount
GF31 11195 (g)
MAA 3754 (g)
EtOAc 350 (g) (+ 400 mL)
AIBN 095 (g)
This first synthesis was done in a batch size of 500 g A reactor with a built in heat controlled oil
circulation was used with a SVL multi-joint lid 5-NECK on top Through the center neck a mechanical
stirrer passed and through the others nitrogen gas was connected and in-let of chemicals occurred
15
the rest were sealed The synthesis progressed in the same manner as described in Chapter 3 ndash
Synthesis and purification of copolymer Problems faced here were leakage of solvent and GF31
interaction with MAA As seen in Table 3 an extra amount (400 mL) of EtOAc was added during the
synthesis due to fact that 80 of the solvent (EtOAc) had evaporated within six hours GF31 (since it
is different from TRIS) formed a type of hard brittle white copolymer instead of the expected clear
tough and rubbery copolymer The ndashSi-O-Me groups of GF31 are probably more reactive than the
TMS groups of TRIS leading to the hard brittle copolymer formed However the side group of
monomer GF31 is not flexible enough to form a soft polymer and less MAA would improve the
softness Even though later on the leakage problem was solved (by sealing the center neck better)
the reactor was disregarded as an optimal set-up and was replaced by round bottom flask (reactor
with batch size 150 g) with a rubber septa using TRIS instead of GF31
Figure 10 Chemical structure of TRIS Figure 11 Chemical structure of GF31
16
4 Results and discussion
Polymerization
Yield
The yield does not take into consideration amount of monomer left in the copolymer In Chapter 4 ndash
NMR calculations of copolymer composition and percentage of monomer left are made For some
copolymers eg sample 1 the yield is much lower than for the rest as seen in Table 4 This may be
due to loss of copolymer in the first purification method see Appendix I Sample 1 (15 MAA)
showed some solubility in MeOH which means that when excess MeOHEtOAc was poured off some
polymer residue may also have been poured off hence the lower yield Also in the precipitation
method the solution started to become turbid when all copolymer solution had been blended with
the MeOH this was a fact for all copolymers The EtOAc to MeOH ratio was probably too small and
the copolymer started to dissolve There was most likely some loss of copolymer in this step too It
would probably have been better to use a larger quantity MeOH to avoid dissolution of the
copolymer
The best yield was expected for sample 8-9 as they had not been purified by the first method first
and hence the loss of polymer was strictly restricted to the new method But as seen the yield is 63
for Sample 8 and 70 for sample 9
Sample 7-9 are the poly[TRIS-co-HEAA] copolymers Amount of HEAA increases from sample 7 to
sample 9 and hence increased hydrophilicity The reason to why there is a loss of polymer in the
purification step could be that the copolymer (as the HEAA increases) became more soluble in
MeOH But as seen in Table 4 sample 7-9 are the copolymers containing the highest amount of TRIS
This speaks against the possibility of increasing HEAA contributing to increased hydrophilicity and
thus making the copolymer soluble in MeOH Also sample 9 should be more soluble in MeOH than
sample 8 as it contains more HEAA The same behavior is seen in sample 4-6 (poly[TRIS-co-NIPAM])
where there is a larger loss of copolymer for sample 4 than for sample 6 It seems that the yield is
somewhat circumstantial
17
Table 4 Results from all evaluations
18
SEC ndash molecular weight
According to the patent application it is stated that the molecular weight is larger than 10 000 gmol
In Figure 12 and 13 and Appendix III Figure 16-17 all values show a MW well above 10 000 gmol at
the lowest 360 000 gmol and for the highest at 508 000 gmol SEC was only done on Sample A-C
see Table 4 and Sample 2 as the copolymers are TRIS-based it is assumed that the rest of the
copolymers possess a similar molecular weight The second peak in both figures represents some
low molecular substance probably monomer residue Before H-NMR measurements Sample 2 was
purified one more time see Appendix I First purification method
Figure 12 SEC of Sample 2 Mw = 360 000 gmol
Figure 13 SEC of Sample A MW= 485 000 gmol
19
1H- NMR
Figure 14 NMR of Sample 1
1H- NMR was done to be able to calculate the composition in the copolymer Calculations are shown
below on Figure 14
(10)
where xT and xM are fractions of TRIS and MAA in the copolymer respectively
(11)
Applying equation (10) into equation (11) and
(expected value is 85 )
The two peaks at 610 ppm and 554 ppm are from the double bonds in the two monomers
(12)
Where xMo is the fraction of monomer left in the copolymer
20
Since xT is 8075 of the copolymer composition xMo is then
According to the calculations above there is approximately 392 monomer residue left in the
copolymer That is quite a large difference to 108 left in sample A (calculated in the same manner
as above) which was purified by the first purification method see Appendix I First purification
method
Table 4 presents the copolymer compositions for each copolymer These data are not exact as the
integrals were calculated by hand in MestreNova an analytical chemistry software suite This results
in an inaccuracy that has to be taken into account and the data showed above has to be considered
as approximate values For all the copolymers there is a continuous increase of the comonomer
which is consistent with the expected values
One copolymer is standing out from the others and it is poly[TRIS-co-HEAA] (sample 7-9) The
expected (the input) percentage of HEAA was 5 ndash 10 ndash 15 but the output was approximately 3 ndash 5 ndash
10 which means that TRIS has less affinity for HEAA than for the rest of the monomers Hence one
can assume leading to TRIS being more reactive toward both propagating species
and the copolymer will contain more of the reactive monomer (TRIS) in statistical placement In
comparison TRIS to the other monomers the r values were as can be seen in
Table 4 where the output was larger than 5 ndash 10 ndash 15 for the comonomers (exception DMAEMA
where 5 was input and 239 was output)
As seen in Table 4 the amount of monomer left in the copolymer varies between 077 ndash 392 for
the polymer purified by precipitation For copolymers A-C the level of monomers left are much
higher (85 ndash 137 ) and this proves that the first purification method was insufficient
Contact angle measurements All contact angle measurements were performed on the formulated films and not on the pure
copolymers
As seen in Table 4 the contact angle (deg) of the copolymer formulations does not differ from the
reference formulation (pure MED 6350) especially much The contact angle was expected to be lower
than the reference but as seen it is higher for sample 7 The contact angle is in the interval 121deg -
128deg and is too narrow to say anything about whether the contact angle actually has been modified
or not One reason to why these measurements may not have been very accurate is the fact that the
angle was measured on a droplet that was out in the open Lights from the surroundings and air
conditioning in the room could have affected the measurements Observed during the measurement
was that the droplet size steadily decreased which either means that the droplet evaporates or that
the surface has changed Had these measurements been done in a closed environment of the
droplet then perhaps there would have been different values
Another fact to why there is such little change in the contact angle is that silicones are highly
hydrophobic materials and since there is a very small amount of hydrophilic material integrated in
the silicone a large difference in the contact angle is really not expected Had there been a large
21
difference in contact angle the possibility of migration within the formulation of the hydrophilic
copolymer could be a reason However that was not the case and is very unlikely since the
copolymers are large molecules and the probability of migration is therefore small
Moisture vapor transmission rate The higher MVTR the better vapor transmission As seen in Table 4 all formulations show higher
MVTR than the reference This means that the formulations containing the hydrophilic copolymers
actually breathe better and are more likely to let vapor through Sample 4 [poly(TRIS-co-NIPAM(5
mol))] has an MVTR that is 139 better than the reference The rest of the formulations show an
improvement between 6 ndash 90 As only three tests on each formulation was done it is not
statistically correct to say that there has been an improvement of the MVTR as there is no clear
standard deviation to take into account However all formulations show higher MVTR than the
reference
Figure 15 MVTR data for all samples Blue = values for each test Red = average
In the investigated patent application there was no MVTR-testing done However testing of wet
adhesion was done by taking a 1-inch by 15-inch strip of adhesive and attach it to the abdominal skin
of a human subject and removing it after 40-60 min of aerobic activity [2] According to their results
good wet adhesion was achieved with the formulation containing 5 mol NIPAM and weak wet
adhesion was achieved with the formulation containing 5 mol DMAEMA sample 4 (MVTR = 1058)
and 2 (MVTR = 838) respectively in this project These two formulations showed best MVTR results
and are in accordance with the patent application investigated Why the formulations with lower
amount of polar part showed the best MVTR values must be due to morphology However due to
monomer residue wet adhesion testing on humans was not possible
22
There were some formulations with bubbles in the film seen Picture 5 and 6 Especially sample 2 4
and 8 This may have affected the MVTR and contributed to a higher value than expected
Formulation 8 had also a large amount of bubbles but a low MVTR The bubbles may have been
caused by solvent or monomer evaporating or air that has been trapped during the speed mixing As
seen in Figure 15 there is one value for sample 4 that is well above the others Since the value is
almost 50 larger than the second highest value it could be faulty perhaps an increased amount of
bubbles in the film or leakage of the cylinder
Picture 5 From MVTR Representing sample 9 - 7 from left to right
Picture 6 From MVTR Representing sample 2 - 4 from left to right
23
5 Conclusions This study showed that synthesis of hydrophilic silicone copolymers can be relatively easy
performed and the molecular weight achieved was high (Mw gt 500 000 gmol)
1H- NMR showed that the composition in the copolymers was not as the feed monomer composition
For poly[TRIS-co-MAA] and poly[TRIS-co-NIPAM] there was a higher percentage of comonomer than
assumed while the values varied for poly[TRIS-co-DMAEMA] and for poly[TRIS-co-HEAA] there was a
lower percentage of comonomer NMR also indicated monomer residue left in the copolymers
between 077 ndash 392 indicating that the purification step needs to be optimized or repeated more
than once to remove monomers left in the copolymer
According to contact angle measurements wetting of the silicone surface was not greatly affected
As the addition of copolymer was only 5 wt and of those 5 wt only 5 ndash 15 mol contained a
hydrophilic part a large change in contact angle was not expected The contact angle was evaluated
as the patent application [2] stated large change in wet adhesion
The most relevant results for this project were the MVTR results as they portrayed the improvement
of the silicone PSA (pure MED 6350) The MVTR values showed an large increase in water vapor
permeability for sample 2 and 4 5 mol DMAEMA and 5 mol NIPAM respectively If there is a
correlation between good wet adhesion and MVTR = 1058 (sample 4) contra weak wet adhesion
and MVTR = 838 (sample 2) then it is possible to conclude that for the rest of the copolymer samples
(MVTR ltlt 800) no or little wet adhesion was achieved Why there was no radical improvement for
sample C and 3 and sample 5 and 6 (DMAEMA 10-15 mol and NIPAM 10-15 mol respectively)
can be due to the results of sample 2 and 4 being faulty The explanation could also be that the
values are correct and that the addition of only 5 mol was enough to change the morphology of
the film in a way generating a higher MVTR and increasing the mol of comonomer did not change
the morphology in the same way thus not generating a higher MVTR
Overall it can be concluded that this method is not optimal for increasing hydrophilicity of PSAs as
the method is somewhat complicated to perform and the purification of the copolymers is time
consuming and unsatisfactory However silicone compatible copolymers were successfully
synthesized and characterized Taking the data retrieved in regard many questions about the quality
of the patent application are raised
24
6 Future work For this project future work would be to further purify the copolymers and then evaluate their
adhesive properties directly on the skin This would give more realistic values to whether or not the
modified PSAs have achieved better wet adhesion or not Also to redo the formulations without
bubbles and once again measure MVTR To add more analysis in form of morphology analysis to se
whether or not there is a difference in structure between the different formulations
Another project of future work is to evaluate the new patent application from Convatec Technlogies
Inc [24] where PSAs are modified by the addition of a low molecular weight organic hydroxy
containing compound This method is more straight on and does not involve any complicated
synthesis or purification steps It is simply addition of a hydroxy containing compound to a PSA prior
to curing This may be an interesting study for future work
25
7 Acknowledgments Many people have been involved in this master thesis and I would like to thank them for their
support and help
Thanks to
Dennis Hansson and Lars Lindgren my supervisors at Moumllnlycke Health Care that have always been
available for questions taken a great interest in my work and been a great support
Everyone at the Columbus group at Moumllnlycke Health Care thanks for making my time here fun and
interesting
Anders Maringrtensson for helping me with SEC analysis at Chalmers
Renee Kroon for helping me with NMR analysis at Chalmers
Mats Andersson my examiner
Friends and family
26
References [1] Mechan S et al Amphiphilic Silicone Copolymers for Pressure Sensitive Adhesive Applications
Journal of Applied Polymer Science 2010 116 3265-3270
[2] Convatec Technologies Inc Pressure Sensitive Silicone Adhesives with Amphiphilic copolymers
WO2011005839A1 Publication date 13 January 2011
[3] Clarson J S et al Silicones and Silicone-Modified Materials American Chemical Society
Washington (2000)
[4] Pachaly B Achenbach F Herzig C Mautner K Silicones WILEY-VCH Wienheim (2005)
[5] Colas A and Curtis J Silicone Biomaterials History and Chemistry amp Medical Applications of
Silicones httpwwwdowcorningcomcontentpublishedlit52-1069-01pdf 2012-01-17
[6] Ratner Buddy D et al Biomaterials Science ndash An introduction to Materials in Medicine Elsevier
London (2004)
[7] Gay C Stickiness ndash some fundamentals of adhesion Integrative and Comparative Biology 2002
42 1123-1126
[8] V Pocius A Adhesion Kirk-Othmer Encyclopedia of Chemical Technology Vol 1 Page 501
(2002)
[9] John Comyn Adhesion Science Royal Society of Chemistry Paperbacks 1997
[10] Garbassi F et al Polymer surfaces ndash From Physics to Technology John Wiley amp Sons Chichester
(1998)
[11] Covert P Principles of Pressure Sensitive Adhesion httpwwwgluemachinerycomprinciples-
of-pressure-sensitive-adhesionhtml 2012-02-08
[12] TRIS
httpwwwsigmaaldrichcomcatalogProductDetaildoD7=0ampN5=SEARCH_CONCAT_PNO7CBRA
ND_KEYampN4=4461307CALDRICHampN25=0ampQS=ONampF=SPEC 2012-02-08
[13] MAA
httpwwwsigmaaldrichcomcatalogProductDetaildoD7=0ampN5=SEARCH_CONCAT_PNO7CBRA
ND_KEYampN4=640507CFLUKAampN25=0ampQS=ONampF=SPEC 2012-02-08
[14] HEAA
httpwwwsigmaaldrichcomcatalogProductDetaildoD7=0ampN5=SEARCH_CONCAT_PNO7CBRA
ND_KEYampN4=6979317CALDRICHampN25=0ampQS=ONampF=SPEC 2012-02-08
[15] NIPAM
httpwwwsigmaaldrichcomcatalogProductDetaildoD7=0ampN5=SEARCH_CONCAT_PNO7CBRA
ND_KEYampN4=4153247CALDRICHampN25=0ampQS=ONampF=SPEC 2012-02-08
27
[16] DMAEMA
httpwwwsigmaaldrichcomcatalogProductDetaildoD7=0ampN5=SEARCH_CONCAT_PNO7CBRA
ND_KEYampN4=2349077CALDRICHampN25=0ampQS=ONampF=SPEC 2012-02-08
[17] AIBN
httpwwwsigmaaldrichcomcatalogProductDetaildolang=enampN4=441090|ALDRICHampN5=SEARC
H_CONCAT_PNO|BRAND_KEYampF=SPEC 2012-02-09
[18] Cowie JMG and Arrighi V Polymers Chemistry and physics of modern materials Taylor amp
Francis Group (2008)
[19] Wound Care ndash MepilexreghttpwwwmolnlyckecomgbWound-Care-ProductsProduct-
selector---Wound-divisionTabsProductsMepilexactiveTab=3 2011-10-24
[20] Chain copolymerization
httpcesysueducnechemipolychemuploadfilesE585B1E8819AE59088pdf
2012-02-09
[21] Israelachivli Jacob N Intermolecular and surface forcesAcademic Press Burlington (2011)
[22] Lyklema J et al Fundamentals of interface and colloid science Academic press San Diego
(2000)
[23] Gooch Jan W Encyclopedic dictionary of polymers 2 Part 13 Page 815 (2011)
[24] Convatec Technologies Inc Silicone Gel Adhesive with Organic Polyhydroxy Compounds
WO2012003028A1 Publication date 5 January 2012
28
Appendix I ndash Synthesis and purification
The synthesis was carried out by combining TRIS with the other monomers see Figure 9 The
combination resulted in four copolymers divided into three categories variations of 95 90 and 85
mol of TRIS
The procedure for the synthesis of poly[TRIS]-based copolymers by free radical polymerization using
poly[TRIS-co-MAA] as an example is as follows
1 4947 g of TRIS and 056 g of MAA was added to a 250 ml round bottomed flask containing a
magnetic stirring bar
2 To the flask was added 120 g of EtOAc to afford a 30 wt solution
3 The flask was sealed with a rubber septa and flushed with with nitrogen for 10 minutes
4 The flask was then placed in an oil bath as seen in Picture 1
5 0087 g of AIBN dissolved in EtOAc was added to the flask when the temperature of the oil
bath reached 65
6 The reaction was continued for 6 hours and stirred at 65 under N2 atmosphere
7 The solution was poured into a plastic jar sealed and let to cool down to room temperature
Calculations of amount of TRIS and MAA needed for the poly(TRIS-co-MAA) sample 1 see below
(1)
MTRIS = 42281 gmol
MDMAEMA = 15721 gmol
MNIPAM = 11316 gmol
MMAA = 8606 gmol
MHEAA = 11513 gmol
(2)
(3)
(4)
=012316
29
See Table 5-8 for detailed composition of all monomers
Table 5 poly(TRIS-co-MAA)
Monomer Sample A Sample B Sample 1
TRIS (g) 4947 4890 4828
MAA (g) 056 111 178
AIBN (g) 0087 0088 0087
EtOAc (g) 120 120 120
Molar fraction (TRISMAA) 09470053 08990101 08470153
Table 6 poly(TRIS-co-DMAEMA)
Monomer Sample 2 Sample C Sample 3
TRIS (g) 4904 4802 4692
DMAEMA (g) 096 200 308
AIBN (g) 0087 0087 0087
EtOAc (g) 120 120 120
Molar fraction (TRISDMAEMA) 09505 089011 085015
Table 7 poly(TRIS-co-NIPAM)
Monomer Sample 4 Sample 5 Sample 6
TRIS (g) 4932 4856 4775
NIPAM (g) 070 144 225
AIBN (g) 0087 0087 0088
EtOAc (g) 120 120 120
Molar fraction (TRISNIPAM) 095005 090010 08515 Table 8 poly(TRIS-co-HEAA)
Monomer Sample 7 Sample 8 Sample 9
TRIS (g) 4929 4853 4772
HEAA (g) 072 144 230
AIBN (g) 0087 0087 0087
EtOAc (g) 120 120 120
Molar fraction (TRISHEAA) 095005 090010 085015
Sample A B and C were not further evaluated
Purification by precipitation
1 The weight of the crude polymer was adjusted to a 30 wt solution and added to a 250 mL
glass separation funnel
2 1500 mL of MeOH was added to a 2000 mL beaker
3 The copolymer solution was drop wise precipitated into the MeOH while constant stirring as
seen in Picture 2
4 The copolymer seen in Picture 3 (a white tacky soft solid) was then retrieved by pouring off
the solution and picking up the polymer and stored in a sealed cup
30
Some observations made during the purification step are
1 The copolymer precipitates as white threads 2 The copolymer is quite firm and non-sticky 3 The solution is clear until the end where it turns turbid and the copolymer is more tacky and
sticky
First purification method Sample A B and C were not further evaluated as they were purified by another method that proved
to be insufficient to purify polymers In the patent application the purification step was described as
washing the copolymer with MeOH hence in this project the procedure was interpreted into the
following
The copolymer was dried after the synthesis and then dissolved in 20 g EtOAc on that was added the
double amount of MeOH (40 g) The solution was stirred manually with a spoon or such and left to sit
for 24 hours The excess MeOHEtOAc was poured off after 24 hours and 40 g of MeOH was added
again In total the procedure was repeated three times According to NMR spectra there was more
than 10 monomer left after this purification step and that is why the method was disregarded
Sample A B C and 2 were purified by this method but since there was no time left to purify sample
A B and C according to the purification described above they were not further evaluated
As this method showed to be insufficient it was decided to proceed with a more commonly used
method see Chapter 3 - Synthesis and purification of copolymer
31
Appendix II ndash Formulation and contact angle
Formulation The copolymers were blended with a silicone adhesive (two component system) in ratio 120 The
procedure is as follows (poly[TRIS-co-MAA] is set as an example)
1 0798 g of copolymer was blended with a conventional PDMS at 5 wt (5016 g of component A and 5014 g of component B) prior to curing
2 The blend was mixed in a SpeedMixer DAC 150 FVX-K for 30 seconds at speed of 3 500 rpm 3 It was cast onto a PUR-coated film (thickness 20 microm) coating thickness of 300 microm 4 The film was cured on a heating plate 150 degC for 15 minutes
Since the copolymers (after purification) where not dried to a 100 calculations of the percentage of
solvent left had to be done before any formulations could be made
Calculating percentage of solvent left in the wet copolymer was performed as follows (taking Sample
1 as example)
1 343 g of copolymer was set to dry in an oven at 45degC 2 After one day the sample was weighted to 201 g 3 The weight difference is the amount of solvent in the wet copolymer
Table 9 Wt solvent in copolymer after purification
Sample Wet
weight (g) Dry
weight (g) wt solvent in wet
copolymer wt solvent in wet copolymer after
removal of some solvent [FINAL]
1 343 201 4139 3735
2 381 278 2703 2430
3 363 249 3140 2757
4 363 252 3057 2660
5 500 335 3300 1899
6 357 227 3641 2812
7 362 219 3950 2298
8 301 205 3189 2938
9 487 291 4024 3425 Table 10 (g) copolymer needed to acheive a 5 wt in the formulation blend (based on Table 10 last column)
Formulation (sample)
Wet copolymer (g) Component A (g) Component B (g) wt copolymer in
blend
1 0798 5016 5014 475
2 0655 5036 5057 468
3 0692 5018 5037 475
4 0678 5013 5024 472
5 0615 5028 5020 472
6 0698 5029 5023 475
7 0699 5027 5034 507
8 0716 5018 5050 478
9 0761 4968 4934 482
32
Contact angle Contact angle measurements were performed on a EASYDROP Contact Angle Measurement System
from KRUumlSS with DSA1 control and evaluating software
1 A sample size 2 cm x 5 cm was taken from each formulation 2 One sample at a time was put on the sample table see Picture 4 3 The sample was illuminated with a PC-controlled illumination 4 The syringe was filled with deionized water and a droplet size 3 microL was produced at the tip
of the needle and applied on the surface 5 Pressing start in the computer software system the measurements started and proceeded for
one minute 6 Three positions were tested on each sample
33
Appendix III ndash Results
MVTR For the calculations of the MVTR values Equation (1) was applied
(1)
where
In this experimental setup deionized water was used as liquid and the test period was set to 24
hours
Table 11 MVTR raw data (red-marked number is disregarded)
Formulation W1 (g) W2 (g) W1-W2 (g) Average (g)
1
2119196 2114015 05181
05299 2123917 2118254 05663
2130770 2125716 05054
2
2120806 2111452 09354
08383 2128864 2121294 0757
2114589 2106363 08226
3
2137987 2133518 04469
04917 2119481 2114588 04893
2134925 2129537 05388
4
2134925 2121103 13822
1058 2134836 2125515 09321
1938189 1929592 08597
5
2140372 2135713 04659
04681 2138197 2133245 04952
2124946 2120513 04433
6
2127705 2121994 05711
05937 2124817 2117913 06904
2147531 2142335 05196
7
2116362 2111662 04700
04701 2121055 2116317 04738
2126865 2122200 04665
8
2138735 2133730 05005
05050 2134656 2129915 04741
2107122 2101718 05404
9
2121140 2116611 04529
04998 2140479 2134419 06060
2135159 2130754 04405
R 2127272 2122760 04512
04412 2138336 2134024 04312
34
SEC
Figure 16 SEC of Sample B MW = 508 456 gmol
Figure 17 SEC of Sample C MW = 443 117 gmol
35
1H- NMR
Figure 18 NMR of Sample A
Figure 19 NMR of Sample B
36
Figure 20 NMR of Sample 2
Figure 21 NMR of Sample C
37
Figure 22 NMR of Sample 3
Figure 23 NMR of Sample 4
38
Figure 24 NMR of Sample 5
Figure 25 NMR of Sample 6
39
Figure 26 NMR of Sample 7
Figure 27 NMR of Sample 8
40
Figure 28 NMR of Sample 9
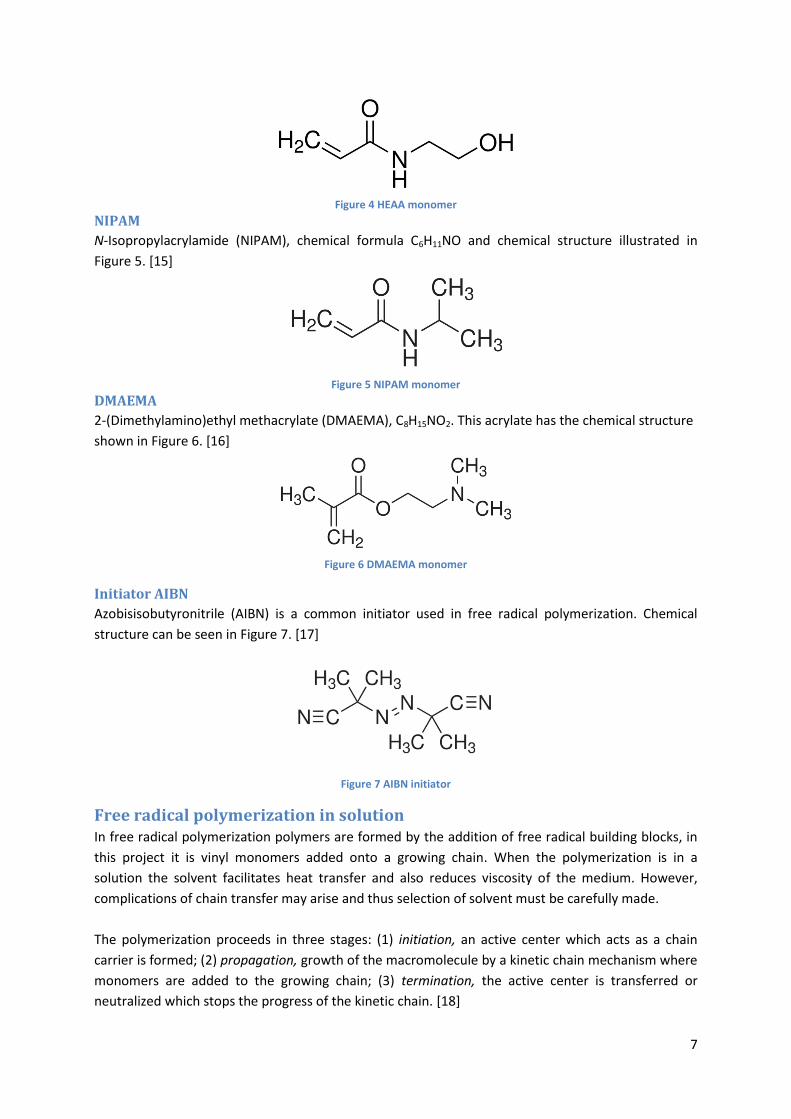
7
Figure 4 HEAA monomer
NIPAM
N-Isopropylacrylamide (NIPAM) chemical formula C6H11NO and chemical structure illustrated in
Figure 5 [15]
Figure 5 NIPAM monomer
DMAEMA
2-(Dimethylamino)ethyl methacrylate (DMAEMA) C8H15NO2 This acrylate has the chemical structure
shown in Figure 6 [16]
Figure 6 DMAEMA monomer
Initiator AIBN
Azobisisobutyronitrile (AIBN) is a common initiator used in free radical polymerization Chemical
structure can be seen in Figure 7 [17]
Figure 7 AIBN initiator
Free radical polymerization in solution In free radical polymerization polymers are formed by the addition of free radical building blocks in
this project it is vinyl monomers added onto a growing chain When the polymerization is in a
solution the solvent facilitates heat transfer and also reduces viscosity of the medium However
complications of chain transfer may arise and thus selection of solvent must be carefully made
The polymerization proceeds in three stages (1) initiation an active center which acts as a chain
carrier is formed (2) propagation growth of the macromolecule by a kinetic chain mechanism where
monomers are added to the growing chain (3) termination the active center is transferred or
neutralized which stops the progress of the kinetic chain [18]
8
Initiation
The initiation step begins with an initiator that decomposes into free radicals R when subjected to
heat electromagnetic radiation or a chemical process see reaction (1) The free radical will have an
active center which is the location of the unpaired electrons The instability of the carbon double
bond of the monomer M makes it susceptive to reaction with the free radicalrsquos unpaired electrons
hence the active center of the free radical can ldquograbrdquo one electron from the double bond of the
monomer creating a new active center at the end of the chain as it leaves an unpaired electron [19]
(1)
The amount of generated radicals effective in the creation of a kinetic chain can be expressed as the
efficiency factor f (0-1) A low efficiency factor will lead to inefficient chain propagation and can be
due to several factors where one is primary recombination which is a result of to radicals combining
see reaction (2)
(2)
This can occur if the solution impedes the radical fragments leading to a cage effect The solvent
plays an important part in solution free-radical polymerization as the extent of decomposition of the
initiator varies with the solvent An example is the decomposition of benzoyl peroxide where in
tetrachloroethylene it only decomposes up to 35 while it is 85 in ethyl acetate [18]
Propagation
When the synthesis has been initiated it is followed by the propagation reaction In free radical
polymerization the propagation process usually takes place within a fraction of a second The
propagation steps are similar to the initiation where electrons are transferred and the active center
is moved down the chain see reaction (3)
(3)
The propagation comes to an end when the termination occurs [18]
Termination
The termination is the step where the active center is either transferred to another chain or
neutralized There are two ways in which the termination can take place by combination or
disproportionation
Combination
The termination reaction combination is between two end chains where they couple together to
form one long chain as seen in Scheme 4
9
Scheme 4 Combination of two growing chains into one polymer
Disproportionation
This occurs when hydrogen abstractions takes place in one end forming a carbon double bond and
resulting in two dead polymer chains see Scheme 5 [18]
Scheme 5 Disproportionation of two growing chains into two dead polymer chains
Chain transfer
Chain transfer occurs when the active center of a growing polymer is transferred to another species
through a collision There are several types of chain transfer In general hydrogen abstraction from
monomer initiator polymer solvent and modifier There are five concepts of chain transfer transfer
to monomer transfer to initiator transfer to polymer transfer to modifier and transfer to solvent
[18]
Copolymer equation When using two or more monomers in a free radical polymerization the term is known as
copolymerization By copolymerizing two monomers the properties of the resulting polymer are
often better than the properties for the parent homopolymers The simplest case of
copolymerization involves two monomers (eg M1 and M2) but can be presented in several different
structures within the copolymer such as Statistical copolymer Alternating copolymers Block
copolymers Graft copolymers and Stereoblock copolymer [18]
The copolymerization between two monomers M1 and M2 is presented in equations (51)-(54)
where k11k22 and k12k21 correspond to self-propagating and cross-propagating rate constants
respectively [18]
(51)
(52)
(53)
(54)
The rate of consumption of M1 can be determined according to equation (6) if steady state
conditions prevail and the radical activity only depends on the nature of the terminal unit [18]
10
(6)
The rate of consumption for M2 is then
(7)
By assuming that
the copolymer equation is obtained by dividing
equation (6) by equation (7) so that
(8)
where r1 and r2 represent relative reactivity ratios from and
Several limiting cases of r can be derived
block copolymerization since both reactivity ratios are larger than unity the propagating monomers prefer to react with themselves forming blocks of M1 and M2
block copolymerization since the reactivity ratios are much higher than unity there is no inclination for the monomers to react with each other leading to two homopolymers
ideal copolymerization the propagating species M1 and M2 have the same preference for adding one or the other resulting in a random copolymer
alternating copolymerization each of the two propagating species prefers adding the other monomer
M1 is more reactive toward both propagating species and the copolymer will contain more of the reactive monomer in statistical placement [20]
Characterization methods
Contact angle
The spreading or deformation of a water droplet on a solid surface is determined by the surface and
interfacial energies The contact angle θ is the angle under which the droplet meets the surface and
may be evaluated by taking into account the three interfacial tensions in Figure 8
ndash between surface and liquid
ndash between surface and gas
ndash between liquid and gas
Figure 8 Different contact angles of a water droplet on a solid surface
11
The contact angle is also a quantification of the wetting of the solid by the liquid and is determined
by Youngs equation
(9)
The lower θ the better the wetting Poorly wetting systems may eg be water on Teflon where the
water droplet rolls off the surface hence θ approaches 180deg The other opposite is when the liquid
spreads and covers the surface complete wetting is achieved and θ approaches 0deg [21 22]
Moisture vapor transmission rate (MVTR)
The definition of moisture vapor transmission rate (also water vapor transmission rate) is as follows
The rate of water vapor flow under steady specified conditions through a unit area of a material
between its two parallel surfaces and normal to the surfaces [23]
And the metric unit of measurements is
12
TRIS
MAA
5 mol
10 mol
15 mol
DMAEMA
5 mol
10 mol
15 mol
NIPAM
5 mol
10 mol
15 mol
HEAA
5 mol
10 mol
15 mol
3 Experimental
Chemicals Table 2 Chemicals used in this project
Monomers Solvents Initiator Silicone PSA
TRIS (from Sigma-Aldrich) EtOAc (from Sigma-Aldrich) AIBN (from
Chalmers) MED 6350 (from Nusil)
NIPAM (from Sigma-Aldrich) MeOH (from Sigma-Aldrich)
DMAEMA (from Sigma-
Aldrich)
MAA (from Sigma-Aldrich)
HEAA (from Sigma-Aldrich)
Methodology
Synthesis and purification of copolymer
In the synthesis of the copolymer monomer weight was kept at 50 g for all the experiments Amount
of initiator was kept at approximately 0087 g and the solvent was kept at 120 g generating a 30 wt
solution
The synthesis was carried out in a round bottom flask see Picture 1 placed in an oil bath holding 65
degC The two monomers (TRIS and MAADMAEMANIPAMHEAA) see Figure 9 were added to the
flask with solvent and initiator Stirring was important throughout the entire synthesis to promote
good mixing The synthesis for each copolymer lasted for six hours For more detailed description see
Appendix I
The copolymer solution was purified by precipitation in methanol see Picture 2 This is because the
copolymer is not soluble in methanol while the pure monomers are In Picture 3 the precipitated
copolymer is shown
Figure 9 A scheme of poly[TRIS]-combinations and molar percentages of MAADMAEMANIPAMHEAA
13
Formulation of copolymer and two component system Each copolymer was blended with MED 6350 (a commercial PDMS polymer) in a 120 ratio of
copolymer to MED 6350 The blends were cast onto PUR-films and then cured on a heating plate to
generate the final PSA For more details see Appendix II
Contact angle measurements The contact angle measurements were performed on the formulations above and not on the pure
copolymers Each formulated film was measured with the EASYDROP Contact angle Measurement
System see Picture 4 using deionized water Three positions were measured for every formulated
film during 60 seconds to ensure a correct average contact angle More details in Appendix II
Picture 1 Synthesis reaction set-up Picture 2 Copolymer purification set-up
Picture 3 A close-up of the precipitated copolymer
14
Picture 4 Contact angle measurement equipment
Moisture vapor transmission rate (ID T-1070)
A cylinder was filled with deionized water up to a level leaving a 5 mm air gap The produced films
from the formulations three specimens of each were punched out in a circular shape larger than the
opening of the cylinders The cylinder was covered with the specimen weighed and placed in an
oven (37degC) for 24 hours After 24 hours the cylinder with the specimen was weighed again and
moisture vapor transmission rate could be obtained by calculating the loss of water
NMR and SEC 1H NMR spectrum was recorded on a Varian 400 spectrometer The samples were dissolved in CDCl3
and the 1H NMR spectra were obtained at 298 K with CDCl3 as internal standard Size-exclusion
chromatography (SEC) was performed on a Waters Alliance 2000 GPCV at 135degC with 124-
trichlorobenzene as eluent at 1 mLmin using an RI-detector It was calibrated using polystyrene
standards
Failed method GF31 is a chemical similar to TRIS but much cheaper see Figure 10 and 11 The first synthesis was
therefore done with GF31 instead of TRIS The first polymerization was between GF31 and MAA
Table 3
Table 3 First synthesis between GF31 and MAA
Chemical Amount
GF31 11195 (g)
MAA 3754 (g)
EtOAc 350 (g) (+ 400 mL)
AIBN 095 (g)
This first synthesis was done in a batch size of 500 g A reactor with a built in heat controlled oil
circulation was used with a SVL multi-joint lid 5-NECK on top Through the center neck a mechanical
stirrer passed and through the others nitrogen gas was connected and in-let of chemicals occurred
15
the rest were sealed The synthesis progressed in the same manner as described in Chapter 3 ndash
Synthesis and purification of copolymer Problems faced here were leakage of solvent and GF31
interaction with MAA As seen in Table 3 an extra amount (400 mL) of EtOAc was added during the
synthesis due to fact that 80 of the solvent (EtOAc) had evaporated within six hours GF31 (since it
is different from TRIS) formed a type of hard brittle white copolymer instead of the expected clear
tough and rubbery copolymer The ndashSi-O-Me groups of GF31 are probably more reactive than the
TMS groups of TRIS leading to the hard brittle copolymer formed However the side group of
monomer GF31 is not flexible enough to form a soft polymer and less MAA would improve the
softness Even though later on the leakage problem was solved (by sealing the center neck better)
the reactor was disregarded as an optimal set-up and was replaced by round bottom flask (reactor
with batch size 150 g) with a rubber septa using TRIS instead of GF31
Figure 10 Chemical structure of TRIS Figure 11 Chemical structure of GF31
16
4 Results and discussion
Polymerization
Yield
The yield does not take into consideration amount of monomer left in the copolymer In Chapter 4 ndash
NMR calculations of copolymer composition and percentage of monomer left are made For some
copolymers eg sample 1 the yield is much lower than for the rest as seen in Table 4 This may be
due to loss of copolymer in the first purification method see Appendix I Sample 1 (15 MAA)
showed some solubility in MeOH which means that when excess MeOHEtOAc was poured off some
polymer residue may also have been poured off hence the lower yield Also in the precipitation
method the solution started to become turbid when all copolymer solution had been blended with
the MeOH this was a fact for all copolymers The EtOAc to MeOH ratio was probably too small and
the copolymer started to dissolve There was most likely some loss of copolymer in this step too It
would probably have been better to use a larger quantity MeOH to avoid dissolution of the
copolymer
The best yield was expected for sample 8-9 as they had not been purified by the first method first
and hence the loss of polymer was strictly restricted to the new method But as seen the yield is 63
for Sample 8 and 70 for sample 9
Sample 7-9 are the poly[TRIS-co-HEAA] copolymers Amount of HEAA increases from sample 7 to
sample 9 and hence increased hydrophilicity The reason to why there is a loss of polymer in the
purification step could be that the copolymer (as the HEAA increases) became more soluble in
MeOH But as seen in Table 4 sample 7-9 are the copolymers containing the highest amount of TRIS
This speaks against the possibility of increasing HEAA contributing to increased hydrophilicity and
thus making the copolymer soluble in MeOH Also sample 9 should be more soluble in MeOH than
sample 8 as it contains more HEAA The same behavior is seen in sample 4-6 (poly[TRIS-co-NIPAM])
where there is a larger loss of copolymer for sample 4 than for sample 6 It seems that the yield is
somewhat circumstantial
17
Table 4 Results from all evaluations
18
SEC ndash molecular weight
According to the patent application it is stated that the molecular weight is larger than 10 000 gmol
In Figure 12 and 13 and Appendix III Figure 16-17 all values show a MW well above 10 000 gmol at
the lowest 360 000 gmol and for the highest at 508 000 gmol SEC was only done on Sample A-C
see Table 4 and Sample 2 as the copolymers are TRIS-based it is assumed that the rest of the
copolymers possess a similar molecular weight The second peak in both figures represents some
low molecular substance probably monomer residue Before H-NMR measurements Sample 2 was
purified one more time see Appendix I First purification method
Figure 12 SEC of Sample 2 Mw = 360 000 gmol
Figure 13 SEC of Sample A MW= 485 000 gmol
19
1H- NMR
Figure 14 NMR of Sample 1
1H- NMR was done to be able to calculate the composition in the copolymer Calculations are shown
below on Figure 14
(10)
where xT and xM are fractions of TRIS and MAA in the copolymer respectively
(11)
Applying equation (10) into equation (11) and
(expected value is 85 )
The two peaks at 610 ppm and 554 ppm are from the double bonds in the two monomers
(12)
Where xMo is the fraction of monomer left in the copolymer
20
Since xT is 8075 of the copolymer composition xMo is then
According to the calculations above there is approximately 392 monomer residue left in the
copolymer That is quite a large difference to 108 left in sample A (calculated in the same manner
as above) which was purified by the first purification method see Appendix I First purification
method
Table 4 presents the copolymer compositions for each copolymer These data are not exact as the
integrals were calculated by hand in MestreNova an analytical chemistry software suite This results
in an inaccuracy that has to be taken into account and the data showed above has to be considered
as approximate values For all the copolymers there is a continuous increase of the comonomer
which is consistent with the expected values
One copolymer is standing out from the others and it is poly[TRIS-co-HEAA] (sample 7-9) The
expected (the input) percentage of HEAA was 5 ndash 10 ndash 15 but the output was approximately 3 ndash 5 ndash
10 which means that TRIS has less affinity for HEAA than for the rest of the monomers Hence one
can assume leading to TRIS being more reactive toward both propagating species
and the copolymer will contain more of the reactive monomer (TRIS) in statistical placement In
comparison TRIS to the other monomers the r values were as can be seen in
Table 4 where the output was larger than 5 ndash 10 ndash 15 for the comonomers (exception DMAEMA
where 5 was input and 239 was output)
As seen in Table 4 the amount of monomer left in the copolymer varies between 077 ndash 392 for
the polymer purified by precipitation For copolymers A-C the level of monomers left are much
higher (85 ndash 137 ) and this proves that the first purification method was insufficient
Contact angle measurements All contact angle measurements were performed on the formulated films and not on the pure
copolymers
As seen in Table 4 the contact angle (deg) of the copolymer formulations does not differ from the
reference formulation (pure MED 6350) especially much The contact angle was expected to be lower
than the reference but as seen it is higher for sample 7 The contact angle is in the interval 121deg -
128deg and is too narrow to say anything about whether the contact angle actually has been modified
or not One reason to why these measurements may not have been very accurate is the fact that the
angle was measured on a droplet that was out in the open Lights from the surroundings and air
conditioning in the room could have affected the measurements Observed during the measurement
was that the droplet size steadily decreased which either means that the droplet evaporates or that
the surface has changed Had these measurements been done in a closed environment of the
droplet then perhaps there would have been different values
Another fact to why there is such little change in the contact angle is that silicones are highly
hydrophobic materials and since there is a very small amount of hydrophilic material integrated in
the silicone a large difference in the contact angle is really not expected Had there been a large
21
difference in contact angle the possibility of migration within the formulation of the hydrophilic
copolymer could be a reason However that was not the case and is very unlikely since the
copolymers are large molecules and the probability of migration is therefore small
Moisture vapor transmission rate The higher MVTR the better vapor transmission As seen in Table 4 all formulations show higher
MVTR than the reference This means that the formulations containing the hydrophilic copolymers
actually breathe better and are more likely to let vapor through Sample 4 [poly(TRIS-co-NIPAM(5
mol))] has an MVTR that is 139 better than the reference The rest of the formulations show an
improvement between 6 ndash 90 As only three tests on each formulation was done it is not
statistically correct to say that there has been an improvement of the MVTR as there is no clear
standard deviation to take into account However all formulations show higher MVTR than the
reference
Figure 15 MVTR data for all samples Blue = values for each test Red = average
In the investigated patent application there was no MVTR-testing done However testing of wet
adhesion was done by taking a 1-inch by 15-inch strip of adhesive and attach it to the abdominal skin
of a human subject and removing it after 40-60 min of aerobic activity [2] According to their results
good wet adhesion was achieved with the formulation containing 5 mol NIPAM and weak wet
adhesion was achieved with the formulation containing 5 mol DMAEMA sample 4 (MVTR = 1058)
and 2 (MVTR = 838) respectively in this project These two formulations showed best MVTR results
and are in accordance with the patent application investigated Why the formulations with lower
amount of polar part showed the best MVTR values must be due to morphology However due to
monomer residue wet adhesion testing on humans was not possible
22
There were some formulations with bubbles in the film seen Picture 5 and 6 Especially sample 2 4
and 8 This may have affected the MVTR and contributed to a higher value than expected
Formulation 8 had also a large amount of bubbles but a low MVTR The bubbles may have been
caused by solvent or monomer evaporating or air that has been trapped during the speed mixing As
seen in Figure 15 there is one value for sample 4 that is well above the others Since the value is
almost 50 larger than the second highest value it could be faulty perhaps an increased amount of
bubbles in the film or leakage of the cylinder
Picture 5 From MVTR Representing sample 9 - 7 from left to right
Picture 6 From MVTR Representing sample 2 - 4 from left to right
23
5 Conclusions This study showed that synthesis of hydrophilic silicone copolymers can be relatively easy
performed and the molecular weight achieved was high (Mw gt 500 000 gmol)
1H- NMR showed that the composition in the copolymers was not as the feed monomer composition
For poly[TRIS-co-MAA] and poly[TRIS-co-NIPAM] there was a higher percentage of comonomer than
assumed while the values varied for poly[TRIS-co-DMAEMA] and for poly[TRIS-co-HEAA] there was a
lower percentage of comonomer NMR also indicated monomer residue left in the copolymers
between 077 ndash 392 indicating that the purification step needs to be optimized or repeated more
than once to remove monomers left in the copolymer
According to contact angle measurements wetting of the silicone surface was not greatly affected
As the addition of copolymer was only 5 wt and of those 5 wt only 5 ndash 15 mol contained a
hydrophilic part a large change in contact angle was not expected The contact angle was evaluated
as the patent application [2] stated large change in wet adhesion
The most relevant results for this project were the MVTR results as they portrayed the improvement
of the silicone PSA (pure MED 6350) The MVTR values showed an large increase in water vapor
permeability for sample 2 and 4 5 mol DMAEMA and 5 mol NIPAM respectively If there is a
correlation between good wet adhesion and MVTR = 1058 (sample 4) contra weak wet adhesion
and MVTR = 838 (sample 2) then it is possible to conclude that for the rest of the copolymer samples
(MVTR ltlt 800) no or little wet adhesion was achieved Why there was no radical improvement for
sample C and 3 and sample 5 and 6 (DMAEMA 10-15 mol and NIPAM 10-15 mol respectively)
can be due to the results of sample 2 and 4 being faulty The explanation could also be that the
values are correct and that the addition of only 5 mol was enough to change the morphology of
the film in a way generating a higher MVTR and increasing the mol of comonomer did not change
the morphology in the same way thus not generating a higher MVTR
Overall it can be concluded that this method is not optimal for increasing hydrophilicity of PSAs as
the method is somewhat complicated to perform and the purification of the copolymers is time
consuming and unsatisfactory However silicone compatible copolymers were successfully
synthesized and characterized Taking the data retrieved in regard many questions about the quality
of the patent application are raised
24
6 Future work For this project future work would be to further purify the copolymers and then evaluate their
adhesive properties directly on the skin This would give more realistic values to whether or not the
modified PSAs have achieved better wet adhesion or not Also to redo the formulations without
bubbles and once again measure MVTR To add more analysis in form of morphology analysis to se
whether or not there is a difference in structure between the different formulations
Another project of future work is to evaluate the new patent application from Convatec Technlogies
Inc [24] where PSAs are modified by the addition of a low molecular weight organic hydroxy
containing compound This method is more straight on and does not involve any complicated
synthesis or purification steps It is simply addition of a hydroxy containing compound to a PSA prior
to curing This may be an interesting study for future work
25
7 Acknowledgments Many people have been involved in this master thesis and I would like to thank them for their
support and help
Thanks to
Dennis Hansson and Lars Lindgren my supervisors at Moumllnlycke Health Care that have always been
available for questions taken a great interest in my work and been a great support
Everyone at the Columbus group at Moumllnlycke Health Care thanks for making my time here fun and
interesting
Anders Maringrtensson for helping me with SEC analysis at Chalmers
Renee Kroon for helping me with NMR analysis at Chalmers
Mats Andersson my examiner
Friends and family
26
References [1] Mechan S et al Amphiphilic Silicone Copolymers for Pressure Sensitive Adhesive Applications
Journal of Applied Polymer Science 2010 116 3265-3270
[2] Convatec Technologies Inc Pressure Sensitive Silicone Adhesives with Amphiphilic copolymers
WO2011005839A1 Publication date 13 January 2011
[3] Clarson J S et al Silicones and Silicone-Modified Materials American Chemical Society
Washington (2000)
[4] Pachaly B Achenbach F Herzig C Mautner K Silicones WILEY-VCH Wienheim (2005)
[5] Colas A and Curtis J Silicone Biomaterials History and Chemistry amp Medical Applications of
Silicones httpwwwdowcorningcomcontentpublishedlit52-1069-01pdf 2012-01-17
[6] Ratner Buddy D et al Biomaterials Science ndash An introduction to Materials in Medicine Elsevier
London (2004)
[7] Gay C Stickiness ndash some fundamentals of adhesion Integrative and Comparative Biology 2002
42 1123-1126
[8] V Pocius A Adhesion Kirk-Othmer Encyclopedia of Chemical Technology Vol 1 Page 501
(2002)
[9] John Comyn Adhesion Science Royal Society of Chemistry Paperbacks 1997
[10] Garbassi F et al Polymer surfaces ndash From Physics to Technology John Wiley amp Sons Chichester
(1998)
[11] Covert P Principles of Pressure Sensitive Adhesion httpwwwgluemachinerycomprinciples-
of-pressure-sensitive-adhesionhtml 2012-02-08
[12] TRIS
httpwwwsigmaaldrichcomcatalogProductDetaildoD7=0ampN5=SEARCH_CONCAT_PNO7CBRA
ND_KEYampN4=4461307CALDRICHampN25=0ampQS=ONampF=SPEC 2012-02-08
[13] MAA
httpwwwsigmaaldrichcomcatalogProductDetaildoD7=0ampN5=SEARCH_CONCAT_PNO7CBRA
ND_KEYampN4=640507CFLUKAampN25=0ampQS=ONampF=SPEC 2012-02-08
[14] HEAA
httpwwwsigmaaldrichcomcatalogProductDetaildoD7=0ampN5=SEARCH_CONCAT_PNO7CBRA
ND_KEYampN4=6979317CALDRICHampN25=0ampQS=ONampF=SPEC 2012-02-08
[15] NIPAM
httpwwwsigmaaldrichcomcatalogProductDetaildoD7=0ampN5=SEARCH_CONCAT_PNO7CBRA
ND_KEYampN4=4153247CALDRICHampN25=0ampQS=ONampF=SPEC 2012-02-08
27
[16] DMAEMA
httpwwwsigmaaldrichcomcatalogProductDetaildoD7=0ampN5=SEARCH_CONCAT_PNO7CBRA
ND_KEYampN4=2349077CALDRICHampN25=0ampQS=ONampF=SPEC 2012-02-08
[17] AIBN
httpwwwsigmaaldrichcomcatalogProductDetaildolang=enampN4=441090|ALDRICHampN5=SEARC
H_CONCAT_PNO|BRAND_KEYampF=SPEC 2012-02-09
[18] Cowie JMG and Arrighi V Polymers Chemistry and physics of modern materials Taylor amp
Francis Group (2008)
[19] Wound Care ndash MepilexreghttpwwwmolnlyckecomgbWound-Care-ProductsProduct-
selector---Wound-divisionTabsProductsMepilexactiveTab=3 2011-10-24
[20] Chain copolymerization
httpcesysueducnechemipolychemuploadfilesE585B1E8819AE59088pdf
2012-02-09
[21] Israelachivli Jacob N Intermolecular and surface forcesAcademic Press Burlington (2011)
[22] Lyklema J et al Fundamentals of interface and colloid science Academic press San Diego
(2000)
[23] Gooch Jan W Encyclopedic dictionary of polymers 2 Part 13 Page 815 (2011)
[24] Convatec Technologies Inc Silicone Gel Adhesive with Organic Polyhydroxy Compounds
WO2012003028A1 Publication date 5 January 2012
28
Appendix I ndash Synthesis and purification
The synthesis was carried out by combining TRIS with the other monomers see Figure 9 The
combination resulted in four copolymers divided into three categories variations of 95 90 and 85
mol of TRIS
The procedure for the synthesis of poly[TRIS]-based copolymers by free radical polymerization using
poly[TRIS-co-MAA] as an example is as follows
1 4947 g of TRIS and 056 g of MAA was added to a 250 ml round bottomed flask containing a
magnetic stirring bar
2 To the flask was added 120 g of EtOAc to afford a 30 wt solution
3 The flask was sealed with a rubber septa and flushed with with nitrogen for 10 minutes
4 The flask was then placed in an oil bath as seen in Picture 1
5 0087 g of AIBN dissolved in EtOAc was added to the flask when the temperature of the oil
bath reached 65
6 The reaction was continued for 6 hours and stirred at 65 under N2 atmosphere
7 The solution was poured into a plastic jar sealed and let to cool down to room temperature
Calculations of amount of TRIS and MAA needed for the poly(TRIS-co-MAA) sample 1 see below
(1)
MTRIS = 42281 gmol
MDMAEMA = 15721 gmol
MNIPAM = 11316 gmol
MMAA = 8606 gmol
MHEAA = 11513 gmol
(2)
(3)
(4)
=012316
29
See Table 5-8 for detailed composition of all monomers
Table 5 poly(TRIS-co-MAA)
Monomer Sample A Sample B Sample 1
TRIS (g) 4947 4890 4828
MAA (g) 056 111 178
AIBN (g) 0087 0088 0087
EtOAc (g) 120 120 120
Molar fraction (TRISMAA) 09470053 08990101 08470153
Table 6 poly(TRIS-co-DMAEMA)
Monomer Sample 2 Sample C Sample 3
TRIS (g) 4904 4802 4692
DMAEMA (g) 096 200 308
AIBN (g) 0087 0087 0087
EtOAc (g) 120 120 120
Molar fraction (TRISDMAEMA) 09505 089011 085015
Table 7 poly(TRIS-co-NIPAM)
Monomer Sample 4 Sample 5 Sample 6
TRIS (g) 4932 4856 4775
NIPAM (g) 070 144 225
AIBN (g) 0087 0087 0088
EtOAc (g) 120 120 120
Molar fraction (TRISNIPAM) 095005 090010 08515 Table 8 poly(TRIS-co-HEAA)
Monomer Sample 7 Sample 8 Sample 9
TRIS (g) 4929 4853 4772
HEAA (g) 072 144 230
AIBN (g) 0087 0087 0087
EtOAc (g) 120 120 120
Molar fraction (TRISHEAA) 095005 090010 085015
Sample A B and C were not further evaluated
Purification by precipitation
1 The weight of the crude polymer was adjusted to a 30 wt solution and added to a 250 mL
glass separation funnel
2 1500 mL of MeOH was added to a 2000 mL beaker
3 The copolymer solution was drop wise precipitated into the MeOH while constant stirring as
seen in Picture 2
4 The copolymer seen in Picture 3 (a white tacky soft solid) was then retrieved by pouring off
the solution and picking up the polymer and stored in a sealed cup
30
Some observations made during the purification step are
1 The copolymer precipitates as white threads 2 The copolymer is quite firm and non-sticky 3 The solution is clear until the end where it turns turbid and the copolymer is more tacky and
sticky
First purification method Sample A B and C were not further evaluated as they were purified by another method that proved
to be insufficient to purify polymers In the patent application the purification step was described as
washing the copolymer with MeOH hence in this project the procedure was interpreted into the
following
The copolymer was dried after the synthesis and then dissolved in 20 g EtOAc on that was added the
double amount of MeOH (40 g) The solution was stirred manually with a spoon or such and left to sit
for 24 hours The excess MeOHEtOAc was poured off after 24 hours and 40 g of MeOH was added
again In total the procedure was repeated three times According to NMR spectra there was more
than 10 monomer left after this purification step and that is why the method was disregarded
Sample A B C and 2 were purified by this method but since there was no time left to purify sample
A B and C according to the purification described above they were not further evaluated
As this method showed to be insufficient it was decided to proceed with a more commonly used
method see Chapter 3 - Synthesis and purification of copolymer
31
Appendix II ndash Formulation and contact angle
Formulation The copolymers were blended with a silicone adhesive (two component system) in ratio 120 The
procedure is as follows (poly[TRIS-co-MAA] is set as an example)
1 0798 g of copolymer was blended with a conventional PDMS at 5 wt (5016 g of component A and 5014 g of component B) prior to curing
2 The blend was mixed in a SpeedMixer DAC 150 FVX-K for 30 seconds at speed of 3 500 rpm 3 It was cast onto a PUR-coated film (thickness 20 microm) coating thickness of 300 microm 4 The film was cured on a heating plate 150 degC for 15 minutes
Since the copolymers (after purification) where not dried to a 100 calculations of the percentage of
solvent left had to be done before any formulations could be made
Calculating percentage of solvent left in the wet copolymer was performed as follows (taking Sample
1 as example)
1 343 g of copolymer was set to dry in an oven at 45degC 2 After one day the sample was weighted to 201 g 3 The weight difference is the amount of solvent in the wet copolymer
Table 9 Wt solvent in copolymer after purification
Sample Wet
weight (g) Dry
weight (g) wt solvent in wet
copolymer wt solvent in wet copolymer after
removal of some solvent [FINAL]
1 343 201 4139 3735
2 381 278 2703 2430
3 363 249 3140 2757
4 363 252 3057 2660
5 500 335 3300 1899
6 357 227 3641 2812
7 362 219 3950 2298
8 301 205 3189 2938
9 487 291 4024 3425 Table 10 (g) copolymer needed to acheive a 5 wt in the formulation blend (based on Table 10 last column)
Formulation (sample)
Wet copolymer (g) Component A (g) Component B (g) wt copolymer in
blend
1 0798 5016 5014 475
2 0655 5036 5057 468
3 0692 5018 5037 475
4 0678 5013 5024 472
5 0615 5028 5020 472
6 0698 5029 5023 475
7 0699 5027 5034 507
8 0716 5018 5050 478
9 0761 4968 4934 482
32
Contact angle Contact angle measurements were performed on a EASYDROP Contact Angle Measurement System
from KRUumlSS with DSA1 control and evaluating software
1 A sample size 2 cm x 5 cm was taken from each formulation 2 One sample at a time was put on the sample table see Picture 4 3 The sample was illuminated with a PC-controlled illumination 4 The syringe was filled with deionized water and a droplet size 3 microL was produced at the tip
of the needle and applied on the surface 5 Pressing start in the computer software system the measurements started and proceeded for
one minute 6 Three positions were tested on each sample
33
Appendix III ndash Results
MVTR For the calculations of the MVTR values Equation (1) was applied
(1)
where
In this experimental setup deionized water was used as liquid and the test period was set to 24
hours
Table 11 MVTR raw data (red-marked number is disregarded)
Formulation W1 (g) W2 (g) W1-W2 (g) Average (g)
1
2119196 2114015 05181
05299 2123917 2118254 05663
2130770 2125716 05054
2
2120806 2111452 09354
08383 2128864 2121294 0757
2114589 2106363 08226
3
2137987 2133518 04469
04917 2119481 2114588 04893
2134925 2129537 05388
4
2134925 2121103 13822
1058 2134836 2125515 09321
1938189 1929592 08597
5
2140372 2135713 04659
04681 2138197 2133245 04952
2124946 2120513 04433
6
2127705 2121994 05711
05937 2124817 2117913 06904
2147531 2142335 05196
7
2116362 2111662 04700
04701 2121055 2116317 04738
2126865 2122200 04665
8
2138735 2133730 05005
05050 2134656 2129915 04741
2107122 2101718 05404
9
2121140 2116611 04529
04998 2140479 2134419 06060
2135159 2130754 04405
R 2127272 2122760 04512
04412 2138336 2134024 04312
34
SEC
Figure 16 SEC of Sample B MW = 508 456 gmol
Figure 17 SEC of Sample C MW = 443 117 gmol
35
1H- NMR
Figure 18 NMR of Sample A
Figure 19 NMR of Sample B
36
Figure 20 NMR of Sample 2
Figure 21 NMR of Sample C
37
Figure 22 NMR of Sample 3
Figure 23 NMR of Sample 4
38
Figure 24 NMR of Sample 5
Figure 25 NMR of Sample 6
39
Figure 26 NMR of Sample 7
Figure 27 NMR of Sample 8
40
Figure 28 NMR of Sample 9
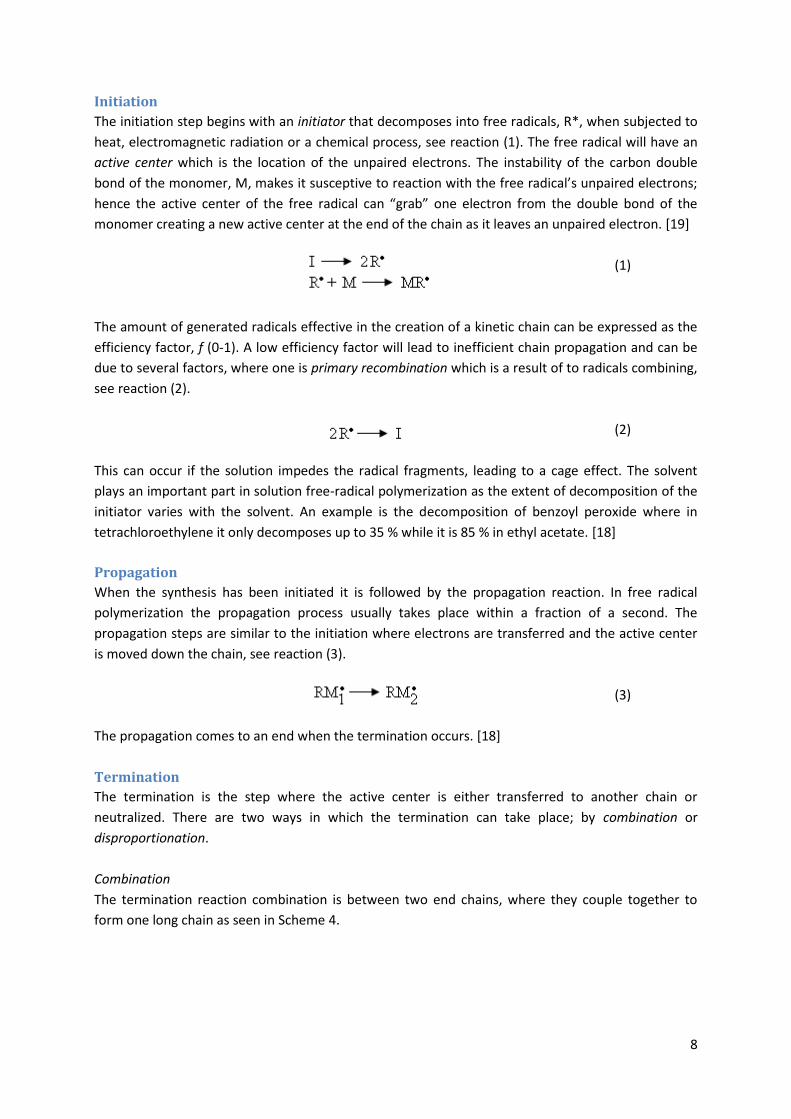
8
Initiation
The initiation step begins with an initiator that decomposes into free radicals R when subjected to
heat electromagnetic radiation or a chemical process see reaction (1) The free radical will have an
active center which is the location of the unpaired electrons The instability of the carbon double
bond of the monomer M makes it susceptive to reaction with the free radicalrsquos unpaired electrons
hence the active center of the free radical can ldquograbrdquo one electron from the double bond of the
monomer creating a new active center at the end of the chain as it leaves an unpaired electron [19]
(1)
The amount of generated radicals effective in the creation of a kinetic chain can be expressed as the
efficiency factor f (0-1) A low efficiency factor will lead to inefficient chain propagation and can be
due to several factors where one is primary recombination which is a result of to radicals combining
see reaction (2)
(2)
This can occur if the solution impedes the radical fragments leading to a cage effect The solvent
plays an important part in solution free-radical polymerization as the extent of decomposition of the
initiator varies with the solvent An example is the decomposition of benzoyl peroxide where in
tetrachloroethylene it only decomposes up to 35 while it is 85 in ethyl acetate [18]
Propagation
When the synthesis has been initiated it is followed by the propagation reaction In free radical
polymerization the propagation process usually takes place within a fraction of a second The
propagation steps are similar to the initiation where electrons are transferred and the active center
is moved down the chain see reaction (3)
(3)
The propagation comes to an end when the termination occurs [18]
Termination
The termination is the step where the active center is either transferred to another chain or
neutralized There are two ways in which the termination can take place by combination or
disproportionation
Combination
The termination reaction combination is between two end chains where they couple together to
form one long chain as seen in Scheme 4
9
Scheme 4 Combination of two growing chains into one polymer
Disproportionation
This occurs when hydrogen abstractions takes place in one end forming a carbon double bond and
resulting in two dead polymer chains see Scheme 5 [18]
Scheme 5 Disproportionation of two growing chains into two dead polymer chains
Chain transfer
Chain transfer occurs when the active center of a growing polymer is transferred to another species
through a collision There are several types of chain transfer In general hydrogen abstraction from
monomer initiator polymer solvent and modifier There are five concepts of chain transfer transfer
to monomer transfer to initiator transfer to polymer transfer to modifier and transfer to solvent
[18]
Copolymer equation When using two or more monomers in a free radical polymerization the term is known as
copolymerization By copolymerizing two monomers the properties of the resulting polymer are
often better than the properties for the parent homopolymers The simplest case of
copolymerization involves two monomers (eg M1 and M2) but can be presented in several different
structures within the copolymer such as Statistical copolymer Alternating copolymers Block
copolymers Graft copolymers and Stereoblock copolymer [18]
The copolymerization between two monomers M1 and M2 is presented in equations (51)-(54)
where k11k22 and k12k21 correspond to self-propagating and cross-propagating rate constants
respectively [18]
(51)
(52)
(53)
(54)
The rate of consumption of M1 can be determined according to equation (6) if steady state
conditions prevail and the radical activity only depends on the nature of the terminal unit [18]
10
(6)
The rate of consumption for M2 is then
(7)
By assuming that
the copolymer equation is obtained by dividing
equation (6) by equation (7) so that
(8)
where r1 and r2 represent relative reactivity ratios from and
Several limiting cases of r can be derived
block copolymerization since both reactivity ratios are larger than unity the propagating monomers prefer to react with themselves forming blocks of M1 and M2
block copolymerization since the reactivity ratios are much higher than unity there is no inclination for the monomers to react with each other leading to two homopolymers
ideal copolymerization the propagating species M1 and M2 have the same preference for adding one or the other resulting in a random copolymer
alternating copolymerization each of the two propagating species prefers adding the other monomer
M1 is more reactive toward both propagating species and the copolymer will contain more of the reactive monomer in statistical placement [20]
Characterization methods
Contact angle
The spreading or deformation of a water droplet on a solid surface is determined by the surface and
interfacial energies The contact angle θ is the angle under which the droplet meets the surface and
may be evaluated by taking into account the three interfacial tensions in Figure 8
ndash between surface and liquid
ndash between surface and gas
ndash between liquid and gas
Figure 8 Different contact angles of a water droplet on a solid surface
11
The contact angle is also a quantification of the wetting of the solid by the liquid and is determined
by Youngs equation
(9)
The lower θ the better the wetting Poorly wetting systems may eg be water on Teflon where the
water droplet rolls off the surface hence θ approaches 180deg The other opposite is when the liquid
spreads and covers the surface complete wetting is achieved and θ approaches 0deg [21 22]
Moisture vapor transmission rate (MVTR)
The definition of moisture vapor transmission rate (also water vapor transmission rate) is as follows
The rate of water vapor flow under steady specified conditions through a unit area of a material
between its two parallel surfaces and normal to the surfaces [23]
And the metric unit of measurements is
12
TRIS
MAA
5 mol
10 mol
15 mol
DMAEMA
5 mol
10 mol
15 mol
NIPAM
5 mol
10 mol
15 mol
HEAA
5 mol
10 mol
15 mol
3 Experimental
Chemicals Table 2 Chemicals used in this project
Monomers Solvents Initiator Silicone PSA
TRIS (from Sigma-Aldrich) EtOAc (from Sigma-Aldrich) AIBN (from
Chalmers) MED 6350 (from Nusil)
NIPAM (from Sigma-Aldrich) MeOH (from Sigma-Aldrich)
DMAEMA (from Sigma-
Aldrich)
MAA (from Sigma-Aldrich)
HEAA (from Sigma-Aldrich)
Methodology
Synthesis and purification of copolymer
In the synthesis of the copolymer monomer weight was kept at 50 g for all the experiments Amount
of initiator was kept at approximately 0087 g and the solvent was kept at 120 g generating a 30 wt
solution
The synthesis was carried out in a round bottom flask see Picture 1 placed in an oil bath holding 65
degC The two monomers (TRIS and MAADMAEMANIPAMHEAA) see Figure 9 were added to the
flask with solvent and initiator Stirring was important throughout the entire synthesis to promote
good mixing The synthesis for each copolymer lasted for six hours For more detailed description see
Appendix I
The copolymer solution was purified by precipitation in methanol see Picture 2 This is because the
copolymer is not soluble in methanol while the pure monomers are In Picture 3 the precipitated
copolymer is shown
Figure 9 A scheme of poly[TRIS]-combinations and molar percentages of MAADMAEMANIPAMHEAA
13
Formulation of copolymer and two component system Each copolymer was blended with MED 6350 (a commercial PDMS polymer) in a 120 ratio of
copolymer to MED 6350 The blends were cast onto PUR-films and then cured on a heating plate to
generate the final PSA For more details see Appendix II
Contact angle measurements The contact angle measurements were performed on the formulations above and not on the pure
copolymers Each formulated film was measured with the EASYDROP Contact angle Measurement
System see Picture 4 using deionized water Three positions were measured for every formulated
film during 60 seconds to ensure a correct average contact angle More details in Appendix II
Picture 1 Synthesis reaction set-up Picture 2 Copolymer purification set-up
Picture 3 A close-up of the precipitated copolymer
14
Picture 4 Contact angle measurement equipment
Moisture vapor transmission rate (ID T-1070)
A cylinder was filled with deionized water up to a level leaving a 5 mm air gap The produced films
from the formulations three specimens of each were punched out in a circular shape larger than the
opening of the cylinders The cylinder was covered with the specimen weighed and placed in an
oven (37degC) for 24 hours After 24 hours the cylinder with the specimen was weighed again and
moisture vapor transmission rate could be obtained by calculating the loss of water
NMR and SEC 1H NMR spectrum was recorded on a Varian 400 spectrometer The samples were dissolved in CDCl3
and the 1H NMR spectra were obtained at 298 K with CDCl3 as internal standard Size-exclusion
chromatography (SEC) was performed on a Waters Alliance 2000 GPCV at 135degC with 124-
trichlorobenzene as eluent at 1 mLmin using an RI-detector It was calibrated using polystyrene
standards
Failed method GF31 is a chemical similar to TRIS but much cheaper see Figure 10 and 11 The first synthesis was
therefore done with GF31 instead of TRIS The first polymerization was between GF31 and MAA
Table 3
Table 3 First synthesis between GF31 and MAA
Chemical Amount
GF31 11195 (g)
MAA 3754 (g)
EtOAc 350 (g) (+ 400 mL)
AIBN 095 (g)
This first synthesis was done in a batch size of 500 g A reactor with a built in heat controlled oil
circulation was used with a SVL multi-joint lid 5-NECK on top Through the center neck a mechanical
stirrer passed and through the others nitrogen gas was connected and in-let of chemicals occurred
15
the rest were sealed The synthesis progressed in the same manner as described in Chapter 3 ndash
Synthesis and purification of copolymer Problems faced here were leakage of solvent and GF31
interaction with MAA As seen in Table 3 an extra amount (400 mL) of EtOAc was added during the
synthesis due to fact that 80 of the solvent (EtOAc) had evaporated within six hours GF31 (since it
is different from TRIS) formed a type of hard brittle white copolymer instead of the expected clear
tough and rubbery copolymer The ndashSi-O-Me groups of GF31 are probably more reactive than the
TMS groups of TRIS leading to the hard brittle copolymer formed However the side group of
monomer GF31 is not flexible enough to form a soft polymer and less MAA would improve the
softness Even though later on the leakage problem was solved (by sealing the center neck better)
the reactor was disregarded as an optimal set-up and was replaced by round bottom flask (reactor
with batch size 150 g) with a rubber septa using TRIS instead of GF31
Figure 10 Chemical structure of TRIS Figure 11 Chemical structure of GF31
16
4 Results and discussion
Polymerization
Yield
The yield does not take into consideration amount of monomer left in the copolymer In Chapter 4 ndash
NMR calculations of copolymer composition and percentage of monomer left are made For some
copolymers eg sample 1 the yield is much lower than for the rest as seen in Table 4 This may be
due to loss of copolymer in the first purification method see Appendix I Sample 1 (15 MAA)
showed some solubility in MeOH which means that when excess MeOHEtOAc was poured off some
polymer residue may also have been poured off hence the lower yield Also in the precipitation
method the solution started to become turbid when all copolymer solution had been blended with
the MeOH this was a fact for all copolymers The EtOAc to MeOH ratio was probably too small and
the copolymer started to dissolve There was most likely some loss of copolymer in this step too It
would probably have been better to use a larger quantity MeOH to avoid dissolution of the
copolymer
The best yield was expected for sample 8-9 as they had not been purified by the first method first
and hence the loss of polymer was strictly restricted to the new method But as seen the yield is 63
for Sample 8 and 70 for sample 9
Sample 7-9 are the poly[TRIS-co-HEAA] copolymers Amount of HEAA increases from sample 7 to
sample 9 and hence increased hydrophilicity The reason to why there is a loss of polymer in the
purification step could be that the copolymer (as the HEAA increases) became more soluble in
MeOH But as seen in Table 4 sample 7-9 are the copolymers containing the highest amount of TRIS
This speaks against the possibility of increasing HEAA contributing to increased hydrophilicity and
thus making the copolymer soluble in MeOH Also sample 9 should be more soluble in MeOH than
sample 8 as it contains more HEAA The same behavior is seen in sample 4-6 (poly[TRIS-co-NIPAM])
where there is a larger loss of copolymer for sample 4 than for sample 6 It seems that the yield is
somewhat circumstantial
17
Table 4 Results from all evaluations
18
SEC ndash molecular weight
According to the patent application it is stated that the molecular weight is larger than 10 000 gmol
In Figure 12 and 13 and Appendix III Figure 16-17 all values show a MW well above 10 000 gmol at
the lowest 360 000 gmol and for the highest at 508 000 gmol SEC was only done on Sample A-C
see Table 4 and Sample 2 as the copolymers are TRIS-based it is assumed that the rest of the
copolymers possess a similar molecular weight The second peak in both figures represents some
low molecular substance probably monomer residue Before H-NMR measurements Sample 2 was
purified one more time see Appendix I First purification method
Figure 12 SEC of Sample 2 Mw = 360 000 gmol
Figure 13 SEC of Sample A MW= 485 000 gmol
19
1H- NMR
Figure 14 NMR of Sample 1
1H- NMR was done to be able to calculate the composition in the copolymer Calculations are shown
below on Figure 14
(10)
where xT and xM are fractions of TRIS and MAA in the copolymer respectively
(11)
Applying equation (10) into equation (11) and
(expected value is 85 )
The two peaks at 610 ppm and 554 ppm are from the double bonds in the two monomers
(12)
Where xMo is the fraction of monomer left in the copolymer
20
Since xT is 8075 of the copolymer composition xMo is then
According to the calculations above there is approximately 392 monomer residue left in the
copolymer That is quite a large difference to 108 left in sample A (calculated in the same manner
as above) which was purified by the first purification method see Appendix I First purification
method
Table 4 presents the copolymer compositions for each copolymer These data are not exact as the
integrals were calculated by hand in MestreNova an analytical chemistry software suite This results
in an inaccuracy that has to be taken into account and the data showed above has to be considered
as approximate values For all the copolymers there is a continuous increase of the comonomer
which is consistent with the expected values
One copolymer is standing out from the others and it is poly[TRIS-co-HEAA] (sample 7-9) The
expected (the input) percentage of HEAA was 5 ndash 10 ndash 15 but the output was approximately 3 ndash 5 ndash
10 which means that TRIS has less affinity for HEAA than for the rest of the monomers Hence one
can assume leading to TRIS being more reactive toward both propagating species
and the copolymer will contain more of the reactive monomer (TRIS) in statistical placement In
comparison TRIS to the other monomers the r values were as can be seen in
Table 4 where the output was larger than 5 ndash 10 ndash 15 for the comonomers (exception DMAEMA
where 5 was input and 239 was output)
As seen in Table 4 the amount of monomer left in the copolymer varies between 077 ndash 392 for
the polymer purified by precipitation For copolymers A-C the level of monomers left are much
higher (85 ndash 137 ) and this proves that the first purification method was insufficient
Contact angle measurements All contact angle measurements were performed on the formulated films and not on the pure
copolymers
As seen in Table 4 the contact angle (deg) of the copolymer formulations does not differ from the
reference formulation (pure MED 6350) especially much The contact angle was expected to be lower
than the reference but as seen it is higher for sample 7 The contact angle is in the interval 121deg -
128deg and is too narrow to say anything about whether the contact angle actually has been modified
or not One reason to why these measurements may not have been very accurate is the fact that the
angle was measured on a droplet that was out in the open Lights from the surroundings and air
conditioning in the room could have affected the measurements Observed during the measurement
was that the droplet size steadily decreased which either means that the droplet evaporates or that
the surface has changed Had these measurements been done in a closed environment of the
droplet then perhaps there would have been different values
Another fact to why there is such little change in the contact angle is that silicones are highly
hydrophobic materials and since there is a very small amount of hydrophilic material integrated in
the silicone a large difference in the contact angle is really not expected Had there been a large
21
difference in contact angle the possibility of migration within the formulation of the hydrophilic
copolymer could be a reason However that was not the case and is very unlikely since the
copolymers are large molecules and the probability of migration is therefore small
Moisture vapor transmission rate The higher MVTR the better vapor transmission As seen in Table 4 all formulations show higher
MVTR than the reference This means that the formulations containing the hydrophilic copolymers
actually breathe better and are more likely to let vapor through Sample 4 [poly(TRIS-co-NIPAM(5
mol))] has an MVTR that is 139 better than the reference The rest of the formulations show an
improvement between 6 ndash 90 As only three tests on each formulation was done it is not
statistically correct to say that there has been an improvement of the MVTR as there is no clear
standard deviation to take into account However all formulations show higher MVTR than the
reference
Figure 15 MVTR data for all samples Blue = values for each test Red = average
In the investigated patent application there was no MVTR-testing done However testing of wet
adhesion was done by taking a 1-inch by 15-inch strip of adhesive and attach it to the abdominal skin
of a human subject and removing it after 40-60 min of aerobic activity [2] According to their results
good wet adhesion was achieved with the formulation containing 5 mol NIPAM and weak wet
adhesion was achieved with the formulation containing 5 mol DMAEMA sample 4 (MVTR = 1058)
and 2 (MVTR = 838) respectively in this project These two formulations showed best MVTR results
and are in accordance with the patent application investigated Why the formulations with lower
amount of polar part showed the best MVTR values must be due to morphology However due to
monomer residue wet adhesion testing on humans was not possible
22
There were some formulations with bubbles in the film seen Picture 5 and 6 Especially sample 2 4
and 8 This may have affected the MVTR and contributed to a higher value than expected
Formulation 8 had also a large amount of bubbles but a low MVTR The bubbles may have been
caused by solvent or monomer evaporating or air that has been trapped during the speed mixing As
seen in Figure 15 there is one value for sample 4 that is well above the others Since the value is
almost 50 larger than the second highest value it could be faulty perhaps an increased amount of
bubbles in the film or leakage of the cylinder
Picture 5 From MVTR Representing sample 9 - 7 from left to right
Picture 6 From MVTR Representing sample 2 - 4 from left to right
23
5 Conclusions This study showed that synthesis of hydrophilic silicone copolymers can be relatively easy
performed and the molecular weight achieved was high (Mw gt 500 000 gmol)
1H- NMR showed that the composition in the copolymers was not as the feed monomer composition
For poly[TRIS-co-MAA] and poly[TRIS-co-NIPAM] there was a higher percentage of comonomer than
assumed while the values varied for poly[TRIS-co-DMAEMA] and for poly[TRIS-co-HEAA] there was a
lower percentage of comonomer NMR also indicated monomer residue left in the copolymers
between 077 ndash 392 indicating that the purification step needs to be optimized or repeated more
than once to remove monomers left in the copolymer
According to contact angle measurements wetting of the silicone surface was not greatly affected
As the addition of copolymer was only 5 wt and of those 5 wt only 5 ndash 15 mol contained a
hydrophilic part a large change in contact angle was not expected The contact angle was evaluated
as the patent application [2] stated large change in wet adhesion
The most relevant results for this project were the MVTR results as they portrayed the improvement
of the silicone PSA (pure MED 6350) The MVTR values showed an large increase in water vapor
permeability for sample 2 and 4 5 mol DMAEMA and 5 mol NIPAM respectively If there is a
correlation between good wet adhesion and MVTR = 1058 (sample 4) contra weak wet adhesion
and MVTR = 838 (sample 2) then it is possible to conclude that for the rest of the copolymer samples
(MVTR ltlt 800) no or little wet adhesion was achieved Why there was no radical improvement for
sample C and 3 and sample 5 and 6 (DMAEMA 10-15 mol and NIPAM 10-15 mol respectively)
can be due to the results of sample 2 and 4 being faulty The explanation could also be that the
values are correct and that the addition of only 5 mol was enough to change the morphology of
the film in a way generating a higher MVTR and increasing the mol of comonomer did not change
the morphology in the same way thus not generating a higher MVTR
Overall it can be concluded that this method is not optimal for increasing hydrophilicity of PSAs as
the method is somewhat complicated to perform and the purification of the copolymers is time
consuming and unsatisfactory However silicone compatible copolymers were successfully
synthesized and characterized Taking the data retrieved in regard many questions about the quality
of the patent application are raised
24
6 Future work For this project future work would be to further purify the copolymers and then evaluate their
adhesive properties directly on the skin This would give more realistic values to whether or not the
modified PSAs have achieved better wet adhesion or not Also to redo the formulations without
bubbles and once again measure MVTR To add more analysis in form of morphology analysis to se
whether or not there is a difference in structure between the different formulations
Another project of future work is to evaluate the new patent application from Convatec Technlogies
Inc [24] where PSAs are modified by the addition of a low molecular weight organic hydroxy
containing compound This method is more straight on and does not involve any complicated
synthesis or purification steps It is simply addition of a hydroxy containing compound to a PSA prior
to curing This may be an interesting study for future work
25
7 Acknowledgments Many people have been involved in this master thesis and I would like to thank them for their
support and help
Thanks to
Dennis Hansson and Lars Lindgren my supervisors at Moumllnlycke Health Care that have always been
available for questions taken a great interest in my work and been a great support
Everyone at the Columbus group at Moumllnlycke Health Care thanks for making my time here fun and
interesting
Anders Maringrtensson for helping me with SEC analysis at Chalmers
Renee Kroon for helping me with NMR analysis at Chalmers
Mats Andersson my examiner
Friends and family
26
References [1] Mechan S et al Amphiphilic Silicone Copolymers for Pressure Sensitive Adhesive Applications
Journal of Applied Polymer Science 2010 116 3265-3270
[2] Convatec Technologies Inc Pressure Sensitive Silicone Adhesives with Amphiphilic copolymers
WO2011005839A1 Publication date 13 January 2011
[3] Clarson J S et al Silicones and Silicone-Modified Materials American Chemical Society
Washington (2000)
[4] Pachaly B Achenbach F Herzig C Mautner K Silicones WILEY-VCH Wienheim (2005)
[5] Colas A and Curtis J Silicone Biomaterials History and Chemistry amp Medical Applications of
Silicones httpwwwdowcorningcomcontentpublishedlit52-1069-01pdf 2012-01-17
[6] Ratner Buddy D et al Biomaterials Science ndash An introduction to Materials in Medicine Elsevier
London (2004)
[7] Gay C Stickiness ndash some fundamentals of adhesion Integrative and Comparative Biology 2002
42 1123-1126
[8] V Pocius A Adhesion Kirk-Othmer Encyclopedia of Chemical Technology Vol 1 Page 501
(2002)
[9] John Comyn Adhesion Science Royal Society of Chemistry Paperbacks 1997
[10] Garbassi F et al Polymer surfaces ndash From Physics to Technology John Wiley amp Sons Chichester
(1998)
[11] Covert P Principles of Pressure Sensitive Adhesion httpwwwgluemachinerycomprinciples-
of-pressure-sensitive-adhesionhtml 2012-02-08
[12] TRIS
httpwwwsigmaaldrichcomcatalogProductDetaildoD7=0ampN5=SEARCH_CONCAT_PNO7CBRA
ND_KEYampN4=4461307CALDRICHampN25=0ampQS=ONampF=SPEC 2012-02-08
[13] MAA
httpwwwsigmaaldrichcomcatalogProductDetaildoD7=0ampN5=SEARCH_CONCAT_PNO7CBRA
ND_KEYampN4=640507CFLUKAampN25=0ampQS=ONampF=SPEC 2012-02-08
[14] HEAA
httpwwwsigmaaldrichcomcatalogProductDetaildoD7=0ampN5=SEARCH_CONCAT_PNO7CBRA
ND_KEYampN4=6979317CALDRICHampN25=0ampQS=ONampF=SPEC 2012-02-08
[15] NIPAM
httpwwwsigmaaldrichcomcatalogProductDetaildoD7=0ampN5=SEARCH_CONCAT_PNO7CBRA
ND_KEYampN4=4153247CALDRICHampN25=0ampQS=ONampF=SPEC 2012-02-08
27
[16] DMAEMA
httpwwwsigmaaldrichcomcatalogProductDetaildoD7=0ampN5=SEARCH_CONCAT_PNO7CBRA
ND_KEYampN4=2349077CALDRICHampN25=0ampQS=ONampF=SPEC 2012-02-08
[17] AIBN
httpwwwsigmaaldrichcomcatalogProductDetaildolang=enampN4=441090|ALDRICHampN5=SEARC
H_CONCAT_PNO|BRAND_KEYampF=SPEC 2012-02-09
[18] Cowie JMG and Arrighi V Polymers Chemistry and physics of modern materials Taylor amp
Francis Group (2008)
[19] Wound Care ndash MepilexreghttpwwwmolnlyckecomgbWound-Care-ProductsProduct-
selector---Wound-divisionTabsProductsMepilexactiveTab=3 2011-10-24
[20] Chain copolymerization
httpcesysueducnechemipolychemuploadfilesE585B1E8819AE59088pdf
2012-02-09
[21] Israelachivli Jacob N Intermolecular and surface forcesAcademic Press Burlington (2011)
[22] Lyklema J et al Fundamentals of interface and colloid science Academic press San Diego
(2000)
[23] Gooch Jan W Encyclopedic dictionary of polymers 2 Part 13 Page 815 (2011)
[24] Convatec Technologies Inc Silicone Gel Adhesive with Organic Polyhydroxy Compounds
WO2012003028A1 Publication date 5 January 2012
28
Appendix I ndash Synthesis and purification
The synthesis was carried out by combining TRIS with the other monomers see Figure 9 The
combination resulted in four copolymers divided into three categories variations of 95 90 and 85
mol of TRIS
The procedure for the synthesis of poly[TRIS]-based copolymers by free radical polymerization using
poly[TRIS-co-MAA] as an example is as follows
1 4947 g of TRIS and 056 g of MAA was added to a 250 ml round bottomed flask containing a
magnetic stirring bar
2 To the flask was added 120 g of EtOAc to afford a 30 wt solution
3 The flask was sealed with a rubber septa and flushed with with nitrogen for 10 minutes
4 The flask was then placed in an oil bath as seen in Picture 1
5 0087 g of AIBN dissolved in EtOAc was added to the flask when the temperature of the oil
bath reached 65
6 The reaction was continued for 6 hours and stirred at 65 under N2 atmosphere
7 The solution was poured into a plastic jar sealed and let to cool down to room temperature
Calculations of amount of TRIS and MAA needed for the poly(TRIS-co-MAA) sample 1 see below
(1)
MTRIS = 42281 gmol
MDMAEMA = 15721 gmol
MNIPAM = 11316 gmol
MMAA = 8606 gmol
MHEAA = 11513 gmol
(2)
(3)
(4)
=012316
29
See Table 5-8 for detailed composition of all monomers
Table 5 poly(TRIS-co-MAA)
Monomer Sample A Sample B Sample 1
TRIS (g) 4947 4890 4828
MAA (g) 056 111 178
AIBN (g) 0087 0088 0087
EtOAc (g) 120 120 120
Molar fraction (TRISMAA) 09470053 08990101 08470153
Table 6 poly(TRIS-co-DMAEMA)
Monomer Sample 2 Sample C Sample 3
TRIS (g) 4904 4802 4692
DMAEMA (g) 096 200 308
AIBN (g) 0087 0087 0087
EtOAc (g) 120 120 120
Molar fraction (TRISDMAEMA) 09505 089011 085015
Table 7 poly(TRIS-co-NIPAM)
Monomer Sample 4 Sample 5 Sample 6
TRIS (g) 4932 4856 4775
NIPAM (g) 070 144 225
AIBN (g) 0087 0087 0088
EtOAc (g) 120 120 120
Molar fraction (TRISNIPAM) 095005 090010 08515 Table 8 poly(TRIS-co-HEAA)
Monomer Sample 7 Sample 8 Sample 9
TRIS (g) 4929 4853 4772
HEAA (g) 072 144 230
AIBN (g) 0087 0087 0087
EtOAc (g) 120 120 120
Molar fraction (TRISHEAA) 095005 090010 085015
Sample A B and C were not further evaluated
Purification by precipitation
1 The weight of the crude polymer was adjusted to a 30 wt solution and added to a 250 mL
glass separation funnel
2 1500 mL of MeOH was added to a 2000 mL beaker
3 The copolymer solution was drop wise precipitated into the MeOH while constant stirring as
seen in Picture 2
4 The copolymer seen in Picture 3 (a white tacky soft solid) was then retrieved by pouring off
the solution and picking up the polymer and stored in a sealed cup
30
Some observations made during the purification step are
1 The copolymer precipitates as white threads 2 The copolymer is quite firm and non-sticky 3 The solution is clear until the end where it turns turbid and the copolymer is more tacky and
sticky
First purification method Sample A B and C were not further evaluated as they were purified by another method that proved
to be insufficient to purify polymers In the patent application the purification step was described as
washing the copolymer with MeOH hence in this project the procedure was interpreted into the
following
The copolymer was dried after the synthesis and then dissolved in 20 g EtOAc on that was added the
double amount of MeOH (40 g) The solution was stirred manually with a spoon or such and left to sit
for 24 hours The excess MeOHEtOAc was poured off after 24 hours and 40 g of MeOH was added
again In total the procedure was repeated three times According to NMR spectra there was more
than 10 monomer left after this purification step and that is why the method was disregarded
Sample A B C and 2 were purified by this method but since there was no time left to purify sample
A B and C according to the purification described above they were not further evaluated
As this method showed to be insufficient it was decided to proceed with a more commonly used
method see Chapter 3 - Synthesis and purification of copolymer
31
Appendix II ndash Formulation and contact angle
Formulation The copolymers were blended with a silicone adhesive (two component system) in ratio 120 The
procedure is as follows (poly[TRIS-co-MAA] is set as an example)
1 0798 g of copolymer was blended with a conventional PDMS at 5 wt (5016 g of component A and 5014 g of component B) prior to curing
2 The blend was mixed in a SpeedMixer DAC 150 FVX-K for 30 seconds at speed of 3 500 rpm 3 It was cast onto a PUR-coated film (thickness 20 microm) coating thickness of 300 microm 4 The film was cured on a heating plate 150 degC for 15 minutes
Since the copolymers (after purification) where not dried to a 100 calculations of the percentage of
solvent left had to be done before any formulations could be made
Calculating percentage of solvent left in the wet copolymer was performed as follows (taking Sample
1 as example)
1 343 g of copolymer was set to dry in an oven at 45degC 2 After one day the sample was weighted to 201 g 3 The weight difference is the amount of solvent in the wet copolymer
Table 9 Wt solvent in copolymer after purification
Sample Wet
weight (g) Dry
weight (g) wt solvent in wet
copolymer wt solvent in wet copolymer after
removal of some solvent [FINAL]
1 343 201 4139 3735
2 381 278 2703 2430
3 363 249 3140 2757
4 363 252 3057 2660
5 500 335 3300 1899
6 357 227 3641 2812
7 362 219 3950 2298
8 301 205 3189 2938
9 487 291 4024 3425 Table 10 (g) copolymer needed to acheive a 5 wt in the formulation blend (based on Table 10 last column)
Formulation (sample)
Wet copolymer (g) Component A (g) Component B (g) wt copolymer in
blend
1 0798 5016 5014 475
2 0655 5036 5057 468
3 0692 5018 5037 475
4 0678 5013 5024 472
5 0615 5028 5020 472
6 0698 5029 5023 475
7 0699 5027 5034 507
8 0716 5018 5050 478
9 0761 4968 4934 482
32
Contact angle Contact angle measurements were performed on a EASYDROP Contact Angle Measurement System
from KRUumlSS with DSA1 control and evaluating software
1 A sample size 2 cm x 5 cm was taken from each formulation 2 One sample at a time was put on the sample table see Picture 4 3 The sample was illuminated with a PC-controlled illumination 4 The syringe was filled with deionized water and a droplet size 3 microL was produced at the tip
of the needle and applied on the surface 5 Pressing start in the computer software system the measurements started and proceeded for
one minute 6 Three positions were tested on each sample
33
Appendix III ndash Results
MVTR For the calculations of the MVTR values Equation (1) was applied
(1)
where
In this experimental setup deionized water was used as liquid and the test period was set to 24
hours
Table 11 MVTR raw data (red-marked number is disregarded)
Formulation W1 (g) W2 (g) W1-W2 (g) Average (g)
1
2119196 2114015 05181
05299 2123917 2118254 05663
2130770 2125716 05054
2
2120806 2111452 09354
08383 2128864 2121294 0757
2114589 2106363 08226
3
2137987 2133518 04469
04917 2119481 2114588 04893
2134925 2129537 05388
4
2134925 2121103 13822
1058 2134836 2125515 09321
1938189 1929592 08597
5
2140372 2135713 04659
04681 2138197 2133245 04952
2124946 2120513 04433
6
2127705 2121994 05711
05937 2124817 2117913 06904
2147531 2142335 05196
7
2116362 2111662 04700
04701 2121055 2116317 04738
2126865 2122200 04665
8
2138735 2133730 05005
05050 2134656 2129915 04741
2107122 2101718 05404
9
2121140 2116611 04529
04998 2140479 2134419 06060
2135159 2130754 04405
R 2127272 2122760 04512
04412 2138336 2134024 04312
34
SEC
Figure 16 SEC of Sample B MW = 508 456 gmol
Figure 17 SEC of Sample C MW = 443 117 gmol
35
1H- NMR
Figure 18 NMR of Sample A
Figure 19 NMR of Sample B
36
Figure 20 NMR of Sample 2
Figure 21 NMR of Sample C
37
Figure 22 NMR of Sample 3
Figure 23 NMR of Sample 4
38
Figure 24 NMR of Sample 5
Figure 25 NMR of Sample 6
39
Figure 26 NMR of Sample 7
Figure 27 NMR of Sample 8
40
Figure 28 NMR of Sample 9

9
Scheme 4 Combination of two growing chains into one polymer
Disproportionation
This occurs when hydrogen abstractions takes place in one end forming a carbon double bond and
resulting in two dead polymer chains see Scheme 5 [18]
Scheme 5 Disproportionation of two growing chains into two dead polymer chains
Chain transfer
Chain transfer occurs when the active center of a growing polymer is transferred to another species
through a collision There are several types of chain transfer In general hydrogen abstraction from
monomer initiator polymer solvent and modifier There are five concepts of chain transfer transfer
to monomer transfer to initiator transfer to polymer transfer to modifier and transfer to solvent
[18]
Copolymer equation When using two or more monomers in a free radical polymerization the term is known as
copolymerization By copolymerizing two monomers the properties of the resulting polymer are
often better than the properties for the parent homopolymers The simplest case of
copolymerization involves two monomers (eg M1 and M2) but can be presented in several different
structures within the copolymer such as Statistical copolymer Alternating copolymers Block
copolymers Graft copolymers and Stereoblock copolymer [18]
The copolymerization between two monomers M1 and M2 is presented in equations (51)-(54)
where k11k22 and k12k21 correspond to self-propagating and cross-propagating rate constants
respectively [18]
(51)
(52)
(53)
(54)
The rate of consumption of M1 can be determined according to equation (6) if steady state
conditions prevail and the radical activity only depends on the nature of the terminal unit [18]
10
(6)
The rate of consumption for M2 is then
(7)
By assuming that
the copolymer equation is obtained by dividing
equation (6) by equation (7) so that
(8)
where r1 and r2 represent relative reactivity ratios from and
Several limiting cases of r can be derived
block copolymerization since both reactivity ratios are larger than unity the propagating monomers prefer to react with themselves forming blocks of M1 and M2
block copolymerization since the reactivity ratios are much higher than unity there is no inclination for the monomers to react with each other leading to two homopolymers
ideal copolymerization the propagating species M1 and M2 have the same preference for adding one or the other resulting in a random copolymer
alternating copolymerization each of the two propagating species prefers adding the other monomer
M1 is more reactive toward both propagating species and the copolymer will contain more of the reactive monomer in statistical placement [20]
Characterization methods
Contact angle
The spreading or deformation of a water droplet on a solid surface is determined by the surface and
interfacial energies The contact angle θ is the angle under which the droplet meets the surface and
may be evaluated by taking into account the three interfacial tensions in Figure 8
ndash between surface and liquid
ndash between surface and gas
ndash between liquid and gas
Figure 8 Different contact angles of a water droplet on a solid surface
11
The contact angle is also a quantification of the wetting of the solid by the liquid and is determined
by Youngs equation
(9)
The lower θ the better the wetting Poorly wetting systems may eg be water on Teflon where the
water droplet rolls off the surface hence θ approaches 180deg The other opposite is when the liquid
spreads and covers the surface complete wetting is achieved and θ approaches 0deg [21 22]
Moisture vapor transmission rate (MVTR)
The definition of moisture vapor transmission rate (also water vapor transmission rate) is as follows
The rate of water vapor flow under steady specified conditions through a unit area of a material
between its two parallel surfaces and normal to the surfaces [23]
And the metric unit of measurements is
12
TRIS
MAA
5 mol
10 mol
15 mol
DMAEMA
5 mol
10 mol
15 mol
NIPAM
5 mol
10 mol
15 mol
HEAA
5 mol
10 mol
15 mol
3 Experimental
Chemicals Table 2 Chemicals used in this project
Monomers Solvents Initiator Silicone PSA
TRIS (from Sigma-Aldrich) EtOAc (from Sigma-Aldrich) AIBN (from
Chalmers) MED 6350 (from Nusil)
NIPAM (from Sigma-Aldrich) MeOH (from Sigma-Aldrich)
DMAEMA (from Sigma-
Aldrich)
MAA (from Sigma-Aldrich)
HEAA (from Sigma-Aldrich)
Methodology
Synthesis and purification of copolymer
In the synthesis of the copolymer monomer weight was kept at 50 g for all the experiments Amount
of initiator was kept at approximately 0087 g and the solvent was kept at 120 g generating a 30 wt
solution
The synthesis was carried out in a round bottom flask see Picture 1 placed in an oil bath holding 65
degC The two monomers (TRIS and MAADMAEMANIPAMHEAA) see Figure 9 were added to the
flask with solvent and initiator Stirring was important throughout the entire synthesis to promote
good mixing The synthesis for each copolymer lasted for six hours For more detailed description see
Appendix I
The copolymer solution was purified by precipitation in methanol see Picture 2 This is because the
copolymer is not soluble in methanol while the pure monomers are In Picture 3 the precipitated
copolymer is shown
Figure 9 A scheme of poly[TRIS]-combinations and molar percentages of MAADMAEMANIPAMHEAA
13
Formulation of copolymer and two component system Each copolymer was blended with MED 6350 (a commercial PDMS polymer) in a 120 ratio of
copolymer to MED 6350 The blends were cast onto PUR-films and then cured on a heating plate to
generate the final PSA For more details see Appendix II
Contact angle measurements The contact angle measurements were performed on the formulations above and not on the pure
copolymers Each formulated film was measured with the EASYDROP Contact angle Measurement
System see Picture 4 using deionized water Three positions were measured for every formulated
film during 60 seconds to ensure a correct average contact angle More details in Appendix II
Picture 1 Synthesis reaction set-up Picture 2 Copolymer purification set-up
Picture 3 A close-up of the precipitated copolymer
14
Picture 4 Contact angle measurement equipment
Moisture vapor transmission rate (ID T-1070)
A cylinder was filled with deionized water up to a level leaving a 5 mm air gap The produced films
from the formulations three specimens of each were punched out in a circular shape larger than the
opening of the cylinders The cylinder was covered with the specimen weighed and placed in an
oven (37degC) for 24 hours After 24 hours the cylinder with the specimen was weighed again and
moisture vapor transmission rate could be obtained by calculating the loss of water
NMR and SEC 1H NMR spectrum was recorded on a Varian 400 spectrometer The samples were dissolved in CDCl3
and the 1H NMR spectra were obtained at 298 K with CDCl3 as internal standard Size-exclusion
chromatography (SEC) was performed on a Waters Alliance 2000 GPCV at 135degC with 124-
trichlorobenzene as eluent at 1 mLmin using an RI-detector It was calibrated using polystyrene
standards
Failed method GF31 is a chemical similar to TRIS but much cheaper see Figure 10 and 11 The first synthesis was
therefore done with GF31 instead of TRIS The first polymerization was between GF31 and MAA
Table 3
Table 3 First synthesis between GF31 and MAA
Chemical Amount
GF31 11195 (g)
MAA 3754 (g)
EtOAc 350 (g) (+ 400 mL)
AIBN 095 (g)
This first synthesis was done in a batch size of 500 g A reactor with a built in heat controlled oil
circulation was used with a SVL multi-joint lid 5-NECK on top Through the center neck a mechanical
stirrer passed and through the others nitrogen gas was connected and in-let of chemicals occurred
15
the rest were sealed The synthesis progressed in the same manner as described in Chapter 3 ndash
Synthesis and purification of copolymer Problems faced here were leakage of solvent and GF31
interaction with MAA As seen in Table 3 an extra amount (400 mL) of EtOAc was added during the
synthesis due to fact that 80 of the solvent (EtOAc) had evaporated within six hours GF31 (since it
is different from TRIS) formed a type of hard brittle white copolymer instead of the expected clear
tough and rubbery copolymer The ndashSi-O-Me groups of GF31 are probably more reactive than the
TMS groups of TRIS leading to the hard brittle copolymer formed However the side group of
monomer GF31 is not flexible enough to form a soft polymer and less MAA would improve the
softness Even though later on the leakage problem was solved (by sealing the center neck better)
the reactor was disregarded as an optimal set-up and was replaced by round bottom flask (reactor
with batch size 150 g) with a rubber septa using TRIS instead of GF31
Figure 10 Chemical structure of TRIS Figure 11 Chemical structure of GF31
16
4 Results and discussion
Polymerization
Yield
The yield does not take into consideration amount of monomer left in the copolymer In Chapter 4 ndash
NMR calculations of copolymer composition and percentage of monomer left are made For some
copolymers eg sample 1 the yield is much lower than for the rest as seen in Table 4 This may be
due to loss of copolymer in the first purification method see Appendix I Sample 1 (15 MAA)
showed some solubility in MeOH which means that when excess MeOHEtOAc was poured off some
polymer residue may also have been poured off hence the lower yield Also in the precipitation
method the solution started to become turbid when all copolymer solution had been blended with
the MeOH this was a fact for all copolymers The EtOAc to MeOH ratio was probably too small and
the copolymer started to dissolve There was most likely some loss of copolymer in this step too It
would probably have been better to use a larger quantity MeOH to avoid dissolution of the
copolymer
The best yield was expected for sample 8-9 as they had not been purified by the first method first
and hence the loss of polymer was strictly restricted to the new method But as seen the yield is 63
for Sample 8 and 70 for sample 9
Sample 7-9 are the poly[TRIS-co-HEAA] copolymers Amount of HEAA increases from sample 7 to
sample 9 and hence increased hydrophilicity The reason to why there is a loss of polymer in the
purification step could be that the copolymer (as the HEAA increases) became more soluble in
MeOH But as seen in Table 4 sample 7-9 are the copolymers containing the highest amount of TRIS
This speaks against the possibility of increasing HEAA contributing to increased hydrophilicity and
thus making the copolymer soluble in MeOH Also sample 9 should be more soluble in MeOH than
sample 8 as it contains more HEAA The same behavior is seen in sample 4-6 (poly[TRIS-co-NIPAM])
where there is a larger loss of copolymer for sample 4 than for sample 6 It seems that the yield is
somewhat circumstantial
17
Table 4 Results from all evaluations
18
SEC ndash molecular weight
According to the patent application it is stated that the molecular weight is larger than 10 000 gmol
In Figure 12 and 13 and Appendix III Figure 16-17 all values show a MW well above 10 000 gmol at
the lowest 360 000 gmol and for the highest at 508 000 gmol SEC was only done on Sample A-C
see Table 4 and Sample 2 as the copolymers are TRIS-based it is assumed that the rest of the
copolymers possess a similar molecular weight The second peak in both figures represents some
low molecular substance probably monomer residue Before H-NMR measurements Sample 2 was
purified one more time see Appendix I First purification method
Figure 12 SEC of Sample 2 Mw = 360 000 gmol
Figure 13 SEC of Sample A MW= 485 000 gmol
19
1H- NMR
Figure 14 NMR of Sample 1
1H- NMR was done to be able to calculate the composition in the copolymer Calculations are shown
below on Figure 14
(10)
where xT and xM are fractions of TRIS and MAA in the copolymer respectively
(11)
Applying equation (10) into equation (11) and
(expected value is 85 )
The two peaks at 610 ppm and 554 ppm are from the double bonds in the two monomers
(12)
Where xMo is the fraction of monomer left in the copolymer
20
Since xT is 8075 of the copolymer composition xMo is then
According to the calculations above there is approximately 392 monomer residue left in the
copolymer That is quite a large difference to 108 left in sample A (calculated in the same manner
as above) which was purified by the first purification method see Appendix I First purification
method
Table 4 presents the copolymer compositions for each copolymer These data are not exact as the
integrals were calculated by hand in MestreNova an analytical chemistry software suite This results
in an inaccuracy that has to be taken into account and the data showed above has to be considered
as approximate values For all the copolymers there is a continuous increase of the comonomer
which is consistent with the expected values
One copolymer is standing out from the others and it is poly[TRIS-co-HEAA] (sample 7-9) The
expected (the input) percentage of HEAA was 5 ndash 10 ndash 15 but the output was approximately 3 ndash 5 ndash
10 which means that TRIS has less affinity for HEAA than for the rest of the monomers Hence one
can assume leading to TRIS being more reactive toward both propagating species
and the copolymer will contain more of the reactive monomer (TRIS) in statistical placement In
comparison TRIS to the other monomers the r values were as can be seen in
Table 4 where the output was larger than 5 ndash 10 ndash 15 for the comonomers (exception DMAEMA
where 5 was input and 239 was output)
As seen in Table 4 the amount of monomer left in the copolymer varies between 077 ndash 392 for
the polymer purified by precipitation For copolymers A-C the level of monomers left are much
higher (85 ndash 137 ) and this proves that the first purification method was insufficient
Contact angle measurements All contact angle measurements were performed on the formulated films and not on the pure
copolymers
As seen in Table 4 the contact angle (deg) of the copolymer formulations does not differ from the
reference formulation (pure MED 6350) especially much The contact angle was expected to be lower
than the reference but as seen it is higher for sample 7 The contact angle is in the interval 121deg -
128deg and is too narrow to say anything about whether the contact angle actually has been modified
or not One reason to why these measurements may not have been very accurate is the fact that the
angle was measured on a droplet that was out in the open Lights from the surroundings and air
conditioning in the room could have affected the measurements Observed during the measurement
was that the droplet size steadily decreased which either means that the droplet evaporates or that
the surface has changed Had these measurements been done in a closed environment of the
droplet then perhaps there would have been different values
Another fact to why there is such little change in the contact angle is that silicones are highly
hydrophobic materials and since there is a very small amount of hydrophilic material integrated in
the silicone a large difference in the contact angle is really not expected Had there been a large
21
difference in contact angle the possibility of migration within the formulation of the hydrophilic
copolymer could be a reason However that was not the case and is very unlikely since the
copolymers are large molecules and the probability of migration is therefore small
Moisture vapor transmission rate The higher MVTR the better vapor transmission As seen in Table 4 all formulations show higher
MVTR than the reference This means that the formulations containing the hydrophilic copolymers
actually breathe better and are more likely to let vapor through Sample 4 [poly(TRIS-co-NIPAM(5
mol))] has an MVTR that is 139 better than the reference The rest of the formulations show an
improvement between 6 ndash 90 As only three tests on each formulation was done it is not
statistically correct to say that there has been an improvement of the MVTR as there is no clear
standard deviation to take into account However all formulations show higher MVTR than the
reference
Figure 15 MVTR data for all samples Blue = values for each test Red = average
In the investigated patent application there was no MVTR-testing done However testing of wet
adhesion was done by taking a 1-inch by 15-inch strip of adhesive and attach it to the abdominal skin
of a human subject and removing it after 40-60 min of aerobic activity [2] According to their results
good wet adhesion was achieved with the formulation containing 5 mol NIPAM and weak wet
adhesion was achieved with the formulation containing 5 mol DMAEMA sample 4 (MVTR = 1058)
and 2 (MVTR = 838) respectively in this project These two formulations showed best MVTR results
and are in accordance with the patent application investigated Why the formulations with lower
amount of polar part showed the best MVTR values must be due to morphology However due to
monomer residue wet adhesion testing on humans was not possible
22
There were some formulations with bubbles in the film seen Picture 5 and 6 Especially sample 2 4
and 8 This may have affected the MVTR and contributed to a higher value than expected
Formulation 8 had also a large amount of bubbles but a low MVTR The bubbles may have been
caused by solvent or monomer evaporating or air that has been trapped during the speed mixing As
seen in Figure 15 there is one value for sample 4 that is well above the others Since the value is
almost 50 larger than the second highest value it could be faulty perhaps an increased amount of
bubbles in the film or leakage of the cylinder
Picture 5 From MVTR Representing sample 9 - 7 from left to right
Picture 6 From MVTR Representing sample 2 - 4 from left to right
23
5 Conclusions This study showed that synthesis of hydrophilic silicone copolymers can be relatively easy
performed and the molecular weight achieved was high (Mw gt 500 000 gmol)
1H- NMR showed that the composition in the copolymers was not as the feed monomer composition
For poly[TRIS-co-MAA] and poly[TRIS-co-NIPAM] there was a higher percentage of comonomer than
assumed while the values varied for poly[TRIS-co-DMAEMA] and for poly[TRIS-co-HEAA] there was a
lower percentage of comonomer NMR also indicated monomer residue left in the copolymers
between 077 ndash 392 indicating that the purification step needs to be optimized or repeated more
than once to remove monomers left in the copolymer
According to contact angle measurements wetting of the silicone surface was not greatly affected
As the addition of copolymer was only 5 wt and of those 5 wt only 5 ndash 15 mol contained a
hydrophilic part a large change in contact angle was not expected The contact angle was evaluated
as the patent application [2] stated large change in wet adhesion
The most relevant results for this project were the MVTR results as they portrayed the improvement
of the silicone PSA (pure MED 6350) The MVTR values showed an large increase in water vapor
permeability for sample 2 and 4 5 mol DMAEMA and 5 mol NIPAM respectively If there is a
correlation between good wet adhesion and MVTR = 1058 (sample 4) contra weak wet adhesion
and MVTR = 838 (sample 2) then it is possible to conclude that for the rest of the copolymer samples
(MVTR ltlt 800) no or little wet adhesion was achieved Why there was no radical improvement for
sample C and 3 and sample 5 and 6 (DMAEMA 10-15 mol and NIPAM 10-15 mol respectively)
can be due to the results of sample 2 and 4 being faulty The explanation could also be that the
values are correct and that the addition of only 5 mol was enough to change the morphology of
the film in a way generating a higher MVTR and increasing the mol of comonomer did not change
the morphology in the same way thus not generating a higher MVTR
Overall it can be concluded that this method is not optimal for increasing hydrophilicity of PSAs as
the method is somewhat complicated to perform and the purification of the copolymers is time
consuming and unsatisfactory However silicone compatible copolymers were successfully
synthesized and characterized Taking the data retrieved in regard many questions about the quality
of the patent application are raised
24
6 Future work For this project future work would be to further purify the copolymers and then evaluate their
adhesive properties directly on the skin This would give more realistic values to whether or not the
modified PSAs have achieved better wet adhesion or not Also to redo the formulations without
bubbles and once again measure MVTR To add more analysis in form of morphology analysis to se
whether or not there is a difference in structure between the different formulations
Another project of future work is to evaluate the new patent application from Convatec Technlogies
Inc [24] where PSAs are modified by the addition of a low molecular weight organic hydroxy
containing compound This method is more straight on and does not involve any complicated
synthesis or purification steps It is simply addition of a hydroxy containing compound to a PSA prior
to curing This may be an interesting study for future work
25
7 Acknowledgments Many people have been involved in this master thesis and I would like to thank them for their
support and help
Thanks to
Dennis Hansson and Lars Lindgren my supervisors at Moumllnlycke Health Care that have always been
available for questions taken a great interest in my work and been a great support
Everyone at the Columbus group at Moumllnlycke Health Care thanks for making my time here fun and
interesting
Anders Maringrtensson for helping me with SEC analysis at Chalmers
Renee Kroon for helping me with NMR analysis at Chalmers
Mats Andersson my examiner
Friends and family
26
References [1] Mechan S et al Amphiphilic Silicone Copolymers for Pressure Sensitive Adhesive Applications
Journal of Applied Polymer Science 2010 116 3265-3270
[2] Convatec Technologies Inc Pressure Sensitive Silicone Adhesives with Amphiphilic copolymers
WO2011005839A1 Publication date 13 January 2011
[3] Clarson J S et al Silicones and Silicone-Modified Materials American Chemical Society
Washington (2000)
[4] Pachaly B Achenbach F Herzig C Mautner K Silicones WILEY-VCH Wienheim (2005)
[5] Colas A and Curtis J Silicone Biomaterials History and Chemistry amp Medical Applications of
Silicones httpwwwdowcorningcomcontentpublishedlit52-1069-01pdf 2012-01-17
[6] Ratner Buddy D et al Biomaterials Science ndash An introduction to Materials in Medicine Elsevier
London (2004)
[7] Gay C Stickiness ndash some fundamentals of adhesion Integrative and Comparative Biology 2002
42 1123-1126
[8] V Pocius A Adhesion Kirk-Othmer Encyclopedia of Chemical Technology Vol 1 Page 501
(2002)
[9] John Comyn Adhesion Science Royal Society of Chemistry Paperbacks 1997
[10] Garbassi F et al Polymer surfaces ndash From Physics to Technology John Wiley amp Sons Chichester
(1998)
[11] Covert P Principles of Pressure Sensitive Adhesion httpwwwgluemachinerycomprinciples-
of-pressure-sensitive-adhesionhtml 2012-02-08
[12] TRIS
httpwwwsigmaaldrichcomcatalogProductDetaildoD7=0ampN5=SEARCH_CONCAT_PNO7CBRA
ND_KEYampN4=4461307CALDRICHampN25=0ampQS=ONampF=SPEC 2012-02-08
[13] MAA
httpwwwsigmaaldrichcomcatalogProductDetaildoD7=0ampN5=SEARCH_CONCAT_PNO7CBRA
ND_KEYampN4=640507CFLUKAampN25=0ampQS=ONampF=SPEC 2012-02-08
[14] HEAA
httpwwwsigmaaldrichcomcatalogProductDetaildoD7=0ampN5=SEARCH_CONCAT_PNO7CBRA
ND_KEYampN4=6979317CALDRICHampN25=0ampQS=ONampF=SPEC 2012-02-08
[15] NIPAM
httpwwwsigmaaldrichcomcatalogProductDetaildoD7=0ampN5=SEARCH_CONCAT_PNO7CBRA
ND_KEYampN4=4153247CALDRICHampN25=0ampQS=ONampF=SPEC 2012-02-08
27
[16] DMAEMA
httpwwwsigmaaldrichcomcatalogProductDetaildoD7=0ampN5=SEARCH_CONCAT_PNO7CBRA
ND_KEYampN4=2349077CALDRICHampN25=0ampQS=ONampF=SPEC 2012-02-08
[17] AIBN
httpwwwsigmaaldrichcomcatalogProductDetaildolang=enampN4=441090|ALDRICHampN5=SEARC
H_CONCAT_PNO|BRAND_KEYampF=SPEC 2012-02-09
[18] Cowie JMG and Arrighi V Polymers Chemistry and physics of modern materials Taylor amp
Francis Group (2008)
[19] Wound Care ndash MepilexreghttpwwwmolnlyckecomgbWound-Care-ProductsProduct-
selector---Wound-divisionTabsProductsMepilexactiveTab=3 2011-10-24
[20] Chain copolymerization
httpcesysueducnechemipolychemuploadfilesE585B1E8819AE59088pdf
2012-02-09
[21] Israelachivli Jacob N Intermolecular and surface forcesAcademic Press Burlington (2011)
[22] Lyklema J et al Fundamentals of interface and colloid science Academic press San Diego
(2000)
[23] Gooch Jan W Encyclopedic dictionary of polymers 2 Part 13 Page 815 (2011)
[24] Convatec Technologies Inc Silicone Gel Adhesive with Organic Polyhydroxy Compounds
WO2012003028A1 Publication date 5 January 2012
28
Appendix I ndash Synthesis and purification
The synthesis was carried out by combining TRIS with the other monomers see Figure 9 The
combination resulted in four copolymers divided into three categories variations of 95 90 and 85
mol of TRIS
The procedure for the synthesis of poly[TRIS]-based copolymers by free radical polymerization using
poly[TRIS-co-MAA] as an example is as follows
1 4947 g of TRIS and 056 g of MAA was added to a 250 ml round bottomed flask containing a
magnetic stirring bar
2 To the flask was added 120 g of EtOAc to afford a 30 wt solution
3 The flask was sealed with a rubber septa and flushed with with nitrogen for 10 minutes
4 The flask was then placed in an oil bath as seen in Picture 1
5 0087 g of AIBN dissolved in EtOAc was added to the flask when the temperature of the oil
bath reached 65
6 The reaction was continued for 6 hours and stirred at 65 under N2 atmosphere
7 The solution was poured into a plastic jar sealed and let to cool down to room temperature
Calculations of amount of TRIS and MAA needed for the poly(TRIS-co-MAA) sample 1 see below
(1)
MTRIS = 42281 gmol
MDMAEMA = 15721 gmol
MNIPAM = 11316 gmol
MMAA = 8606 gmol
MHEAA = 11513 gmol
(2)
(3)
(4)
=012316
29
See Table 5-8 for detailed composition of all monomers
Table 5 poly(TRIS-co-MAA)
Monomer Sample A Sample B Sample 1
TRIS (g) 4947 4890 4828
MAA (g) 056 111 178
AIBN (g) 0087 0088 0087
EtOAc (g) 120 120 120
Molar fraction (TRISMAA) 09470053 08990101 08470153
Table 6 poly(TRIS-co-DMAEMA)
Monomer Sample 2 Sample C Sample 3
TRIS (g) 4904 4802 4692
DMAEMA (g) 096 200 308
AIBN (g) 0087 0087 0087
EtOAc (g) 120 120 120
Molar fraction (TRISDMAEMA) 09505 089011 085015
Table 7 poly(TRIS-co-NIPAM)
Monomer Sample 4 Sample 5 Sample 6
TRIS (g) 4932 4856 4775
NIPAM (g) 070 144 225
AIBN (g) 0087 0087 0088
EtOAc (g) 120 120 120
Molar fraction (TRISNIPAM) 095005 090010 08515 Table 8 poly(TRIS-co-HEAA)
Monomer Sample 7 Sample 8 Sample 9
TRIS (g) 4929 4853 4772
HEAA (g) 072 144 230
AIBN (g) 0087 0087 0087
EtOAc (g) 120 120 120
Molar fraction (TRISHEAA) 095005 090010 085015
Sample A B and C were not further evaluated
Purification by precipitation
1 The weight of the crude polymer was adjusted to a 30 wt solution and added to a 250 mL
glass separation funnel
2 1500 mL of MeOH was added to a 2000 mL beaker
3 The copolymer solution was drop wise precipitated into the MeOH while constant stirring as
seen in Picture 2
4 The copolymer seen in Picture 3 (a white tacky soft solid) was then retrieved by pouring off
the solution and picking up the polymer and stored in a sealed cup
30
Some observations made during the purification step are
1 The copolymer precipitates as white threads 2 The copolymer is quite firm and non-sticky 3 The solution is clear until the end where it turns turbid and the copolymer is more tacky and
sticky
First purification method Sample A B and C were not further evaluated as they were purified by another method that proved
to be insufficient to purify polymers In the patent application the purification step was described as
washing the copolymer with MeOH hence in this project the procedure was interpreted into the
following
The copolymer was dried after the synthesis and then dissolved in 20 g EtOAc on that was added the
double amount of MeOH (40 g) The solution was stirred manually with a spoon or such and left to sit
for 24 hours The excess MeOHEtOAc was poured off after 24 hours and 40 g of MeOH was added
again In total the procedure was repeated three times According to NMR spectra there was more
than 10 monomer left after this purification step and that is why the method was disregarded
Sample A B C and 2 were purified by this method but since there was no time left to purify sample
A B and C according to the purification described above they were not further evaluated
As this method showed to be insufficient it was decided to proceed with a more commonly used
method see Chapter 3 - Synthesis and purification of copolymer
31
Appendix II ndash Formulation and contact angle
Formulation The copolymers were blended with a silicone adhesive (two component system) in ratio 120 The
procedure is as follows (poly[TRIS-co-MAA] is set as an example)
1 0798 g of copolymer was blended with a conventional PDMS at 5 wt (5016 g of component A and 5014 g of component B) prior to curing
2 The blend was mixed in a SpeedMixer DAC 150 FVX-K for 30 seconds at speed of 3 500 rpm 3 It was cast onto a PUR-coated film (thickness 20 microm) coating thickness of 300 microm 4 The film was cured on a heating plate 150 degC for 15 minutes
Since the copolymers (after purification) where not dried to a 100 calculations of the percentage of
solvent left had to be done before any formulations could be made
Calculating percentage of solvent left in the wet copolymer was performed as follows (taking Sample
1 as example)
1 343 g of copolymer was set to dry in an oven at 45degC 2 After one day the sample was weighted to 201 g 3 The weight difference is the amount of solvent in the wet copolymer
Table 9 Wt solvent in copolymer after purification
Sample Wet
weight (g) Dry
weight (g) wt solvent in wet
copolymer wt solvent in wet copolymer after
removal of some solvent [FINAL]
1 343 201 4139 3735
2 381 278 2703 2430
3 363 249 3140 2757
4 363 252 3057 2660
5 500 335 3300 1899
6 357 227 3641 2812
7 362 219 3950 2298
8 301 205 3189 2938
9 487 291 4024 3425 Table 10 (g) copolymer needed to acheive a 5 wt in the formulation blend (based on Table 10 last column)
Formulation (sample)
Wet copolymer (g) Component A (g) Component B (g) wt copolymer in
blend
1 0798 5016 5014 475
2 0655 5036 5057 468
3 0692 5018 5037 475
4 0678 5013 5024 472
5 0615 5028 5020 472
6 0698 5029 5023 475
7 0699 5027 5034 507
8 0716 5018 5050 478
9 0761 4968 4934 482
32
Contact angle Contact angle measurements were performed on a EASYDROP Contact Angle Measurement System
from KRUumlSS with DSA1 control and evaluating software
1 A sample size 2 cm x 5 cm was taken from each formulation 2 One sample at a time was put on the sample table see Picture 4 3 The sample was illuminated with a PC-controlled illumination 4 The syringe was filled with deionized water and a droplet size 3 microL was produced at the tip
of the needle and applied on the surface 5 Pressing start in the computer software system the measurements started and proceeded for
one minute 6 Three positions were tested on each sample
33
Appendix III ndash Results
MVTR For the calculations of the MVTR values Equation (1) was applied
(1)
where
In this experimental setup deionized water was used as liquid and the test period was set to 24
hours
Table 11 MVTR raw data (red-marked number is disregarded)
Formulation W1 (g) W2 (g) W1-W2 (g) Average (g)
1
2119196 2114015 05181
05299 2123917 2118254 05663
2130770 2125716 05054
2
2120806 2111452 09354
08383 2128864 2121294 0757
2114589 2106363 08226
3
2137987 2133518 04469
04917 2119481 2114588 04893
2134925 2129537 05388
4
2134925 2121103 13822
1058 2134836 2125515 09321
1938189 1929592 08597
5
2140372 2135713 04659
04681 2138197 2133245 04952
2124946 2120513 04433
6
2127705 2121994 05711
05937 2124817 2117913 06904
2147531 2142335 05196
7
2116362 2111662 04700
04701 2121055 2116317 04738
2126865 2122200 04665
8
2138735 2133730 05005
05050 2134656 2129915 04741
2107122 2101718 05404
9
2121140 2116611 04529
04998 2140479 2134419 06060
2135159 2130754 04405
R 2127272 2122760 04512
04412 2138336 2134024 04312
34
SEC
Figure 16 SEC of Sample B MW = 508 456 gmol
Figure 17 SEC of Sample C MW = 443 117 gmol
35
1H- NMR
Figure 18 NMR of Sample A
Figure 19 NMR of Sample B
36
Figure 20 NMR of Sample 2
Figure 21 NMR of Sample C
37
Figure 22 NMR of Sample 3
Figure 23 NMR of Sample 4
38
Figure 24 NMR of Sample 5
Figure 25 NMR of Sample 6
39
Figure 26 NMR of Sample 7
Figure 27 NMR of Sample 8
40
Figure 28 NMR of Sample 9
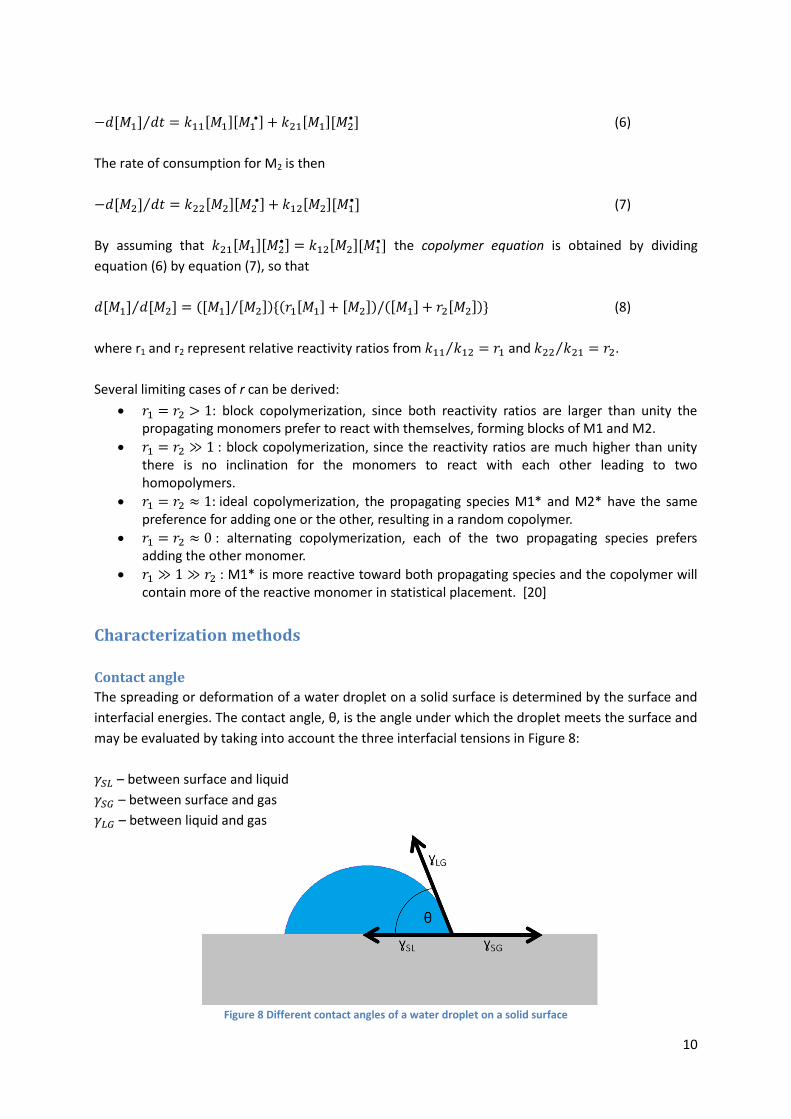
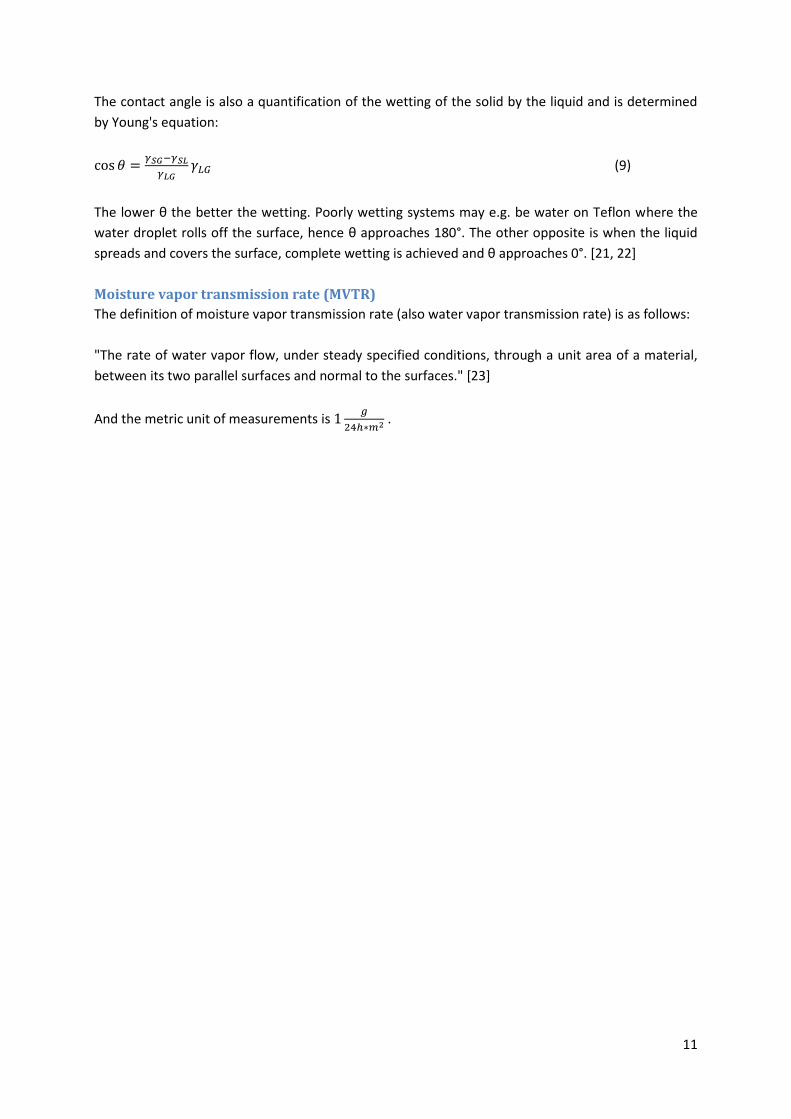
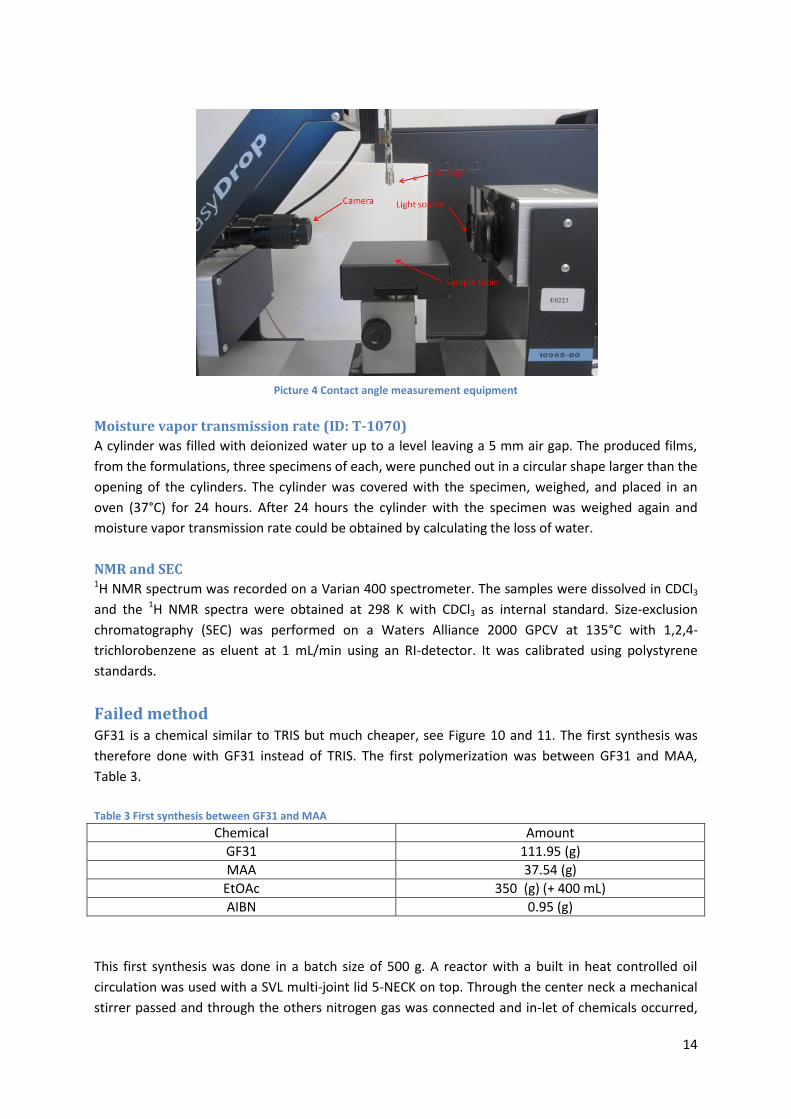
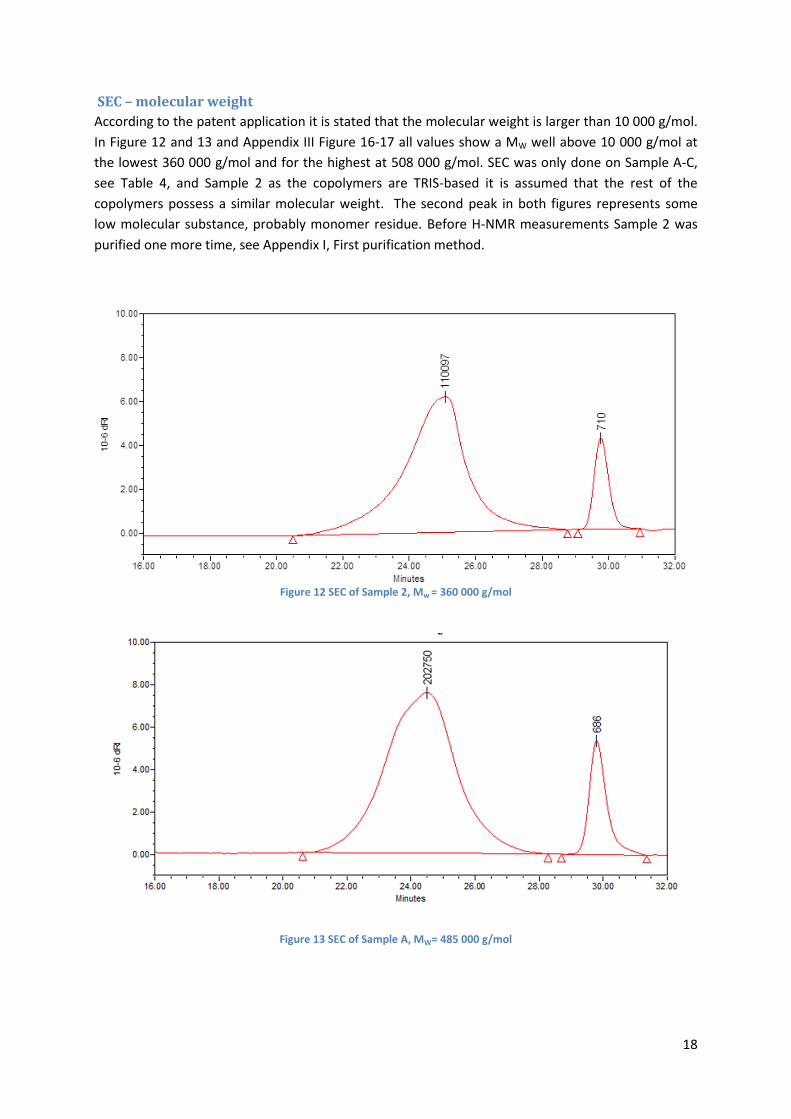
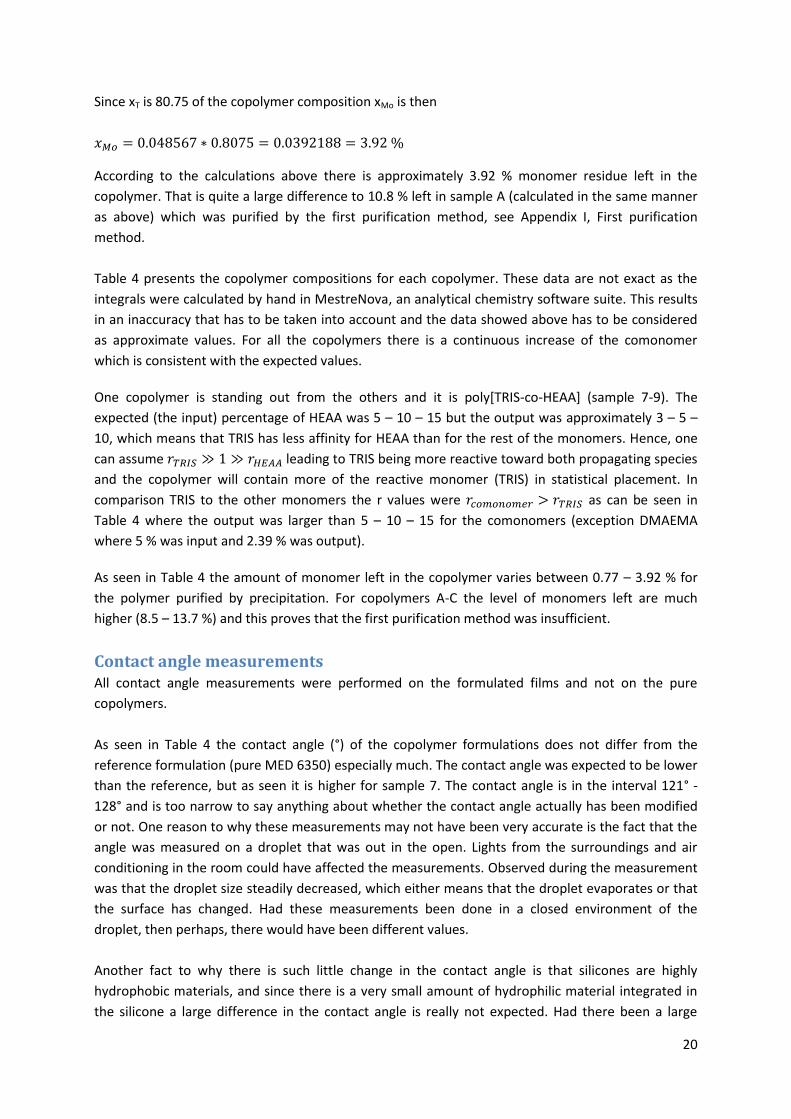
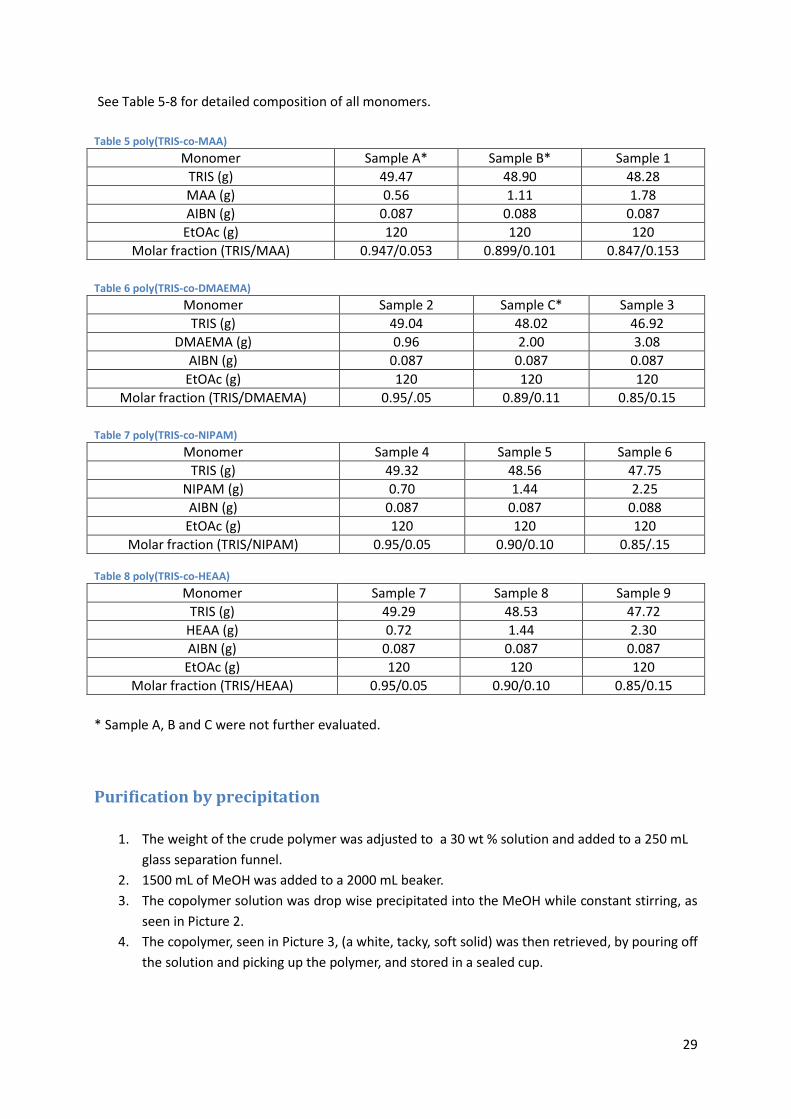
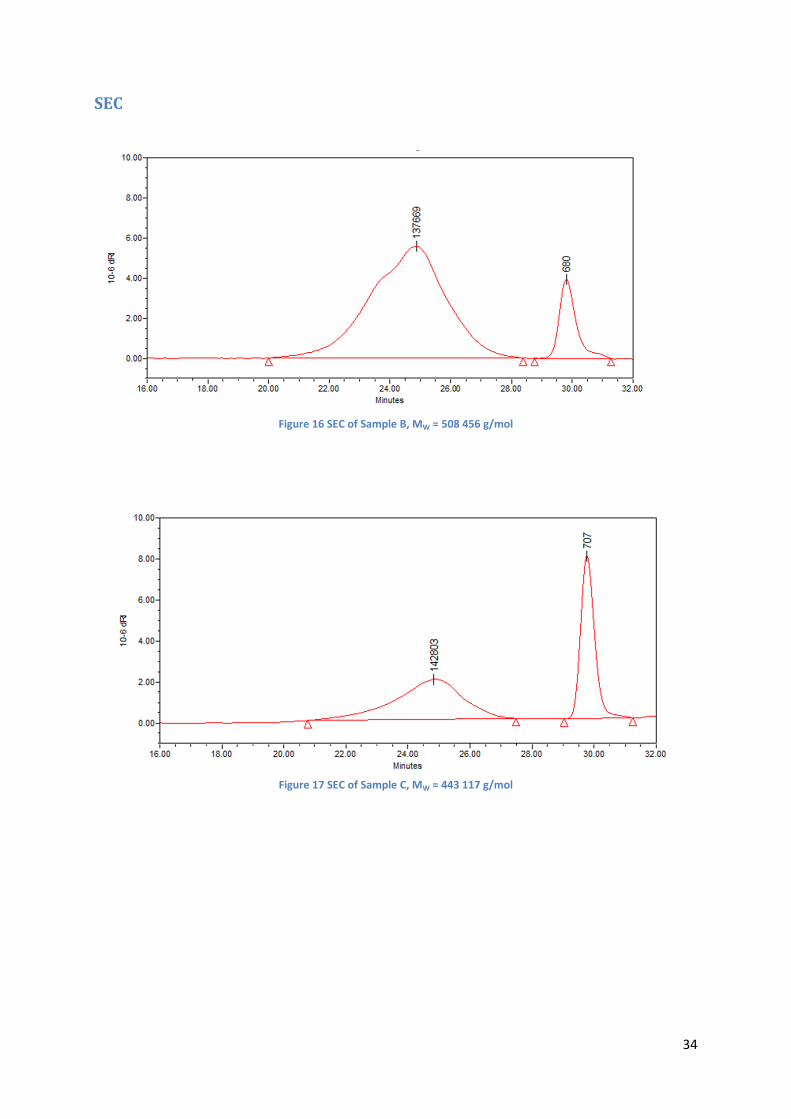

36
Figure 20 NMR of Sample 2
Figure 21 NMR of Sample C
37
Figure 22 NMR of Sample 3
Figure 23 NMR of Sample 4
38
Figure 24 NMR of Sample 5
Figure 25 NMR of Sample 6
39
Figure 26 NMR of Sample 7
Figure 27 NMR of Sample 8
40
Figure 28 NMR of Sample 9

37
Figure 22 NMR of Sample 3
Figure 23 NMR of Sample 4
38
Figure 24 NMR of Sample 5
Figure 25 NMR of Sample 6
39
Figure 26 NMR of Sample 7
Figure 27 NMR of Sample 8
40
Figure 28 NMR of Sample 9
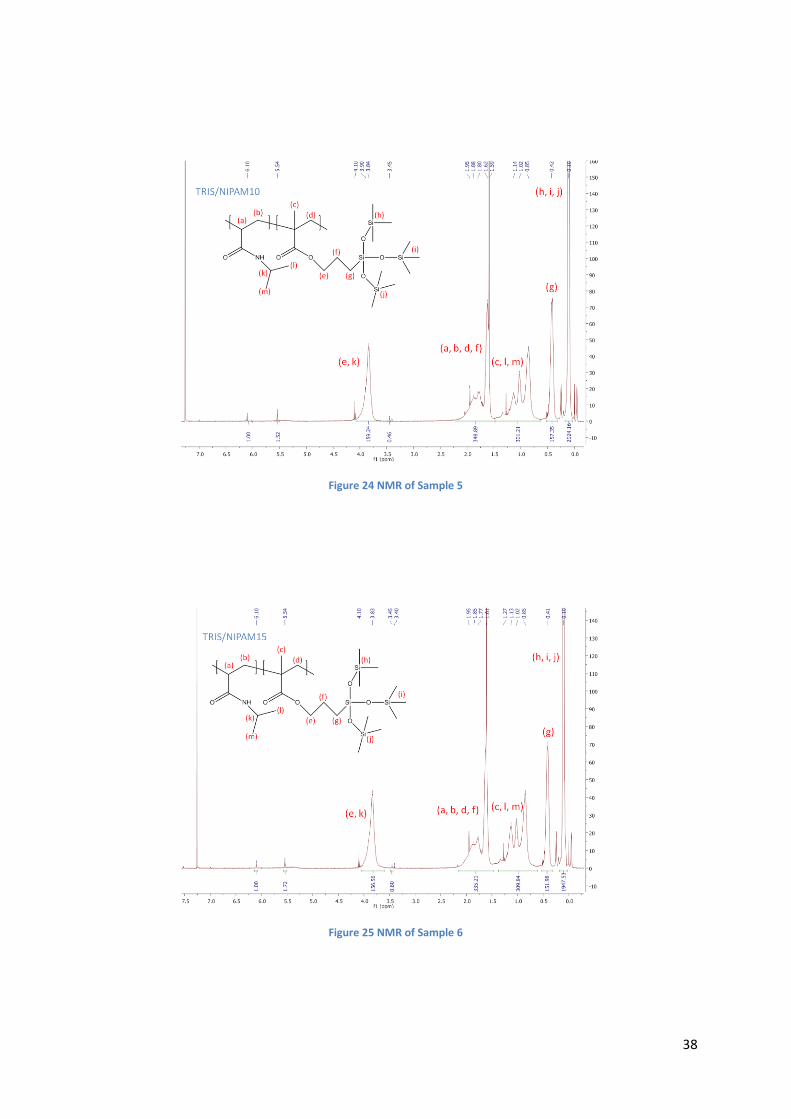
38
Figure 24 NMR of Sample 5
Figure 25 NMR of Sample 6
39
Figure 26 NMR of Sample 7
Figure 27 NMR of Sample 8
40
Figure 28 NMR of Sample 9

39
Figure 26 NMR of Sample 7
Figure 27 NMR of Sample 8
40
Figure 28 NMR of Sample 9
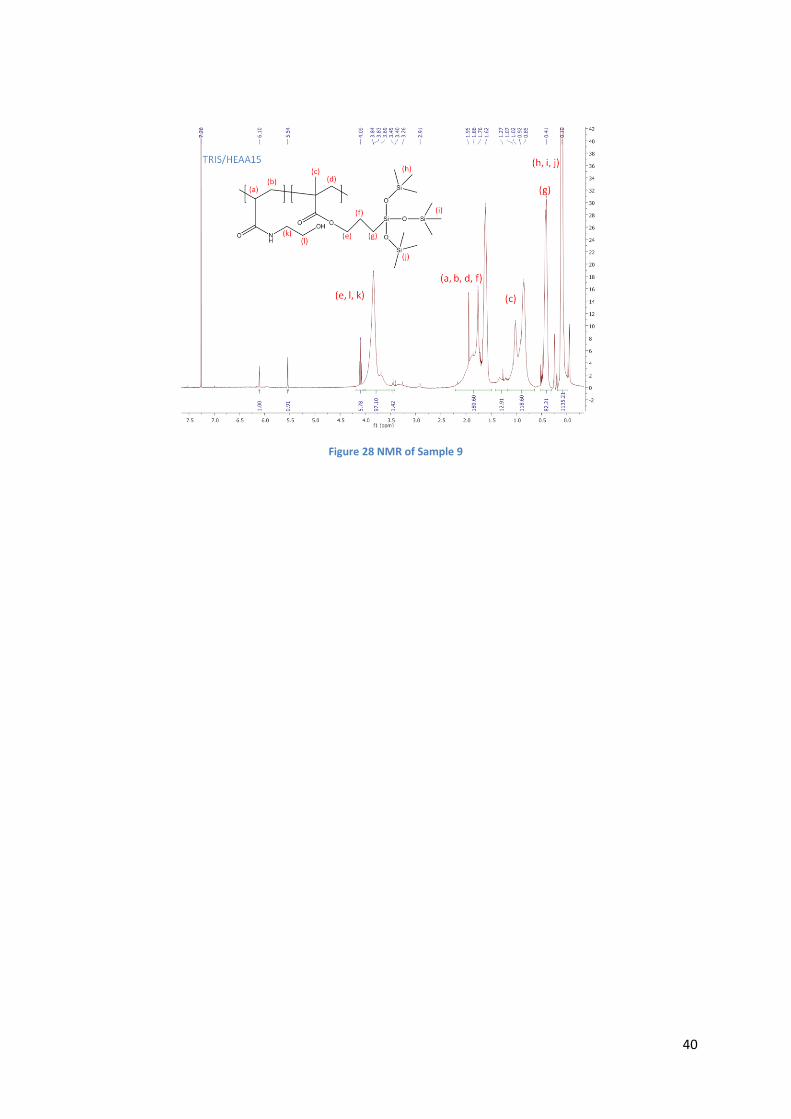
40
Figure 28 NMR of Sample 9