synthesis and characterization of star block copolymers...
TRANSCRIPT

SYNTHESIS AND CHARACTERIZATION OF STAR BLOCK COPOLYMERS FOR CONTROLLED
DRUG DELIVERY
A Thesis Submitted to the Graduate School of Engineering and Sciences of
İzmir Institute of Technology in Partial Fulfillment of the Requirements for the Degree of
DOCTOR OF PHILOSOPHY
in Chemical Engineering
by Gözde GENÇ ATİKLER
June 2010 İZMİR

We approve the thesis of Gözde GENÇ ATİKLER12 point s Stuent's name (bold) ____________________________ Asst. Prof. Ayşegül BATIGÜN Supervisor ____________________________ Prof. Serdar ÖZÇELİK Committee Member ____________________________ Prof. Sacide ALSOY ALTINKAYA Committee Member ___________________________ Assoc. Prof. Mustafa DEMİR Committee Member ____________________________ Asst. Prof. Zehra ÖZÇELİK Committee Member 9 June 2010 ____________________________ ____________________________ Prof. Mehmet POLAT Assoc. Prof. Talat YALÇIN Head of the Department of Dean of the Graduate School of Chemical Engineering Engineering and Sciences
ACKNOWLEDGEMENTS
I would like to thank to my supervisor Ayşegül Batıgün for her support and
guadiance. I thank very much to Prof. Sacide Alsoy Altınkaya and Prof. Serdar Özçelik,
for their generous help and valuable critics. I am so much thankful to Assoc. Prof. Zehra
Özçelik for her commendations and very kind interest. I have to express my deep
gratitude to Assoc. Prof. Mustafa Demir for his encouraging attitude and to Prof.
Muhsin Çiftçioğlu for his help and substantial recommendations. I need to express my
gratitude to Prof. Devrim Balköse for her support and precious advices.
This research was financially supported by İYTE BAP (2006 İYTE 33) and all
polymer samples used in this study were synthesized in Organic Chemistry Laboratory
in İTÜ Chemistry Department with permission from Prof. Ümit Tunca and Prof. Gürkan
Hızal for which I am very grateful. I would like to extend my special thanks to Prof.
Ümit Tunca for his guadiance in polymer synthesis. I am thankful to Özcan Altıntaş,
Eda Güngör and Aydan Dağ for their help and support in laboratory.
I thank very much to İYTE Materials Reserach Center staff, Evrim Yakut, Mine
Bahçeci, Duygu Oğuz and Gökhan Erdoğan for they have always been so helpful and
giving. I would like to thank to Dr. Hüseyin Özgener for his valuable advices and clues
about chemical protocols. Sincere thanks to Özlem Çağlar Duvarcı for her favour in
FTIR analysis, Burcu Alp for performing thermal analysis and Deniz Şimşek for his
help in particle size analysis. I would also like to express my sincere thanks to my
colleagues, Dane Rusçuklu, Diren Kaçar, Dilek Yalçın, Alihan Karakaya, Ali Bora
Balta, Merve Şahin, İpek Erdoğan and Özge Tuncel for their help and company. I need
to thank my friend Güler Narin for her support. Finally, thanks to my family for their
understanding.

iv
ABSTRACT
SYNTHESIS AND CHARACTERIZATION OF STAR BLOCK COPOLYMER FOR CONTROLLED DRUG DELIVERY
Amphiphilic multiarm block copolymers of hydrophobic poly(methyl
methacrylate) core and hydrophilic poly(acrylic acid) corona has been synthesized,
characterized and proposed for an anticancer drug that is 5 Florouracil (5FU). 3 arm, 4
arm and 6 arm PMMA-b-PtBA (poly(methyl methacrylate-block-poly(tertiary butyl
acrylate)) copolymers with molecular weights from 18 kDa to 80 kDa were synthesized
by Atomic Transfer Radical Polymerization and reacted into PMMA-b-PAA
(poly(methyl methacrylate-block-poly(acrylic acid)) by hydrolysis of tBA chains.
Optimum molecular weight and hydrophobic core ratio was determined by evaluation of
critical micelle concentrations and maximum loading capacities with pyrene. Loading
method was selected among simple equilibrium, solvent deposition, salting out and
dialysis methods. Dialysis method yielded the highest loading contents of model drug
indomethacin. Optimum loading conditions in terms of temperature, duration, pH and
polymer concentration were determined with anticancer drug 5FU. 4 arm PMMA-b-
PAA with molecular weight 18000 Da and hydrophobic core ratio 0.27 was proposed
for controlled delivery of 5FU. Optimum loading conditions were determined as 15°C
in acidic aqueous medium with pH 1.0-1.5 and loading interval as 4 hours. Minimum
polymer concentration was estimated to be 2000 mg/L for an optimum loading. Drug
loaded particles were characterized by FTIR, TGA, DTG and DSC. 5FU loaded
PMMA-b-PAA samples with drug contents about 14-20 % were investigated by a
continuous operation where a diffusion cell was employed to monitor release profiles.
Controlled release of 5FU with zero order release kinetics for 18 days was provided by
4 arm PMMA-b-PAA. Biodegradation of loaded particles were monitored through
particle size analysis by Dynamic Light Scattering and Atomic Force Microscopy.

v
ÖZET
KONTROLLÜ İLAÇ AKTARIMI İÇİN YILDIZ BLOK KOPOLİMER SENTEZİ VE KARAKTERİZE EDİLMESİ
Hidrofobik poli(metil metakrilat) merkez etrafında hidrofilik poli(akrilik asit)
çeperden oluşan amfifilik yıldız blok kopolimerler sentezlendi ve kanser ilacı 5
Florourasil taşıyıcısı olarak kullanılmak üzere karakterize edildi. 18 kDa-80 kDa
molekül ağırlığı aralığında 3-kollu, 4-kollu ve 6-kollu PMMA-b-PtBA (poli(metil
metakrilat)-blok-poli(tersiyer bütil akrilat) kopolimerleri Atomik Transfer Radikal
Polimerizasyon tekniğiyle sentezlendi ve tBA kollar hidroliz reaksiyonuyla akrilik asite
dönüştürüldü. Kritik misel konsantrasyonları ve maksimum piren yüklenme kapasiteleri
değerlendirilerek optimum molekül ağırlığı ve hidrofobik merkez oranı belirlendi.
Model ilaç olarak kullanılan indometazinle yapılan deneylerde en yüksek yükleme
miktarı diyaliz yöntemiyle elde edildi. Diyaliz yöntemiyle optimum yükleme
koşullarının belirlenmesinde model ilaç olarak kanser ilacı 5-florourasil kullanıldı. 18
kDa molekül ağırlığı ve 0.25 hidrofobik merkez oranına sahip 4-kollu PMMA-b-PAA
kopolimerin kontrollü 5FU salımı için optimum yükleme koşulları 15°C’de, 1.0-1.5 pH
aralığında sulu çözelti içinde, yükleme süresi 4 saat ve minimum polimer
konsantrasyonu 2 g/L olmak üzere belirlendi. İlaç yüklü polimer numuneleri FTIR,
TGA, DTG ve DSC ile karakterize edildi. 5FU yüklenme miktarları 14-20% olan
PMMA-b-PAA numuneler difüzyon hücresine yerleştirildi ve salınan ilaç miktarları
UV-spektroskopi yöntemiyle belirlendi. 4-kollu PMMA-b-PAA kopolimeriyle 18 gün
süresince kontrollü salım sağlandı. İlaç yüklü polimerlerin biyolojik parçalanma
özellikleri Dinamik Işık Saçılımı ve Atomik Güç Mikroskopi yöntemleriyle belirlenen
parçacık büyüklükleri bazında incelendi.

vi
TABLE OF CONTENTS
LIST OF FIGURES ....................................................................................................... viii
LIST OF TABLES......................................................................................................... xiv
LIST OF SYMBOLS AND ABBREVIATIONS .......................................................... xvi
CHAPTER 1. INTRODUCTION .................................................................................... 1
CHAPTER 2. LITERATURE REVIEW.......................................................................... 6
2.1. Atomic Transfer Radical Polymerization ............................................... 6
2.2. Biodegradable Polymers Used in Drug Delivery.................................... 9
2.3. Delivery of Anticancer Drugs with Biodegradable Particles ............... 16
CHAPTER 3. THEORY................................................................................................. 21
3.1. Theoretical Models for Drug Release ................................................... 21
3.2. Description of System........................................................................... 24
3.3. Permeation Through Membrane .......................................................... 29
CHAPTER 4. MATERIALS AND METHODS ............................................................ 30
4.1. Materials ............................................................................................... 30
4.2. Synthesis of Initiators ......................................................................... 30
4.3. Synthesis of Macroinitiators ................................................................ 31
4.4. Synthesis of Multiarm PMMA-b-PAA Copolymers .......................... 32
4.5. Characterization .................................................................................... 33
4.6. Maximum Loading Capacity ................................................................ 34
4.7. Critical Micelle Concentration.............................................................. 35
4.8. Drug Loading ....................................................................................... 35
4.9. Drug Release......................................................................................... 37
4.10. Biodegradation ................................................................................... 38

vii
CHAPTER 5. RESULTS AND DISCUSSION.............................................................. 39
5.1. Synthesis of Initiators ........................................................................... 39
5.2. Synthesis of PMMA-b-PAA Polymers................................................ 44
5.3. Maximum Loading Capacity ................................................................ 66
5.4. Critical Micelle Concentration ............................................................. 70
5.5. Drug Loading ....................................................................................... 75
5.5.1 Determination of Optimum Drug Loading Method......................... 75
5.5.2 Determination of Optimum Duration of 5FU Loading.................... 80
5.5.3 Selection of Ideal Medium for 5FU Loading................................... 83
5.5.4 Determination of Optimum Polymer Concentration for Loading.... 84
5.6. Drug Release ........................................................................................ 90
5.7. Biodegradation.................................................................................... 100
CHAPTER 6. CONCLUSIONS ................................................................................... 109
REFERENCES ............................................................................................................. 113
APPENDICES
APPENDIX A. CRITICAL MICELLE CONCENTRATIONS................................... 126
APPENDIX B. DRUG RELEASE DATA.................................................................. 130
APPENDIX C. PARTICLE SIZE ANALYSIS BY ZETASIZER.............................. 135
APPENDIX D. PARTICLE SIZE ANALYSIS BY AFM ........................................... 149

viii
LIST OF FIGURES
Figure PageFigure 1.1. Schematic presentation of divergent and convergent synthesis................ 2
Figure 1.2. Schematic representation of simple AB graft, AnBn, and (AB)n
star-block copolymers............................................................................... 3
Figure 2.1. Schematic presentation of atom transfer radical polymerization
where ka is rate constant of activation, kd is rate constant of
deactivation and Kp is the rate constant of propagation............................ 7
Figure 2.2. Stages in tumor development.................................................................. 17
Figure 3.1. Schematic representation of the diffusion cell where drug
release occurs. ........................................................................................ 25
Figure 4.1. Experimental set up for degassing the reactants prior to ATRP
reaction.................................................................................................... 32
Figure 4.2. Fotographs of experimental setup for ATRP synthesis of star block
copolymers (a) vacuum line for degassing, (b) Freeze-thaw process
and (c) reaction carried in oil-bath.......................................................... 33
Figure 4.3. (a) Flow-through dissolution apparatus used to measure free drug
flux arising from a nanoparticulate suspension held separated from a
dissolution chamber by a semi-permeable membrane (b) Photograph
of diffusion cell used in drug release studies.......................................... 34
Figure 5.1. Schematic presentation of bromination reaction of
1,3,5-trihdiroxybenzene to synthesize 1,3,5-(2-bromo-2-methyl
propionate) benzene................................................................................ 40
Figure 5.2. Schematic presentation of bromination reaction of pentaerythritol
to synthesize pentaerythritol tetrakis (2-bromoisobutyrate). .................. 40
Figure 5.3. Schematic presentation of bromination reaction of di-pentaerythritol
to synthesize di-pentaerythritol hexakis (2-bromoisobutyrate) .............. 40
Figure 5.4. TGA overlay of (a) unreacted 1,3,5-trihydroxybenzene and
(b) 1,3,5- (2- bromo-2-methyl propionate) benzene. .............................. 41
Figure 5.5. TGA overlay of (a) unreacted pentaerythritol and
(b) synthesized pentaerythritol tetrakis (2-bromoisobutyrate)................ 41
Figure 5.6. TGA overlay of (a) unreacted di-pentaerythritol and
(b) synthesized di-pentaerythritol hexakis (2-bromoisobutyrate)........... 42

ix
Figure 5.7. 1H-NMR spectrum of 1,3,5- (2-bromo-2-methyl propionate)
benzene. .................................................................................................. 43
Figure 5.8. 1H-NMR spectrum of pentaerythritol tetrakis (2-bromoisobutyrate). .... 44
Figure 5.9. 1H-NMR spectrum of di-pentaerythritol hexakis (2-bromoisobutyrate). 45
Figure 5.10. ATRP synthesis of 3 arm PMMA from 1,3,5- (2-bromo-2-methyl
propionate)benzene................................................................................. 46
Figure 5.11. ATRP synthesis of 4 arm PMMA from pentaerythritol tetrakis
(2-bromoisobutyrate) .............................................................................. 47
Figure 5.12. ATRP synthesis of 6 arm PMMA from di-pentaerythritol
hexakis (2-bromoisobutyrate). ................................................................ 48
Figure 5.13. H-NMR spectrum of 3 arm PMMA........................................................ 49
Figure 5.14. H-NMR spectrum of 4 arm PMMA........................................................ 50
Figure 5.15. H-NMR spectrum of 6 arm PMMA........................................................ 51
Figure 5.16. GPC profiles of 3 arm PMMA macroinitiator and the 3 arm star
PMMA-b-PtBA copolymer having molecular weights of 5600 Da
and 22000 Da. ......................................................................................... 52
Figure 5.17. GPC profiles of 4 arm PMMA macroinitiator and the 3 arm star
PMMA-b-PtBA copolymer having molecular weights of 4700 Da
and 27000 Da. ......................................................................................... 53
Figure 5.18. GPC profiles of 6 arm PMMA macroinitiator and the 3 arm star
PMMA-b-PtBA copolymer having molecular weights of 8100 Da
and 80000Da. .......................................................................................... 53
Figure 5.19. ATRP synthesis of 3 arm PMMA-b-PtBA from 3 arm PMMA
macroinitiator.......................................................................................... 56
Figure 5.20. ATRP synthesis of 4 arm PMMA-b-PtBA from 4 arm PMMA
macroinitiator.......................................................................................... 57
Figure 5.21. ATRP synthesis of 6 arm PMMA-b-PtBA from 6 arm PMMA
macroinitiator.......................................................................................... 58
Figure 5.22. H-NMR spectrum of 3 arm PMMA-PtBA. ............................................ 59
Figure 5.23. H-NMR spectrum of 4 arm PMMA-PtBA. ............................................ 60
Figure 5.24. H-NMR spectrum of 6 arm PMMA-PtBA ............................................. 61
Figure 5.25. Chemical structure of 4 arm PMMA-b-PAA synthesized by
hydrolysis of 4 arm PMMA-b-PtBA. ..................................................... 62
x
Figure 5.26. (a) 1H-NMR spectrum of 4 arm PMMA-b-PAA (b) 13C-NMR
spectrum of 6 arm PMMA-b-PAA. ........................................................ 63
Figure 5.27. FTIR spectra of (a) 3 arm PMMA-b-PtBA with 5600 Da
PMMA core and total molecular weight of 22000 Da,
(b) 3 arm PMMA-b-PAA produced by hydrolysis. ............................... 64
Figure 5.28. FTIR spectra of (a) 4 arm PMMA-b-PtBA with 7000 Da
PMMA core and total molecular weight of 30000 Da,
(b) 4 arm PMMA-b-PAA produced by hydrolysis. ................................ 64
Figure 5.29. FTIR spectra of (a) 6 arm PMMA-b-PtBA with 8100 Da
PMMA core and total molecular weight of 77000 Da,
(b) 6 arm PMMA-b-PAA produced by hydrolysis. ................................ 65
Figure 5.30. Chemical structure of pyrene. ................................................................. 66
Figure 5.31. Emission spectra of PMMA-b-PAA 4.1 loaded at different
pyrene concentrations designated in different colors. . ......................... 67
Figure 5.32. Variation of emission intensities of 3 arm and 4 arm
PMMA-b-PAA samples loaded at 500 mg/L polymer
concentration with respect to pyrene concentration. .............................. 68
Figure 5.33. Variation of emission intensities of 6 arm PMMA-b-PAA samples
loaded at 500 mg/L polymer concentration with respect to pyrene
concentration........................................................................................... 68
Figure 5.34. Variation of emission intensities of 3 arm and 4 arm
PMMA-b-PAA samples loaded at 200 mg/L polymer
concentration with respect to pyrene concentration. .............................. 69
Figure 5.35. Variation of emission intensities of 6 arm PMMA-b-PAA samples
loaded at 200 mg/L polymer concentration with respect to
pyrene concentration............................................................................... 69
Figure 5.36. Excitation spectra of pyrene loaded 4 arm PMMA-b-PAA samples
(MW: 5000/45000 Da) at polymer concentrations designated
in different colors.................................................................................... 71
Figure 5.37. Determination of CMC from shifts in I336 band in excitation spectra
(n=2)........................................................................................................ 72
Figure 5.38. Determination of CMC from I1/I3 ratios in emmission spectra
(n=2)........................................................................................................ 72

xi
Figure 5.39. I1 and I3 bands at 372 nm and 385 nm on emission spectrum of pyrene
in chloroform (excited at 330 nm). ........................................................ 73
Figure 5.40. UV-Absorbance spectra of pyrene loaded 4 arm PMMA-b-PAA
samples (MW: 5000/45000 Da) at polymer concentrations
designated in different colors.................................................................. 73
Figure 5.41. Determination of CMC from change in UV-absorbance A266
with respect to polymer concentration (n=2).......................................... 74
Figure 5.42. Chemical structure of indomethacin. ...................................................... 75
Figure 5.43. Calibration curve of indomethacin dissolved in dimethyl
formamide. .............................................................................................. 77
Figure 5.44. FTIR spectra of (a) indomethacin, (b) indomethacin loaded
4 arm PMMA-b-PAA.and (c) neat polymer. .......................................... 78
Figure 5.45. DSC thermograms of (a) neat polymer and (b) indomethacin
loaded 4 arm PMMA-b-PAA.................................................................. 78
Figure 5.46. Chemical structure of 5 Fluorouracil or
5 Fluoro-2,4-pyrimidinedione................................................................. 79
Figure 5.47. Calibration curve of 5FU dissolved in PBS (n=3). ................................ 80
Figure 5.48. Variation of DLC versus time of 5FU loading for 6 arm
PMMA-b-PAA (MW:5700/34000 Da) at 25°C and 500 mg/L
polymer concentration. ........................................................................... 82
Figure 5.49. Instantaneous amounts of drug released within 1 hour of dialysis
and total amount of drug released during total interval of dialysis
that was carried to remove excess drug from loaded samples. .............. .82
Figure 5.50. FTIR spectra of 4 arm PMMA-b-PAA (a) unloaded, (b) loaded at
500 mg/L polymer concentration, (c) loaded at 2000 mg/L polymer
concentration, (d) loaded at 3500 mg/L polymer concentration for
4 h. at 15°C and (e) FTIR spectrum of 5FU .......................................... 86
Figure 5.51. DSC thermograms of 4 arm PMMA-b-PAA (a) unloaded, (b) loaded
at 500 mg/L polymer concentration, (c) loaded at 2000 mg/L polymer
concentration, (d) loaded at 3500 mg/L polymer concentration and
(e) of 5FU............................................................................................... 88
Figure 5.52. Comparison of DTG and TGA thermograms of 4 arm PMMA-b-PAA
(MW 4900/18000) loaded at different polymer concentrations
with that of model drug (5FU) spectrum ................................................ 89

xii
Figure 5.53. Drug release profiles of neat polymer (control) and neat drug (blank )
determined from UV-spectroscopy from receptor compartment of
diffusion cell ........................................................................................... 90
Figure 5.54. Release profiles of neat drug passed through membrane of diffusion
cell at different medium temperatures ................................................... 91
Figure 5.55. Effect of mixing in donor and receptor compartments of diffusion cell 92
Figure 5.56. Drug release profiles of 4 arm PMMA-b-PAA loaded at 3500 mg/L
polymer concentration at 15°C, 4 h. (a) Amount of drug released
versus time; (○) series belong to the sample with DLC=13.6%,
PBS flow rate=0.025 ml/min. (●) series belong to DLC=20.6%,
PBS flow rate=0.25 ml/min. Mt amounts were determined from
collected 15 ml portions of downstream................................................. 93
Figure 5.57. Drug release profiles of 4 arm PMMA-b-PAA loaded at 3500 mg/L
polymer concentration at 15°C, 4 h. (a) Released fraction of drug
versus time, (b) Blank experiment of 5FU permeation through
membrane (n=3)...................................................................................... 94
Figure 5.58. Graphical determination of 5FU permeability through membrane
that separates donor and receptor compartments of diffusion cell. ........ 95
Figure 5.59. Experimental and theoretical values of (a) Mt and (b)Mt/M obtained
from model that assumes Cd=ktn=9.78×10⁻⁴ mg/ml, for the drug
release from 4 arm PMMA-b-PAA nanoparticles. ................................. 97
Figure 5.60. Experimental and theoretical values of (a) Mt and (b)Mt/M obtained
from model that assumes Cd=1.35×10⁻³ mg/ml (for the initial interval
where Mt/M<40) and Cd=7.59×10⁻⁴ mg/ml (for the late interval where
Mt/M>40), for the drug release from 4 arm PMMA-b-PAA
nanoparticles ........................................................................................... 99
Figure 5.61. Volume average particle size analysis of 4 arm PMMA-b-PAA
degraded in PBS solution at 37 ºC (n=3). Concentrations of polymer
samples were 2 mg/ml. ........................................................................ 100
Figure 5.62. Variation of particle size with increasing polymer concentration of
4 arm PMMA-b-PAA nanoparticle before degradation ....................... 101
Figure 5.63. Variation of particle size with increasing polymer concentration of
4 arm PMMA-b-PAA nanoparticle degraded for 3 days...................... 102

xiii
Figure 5.64. Variation of particle size with increasing polymer concentration of
4 arm PMMA-b-PAA nanoparticle degraded for 7 days...................... 102
Figure 5.65. Entrapment efficiency of 4 arm PMMA-b-PAA in PBS solution
having polymer concentrations 8,6,4,2,1 mg/ml (from top to bottom),
before degradation ............................................................................... 104
Figure 5.66. Entrapment efficiency of 4 arm PMMA-b-PAA in PBS solution
having polymer concentrations 6,4,2,1 mg/ml (from top to bottom),
after 7 days of degradation ................................................................... 104
Figure 5.67. AFM micrograph of 4 arm PMMA-b-PAA (MW 4900/18000 Da) as
dissolved in aqueous medium at 25 °C................................................. 105
Figure 5.68. AFM micrograph of 4 arm PMMA-b-PAA (MW 4900/18000 Da) as
degraded for 1 hour in aqueous medium at 37 °C ............................... 105
Figure 5.69. AFM micrograph of 4 arm PMMA-b-PAA (MW 4900/18000 Da) as
degraded for 7 days in aqueous medium at 37 °C. ............................... 106
Figure 5.70. AFM micrograph of 4 arm PMMA-b-PAA (MW 4900/18000 Da) as
degraded for 10 days in aqueous medium at 37 °C ............................. 106
Figure 5.71. Particle analysis of 4 arm PMMA-b-PAA (MW 4900/18000 Da) as
Degraded for 10 days in aqueous medium at 37 °C ............................. 107

xiv
LIST OF TABLES
Table PageTable 2.1. Literature survey for drug loading performances of various
biocompatible homopolymers or block copolymers.............................. 12
Table 2.2 Drug Loading Contents (DLC) and Drug Loading Efficiencies (DLE)
of several biomaterials loaded with anti-cancer drug 5-FU. .................. 19
Table 5.1. Conversions of bromination reactions of starting materials to
synthesize initiator molecules with 3, 4 and 6 brominated
active sites............................................................................................... 39
Table 5.2. Reaction conditions and conversions of PMMA-b-PAA synthesis
by 2 stage ATRP polymerization and hydrolysis reactions. ................... 54
Table 5.3. Specific FTIR peaks related to PMMA-b-PtBA copolymers. ................ 65
Table 5.4. List of polymers compared for maximum loading capacity ................... 66
Table 5.5. Maximum loading capacities of 3 arm, 4 arm and 6 arm
PMMA-b-PAA samples loaded at different polymer
concentrations ......................................................................................... 70
Table 5.6. Critical micelle concentrations of 3 arm, 4 arm and 6 arm
PMMA-b-PAA samples having various molecular weight
and hydrophobic core ratios.................................................................... 74
Table 5.7. Reaction conditions and conversions of synthesis and
hydrolysis reactions of 4 arm PMMA-b-PAA (7000/30000). ................ 76
Table 5.8. Drug loading performances of dialysis, salting out and solvent
deposition methods. ................................................................................ 77
Table 5.9. Drug Loading Content (DLC, %) with changing loading time for 5FU
loaded 6 arm PMMA-b-PAA (MW:5700/34000 Da) at 25°C and
500 mg/L polymer concentration. Loading medium is distilled water... 81
Table 5.10. Loading performance of 6 arm PMMA-b-PAA
(MW: 5700/34000) at various loading conditions. ................................. 83
Table 5.11. Reaction conditions and conversions of synthesis and hydrolysis
reactions of 4 arm PMMA-b-PAA (MW 4900/18000).............. .............85
Table 5.12. Effect of polymer concentration on drug loading performed at 15 °C,
4 hours.....................................................................................................85

xv
Table 5.13. Ratio of asymmetric(A1570)/symmetric(A1460) bonds of C=O of
carboxyl grops of acrylic acid chains due to loading conditions of
4 arm PMMA-b-PAA (MW:4900/18000)...............................................87
Table 5.14. Endothermic peaks observed on DSC thermograms of the model
drug, unloaded and 5-FU loaded polymer samples at 15°C for
4 hours in aqueous medium.....................................................................87
Table 5.15. Particle size analysis of 4 arm PMMA-b-PAA (MW: 18000,
fc:0.27) ..................................................................................................107
Table 6.1. Constants of release kinetics equation from 5FU loaded
PMMA-b-PAA nanoparticles................................................................112

xvi
LIST OF SYMBOLS AND ABBREVIATIONS
A Area of diffusion (cm2)
Cd Concentration of drug in donor compartment (mg/ml)
Co Original drug concentration in formulation (mg/ml)
Cr Concentration of drug in receptor compartment (mg/ml)
D Diffusivity (cm2/min)
F Flowrate (ml/min)
fc Hydrophobic core ratio
J Mass flux
η Viscosity (cP)
k Constant of release kinetics
kB Boltzmann constant
K Partition coefficient
KATRP Rate constant of atomic transfer radical polymerization reaction
Ka Rate constant of activation
Kd Rate constant of deactivation
Kp Rate constant of propagation
κ Constant (=AP/Vr)
M Amount of drug released at infinity (mg)
Mt Amount of drug released at time t (mg)
MW Molecular weight (Da)
n Degree of power law release kinetics
np Number of moles of product
nr Number of moles of reactant
P Permeability (cm/min)
q Amount of substance transferred (mg)
rh Hydrodynamic radius (nm)
rp Radius of spherical particle
Rp Rate of polymerization reaction
T Temperature (°C)
t Time (min)
Vr Receptor volume (ml)

xvii
wp Weight of product (g)
wr Weight of reactant (g)
x Distance
AA Acetic Acid
AFM Atomic Force Microscopy
ATRP Atomic Transfer Radical Polymerization
CMC Critical Micelle Concentration
diPENTA Dipentaerythritol
DLC Drug Loading Content (or Drug Loading Capacity)
DLE Drug Loading Efficiency
DLS Dynamic Light Scattering
DMAP Dimethylaminopyridine
DMF Dimethylformamide
DMSO Dimethylsulfoxide
DSC Differential Scanning Calorimetry
DTG Differential Thermal Gravimetry
FTIR Fourier Transform Infrared Spectroscopy
GPC Gel Permeation Chromatography
MMA Methyl Methacrylate
MPEG Methoxy Poly(Ethylene Glycol)
MWCO Molecular Weight Cut-Off
NMR Nuclear Magnetic Resonance
OEG Oligo Ethylene Glycol
OSM Oligo Sulfamethazine
PAA Poly(Acrylic Acid)
PAMAM Polyamidoamine
PBS Phosphate Buffer Solution
PCL Poly(1-Caprolactone)
PDMAEMA Poly(2-(N,N-Dimethylamino)Ethyl Methacrylate)
PDLLA Poly(D,L-Lactide)
PEG Poly(Ethylene Glycol)
PENTA Pentaerythritol
PEO Poly(Ethylene Oxide)

xviii
PHPMA Poly(N-(2-Hydroxypropyl)Methacrylamide)
PI Polydispersity Index
PLA Poly(Lactic Acid)
PLGA Poly(Lactic-co-Glycolic Acid)
PLLA Poly(L-Lactide)
PMDETA N,N,N’,N”,N”-Pentamethyl Diethylenetriamine
PMMA Poly(Methyl Methacrylate)
PNIPAAm poly(N-Isopropylacrylamide)
PTMC Poly(Thrimethylene Carbonate)
PVP Poly(Vinyl Pyrolidone)
PtBA Poly(tert- Butyl Acrylate)
SANS Small Angle Neutron Scattering
SAXS Small Angle X-Ray Scattering
tBA tert- Butyl Acrylate
TEA Triethylamine
TFA Trifluoro acetic acid
TGA Thermal Gravimetric Analysis
THB 1,3,5-Trihydroxibenzene
THF Tetrahydrofuran

1
CHAPTER 1
INTRODUCTION
Water soluble amphiphilic polymer particles are good candidates for drug
delivery with their thermodynamic and kinetic stabilities, high drug loading capacities
and low critical micelle concentrations. Their structures with hydrophobic cores and
hydrophilic coronas provide beneficial properties such as elimination of additional
surfactants in drug formulations, protection of drug from premature degradation and
opportunities for controlled and targeted delivery (Leroux and Ranger, 2002; Nishiyama
and Kataoka, 2006).
One of the best candidates for delivery of hydrophobic drugs is star polymers
which are branched polymer chains around a multifunctional core. The number of the
active sites of the core molecule of a unimolecular polymeric carrier determines the
number of arms. They may be classified as dendrimers, symmetrical star block
copolymers and miktoarm block copolymers where each arm is another type of
polymer chain (Deng et al., 2007; Tunca et al., 2002). Synthesis of miktoarm star
polymers requires sophisticated initiators whose active sites show different reactivities
with different monomer species.
Dendrimers are the most famous star shaped polymers introduced by Tomalia’s
and Freche’s studies in 1980’s. Polyamidoamine (PAMAM) is the most widely studied
dendrimer for biomedical applications and is reported to be stable, biodegradable and
nontoxic under certain conditions (Svenson and Tomalia, 2005; Patri et al., 2005;
Tomalia et al., 2006). Dendritic structures including all star shaped polymers can be
synthesized by two techniques as shown in Figure 1.1. These may be explained as
achieving the synthesis around a core and repeating the procedure for addition of
branches several times (divergent method) or, simply producing the branched chains
and attaching them around an initiator which has various active sites (convergent
method).
PAMAM is produced by divergent synthesis while dentritic structures of block
copolymers of polyethyleneoxide (PEO), mostly studied by Fréchet and coworkers
(Tomalia and Fréchet, 2005; Grayson and Fréchet, 2001, Gillies and Fréchet, 2004), are

2
synthesized by convergent methods. But the synthesis of dendrimers are hard to control
in either cases and the reaction yields are low. Hence star block copolymers constitute a
good alternative with the possibility of using controlled polymerization techniques.
Figure 1.1. Schematic presentation of divergent and convergent synthesis (Source: Tomalia et al., 2006).
Star block copolymers are the most versatile type of dendritic structures with the
numerous possibilities of synthesis, modifications and applications. They can be sorted
according to number of arms and distribution of polymers that constitutes the star
shaped polymer as summarized in Figure 1.2 (Haddleton et al., 1997; Ganguly, 2002;
Kilian, 2004; Yin et al., 2005; Chu et al., 2004; Ishizu and Uchida, 1999). Amphiphilic
structure is often produced by block copolymers constituting hydrophilic and
hydrophobic polymer blocks in numerous shapes, built by both convergent and
divergent techniques Such block copolymers have recently drawn significant attention
with their perfect solubilizing properties (Kilian, 2004). Their potential in drug delivery
area has also been widely studied, especially in gene delivery, and delivery of
chemotherapeutic agents (Gaucher et al., 2005; Kakizawa and Kataoka, 2002).
Divergent Growth
Convergent Growth

3
Figure 1.2. Schematic representation of simple AB graft, AnBn, and (AB)n star-block
copolymers. (Source: Ishuzu and Uchida, 1999)
Star block copolymers form polymeric micelles where interior spaces of
polymeric structure constitute a reservoir for the drug. Hydrophobic cores and
hydrophilic coronas are particularly favoured to solubilize hydrophobic drugs. The
substance can be stocked in the particles by hydrophobic-hydrophobic interactions,
diffusion or conjugation (Marion et al., 1999; Chytil et al., 2006). Star block copolymers
have also been proposed as good candidates for smart drug delivery systems like pH
sensitive, thermosensitive or targeted drug delivery. Generally polyethylene glycols,
polylactides and block copolymers of poly ethylene oxides have been used for drug
delivery studies for they are approved biodegradable and biocompatible polymers.
Polystyrene has also been widely investigated for core-and-shell type unimolecular
polymer structures. In the last decade, acrylic block copolymers have gained attention
for their extremely low critical micelle concentrations, amphiphilic properties and
relative ease of controlled polymerization techniques.
ATRP (Atom Transfer Radical Polymerization) is a beneficial controlled
polymerization technique for it allows shorter reaction times at high reaction
temperatures and yields acceptable polydispersities (Krishnan and Srinivasan, 2004).
Block copolymers synthesized by controlled polymerization techniques can be designed
as linear, branched or star shaped unimolecular structures. The linear block copolymers
may act as surfactants in aqueous media and produce polymeric micelles with low
Simple AB Graft Copolymer A2B2 Star-Block Copolymer (AB)4 Star-Block Copolymer

4
critical micelle concentrations (Gaucher et al., 2005). The critical micelle concentrations
of star block copolymers are even lower. Block copolymer systems, linear or star
shaped, have been widely studied for their loading capacities with various hydrophobic
drugs and have shown versatile characteristics in terms of drug loading, drug release
performance, critical micelle concentrations and cytotoxicity. Each parameter has been
claimed to depend on molecular weight, arm length, composition and concentration of
the polymer, drug type, dosage and preparation method. Therefore, polymer architecture
is quite important when the material is to be used as a drug carrier for controlled
delivery. Whether they are used for oral, intravenous or transdermal drug delivery, drug
loading capacity, release kinetics, particle stability and compatibility are all related with
polymer architecture as well as molecular weight and type of polymer (Qiu and Bae,
2006).
Controlled and sustained delivery profiles are not only desired to provide
constant plasma levels of the drug after administration. With polymeric particles that are
capable of sustained and/or controlled drug delivery, enhanced permeability and
retention characteristics of cancerous tumors can be expected to serve for the wellbeing
of the patient. This expectancy can be explained by increased drug levels in tumors by
passive diffusion. Polymeric micelles have been reported to show prolonged circulation
times after intravenous administration and minimum accumulation in liver. Besides
drug distribution is reported to be higher in tumors due to perivascular accumulation of
macromolecules in tumor tissues with reduced drug levels in general (Sahoo and
Labhasetwar, 2003).
Especially for amphiphilic systems, properties of the core material such as
hydrophobicity and size of the core are known to be important parameters that
determine the performance of polymer in specific applications. It has been reported that
hydrophobic core block-length determines stability and loading performance as well as
release kinetics. Drug loading performance of the polymer synthesized is expected to
increase with increasing molecular weight of hydrophobic core. On the other hand, high
molecular weight PMMA cores were not desired for they don’t produce biodegradable
polymeric materials. Therefore an ideal polymeric micelle for drug delivery purposes
must comprise a PMMA core at a molecular weight of oligomer level where PMMA
core has to have 10-100 repeating units (Allen et al., 1999) and the resulting polymer
should not be greater than 50000 Da in molecular weight (Bontha et al., 2006;
Nishiyama and Kataoka, 2006).

5
In our study main purpose is to synthesize biocompatible and biodegradable
amphiphilic nanoparticles that can be effectively loaded by an anticancer drug and tend
to accumulate in solid tumors by avoiding reticuloendothelial system. For this reason
polymeric micelles with particles sizes less than 100 nm, made of hydrophobic PMMA
core and hydrophilic PAA shell have been synthesized and characterized. Considering
all the approaches and requirements summarized above, an ideal carrier was tried to be
selected among various star block copolymers (# arm PMMA-b-PAA) with different
number of arms, molecular weights and hydrophobic core ratios. The star block
copolymers PMMA-b-PAA were synthesized by atomic transfer radical polymerization
(ATRP) technique through a two-stage reaction and hydrolysis. The polymers
synthesized were investigated in terms of their critical micelle concentrations,
maximum loading capacities and drug loading efficiencies. 4 arm PMMA-b-PAA with
molecular weight about 20 kDa and hydrophobic core ratio of 0.25 is proposed as an
ideal drug carrier for parenteral administration and controlled delivery of a widely used
anticancer drug, 5 Fluorouracyl.

6
CHAPTER 2
LITERATURE REVIEW
2.1. Atomic Transfer Radical Polymerization
Star polymers have drawn attention as one of the most promising materials for
biomedical applications. They can be tailored for specific purposes providing many
opportunities in synthesis (selection of initiators, monomers, catalysts, reaction media,
etc.) through the use of controlled polymerization techniques.
The controlled polymerization methods used for the synthesis of block
copolymers from vinyl monomers can be listed as ROP (Ring Opening Polymerization),
SFRP (Stable Free Radical Polymerization) and ATRP (Atomic Transfer Radical
Polymerization) can be employed in various combinations (Tunca et al., 2002; Celik et
al., 2003; Erdoğan et al., 2004) ATRP is a beneficial controlled polymerization
technique for it allows shorter reaction times at high reaction temperatures and yields
acceptable polydispersities (Krishnan and Srinivasan, 2004; Brar and Saini, 2007).
Since the initiation is fast and termination is negligible for controlled polymerization
techniques, ratio of dead chains are as small as 10% compared to conventional radical
polymerization. Another important advantage is possibility of elimination of catalysts
used in controlled polymerization while initiator residues inevitably remain in final
polymer in radical polymerization (Braunecker and Matyjaszewski, 2007).
Major advantage of ATRP among radical polymerization techniques is
availability of reagents which are procurable commercial chemicals such as alkyl
halides, transition metals and various ligands. Another important advantage ATRP
provides is the precise control over polymerization reaction. Zhao claims that ATRP
reaction has almost linear kinetics which paves the way for high reaction yields (Zhao et
al, 2001). Polymerization rate mainly depends on initiator concentration and ratio of
activator to deactivator concentration as in Equation 2.1.

7
[ ] [ ][ ] [ ] [ ] ⎟⎟⎠
⎞⎜⎜⎝
⎛==−= ++
+
)1(• nm
nm
ATRPppp MetLMetL
RXKMKRMKdtMdR (2.1)
Rp is the rate of polymerization, Kp is the propagation constant, [M] is the
monomer concentration, and [R·] is the concentrtation of organic radicals generated
from alkyl halide initiator (RX). KATRP is the ratio of activation constant to deactivation
constant (=Ka/Kd). LmMet+n is a transition metal complex that cleaves the alkyl halogen
bond of RX and genertes the organic radical species besides the metal halide complex
having a higher oxidation state notated as LmMet+(n+1)X. The organic radicals (R·) may
either propogate or terminate after they are generated but termination at this stage is
generally negligible for ATRP reactions (Braunecker and Matyjaszewski, 2007)..
Figure 2.1 Schematic presentation of atom transfer radical polymerization where Ka is
rate constant of activation, Kd is rate constant of deactivation and Kp is the rate constant of propagation (Source: Ibrahim, 2006).
Both kinetics and yield of ATRP reactions can be controlled by two major
factors; considerably high rate of initiation and persistent radical effect which means
continuous activity of catalyst through reaction. For a successful ATRP reaction,
termination of the living polymers must be kept at a minimum level. Termination occurs
as an undesired reaction between the radical species (RMn·) which appear as active
species in Figure 2.1. The number of radical species is kept low as the reaction
equilibrium favors the deactivated (dormant species) side and at low concentration of

8
radical species a minimum termination occurs. Hence, the kinetic behavior of the
reaction mechanism is vitally important to produce a polymer with controlled molecular
weight and polydispersity. A fast initiation and rapid reversible deactivation is
necessary for uniform growth of polymer chains and narrow molecular weight
distributions. An equilibrium between propagating radicals (or active species) and
dormant species can be provided by selection of appropriate catalyst and ligand that
minimizes termination. Therefore it is a critical issue to create an efficient ligand and
catalyst system for a specific polymer. (Coessens et al., 2001; Ibrahim, 2006)
ATRP of vinyl monomers require three components: an organo-halide type
initiator, a catalyst which is salt of a transition metal in lower oxidation state and a
ligand which is generally an amine compound. ATRP reactions can be mediated by
various metals such as Ti (Group 4), Mo (Group 6), Re (Group 7), Fe, Ru, Os (Group
8), Rh, Co (Group 9), Ni, Pd (Group 10) and Cu (Group 11) which is the most efficient.
Generally used ligands are nitrogen based compounds which can be listed as bidentate
bipyridine, pyridine imine, tridentate diethylenetriamine, tetradentate tris[2-aminoethyl]
amine, tetraazacyclotetradecane, etc. (Malinowska et al., 2005; Braunecker and
Matyjaszewski, 2007). The homogeneity and distribution of reactants is another
important issue and can be acquired by the ligand. 2,2 bipyridine derivatives or linear
amines are used as ligands to increase the solubility of the catalyst and accelerate
copper mediated ATRP reactions. PMDETA (N,N,N’,N”,N”-pentamethyl
diethylenetriamine) as a ligand was also reported to prove the living character of the
polymerization and as the most suitable ligand for ATRP of all functional acrylates and
methacrylates. Type of solvent used as reaction media is effective on solubility of the
catalyst (Yin et al., 2005; Ibrahim, 2006).
ATRP reaction can be used for the both convergent and divergent synthesis of
star block copolymers. Several molecules with various numbers of active sites can be
used to initiate reaction. AB and ABC types of block copolymers of a group of
monomers involving styrene, vinyl pyridine, acrylates and methacrylates can be
produced by ATRP reactions starting from bromo-macromolecules. (Sun et al., 2005)
Active sites generally constitute brominated or chlorinated endgroups. Phenolic
ester based initiators or tetra-, hexa-, octa- functional initiators based on calyx[n]arene
cores have been proposed for activation in order to be used in ATRP reactions.
Multisulfonyl chlorides and brominated D-glucose molecules have also been offered.
Chlorinated siloxane, brominated phosphazene molecules may well provide multiarm

9
initiators for ATRP. Finally, multifunctional initiators brominated by bromoisobutyryl
bromide have successfully been used as initiators for ATRP yielding low
polydispersities. Divinyl benzene is the most widely used initiator in convergent
approach where polymerized arms are connected to each other to form a unimolecular
starlike molecule by a difunctional linker which constitutes the very center of the
molecule.
ATRP is a robust technique for functional methacrylates. Acrylic acid is an
exceptional acrylic monomer that is not easily polymerized by ATRP, because carboxyl
groups of acrylic acid interacts with the catalyst. Use of a precursor like tertiary butyl
acrylate is preferred for synthesis of poly(acrylic acid). In that case PtBA is synthesized
through ATRP, at 60-90°C by using CuBr as catalyst in the presence of a ligand which
may be PMDETA or a specific bipyridine. About 25(v)% solvent would better be added
to help dissociation of catalyst. PtBA can then be reacted to poly(acrylic acid)
(Coessens et al., 2001).
2.2. Biodegradable Polymers Used for Drug Delivery
Smart drug carriers are one of the most attractive research subjects of our era
since medicine and medical technologies has been developing so fast parallel to
increasing demand of quality in healthcare. One of the most problematic therapies are
protein administration and cancer chemotherapy which require controlled doses
intravenously applied. Most neoplastic anticancer drugs are hydrophobic and require
use of a dissolving agent such as surfactants or specific buffer compositions to be
applied.
Especially in chemotherapy, the greatest problems may be counted as short half-
life of chemotherapeutic agent, side effects and toxicity besides drug resistance
(Manocha and Margaritis, 2008). Because of those problems cancer therapy requires
high doses which increases undesired side effects tremendously. Hence, development of
controlled drug delivery systems have been a challenge for several decades.
Unfortunately an optimized drug delivery system has not been settled yet and so many
researches with biodegradable, biocompatible materials such as chitosan, poly(ethylene
glycol), poly lactides, polyamidoamine and poly(ethyleneoxide) dendrimers has been
going on. In order to obtain an enhanced solubility and controlled delivery of the drug,

10
commercial liposomes are coupled with anticancer drugs but their use is not a
responsive solution due to their poor stability and possible toxicity over critical doses
(Qui and Bae, 2006).
Polymeric nanoparticles and especially block copolymers are proposed for their
low critical micelle concentrations. A low CMC provides a better stability and
solubilization of hydrophobic drugs in aqueous media with very low polymer
concentrations when compared to liposomes and conventional surfactants (Rösler et al.,
2001; Allen et al., 1999; Tao and Uhrich, 2006; Jones et al., 2008). Theoretical studies
on micelle formation of block copolymers focus on CMC since it indicates a measure
on aggregation number or number of chains that form a micelle structure. Conventional
characterization of block copolymer micelles are known as X-ray scattering, neutron
scattering and light scattering techniques. Structure of polymeric micelles can be
determined by SAXS (small angle x-ray scattering) of SANS (small angle neutron
scattering). Turbidity can be employed for polymers with high molecular weights.
Sedimentation and viscometric studies can also be useful for caharacterization of
micelle forming polymeric structures. (Gast, 1997)
Micelle formation performance of polymeric micelles are generally estimated by
combination of light scattering and determination of CMC by fluorescence
spectroscopy. TEM might be used to confirm structures of micelles in addition to those
two techniques. Dynamic Light Scattering (DLS) is a very common method to
determine hydrodynamic radius of small particles. DLS correlates intensity fluctuations
with the scattered light and z-average diffusion coefficient of the scatterers and
calculates hydrodynamic from Stokes-Einstein equation given as Equation 2.2. (Candau
and Otterwill, 1998).
DTkr B
h πη6= (2.2)
where kB is Boltzmann constant, T is temperature, η is solvent viscosity and D is z-
average diffusion coefficient.
Fluorescence methods can be used to determine loading capacities besides CMC
or CAC by using a fluorophore instead of drug (Zhang et al., 2007). The major problem
that emerges with polymeric micelles is optimization of loading conditions to maximize

11
drug loading efficiencies, because although polymeric micelles have been reported to
have very high loading capacities (Leroux and Ranger, 2002) block copolymers of
biodegradable polymers generally exhibit low drug loading performances.
Loading a polymeric nanoparticle with a chemically active drug can be possible
by both chemical conjugation and physical adsorption/absorption. Physical adsorption
has advantages over conjugation for the sake of simplicity of release mechanism, and
less sensitivity to changing medium conditions. In this case loading is provided by drug-
hydrophobic core interaction which also determines the release characteristics based on
diffusion. Both loading and release performances are affected by solvent used as
medium, concentration and duration of operation (Qui and Bae, 2006).
As the criteria for evaluating performance of a polymeric drug carrier, properties
such as critical micelle concentration, maximum loading capacity, stability and
biodegradability has to be considered besides drug release characteristics of the
material. The method of loading has been a critical issue which affects all these
properties of the loaded particles. According to that, the efficiency is directly dependent
on the physical and chemical structure of the polymeric carrier, the drug or selected
medium for loading. Several loading methods can be listed as simple equilibrium, co-
precipitation, dialysis, solvent deposition and salting-out methods (Gaucher et al., 2005;
Lukyanov and Torchilin, 2004; Allen et al., 1999).
Direct solution or simple equilibrium method is recommended for highly soluble
amphiphilic copolymers. For acrylic star block copolymers, neutralization and heating
treatment may be necessary for solubilizing the polymer in aqueous medium (Burguiere
et al., 2003). Hardly soluble block copolymers can be micellized by dialysis method by
use of a water miscible solvent or oil in water emulsion (solvent deposition) methods.
But these methods require a very careful selection of the solvent for it significantly
affects the yield of drug loading. Table 2.1 summarizes studies on drug loading
performances of several biodegradable homopolymers and block copolymers,
comparing drug loading capacities (as % drug contents) according to loading methods
employed. Drug loading capacities are generally expressed in terms of drug loading
contents (% DLC) and drug loading efficiencies (% DLE) whose definitions are given
in Equations 2.3 and 2.4. mdrug the is amount of drug loaded by carrier particle and
mparticle is the total weight of drug loaded particle in Equation 2.3. In Equation 2.4,
(mdrug)actual is amount of drug that was actually loaded and (mdrug)theoretical is the amount
of drug initially introduced to be loaded by the drug carrier.

12
Table 2.1. Literature survey for drug loading performances of various biocompatible homopolymers or block copolymers.
Polymer (MW) Drug Loading Method DLC % Reference
PEG dendrimers (>3500) Indomethacin Coprecipitation 11
Liu et al., 2000
PCL-PHPMA (25000-35000) Indomethacin Dialysis 5-12
Lele and Leroux 2002
PEG (5000, 17000)
Indomethacin Ketoprofen Piroxicam
Coprecipitation 0.7 0.4 1.7
Djordjevic et al., 2003
PLA-PEG (6000-60000)
5-FU Paclitaxel Dialysis 0.1-2.7
Jie et al., 2005
PEG-b-PTMC (20000-70000) Dexamethasone Single Emulsion
Salting Out 2-14 12-16
Zhang et al., 2006
PLA/PLGA (16000, 100000, 200000)
Doclataxel Solvent deposition method <1
Musumeci et al., 2006
PCL-PEO (10000-30000) at-Retionic acid Coprecipitation in
water 0.2-0.9 Quaglia et al., 2006
PHPMA (15000-35000) Doxorubicin Conjugation 4-7
Chytil et al., 2006
PEG-PDLLA-OSM (3000-4000)
Paclitaxel Solid dispersion pH induced micellization
6.4 7.6
Shim et al., 2006
PEO-b-PMA (25000) Cysplatin
Single Emulsion (incubation at 37ºC)
22 Bontha et al., 2006
PLLA-b-PDMAEMA (20000-200000)
Chlorambucil Film casting 5 Yuan et al., 2007
PNIPAAm-PMMA (80000)
Prednison acetate Dialysis 11
Wei et al., 2007
MPEG-PCL (18600-30500) Docetaxel Nanoprecipitation 19.4
Zheng et al., 2009
100% ×=particle
drug
mm
DLC (2.3)
( )( ) 100% ×=
ltheoreticadrug
actualdrug
mm
DLE (2.4)

13
The drugs used as model drugs are anticancer and anti-inflammatory drugs with
hydrophobic character which require aid to be dissolved in aqueous media for
administration. A suitable carrier is expected to have a good solubilizing performance
for administration as well as keeping plasma levels of drug after administration.
Therefore designing smart biodegradable polymeric particles with high loading
capacities and good stabilities for controlled delivery of specific drugs is a huge
research area where so many approaches are proposed but very few materials could
have been commercialized to be used for drug delivery.
Water soluble amphiphilic polymer particles with hydrophobic cores and
hydrophilic branches allow solubilization of hydrophobic drugs in aqueous media with
no addition of other chemicals such as surfactants. A number of biodegradable,
biocompatible polymeric micelles with sustained delivery characteristics have been
proposed for both parenteral and transdermal delivery of various drugs, especially the
ones that cannot be administered by oral route. Dendritic materials like PAMAM
(polyamidoamine) dendrimers (Svenson and Tomalia, 2005; Cheng and Xu, 2008;
Asthana et al., 2005; Aulenta et al., 2003) and commercial Eudragit suspensions
(methyl methacrylate and methyl methacrylic acid copolymers) (Castelli et al., 2003;
Eerikäinen et al., 2004) have been studied in terms of encapsulation and controlled
release performance of anti-inflammatory drugs. Polycaprolactam, poly lactic acid,
polyvinyl pyrolidone and polyethylene glycol have been the most famous biodegradable
polymers proposed for drug delivery (Breitenbach et al., 2000; Kang and Leroux, 2004;
Yang et al., 2007; Bartolozzi et al., 2007). But biodegradable polylactide nanospheres
were generally reported to indicate relatively low loading capacities (less than 5w%)
(Klose et al., 2008; Kang et al.,2008; Castelli et al., 1997) and a burst effect due to
relatively high loading of drug (Musumeci et al., 2006). Star shaped PEG micelles
which were commonly loaded by co-precipitation method also yielded low loading
capacities with anti-inflammatory drugs (Djordevic et al., 2003).
Frechet proposes pH sensitive poly ethylene oxide block copolymers as drug
carriers for cancer therapy because tumors have slightly more acidic media compared
to normal metabolism (Gillies and Frechet, 2004). Diblock copolymers of t-butyl
methacrylate and 2-(diethylamino)ethyl methacrylate were also reported to show pH
sensitivity (Mao et al., 2005). Doxorubicin loaded poly(ethylene oxide):poly(b-benzyl
L-aspartate) micelles were reported to have thermosensitivity properties, besides small
diameters and a low critical micelle concentrations (Marion et al., 1999).

14
Nondegradable N-(2-Hydroxypropyl)methacrylamide copolymers and biodegradable
poly(ethyleneglycol) multiblock copolymers were designed as water-soluble carriers of
anticancer drug doxorubicin and the drug release of the conjugates was observed to be
faster under mildly acidic conditions (Chytil et al., 2006; Ulbrich et al., 2003). Some
commercial polymeric micelles (Pluronic and polyethylene glycol–
distearoylphosphatidyl ethanolamine) were tried for the solubilization of several poorly
water-soluble anticancer drugs and it was reported that, polymeric micelles were highly
stable up to particle size of 100 nm and the loading capacities changed according to
polymer and drug type (Sezgin et al., 2006).
Poly (trimethylene carbonate)–poly(ethylene glycol)–poly(trimethylene
carbonate) nanoparticles were studied for the controlled release of methotrexate (a,
hydrophobic, anticancer drug) but the loading capacities were relatively low (Zhang and
Zhuo, 2005a).
Nanospheres prepared by solvent displacement method using polylactic acids
(PLA) at different molecular weight and polylactic-co-glycolic acid (PLGA) were
studied for their drug loading and drug release performances with the drug doclataxel.
Poly(d,l-lactide-co-glycolide) was studied for a controlled release of another anti-cancer
drug, paclitaxel (Kang et al., 2004). The biodegradable nanospheres also showed
relatively low loading capacity, and a burst effect prior to sustained release profiles
(Musumeci et al., 2006).
Effect of crosslinking was investigated on block ionomer complexes of poly
(ethylene oxide)-b-poly(methacrylic acid) copolymers which constituted hydrophilic
nanospheres of core-shell morphology. It was reported that crosslinked
polymethacrylate cores exhibited pH dependent swelling behavior and cisplatin, a
potent chemotherapeutic agent, was incorporated into the ionic core of the micelles with
remarkably high efficiency (22% w/w). The drug-loaded micelles were stable in
aqueous dispersions exhibiting no aggregation or precipitation for a prolonged period of
time. Slow release of platinum complexes was observed in sustained manner from the
cisplatin-loaded cross-linked micelles (Bontha et al., 2006). An overview of the studies
suggest that loading capacities of block copolymers with acrylic blocks are much higher
than conventional biodegradable polymers. PEG carriers grafted or copolymerized with
block or branched polymers involving phenolic or acrylic groups exhibited improved
loading and solubilizing capacities exceeding 10w% (Sant et al., 2005; Liu et al., 2000).
PCL (Lele and Leroux, 2002; SanMiguel et al., 2008), PVP (Sairam et al., 2007), and

15
PEO (Bontha et al., 2006) polymers showed superior drug loading performances when
compared to other polymeric carriers when copolymerized with acrylic polymers.
The selection of acrylic star block copolymers as anticancer drug carriers also
depend on their reported advantages over many of other biomaterials. They have
extremely low critical micelle concentrations, can be designed and synthesized in a
controlled manner with low polydispersities and can be modified for specific purposes.
Poly (methyl methacrylate)-block poly(t-butyl acrylate) copolymers yield stable
amphiphilic polymeric nanoparticles with very high stability in aqueous media. Their
ease of precisely controlled molecular weights, number of arms and hydrophobic core
ratios is an opportunity for optimization of those for physical drug loading for a specific
drug. It has been reported that hydrophobic core block-length determines stability and
loading performance as well as release kinetics. Hence, drug loading performance is
expected to increase with increasing molecular weight of hydrophobic core. On the
other hand, high molecular weight PMMA cores were not desired for the difficulty of
biodegradation as molecular weight increases. Hence an ideal polymeric micelle for
drug delivery purposes must consist of a PMMA core at a molecular weight of oligomer
level where PMMA core has to have maximum 10-100 repeating units (Allen et al.
1999) and the resulting polymer should not be greater than 50000 Da in molecular
weight (Nishiyama and Katakoa 2006, Bontha et al. 2006). An ideal drug carrier should
have a size less than 200 nm (preferably 10-100 nm) and should remain in bloodstream
for long time for a successful biodistribution. But it should not accumulate within the
liver, kidneys or lungs. This accumulation phenomenon called as “glomerular
excretion” can be avoided by water-soluble polymeric carriers (with 42-50 kDa
molecular weights) despite their elongated durations in blood circulation system. On the
contrary, they tend to accumulate in tumors (Nishiyama and Kataoka, 2006).
Poly methyl methacrylate is known as a non-degradable biocompatible polymer
widely used as joints for bone repairing and in dental applications. It has also been
reported as a drug release agent and has been listed among biocompatible core materials
to form amphiphilic block copolymers to serve as drug carriers (Brannon-Peppas, 1997;
Ning et al., 2002). Poly methyl methacrylate grafted chitosan particles were reported to
be nontoxic and blood-compatible (Radhakumary et al., 2005). A four arm star
copolymer of poly acrylic acid arms with pentaerythritol core was investigated as a
dental filler and was found that cytotoxicity depended on molecular weight and dose
(Xie et al., 2006).

16
Poly (acrylic acid) is the most suitable and common hydrophilic acrylic polymer
used in medicine and food chemistry. PtBA completely hydrolyses to produce poly
acrylic acid which is an approved food and drug ingredient and a conventional
controlled drug delivery agent (Burguiere et al., 2003; Brannon Peppas, 1997).
Polymeric micelle produced from a PMMA core and PAA shell synthesized by
hydrolysis of PMMA-b-PtBA has been reported to have acceptable solubilizing
performance of silver particles (Ishizu et al., 2005). In fact, many studies are available
on synthesis and characterization of acrylic block copolymers by controlled
polymerization techniques but studies that focus on solubilization performance are
rather few (Narrainen et al., 2002; Even et al., 2003; Limer et al., 2006).
2.3. Delivery of Anticancer Drugs with Biodegradable Particles
Cancer as one of the major issues in medicine still occupies a great deal of
research in hope of improving chemotherapy and radiotherapy. Therapeutic difficulties
of these applications mainly originate from the nature of disease that has the ability to
modify its surrounding for its growing and proliferation. Drug resistance and lack of
selectively toxic anticancer agents are other issues that make cancer treatment difficult
and risky. Drug resistance or chemotherapy resistance means the low uptake of drug by
solid tumors which require either increasing doses or enhancing diffusion through
cancerous tissues. Increased doses cause detrimental side effects which may sometimes
be fatal. Therefore invention of smart drug carriers or targeting mechanisms constitutes
an extremely important part of cancer research. For designing a system that aims a
chemotherapy with increased influence on tumors or/and cancer cells and minimized
contact with healthy cells, it has to be considered how cancer grows.
Cancer starts in mutated single cells which replicate at higher rates than normal
cells. Cancerous cells occupy most nutrients and oxygen in their environment and
replace normal cells by growing faster than them. The growth continues until tumor
reaches to its diffusion limited maximal size which claims a steady state. At this state,
the nutrients and oxygen occupied by cancerous cells at the surface cannot diffuse
through solid tumor and reach to the core where cell death begins. At this maximal size
which is about 2 mm3 number of proliferated cells is about the same as the ones that die
due to lack of nutrients. For further growing, cancerous tissue organizes vascularization

17
which provides more nutrients and oxygen by formation of new vessels. This
phenomena is called as angiogenesis. Next and most dangerous activity of cancerous
cells is transportation through blood or nymph vessels and cause formation of new
tumors as shown in Figure 2.2. Different approaches for site specific chemotherapy
have been proposed to prevent formation and proliferation of cancerous cells for
different stages of tumor formation. (Brannon-Peppas and Blanchette, 2004; Manocha
and Margaritis, 2008) They may be listed as follows:
1. Avoiding reticuloendothelial system: Reticuloendothelial system is defense
mechanism of metabolism for the clearance of alien particles and microorganisms from
the body. Alienated particles are filtered through liver, spleens and lungs and are
sequestered by macrophages. If a particle designed for specific drug delivery purpose
have the size, morphology and surface characteristics that avoid being eliminated by the
reticuloendothelial system, it may remain in circulatory system until it degrades and
rather accumulates in solid tumors. These particles should have a particle size less than
100 nm and hydrophilic surface.
Figure 2.2. Stages in tumor development: (A) healthy cells—nutrient rich, normal replication rate; (B) peripheral cancerous tissues bathe in nutrients, higher replication rate, gradient decrease in nutrient supply from periphery to core; (C) necrotic core—very low to no nutrient supply, interstitial pressure decreases from core to periphery; (D) tumor reaches diffusion-limited maximum size (2 mm3), cells break off from primary tumor; (E) cancer cells invades into local tissues; (F) angiogenesis; and (G) metastasis via blood and lymph vessels. (Manocha and Margaritis, 2008)
2. Enhanced permeability and retention: Ensembled cancerous cells have been
observed to have enhanced permeability due to vascularization around the tumor
formation. Although it allows overfeeding of cancerous tissues, in classical

18
chemotherapy this is thought to be the reason for the effectiveness of toxic drugs on
cancerous tissues rather than healthy cells although it may not work for every case.
Retention is another property observed in solid tumors due to poor lymphatic drainage.
3. Tumor specific targeting: Since cancer cells need overfeeding, particular
antigens within their medium are overexpressed. Folic acid is the most famous protein
observed at extended amounts in tumors. Folate receptors are expected to tend to cancer
cells which allow tumor targeting.
4. Prodrugs: Prodrugs are complexes that have been designed to activate only
after reaching tumors. For this purpose specific linkers and ligands are used. Toxic drug
is conjugated by a linker that is usually broken by peptidase or acidic medium that are
peculiar to environments of cancerous cells. But the mechanism may not work properly
in any case for in vivo conditions may vary from person to person and are hard to
predetermine.
5. Targeting through angiogenesis: Instead of overexpressed antigens, some
angiogenesis stimulating molecules can be targeted to get into tumors. The molecules
that have this capability are vascular endothelial growth factor, basic fibroplast growth
factor, platelet-derived growth factor, and some metalloproteinases which indicate
suspicious vascularization. To prevent angiogenesis and in turn avoid feeding of
cancerous cells can be possible by limiting endothelial proliferation, introducing
angiogenesis inhibitors, avoiding angiogenesis stimulatory factors. Both are possible to
prevent angiogenesis or use angiogenesis as a selective route to deliver toxic drugs to
cancerous sites.
5FU is a hydrophobic neoplastic anticancer drug which is widely used in breast,
colon, pancreas and eye cancer (Pascu et al., 2003). To prevent side effects, decrease
drug resistance, provide elongated influence in circulatory system and a controlled
delivery, various nanocarriers were investigated in terms of 5FU loading and release
performance as listed in Table 2.2. With poly(lactide-co-glycolide) 3.8 % drug content
could be achieved (McCarron and Hall, 2008). Entrapment of 5FU by crosslinking
during loading was studied with acrylic copolymers but loading with
adsorption/absorption yielded better drug loading efficiency which depended on drug
concentration (Babu et al., 2006).
One way of minimizing toxic side effects of 5FU was proposed as preparation of
polymer-5FU conjugates. Sulfated polysaccharides have been proposed for 5FU
conjugation although the release properties were not desirable for cancer therapy.

19
Table 2.2 Drug Loading Contents (DLC) and Drug Loading Efficiencies (DLE) of several biomaterials loaded with anti-cancer drug 5-FU.
Material MW (kDa)
Loading Method
DLE* %
DLC* % Reference
PAMAM dendrimer 5-20 Conjugation - <1
Zhuo et al, 1998
PVP hydrogel network 10-18 Conjugation - <1
Liu & Rimmer, 2002
PLGA microsphere 40-75 Solvent
Evaporation 50 <1 Gupte & Ciftci, 2004
PLA-b-PEG nanoparticles 8-60 Solvent
Evaporation 10-50 <2 Jie et al, 2005
PDTC-b-PEG-b-PDTC 74-13 Dialysis 17-7 4-2
Zhang & Zhuo, 2005b
PLA fibers 100-200 Wet Spinning 75-90 10
Gao et al, 2007
Chitosan/PAsp nanoparticles 18/5 Absorption 10-35 10-28
Zheng et al, 2007
Chitosan 55-550 Crosslinking 28-66 - Yang & Hon, 2009
Chitosan/PEG microparticles 300 Phase
Inversion 70 <1 Lin & Fu, 2009
Porphyran LMW Porphyran
250 5 Conjugation 80
60 4-7 18
Zhang et al, 2010
* DLC and DLE are defined by Equations 2.3 and 2.4.
The conjugates showed fast initial releases reaching almost equilibrium within
the first 10 hours with relatively higher rates of release in basic media while it is known
that the medium is slightly acidic in cancerous regions (Zhang et al., 2009). Zhuo et al
achieved controlled release profiles over seven days of periods by dendrimer conjugates
of 5FU (Zhuo et al., 1999). Another succesfull attempt is 5FU conjugates with poly(N-
vinyl pyrrolidone) derivatives which provide quite slow release profiles (Liu and
Rimmer, 2002). The main disadvantage in this application is that minute amounts of
drug can be introduced by conjugation due to great difference in molecular weights of
drug and conjugated polymer.

20
Polyorganophosphazene microparticles were loaded with indomethacin and 5FU
by solvent evaporation technique yielding very high loading contents up to 50%. But
the microparticles delivered loaded drug very fast (Gudasi et al., 2006).
Chitosan is another biomaterial proposed for controlled 5FU delivery (Yang et
al., 2009). Some studies with hydroxyapetite and chitosan yield insignificant 5FU
loading contents less then 1% although they have been proposed as controlled delivery
agents (Dodova et al., 2009; Santos et al., 2009). Lin et al. studied crosslinking of
chitosan / polyethylene glycol microparticles to provide controlled release of 5FU and
Jain improved release profiles with incorporation of hyaluronic acid in chitosan
particles. But drug loading capacities were still poor and 50% of the loaded drug was
released in the first 12 hours (Lin and Fu, 2009; Jain and Jain, 2008). Zheng et al.
attained high loading drug contents (20-30%) by using hydrophilic particles of chitosan
and polyaspartic acid salt and they could obtain controlled release from particles
through glutaraldehyde crosslinking (Zheng et al., 2007).
Acrylamide methyl methacrylate copolymers of core and shell type were also
loaded to yield high 5FU contents (5-15%) by in situ polymerization of monomers. The
release rates were proposed to depend on degree of crosslinking via N,N’-methylene
bisacrylamide and 5FU contents of loaded microparticles (Babu et al., 2006). 5FU
loaded nanoparticles (30 nm) of poly(γ-benzyl-L-glutamate) (PBLG) as and
poly(ethylene glycol) (PEG) exhibited very high loading capacity about 27% by dialysis
method. But 40% of loaded content was released in two hours (Li et al., 2008).
5FU loading to PLGA particles is commonly achieved by precipitation/solvent
evaporation techniques. Main problem reported about drug delivery performance of
PLGA is the burst effect which means sudden release of loaded drug due to fast
degradation (Gupte and Ciftci, 2004). Poly(L-lactic acid) microfibres were loaded with
5FU achieving high loading capacities (10%) by wet-spinning method but burst effect
remains as a challenging problem (Gao et al., 2007).
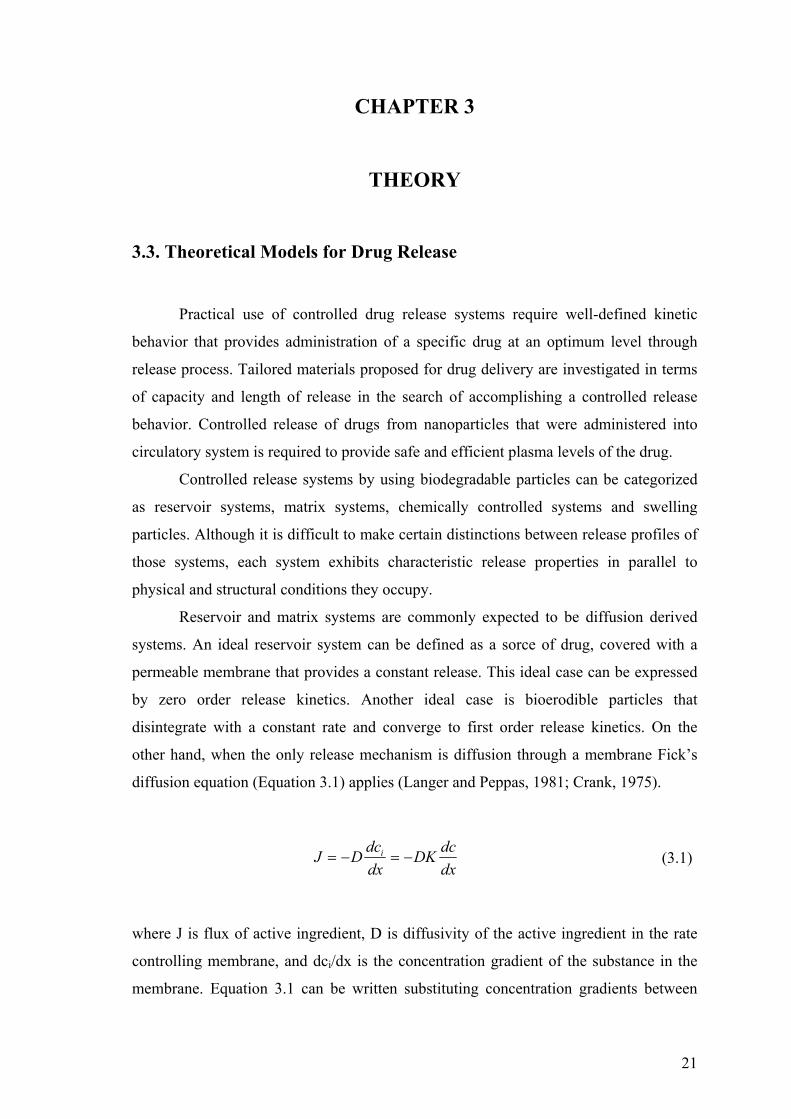
21
CHAPTER 3
THEORY
3.3. Theoretical Models for Drug Release
Practical use of controlled drug release systems require well-defined kinetic
behavior that provides administration of a specific drug at an optimum level through
release process. Tailored materials proposed for drug delivery are investigated in terms
of capacity and length of release in the search of accomplishing a controlled release
behavior. Controlled release of drugs from nanoparticles that were administered into
circulatory system is required to provide safe and efficient plasma levels of the drug.
Controlled release systems by using biodegradable particles can be categorized
as reservoir systems, matrix systems, chemically controlled systems and swelling
particles. Although it is difficult to make certain distinctions between release profiles of
those systems, each system exhibits characteristic release properties in parallel to
physical and structural conditions they occupy.
Reservoir and matrix systems are commonly expected to be diffusion derived
systems. An ideal reservoir system can be defined as a sorce of drug, covered with a
permeable membrane that provides a constant release. This ideal case can be expressed
by zero order release kinetics. Another ideal case is bioerodible particles that
disintegrate with a constant rate and converge to first order release kinetics. On the
other hand, when the only release mechanism is diffusion through a membrane Fick’s
diffusion equation (Equation 3.1) applies (Langer and Peppas, 1981; Crank, 1975).
dxdcDK
dxdcDJ i −=−= (3.1)
where J is flux of active ingredient, D is diffusivity of the active ingredient in the rate
controlling membrane, and dci/dx is the concentration gradient of the substance in the
membrane. Equation 3.1 can be written substituting concentration gradients between

22
solutions on the two sides of the membrane with introduction of K, ratio of
concentration in the membrane to the concentration in the solution named as partition
coefficient. KD can also be expressed as permeability of the membrane, P.
Fickian diffusion through a rate controlling membrane is the most general form
of release mechanism in reservoir type drug release systems. Fickian diffusion through
spherical particles is commonly expressed as in Equation 3.2, by transient diffusion
equation which is used to find diffusion coefficient through polymeric particles:
⎟⎠⎞
⎜⎝⎛
∂∂
∂∂
=∂∂
rqr
rrD
tq 2
2 (3.2)
Equation 3.2 shows the change in amount of substance released from spherical particles,
where q represents amount of substance transferred through particle, r is distance from
the center of the sphere and D is diffusion coefficient. This equation assumes constant
diffusion coefficient and the case is valid at low concentrations considering the
following initial and boundary conditions (Crank, 1975; Klose et al. 2008) :
at 0t = , Mq =
for 0t > and at pRR = , tMq =
for 0t > , 00
=⎟⎠⎞
⎜⎝⎛∂∂
=rrq
(3.3)
Integration of Equation 3.2 with the boundary conditions given by Equation 3.3 ends in
Equation 3.4 for spherical particles and that can be simplified as in Equation 3.5 by
reducing the series to the first term (n=1). Equation 3.6 is a further simplified form to be
used for calculation of diffusivity from initial slope of Mt/M versus t1/2 graph.
⎟⎟⎠
⎞⎜⎜⎝
⎛−−= ∑
∞
=2
22
122 exp161
pn
t
rDtn
nMM π
π (3.4)

23
⎟⎟⎠
⎞⎜⎜⎝
⎛= 2
2
2 -exp6-1p
t
rDt
MM π
π (3.5)
2/1
24 ⎟⎟⎠
⎞⎜⎜⎝
⎛=
p
t
rDt
MM
π (3.6)
However, release kinetics observed in most of the systems that depend on
diffusion are preferably modeled by zero order or first order kinetics. Zero order
kinetics considers release systems where release rate remains constant and is
independent of the instantaneous drug content of the reservoir. First order release
kinetics generally indicate proportionality of release rate to drug content of reservoir.
These ideal and extreme conditions can be expressed by the simple mathematical
equations given by Equations 3.7-3.9. But it shoul be reminded that most of the actual
drug release system, a correspondence with theoretical models can merely be obtained
in the first one third interval of total release period. (Ritger and Peppas, 1987; Ho and
Sirkar, 1992; Heng et al. 2001; Prabakaran et al. 2003).
Zero Order ;
tkMMoto =− (3.7)
First Order;
ktM
tMt =)( (3.8)
Fickian Diffusion model;
5.0)(kt
MtM t = (3.9)

24
Ritger-Peppas model;
nt ktM
tM=
)( (3.10)
Ritger and Peppas stated by Equation 3.10 provides a far more general definition
of release system with any value of n, covering t-1/2 release systems. Value of n
determined by Ritger-Peppas model virtually shows the diffusion characteristics of the
system. For the cases where n=0.5, cartesian system of mass transfer is said to be
Fickian and the transfer is completely diffusion driven. When the diffusion occurs
through spherical particles n is expected to be 0.43 to be considered Fickian. An n value
between 0.5 and 1 indicates anomalous behavior which may be explained by existance
of a release profile driven by both diffusion and another release mechanism. Any
deviation from predetermined power of theoretical kinetic model can be caused by other
physical aspects of the system like swelling, relaxation or erosion of the particles
(Lowman and Peppas, 1999).
3.2. Description of the System
Drug release profile of loaded PMMA-b-PAA nanoparticles were estimated by a
continuous release process which took place in a diffusion cell that is schematically
shown in Figure 3.1. Loaded particles were placed in donor compartment and released
amount of drug that passed through a semipermeable membrane was continuously
monitored from the stream passing through receptor compartment.

25
Figure 3.1. Schematic representation of the diffusion cell where drug release occurs.
Since both compartments are well mixed, the mass transfer resistance is assumed
to be the resistance of membrane that separated the two compartments. Therefore
overall mass transfer coefficient occurs to be the permeation of the membrane and
Equation 3.13 which is derived from Equation 3.1 is used to determine drug
concentration in donor compartment starting from drug concentration measured from
receptor compartment.
(3.13)
M=CrVr (3.14)
where M is amount of drug that is transferred by diffusion through membrane and
defined as in Equation 3.14, Cd is concentration of drug in donor compartment, Cr is
concentration of drug in receptor compartment, Vr is volume of receptor compartment,
A is area of diffusion and P is permeability (Lowman and Peppas, 1999).
)()(rd
rr CCAPdt
VCd−= (3.15)
For the volume of receptor (Vr) is constant;
)( rd CCAPtM −=
dd
Cd
Semipermeable membrane
Continuous mixing in both compartments
Cr detected by UV spect
Donor Compartment
Receptor Compartment (Conc: Cr)
PBS flow

26
)( rdr
r CCVAP
dtdC
−= (3.16)
Substituting Cr= Y(t) and Cd= X(t) :
))()(()( tYtXVAP
dttdY
r
−= (3.17)
)()()( tXVAPtY
VAP
dttdY
rr
=+ (3.18)
In Equation 3.18, both concentration functions in donor and receptor
compartments are time dependent. Y(t), namely drug concentration in receptor
compartment can be experimentally determined and is to be dependent on drug
concentration in donor compartment. Therefore a mathematical expression that
represents drug release profile from polymeric nanoparticles is required for an ultimate
analysis of drug release behavior of drug loaded particles. It can be managed by
analytial solution of Equation 3.18 assuming X(t)=kntn, expecting that drug release from
particles will be explained by one of the well-known mechanisms which can be
summarized as zero order kinetics (n=0) or Fickian diffusion (n=0.5) or first order
kinetics (n=1).
Solution of the first order linear differential equation given by Equation 3.18 is
as follows:
)()()( tXeVAPtYe
VAPe
dttdY t
VAP
r
tVAP
r
tVAP
rrr =+ (3.19)
)()( tXeVAPetY
dtd t
VAP
r
tVAP
rr =⎟⎟
⎠
⎞
⎜⎜
⎝
⎛ (3.20)

27
)()( nn
tVAP
r
tVAP
tkeVAPetY
dtd
rr =⎟⎟
⎠
⎞
⎜⎜
⎝
⎛ (3.21)
∫∫ =⎟⎟
⎠
⎞
⎜⎜
⎝
⎛dttke
VAPetYd n
n
tVAP
r
tVAP
rr )()( (3.22)
∫=+ dttkeVAPCetY n
n
tVAP
r
tVAP
rr )()( 0 (3.23)
Integrating Equation 3.23 by using “integration by parts”: ∫∫ −= vduuvudv ,
u = tn , du = ntn-1dt , κ
κtev = , dv = eκtdt (where rV
AP=κ )
11)( CdttenetketY nt
tn
nt +⎥
⎦
⎤⎢⎣
⎡−= ∫ −κ
κκ
κκκ (3.24)
∫ +−= −1
1)( CdttenketketY ntn
tnn
t κκκ (3.25)
u = tn-1 , du = (n-1)tn-2dt , κ
κtev = , dv = eκtdt
22
1 1)( CdttenetnketketY nttn
ntn
nt +⎥
⎦
⎤⎢⎣
⎡ −−−= ∫ −
−κ
κκκ
κκ (3.26)
u = tn-2 , du = (n-2)tn-3dt , κ
κtev = , dv = eκtdt
33
21 2)1()( Cdttenetnnk
etnketketY nttn
ntn
ntn
nt +⎥
⎦
⎤⎢⎣
⎡ −−
−+−= ∫ −
−−κ
κκκκ
κκκκ (3.27)

28
tn
nn
n
n
n
n
n
nn
n eCtnktnnnktnnktnktktY κκκκκ
+−+−−−−+−=−−− 0
3
3
2
21
!....)2)(1()1()( (3.28)
Equation 3.28 is verified by analytical solution of integration in the form
∫ dxxe mA where A is defined as bx provided that b is a constant (Tuma, 1987).
Converting concentration of drug in receptor compartment which is a function of
time given in Equation 3.27 to amount of released drug shown in Equation 3.28, it will
be possible to compare theoretical amount of released drug with experimental data that
represented the amount of drug released from polymer particles within donor
compartment, permeated to receptor compartment through membrane and measured
continuously by UV-spectrophotometry. Once again, concentration variation of drug in
receptor compartment is denoted by Y(t), and in donor compartment by X(t). Mt
represents the cumulative amount of drug continuously released from the system and
determined by summation of instantaneous amounts at certain time intervals determined
by UV-spectrophotometry. F is volumetric flow rate of buffer solution passing through
receptor compartment.
dtFtYtMt ∫= )()( (3.29)
CeCFtnnkFtnkFtkFntktM t
n
n
n
n
n
n
n
n
nt +++−−+−+
= −−−+
κ
κκκ....)1(
1)( 3
2
2
11
(3.30)
Equation 3.29 is an alternating series which converges and can be reduced to the
first five terms as in Equation 3.30.
FtnnkFtnkFtkFntktM
n
n
n
n
n
n
n
nt 3
2
2
11
)1(1
)(κκκ
−−+
−−+−+
=
CeCFtnnnk tn
n
n ++−−+ −−
κ
κ 4
3
)2)(1(
(3.31)
where Cn and C are integral constants.

29
3.3. Permeation through Membrane
In order to define the system schematically described in Figure 3.1 by a
mathematical model, permeability of the membrane that separates two compartments of
the diffusion cell has to be known. Permeability is estimated by performing an
experiment where a known concentration of drug solution not loaded to any carrier has
been placed in donor compartment, passed through the membrane and monitored versus
time.
Assumptions related to this experiment performed in the diffusion cell are:
• Initial drug concentration is constant.
• Solutions in both compartments are homogeneous.
• Permeation is unidirectional in normal direction to the membrane.
• Perfect sink conditions are provided.
Then Equation 3.16 can be reconsidered for these conditions where Cd is
constant and known. Integrating Equation 3.16 for boundary conditions that are Cr=0 at
t=0, and Cr=Cr(t) at t=t:
dtVAP
CCdC
rrd
r ∫∫ =− )(
(3.32)
tVAPCC
r
trd =−−
0)ln( (3.33)
[ ] tVAPCCC
rdrd =−−− )ln()ln( (3.34)
PtC
CCA
V
d
rdr =⎥⎦
⎤⎢⎣
⎡ −− ln (3.35)
PtCC
AV
d
rr =⎥⎦
⎤⎢⎣
⎡−− 1ln (3.36)

30
CHAPTER 4
MATERIALS AND METHODS
4.1. Materials
Pentaerythritol (PENTA) (Aldrich, 98%) and dipentaerythritol (diPENTA)
(Charmor, 96%) was dried at 180 ºC for 3 hours and cooled under nitrogen. 1,3,5-
trihydroxybenzene was dried at 110 ºC and cooled under nitrogen. 2-bromoisobutyryl
bromide (Fluka, 97%), triethylamine (TEA) (Riedel-de-Haen, 99%) and 4-
dimethylaminopyridine (DMAP) (Fluka, 99%) were used as received. Tertiary butyl
acrylate (tBA) (Aldrich, 99%) and methyl methacrylate (MMA) (Aldrich, 99%) were
passed through basic alumina columns for removal of stabilizers. N,N,N’,N”,N”-
pentamethyl diethylenetriamine (PMDETA) (Aldrich, 99%) was distilled over NaOH
before use. Tetrahydrofuran (THF) (J.T. Baker, 99.8%) was dried and distilled over
LiAlH4. The other solvents, namely ethanol, methanol, n-hexane, diethyl ether and
dichloromethane were purified by conventional procedures. CuBr (Aldrich, 99.999%)
and anisole (Aldrich, 99%) was used without further purification. Other solvents such
as dimethyl formamid, dichloromethane, ethanol and methanol were at reagent grade.
Trifluoroacetic acid (TFAA) (Aldrich, 99%) was used for hydrolysis. Pyrene (Fluka,
99%) was employed as the fluorescent probe. Indomethacin (Fluka, 99%) and 5
Fluorouracil (5FU) (Aldrich, 99%) were used as model drugs. Standard PBS (phosphate
buffer solution) at pH value 7.4 was prepared by dissolving 8 g NaCl, 0.2 g KCl, 1.44 g
Na2HPO4 and 0.24 g KH2PO4 in 1 L deionized water.
4.2. Synthesis of Initiators
Brominated 1,3,5-trihydroxybenzene so called 1,3,5-(2-bromo-2-methyl
propionate) benzene was synthesized from 1.73 gr 1,3,5-trihydroxybenzene in THF
(tetrahydrofuran). 1 gr DMAP (dimethyl amino pyridine) was dissolved in 130 ml THF,
and 1,3,5-trihydroxybenzene was added. 6.7 ml TEA (triethyleneamine) was dissolved

31
in 30 ml THF and added under nitrogen. Then 6 ml 2-BIB (2-bromoisobutyryl bromide)
was added dropwise at 0˚C in 20 minutes. Afterwards addition of reactants, reaction
vessel was stirred at room temperature overnight. The product was filtered, THF was
evaporated, the powder was dissolved in Cl2CH2, washed with water twice, washed with
5% sodium bicarbonate solution to remove unreacted 2-bromoisobutyryl bromide,
Cl2CH2 phase was seperated, dried over MgSO4, and finally vacuum dried. For further
purification brominated 1,3,5-trihydroxybenzene is dissolved in 150 ml Cl2CH2, washed
with 50 ml 1% NaOH solution and water, dried over MgSO4, then vacuum dried,
dissolved in diethyl acetate and recrystallized in 20% ethyl acetate-80% hexane
solution.
Brominated pentaerythritol so called pentaerythritol tetrakis (2-
bromoisobutyrate) was synthesized from 1.09 gr pentaerythritol in THF. 1 gr DMAP
was dissolved in 130 ml THF, and pentaerythritol was added. 6.7 ml TEA was dissolved
in 30 ml THF and added under nitrogen. Then 6 ml 2-BIB was added dropwise at 0˚C.
The reaction vessel was warmed up to room temperature and stirred under nitrogen
overnight. The product was filtered, THF was evaporated, the powder was dissolved in
Cl2CH2, washed with water twice, washed with 5w% sodium bicarbonate aqueous
solution to remove unreacted 2-bromoisobutyryl bromide. Cl2CH2 phase was separated
and dried over MgSO4 and finally vacuum dried. For further purification, the initiator
was dissolved in Cl2CH2, washed with 1w% NaOH solution and deionized water, dried
over MgSO4, vacuum dried and recrystallized in diethyl ether.
Brominated dipentaerythritol so called di-pentaerythritol hexakis (2-
bromoisobutyrate) was synthesized from 1.35 gr pentaerythritol in THF as described
above. For further purification brominated pentaerythritol is dissolved in Cl2CH2,
washed with 1% NaOH solution and water, dried over MgSO4, vacuum dried and
recrystallized in diethyl ether.
4.3. Synthesis of Macroinitiators
Multiarm PMMA macroinitiators were synthesized from 10 ml of methyl
methacrylate. Monomer was diluted with anisole at 1:1 volumetric ratio. For the
polymerization reaction, 78.1 µL ligand (PMDETA) and 0.037 gr catalyst (CuCl) was
introduced. Initial molar ratio of monomer/initiator was 250 for each arm. The reactants

32
were purified from oxygen by degassing through three freeze-thaw cycles. Freezing and
thawing process was performed on a vacuum line schematically shown in Figure 4.1.
Then reactants eliminated from dissolved O2 and moisture were reacted for 10-12
minutes at 70 ºC as shown in Figure 4.2. The product was passed through neutral
activated alumina column, vacuum dried, diluted in tetrahydrofuran and precipitated in
hexane for purification.
Figure 4.1. Experimental set up for degassing the reactants prior to ATRP reaction
4.4. Synthesis of Multiarm PMMA-b-PAA Copolymers
For polymerization of tBA to synthesize PMMA-b-PtBA from PMMA
macroinitiator, 7 ml of tBA was used as monomer and diluted with anisole at 1:1
volumetric ratio. 196 µL ligand (PMDETA) and 0.015 gr catalyst (CuBr) was
introduced. Initial molar ratio of monomer/initiator was 600 for each arm. The reactants
were degassed through three freeze-thaw cycles then reacted for 4-12 hours at 90 ºC.
The product was passed through neutral activated alumina column, vacuum dried,
diluted in tetrahydrofuran and precipitated in methanol-water mixture to eliminate
residual monomer.

33
Figure 4.2. Fotographs of experimental setup for ATRP synthesis of star block
copolymers (a) vacuum line for degassing, (b) freeze-thaw process and (c) reaction carried in oil-bath.
The polymer sample was dissolved in dichloromethane, dried over Na2SO4,
filtered and vacuum dried. PMMA-b-PtBA samples were hydrolized with trifluoroacetic
acid. The polymer synthesized was dissolved in 10 ml distilled dichloromethane and 2
ml of trifluoroacetic acid was added. Reaction was completed by 24 hours of stirring at
room temperature.
4.5. Characterization
Molecular weights of the star block copolymer were determined by Gel
Permeation Chromatography (GPC). GPC analysis were achieved with an Agilent
model 1100 instrument equipped with a pump, refractive-index, UV detectors and four
Waters Styragel columns (HR 5E, HR 4E, HR 3, and HR 2). THF was the eluent stream
passing with a flow rate of 0.3 mL/min at 30 °C. Toluene was used as an internal
b c
a

34
standard. The molecular weights of the polymers were calculated on the basis of linear
PMMA standards (Polymer Laboratories).
Chemical structures of the initiator (pentaerythritol tetrakis (2-
bromoisobutyrate)), macroinitiator (PMMA) and the star block copolymer (PMMA-b-
PtBA) were determined by Bruker NMR spectrometer (250 MHz for 1H-NMR). 1H-
NMR and 13C-NMR analysis of hydrolyzed copolymer was achieved by Varian 400-
MR spectrometer. The efficiency of the hydrolysis reaction was confirmed by Fourier
Transform Infrared Spectroscopy.
Loaded particles were characterized by Differential Scanning Calorimetry
(DSC-50 Shimadzu), Thermal Gravimetric Analysis and Differential Thermal
Gravimetry (Seteram Labsys) in addition to Fourier Transform Infrared
Spectrophotometry (Shimadzu FTIR 8400 S).
4.6. Maximum Loading Capacity
Pyrene stock solutions and polymer solutions with constant concentrations were
prepared. Each sample of 4 ml included 20 µL ethanol. Pyrene aliquots were taken into
test tubes at twelve different dozes which vary between 2.5x10⁻⁷ M and 30x10-7 M.
After vacuum drying for 4 h at 25 °C, polymer solutions at determined polymer
concentration were transferred into pyrene containing tubes and were kept at 4 °C, dark
medium for 16 hours being stirred. Then 750 μL samples were centrifuged with 1500
rpm for 10 minutes. Centrifuged samples were scanned in fluorescent
spectrophotometer to determine maximum capacity of pyrene loading. Fluorescent
measurements were performed at Varioskan Flash microplate reader. Emission spectra
in 360-450 nm interal were recorded with excitation at 330 nm wavelength and
intensities at 393 nm were recorded versus increasing pyrene concentrations.
Experiment is performed at two diferent polymer concentrations which were
200 mg/L and 500 mg/L. Change in intensity of pyrene loaded polymer samples with
increasing pyrene concentrations were compared to blank pyrene solutions that took the
same treatment as the pyrene loaded polymer solution samples. Blank solutions
contained the same pyrene concentrations of the polymer solutions.

35
4.7. Critical Micelle Concentration
Pyrene was dissolved in chloroform and diluted to 2x10⁻⁵ mg/ml. 10 μL aliquots
were taken into test tubes which were dried under vacuum for 4 hours at 25°C. 20 mg
polymer sample was dissolved in 1 ml alcohol to obtain a stock solution. Then aliquots
taken from stock solutions were diluted to 5 ml to obtain different polymer
concentrations from 0.015 mg/L to 1500 mg/L. Then 5 ml polymer solutions were
transferred into pyrene containing test tubes. Each tube had a pyrene concentration of
2x10⁻⁷ M. The tubes were kept at 4 °C for 16 hours being stirred at a dark medium. 750
μL samples were drawn for fluorescence measurements. The samples were centrifuged
at 1500 rpm for 10 min before fluorescence measurements. Fluorescence measurements
were performed at Varioskan Flash microplate reader. Excitation spectra were obtained
in 300-360 nm interval keeping the emission wavelength at 393 nm. Bandwidth was
kept 5 nm and stepsize was 3 nm during all scans. Critical micelle concentration was
determined from emmision intensity ratios of the excitation bands at 336 nm and 333
nm (I336/I333) versus polymer concentration on logarithmic scale. CMC determined from
shifts in excitation spectra was verified by I1/I3 ratio changes in emmission spectra and
also by UV-spectroscopy at 266 nm.
4.8. Drug Loading
Drug loading was achieved by several methods for comparison. The methods
applied to load multiarm star block copolymer samples with the model drugs
indomethacin and 5-FU were performed as follows:
1. Simple equilibrium method: The polymer and drug were simply added into
buffer saline solution under agitation and filtered.
2. Co-precipitation: The drug and the polymer were dissolved in appropriate
solvents. Polymer and drug solutions were mixed and kept for 30-60 min. (The solution
may be dispersed by ultrasonic treatment.) Then the homogeneous solution was added
into suitable nonsolvent (that was generally a nonpolar solvent like hexane, diethyl
ether or a mixture of the two) drop by drop under agitation. The polymer precipitate is
filtered and vacuum dried.

36
3. Dialysis: The polymer and drug are dissolved in appropriate solvents and
kept for 30-60 minutes. (The solution may be dispersed by ultrasonic treatment.) Then 5
ml of water is added drop wise into the solution, and poured into dialysis bag. The
polymer+drug solution is dialyzed against 2 L of water for 24 hours and the medium is
freshened in 12 hours. The ingredients after 24 hours is freeze-dried for determination
of drug loading efficiency.
4. Solvent deposition method (Coacervation): The polymer and drug are
dissolved in appropriate solvents. The organic phase is poured into water phase (water
or PBS). Solvent is evaporated under vacuum or polymer is micellized in water
medium and drug is separately dissolved in solvent. Then the drug solution is poured
into micelle and solvent is evaporated under vacuum. Then the solution is centrifuged
(or filtered) several times to remove precipitates.
5. Salting-out method: The polymer and drug are dissolved in appropriate
solvents. Then the solvent is evaporated. The film formed is hydrated in buffer solution,
and the micelle is formed with intensive shaking. Excess drug precipitates and is
removed by filtration.
Drug loading conditions were optimized in terms of type of medium,
temperature, loading interval and polymer concentration. For the selection of loading
medium, 20 mg polymer samples was introduced to equal amount of drug in water,
ethanol, 1% acetic acid, dimethyl sulfoxide and dimethyl formamide. In each
experiment polymer sample was dissolved in 0.25 ml ethanol then diluted to specific
concentration with solvent of interest in which 20 mg of drug was previously dissolved.
All loading experiments were performed at room temperature for 2 hours. After loading,
loaded sample was washed off excess drug by dialysis method and freze dried. Drug
content of each sample was determined from spectrophotometric analysis of dialysis
media. Dialysis was performed in 100 ml portions of distilled water and medium was
refreshed at every one hour period. Concentrations of 100 ml dialysis media was
followed until ultimate purification of loaded polymer samples from excess drug which
took 12-18 hours depending on type of solvent.
After selection of medium, optimum temperature of loading medium and
duration of loading was determined through trials performed at three temperatures,
25°C, 15ºC and 5ºC. Polymer samples of 10 mg were dissolved in 0.25 ml ethanol,
mixed with equal amount of drug dissolved in selected loading medium in water bath
kept at specific temperature. Drug content of samples were monitored versus time and

37
loading intervals to reach equilibrium besides drug loading efficiencies were
determined.
In order to determine effect of polymer and initial drug concentration on loading
performance 20 mg polymer samples were dissolved in 0.5 ml of ethanol and 20 mg
drug portions were dissolved in 1.5 ml 1 % HCl. Polymer solutions were diluted with
distilled water to have concentrations of 500 mg/L, 2000 mg/L or 3500 mg/L. After
addition of drug into polymer solutions, loading was achieved at 15 °C under stirring in
4 hours. The solutions were transferred into dialysis tubes which were placed in 1 L of
water. The dialysis media were refreshed at 5th and 12th hours. Further dialysis in 100
ml of water for 1 hour was employed for checking by UV-spectroscopy to understand
whether samples were completely washed off excess drug or not. The drug content of
the samples were estimated by subtracting the amount of excess drug washed out by
dialysis from the initial content.
Quantities of excess drug were determined by measuring absorbance of certain
volume of dialysis media by UV-Vis Spectrophotometry (Perkin Elmer) at 266 nm for
5FU.
4.9. Drug Release
Drug release profiles were obtained by a continuous process which involved a
diffusion cell as in Figure 4.3 and a flow cell attached to a UV-Vis Spectrophotometer.
5 mg of drug loaded polymer sample was dissolved in 1 ml PBS within donor
compartment of diffusion cell which was kept at 37 Cº through experiment. Fresh buffer
was passed through the diffusion cell with a 0.025 ml/min flowrate by using a syrince
pump. The donor and acceptor compartments of the diffusion cell were separated by
cellulosic membrane with 12000-14000 MWCO. UV-absorbance data of the dowstream
passing through the diffusion cell and then a flow cell placed within spectrophotometer
were simultaneously recorded with respect to time. Absorbance data was converted to
concentration values of the drug by using Beer’s law. Calibration curve of 5FU in PBS
was used to determine released amount of drug by multiplying instantaneous
concentration (mg/ml) data collected at 1 minute intervals by volumetric flowrate
(ml/min).

38
Figure 4.3. (a) Flow-through dissolution apparatus used to measure free drug flux
arising from a nanoparticulate suspension held separated from a dissolution chamber by a semi-permeable membrane (Source: McCarron and Hall, 2008). (b) Photograph of the diffusion cell used in drug release studies.
4.10. Biodegradation
Particle size analysis by dynamic light scattering was achieved by Zetasizer
(3000 HSA, Malvern). Polymer samples were prepared by dissolving polymer in limited
amount of alcohol then diluting to 2 mg/ml with PBS. Each sample was filtered through
0.2 µm teflon membrane prior to measurement (n=4). Biodegradion of polymer samples
at different polymer concentrations (1,2,4,6 and 8 mg/ml) were also investigated.
Loading ability of biodegraded polymer samples were detected by UV-
spectrophotometer after they were loaded with pyrene as described in section 4.6.
The results were also compared to particle size analysis of AFM micrographs
(Digital Instruments MMAFM-2/1700EXL). Freeze dried polymer samples were
dissolved in deionized water at a concentration of 5 mg/L and kept in thermoshaker at
37ºC for degradation. 5 ml samples taken daily were filtered through 0.45 µm teflon
membrane and dripped on glass supports. Each sample was immediately frozen at -
20ºC, freeze dried (Telstar, Cryodos) for 48 hours and kept at dessicator for
dehumidification for 24 hours. AFM images were obtained by tapping mode.
nanoparticle suspension
solvent
dissolution chamber
semipermeable membrane (a)
b
(b)

39
CHAPTER 5
RESULTS AND DISCUSSION
5.1. Synthesis of Initiators
Initiators with three, four and six brominated active sites were synthesized in
tetrahydrofuran and under N2 as described by Jankova et al. (Jankova et al., 2005; Even
et al., 2003). Starting materials were 1,3,5-trihdiroxybenzene with three –OH groups,
pentaerythritol with four –OH groups and dipentaerythritol with six –OH groups.
Bromination of –OH groups was achieved by reacting with 2-bromoisobutyryl bromide
by using a ligand. Triethyleneamine (TEA) was used as ligand for bromination of 1,3,5-
trihdiroxybenzene while dimethylaminopyridine (DMAP) was used for bromination of
pentaerythritol and dipentaerythritol. All reactions were carried in tetrahydrofuran
(THF) and all reactants were completely dried before reaction. The reactions shown in
Figures 5.1, 5.2 and 5.3 were carried under nitrogen and the system was carefully
prevented from oxygen and moisture in order to produce extremely pure brominated
products. Reaction conversions were simply calculated from molar conversion of
starting material as shown by Equation 5.1 where n is number of moles, MW is
molecular weight and w is weight of reactants and products, and given in Table 5.1.
100100(%) ×=×=rr
pp
r
p
MWwMWw
nn
Conversion (5.1)
Table 5.1. Conversions of bromination reactions of starting materials to synthesize initiator molecules with 3, 4 and 6 brominated active sites.
Reactant MW
(Da) Wreactant
(gr) Product MW (Da)
Wproduct (gr)
Conversion (%)
THB 162 1.73 THB-Br 499 5.04 94.5 PENTA 136 1.09 PENTA-Br 572 3.50 76.3
diPENTA 254 1.35 diPENTA-Br 956 3.42 67.3

40
Figure 5.1. Schematic presentation of bromination reaction of 1,3,5-trihydroxybenzene to synthesize 1,3,5- (2-bromo-2-methyl propionate) benzene
Figure 5.2. Schematic presentation of bromination reaction of pentaerythritol to synthesize pentaerythritol tetrakis (2-bromoisobutyrate).
Figure 5.3. Schematic presentation of bromination reaction of di-pentaerythritol to
synthesize di-pentaerythritol hexakis (2-bromoisobutyrate)
O
OH OH
OH
OH OH OH
O
O O
O
O O O
O
Br
O
Br
O
O
Br
Br
O
Br
O Br
OH
OH HO
Br
Br
O
O
O O
O
Br
O O
Br Br
Br
Br
O
OH
OH OH
OH O
OO
O
Br
O
O
Br
Br
O
Br
O
TEA (THF, 0°C)
DMAP (THF, 0°C)
Br
Br
O
DMAP (THF, 0°C)

41
Bromo-initiators, namely 1,3,5- (2-bromo-2-methyl propionate) benzene with
three active sites, pentaerythritol tetrakis (2-bromoisobutyrate) with four active sites and
dipentaerythritol hexakis (2-bromoisobutyrate) were compared with starting materials
by thermal analysis. The change in thermal behavior of materials as shown in Figures
5.4-5.6 confirmed that bromination reactions were completed.
0
20
40
60
80
100
0 100 200 300 400 500
T (oC)
Wei
ght %
Figure 5.4. TGA overlay of (a) unreacted 1,3,5-trihydroxybenzene and (b) 1,3,5- (2-
bromo-2-methyl propionate) benzene.
0
20
40
60
80
100
0 100 200 300 400 500
T (oC)
Wei
ght %
Figure 5.5. TGA overlay of (a) unreacted pentaerythritol and (b) synthesized
pentaerythritol tetrakis (2-bromoisobutyrate).
(a)
(a) (b)
(b)

42
0
20
40
60
80
100
0 100 200 300 400 500
T (oC)
Wei
ght %
Figure 5.6. TGA overlay of (a) unreacted di-pentaerythritol and (b) synthesized di-
pentaerythritol hexakis (2-bromoisobutyrate). 1H-NMR spectra of each sample was evaluated to determine purity of the
products. Purity of the initiators were determined by comparing the specific peak areas
obtained from 1H-NMR spectrum to the stoichiometric ratios of types of hydrogen
groups observed in molecular structure.
Brominated and purified 1,3,5-trihydroxybenzene has two types of hydrogen
groups, one belonging to the benzene ring and the other to the methyl groups of added
isopropyl bromide arms, which were notated as a and b respectively in Figure 5.7. As
can be calculated from the molecular structure, the ratio of these two types of hydrogen
atoms are 3/18 (=1/6) in number for the molecule has three CH and six CH3 groups. The
characteristic peak of CH appears at 2.04-2.06 ppm interval and has a peak area of
58.381 while signals of the 2-bromopropanoate groups [COO(CH3)2Br] are 6.95-6.97
ppm with a total peak area of 7.912. The ratio of the integrals (areas) of the peaks was
determined as 1/7.37 which corresponds to a 82% purity.
(a) (b)

43
b a b Br
Figure 5.7. 1H-NMR spectrum of 1,3,5- (2-bromo-2-methyl propionate) benzene.
H-NMR spectrum of brominated pentaerythritol provided two peaks that belong
to C(CH2)4 and bromopropanoate groups 4[COOC(CH3)2Br] at 4.31 and 1.92 ppm with
peak areas of 7.912 and 32.793 respectively (Figure 5.8). Comparing the ratio of the
peak areas to the stoichiometric H ratio (8/24) it was determined that 99% purity was
obtained after purification although the purity of the synthesized material had been
determined as 64.7% before purification.
Brominated dipentaerythritol, on the other hand, could be purified to 100%
purity according to the signals that appear as follows: 2[C(CH2)3] at 4.28 ppm,
O(CH2)2 at 3,58 and 6[COOC(CH3)Br] at 1.92 ppm with the peak areas of 13.688, 4.57
and 41.645 (Figure 5.9).
8 7 6 5 4 3 2 1 0 ppm
O
O
O Br
O O
Br O

44
Figure 5.8. 1H-NMR spectrum of pentaerythritol tetrakis (2-bromoisobutyrate).
5.2. Synthesis of PMMA-b-PAA Polymers
Synthesis of PMMA-b-PAA block copolymers constitutes of two stage ATRP
reaction to produce PMMA-b-PtBA copolymer and hydrolysis of PMMA-b-PtBA to
react tertiary butyl acrylate groups into acrylic acid. ATRP synthesis of 3 arm, 4 arm
and 6 arm PMMA initiators is the first stage of the polymerization reaction and are
shown in Figures 5.10-5.12.
For the ATRP synthesis of PMMA macroinitiators from the bromo-initiators
synthesized and purified previously, CuCl was used as catalyst in stoichiometric ratio.
PMDETA was used in 10% excess to increase solubility of catalyst and provide
persistent radical effect of the catalyst.
Dilution of monomer with an appropriate solvent that was anisole was employed
to keep concentration of active species as high as possible throughout reaction. This was
also expected to minimize termination reactions via coupling of active species. A third
advanage of addition of a strong solvent was further solubilization of catalyst as well.
a
b
a
b O
O O
O
Br
O
O
Br
Br
O
Br
O
8 7 6 5 4 3 2 1 ppm

45
Figure 5.9. 1H-NMR spectrum of di-pentaerythritol hexakis (2-bromoisobutyrate).
Amount of monomer, methyl methacrylate (MMA) to be reacted was
determined as a result of trials achieved by various M/Io (monomer to initiator molar
ratio) values between 100 and 250. Since CuCl is a very effective catalyst when
combined with MMA, reaction is quite fast still depending on initial monomer ratio as
shown by Equation 2.1. When M/Io ratio was as high as 250, ATRP reaction at 60°C
yielded macroinitiators having desired molecular weights (<5000 Da) within 10-12
minutes. High rate of reaction provided a very low polydispersity, on the other hand
reaction conversions were as low as 3-5% (Table 5.2). Although the conversions were
too low to propose they can be improved and still provide acceptible polydispersities by
an optimization study of reaction conditions (temperature, time, M/Io ratio) to obtain
reaction conversions. In this study low conversions were tolerated since minimum
molecular weight distribution of the macroinitiator was extremely important at this
stage of synthesis in order to prevent side reactions at the second stage of synthesis.
7 6 5 4 3 2 1 ppm
O
OO
O
OO O
O
Br
O
Br
O
O
Br
Br
O
Br
O Br
a
b
a
c
cb

46
CuCl, PMDETA (Anisole, 70°C) MMA
O
O O
O
Br
O O
Br Br
OCH3
CH2 C
CO
O
O O
O
Br
O O C H2C
OCH3
CH3
n
CH2 C
CO
Br
CH3
n
Br
n
CH3
CO
OCH3
Figure 5.10. ATRP synthesis of 3 arm PMMA from 1,3,5- (2-bromo-2-methyl propionate) benzene.

47
O
OO
O
Br
O
O
Br
Br
O
Br
O
OCH3
O
O
OO
O
O
O
O
CH2 C
CO
Br
CH3
nOCH3
C CH2
n
CH3
CO
OCH3
Br
C CH2
n
CH3
CO
Br
OCH3
CH2 C
CO
Br
CH3
n
CuCl, PMDETA (Anisole, 70°C) MMA
Figure 5.11. ATRP synthesis of 4 arm PMMA from pentaerythritol tetrakis (2-bromoisobutyrate).

48
O
OO
O
OO O
O
Br
O
Br
O
O
Br
Br
O
Br
OBr
OCH3
O
OCH3
CH2 C
CO
Br
CH3
n
O
OO
O
OO O
O
O OO
O
CH2 C
CO
Br
CH3
nOCH3
C CH2
n
CH3
CO
OCH3
Br
C CH2
n
CH3
CO
Br
CH3
OCH3
CH2 C
CO
Br
CH3
n
OCH3
CH2 C
CO
Br n
CuCl, PMDETA (Anisole, 70°C) MMA
Figure 5.12. ATRP synthesis of 6 arm PMMA from di-pentaerythritol hexakis (2-promoisobutyrate).
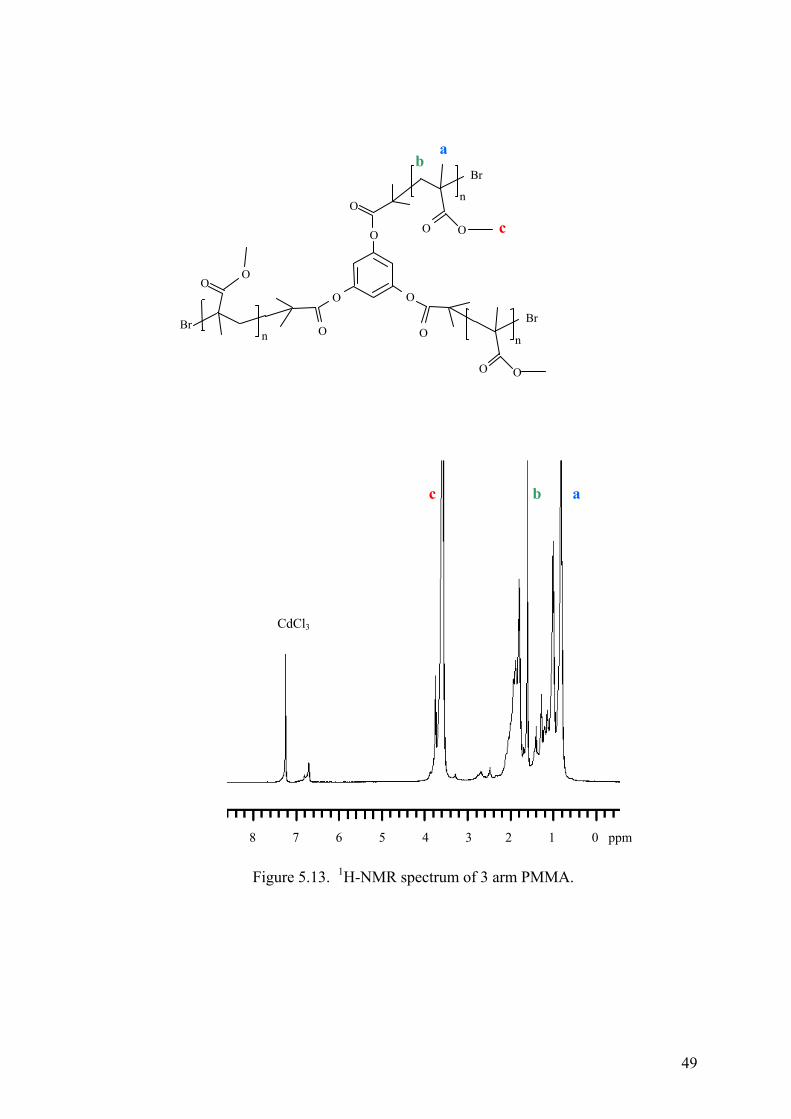
49
O
O O
O
O O
n
Br
ab
cO O
n
O O
n
O O
c b a
CdCl3
Figure 5.13. 1H-NMR spectrum of 3 arm PMMA.
8 7 6 5 4 3 2 1 0 ppm
Br Br

50
Br
O
O O
a
b
c
CdCl3
Figure 5.14. 1H-NMR spectrum of 4 arm PMMA.
7 6 5 4 3 2 1 0 ppm
n
Br
a
cO O
O O
O
O
O
n
Br
O O
b
O O
Br
O O

51
Br
O
O
O O
O
O O O
O
O O
O
O
n
n
n
nBr
Br
Br c
b
OO
Br n
OO
n Br
a
OO
O O
OO
O O
a b c
CdCl3
Figure 5.15. 1H-NMR spectrum of 6 arm PMMA.
8 7 6 5 4 3 2 1 0 ppm

52
The chemical structure of each macroinitiator synthesized was analized by 1H-
NMR and given by Figures 5.13-5.15. 1H -NMR spectrum of PMMA is δ: 0.8–1.0 ppm
(3H, CH3), 1.7 ppm (2H, CH2), 3.6 ppm (3H, COOCH3), 7.25 ppm (H, CHCl3).
(Malinowska et al., 2005; Ishizu et al., 2005; Nurmi et al., 2007). CH2 peak labelled
with letter ‘b’ in Figures 5.13-5.15 depicts a number of shifts within the range 1.35-2.3
ppm probably due to molecular interactions between chains. Areas of related peaks of H
groups belonging to PMMA have been consistent with molecular structures.
Molecular weights of PMMA and PMMA-b-PtBA copolymers were determined
by Gel Permeation Chromotography (Figures 5.16-5.18). For performing the second
stages of polymerization reactions that are presented schematically by Figures 5.19-5.21
experimental molecular weight of PMMA initiator was used to determine quantity of
PMMA initiator to be reacted with certain volume of tBA. Stoichiometric ratio of
monomer to initiator (M/I1) determines rate of reaction (as mentioned in Chapter 3),
final molecular weight of copolymer and also polydispersity. The reaction conditions
and conversions are tabulated in Table 5.2 for the samples of 3 arm, 4 arm and 6 arm
PMMA-b-PAA polymers having molecular weights as follows; 3 arm PMMA(MW:
5600 Da)-b-PtBA (MW: 22000 Da), 4 arm PMMA(MW: 4700 Da)-b-PtBA
(MW:27000 Da), 6 arm PMMA(MW: 8100 Da)-b-PtBA (MW:77000 Da, 45000 Da and
18000 Da).
Figure 5.16. GPC profiles of 3 arm PMMA macroinitiator and the 3 arm star PMMA-b-PtBA copolymer having molecular weights of 5600 Da and 22000Da.

53
Figure 5.17. GPC profiles of 4 arm PMMA macroinitiator and the 3 arm star PMMA-b-PtBA copolymer having molecular weights of 4700 Da and 27000 Da.
Figure 5.18. GPC profiles of 6 arm PMMA macroinitiator and the 3 arm star PMMA-b-PtBA copolymer having molecular weights of 8000 Da and 77000 Da.

54
Table 5.2. Reaction conditions and conversions of PMMA-b-PAA synthesis by 2 stage ATRP polymerization and hydrolysis reactions.
PMMA-b-PtBA 3.1 PMMA-b-PtBA 4.1 PMMA-b-PtBA 6.1
Initiator (Io) 1,3,5- (2-bromo-2-methyl propionate) benzene
Pentaerythritol tetrakis (2-Bromoisobutyrate)
Dipentaerythritol hexakis (2-Bromoisobutyrate)
Monomer MMA (10 ml) MMA (10 ml) MMA (10 ml) Mo/Io 750 1000 1500 Solvent Anisole (1:1 Vm/Vs) Anisole (1:1 Vm/Vs)* Anisole (1:1 Vm/Vs) Catalyst CuCl (3x Io) CuCl (4x Io) CuCl (6x Io) Ligand PMDETA (3x Io) PMDETA (4x Io) PMDETA (6x Io) Reaction T (ºC) 60 60 60 Reaction time (min) 12 12 12 MW (Da) 5600 4700 8100 Da PI 1.09 1.14 1.15 Weight of product (gr) 0.25 0.34 0.32 Cp (%) 2.0 2.9 2.6
Initiator (Iı) 3- arm PMMA-Br (MW 5600 Da)
4 arm PMMA-Br (MW 4700)
6- arm PMMA-Br (MW 8100)
Monomer 4 ml tBA 4 ml tBA 5 ml tBA
Solvent Anisole (1:1 Vm/Vs) Anisole (1:1 Vm/Vs) Anisole (1:1 Vm/Vs) Mo/Iı 1500 2500 3000 Catalyst CuBr (3.3x Iı) CuBr (4.4x Iı) CuBr (6.6x Iı) Ligand PMDETA (33x Iı) PMDETA (44x Iı) PMDETA (66x Iı) Reaction T (ºC) 90ºC 90ºC 90ºC Reaction time (h) 5 6 17 MW (Da) 22000 27000 770008000 PI 1.22 1.16 1.83 Weight of product (gr) 0.44 0.44 0.78 Weight of product after hydrolysis (gr) 0.22 0.25 0.41
Cp (%) 10.0 11.0 24.0 Ch (%) 62.0 80.0 84.0
100% ×−
=m
ipp w
wwC (5.1)
100% ×−
−
==−−
−−
tBA
PMMAPtBAbPMMA
AA
PMMAPAAbPMMA
tBA
AAh
MWww
MWww
nnC (5.2)

55
where Cp is molar conversion of polymerization, Ch is molar conversion of hydrolysis
reaction, wp is net weight of polymer synthesized, wi is weight of initiator used and wm
is the initial weight of monomer incorporated in Equation 5.1. In Equation 5.2., nAA is
number of moles of acrylic acid produced and ntBA is number of moles of tBA that
reacted with TFAA during the hydrolysis reaction.
Chemical structure of the synthesized PMMA-b-PtBA block copolymers were
investigated by 1H-NMR. 1H-NMR spectrum of PMMA-b-PtBA is δ: 1.4 ppm (9H,
COOC(CH3)3), 1.7 ppm (2H, CH2 of PMMA and PtBA), 2.4 ppm (H, CH of PtBA), 3.6
ppm (3H, COOCH3 of PMMA), 6.9 ppm (9H, COOC(CH3)3 of tBA), 7.25 ppm (s; H,
CHCl3) (Malinowska et al., 2005; Ishizu et al., 2005; Nurmi et al., 2007). CH2 It was
observed that residual tBA monomer remained besides specific peaks of PMMA and
PtBA blocks in 1H-NMR spectra of copolymers given by Figures 5.22-5.24.
Multiarm PMMA-b-PAA molecules were produced by hydrolysis reaction
(Figure 5.25). The residual monomer observed in 1H-NMR analysis of PMMA-b-PtBA
was eliminated during hydrolysis reaction since the polymer was reacted with
trifluoroacetic acid in dichloromethane. Amphiphilic PMMA-b-PAA copolymer
produces a solid precipitate which separates from reaction medium. 1H and 13C-NMR
analysis showed that monomer residue was eliminated through hydrolysis reaction
(Figure 5.26).

56
CuBr, PMDETA (Anisole, 90°C) tBA
CH2 C
CO
O
O O
O
Br
O O C H2C
OCH3
CH3
n
CH2 C
CO
Br
CH3
n
OCH3
Br
n
CH3
CO
OCH3
CH2 C
CO
O
O O
O
O O C CH2
OCH3
CH3
n
CH2 C
CO
Br
CH3
n
OCH3
Br
n
CH3
CO
OCH3
CH CH2
m CO
OtBu
CH2 CH
CO m
OtBu
Br CH2 CH
CO m
OtBu
Figure 5.19. ATRP synthesis of 3 arm PMMA-b-PtBA from 3 arm PMMA macroinitiator.

57
OCH3
O
O
OO
O
O
O
O
CH2 C
CO
Br
CH3
n OCH3
C CH2
n
CH3
CO
OCH3
Br
C CH2
n
CH3
CO
Br
OCH3
CH2 C
CO
Br
CH3
n
CuBr, PMDETA (Anisole, 90°C) tBA
Br CH2 CH
CO m
OtBu
OC n
OCH3
Br CH2 CH
CO
m
OtBu
CO
OCH3
CH3
CH2 C
CH CH2
m CO
OtBu
CH CH2
m CO
OtBu
Br
Br
O
CH2 C
CH3
O
CH3
OCH3
CO
C CH2
n
O
O
C CH2
CH3
CO
OCH3
O
O
O
O
n
Figure 5.20. ATRP synthesis of 4 arm PMMA-b-PtBA from 4 arm PMMA macroinitiator.

58
OCH3
O
OCH3
CH2 C
CO
Br
CH3
n
O
OO
O
OO O
O
O O
O
O
CH2 C
CO
Br
CH3
n OCH3
C CH2
n
CH3
CO
OCH3
Br
C CH2
n
CH3
CO
Br
CH3
OCH3
CH2 C
CO
Br
CH3
n
OCH3
CH2 C
CO
Br
n
CuBr, PMDETA (Anisole, 90°C) tBA
OtBu
Br CH2 CH
CO m
OtBu Br
CO m
CO n
OCH3
OtBu
Br CH2 CH
CO
m
Br CH2 CH
CO m
OtBu
CO
OCH3
CH3
CH2 C
CH2 CH
CO
OCH3
CH CH2
m CO
OtBu
CH CH2
m CO
OtBu
Br
Br
O
OCH3
CH2 C
CO
CH3
n
O
OO
O
OO O
O
O O
O
O
n
C CH2
n
CH3
CO
OCH3
C CH2
n
CH3
CO
CH3
OCH3
CH2 C
CH3
CH2 C
n
Figure 5.21. ATRP synthesis of 6 arm PMMA-b-PtBA from 6 arm PMMA macroinitiator.

59
O
O O
O
O O
n
ab
c
O O
n
O O
O
nO
m
e
d
O O
b
d O
m
a b
c
d
e
CdCl3
tBA
Figure 5.22. 1H-NMR spectrum of 3 arm PMMA-b-PtBA.
8 7 6 5 4 3 2 1 0 ppm
Br Br
Br
d
O O
m
O

60
a
b
c
d
e
CdCl3
tBA
Figure 5.23. 1H-NMR spectrum of 4 arm PMMA-b-PtBA.
8 7 6 5 4 3 2 1 0 ppm
O
O O
O O
O
O
O
n
Br
O O
O
n
ab
c
O O
m
e
d
O O
b
d d
Br
O O
Br
O
O O
m
m n
n O O
Br
O
m
O

61
Br
O
O
O O
O
O O O
O
O O
O
O
n
n
n
m
Br
b
OO
n
OO
n
a O
O
O
O
O
O
O O
OO
m
O O
O
c
nO
OO
b
dd
O
O
m
O
m
d
a
b
d
e
c
CdCl3
tBA
Figure 5.24. 1H-NMR spectrum of 6 arm PMMA-PtBA.
8 7 6 5 4 3 2 1 0 ppm
Br
Br m
Br
Br
O
e

62
Figure 5.25. Chemical structure of 4 arm PMMA-b-PAA synthesized by hydrolysis of 4 arm PMMA-b-PtBA.
Peaks of H groups and C atoms of PMMA and PAA chains of 4 arm PMMA-b-
PAA labeled on NMR spectra given in Figure 5.26 have been defined on molecular
structure depicted in Figure 5.25. CH2 groups of hydrophobic PMMA and hydrophilic
PAA labeled with the letter ‘b’ appeared as two distinct peaks about 1.6 and 1.8 ppm. 1H-NMR spectrum given in 5.25-a showed that CH3 peak belonging to tBA almost
disappeared after hydrolysis. 13C-NMR spectrum explains the structure of amphiphilic molecule more clearly.
C peak of CH3 groups from both PtBA and residual tBA are not observed as in Figure
5.26.b. The only unexpected peak that was not consistent with molecular structure of
PMMA-b-PAA copolymer was the peak observed at 159 ppm. This peak indicates
presence of (-COOC-) structure due to crosslinking of acrylic acid chains. Since the
peak is small degree of crosslinking is expected to be low and can be more accurately
determined by FTIR analysis.
Br m
CH2 CH
OC
OH
OC n
OCH3
Br CH2 CH
CO
m
OH
CO
OCH3
CH3
CH2 C
CH CH2 m CO
OH
CH CH2
m CO
OH
Br
Br
O
CH2 C
CH3
O
CH3
OCH3
CO
C CH2
n
O
O
C CH2
CH3
CO
OCH3
O
O
O
O
n
g
b
a
b
c
n
g
d f

63
(a)
(b)
Figure 5.26. (a) 1H-NMR spectrum of 4 arm PMMA-b-PAA (b) 13C-NMR spectrum of 6 arm PMMA-b-PAA.
DCM

64
Efficiency of hydrolysis reaction was also examined by FTIR spectra of block
copolymers before and after hydrolysis (Figure 5.27-5.29). Peaks of each sample were
investigated and named with repect to Table 5.3 (Silverstein et al., 2005; Storey et al.,
2005; Ishizu et al., 2005; Wei et al., 2007; Yu et al., 2007; Kang et al., 2006; Yu et al,
2004; Yin et al., 2006)
0
0.5
1
1.5
2
2.5
3
3.5
050010001500200025003000350040004500
Wavenumber (cm-1)
A
Figure 5.27. FTIR spectra of (a) 3 arm PMMA-b-PtBA with 5600 Da PMMA core and
total molecular weight of 22000 Da, (b) 3 arm PMMA-b-PAA produced by hydrolysis.
0
0.5
1
1.5
2
2.5
3
3.5
01000200030004000
Wavenumber (cm-1)
A
Figure 5.28. FTIR spectra of (a) 4 arm PMMA-b-PtBA with 7000 Da PMMA core and total molecular weight of 30000 Da, (b) 4 arm PMMA-b-PAA produced by hydrolysis.
(a)
(b)
(a)
(b)

65
0
0.5
1
1.5
2
2.5
3
050010001500200025003000350040004500
Wavenumber (cm-1)
A
Figure 5.29. FTIR spectra of (a) 6 arm PMMA-b-PtBA with 8100 Da PMMA core and total molecular weight of 77000 Da, (b) 6 arm PMMA-b-PAA produced by hydrolysis.
Table 5.3. Specific FTIR peaks related to PMMA-b-PtBA copolymers.
Wavenumber (cm-1) Band Monomer
752 CH vibration of C-CH3 Methyl methacrylate 990 CH vibration of O-CH3 Methyl methacrylate 1150 C-O stretching tert-Butyl acrylate 1168 COO ester stretching Acrylic acid 1260 C-O stretching Acrylic acid 1400 Stretching vibration of C(CH3)3 tert-Butyl acrylate 1440-1460 Symmetric stretching of COO- Acrylic acid 1570 Asymmetric stretching of COO- Acrylic acid 1715 Carboxyl peak Acrylic acid 1730 C=O stretching All acrylic monomers 2800-3200 OH Acrylic acid
2925 C-H asymmetric stretching of methyl groups tert-Butyl acrylate
(a)
(b)

66
5.3. Maximum Loading Capacity
Maximum loading capacities of seven polymers were compared to select the
ideal hydrophobic drug carrier. In that manner number of arms, total molecular weights
and hydrophobic core ratios were the main issues for comparison. Table 5.4 gives a list
of seven block copolymers synthesized with different number of arms, molecular
weights and hydrophobic core ratios.
In order to determine maximum loading capacities, pyrene was used as
fluorescent probe and pyrene loading capacity of polymer samples were determined by
fluorescent method. Pyrene is a highly hydrophobic substance whose chemical structure
is as in Figure 5.30 and is used as an indicator for loading capacity of polymers with
hydrophobic drugs.
Figure 5.30. Chemical structure of pyrene.
Table 5.4. List of polymers compared for maximum loading capacity.
Sample Number of Arms
MW of PMMA core (Da)
MW of PMMA-b-PtBA form (Da)
Hydrophobic Core Ratio (%)
PMMA-b-PAA 3.1 3 5600 22000 25.2 PMMA-b-PAA 4.1 4 4700 27000 17.4 PMMA-b-PAA 4.2 4 7000 30000 23.3 PMMA-b-PAA 4.3 4 7000 17000 41.2 PMMA-b-PAA 6.1 6 8000 77000 10.1 PMMA-b-PAA 6.2 6 8000 45000 18.0 PMMA-b-PAA 6.3 6 8000 18000 46.0
Determination of maximum loading capacity was performed by loading certain
concentrations of polymer samples by various pyrene concentrations in aqueous
medium. After elimination of unloaded quantity of pyrene by centrifugation, loading
capacity was determined from fluorescence emission intensity of pyrene at 393 nm.
Loading capacities were determined at two polymer concentrations which were 500
mg/L and 200 mg/L.

67
A sample graph for change in emission intensities of 4 arm PMMA-b-PAA with
4700 Da PMMA core and 27000 Da total molecular weight at different pyrene
concentrations excited at 330 nm is given in Figure 5.31. Figures 5.32 and 5.33 show
the variations of emission intensities (at 393 nm) of 3 arm, 4 arm and 6 arm PMMA-b-
PAA samples with respect to pyrene concentration at a polymer concentration of 500
mg/L. Maximum loading capacity is observed to increase with increasing hydrophobic
core ratio. 4 arm and 6 arm PMMA-b-PAA samples exhibit better loading capacities
when compared to 3 arm PMMA-b-PAA.
0
20
40
60
80
100
120
140
160
180
340 360 380 400 420 440 460
Emission Wavelength (nm)
I (R
FU)
2.5 E-7 M5.0 E-7 M7.5 E-7 M10.0 E-7 M12.5 E-7 M15.0 E-7 M17.5 E-7 M20.0 E-7 M22.5 E-7 M25.0 E-7 M30.0 E-7 M
Figure 5.31. Emission spectra of PMMA-b-PAA 4.1 loaded at different pyrene
concentrations designated in different colors.

68
050
100150200250300350
0 5 10 15 20 25 30 35
Pyrene concentration (10-7 M)
I 393
(RFU
)
PMMA-b-PAA 4.3 PMMA-b-PAA 4.2PMMA-b-PAA 4.1 PMMA-b-PAA 3.1blank
Figure 5.32. Variation of emission intensities of 3 arm and 4 arm PMMA-b-PAA
samples loaded at 500 mg/L polymer concentration with respect to pyrene concentration.
050
100150200250300350400
0 5 10 15 20 25 30 35Pyrene concentration (10-7 M)
I 393
(RFU
)
PMMA-b-PAA 6.3 PMMA-b-PAA 6.2PMMA-b-PAA 6.1 blank
Figure 5.33. Variation of emission intensities of 6 arm PMMA-b-PAA samples loaded at 500 mg/L polymer concentration with respect to pyrene concentration.
Figures 5.34 and 5.35 show the variations of emission intensities (at 393 nm) of
3 arm, 4 arm and 6 arm PMMA-b-PAA samples with respect to pyrene concentration at
a polymer concentration of 200 mg/L. Maximum loading capacities of 3 arm, 4 arm and
6 arm PMMA-b-PAA samples at both concentrations of 500 mg/L and 200 mg/L are
listed in Table 5.5. Maximum loading capacities in terms of emission intensity at 393
nm given in relative fluorescence units were achieved at and above pyrene
concentrations of 20 ×10-7 M.

69
020406080
100120140160
0 5 10 15 20 25 30 35
Pyrene concentration (10-7 M)
I 393
(RFU
)
PMMA-b-PAA 4.3 PMMA-b-PAA 4.2PMMA-b-PAA 4.1 PMMA-b-PAA 3.1blank
Figure 5.34. Variation of emission intensities of 3 arm and 4 arm PMMA-b-PAA
samples loaded at 200 mg/L polymer concentration with respect to pyrene concentration.
0
20
40
60
80
100
120
140
0 5 10 15 20 25 30 35Pyrene concentration (10-7 M)
I 393
(RFU
)
PMMA-b-PAA 6.3 PMMA-b-PAA 6.2PMMA-b-PAA 6.1 blank
Figure 5.35. Variation of emission intensities of 6 arm PMMA-b-PAA samples loaded at 200 mg/L polymer concentration with respect to pyrene concentration.
Table 5.5 shows that highest loading capacities were attained by highest
hydrophobic core ratios at 500 mg/L polymer concentration. 4 arm and 6 arm PMMA-
b-PAA samples with similar hydrophobic core ratios exhibit comparable maximum
loading capacities at that polymer concentration. But when system is diluted to a 200
mg/L polymer concentrations, it was observed that maximum loading capacities of 4-
arm PMMA-b-PAA were higher than that of 6 arm PMMA-b-PAA with similar
hydrophobic core ratios.

70
At lower polymer concentration it was also observed that hydrophobic core ratio
is not the only criteria that improves maximum loading capacity. At relatively dilute
systems importance of stability of the polymer emerges. Although hydrophobic core
ratio determines the loading capacity of the polymer, it reduces the stability of the
polymer when it exceeds an optimum value. Therefore an ideal multiarm PMMA-b-
PAA to be used as an hydrophobic drug carrier is estimated to have 4 arms and a a
hydrophobic core ratio about 0.25.
Table 5.5. Maximum loading capacities of 3 arm, 4 arm and 6 arm PMMA-b-PAA
samples loaded at different polymer concentrations.
Sample
MWPMMA /
MWPMMA-b-PAA (Da)
Max. Loading Capacity
(500 mg/L) (I 393)
Max. Loading Capacity
(200 mg/L) (I 393)
fc
PMMA-b-PAA 3.1 5600/22000 154.11 60.56 0.26 PMMA-b-PAA 4.1 4700/27000 150.43 59.05 0.17 PMMA-b-PAA 4.2 7000/30000 216.97 139.54 0.23 PMMA-b-PAA 4.3 7000/17000 301.80 132.12 0.41 PMMA-b-PAA 6.1 8100/77000 106.825 53.84 0.11 PMMA-b-PAA 6.2 8100/45000 198.53 53.09 0.18 PMMA-b-PAA 6.3 8100/18000 344.41 117.30 0.45
5.4. Critical Micelle Concentration
Critical micelle concentration is a very important characteristics of micelle
forming polymers for drug transportation systems. Critical micelle concentration is a
minimum concentration that polymer forms a micelle and is able to carry a hydrophobic
drug in aqueous medium and are generally determined by pyrene fluorescence methods.
Critical micelle concentrations (CMC) of PMMA-b-PAA samples loaded with pyrene at
different polymer concentrations could have been analyzed by evaluation of both
emission and excitation spectra. Emission spectra were obtained for an excitation
wavelength of 330 nm, and excitation spectra were obtained for an emission wavelength
of 393 nm. Variation of excitation spectra for a pyrene loaded 4 arm PMMA-b-PAA
sample with 5000 Da PMMA and 45000 Da total molecular weight with respect to
polymer concentration is shown in Figure 5.36. Pyrene loading was performed by
mixing polymer solutions at different concentrations with constant amount of pyrene at

71
4°C for 16 hours. Emission intensities (393 nm) of the samples were followed during
loading to make sure equilibrium is reached within 16 hours. Pyrene concentration was
2×10⁻⁷ M to prevent excimer formation which leads erroneous results in fluorescence
measurements.
05
1015202530354045
290 310 330 350 370
Excitation Wavelength (nm)
I (R
FU)
0.015mg/L0.5 mg/L
5 mg/L
50 mg/L
100 mg/L
500 mg/L
Figure 5.36. Excitation spectra of pyrene loaded 4 arm PMMA-b-PAA samples (MW:
5000/45000 Da) at polymer concentrations designated in different colors.
Critical micelle concentrations were determined from changes in I336/I333 ratio
with increasing polymer concentrations as in method given by Lele and coworkers (Lele
et al., 2002) The blue shift in I336 band of excitation spectra of pyrene indicates the
change in excitation behavior of the probe due to loading. Figure 5.37 shows this
change in I336/I333 ratio for 4 arm PMMA-b-PAA sample (MW: 5000/45000 Da). CMC
is accepted to be the polymer concentration where initial constant I336/I333 line intersects
the increasing slope emerged due to loading. Sketches of I336/I333 ratio versus polymer
concentration of other PMMA-b-PtBA samples that were investigated for comparison
are given in Appendix A.

72
1
1.1
1.2
1.3
1.4
0.01 0.1 1 10 100 1000 10000
Polymer concentration (mg/L)
I 336
/I33
3
Figure 5.37. Determination of CMC from shifts in I336 band in excitation spectra (n=2).
0.6
0.7
0.8
0.9
1
1.1
1.2
0.01 0.1 1 10 100 1000 10000
Polymer Concentration (mg/L)
I 1/I
3
Figure 5.38. Determination of CMC from I1/I3 ratios in emission spectra (n=2).
CMC of the 4 arm PMMA-b-PAA sample has also been determined from the
ratio of first and third emission bands (I1/I3) versus polymer concentration in mg/L as in
Figure 5.38. Intensities of the first and third bands of pyrene correspond to fluorescence
emissions at 372 nm and 385 nm wavelengths (LópezDíaz and Velázquez, 2007; Zhang
et al., 2007; Aguiar et al., 2003). Distinct I1 and I3 bands were observed more clearly as
in Figure 5.39 when pyrene was dissolved in chloroform. The drop in I1/I3 ratio
designates a change in pyrene’s location due to loading and CMC is supposed to be
intersection of horizontal and steep slopes of initial constant and increasing I1/I3 values
on non-logarithmic scale.

73
0
1
2
3
4
5
300 350 400 450 500 550 600
nm
RFU
Figure 5.39. I1 and I3 bands at 372 nm and 385 nm on emission spectrum of pyrene in
chloroform (excited at 330 nm). As a final approach, pyrene loaded PMMA-b-PAA sample was analyzed by UV-
spectrophotometry and absorbance spectra of pyrene solubilized by certain
concentrations of polymer were measured. Change in absorbance spectra increasing
with polymer concentration was observed as in Figure 5.40. An increase in UV-
absorbance at 266 was observed after 10 mg/L polymer concentration on Figure 5.41
which verifies CMC obtained by fluorescence spectroscopy.
Figure 5.40. UV-Absorbance spectra of pyrene loaded 4 arm PMMA-b-PAA samples
(MW: 5000/45000 Da) at polymer concentrations designated in different colors.

74
0
0.05
0.1
0.15
0.2
0.01 0.1 1 10 100 1000 10000
Polymer concentration (mg/L)
A26
6
Figure 5.41. Determination of CMC from change in UV-absorbance A266 with respect to
polymer concentration (n=2).
Comparison of CMC values listed in Table 5.6 suggests that a hydrophobic core
ratio at 0.25 provides improved stability indicated by minimum critical micelle
concentrations. Another characteristics that affect stability in terms of CMC is
molecular weight. It was observed that increasing molecular weight of block copolymer
increases stability but it has to be reminded that increased molecular weights reduce
loading capacity of multiarm PMMA-b-PAA copolymers and increased molecular
weight of PMMA core would prevent degradation of polymer particles.
Table 5.6. Critical micelle concentrations of 3 arm, 4 arm and 6 arm PMMA-b-PAA samples having various molecular weight and hydrophobic core ratios.
Sample
MWPMMA / MWPMMA-b-PAA
(Da)
CMC
(mg/L)
fc
PMMA-b-PAA 3.1 5600/22000 5 0.26 PMMA-b-PAA 4.1 4700/27000 10 0.17 PMMA-b-PAA 4.2 7000/30000 5 0.23 PMMA-b-PAA 4.4 6400/33000 10 0.19 PMMA-b-PAA 4.5 5000/45000 10 0.11 PMMA-b-PAA 6.1 8100/77000 10 0.11 PMMA-b-PAA 6.2 8100/45000 20 0.18

75
5.5. Drug Loading
5.5.1 Determination of Optimum Drug Loading Method
Drug loading methods were listed as simple equilibrium, co-precipitation,
dialysis, solvent deposition and salting out methods which have been described in
Chapter 2.2. PMMA-b-PAA copolymers cannot form micelles by direct mixing with
water. A micellization technique has to be applied during loading which follows
dissolution of drug and polymer samples in appropriate solvents. Polymer samples can
be dissolved in ethanol and dimethyl sulfoxide with slight heating while dimethyl
formamide readily dissolves the polymer. After dissolution of polymer and drug, they
have to be mixed at definite loading conditions that consist of type of loading medium,
polymer and drug concentrations, temperature and duration of the process. Before an
analysis of effectiveness of those parameters, the most efficient loading technique has to
be determined.
Model drug used for selection of loading method was indomethacin.
Indomethacin is an anti-enflammatory drug that is slightly soluble in aqueous medium.
The chemical structure is shown in Figure 5.42.
Figure 5.42. Chemical structure of indomethacin.
In order to make a comparison among loading methods listed above,
indomethacin was loaded to 4 arm PMMA-b-PAA (MW: 7000/30000 Da) which has
exhibited the highest maximum loading capacity with pyrene at a polymer concentration
H3C O CH2COOH
CH3
C O
N
Cl

76
of 200 mg/L. Reaction conditions and conversions of 4 arm PMMA-b-PAA (MW:
7000/30000 Da) synthesis are given in Table 5.7 for information.
Co-precipitation is not a suitable method for loading acrylic block copolymers
for an appropriate nonsolvent, like diethyl ether for PEG derivatives (Djordevic et al.
2003), does not exist. Therefore PMMA-b-PAA samples were loaded by other three
techniques and drug loading efficiencies were determined by UV-spectrophotometer.
Table 5.7. Reaction conditions and conversions of synthesis and hydrolysis reactions of 4 arm PMMA-b-PAA (7000/30000).
4 arm PMMA-Br 4 arm PMMA-b-
PtBA 4- arm PMMA-PAA
Initiator (I) Pentaerythritol tetrakis (2-Bromoisobutyrate)
4 arm PMMA-Br (MW 7000 Da)
Reactants: Trifluoro acetic acid + 4 arm PMMA-b-PtBA
Mo/I 1000 2300 - Solvent Anisole (1:1 Vm/Vs)* Anisole (1:1 Vm/Vs)* Dichloromethane Catalyst CuCl (4×I) CuBr (4.4×I) - Ligand PMDETA (4×I) PMDETA (40×I) - Reaction Temperature 70ºC 90ºC 25ºC Reaction time 10 min 12 hours 24 hours MW experimental 7000 Da (PI: 1.135) 30000 Da (PI: 1.12) - Molar Conversion 3.75 % 14.15 % 91.7 % Weight of product 0.42 gr 1.014 gr 0.638 gr
*Volumetric solvent to monomer ratio.
For loading 4 arm PMMA-b-PAA samples with indomethacin by dialysis
method both polymer and drug was dissolved in dimethylformamide and excess drug
was eliminated by dialysis in 24 hours. Loading was carried for 1 hour for each sample
at room temperature or at 4°C. Samples were freeze dried after dialysis and drug content
of each sample was measured by UV-spectroscopy. Absorbance of sample at 320 nm
was compared to calibration curve of indomethacin given in Figure 5.43. Drug content
of loaded micelle solutions were calculated by using Equation 5.4 that was obtained
from regression formula given by Figure 5.42 (MWindomethacin=357.8).

77
y = 0.6461xR2 = 0.9895
00.1
0.20.30.4
0.50.6
0.70.8
0 0.2 0.4 0.6 0.8 1
C (10-4 M)
A32
0
Figure 5.43. Calibration curve of indomethacin dissolved in dimethylformamide.
Cindomethacin (mg/ml) = 0.055 × A320 (5.4)
Dialysis method not only yields high drug loading efficiencies but also provides
micellization of freeze dried samples of drug loaded PMMA-b-PAA. Drug loaded
samples were easily dissolved and formed stable dispersions when introduced to
aqueous medium. When Table 5.8 was examined, it was also observed that dialysis
method yielded superior drug contents compared to salting out and solvent deposition
methods.
Table 5.8. Drug loading performances of dialysis, salting out and solvent deposition methods.
Method
Solvent (Polymer/Drug)
Sample Amount (Polymer/Drug)
(mg)
Temperature
(°C)
Loading Efficiency
(%)
Dialysis DMF / DMF 10 /10 25 13.4
Dialysis DMF / DMF 10 /10 4 20.6
Dialysis DMF / DMF 50 / 50 4 24.8
Salting Out Water 50 / 50 25 2.5
Salting Out PBS 50 / 50 25 5.5 Solvent
Deposition EtOH / DMF 10 /10 25 4.7

78
Characterization of indomethacin loaded 4 arm PMMA-b-PAA
(MW:7000/30000 Da) was achieved by FTIR and DSC analysis given by Figures 5.44
and 5.45. Comparison of FTIR spectra of loaded and unloaded polymer samples to that
of model drug indomethacin shows that drug is entrapped within polymer particles since
sharp peaks of indomethacin were repressed. However specific peaks of indomethacin
can be distinguished.
Figure 5.44. FTIR spectra of (a) indomethacin, (b) indomethacin loaded 4 arm PMMA-
b-PAA.and (c) neat polymer.
Figure 5.45. DSC thermograms of (a) neat polymer and (b) indomethacin loaded 4 arm
PMMA-b-PAA.
0 50 100 150 200 250 300
Temperature (oC)
Hea
t Flo
w (m
W)
Temperature (ºC)
(a)
(b)
Hea
t Flo
w (m
W)
←E
ndo
Exo→
050010001500200025003000350040004500
Wavenumber (cm-1)
A
(a)
(c)
(b)
Wavenumber (cm-1)
A (A
rbitr
ary
units
)

79
Such high loading efficiencies may indicate strong electrostatic interactions
between polymer and drug, which is expected to affect thermal stability of polymer.
Eerikäinen reports interaction of an acidic anti-inflammatory drug with methacrylates
emphasizing the interactions between drug and polymer in forms of hydrogen bonds
and electrostatic forces (Eerikäinen et al., 2004). These interactions may increase glass
transition, melting and even degradation temperatures of the original polymer increasing
thermal stability of the polymer.
An interaction has been observed with DSC thermograms of our neat and drug
loaded 4 arm PMMA-b-PAA samples given in Figure 5.45. Afterwards loading, Tg of 4
arm PMMA-b-PAA increased from 55 ºC to 75ºC and Tm of PMMA core increased
from 130ºC to 145ºC which designates a strong interaction between hydrophobic
PMMA core and indomethacin. The third peak at 228ºC observed at neat polymers DSC
thermogram belongs to PAA which was expected to melt above 200ºC. Hence Tm of
PAA was also improved through loading for the onset of melting could not be observed
until 250ºC.
After approval of dialysis method as the most efficient drug loading method, the
same procedure was repeated with anticancer drug 5 Fluorouracyl (5FU). But loading
efficiency was very poor (less than 1 %) with both 4 arm and 6 arm PMMA-b-PAA
samples having hydrophobic core ratios changing from 0.10 to 0.25. That may have
arose from smaller molecular weight, or weaker electrostatic interactions related to
chemical structure of 5FU shown in Figure 5.46. It was obvious that loading conditions
had to be optimized for acceptable loading contents in terms of duration, temperature
and composition of loading medium.
Figure 5.46. Chemical structure of 5 Fluorouracil or 5 Fluoro-2,4-pyrimidinedione.
HN
N
H
O
O
F

80
y = 0.0079xR2 = 0.9987
0.00.10.20.30.40.50.60.70.80.9
0 20 40 60 80 100 120
C (10 -6 M)
A26
6
Figure 5.47. Calibration curve of 5FU dissolved in PBS (n=3).
C5FU (mg/ml) = 0.0165 × A266 (5.5)
Calibration curve and equation used for determination of drug concentration in
dialysis medium are given by Figure 5.47 and Equation 5.5. Drug loading contents of
loaded polymer samples have been determined from analysis of dialysis media and
subtraction of removed amount of drug from initial quantity introduced.
5.5.2 Determination of Optimum Duration of 5FU Loading
Loading interval is an important parameter that has to be optimized considering
other conditions such as mixing rate, temperature and composition of loading medium.
For monitoring loading efficiency versus time a 6 arm PMMA-b-PAA
(MW:5700/34000 Da, HCR:0.17) sample was used. In order to determine interval of
loading to reach equilibrium, equal quantities of drug and polymer solutions were
mixed in distilled water with a concentration of 500 mg/L at room temperature. In
certain time intervals a sample of specific volume was taken from solution, dialyzed
against water and freeze dried. After weighing dry samples, drug content was
determined by UV-spectroscopy. Drug loading contents versus sampling intervals were
tabulated in Table 5.9.

81
Table 5.9. Drug Loading Content (DLC, %) with changing loading time for 5FU loaded 6 arm PMMA-b-PAA (MW:5700/34000 Da) at 25°C and 500 mg/L polymer concentration. Loading medium is distilled water.
Time of Loading
(min)
Weight Released
(mg)
Loaded Weight
(mg)
Sample Weight
(mg)
DLC (%)
5 2.2511 0.2489 2.6 9.96 10 2.2682 0.2318 2.8 9.26 20 2.3032 0.1968 3.1 7.87 30 2.200 0.3000 1.9 12.00 40 2.2483 0.2517 1.9 10.07 50 2.2302 0.2698 2.6 10.79 60 2.1717 0.3283 2.4 13.13 80 2.1258 0.3742 2.7 14.97
105 2.1554 0.3446 2.9 13.78 120 2.0241 0.4759 3.0 19.04 150 2.1158 0.3842 3.0 15.37 185 2.1460 0.354 2.4 14.16 220 2.1300 0.3700 1.4 14.8 260 2.1955 0.3045 2.8 12.8 300 2.0987 0.4013 2.6 16.05 360 1.8561 0.3439 1.9 17.5
TOTAL 34.93 5.07 40.00 12.7
Variation of drug loading contents versus time of loading in distilled water at
25°C is shown in Figure 5.48, too. It can be suggested that loading performance reaches
its maximum efficiency in 120 minutes and remains about the equilibrium value.
Therefore further investigations to optimize loading conditions were performed with 4
hours of loading intervals at room temperatures.
The samples taken from polymer and drug solution prepared for the experiment
to determine optimum loading interval were purified from excess drug by dialysis as
mentioned before. Amount of excess drug was determined from UV-absorbance of
dialysis media that has been refreshed every one hour until all excess drug was removed
from samples. In order to optimize interval of dialysis for removal of excess drug, 5FU
concentration of portions of dialysis medium were monitored. Figure 5.49 displays
instantaneous amounts of drug removed by dialysis and measured every hour and total
amount of drug released from polymer sample loaded for 120 minutes at 25°C and 500
mg/L polymer concentration. It was estimated that at least 10 hours of dialysis was
required to remove excess drug completely from loaded particles.

82
02468
101214161820
0 100 200 300 400
Loading Interval (min)
DL
C (%
)
Figure 5.48. Variation of DLC versus time of 5FU loading for 6 arm PMMA-b-PAA
(MW:5700/34000 Da) at 25°C and 500 mg/L polymer concentration.
0.00
0.05
0.10
0.15
0.20
0.25
0.30
10 60 110 160 210 260 310 360 410 460 510 560 610
Time (min)
Wei
ght
(mg)
0.00
0.50
1.00
1.50
2.00
2.50
Tot
al W
eigh
t (m
g)
Figure 5.49. Instantaneous amounts of drug released within each 1 hour interval of
dialysis (•) and total (cumulative) amount of drug removed within corresponding time interval of dialysis (•).

83
5.5.3 Selection of Ideal Medium for 5FU Loading
For an efficient loading both polymer and drug has to be completely dissolved
prior to mixing. Polymer samples were dissolved in ethanol and drug samples were
dissolved in dimethyl formamide, which was a perfect solvent both for indomethacin
and 5FU, for all loading experiments reported up to now. To select the ideal
composition of loading medium, polymer samples were again dissolved in ethanol and
drug samples were dissolved in the solvent investigated, at least for the experiments
carried at 25°C. Solvents that were used as loading medium for the comparison of their
performances in terms of drug loading content were water, ethanol, 1% acetic acid,
dimethyl sulfoxide and dimethyl formamide. Initial polymer and drug concentrations
were 5000 mg/L. The results are tabulated in Table 5.10 stating that 1%acetic acid and
dimethyl formamide are the best loading media for 5FU loading to PMMA-b-PAA
copolymers. Yield of loading is very low in ethanol and water since 5FU is slightly
soluble in water and almost insoluble in ethanol.
Table 5.10. Loading performance of 6 arm PMMA-b-PAA (MW: 5700/34000) at various loading conditions.
Drug/Polymer/Solvent
(mg/mg/ml) Temperature
(ºC) Time (h)
Medium (Solvent)
DLC (%)
10/10/2 25 4 Water 3.6 10/10/2 25 4 Ethanol <1 10/10/2 25 4 1% Acetic acid 8.0 10/10/2 25 4 DMSO 4.7 10/10/2 25 4 DMF 7.3 10/10/2 15 4 Water 16.9 10/10/2 15 4 Ethanol 14.0 10/10/2 15 4 1% Acetic acid 17.5 10/10/2 15 4 DMSO 16.4 10/10/2 15 4 DMF 16.4 10/10/2 4 16 Water 20.0 10/10/2 4 16 Ethanol 10.1 10/10/2 4 16 1% Acetic acid 7.5 10/10/2 4 16 DMF 17.2
The experiment was repeated at 15°C and 4°C, too. Loading interval was kept 4
hours for 15°C and 16 hours for 4°C. Equilibrium was reached at shorter intervals
(between 4 and 12 hours depending on polymer concentration) at 4°C. Since stability of

84
polymer is permanent at that temperature loading intervals were preferred to be kept
elongated.
For the loading experiments performed at 15°C and 4°C, drug was dissolved in
little amount of DMF for loading experiments performed in water and ethanol.
Otherwise loading performance would be minute due to poor dissolution of drug in
water or ethanol. It was observed that failure of loading in water and ethanol was really
related to dissolution performance of drug since drug loading contents in various media
were comparable when drug was dissolved in appropriate solvent.
But incorporation of dimethylformamide is not desired for biomaterials designed
to be used for medical purposes. Hence, optimum drug loading medium was selected as
1% acid solution which could also be used for dissolution of drug. Optimum loading
temperature was obviously 15°C.
5.5.4 Determination of Optimum Polymer Concentration for Loading
Determination of optimum polymer concentration was achieved among three
concentrations which were 500 mg/L, 2000mg/L and 3500 mg/L. Both drug and
polymer sample was introduced into loading medium at the same quantities. In this
condition the drug was in excess amount, exceeding the required amount at a great
extent. However introduction of equal amounts of drug and polymer simplifies
evaluation of results since drug loading contents and drug loading efficiencies shall be
identical. Reducing initial amount of drug introduced into loading medium would
certainly increase drug loading efficiency and has to be optimized separately to prevent
reduction of drug loading contents.
An amphiphilic PMMA-b-PAA copolymer with 4 arms, hydrophobic core ratio
of 0.25 and molecular weight about 20000 Da has already been anticipated as an ideal
drug carrier for hydrophobic drugs considering the comparison of multiarm PMMA-b-
PAA samples in terms of maximum loading capacity and CMC. Therefore a polymer
sample, namely 4 arm PMMA-b-PAA (MW:4900/18000 HCR:0.27) has been
synthesized to determine optimum drug loading conditions. Reaction conditions and
conversions of three stage synthesis of the polymer sample is given by Table 5.11.

85
Table 5.11. Reaction conditions and conversions of synthesis and hydrolysis reactions of 4 arm PMMA-b-PAA (MW 4900/18000).
4 arm PMMA-Br 4 arm PMMA-b-
PtBA 4- arm PMMA-b-PAA
Initiator (I) Pentaerythritol tetrakis (2-Bromoisobutyrate)
4 arm PMMA-Br (MW 4900 Da)
Reactants: Trifluoro acetic acid + 4 arm PMMA-b-PtBA
Mo/I 1000 2300 - Solvent Anisole (1:1 Vm/Vs)* Anisole (1:1 Vm/Vs)* Dichloromethane Catalyst CuCl (4×I) CuBr (4.4×I) - Ligand PMDETA (4.4×I) PMDETA (40×I) - Reaction temperature
70ºC 90ºC 25ºC
Reaction time 12 min 4.5 hours 24 hours MW experimental 4900 Da (PI: 1.135) 18000 Da (PI: 1.104) - Molar Conversion %
3.8 % 11.2 % 29.6 %
Weight of product 0.43 gr 0.8 gr 0.3 gr *Volumetric solvent/ monomer ratio.
Previously optimized loading conditions were 4 hours of loading at 15°C for
dialysis method. Polymer samples were dissolved in small amounts of ethanol and drug
samples were dissolved in 1% HCl to provide dissolution of drug in acidic conditions
instead of toxic solvents. Hydrochloric acid was preferred for it is commonly used for
drug dissolution in pharmacology. Loading experiments were performed with two
replicates and drug loading contents were as given in Table 5.12. Concentration of
polymer is observed to be effective on drug loading content, but further increase in
polymer concentration after 2000 mg/L does not increase loading capacity significantly.
Table 5.12. Effect of polymer concentration on drug loading performed at 15 °C, 4
hours.
Polymer Conc. (mg/L)
Mass of Polymer
(mg)
Volume (ml) pH
Drug Loading Content
(%) 500 20.0 40.0 1.968 6.4 11.3
2000 20.0 10.0 1.431 13.6 20.6 3500 20.0 3.0 1.213 14.8 20.7

86
Polymer samples loaded at 2000 and 3500 mg/L polymer concentrations were
also loaded in acidic media since the drug was dissolved in 1% HCl. Loading medium
of 2000 mg/L polymer concentration was loaded in 0.15% HCl and 3500 mg/L polymer
concentration was loaded in 0.15% HCl (corresponding pH values were given in Table
5.12).
4 arm PMMA-b-PAA samples loaded at different polymer concentrations at
15°C and for 4 hours were analysed by FTIR to observe any change in chemical
structure due to drug loading. FTIR spectra shown in Figure 5.50 display that
characteristic peaks of 5FU (at 1726 and 1656 cm-1) (Gao et al., 2007) do not appear
significantly in loaded samples. That was expected since drug is proposed to be
entrapped in the hydrophobic core. But a change in structure of COO- appeared due to
chemical shift from symmetric to asymmetric bonds of C=O through loading (Ishizu et
al, 2005). Specific bands of symmetric and asymmetric C=O bonds of carboxyl groups
appear at wavenumbers of 1460 and 1570 cm-1, respectively. Ratio of asymmetric bond
that appear through interaction of carboxyl group with the acidic drug 5FU to
symmetric bond of C=O (A1570/A1460 ) is assumed a measure of loading. A1570/A1460
ratios listed in Table 5.13. shows that most efficient loading was performed in dimethyl
formamide. But loading in 1% acetic acid solution was comparable.
01000200030004000
Wavenumber (cm-1)
A (a
rbitr
ary
units
)
Figure 5.50. FTIR spectra of 4 arm PMMA-b-PAA (a) unloaded, (b) loaded at 500
mg/L polymer concentration, (c) loaded at 2000 mg/L polymer concentration, (d) loaded at 3500 mg/L polymer concentration for 4 h at 15°C and (e) FTIR spectrum of 5FU.
(a)
(b)
(c)
(d)
(e)

87
Table 5.13. Ratio of asymmetric(A1570)/symmetric(A1460) bonds of C=O of carboxyl groups of acrylic acid chains due to loading conditions of 4 arm PMMA-b-PAA (MW:4900/18000).
Loading
Conditions Loading
Medium* Polymer
Concentration A1460 A1570 A1570/A1460
Unloaded - - 0.494224 0.26019 0.526462 4 h, 15°C 1 % AA 5000 mg/L 0.944267 0.860732 0.911535 4 h, 15°C DMF 5000 mg/L 0.903261 0.906998 1.004137 4 h, 15°C 0.5 % HCl 3500 mg/L 1.192225 0.9119 0.764872 4 h, 15°C 0.15% HCl 2000 mg/L 1.120375 1.034097 0.922992 16 h, 4°C 0.15% HCl 2000 mg/L 1.410556 1.279316 0.906959 4 h, 15°C 0.05% HCl 500 mg/L 1.320948 1.025745 0.776522
*AA: Acetic Acid, DMF: Dimethyl Formamide, HCl: Hydrochloric Acid.
According to magnitude of change in chemical structure of carboxyl groups of
acrylic acid (A1570/A1460 ratios), 2000 mg/L seems to be the ideal polymer
concentration for 5FU loading into 4 arm PMMA-b-PAA samples with molecular
weight around 20000 Da and a hydrophobic core ratio of 0.25.
Differential scanning calorimeter thermograms of unloaded and loaded samples
were also compared (Figure 5.51). Thermograms show that due to interaction with 5FU
degradation temperature of 4 arm PMMA-b-PAA depicts a shift about 30°C.
Endothermic peaks of unloaded and loaded polymer samples are listed in Table 5.14.
Table 5.14. Endothermic peaks observed on DSC thermograms of the model drug,
unloaded and 5-FU loaded polymer samples at 15°C for 4 hours in aqueous medium.
Sample Peak 1 Peak 2 Peak 3 Peak 4
Polymer Unloaded 75 215 367 - Polymer loaded at 500 mg/L 74 227 388 444 Polymer loaded at 2000 mg/L 76 225 396 447 Polymer loaded at 3500 mg/L 74 226 396 449 Drug (5 FU) - 288 318 -

88
-10
-8
-6
-4
-2
0
2
0 100 200 300 400 500 600 700
T (ºC)
DSC
(mW
)←
End
o E
xo →
.
-25
-20
-15
-10
-5
0
0 100 200 300 400 500 600 700
T (ºC)
DSC
(mW
)←
End
o E
xo →
.
Figure 5.51. DSC thermograms of 4 arm PMMA-b-PAA (a) unloaded, (b) loaded at 500
mg/L polymer concentration, (c) loaded at 2000 mg/L polymer concentration, (d) loaded at 3500 mg/L polymer concentration and (e) of 5FU.
Differential Thermal Gravimetry and Thermal Gravimetric Analysis of loaded
and unloaded samples are shown in Figure 5.52. In DTG thermograms of loaded
samples any peak due to degradation of drug could not be detected at 288°C and 340°C.
Weight fractions after degradation shows that fraction of residue after degradation of
polymer increased with increasing polymer concentrations during loading. The drug
shows a distinct degradation at 350°C and at 18% of initial quantity remains at 600°C.
The difference in residue fractions of loaded polymer samples may have originated
from degradation of varying drug contents of the samples. Although we cannot make a
quantitative determination of drug contents of polymer samples from differences, it has
(a)
(b)
(c)
(d)
(e)

89
been obvious that loading efficiency has increased with increasing polymer and drug
concentrations of loading.
-3.00
-2.50
-2.00
-1.50
-1.00
-0.50
0.00
0.50
0 100 200 300 400 500 600 700
T (ºC)
DT
G (m
g/m
in)
0102030405060708090
100
0 100 200 300 400 500 600 700
T (ºC)
TG
A (%
)
P44-Loading conc:500 mg/L P44-Loading conc:2000 mg/LP44-Loading conc:3500 mg/L 5FU
Figure 5.52. Comparison of DTG and TGA thermograms of 4 arm PMMA-b-PAA (MW 4900/18000) loaded at different polymer concentrations with that of model drug (5FU).

90
5.6. Drug Release
Prior to achievement of drug release experiments certain assumptions related to
theory of drug release performed in a diffusion cell under continuous flow of fresh
buffer solution, and criterion involved by determination of released amount of drug
through UV-measurements has to be verified by experimental methods. The first
prerequisite to determine amount of drug is zero absorbance of neat polymer which is
defined with the term ‘control’. UV-absorbance of receptor compartment versus time
was measured as described in Chapter 4.9 for the two cases called ‘control’ and ‘blank’.
When neat polymer was placed in donor compartment for control experiment no
absorbance throughout experiment was observed. Permeation of neat drug (5FU)
solution put in donor compartment was also monitored to compare kinetics of drug
release from loaded polymer particles with that of blank. Release profiles of both
control and blank experiments are given in Figure 5.53.
-0.050
0.050.1
0.150.2
0.250.3
0.35
0 50 100 150 200 250 300 350
t (min)
Mt (
mg)
Blank Control
Figure 5.53. Drug release profiles of neat polymer (control) and neat drug (blank) determined by UV-spectroscopy from receptor compartment of diffusion cell.
Effect of temperature of medium on UV-absorbance of drug that permeated from
donor compartment of diffusion cell to the receptor compartment through membrane
that separates the two compartments was observed as in Figure 5.54. Experiments
performed at 22°C and 37°C indicate that permeation increases at higher temperatures.

91
0
0.05
0.1
0.15
0.2
0.25
0.3
0.35
0 50 100 150 200 250 300 350
t (min)
Mt (
mg)
22 C 37 C
Figure 5.54. Release profiles of neat drug passed through membrane of diffusion cell at different medium temperatures.
Measurements of UV-absorbance were performed with 1 ml/min flowrate of
fresh PBS passing through receptor compartment of diffusion cell for all experiments
performed to validate assumptions employed to describe mass transfer system. It was
the maximum flowrate at which amount of release could be detected. At higher
flowrates concentration of drug was too low to be detected by UV-spectrometry.
One last parameter that could have an effect on mass transfer rate was rate of
mixing in donor and receptor compartments. Theoretical model proposed in Chapter 3
assumes homogeneous drug concentrations in both donor and receptor compartments
which require continuous mixing. Same model assumes that mass transfer through
membrane depends on concentration difference only. Effect of mixing in compartments
of diffusion cell were observed by employing no mixing, mixing in donor compartment
only and mixing in both compartments when a known amount of neat drug was placed
in donor compartment and PBS passed through receptor compartment at 1 ml/min
flowrate. Amount of drug permeated through membrane was monitored for each
condition as shown in Figure 5.55. The three profiles did not exhibit significant
variations especially within the initial interval of experiment which confirms that the
only driving force is concentration difference at the two sides of membrane. However,
when donor compartment was not mixed, permeation profile was more linear since the
drug solubility was poor. Probably drug precipitated at the upper side of membrane
providing an approximately constant flux.

92
0
0,05
0,1
0,15
0,2
0,25
0,3
0,35
0 20 40 60 80 100 120 140 160 180
t (min)
Mt (
mg)
No mixing Donor mixed Donor and receptor mixed
Figure 5.55. Effect of mixing in donor and receptor compartments of diffusion cell.
Permeation profiles in cases of mixing exhibited similar mass transfer behavior;
until 40% of the total drug placed in donor compartment permeated through membrane,
profile was linear with a constant mass transfer coefficient. Then, depending on the
decrease in drug concentration in donor compartment, mass transfer rate decreased.
However, since mass fluxes in initial interval are identical, effect of mixing rate has no
effect on mass transfer rate (dM/dt) and it is a function of concentration difference only.
The experiment indicates that mixing in donor compartment is essential since
concentration difference at the two sides of membrane cannot represent average
concentrations of donor and receptor compartments if there is no mixing. Homogeneity
of the receptor compartment is also necessary to eliminate effect of variations in
flowrate that passes through receptor compartment. Therefore, both compartments are
well mixed in drug release experiments in order to provide homogeneous drug
concentrations at both sides of the membrane.
Drug release experiments from 5FU loaded 4 arm PMMA-b-PAA were
performed for the samples with the highest drug loading contents. Figure 5.56 shows
release profiles of 5FU from loaded 4 arm PMMA-b-PAA samples at two different
flowrates. Data was collected continuously at 1 min intervals for 400 hours. Cumulative
amount of released drug was determined from downstream at every 1000 minutes
intervals. Experimental data of experiments have been given in Appendix B.
Loading conditions of the sample can be reminded as 3500 mg/L polymer &
drug concentration in 3 ml volume, being loaded for 4 hours at 15 °C and at pH=1.2.

93
Release of the loaded drug from particles occurred in donor compartment of the
diffusion cell, then released amount was transferred to receptor compartment through
semi-permeable membrane. Fresh PBS solution passed through receptor compartment
of diffusion cell with 0.25 ml/min flow rate. But it was too hard to detect concentration
of released drug when mass decreased. The experiment was repeated with 0.025
ml/min PBS flow rate and it was observed that results of the two experiments were
consistent.
0
0.1
0.2
0.3
0.4
0.5
0.6
0.7
0 50 100 150 200 250 300 350 400 450 500
t (h)
Mt (
mg)
Figure 5.56. Drug release profiles of 4 arm PMMA-b-PAA loaded at 3500 mg/L
polymer concentration at 15°C, 4 h. (a) Amount of drug released versus time; (○) series belong to the sample with DLC=13.6%, PBS flow rate=0.025 ml/min. (●) series belong to DLC=20.6%, PBS flow rate=0.25 ml/min. Mt amounts were determined from collected 15 ml portions of downstream.
Concentration of drug in receptor compartment monitored by UV-spectroscopy
was used to determine amount of released drug per unit time by using Equation 5.6.
Mt = A266× 0.016456 (mg/ml) × flowrate (ml/min)× t (min) (5.6)
Since flowrate of PBS solution that received released amount of drug is quite
small (0.025 ml/min) calculation of released drug per minute may only be
approximately representative. In order to confirm the quantities calculated from
continuous release data, samples of downstream collected for 600 minute intervals (15

94
ml) were separately analysed by UV-spectrophotometry. The data gathered that way for
the two replicates of release experiments from 5FU loaded 4 arm PMMA-b-PAA,
loaded at a polymer concentration of 3500 mg/L, are shown in Figure 5.57.
00.10.20.30.40.50.60.70.80.9
1
0 50 100 150 200 250 300 350 400 450 500
t (h)
Mt /M
00.10.20.30.40.50.60.70.80.9
1
0 1 2 3 4 5 6
t (h)
Mt /M
Figure 5.57. Drug release profiles of 4 arm PMMA-b-PAA loaded at 3500 mg/L
polymer concentration at 15°C, 4 h. (a) Released fraction of drug versus time, (b) Blank experiment of 5FU permeation through membrane (n=3).
(a)
(b)

95
y = 0.005xR2 = 0.9929
00.10.20.30.40.50.6
0 20 40 60 80 100 120
t (min)
-V/A
*ln(
1-C
r/Cd)
Figure 5.58. Graphical determination of 5FU permeability through membrane that
separates donor and receptor compartments of diffusion cell.
Permeability is calculated as P=0.005 from experimental data obtained by
keeping drug concentration constant at donor compartment. Initial 5FU concentration
introduced to donor compartment was 10 mg/ml. The slope of linear function given in
Figure 5.58 provided permeability of the semi-permeable membrane that separated the
two compartments of diffusion cell as derived in Chapter 3.3 (Equation 3.36).
As long as permeability was known and it is the only mass transfer resistance
that released drug confronts prior to measurement, all constants were available within
the model derived in Chapter 3.2. Equation 3.30 was the general form of derived model
based on assumption that drug release from particles would be expressed according to
power law which can be declared by the mathematical expression ktn. Since the volume
of donor compartment is 1 ml, Cd = ktn was substituted to derive model equation which
included the release rate constant (k) and power index (n) which constituted the degree
of release kinetics. Eventually, the ultimate equation (Equation 3.31) had four
unknowns the two (Cn and C) being integration constants as expressed in Equation 5.7:
),,,()( nkCCftM nt = (5.7)
Solution of this equation was achieved by a trial and error approach, by using
Solver tool (Microsoft Office Excel, 2007) to minimize sum of square errors (SSE)
calculated from errors between theoretical and experimental Mt values. Solution of
equation yields a zero order release behavior from particles within the donor
compartment. The only constraint for the solution was non-negativity of n. For this case

96
k and Cn values were estimated as k=9.78×10⁻⁴ and Cn=0.217. C is zero since initial
condition claims that drug concentration in donor compartment is zero at t=0. SSE is
0.0658. General equation can then be represented as in Equation 5.8.
( ) tt eFFttM κ
κ−+×××= 217.0109.78109.78)( 4-4- (5.8)
where concentration of the donor compartment is constant and Cd=ktn=9.78×10⁻⁴ mg/ml
since n=0. Then mass transfer rate is to be constant throughout experiment and release
process occurs at steady state.
Comparison of experimental and theoretical Mt and Mt/M values calculated from
Equation 3.31 are shown on Figure 5.59. Here it can be observed that experimental data
shows deviation from linearity.
Drug release systems may comply with more than one mechanisms and different
release profiles at initial and proceeding stages of drug release is a very common issue.
In order to decrease SSE and provide a better fit between theoretical model and
experimental results, it is recommended to make a distinction between initial release
profile up to where Mt/M<0.6 and late release profile where Mt/M>0.4 and analyze the
two regions separately. The overlapping region may be explained by both mechanisms
(Ho and Sirkar, 1992).
The first interval starting from t=0 up to t=130 hour covers the first stage of drug
release where 40% of the drug loaded to polymer sample was released. Then Equation
3.31 was solved for each interval separately as shown in Appendix B. As a result SSE
decreased to 0.016 and deviation from experimental data diminished as in Figure 5.60.

97
0.0
0.1
0.2
0.3
0.4
0.5
0.6
0.7
0.8
0 50 100 150 200 250 300 350 400 450 500
t (h)
Mt (
mg)
0.00.10.20.30.40.50.60.70.80.91.0
0 50 100 150 200 250 300 350 400 450 500
t (h)
Mt /
M
Experimental Model
Figure 5.59. Experimental and theoretical values of (a) Mt and (b)Mt/M obtained from model that assumes Cd=ktn=9.78×10⁻⁴ mg/ml, for the drug release from 4 arm PMMA-b-PAA nanoparticles.
Solution of equation yields an approximately zero order release behavior again.
n1=0.0025 that is quite close to zero is the order of release rate for the initial interval
and n2=0 for the rest of the release process. As release rate is a bit higher in the initial
region the main difference in two intervals originate from k values which are
k1=1.35×10⁻³ and k2=7.59×10⁻⁴. The constraints for the solution were non-negativity of
n values and C=0 for the initial interval of drug release. For this case Cn values were
estimated as C1=0.12 and C2=-0.212 for the two intervals. C was nonzero for the second
(b)
(a)

98
interval and was estimated to be C3=0.118 as shown in Appendix B. The third, fourth
and fifth terms of the alternating series that appear in Equation 3.31 were not significant
although they were nonzero, therefore they were not considered for constitution of the
general equation.
Equation 3.31 for the solution of equation in two separate intervals that cover the
first 130 hours and the rest of release process respectively, yields the two equations
given in Equations 5.8 and 5.9.
tt eFtFtM κ
κ−+×−
×= 12.0101.35
0025.1101.35 0025..03-
0025.1-3
⎥⎦⎤
⎢⎣⎡ ≤ 40.0
MM t (5.8)
18.1212.01059.7107.59 4-4- +−×−×= − tt eFtFM κ
κ ⎥⎦
⎤⎢⎣⎡ > 40.0
MM t (5.9)
where F is volumetric flow rate of PBS stream passing through receptor compartment
(0.025 ml/min), κ=AP/Vr, Vr is volume of receptor compartment (0.47 ml), A is area of
membrane (0.785 cm2) and P is permeability calculated previously (0.005 cm/min).
Concentration of donor compartment (Cd) also has two conditions given by the
mathematical expressions as in Equations 5.10 and 5.11.
-3101.35×≅dC mg/ml ⎥⎦⎤
⎢⎣⎡ ≤ 40.0
MM t (5.10)
-4107.59×=dC mg/ml ⎥⎦⎤
⎢⎣⎡ > 40.0
MM t (5.11)

99
0.0
0.1
0.2
0.3
0.4
0.5
0.6
0.7
0.8
0 50 100 150 200 250 300 350 400 450 500
t (h)
Mt (
mg)
0.00.10.20.30.40.50.60.70.80.91.0
0 50 100 150 200 250 300 350 400 450 500
t (h)
Mt /
M
Experimental Model
Figure 5.60. Experimental and theoretical values of (a) Mt and (b)Mt/M obtained from model that assumes Cd=1.35×10⁻³ mg/ml (for the initial interval where Mt/M<40) and Cd=7.59×10⁻⁴ mg/ml (for the late interval where Mt/M>40), for the drug release from 4 arm PMMA-b-PAA nanoparticles.
(a)
(b)

100
5.7 Biodegradation
Biodegradability of particles were evaluated in terms of particle sizes of
degraded 4 arm PMMA-b-PAA samples at 37°C. For the particle size analysis with
DLS polymer samples were degraded in standard PBS solution.
Polymer samples prepared by simple equilibrium method were analyzed in 1
hour to determine particle size of undegraded polymer particles. Initial particle size is
about 20-30 nm as dissolved in aqueous medium at 25 ºC. Dissolved polymeric micelle
samples were introduced into degradation temperature that was 37 ºC, then they start to
agglomerate and reach an average particle size of 35 nm within 36 hours. Within 3 days
particle size drops back to an average particle size of 25 nm, and below 10 nm in a 7
days period of degradation. Variation of particle sizes for degraded polymer samples
were shown in Figure 5.61.
Volume average particles sizes shown in Figure 5.61 represent the dominant
peak that constitutes more than 90% of total volume of particles. That peak also
represents the smallest particle size interval. But presence of other peaks having a
particle size between 50 nm and 150 nm indicate tendency of 4 arm PMMA-b-PAA
particles to agglomerate.
0
5
10
15
20
25
30
35
0 2 4 6 8 10 12
t (days)
Part
icle
Siz
e (n
m)
Figure 5.61. Volume average particle size analysis of 4 arm PMMA-b-PAA degraded
in PBS solution at 37 ºC (n=3). Concentrations of polymer samples were 2 mg/ml.

101
The effect of polymer concentration on agglomeration and micelle forming
behavior versus degradation has to be investigated. For this reason, polymer solutions at
different concentrations (varying between 1-8 mg/ml) were degraded at 37°C and
monitored in terms particle size.
Particle size distribution of undegraded 4 arm PMMA-b-PAA show that, average
particle size does slightly increase with increasing polymer concentration, but average
size of agglomerates which constitutes only a 10% of all particles by volume strongly
depends on polymer concentration as can be observed from Figure 5.62. Then it can be
declared that undegraded particles form unimolecular micelles with almost constant
particle size about 20-30 nm that is virtually independent of polymer concentration. But
agglomeration tendency increases drastically with increasing concentration of polymer
in solution.
After three days of degradation, micelle size remains constant, and dependency
of agglomerate sizes on polymer concentration is not significant. Particle size still
occurs in 20-30 nm, while agglomerates at every concentration were observed to be
about 100-150 nm (Figure 5.63). This case is just identical to the initial particle size
distributions observed at low polymer concentrations, only volumetric ratios of
agglomerates to particles are smaller. Particle size distributions of the samples
determined by zetasizer have been reported in Appendix C.
1 2 3 4 5
>90% <1
0% <2%
050
100150200250300350400450
Particle Size
Polymer Concentration (mg/ml)
>90%
<10%
<2%
Figure 5.62. Variation of particle size with increasing polymer concentration of 4 arm
PMMA-b-PAA nanoparticles before degradation.
4 6 8

102
1 2 3 4 5
>90% <1
0% <1%
0
20
40
60
80
100
120
140
160
Particle S ize
Polymer Concentration (mg/ml)
>90%<10%<1%
Figure 5.63. Variation of particle size with increasing polymer concentration of 4 arm
PMMA-b-PAA nanoparticles degraded for 3 days.
At the seventh day of degradation, agglomerates were completely diminished
and particle sizes were decreased down to below 10 nm as (Figure 5.64). Thereby the
biodegradability of 4 arm PMMA-b-PAA with a PMMA core smaller than 5000 Da was
substantiated. A dependency of particle size on polymer concentration still holds but
the polymer solution at this point has lost all its capability to produce a micellar
structure that can entrap hydrophobic molecules.
1 2 3 4 5100%
0
2
4
6
8
10
12
14
Particle Size
Polymer Concentration (mg/ml)
Figure 5.64. Variation of particle size with increasing polymer concentration of 4 arm
PMMA-b-PAA nanoparticles degraded for 7 days.
4 6 8
4 6 8

103
5FU loaded particles in dimethyl formamide and acetic acid solution were also
investigated by DLS. Hydrodynamic radius of unloaded 4 arm PMMA-b-PAA particles
was 14 nm with a slight agglomeration (about 6.3 volume % agglomerates having 79
nm size) as given in Table C.2. The polymer samples loaded in dimethyl formamide
(DLC=7.3%) and 1% acetic acid solution (DLC=8.0%) yielded almost the same particle
size as unloaded sample, and exhibited no agglomeration. Volume average particle sizes
of 4 arm PMMA-b-PAA particles were 11.3 nm (loaded in DMF) and 12.3 nm (loaded
in 1% acetic acid). Detailed description of particle size distributions of the samples have
been shown in Tables C.12-C.13.
All the samples that were employed for the biodegradation experiments were
loaded with pyrene (as described in Chaper 4.6) after the particle size analysis to check
their loading capacity. Figure 5.65 shows the capability of 4 arm PMMA-b-PAA as
dissolved in PBS solution at various polymer concentrations. UV absorbance of pyrene
loaded samples show the increasing abilities of micelle forming and entrapping capacity
of polymer samples with increasing polymer concentration. It is obvserved in Figure
5.66 that biodegraded polymer samples have lost their capability to entrap and
solubilize pyrene molecules.
Particle sizes were also determined by AFM images in order to confirm particle
size and particle size distribution data obtained by DLS. In order to observe single
particles and agglomerates, dilute solutions (such as 5×10⁻³ mg/ml) were prepared
(Demir and Erman 2002). Figure 5.67 and 5.68 show how agglomeration proceeds even
within 1 hour of degradation at 37°C.

104
200,0 250 300 350 400,00,00
0,5
1,0
1,5
2,0
2,5
3,0
3,5
4,00
nm
A
Figure 5.65. Entrapment efficiency of 4 arm PMMA-b-PAA in PBS solution having
polymer concentrations 8,6,4,2,1 mg/ml (from top to bottom), before degradation.
200,0 250 300 350 400,00,01
0,5
1,0
1,5
2,0
2,5
3,0
3,5
4,00
nm
A
Figure 5.66. Entrapment efficiency of 4 arm PMMA-b-PAA in PBS solution having polymer concentrations 6,4,2,1 mg/ml (from top to bottom), after 7 days of degradation.

105
Figure 5.67. AFM micrograph of 4 arm PMMA-b-PAA (MW 4900/18000 Da) as
dissolved in aqueous medium at 25 °C.
Figure 5.68. AFM micrograph of 4 arm PMMA-b-PAA (MW 4900/18000 Da)
degraded for 1 hour in aqueous medium at 37 °C.

106
Figure 5.69. AFM micrograph of 4 arm PMMA-b-PAA (MW 4900/18000 Da) as
degraded for 7 days in aqueous medium at 37 °C.
Figure 5.70. AFM micrograph of 4 arm PMMA-b-PAA (MW 4900/18000 Da) as
degraded for 10 days in aqueous medium at 37 °C.

107
Table 5.15. Particle size analysis of 4 arm PMMA-b-PAA (MW: 18000, fc:0.27).
Degradation Time Count
Average Particle Size
(nm)
Minimum Particle Size
(nm)
Minimum Particle Size
(nm) σ
5×5 µm2 As dissolved
88 158
26.0 31.1
11.0 11.0
150.3 207.3
25.4 24.3
1 hour
161 53
35.2 58.3
11.0 11.0
305.8 298.7
44.1 69.4
1 day 38 42.9 11.0 122.7 28.3 5 days 44 37.8 11.0 288.6 54.2 7 days 382 36.3 11.0 342.7 46.7 10 days 83 22.65 11.0 85.4 17.9
2×2 µm2 As dissolved
53 133
14.2 9.9
4.4 4.4
78.0 68.8
13.4 10.9
1 hour
55 59
12.4 17.9
4.4 4.4
64.8 197.5
12.8 29.6
1 day 55 16.13 4.4 93.1 21.0 5 days 16 19.0 4.4 107.5 26.4 7 days 107 13.12 4.4 189.2 19.8 10 days 60 8.7 4.4 58.3 9.6
Figure 5.71. Particle analysis of 4 arm PMMA-b-PAA (MW 4900/18000 Da) as
degraded for 10 days in aqueous medium at 37 °C.

108
Particle sizes from 5×5 µm2 and 2×2 µm2 scans were determined by particle
analysis and are given by Table 5.15. Particle analysis of 5×5 µm2 AFM scans can be
examined in detailed from sketches and statistics given in Appendix D. In all samples
exposed to particle analysis, threshold height was kept at 1±0.2 nm. σ values were given
as a measure of variation of particle sizes indicating an evaluation of particle size
distribution.
Agglomerates remaining at 7th day of degradation can be observed in Figure
5.69. They seem like accumulated particles when compared to solid agglomerates
observed previously. By the 10th day of degradation, agglomerates significantly
decreased both in number and particle size (Figures 5.70 & 5.71).
AFM images and particle analysis cannot yield definite results for particle size
and distribution analysis since samples can never be perfectly representative. Besides
agglomerates observed from micrographs might have occurred via drying process. But
when AFM micrographs were compared with particle size determinations achieved by
DLS, it was observed that results were comparative after all.

109
CHAPTER 6
CONCLUSIONS
3 arm, 4 arm and 6 arm PMMA-b-PAA copolymers having molecular weights
between 18kDa-80kDa and hydrophobic core ratios varying from 0.1 to 0.45 were
synthesized by ATRP method.
Brominated 3 arm, 4 arm and 6 arm initiators of first stage of ATRP reaction
were synthesized from 1,3,5-trihydroxybenzene, pentaerythritol and dipentaerythritol
with 94.5, 76.3 and 67.3% conversions. Pentaerythritol tetrakis (2-bromoisobutyrate)
from pentaerythritol and dipentaerythritol hexakis (2-bromoisobutyrate) from
dipentaerythritol were synthesized with 100% purity while attained purity of 1,3,5- (2-
bromo-2-methyl propionate) benzene from 1,3,5-trihydroxybenzene was 82 %.
Sythesis of PMMA cores were achieved in anisole by using PMDETA as ligand
and CuCl as catalyst in stoichiometric ratio. Monomer to initiator molar ratio was kept
250 for each arm. Reactions were carried at 60-70°C for 10-12 minutes to obtain
PMMA-Br macroinitiators at 5000 Da molecular weights and with acceptable
polydispersity indexes. Molecular weights were tried to be kept about 5000 Da for
providing particle sizes of degraded polymers under 5 nm after biodegradation at 37 °C
following administration into body for therapeutically purposes. This is an important
requirement for biodegradable polymers to be used for drug delivery for only the
particles smaller than 5 nm can be removed from circulatory system by renal route.
3 arm PMMA-b-PtBA synthesis from PMMA-Br macroinitiators were also
carried in anisole by using PMDETA as ligand. CuBr was used as catalyst with 10%
excess and monomer to initiator molar ratio varied about 500-600 for each arm.
Reaction times changing from 5 hours to 20 hours determined molecular weights of
PMMA-b-PtBA copolymers. Synthesized PMMA-b-PtBA copolymers were reacted
into PMMA-b-PAA copolymers by selective hydrolysis reaction of tBA chains by
trifluoroacetic acid.
Critical micelle concentrations and maximum loading capacities of polymer
samples were determined by fluorescence method. Pyrene was used as a fluorescent
probe and critical micelle concentration was determined by both comparing ratio of first

110
and third bands in emission spectra and detecting the shift in I336 band in excitation
spectra of pyrene loaded polymer samples at different concentrations. Critical micelle
concentration was observed to increase with increasing molecular weight and maximum
loading capacity was observed to increase with increasing hydrophobic core ratio.
Therefore an optimum PMMA-b-PAA copolymer was proposed to have 20000 Da
molecular weight and 0.25 hydrophobic core ratio in order to provide a minimum
critical micelle concentration and maximum loading capacity for hydrophobic drugs.
Drug loading method was optimized with 4 arm PMMA-b-PAA having 30 kDa
molecular weight and 0.23 hydrophobic core ratio and indomethacin as model drug.
Drug and polymer was easily loaded at high loading content (24.8%) with 1 hour of
mixing at room temperature following dissolution in a strong solvent which was
dimethylformamide. Removal of solvent and excess drug was achieved by dialysis.
Dialysis method yielded excellent loading performance when compared to salting out
and solvent deposition methods which constitute alternatives for drug loading.
Drug loading contents of synthesized PMMA-b-PAA samples with 4 and 6 arms
were very poor when they were tried to be loaded with the anticancer drug 5
Fluorouracyl at the same conditions. Therefore determination of ideal loading
conditions were required. 6 arm PMMA-b-PAA having molecular weight of 34 kDa
with hydrophobic core PMMA of 5400 Da, and 4 arm PMMA-b-PAA having molecular
weight of 18000 Da with hydrophobic core PMMA of 4900 Da), were used for
determination of ideal drug loading conditions for 5FU loading. The polymers were
characterized by FTIR to confirm they were completely hydrolyzed and contained
neither monomer nor solvent residue.
Drug loading conditions were optimized as 4 hours of loading at 15°C, within
aqueous medium with pH value of 1.0-1.5. Polymer samples were dissolved in minute
amounts of ethanol and drug samples at equal quantities were dissolved in 1% HCl.
Effect of polymer concentration on loading performance was investigated and it was
observed that higher polymer concentrations yielded higher drug loading contents.
Three polymer concentrations (500, 2000 and 3500 mg/L) yielded 8.8 %, 17.7% and
17.1% drug contents (average drug contents of two replicates), respectively. In FTIR
spectra of loaded polymer samples, asymmetric stretching of COO- bands appeared due
to interaction of carboxyl groups of the polymer with 5FU. In DSC and DTG
thermograms specific degradation peaks of 5FU could not be observed and TGA

111
thermograms indicated an improvement in thermal stability of the polymer probably due
to interaction with 5FU molecules.
Although drug loading contents determined from concentration analysis of
dialysis media of samples by UV-spectroscopy were very close, TGA thermogram of 4
arm PMMA-b-PAA loaded at a polymer concentration of 3500 mg/L exhibited
relatively low residue depicting relatively higher drug content. Therefore 4 arm PMMA-
b-PAA loaded at a polymer concentration of 3500 mg/L samples were tested for their
drug release performances.
Drug release from 4 arm PMMA-b-PAA loaded at a polymer concentration of
3500 mg/L, at 15°C for four hours were determined by a continuous system equipped
by a Franz diffusion cell, a syringe pump and a flow cell continuously monitored by UV
spectroscopy. Absorbance of PBS solution passed through receptor compartment at
37°C was analyzed with one minute intervals. To confirm continuous measurement, 15
ml samples of downstream were separately analyzed to calculate released amount of
drug versus time. The experiment was repeated at two different flow rates, 0.25 ml/min
and 0.025 ml/min, which yielded comparable amounts of drug released. Release profile
from particles has been estimated by considering continuous mass transfer of released
drug to the receptor compartment of diffusion cell through a semipermeable membrane.
Concentration of PBS flow passing through receptor compartment was monitored
throughout release process and release profile was modelled following determination of
permeability as 0.005 cm/min which constituted the mass transfer coefficient of overall
system.
Drug release from 4 arm PMMA-b-PAA was modeled separately for the initial
and proceeding intervals of release process. Solution of parameters (n, k and integration
constants) by trial and error indicated that release from polymer particles approached
zero order kinetics with negligibly small n for the initial interval and constant release
for the rest of the process. Therefore drug release mechanism was dominated by k
constants which were determined as 1.35×10⁻³ and 7.59×10⁻⁴ for the initial and late
intervals of drug release, respectively. Precise values of coefficient (k) and degree (n) of
release kinetics within donor compartment provided by the solutions has been tabulated
in Table 6.1. They show the release behavior from PMMA-b-PAA nanoparticles
according to the mathematical model derived by assuming drug concentration in donor
compartment to be time dependent obeying the power low equation which was
represented by the mathematical expression, ktn.

112
Table 6.1. Constants of release kinetics equation from 5FU loaded PMMA-b-PAA nanoparticles.
Release Profiles for the Initial and Late Periods
(SSE=0.016)
Release Profile Along the Whole Release Period
(SSE=0.066) ⎥⎦⎤
⎢⎣⎡ ≤ 40.0
MM t ⎥⎦
⎤⎢⎣⎡ > 40.0
MM t
k n k1 n1 k2 n2 9.78×10⁻⁴ 0 1.35×10⁻³ 0.0025 7.59×10⁻⁴ 0
Biodegradation profiles of 4 arm PMMA-b-PAA were consistent with release
profiles which indicated erosion of polymeric particles. 4 arm PMMA-b-PAA particles
exposed to buffer solution of 7.4 pH and body temperature tended to agglomerate for
the first day of degradation. This behavior explains 6 hours of delay in release profile,
when agglomeration was severe. Then agglomerates slowly reduced in seven days when
drug release appeared almost with a constant rate.
Average particle size of 4 arm PMMA-b-PAA having a PMMA core of 5000
Da molecular weight and 0.25±0.05 hydrophobic core ratio was 20-30 nm as dissoleved
in aqueous medium. Due to agglomeration, particle size could rise up to 150 nm, but
agglomerates were rather few (<10 v%). compared to small particles After 10 days of
degradation average particle size were smaller than 10 nm, dilute samples resulting in 5
nm. AFM micrographs confirmed these results.
For a final word, amphiphilic 4 arm PMMA-b-PAA nanoparticles have been
proved promising drug carriers especially for hydrophobic anticancer drugs. They
exhibit substantial drug loading content (14 % for 5FU and 22% for indomethacin) and
provided controlled release for 18 days. All polymer samples studied for their release
performance exhibited sustained release with a 4-6 hours of delay prior to beginning of
drug release. This delay is attributed beneficial for the application of release system in
cancer therapy since sustained delivery permits carrier particles accumulate in tumors.
Agglomerated particles not exceeding 100 nm particle size provides another benefit for
cancer therapy ensuring passive tumor targeting. On the other hand further
agglomeration of particles within the first few hours of administration may cause
problems in reticuloendothelial system. A surface modification of 4 arm PMMA-b-PAA
nanoparticles may be necessary to prevent severe agglomeration for parenteral
applications of drugs carried by 4 arm PMMA-b-PAA nanoparticles.

113
REFERENCES
Aguiar, J.; Carpena, P.; Molina-Bolívar, J. A.; Carnero, R. C. On the Determination of the Critical Micelle Concentration by the Pyrene 1:3 Ratio Method. J. Colloid Interf. Sci. 2003, 258, 116–122.
Allen, C.; Maysinger, D.; Eisenberg, A. Nano-Engineering Block Copolymer
Aggregates for Drug Delivery. Colloid Surface B. 1999, 16, 3–27. Arias, J. L.; Ruiz, M. A.; López-Viota, M.; Delgado, Á. V.; Poly(Alkylcyanoacrylate)
Colloidal Particles as Vehicles for Antitumour Drug Delivery: A Comparative Study. Colloids and Surface B. 2008, 62, 64–70.
Asthana, A.; Chauhan, A. S.; Diwan, P.V.; Jain, N.K. Poly(Amidoamine) (PAMAM)
Dendritic Nanostructures for Controlled Site-Specific Delivery of Acidic Anti-Inflammatory Active Ingredient. AAPS Pharm.Sci. 2005, 6, 536-542.
Aulenta, F.; Hayes, W.; Rannard, S. Dendrimers: A New Class of Nanoscopic
Containers and Delivery Devices. Eur. Polym. J. 2003, 39, 1741–1771. Babu, V. R.; Sairam, M.; Hosamani, K. M.; Aminabhavi, T. M. Development of 5-
Fluorouracil Loaded Poly(Acrylamide-co-Methylmethacrylate) Novel Core-Shell Microspheres: In Vitro Release Studies. Int. J. Pharm. 2006, 325, 55–62.
Bartolozzi, I.; Solaro, R.; Schacht, E.; Chiellini, E. Hydroxyl End-Capped Macromers
of N-Vinyl-2-Pyrrolidinone as Precursors of Amphiphilic Block Copolymers. Eur. Polym. J. 2007, 43, 4628–4638.
Bontha, S.; Kabanov, A. V.; Bronich, T. K. Polymer Micelles With Cross-Linked Ionic
Cores for Delivery Of Anticancer Drugs. J. Control. Release. 2006, 114, 163-174.
Brannon-Peppas L.; Blanchette J. O. Nanoparticle and Targeted Systems for Cancer
Therapy. Adv. Drug Deliver. Rev. 2004, 56, 1649– 1659. Brannon-Peppas L. Polymers in Controlled Drug Delivery. Medical Plastics And
Biomaterials Magazine. 1997, 4, 34-44.

114
Brar, A. S.; Saini, T. Atom Transfer Radical Polymerization of 2-Methoxy Ethyl Acrylate and Its Block Copolymerization with Acrylonitrile. Eur. Polym. J. 2007, 43, 1046–1054.
Braunecker, W. A.; Matyjaszewski K. Controlled/Living Radical Polymerization:
Features, Developments and Perspectives. Prog. Polym. Sci. 2007, 32, 93-146 Breitenbach, A.; Li, Y. X.; Kissel, T. Branched Biodegradable Polyesters for Parenteral
Drug Delivery Systems. J. Control. Release. 2000, 64, 167–178. Burguière, C., Chassenieux, C., Charleux, B. Characterization of Aqueous Micellar
Solutions of Amphiphilic Block Copolymers of Poly(Acrylic Acid) And Polystyrene Prepared via ATRP. Toward the Control of the Number of Particles in Emulsion Polymerization. Polymer. 2003, 44, 509–518.
Candau, F.; Ottewill, R. H. Scientific Methods for the Study of Polymer Colloids and
their Applications ; Kluwer : Strasbourg, 1988, pp 311-314. Castelli, F.; Messina, C.; Sarpietro, M. G.; Pignatello, R.; Puglisi, G. Eudragit as
Controlled Release System for Anti-Inflammatory Drugs. A Comparison between DSC and Dialysis Experiments. Thermochim. Acta. 2003, 400, 227–234.
Castelli, F.; Conti, B.; Maccarrone, D.; Lacamera, O.; Conte, U. Indomethacin-
Dipalmitoylphosphatidylcholine Interaction. A Calorimetric Study of Drug Release From Poly(Lactide-co-Glycolide) Microspheres into Multilamellar Vesicles. Drug Deliv. 1997, 4, 273-279.
Celik, C.; Hızal, G.; Tunca, U. Synthesis of Miktoarm Star and Miktoarm Star Block
Copolymers via a Combination of Atom Transfer Radical Polymerization and Stable Free-Radical Polymerization. J. Polym. Sci. Pol. Chem. 2003, 41, 2542–2548.
Chatterjee, U.; Jewrajka, S. K.; Mandal, B. M. The Amphiphilic Block Copolymers of
2-(Dimethylamino)Ethyl Methacrylate and Methyl Methacrylate: Synthesis by Atom Transfer Radical Polymerization and Solution Properties. Polymer. 2005, 46, 10699–10708.
Cheng, Y.; Xu, T. The Effect of Dendrimers on the Pharmacodynamic and
Pharmacokinetic Behaviors of Non-Covalently or Covalently Attached Drugs. Eur. J. Med. Chem. 2008, 43, 2291-2297.

115
Chu, J.; Chen, J.; Zhang K. N,N,N,N,N-Penta(Methyl Acrylate)Diethylenetriamine: A Novel Ligand for Atom Transfer Radical Polymerization of Methyl Methacrylate. J. Polym. Sci. Pol. Chem. 2004, 42, 1963–1969.
Chytil, P.; Etrych, T.; Koňák, Č.; Šírová, M.; Mrkvan, T.; Říhová, B.; Ulbrich, K.
Properties of HPMA Copolymer–Doxorubicin Conjugates with pH-Controlled Activation: Effect of Polymer Chain Modification. J. Control. Release. 2006, 115, 26–36.
Coessens, V.; Pintauer, T.; Matyjaszewski K. Functional Polymers by Atom Transfer
Radical Polymerization. Prog. Polym. Sci. 2001, 26, 337-377. Crank J. The Mathematics of Diffusion; Clarendon Pres: Oxford, 1975; pp 89-91. Demir, M. M.; Erman, B. Dimensions of Polystyrene Particles Deposited on Mica from
Dilute Cyclohexane Solution at Different Temperatures. Macromolecules, 2002, 35, 7986-7992.
Deng, G.; Ma, D.; Xu, Z. Synthesis of ABC-Type Miktoarm Star Polymers By ‘‘Click’’
Chemistry, ATRP and ROP. Eur. Polym. J. 2007, 43, 1179–1187. Djordjevic, J.; Michniak, B.; Uhrich, K. E. Amphiphilic Star-Like Macromolecules as
Novel Carriers for Topical Delivery of Nonsteroidal Anti-Inflammatory Drugs. AAPS Pharm.Sci. 2003, 5, Article 26, 1-12.
Dodova, M. G.; Calis, S.; Crcarevska, M. S.; Geskovski, N.; Petrovska, V.; Goracinova,
K.; Wheat Germ Agglutinin-Conjugated Chitosan–Ca–Alginate Microparticles for Local Colon Delivery of 5-FU: Development and in vitro Characterization. Int. J. Pharm. 2009, 381, 166–175.
Eerikäinen, H.; Peltonen, L.; Raula, J.; Hirvonen, J.; Kauppinen, E. I. Nanoparticles
Containing Ketoprofen and Acrylic Polymers Prepared by an Aerosol Flow Reactor Method. AAPS Pharm. Sci. 2004, 5, Article 68, 1-9.
Erdoğan, T.; Ozyürek, Z.; Hızal G.; Tunca U. Facile Synthesis Of AB2-Type Miktoarm
Star Polymers Through the Combination of Atom Transfer Radical Polymerization and Ring-Opening Polymerization. J. Polym. Sci. Pol. Chem. 2004, 42, 2313–2320.

116
Even, M.; Haddleton, D. M.; Kukulj, D. Synthesis and Characterization of Amphiphilic Triblock Polymers by Copper Mediated Living Radical Polymerization. Eur. Polym. J. 2003, 39, 633–639.
Faisant, N.; Akiki, J.; Siepmann, F.; Benoit, J.P.; Siepmann, J. Effects of the Type of
Release Medium on Drug Release From PLGA-Based Microparticles: Experiment and Theory. Int. J. Pharm. 2006, 314, 189–197.
Faisant, N.; Siepmann, J.; Richard, J.; Benoit, J.P. Mathematical Modeling of Drug
Release from Bioerodible Microparticles: Effect of Gamma-Irradiation. Eur. J. Pharm. Biopharm. 2003, 56, 271–279.
Gast, A. P. Polymeric Micelles. Curr Opin Colloid In. 1997, 2, 258-263. Ganguly, M. Controlled Polymerization of Alkyl Methacrylates. Ph.D. Dissertation,
University Of Pune, Pune, India. December 2002. Gao, H.; Gu, Y.; Ping, Q. The Implantable 5-Fluorouracil-Loaded Poly(L-Lactic Acid)
Fibers Prepared by Wet-Spinning from Suspension. J. Control. Release. 2007, 118, 325–332.
Gaucher, G.; Dufresne, M. H.; Sant, V. P.; Kang, N.; Maysinger D.; Leroux J. C. Block
Copolymer Micelles: Preparation, Characterization and Application in Drug Delivery. J. Control. Release. 2005, 109, 169–188.
Gillies, E. R., Fréchet, J. M. J. Development of Acid-Sensitive Copolymer Micelles for
Drug Delivery. Pure Appl. Chem. 2004, 76, 1295–1307. Grayson, S. M.; Fréchet, J. M. J. Convergent Dendrons and Dendrimers: from Synthesis
to Applications. Chem. Rev. 2001, 101, 3819-3868. Gudasi, K. B.; Vadavi, R. S.; Shelke, N. B.; Sairam, M.; Aminahbavi, T. M. Synthesis
and Characterization of Novel Polyorganophosphazenes Substituted with 4-Methoxybenzylamine and 4-Methoxyphenethylamine for in vitro Release of Indomethacin and 5-Fluorouracil. React. Funct. Polym. 2006, 66, 1149–1157.
Gupte, A.; Ciftci, K. Formulation and Characterization of Paclitaxel, 5-FU and
Paclitaxel + 5-Fu Microspheres. Int. J. Pharm. 2004, 276, 93–106.
117
Haddleton, D. M.; Clark, A. J.; Crossman, M. C.; Duncalf, D. J.; Heming, A. M.; Morsley, S. R.; Shooter, A. J. Atom Transfer Radical Polymerisation (ATRP) Of Methyl Methacrylate in the Presence of Radical Inhibitors. Chem. Commun. 1997, 1173-1174.
Heng, P. W. S.; Chan, L. W.; Easterbrook, M. G.; Li, X. Investigation of the Influence
of Mean HPMC Particle Size and Number of Polymer Particles on The Release of Aspirin from Swellable Hydrophilic Matrix Tablets. J. Control. Release. 2001, 76, 39–49.
Ho, W. S. W.; Sirkar, K. K. Membrane Handbook; Van Nostrand Reinhold; New York,
1992; pp 915-931. Ibrahim, K. Studies on Atom Transfer Radical Polymerization of Acrylates and
Styrenes with Controlled Polymeric Block Structures. Ph.D. Dissertation, Helsinki University Of Technology, Helsinki, Finland, June 2006.
Ishizu, K.; Furukawa, T.; Yamada, H. Silver Nanoparticles Dispersed within
Amphiphilic Star-Block Copolymers as Templates for Plasmon Band Materials. Eur. Polym. J. 2005, 41, 2853–2860.
Ishizu, K.; Uchida, S. Synthesis and Microphase-Separated Structures of Star-Block
Copolymers. Prog. Polym. Sci. 1999, 24, 1439–1480. Jain, A.; Jain, S. K. In vitro and Cell Uptake Studies for Targeting of Ligand Anchored
Nanoparticles for Colon Tumors. Eur. J. Pharm. Sci. 2008, 35, 404–416. Jankova, K.; Bednarek, M.; Hvilsted, S. Star Polymers by ATRP of Styrene and
Acrylates Employing Multifunctional Initiators. J. Polym. Sci. Pol. Chem. 2005, 43, 3748–3759.
Jie, P.; Venkatraman, S. S.; Min, F.; Freddy, B. Y. C.; Huat, G. L. Micelle-Like
Nanoparticles of Star-Branched PEO–PLA Copolymers as Chemotherapeutic Carrier. J. Control. Release. 2005, 110, 20– 33.
Jones, M. C.; Hui, G.; Leroux, J. C. Reverse Polymeric Micelles for Pharmaceutical
Applications. J. Control. Release. 2008, 132, 208-215. Kakizawa, Y.; Kataoka, K. Block Copolymer Micelles for Delivery of Gene and
Related Compounds. Adv. Drug Deliver. Rev. 2002, 54, 203–222.

118
Kang, B. K.; Chon, S. K.; Kim, S. H.; Jeong, S. Y.; Kim, M. S.; Cho, S. H.; Lee, H. B.; Khang, G. Controlled Release of Paclitaxel from Microemulsion Containing PLGA and Evaluation of Anti-Tumor Activity in vitro and in vivo. Int. J. Pharm. 2004, 286,147–156.
Kang, H.; Liu, W.; He, B.; Shen, D.; Ma, L.; Huang, Y. Synthesis of Amphiphilic Ethyl
Cellulose Grafting Poly(Acrylic Acid) Copolymers and Their Self-Assembly Morphologies in Water. Polymer. 2006, 47, 7927-7934.
Kang, N.; Leroux, J. C. Triblock and Star-Block Copolymers of N-(2-Hydroxypropyl)
Methacrylamide or N-Vinyl-2-Pyrrolidone and D,L-Lactide: Synthesis and Self-Assembling Properties in Water. Polymer. 2004, 45, 8967–8980.
Kang, Y.; Wu, J.; Yin, G.; Huang, Z.; Yao, Y.; Liao, X.; Chen, A.; Pu, X.; Liao, L.
Preparation, Characterization and in vitro Cytotoxicity of Indomethacin-Loaded PLLA/PLGA Microparticles Using Supercritical CO2 Technique. Eur. J. Pharm.Biopharm. 2008, 70, 85-97.
Kilian, L. Synthesis and Characterization of Responsive Poly(Alkyl Methacrylate)
Topologies. Ph. D. Dissertation, Virginia Polytechnic Institute and State University, Virginia, USA, July 2004.
Klose, D.; Siepmann, F.; Elkharraz, K.; Siepmann, J. PLGA-Based Drug Delivery
Systems: Importance of the Type of Drug and Device Geometry. Int. J. Pharm. 2008, 354, 95–103.
Krishnan, R. K.; Srinivasan, S. V. Homo and Block Copolymers of tert-Butyl
Methacrylate by Atom Transfer Radical Polymerization. Eur. Polym. J. 2004, 40, 2269–2276.
Langer, R. S.; Peppas, N. A. Present and Future Applications of Biomaterials in
Controlled Drug Delivery Systems. Biomaterials. 1981, 2, 201-214. Lele, B. S.; Leroux, J. C. Synthesis of Novel Amphiphilic Star-Shaped Poly(L-
Caprolactone)-block-Poly(N-(2-Hydroxypropyl) Methacrylamide) by Combination of Ring-Opening And Chain Transfer Polymerization. Polymer. 2002, 43, 5595–5606.
Leroux, J. C.; Ranger, M. Water-Soluble Amphiphilic Nanocarriers – Applications in
Drug Delivery, Drug Delivery Companies Report, Autumn-Winter, 2002.

119
Li, S.; Wang, A.; Jiang, W.; Guan, Z. Pharmacokinetic Characteristics and Anticancer Effects of 5-Fluorouracil Loaded Nanoparticles. BMC Cancer. 2008, 8, 103-112.
Limer, A. J.; Rullay, A. K.; Sanmiguel V.; Peinado, C.; Keely, S.; Fitzpatrick, E.;
Carrington, S. D.; Brayden, D.; Haddleton, D. M. Fluorescently Tagged Star Polymers by Living Radical Polymerisation for Mucoadhesion and Bioadhesion. React. Funct. Polym. 2006, 66, 51–64.
Lin, C. C.; Fu, C. H. Controlled Release Study of 5-Fluorouracil-Loaded
Chitosan/Polyethylene Glycol Microparticles. Drug Deliv. 2009, 16, 274–279. Liu, M.; Kono, K.; Fréchet J. M. J. Water-Soluble Dendritic Unimolecular Micelles:
Their Potential as Drug Delivery Agents. J. Control. Release. 2000, 65, 121–131.
Liu, Z.; Rimmer, S. Synthesis and Release of 5-Fluorouracil from Poly(N-
Vinylpyrrolidinone) Bearing 5-Fluorouracil Derivatives. J. Control. Release. 2002, 81, 91–99.
Lópezdíaz, D.; Velázquez, M. M. Variation of the Critical Micelle Concentration with
Surfactant Structure: A Simple Method to Analyze the Role of Attractive–Repulsive Forces on Micellar Association. Chem. Educ. 2007, 12, 327-330.
Lowman, A. M.; Peppas, N. A. Hydrogels, Encyclopedia of Controlled Drug Delivery;
Wiley; New York, 1999; pp 397-418. Lukyanov, A. N.; V. P. Torchilin. Micelles from Lipid Derivatives of Water-Soluble
Polymers as Delivery Systems for Poorly Soluble Drugs, Adv. Drug Deliver. Rev. 2004, 56, 1273– 1289.
Malinowska, A.; Vlček, P.; Kříž, J.; Toman, L.; Látalová, P.; Janata, M.; Masař, B.
ATRP of (Meth)Acrylates Initiated with a Bifunctional Initiator Bearing Trichloromethyl Functional Groups and Structural Analysis Of The Formed Polymer. Polymer. 2005, 46, 5–14.
Manocha, B.; Margaritis, A. Production and Characterization of γ -Polyglutamic Acid
Nanoparticles For Controlled Anticancer Drug Release. Crit. Rev. Biotechnol. 2008, 28, 83–99.

120
Mao, B. W.; Gan, L. H.; Gan, Y. Y.; Tam, K. C.; Tan, O. K. Controlled One-Pot Synthesis of pH-Sensitive Self-Assembled Diblock Copolymers and Their Aggregation Behavior. Polymer. 2005, 46, 10045–10055.
Marion, S. C.; Okano, T.; Kataoka, K. Functional and Site-Specific Macromolecular
Micelles as High Potential Drug Carriers. Colloid. Surface. B. 1999, 16, 207–215.
McCarron, P. A.; Hall, M. Incorporation of Novel L-Alkylcarbonyloxymethyl Prodrugs
Of 5-Fluorouracil into Poly(Lactide-co-Glycolide) Nanoparticles. Int. J. Pharm. 2008, 348, 115–124.
Musumeci, T.; Ventura, C. A.; Giannone, I.; Ruozi, B.; Montenegro, L.; Pignatello, R.;
Puglisi, G. PLA/PLGA Nanoparticles for Sustained Release of Docetaxel. Int. J. Pharm. 2006, 325, 172–179.
Narrainen, A. P.; Pascual, S.; Haddleton, D. M. Amphiphilic Diblock, Triblock, and
Star Block Copolymers by Living Radical Polymerization: Synthesis and Aggregation Behavior. J. Polym. Sci. Pol. Chem. 2002, 40, 439-450.
Ning, F.; Jiang, M.; Mu, M.; Duan, H.; Xie, J. Synthesis of Amphiphilic Block–Graft
Copolymers [Poly(Styrene-b-Ethylene-co-Butylene-b-Styrene)-G-Poly(Acrylic Acid)] and Their Aggregation in Water. J. Polym. Sci. Pol. Chem. 2002, 40, 1253–1266.
Nishiyama, N.; Kataoka, K. Current State, Achievements, and Future Prospects of
Polymeric Micelles as Nanocarriers for Drug and Gene Delivery. Pharmacol. Therapeut. 2006, 112, 630-648.
Nurmi, L.; Holappa, S.; Mikkonen, H.; Seppälä, J. Controlled Grafting of Acetylated
Starch by Atom Transfer Radical Polymerization Of MMA. Eur. Polym. J. 2007, 43, 1372–1382.
Pascu, M. L.; Carstocea, B.; Brezeanu1, M.; Gazdaru, D.; Voicu, L.; Smarandache, A.
Studies On Activated Fluorouracil with Optical Beams, for Use in The Eye Tumours Treatment. Romanian Reports In Physics. 2003, 55, 270-274.
Patri, A. K.; Kukowska-Latallo, J. F.; Baker, J. R. Jr. Targeted Drug Delivery with
Dendrimers: Comparison of the Release Kinetics of Covalently Conjugated Drug and Non-Covalent Drug Inclusion Complex. Adv. Drug Deliver. Rev. 2005, 57, 2203–2214.

121
Prabakaran, D.; Singh, P.; Kanaujia, P.; Vyas, S. P.; Effect of Hydrophilic Polymers on the Release of Diltiazem Hydrochloride from Elementary Osmotic Pumps. Int. J. Pharm. 2003, 259, 173–179.
Qiu, L. Y.; Bae, Y. H.; Polymer Architecture And Drug Delivery. Pharmaceut. Res.
2006, 23, 1-30. Quaglia, F.; Ostacolo, L.; Derosa, G.; Larotonda, M.; Ammendolab, M.; Nese, G;
Maglio, G.; Palumbo, R.; Vauthier, C. Nanoscopic Core-Shell Drug Carriers Made of Amphiphilic Triblock and Star-Diblock Copolymers. Int. J. Pharm. 2006, 324, 56–66.
Radhakumary, C.; Prabha, D. N .; Mathew, S.; Nair C. P. R. Biopolymer Composite of
Chitosan and Methyl Methacrylate for Medical Applications. Trends Biomater. Artif. Organs. 2005, 18, 117-124.
Ritger, P. L.; Peppas, N. A. A Simple Equation for Description of Solute Release I.
Fickian and Non-Fickian Release from Non-Swellable Devices in the Form of Slabs, Spheres, Cylinders or Discs. J. Control. Release. 1987, 5, 23-36.
Rösler, A.; Vandermeulen, G. W. M.; Klok, H. A. Advanced Drug Delivery Devices via
Self-Assembly of Amphiphilic Block Copolymers. Adv. Drug Deliver. Rev. 2001, 53, 95–108.
Sahoo, S. K.; Labhasetwar, V. Nanotech Approaches to Drug Delivery and Imaging.
Drug Discov. Today. 2003, 8, 1112-1120. Sairam, M.; Babu R., Krishna, V.; Rao, K. S. V.; Aminabhavi, T. M.
Poly(Methylmethacrylate)-Poly(Vinyl Pyrrolidone) Microspheres as Drug Delivery Systems: Indomethacin/Cefadroxil Loading and in vitro Release Study. J. Appl. Polym. Sci. 2007, 104, 1860–1865.
Salaam, L. E.; Dean, D.; Bray, T. L. In vitro Degradation Behavior of Biodegradable 4-
Star Micelles. Polymer. 2006, 47, 310–318. Sanmiguel, V.; Limer, A. J.; Haddleton, D. M.; Catalina, F.; Peinado, C. Biodegradable
and Thermoresponsive Micelles of Triblock Copolymers Based on 2-(N,N-Dimethylamino)Ethyl Methacrylate and E-Caprolactone for Controlled Drug Delivery. Eur. Polym. J. 2008, 44, 3853–3863.

122
Sant, V. P.; Smith, D.; Leroux, J. C. Enhancement of Oral Bioavailability of Poorly Water-Soluble Drugs by Poly(Ethylene Glycol)-block-Poly(Alkyl Acrylate-co-Methacrylic Acid) Self-Assemblies. J. Control. Release. 2005, 104, 289–300.
Santos, C.; Martins, M. A.; Franke, R. P.; Almeida, M. M.; Costa, M. E. V. Calcium
Phosphate Granules for Use as a 5-Fluorouracil Delivery System. Ceram. Int. 2009, 35, 1587–1594.
. Sezgin, Z.; Yüksel, N.; Baykara, T. Preparation and Characterization of Polymeric
Micelles for Solubilization of Poorly Soluble Anticancer Drugs. Eur. J. Phar. Biopharm. 2006, 64, 261–268.
Shim, W. S.; Kim, S. W.; Choi, E.-K.; Park, H.- J.; Kim, J.-S.; Lee D. S. Novel pH
Sensitive Block Copolymer Micelles for Solvent Free Drug Loading. Macromol. Biosci. 2006, 6, 179–186.
Silverstein, R. M., Webster, F. X., Kiemle, D. J. Spectrometric Identification of Organic
Compounds, 7th ed.; John Wiley & Sons Inc, 2005; Chapters 2-4. Storey, R. F.; Scheuer, A. D.; Achord, B. C. Amphiphilic Poly(Acrylic Acid-b-Styrene-
b-Isobutylene-b-Styrene-b-Acrylic Acid) Pentablock Copolymers from a Combination of Quasiliving Carbocationic and Atom Transfer Radical Polymerization. Polymer, 2005, 46, 2141–2152.
Sun, X.; Zheng, H.; Huang, X.; Wang, X.; Zhou, Q.-F. Synthesis of Poly(Ethylene
Oxide)-block-Poly(Methyl Methacrylate)-block-Polystyrene Triblock Copolymers by Two Step Atom Transfer Radical Polymerization. Polymer. 2005, 46, 5251-5257.
Svenson, S.; Tomalia, D. A. Dendrimers in Biomedical Applications. Adv. Drug
Deliver. Rev. 2005, 57, 2106– 2129. Tao, L.; Uhric, K. E. Novel Amphiphilic Macromolecules and Their in vitro
Characterization as Stabilized Micellar Drug Delivery Systems. J. Colloid Interf. Sci. 2006, 298, 102–110 .
Tomalia, D. A. Dendrimers: Key Properties of Importance to Nanomedicine.
Nanomedicine. 2006, 2, 269–312.

123
Tomalia, D. A.; Fréchet, J. M. J. Introduction to Dendrimers and Dendritic Polymers. Prog. Polym. Sci. 2005, 30, 217-219.
Tuma, J. J. Engineering Mathematics Handbook, 3rd ed.; McGraw Hill, 1987; p.368. Tunca, U.; Erdoğan, T.; Hızal, G. Synthesis and Characterization of Well-Defined
ABC-Type Triblock Copolymers via Atom Transfer Radical Polymerization and Stable Free-Radical Polymerization. J. Polym. Sci. Pol. Chem. 2002, 40, 2025–2032.
Ulbrich, K.; Pechar, M.; Etrych, T.; Jelínková, M.; Kováø, M.; Øíhová, B.; Polymer
Carriers for Targeted Drug Delivery and Controlled Drug Release. Materials Structure. 2003, 10, 3-5.
Wang, G.; Henselwood, F.; Liu, G. Water-Soluble Poly(2-Cinnamoylethyl
Methacrylate)-block-Poly(Acrylic Acid) Nanospheres as Traps for Perylene. Langmuir. 1998, 14, 1554-1559.
Wei, H.; Zhang, X.; Cheng, C.; Cheng, S. X.; Zhuo, R. X. Self-Assembled,
Thermosensitive Micelles of a Star Block Copolymer Based on PMMA and PNIPAAM for Controlled Drug Delivery. Biomaterials. 2007, 28, 99–107.
Xie, D.; Yang, Y.; Zhao, J.; Park, J. G.; Zhang, J. T. A Novel Comonomer-Free Light-
Cured Glass-Ionomer Cement for Reduced Cytotoxicity and Enhanced Mechanical Strength. Dent. Mater. 2006, 23, 994-1003.
Yang, H. C.; Hon, M. H. The Effect of the Molecular Weight of Chitosan Nanoparticles
and Its Application on Drug Delivery. Microchem. J. 2009, 92, 87–91. Yang, Z.; Liu, J.; Huang, Z.; Shi, W. Crystallization Behavior and Micelle Formation of
Star-Shaped Amphiphilic Block Copolymer Based on Dendritic Poly(Ether-Amide). Eur. Polym. J. 2007, 43, 2298–2307.
Yin, M.; Habichera, W. D.; Voit, B.; Preparation of Functional Poly(Acrylates and
Methacrylates) and Block Copolymers Formation Based on Polystyrene Macroinitiator by ATRP. Polymer. 2005, 46, 3215–3222.
Yin, N.; Chen, K.; Kang, W. Preparation of BA/ST/AM Nano Particles by Ultrasonic
Emulsifier-Free Emulsion Polymerization. Ultrason. Sonochem. 2006, 13, 345–351.

124
Yu, H.; Peng, J.; Zhai, M.; Li, J.; Wei, G.; Qiao, J. Synthesis and Characterization of Poly (n-Butyl Acrylate)-Poly(Methyl Methacrylate) Latex Interpenetrating Polymer Networks by Radiation-Induced Seeded Emulsion Polymerization. Radiat. Phys. Chem. 2006, 76, 1746–1750.
Yu, Z.-Q.; Ni, P.-H.; Li, J.-A.; Zhu, X.-L. Miniemulsion Copolymerization of Methyl
Methacrylate and Butyl Acrylate in the Presence of Vinyl Siloxane Rubber. Colloid Surfaces A, 2004, 242, 9–15.
Yuan, W.; Yuan, J.; Zheng, S.; Hong, X. Synthesis, Characterization, and Controllable
Drug Release of Dendritic Star-Block Copolymer by Ring-Opening Polymerization and Atom Transfer Radical Polymerization. Polymer. 2007, 48, 2585-2594.
Zhang, Z.; Zhang, Q.; Wang, J.; Shi, X.; Zhang, J.; Song, H.; Synthesis and Drug
Release in vitro of Porphyran Carrying 5-Fluorouracil. Carbohyd. Polym. 2010, 79, 628-632.
Zhang, Y.; Jiang, M.; Zhao, J.; Chen, D. Thermo-Sensitive Core–Shell Nanoparticles as
Potential Drug Carrier. Eur. Polym. J. 2007, 43, 4905-4915. Zhang, Z.; Grijpma, D. W.; Feijen, J. Poly(Trimethylene Carbonate) and Monomethoxy
Poly(Ethylene Glycol)-block-Poly(Trimethylene Carbonate) nanoparticles for the controlled release of dexamethasone. J. Control. Release. 2006, 111, 263–270.
Zhang, Y.; Zhuo, R. X. Synthesis and Drug Release Behavior of Poly (Trimethylene
Carbonate)–Poly(Ethyleneglycol)–Poly(Trimethylene Carbonate) Nanoparticles. Biomaterials. 2005a, 26, 2089–2094.
Zhang, Y.; Zhuo, R. X. Synthesis, characterization, and in vitro 5-FU Release Behavior
of Poly(2,2-Dimethyltrimethylene Carbonate)-Poly(Ethylene Glycol)-Poly(2,2-DimethylTrimethylene Carbonate) Nanoparticles. J. Biomed. Mater. Res. 2005b, 76, 674–680.
Zhao, Y. L.; Gong, A. J.; Jiang, J.; Liu, H. W.; Chen, C. F.; Xi, F. Synthesis of
Dendritic-Linear Block Copolymers by Atom Transfer Radical Polymerization. Chinese Chem. Lett. 2001, 12, 595-596.
Zheng, D.; Li, X.; Xu, H.; Lu, X.; Hu, Y.; Fan, W. Study on Docetaxel Loaded
Nanoparticles with High Antitumor Efficiacy agains Malignant Melanoma. Acta Biochim. Biophys. Sin. 2009, 41, 578-587.

125
Zheng, Y.; Yang, W.; Wang, C.; Hu, J.; Fu, S.; Dong, L.; Wu, L.; Shen, X. Nanoparticles Based on the Complex of Chitosan and Polyaspartic Acid Sodium Salt: Preparation, Characterization and the Use for 5-Fluorouracil Delivery. Eur. J. Phar. Biopharm. 2007, 67, 621–631.
Zhuo, R. X.; Du, B.; Lu, Z. R. In vitro Release of 5-Fluorouracil with Cyclic Core
Dendritic Polymer, J. Control. Release. 1999, 57, 249–257.
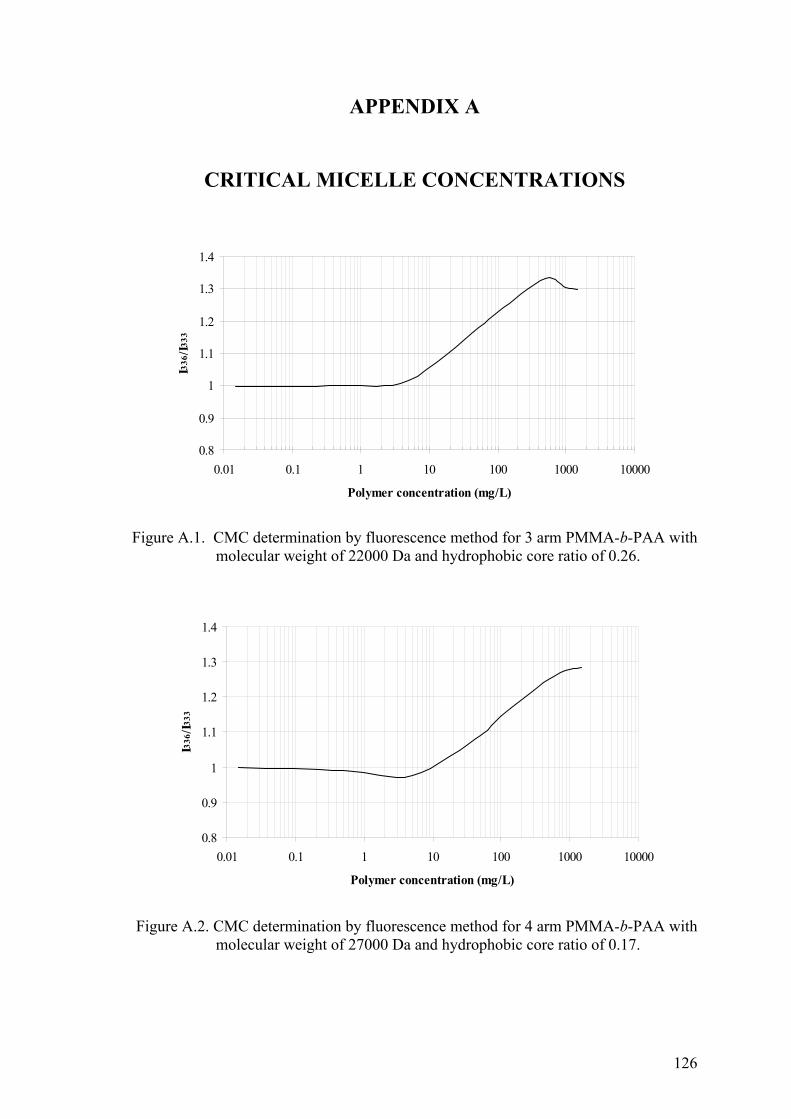
126
APPENDIX A
CRITICAL MICELLE CONCENTRATIONS
Figure A.1. CMC determination by fluorescence method for 3 arm PMMA-b-PAA with molecular weight of 22000 Da and hydrophobic core ratio of 0.26.
0.8
0.9
1
1.1
1.2
1.3
1.4
0.01 0.1 1 10 100 1000 10000
Polymer concentration (mg/L)
I336
/I333
Figure A.2. CMC determination by fluorescence method for 4 arm PMMA-b-PAA with
molecular weight of 27000 Da and hydrophobic core ratio of 0.17.
0.8
0.9
1
1.1
1.2
1.3
1.4
0.01 0.1 1 10 100 1000 10000
Polymer concentration (mg/L)
I336
/I333

127
0.8
0.9
1
1.1
1.2
1.3
1.4
0.1 1 10 100 1000 10000
Polymer concentration (mg/L)
I336
/I333
Figure A.3. CMC determination by fluorescence method for 4 arm PMMA-b-PAA with
molecular weight of 30000 Da and hydrophobic core ratio of 0.23.
0.8
0.9
1
1.1
1.2
1.3
1.4
0.01 0.1 1 10 100 1000 10000
Polymer concentration (mg/L)
I336
/I333
Figure A.4. CMC determination by fluorescence method for 4 arm PMMA-b-PAA with
molecular weight of 33000 Da and hydrophobic core ratio of 0.19.

128
0.8
0.9
1
1.1
1.2
1.3
1.4
0.01 0.1 1 10 100 1000 10000
Polymer concentration (mg/L)
I336
/I333
Figure A.5. CMC determination by fluorescence method for 4 arm PMMA-b-PAA with
molecular weight of 45000 Da and hydrophobic core ratio of 0.11.
0.8
0.9
1
1.1
1.2
1.3
1.4
0.01 0.1 1 10 100 1000 10000
Polymer concentration (mg/L)
I 336
/I33
3
Figure A.6. CMC determination by fluorescence method for 6 arm PMMA-b-PAA with molecular weight of 77000 Da and hydrophobic core ratio of 0.11.

129
0.8
0.9
1
1.1
1.2
1.3
1.4
0.01 0.1 1 10 100 1000 10000
Polymer concentration (mg/L)
I 336
/I33
3
Figure A.7. CMC determination by fluorescence method for 6 arm PMMA-b-PAA with
molecular weight of 45000 Da and hydrophobic core ratio of 0.18.
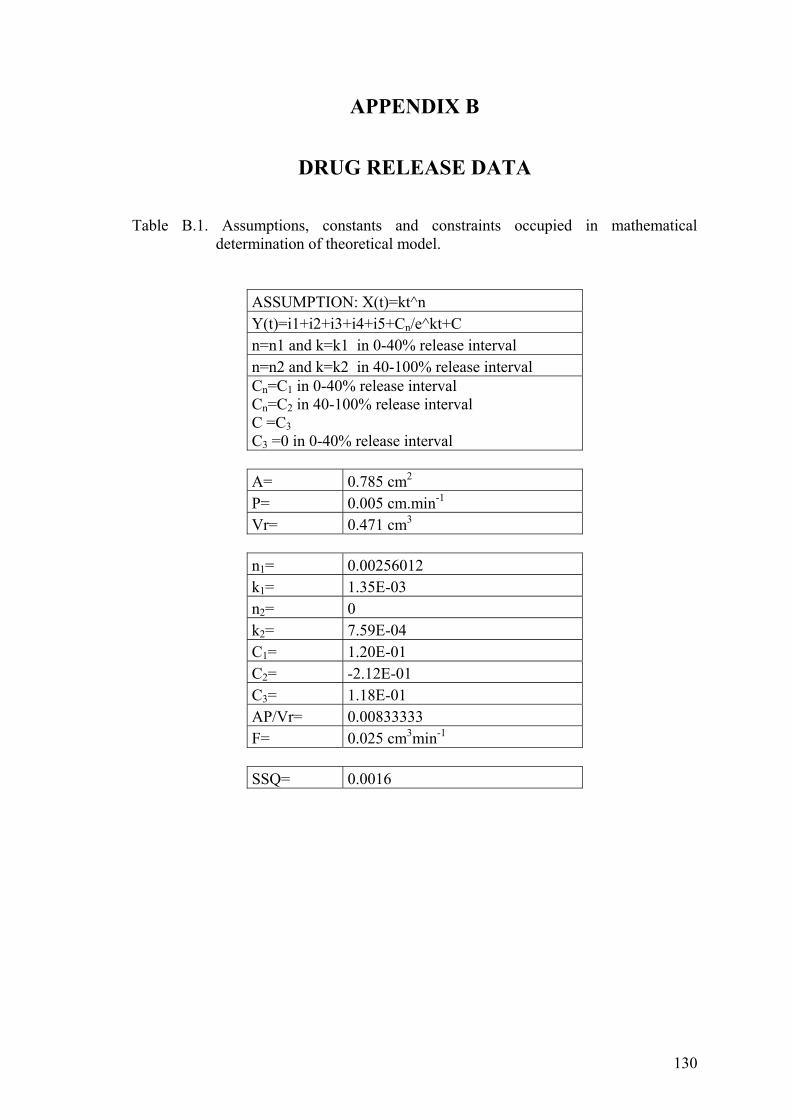
130
APPENDIX B
DRUG RELEASE DATA
Table B.1. Assumptions, constants and constraints occupied in mathematical determination of theoretical model.
ASSUMPTION: X(t)=kt^n Y(t)=i1+i2+i3+i4+i5+Cn/e^kt+C n=n1 and k=k1 in 0-40% release interval n=n2 and k=k2 in 40-100% release interval Cn=C1 in 0-40% release interval Cn=C2 in 40-100% release interval C =C3 C3 =0 in 0-40% release interval
A= 0.785 cm2
P= 0.005 cm.min-1
Vr= 0.471 cm3
n1= 0.00256012 k1= 1.35E-03 n2= 0 k2= 7.59E-04 C1= 1.20E-01 C2= -2.12E-01 C3= 1.18E-01 AP/Vr= 0.00833333 F= 0.025 cm3min-1
SSQ= 0.0016

131
Table B.2. Determination of terms in theoretical model derived and given by Equation 3.31 including the first 5 terms of the alternating series.
time (min) i=1 i=2 i=3 i=4 i=5 Cn/e^kt+C
420 0.01435 0.00411 3.0065E-06 -8.57E-07 4.8898E-07 3.63E-03930 0.03184 0.00412 1.3606E-06 -1.75E-07 4.5131E-08 5.17205E-05
1290 0.0442 0.00412 9.8169E-07 -9.11E-08 1.6925E-08 2.57501E-061580 0.05416 0.00412 8.0192E-07 -6.07E-08 9.216E-09 2.29739E-072110 0.07239 0.00413 6.0094E-07 -3.41E-08 3.8725E-09 2.77396E-092660 0.09131 0.00413 4.7697E-07 -2.15E-08 1.934E-09 2.8352E-113200 0.1099 0.00413 3.9667E-07 -1.48E-08 1.1113E-09 3.14963E-133620 0.12436 0.00413 3.5075E-07 -1.16E-08 7.6791E-10 9.51105E-154220 0.14503 0.00413 3.01E-07 -8.54E-09 4.8492E-10 6.40849E-174785 0.1645 0.00414 2.6555E-07 -6.64E-09 3.3274E-10 5.78033E-195310 0.1826 0.00414 2.3936E-07 -5.40E-09 2.4354E-10 7.27636E-215700 0.19605 0.00414 2.2302E-07 -4.68E-09 1.9693E-10 2.82135E-226330 0.21777 0.00414 2.0088E-07 -3.80E-09 1.4383E-10 1.48051E-247820 0.26918 0.00414 1.6269E-07 -2.49E-09 7.6326E-11 5.99683E-308955 1.70E-01 0.00228 7.9916E-08 -1.07E-09 2.8591E-11 1.18E-01
10395 0.19714 0.00228 6.8872E-08 -7.93E-10 1.8286E-11 1.18E-0111095 0.21042 0.00228 6.4537E-08 -6.96E-10 1.5041E-11 1.18E-0111685 0.22161 0.00228 6.1287E-08 -6.28E-10 1.2878E-11 1.18E-0112825 0.24323 0.00228 5.5852E-08 -5.21E-10 9.742E-12 1.18E-0113245 0.2512 0.00228 5.4086E-08 -4.89E-10 8.8451E-12 1.18E-0113965 0.26485 0.00228 5.1304E-08 -4.40E-10 7.5473E-12 1.18E-0114685 0.27851 0.00228 4.8795E-08 -3.98E-10 6.4916E-12 1.18E-0115405 0.29216 0.00228 4.652E-08 -3.61E-10 5.6239E-12 1.18E-0116125 0.30582 0.00228 4.4448E-08 -3.30E-10 4.9043E-12 1.18E-0116275 0.30866 0.00228 4.404E-08 -3.24E-10 4.7701E-12 1.18E-0117145 0.32516 0.00228 4.181E-08 -2.92E-10 4.0807E-12 1.18E-0117565 0.33313 0.00228 4.0813E-08 -2.78E-10 3.7951E-12 1.18E-0118225 0.34564 0.00228 3.9339E-08 -2.58E-10 3.3979E-12 1.18E-0118885 0.35816 0.00228 3.7967E-08 -2.41E-10 3.0542E-12 1.18E-0119125 0.36271 0.00228 3.7492E-08 -2.35E-10 2.9408E-12 1.18E-0120685 0.3923 0.00228 3.4672E-08 -2.01E-10 2.3248E-12 1.18E-0121405 0.40595 0.00228 3.3508E-08 -1.87E-10 2.0982E-12 1.18E-0121675 0.41107 0.00228 3.3092E-08 -1.83E-10 2.0208E-12 1.18E-0122395 0.42473 0.00228 3.2031E-08 -1.71E-10 1.8323E-12 1.18E-0122765 0.43174 0.00228 3.1511E-08 -1.66E-10 1.7444E-12 1.18E-0123085 0.43781 0.00228 3.1076E-08 -1.61E-10 1.673E-12 1.18E-0123145 0.43895 0.00228 3.0995E-08 -1.60E-10 1.66E-12 1.18E-01
(Cont. on next page)

132
Table B.2. (cont.) time (min) i=1 i=2 i=3 i=4 i=5 C1/e^Kt+C3 24375 0.46228 0.00228 2.9435E-08 -1.45E-10 1.4214E-12 1.18E-0124885 0.47195 0.00228 2.8834E-08 -1.39E-10 1.3358E-12 1.18E-0125665 0.48674 0.00228 2.7959E-08 -1.30E-10 1.2178E-12 1.18E-0126115 0.49528 0.00228 2.7479E-08 -1.26E-10 1.156E-12 1.18E-0127105 0.51405 0.00228 2.6478E-08 -1.17E-10 1.034E-12 1.18E-0127265 0.51709 0.00228 2.6323E-08 -1.16E-10 1.0159E-12 1.18E-0127375 0.51917 0.00228 2.6217E-08 -1.15E-10 1.0037E-12 1.18E-0127395 0.51955 0.00228 2.6198E-08 -1.14E-10 1.0015E-12 1.18E-0127585 0.52316 0.00228 2.6018E-08 -1.13E-10 9.8097E-13 1.18E-0127585 0.52316 0.00228 2.6018E-08 -1.13E-10 9.8097E-13 1.18E-0128835 0.54686 0.00228 2.4893E-08 -1.03E-10 8.5894E-13 1.18E-01

133
Table B.3. Calculation of theoretical values of Mt and Mt/M.
time (h) time (min) Mt exp Mt theo Error
Square Error Mt/M exp Mt/M theo
7.0 420 0.01385 0.01387 0.0000 0.0000 0.0221 0.021715.5 930 0.02808 0.02777 0.0003 0.0000 0.0447 0.043521.5 1290 0.0383 0.0401 -0.0017 0.0000 0.0611 0.062826.3 1580 0.0455 0.0500 -0.0045 0.0000 0.0725 0.078435.2 2110 0.0626 0.0683 -0.0057 0.0000 0.0997 0.106944.3 2660 0.0897 0.0872 0.0025 0.0000 0.1429 0.136553.3 3200 0.1093 0.1058 0.0035 0.0000 0.1741 0.165660.3 3620 0.1229 0.1202 0.0027 0.0000 0.1958 0.188370.3 4220 0.1367 0.1409 -0.0042 0.0000 0.2177 0.220779.8 4785 0.1566 0.1604 -0.0038 0.0000 0.2494 0.251188.5 5310 0.1772 0.1785 -0.0013 0.0000 0.2823 0.279595.0 5700 0.2044 0.1919 0.0125 0.0002 0.3256 0.3005
105.5 6330 0.2187 0.2136 0.0050 0.0000 0.3484 0.3346130.3 7820 0.2565 0.2650 -0.0086 0.0001 0.4086 0.4151149.3 8955 0.2787 0.2852 -0.0066 0.0000 0.4439 0.4467173.3 10395 0.3160 0.3125 0.0035 0.0000 0.5035 0.4894184.9 11095 0.3254 0.3258 -0.0005 0.0000 0.5183 0.5102194.8 11685 0.3328 0.3370 -0.0042 0.0000 0.5302 0.5278213.8 12825 0.3533 0.3586 -0.0053 0.0000 0.5629 0.5616220.8 13245 0.3611 0.3666 -0.0055 0.0000 0.5752 0.5741232.8 13965 0.3772 0.3802 -0.0030 0.0000 0.6009 0.5955244.8 14685 0.3943 0.3939 0.0004 0.0000 0.6282 0.6169256.8 15405 0.4135 0.4075 0.0060 0.0000 0.6588 0.6382268.8 16125 0.4227 0.4212 0.0015 0.0000 0.6734 0.6596271.3 16275 0.4314 0.4240 0.0073 0.0001 0.6872 0.6641285.8 17145 0.4408 0.4405 0.0003 0.0000 0.7023 0.6899292.8 17565 0.4483 0.4485 -0.0002 0.0000 0.7142 0.7024303.8 18225 0.4594 0.4610 -0.0016 0.0000 0.7319 0.7220314.8 18885 0.4712 0.4735 -0.0024 0.0000 0.7506 0.7416318.8 19125 0.4853 0.4781 0.0072 0.0001 0.7732 0.7487344.8 20685 0.5052 0.5077 -0.0025 0.0000 0.8048 0.7951356.8 21405 0.5182 0.5213 -0.0031 0.0000 0.8256 0.8164361.3 21675 0.5267 0.5265 0.0002 0.0000 0.8391 0.8245373.3 22395 0.5363 0.5401 -0.0038 0.0000 0.8544 0.8459379.4 22765 0.5498 0.5471 0.0027 0.0000 0.8760 0.8568384.8 23085 0.5678 0.5532 0.0146 0.0002 0.9045 0.8663385.8 23145 0.5694 0.5543 0.0151 0.0002 0.9072 0.8681406.3 24375 0.5844 0.5777 0.0067 0.0000 0.9310 0.9047
(Cont. on next page)

134
Table B.3. (cont.)
time (h) time (min) Mt exp Mt theo Error
Square Error Mt/M exp Mt/M theo
414.8 24885 0.5949 0.5873 0.0076 0.0001 0.9478 0.9198427.8 25665 0.6030 0.6021 0.0008 0.0000 0.9606 0.9430435.3 26115 0.6151 0.6107 0.0044 0.0000 0.9799 0.9563451.8 27105 0.6227 0.6294 -0.0067 0.0000 0.9921 0.9857454.4 27265 0.6257 0.6325 -0.0068 0.0000 0.9968 0.9905456.3 27375 0.6267 0.6346 -0.0079 0.0001 0.9984 0.9938456.6 27395 0.6277 0.6349 -0.0073 0.0001 1.0000 0.9944459.8 27585 0.6277 0.6385 -0.0109 0.0001 1.0000 1.0000459.8 27585 0.6277 0.6385 -0.0109 0.0001 1.0000 1.0000480.6 28835 0.6277 0.6623 -0.0346 0.0012 1.0000 1.0000

135
APPENDIX C
PARTICLE SIZE ANALSIS BY ZETASIZER
TABLE C.1. Particle size analysis of 4 arm PMMA-b-PAA having 1mg/ml concentration in PBS
Size(nm) Intensity Volume Number
7.5 0.0 0.0 0.0 8.6 0.0 0.0 0.0 9.9 0.0 0.0 0.0 11.4 0.0 0.0 0.0 13.1 0.0 0.0 0.0 15.1 0.0 22.6 25.0 17.4 12.7 45.2 49.9 20.0 0.0 22.6 25.0
23.0 0.0 0.0 16.4 26.4 0.0 0.0 0.0 30.4 0.0 0.0 0.0 34.9 0.0 0.0 0.0 40.2 0.0 0.0 0.0 46.2 0.0 0.0 0.0 53.2 0.0 0.0 0.0 61.2 0.0 2.3 0.0 70.3 79.1 4.7 0.1 80.9 7.8 2.5 0.0 93.1 0.0 0.1 0.0 107.0 0.0 0.0 0.0 123.1 0.0 0.0 0.0 141.6 0.0 0.0 0.0 162.9 0.4 0.0 0.0 Peak Analysis by intensity
Peak Area Mean Width 1 12.7 17.4 2.4 2 86.9 71.3 10.5
Peak Analysis by volume
Peak Area Mean Width 1 90.4 17.4 4.9 2 9.6 71.3 20.6
Peak Analysis by number
Peak Area Mean Width 1 99.8 17.4 4.9

136
TABLE C.2. Particle size analysis of 4 arm PMMA-b-PAA having 2 mg/ml concentration in PBS.
Size(nm) Intensity Volume Number
6.4 0.0 0.0 0.0 8.1 0.0 0.0 0.0 10.2 0.0 16.5 20.7 12.8 4.3 39.9 45.6 16.2 3.6 30.3 29.3 20.3 0.0 6.9 4.3 25.6 0.0 0.0 0.0 32.2 0.0 0.0 0.0
40.6 0.0 0.0 0.0 51.1 0.0 0.5 0.0 64.4 14.9 2.0 0.0 81.0 61.3 2.6 0.0 102.0 15.8 1.3 0.0 128.5 0.0 0.1 0.0 161.7 0.0 0.0 0.0 203.7 0.0 0.0 0.0 256.4 0.0 0.0 0.0 322.8 0.0 0.0 0.0 406.5 0.0 0.0 0.0 511.8 0.0 0.0 0.0 644.3 0.0 0.0 0.0 811.2 0.0 0.0 0.0 1021.4 0.0 0.0 0.0 1286.0 0.0 0.0 0.0
Peak Analysis by intensity
Peak Area Mean Width 1 8.0 14.3 6.3 2 92.0 81.9 25.2
Peak Analysis by volume
Peak Area Mean Width 1 93.5 14.0 7.4 2 6.5 79.0 42.9
Peak Analysis by number
Peak Area Mean Width 1 100.0 13.6 6.8

137
TABLE C.3. Particle size analysis of 4 arm PMMA-b-PAA having 4 mg/ml concentration in PBS.
Size(nm) Intensity Volume Number 5.1 0.0 0.0 0.0 6.5 0.0 0.0 0.0 8.2 0.0 0.0 0.0 10.3 0.0 0.0 0.0 12.9 0.0 0.0 0.0 16.3 0.0 24.3 25.0 20.5 19.9 48.6 50.0 25.8 0.0 24.3 25.0 32.5 0.0 0.0 0.0 40.9 0.0 0.0 0.0 51.5 0.0 0.0 0.0 64.8 0.0 0.0 0.0 81.6 0.0 0.3 0.0 102.8 23.0 0.8 0.0 129.4 50.1 0.9 0.0 162.9 0.0 0.3 0.0 205.1 0.6 0.0 0.0 258.3 0.0 0.0 0.0 325.2 0.0 0.0 0.0 409.4 0.0 0.0 0.0 515.5 0.0 0.0 0.0 649.0 3.9 0.1 0.0 817.1 3.2 0.2 0.0 1028.8 0.0 0.1 0.0 Peak Analysis by intensity Peak Area Mean Width 1 19.9 20.5 4.8 2 73.0 121.0 41.3 3 7.1 725.6 320.2 Peak Analysis by volume Peak Area Mean Width 1 97.3 20.8 9.5 2 2.3 118.9 66.9 Peak Analysis by number Peak Area Mean Width 1 100.0 20.8 9.5

138
TABLE C.4. Particle size analysis of 4 arm PMMA-b-PAA having 6 mg/ml concentration in PBS.
Size(nm) Intensity Volume Number 11.1 0.0 0.0 0.0 13.9 0.0 14.3 18.5 17.5 3.6 38.6 43.5 22.1 5.0 34.3 31.5 27.8 0.0 10.0 6.5 35.0 0.0 0.0 0.0 44.1 0.0 0.0 0.0 55.5 0.0 0.0 0.0 69.9 0.0 0.0 0.0 88.0 0.0 0.0 0.0 110.7 0.0 0.3 0.0 139.4 25.0 0.5 0.0 175.5 0.0 0.3 0.0 221.0 0.0 0.1 0.0 278.3 29.0 0.6 0.0 350.3 37.4 0.7 0.0 441.1 0.0 0.3 0.0 555.3 0.0 0.0 0.0 699.2 0.0 0.0 0.0 880.3 0.0 0.0 0.0 1108.3 0.0 0.0 0.0 1395.4 0.0 0.0 0.0 1756.9 0.0 0.0 0.0 2212.0 0.0 0.0 0.0 Peak Analysis by intensity Peak Area Mean Width 1 8.6 20.2 8.5 2 25.0 139.4 32.4 3 66.4 318.8 137.8 Peak Analysis by volume Peak Area Mean Width 1 97.1 19.7 10.9 2 1.2 150.0 64.8 3 1.7 333.1 175.0 Peak Analysis by number Peak Area Mean Width 1 100.0 19.0 9.9

139
TABLE C.5. Particle size analysis of 4 arm PMMA-b-PAA having 1 mg/ml concentration in PBS after three days of degradation.
Size(nm) Intensity Volume Number 5.7 0.0 0.0 0.0 7.2 0.0 0.0 0.0 9.1 0.0 0.0 0.0 11.4 0.0 0.0 0.0 14.4 0.0 0.0 0.0 18.1 0.0 5.7 10.7 22.8 1.7 24.1 33.6 28.7 7.8 35.7 37.1 36.2 5.4 21.8 16.4 45.6 0.0 4.5 0.0 57.4 0.0 0.0 0.0 72.2 0.0 0.2 0.0 91.0 3.5 1.4 0.0 114.5 33.9 3.1 0.0 144.2 43.3 2.6 0.0 181.5 4.4 0.9 0.0 228.5 0.6 0.0 0.0 287.7 0.0 0.0 0.0 362.3 0.0 0.0 0.0 456.1 0.0 0.0 0.0 574.3 0.6 0.0 0.0 723.1 3.5 0.0 0.0 910.4 8.0 0.0 0.0 1146.2 0.0 0.0 0.0
Peak Analysis by intensity
Peak Area Mean Width 1 15.0 30.8 22.0 2 85.0 132.1 55.1
Peak Analysis by volume
Peak Area Mean Width 1 91.8 29.1 17.1 2 8.2 126.4 75.1
Peak Analysis by number
Peak Area Mean Width 1 99.9 27.2 15.7

140
TABLE C.6. Particle size analysis of 4 arm PMMA-b-PAA having 2 mg/ml concentration in PBS after 3 days of degradation.
Size(nm) Intensity Volume Number 4.6 0.0 0.0 0.0 5.8 0.0 0.0 0.0 7.3 0.0 0.0 0.0 9.2 0.0 0.0 0.0 11.6 0.0 15.2 19.5 14.6 6.6 38.6 44.3 18.3 7.1 32.3 30.2 23.1 1.2 9.6 5.7 29.1 0.0 0.7 0.2 36.6 0.0 4.5 0.0 46.1 2.5 0.2 0.0 58.0 6.9 0.6 0.0 73.1 9.4 0.9 0.0 92.0 10.7 0.7 0.0 115.8 14.3 0.5 0.0 145.9 18.6 0.3 0.0 183.6 16.4 0.2 0.0 231.2 6.4 0.1 0.0 291.1 0.0 0.1 0.0 366.5 0.0 0.0 0.0 461.5 0.0 0.0 0.0 581.0 0.0 0.0 0.0 731.5 0.0 0.0 0.0 921.0 0.0 0.0 0.0
Peak Analysis by intensity
Peak Area Mean Width 1 14.9 17.1 8.0 2 85.1 129.6 144.6
Peak Analysis by volume
Peak Area Mean Width 1 96.3 16.4 9.0 2 3.7 80.4 55.2
Peak Analysis by number
Peak Area Mean Width 1 99.9 15.7 8.0

141
TABLE C.7. Particle size analysis of 4 arm PMMA-b-PAA having 4 mg/ml concentration in PBS after 3 days of degradation.
Size(nm) Intensity Volume Number 5.2 0.0 0.0 0.0 6.1 0.0 0.0 0.0 7.3 0.0 0.0 0.0 8.6 0.0 0.0 0.0 10.2 0.0 0.0 0.0 12.1 0.0 0.0 0.0 14.4 0.0 2.7 5.3 17.1 2.5 16.0 23.0 20.2 15.8 32.7 36.2 24.0 22.2 30.9 25.9 28.4 10.7 14.0 8.4 33.7 0.0 2.6 1.1 39.9 0.0 0.0 0.0 47.3 0.0 0.0 0.0 56.1 0.0 0.0 0.0 66.5 0.0 0.0 0.0 78.8 0.7 0.1 0.0 93.4 17.3 0.4 0.0 110.7 22.8 0.4 0.0 131.3 7.9 0.2 0.0 155.6 0.0 0.0 0.0 184.5 0.0 0.0 0.0 218.7 0.0 0.0 0.0 259.2 0.0 0.0 0.0
Peak Analysis by intensity
Peak Area Mean Width 1 51.2 23.4 9.1 2 48.8 107.5 38.2
Peak Analysis by volume
Peak Area Mean Width 1 98.9 22.2 10.7 2 1.1 104.0 46.9
Peak Analysis by number
Peak Area Mean Width 1 100.0 21.0 9.6

142
TABLE C.8. Particle size analysis of 4 arm PMMA-b-PAA having 6 mg/ml concentration in PBS after 3 days of degradation.
Size(nm) Intensity Volume Number 4.3 0.0 0.0 0.0 5.1 0.0 0.0 0.0 6.0 0.0 0.0 0.0 7.1 0.0 0.0 0.0 8.4 0.0 0.0 0.0 10.0 0.0 0.0 0.0 11.8 0.0 0.0 0.0 14.0 0.0 0.0 0.0 16.6 0.0 3.8 5.8 19.7 7.6 28.8 30.8 23.4 70.1 46.1 44.2 27.7 0.0 21.1 19.2 32.9 0.0 0.0 0.0 38.9 0.0 0.0 0.0 46.2 0.0 0.0 0.0 54.7 0.0 0.0 0.0 64.9 0.0 0.0 0.0 76.9 0.0 0.0 0.0 91.2 0.0 0.0 0.0 108.1 0.0 0.0 0.0 128.1 4.8 0.0 0.0 151.9 17.6 0.1 0.0 180.0 0.0 0.0 0.0 213.4 0.0 0.0 0.0
Peak Analysis by intensity
Peak Area Mean Width 1 77.7 23.0 4.2 2 22.3 146.8 30.4
Peak Analysis by volume
Peak Area Mean Width 1 99.8 23.0 8.4
Peak Analysis by number
Peak Area Mean Width 1 100.0 22.7 8.6

143
TABLE C.9. Particle size analysis of 4 arm PMMA-b-PAA having 1 mg/ml concentration in PBS after 7 days of degradation.
Size(nm) Intensity Volume Number 1.1 0.0 0.0 0.0 1.4 0.0 0.0 0.0 1.8 0.0 0.0 0.0 2.2 0.0 5.5 13.8 2.8 1.1 16.3 34.2 3.5 2.1 20.7 30.0 4.4 3.6 18.0 13.5 5.6 5.5 14.2 5.5 7.0 7.9 10.3 2.1 8.8 10.2 6.8 0.7 11.1 12.1 4.1 0.2 14.0 13.0 2.3 0.1 17.6 12.3 1.1 0.0 22.2 10.0 0.5 0.0 27.9 6.6 0.2 0.0 35.2 2.9 0.0 0.0 44.3 0.6 0.0 0.0 55.8 0.0 0.0 0.0 70.2 0.0 0.0 0.0 88.4 0.0 0.0 0.0 111.3 0.6 0.0 0.0 140.2 3.5 0.0 0.0 176.5 8.0 0.0 0.0 222.2 0.0 0.0 0.0
Peak Analysis by intensity
Peak Area Mean Width 1 87.8 14.5 22.0 2 12.2 162.6 55.1
Peak Analysis by volume
Peak Area Mean Width 1 100.0 5.4 4.5
Peak Analysis by number
Peak Area Mean Width 1 100.0 3.5 1.9

144
TABLE C.10. Particle size analysis of 4 arm PMMA-b-PAA having 2 mg/ml concentration in PBS.
Size(nm) Intensity Volume Number 1.2 0.0 0.0 0.0 1.5 0.0 0.0 0.0 1.8 0.0 0.0 0.0 2.3 0.0 0.0 0.0 2.9 0.0 0.0 0.0 3.7 0.0 5.5 12.7 4.6 2.1 17.7 33.0 5.8 5.0 24.3 31.2 7.3 8.3 21.5 15.2 9.2 11.2 15.2 5.7 11.6 12.4 8.9 1.8 14.6 11.4 4.4 0.5 18.3 8.5 1.8 0.1 23.1 4.5 0.6 0.0 29.1 1.4 0.1 0.0 36.6 0.0 0.0 0.0 46.1 0.0 0.0 0.0 58.0 1.2 0.0 0.0 73.0 3.9 0.0 0.0 91.9 7.2 0.0 0.0 115.7 9.2 0.0 0.0 145.7 8.6 0.0 0.0 183.5 5.1 0.0 0.0 231.0 0.0 0.0 0.0
Peak Analysis by intensity
Peak Area Mean Width 1 64.7 12.5 14.7 2 35.3 121.3 111.2
Peak Analysis by volume
Peak Area Mean Width 1 100.0 7.6 6.2
Peak Analysis by number
Peak Area Mean Width
1 100.0 5.7 3.3

145
TABLE C.11. Particle size analysis of 4 arm PMMA-b-PAA having 4 mg/ml concentration in PBS after 7 days of degradation.
Size(nm) Intensity Volume Number 1.2 0.0 0.0 0.0 1.5 0.0 0.0 0.0 1.9 0.0 0.0 0.0 2.4 0.0 0.0 0.0 3.0 0.0 0.0 0.0 3.8 0.0 0.0 0.0 4.8 0.0 0.0 0.0 6.0 0.0 6.3 12.5 7.6 5.5 21.2 33.5 9.5 14.8 29.8 32.7 12.0 21.6 24.2 15.5 15.1 20.7 13.1 4.7 19.1 10.8 4.6 0.9 24.0 0.0 0.8 0.1 30.2 0.0 0.0 0.0 38.0 0.0 0.0 0.0 47.9 0.0 0.0 0.0 60.3 0.0 0.0 0.0 75.9 0.0 0.0 0.0 95.6 6.2 0.0 0.0 120.3 11.5 0.0 0.0 151.5 8.9 0.0 0.0 190.8 0.0 0.0 0.0 240.2 0.0 0.0 0.0
Peak Analysis by intensity
Peak Area Mean Width 1 73.4 13.1 10.3 2 26.6 125.0 71.0
Peak Analysis by volume
Peak Area Mean Width 1 100.0 10.8 7.7
Peak Analysis by number
Peak Area Mean Width 1 100.0 9.2 5.5

146
TABLE C.12. Particle size analysis of 4 arm PMMA-b-PAA having 6 mg/ml concentration in PBS after 7 days of degradation.
Size(nm) Intensity Volume Number 1.9 0.0 0.0 0.0 2.3 0.0 0.0 0.0 2.8 0.0 0.0 0.0 3.4 0.0 0.0 0.0 4.2 0.0 0.0 0.0 5.1 0.0 0.0 0.0 6.2 0.0 0.0 0.0 7.6 0.0 0.0 0.0 9.2 0.0 9.7 14.1 11.3 14.7 30.9 37.5 13.8 32.2 36.6 34.3 16.9 19.0 19.1 12.5 20.6 0.0 3.7 1.6 25.2 0.0 0.0 0.0 30.7 0.0 0.0 0.0 37.6 0.0 0.0 0.0 45.9 0.0 0.0 0.0 56.0 0.0 0.0 0.0 68.5 0.0 0.0 0.0 83.7 0.6 0.0 0.0 102.2 22.5 0.0 0.0 124.9 11.0 0.0 0.0 152.5 0.0 0.0 0.0 186.3 0.0 0.0 0.0 Peak Analysis by intensity
Peak Area Mean Width 1 65.9 14.1 5.9 2 34.1 109.2 31.7
Peak Analysis by volume
Peak Area Mean Width 1 99.9 13.4 7.0
Peak Analysis by number
Peak Area Mean Width 1 100.0 12.7 6.3

147
TABLE C.13. Particle size analysis of 5-FU loaded (in dimethyl formamide) 4 arm PMMA-b-PAA having 2 mg/ml concentration in PBS.
Size(nm) Intensity Volume Number 4.6 0.0 0.0 0.0 5.7 0.0 6.7 14.1 7.2 1.5 20.1 35.1 9.1 2.9 25.2 30.7 11.4 4.5 20.5 13.3 14.4 5.9 13.9 4.8 18.1 6.3 7.9 1.4 22.9 5.4 3.7 0.4 28.8 3.3 1.3 0.1 36.2 1.0 0.3 0.0 45.6 0.0 0.0 0.0 57.4 0.0 0.0 0.0 72.3 0.0 0.0 0.0 91.0 0.9 0.0 0.0 114.6 4.3 0.0 0.0 144.3 9.9 0.0 0.0 181.7 15.2 0.0 0.0 228.7 17.4 0.0 0.0 288.0 14.1 0.0 0.0 362.6 6.7 0.0 0.0 456.5 0.7 0.1 0.0 574.8 0.0 0.0 0.0 723.7 0.0 0.0 0.0 911.2 0.0 0.0 0.0 Peak Analysis by intensity
Peak Area Mean Width 1 30.8 17.7 19.8 2 69.2 224.8 205.1
Peak Analysis by volume
Peak Area Mean Width 1 99.7 11.3 8.9
Peak Analysis by number
Peak Area Mean Width 1 100.0 8.7 4.9

148
TABLE C.14. Particle size analysis of 5-FU loaded (in 1% acetic acid solution) 4 arm PMMA-b-PAA having 2 mg/ml concentration in PBS.
Size(nm) Intensity Volume Number 2.3 0.0 0.0 0.0 2.9 0.0 0.0 0.0 3.6 0.0 0.0 0.0 4.6 0.0 0.0 0.0 5.7 0.0 4.4 11.3 7.2 1.2 14.9 30.5 9.1 3.5 22.6 31.0 11.4 6.7 22.3 17.0 14.4 9.8 17.2 7.1 18.1 11.5 10.6 2.3 22.8 10.4 5.3 0.6 28.8 6.6 2.0 0.1 36.2 2.4 0.5 0.0 45.6 0.0 0.1 0.0 57.4 0.0 0.0 0.0 72.3 0.0 0.0 0.0 91.0 0.8 0.0 0.0 114.6 4.9 0.0 0.0 144.3 11.8 0.0 0.0 181.6 16.2 0.0 0.0 228.7 11.9 0.0 0.0 287.9 2.2 0.0 0.0 362.5 0.0 0.0 0.0 456.4 0.0 0.0 0.0 Peak Analysis by intensity
Peak Area Mean Width 1 52.2 18.8 19.5 2 47.8 180.7 123
Peak Analysis by volume
Peak Area Mean Width 1 99.9 12.3 11.1
Peak Analysis by number
Peak Area Mean Width 1 100.0 9.2 5.8

149
APPENDIX D
PARTICLE SIZE ANALYSIS BY AFM
Appendix C.1. 4 arm PMMA-b-PAA (MW:4900/18000) dissolved in water at 25°C .
Figure D.1. 4 arm PMMA-b-PAA (MW:4900/18000) dissolved in water at 25°C (n=2).

150
Appendix C.3. 4 arm PMMA-b-PAA (MW:4900/18000) degraded in water at 37°C for 1 hour.
Figure D.2. 4 arm PMMA-b-PAA (MW:4900/18000) degraded in water at 37°C for 1 hour (n=2).

151
Figure D.3. 4 arm PMMA-b-PAA (MW:4900/18000) degraded in water at 37°C
for 1 day. .
Figure D.4. 4 arm PMMA-b-PAA (MW:4900/18000) degraded in water at 37°C
for 5 days. .

152
Figure D.6. 4 arm PMMA-b-PAA (MW:4900/18000) degraded in water at 37°C
for 10 days.
Figure D.5. 4 arm PMMA-b-PAA (MW:4900/18000) degraded in water at 37°C
for 7 days. .

VITA
Name: Gözde GENÇ ATİKLER Birth Date and Place: 1972/İSTANBUL Marital Satatus: Married Education: M.S. in Chemical Engineering Department, IZTECH, 2004
B.S. in Chemical Engineering Department, METU, 1995 İzmir Özel Türk Lisesi, 1990
Work Experiences: Research Assistant in IZTECH 2001-2010 R&D Engineer in Far-Per Kimya Ltd. Şti. 1997-1999 Quality Control Laboratory Chief in Bağ Yağları A.Ş. 1996-1997 Reserach Subjects: Nanocrystalline materials, Acrylic polymer synthesis and characterization, Drug loading and controlled drug delivery. Publications: Genc G., Altıntaş O., Batıgün A., Bayraktar, O., Tunca, U., Hızal,
G. Acrylic Star Block Copolymers as Drug Carriers, Biyomut, 2009.
Kocabaş, I., Genç, G., Batıgün, A., Bayraktar, O. Serisin-
Poliakrilik asit Graft Polimerlerin Mukozaya Yapışma Özellikleri, 15. Ulusal Biyoteknoloji Kongresi, 2007.
Genc G., Alp, B., Balköse, D., Ülkü, S., Cireli, A., Moisture Sorption and Thermal Charcteristics of Polyaramide Blend Fabrics. J. Appl. Pol. Sci., 2006, 102, 29-38. Duvarcı, Ö.Ç., Çiftçioğlu, M., Güden, M., Arıkut, G. Preparation and Microstructural Development of Nanocrystalline Titania and Alumina. Key Engineering Materials. 2004, 264-268, 2355-58.
Certificates: Total Quality Management, TSE, 1999 Statistical Process Control, TSE, 1999 Documentation, TSE, 1999