synthetic ion transporters: new analytical approaches for
TRANSCRIPT

Washington University in St. LouisWashington University Open Scholarship
All Theses and Dissertations (ETDs)
January 2010
Synthetic ion transporters: new analyticalapproaches for the investigation of ion binding andtransportIonut CaraselWashington University in St. Louis
Follow this and additional works at: https://openscholarship.wustl.edu/etd
This Dissertation is brought to you for free and open access by Washington University Open Scholarship. It has been accepted for inclusion in AllTheses and Dissertations (ETDs) by an authorized administrator of Washington University Open Scholarship. For more information, please [email protected].
Recommended CitationCarasel, Ionut, "Synthetic ion transporters: new analytical approaches for the investigation of ion binding and transport" (2010). AllTheses and Dissertations (ETDs). 55.https://openscholarship.wustl.edu/etd/55

WASHINGTON UNIVERSITY
Department of Chemistry
Dissertation Examination Committee: George W. Gokel, co-Chair
Kevin Moeller, co-Chair Aaron DiAntonio
John Bleeke Joshua Maurer Liviu Mirica
Synthetic ion transporters: new analytical approaches for the investigation of ion binding and transport
By
Ionut Alexandru Carasel
A dissertation presented to the Graduate School of Arts and Sciences
of Washington University in partial fulfillment of the
requirements for the degree of Doctor of Philosophy
August 2010
Saint Louis, Missouri

ii
ABSTRACT OF THE DISSERTATION Synthetic ion transporters: new analytical approaches for the investigation of ion binding
and transport by
Ionut Alexandru Carasel
Doctor of Philosophy in Chemistry Washington University in St. Louis, 2010
Dr. George W. Gokel, co-Chair Dr. Kevin Moeller, co-Chair
The work reported in this dissertation focuses on synthetic ion transporters
(SATs). SATs have a relatively simple chemical structure but they aggregate, self-
assemble and insert in biological membranes much in the same way as their much more
complex naturally occurring analogs. This makes SATs valuable tools for the
investigation of these supramolecular and membrane related processes with the final goal
of developing new therapeutical agents useful in the treatment of conditions stemming
from ionic imbalances.
Two families of synthetic anion transporters are studied in this dissertation:
pyrogallol[4]arene derivatives and dianilides of isophthalic and dipicolininc acids.
Experiments aimed at investigating their solution behavior, anion binding properties and
the strength of the interactions present in the host•anion adducts employed analytical
techniques such as high performance liquid chromatography, electrospray mass
spectrometry, UV-vis and NMR spectroscopy. Insights derived from these experiments
were instrumental to our understanding of the stability and transport mechanisms
pertaining to these two families of compounds.

iii
Acknowledgements A great number of people contributed to my professional development and
success as a graduate student. First and foremost I would like to thank my research
advisor Professor George W. Gokel. Without his constant support and guidance none of
the work presented in this dissertation would have been possible.
I would like to extend my gratitude to Professor Kevin D. Moeller and Professor
Joshua Maurer for being members in my research advisory committee. Their help and
input throughout my graduate carrier has been invaluable. Also I would like to thank
Professors John Bleeke, Liviu Mirica and Aaron DiAntonio for their time and advice and
for accepting to be members in my dissertation examination committee.
Special recognition should be awarded to Professor Rudolph K. Winter and
Joseph Kramer from the Chemistry Department at University of Missouri St Louis. The
work presented in chapters four and five of this dissertation is a result of our
collaborative work and could not have been performed without their assistance.
In my tenure in the Gokel laboratory I was fortunate enough to meet many gifted
postdoctoral assistants and graduate students: Dr. Robert Pajewski, Jola Pajewska, Dr.
Riccardo Ferdani, Dr. Wei Wang, Dr. Lei You, Dr. Ruiqiong Li, Dr. Elizabeth Elliot, Dr.
Brock Levin, Dr. Natalie Barkey, Dr. Oleg Kulikov, Carl Yamnitz, Megan Daschbach,
Saeedeh Negin, Jason Atkins and Mohit Patel. Working side by side with them helped me
grow and mature as a scientist.
I would like to acknowledge Ema Voinescu, Cristian Jitianu, Bogdan Dinca,
Mugur Kacso, Jennifer Bergstrom, Alina Handorean, Matt van Duzor, Stefan Bennewitz,

iv
Donnie Smith, Matt Lenze, Aileen Bongat, Colin White, Heather Helm and Leo Seballos
for their help and friendship.
Finally, I would like to thank my parents, my sister and all the members of my
family for their love, encouragement and unwavering support.
v
Table of Contents
Abstract…………... ............................................................................................................ ii
Acknowledgements ............................................................................................................ iii
Table of Contents ................................................................................................................ v
List of Figures .................................................................................................................... ix
List of Tables ................................................................................................................... xiv
Chapter 1. Introduction: Biological membranes and ion channels ..................................... 1
Biological membranes ...................................................................................... 2
Membrane permeability .................................................................................... 4
Cellular membrane complexity ......................................................................... 5
Naturally occurring channels and carriers ........................................................ 6
Previous reports of synthetic ion transporters ................................................... 8
Hydraphyles .................................................................................................... 11
Applospans ...................................................................................................... 12
Peptide based transporters ............................................................................... 13
Pyrogallol[4]arenes ......................................................................................... 14
References ....................................................................................................... 17
Chapter 2. Triacsin C and derivatives: Synthesis and study of biological properties ....... 20
ntroduction ............................................................................................................ 21

vi
Inhibitory potency of the Triacsin A, B, C and D ........................................... 22
Triacsin C use in biochemical reseach ............................................................ 23
Enzymatic mechanism for LC Acyl-CoA synthetase ..................................... 23
Study of Triacsin C analogs ............................................................................ 27
Results ............................................................................................................. 30
Conclusions ..................................................................................................... 31
Experimental section ....................................................................................... 33
References ....................................................................................................... 34
Chapter 3. Pyrogallol[4]arenes solution equilibrium studies ............................................ 35
Introduction ..................................................................................................... 36
Pyrogallol[4]arene synthesis ........................................................................... 36
Crystallization motifs for pyrogallol[4]arenes ................................................ 38
Membrane properties of C11 pyrogallol[4]arenes .......................................... 39
Results ............................................................................................................. 44
Conclusions ..................................................................................................... 47
References ....................................................................................................... 50
Chapter 4. Dipicolinamides and Isophthalamides Anion transport studies ...................... 51
Introduction ..................................................................................................... 52
Results ............................................................................................................. 56

vii
Compounds studied ......................................................................................... 57
Computational studies ..................................................................................... 57
Solution based studies ..................................................................................... 60
Electrospray mass sprectrometry .................................................................... 61
Conclusions ..................................................................................................... 67
Experimental Section ...................................................................................... 69
References ....................................................................................................... 70
Chapter 5. Gas Phase Ion Selectivity of 1,3-Diarylamides ............................................... 72
Introduction ..................................................................................................... 73
Computational data ......................................................................................... 75
Electrospray mass spectrometry experiments ................................................. 81
NMR titration experiments ............................................................................. 93
HPLC studies .................................................................................................. 98
UV-Vis studies ................................................................................................ 99
Colorimetric behavior of Pyr and Iso in the presence of various anions. ..... 103
Conclusions ................................................................................................... 107
Experimental section ..................................................................................... 109
References ..................................................................................................... 112
Chapter 6 Future studies ................................................................................................. 114

viii
Triacsin C analogs ......................................................................................... 115
Pyrogallol[4]arenes solution equilibrium ..................................................... 119
New dipicolinic and isophthalamide dianilides ............................................ 121
References ..................................................................................................... 123
Resume………… ............................................................................................................ 124

ix
List of Figures
Chapter 1
Figure 1.1 Cartoon representation of an eukaryotic cell ..................................................... 2
Figure 1.2 Structure of a phospholipid, DOPC. .................................................................. 3
Figure 1.3 Calculated structure of a phospholipid bilayer .................................................. 4
Figure 1.4..4 Membrane permeability ................................................................................ 5
Figure 1.5 Cartoon representation of the phospholipid bilayer with embedded proteins ... 6
Figure 1.6 Carrier (top panel) and channel (lower panel) transport mechanisms. .............. 7
Figure 1.7 Ribbon representation of the StClC dimer from the extracellular side. A Cl¯
ion in the selectivity filter is represented as a green sphere. ............................................... 7
Figure 1.8 A) Tabushi channel. B) Gin's cyclodextrin channel .......................................... 9
Figure 1.9 A) Davis's synthetic ion channels. B) calix[4]arene-crown synthetic ion
channels............................................................................................................................... 9
Figure 1.10 A) Flyes tartaric crown ether ion transporter. B) Voyer family of synthetic
ion transporter. C) Matile polyphenylene ion transporter ................................................. 10
Figure 1.11 General structure of the hydraphiles. ............................................................ 11
Figure 1.12 Putative transport mechanism for hydraphyles. ............................................ 12
Figure1.13 Structure of an applospan ............................................................................... 12
Figure 1.14 General structure of the peptide based ion transporters ................................ 13
Figure 1.15 Putative transport mechanism for the peptide based transporters ................. 14
Figure 1.16 General structure of pyrogallol[4]arenes ....................................................... 15

x
Figure 1.17. Dipicolinic and isophthalic acid derivatives ................................................ 15
Chapter 2
Figure 2.1. Structure of Triacsin A, B, C, D. .................................................................... 21
Figure 2. 2 Inhibitory activity of Triacsin A, B, C and D. ................................................ 22
Figure 2. 3 Enzymatic reactions for fatty acids esterification. ......................................... 24
Figure 2. 4 Structure of AMP and Coenzyme A ............................................................... 24
Figure 2. 5 The structure of LC Acyl-CoA synthetase from Thermus thermophilus. ...... 25
Figure 2. 6 The active site of the LC Acyl-CoA synthetase from Thermus thermophilus
........................................................................................................................................... 26
Figure 2. 7 Triacsin C and derivatives. ............................................................................. 27
Chapter 3
Figure 3. 1 Various conformations of calixarenes. ........................................................... 37
Figure 3. 2 Bilayer and Capsule structure for pyrogallol[4]arenes ................................... 38
Figure 3. 3 Schematic representation of a planar bilayer apparatus. ................................ 39
Figure 3. 4 A representative trace for a planar bilayer experiment .................................. 40
Figure 3. 5 Planar bilayer traces for C11 bilayer. ............................................................. 41
Figure 3. 6 HPLC traces for C10 capsule (top) and C10 bilayer (bottom). ..................... 45
Figure 3. 7 HPLC traces for C10 capsule and C10 bilayer ................................................. 46
Figure 3. 8 Aggregation behavior of pyrogallol[4]arenes. ............................................... 48

xi
Chapter 4
Figure 4. 1 Cartoon representation of carrier and channel (lower panel) mechanism. ..... 52
Figure 4. 2 Synthesis and structure of Crabtree’s anion receptor. .................................... 54
Figure 4. 3 Side view of the crystal structure of the host-guest complex formed by
Crabtree’s receptor. ........................................................................................................... 54
Figure 4.4 Li’s receptor and the planar bilayer traces. .................................................... 55
Figure 4. 5 Structures of the compounds studied .............................................................. 57
Figure 4. 6 The synthesis of studied compounds .............................................................. 57
Figure 4. 7 Gas phase conformation of unsubstituted isophthalamide (left) and
dipicolinamide (right) in the absence of guest anions ...................................................... 58
Figure 4. 8 Conformations of p-nitro substituted isophthalamide (A) and dipicolinamide
(B) with a Cl¯ guest .......................................................................................................... 59
Figure 4. 9 ES-MS ionization process .............................................................................. 61
Figure 4. 10 Competitive ES-MS experiment between the p-nitro and the unsubstituted
isophthalamide .................................................................................................................. 63
Chapter 5
Figure 5. 1 General structure of compounds 1-6 .............................................................. 74
Figure 5. 2 Ionic radii for F¯, Cl¯ and Br¯ ....................................................................... 75
Figure 5. 3. Conformation of unsubstituted isophthalamides (left) and dipicolinamides
(right). ............................................................................................................................... 76
Figure 5. 4 The method of data collection used for gas phase calculations. ..................... 77
Figure 5. 5 Host Iso binding Cl¯ ...................................................................................... 77

xii
Figure 5. 6 Calculated gas phase structure of the Pyr+F¯complex................................... 78
Figure 5. 7 Calculated gas phase structure of the Iso+F¯. ................................................ 79
Figure 5. 8 UV-vis spectrum of Pyr in DMSO in the presence of excess Na+DMSO¯ ... 86
Figure 5. 9 UV-Vis traces in EtOAc for 1 eq Pyr and 10 eq F¯. Final [Pyr]=33 µM. .... 87
Figure 5. 10 UV-vis titration of Pyr with Cl¯ ................................................................... 88
Figure 5. 11. 1HNMR spectrum of Pyr............................................................................. 94
Figure 5. 12. Assignment of the aromatic protons of Pyr. ............................................... 95
Figure 5. 13. 2D 1HNMR of the aromatic region for Pyr. ................................................ 96
Figure 5. 14. Comparison of the spectra of Pyr (top panel) and Pyr with 1 eq TBAF
(bottom panel). .................................................................................................................. 97
Figure 5. 15. HPLC traces for the titration of Pyr with increasing equivalents of TBAF.
........................................................................................................................................... 98
Figure 5. 16. UV-Vis traces in EtOAc for 1 eq Pyr with 10 eq Cl¯ (green) and 1 eq Pyr
with 10 eq F¯ (yellow). Final [Pyr]=33 µM. .................................................................... 99
Figure 5. 17 Titration of Pyr with TBAF in EtOAc. ...................................................... 101
Figure 5. 18. Isosbestic point observed in the titration of Pyr with TBAF. ................... 102
Figure 5. 19 Changes in λmax when titrating Pyr with F¯ .............................................. 102
Figure 5. 20. Change in color when adding 1 eq of anion to 1 eq of Host in DMSO. Final
[Host]=0.5 mM. .............................................................................................................. 104
Figure 5. 21 Plausible binding state for Iso with an acetic acid derivative. ................... 104
Figure 5. 22 Titration of Pyr with 0-10 eq DHP. ........................................................... 105
Figure 5. 23 Titration of Iso with 0-10 eq DHP ............................................................. 106

xiii
Figure 5. 24 Blow up of the new absorption peak formed upon titrating 1 eq of Iso with
0-10 eq DHP ................................................................................................................... 107
Chapter 6
Figure 6. 1 Structure of Triacsin C and analogs. ............................................................ 115
Figure 6. 2 Variations of the hydrophilic chain. ............................................................. 116
Figure 6. 3 The active site of the LC Acyl-CoA synthetase from Thermus thermophilus
(image reproduced from Hisanaga et al) ......................................................................... 117
Figure 6. 4 Second set of Triacsin C analogs. ................................................................. 118
Figure 6. 5 General structure of a pyrogallol[4]arene. ................................................... 119
Figure 6. 6 HPLC traces for C10 capsule (top) and C10 bilayer (bottom). .................... 120
Figure 6. 7 Linked monomers with potential use in the study of the aggregation and
transport behavior of Pyr. ............................................................................................... 121
Figure 6. 8 Plausible binding state for Iso with an acetic acid derivative. ..................... 122
Figure 6. 9 Potential substitution patterns for Pyr. ......................................................... 122

xiv
List of Tables
Table 2.1. IC50 determined for Triacsin C and derivatives. .............................................. 28
Table 2.2. IC50 for BP1 and BP2 ....................................................................................... 31
Table 4. 1Competitive ES-MS experiment data for the compounds studied. ................... 64
Table 4. 2 Species present in the cluster of peaks corresponding to a dimmer chloride
adduct ……………………………………………………………………………………66
Table 5. 1. Computational data collected for adducts of Pyr and Iso with halogenated
anions (F¯, Cl¯, and Br¯). All experiments were performed at the DFT level of theory. 79
Table 5.2 Host single anion control experiments for Pyr ................................................. 83
Table 5.3 Host single anion control experiments for Iso .................................................. 84
Table 5. 4. Anion selectivity for hosts Pyr and Iso with halide ions. ............................... 89
Table 5. 5. Base peak and selectivity ratios for Pyr at various anion molar ratios. ......... 90
Table 5. 6. Binding / deprotonation ratio for Pyr and Iso in the presence of one anion. .. 91
Table 5. 7. Binding/deprotonation ratio for Pyr and Iso in the presence of two competing
anions. ............................................................................................................................... 92
1
Chapter 1. Introduction: Biological membranes and ion channels
2
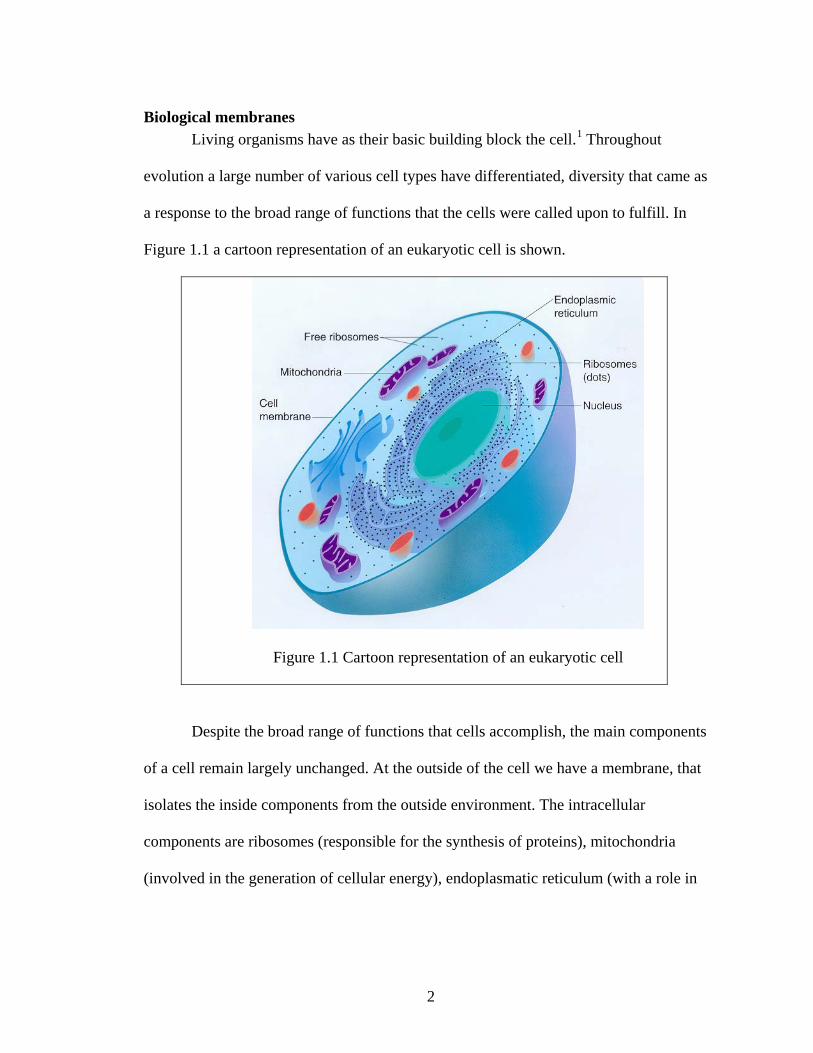
Biological membranes Living organisms have as their basic building block the cell.1 Throughout
evolution a large number of various cell types have differentiated, diversity that came as
a response to the broad range of functions that the cells were called upon to fulfill. In
Figure 1.1 a cartoon representation of an eukaryotic cell is shown.
Figure 1.1 Cartoon representation of an eukaryotic cell
Despite the broad range of functions that cells accomplish, the main components
of a cell remain largely unchanged. At the outside of the cell we have a membrane, that
isolates the inside components from the outside environment. The intracellular
components are ribosomes (responsible for the synthesis of proteins), mitochondria
(involved in the generation of cellular energy), endoplasmatic reticulum (with a role in

3
the synthesis of proteins and lipids) and the nucleus (where the genetic information is
stored).
The barrier role2 that the cellular membrane has is a very important one. The cell
could not survive or even be defined as an entity without the outside membrane. The
composition of the membrane is very complex, but the main constituent is represented by
phospholipids.3 An example of a phopsholipid molecule is presented in Figure 1.2, using
1,2-Dioleoyl-sn-glycero-3-phosphocholine (DOPC).
Figure1.2 Structure of a phospholipid, DOPC.
As Figure 1.2 shows phospholipids have three main regions based on the polarity
of the moieties that are present in the structure. The polar head group is comprised of the
phosphate and the choline, having two electric charges. The region of intermediate
polarity is formed of the ester groups while the long hydrocarbon chains form the region
of low polarity.
4
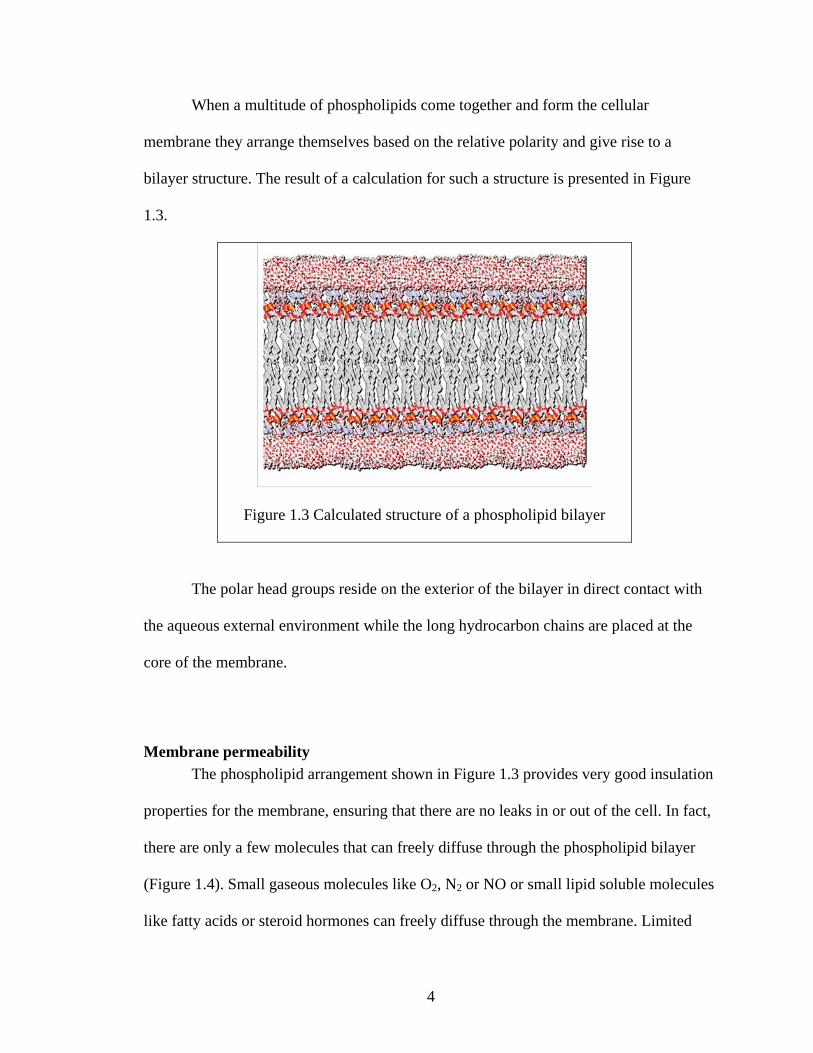
When a multitude of phospholipids come together and form the cellular
membrane they arrange themselves based on the relative polarity and give rise to a
bilayer structure. The result of a calculation for such a structure is presented in Figure
1.3.
Figure 1.3 Calculated structure of a phospholipid bilayer
The polar head groups reside on the exterior of the bilayer in direct contact with
the aqueous external environment while the long hydrocarbon chains are placed at the
core of the membrane.
Membrane permeability The phospholipid arrangement shown in Figure 1.3 provides very good insulation
properties for the membrane, ensuring that there are no leaks in or out of the cell. In fact,
there are only a few molecules that can freely diffuse through the phospholipid bilayer
(Figure 1.4). Small gaseous molecules like O2, N2 or NO or small lipid soluble molecules
like fatty acids or steroid hormones can freely diffuse through the membrane. Limited

5
permeability exists for small polar molecules like water, urea or glycerol that can to a
certain point penetrate the phospholipid bilayer. Larger molecules like proteins, nucleic
acids, charged species like cations and anions (Na+, K+, Ca2+, Cl¯), amino acids cannot
pass through the phospholipid bilayer.
Figure 1.4 Membrane permeability
Most, if not all of the components mentioned as being unable to permeate the
membrane are important for the survival and well being of the cell. The transport of these
molecules is accomplished with the help of the proteins that are embedded in the
membrane and which ensure that the necessary nutrients are available to the cell.
Cellular membrane complexity The presence of membrane proteins paints a more realistic picture of the structure
of the membrane. It is not just a phospholipid bilayer; it contains a large number of

6
surface or transmembranar proteins. A cartoon representation of such a phospholipid
membrane is presented in figure 1.5.
Figure1.5 Cartoon representation of the phospholipid bilayer with embedded proteins
Membrane proteins can transport compounds across the membrane via two types
of mechanisms: channel or carrier4.
Naturally occurring channels and carriers The two transport mechanisms (carrier and channel) are depicted in cartoon form
in Figure 1.6.
A carrier is usually a smaller molecule that captures the host on one side of the
membrane, diffuses to the other side of the bilayer where it releases the guest.

7
A protein acting as a channel forms a pore through the membrane allowing for the
otherwise too polar or too big molecules to pass and enter the cell. The channels are
generally very large proteins containing hundreds of amino acids.
Figure 1.6 Carrier (top panel) and channel (lower panel)
transport mechanisms.
To exemplify the complexity of naturally occurring channels, the structure of a
Cl¯ transporter from S. typhimurium is presented in Figure 1.7. It has two subunits
(highlighted in red and blue in Figure 1.7.) each containing a large number of amino
acids.
Figure 1.7 Ribbon
representation of the S.
thyphimurium Cl¯ transporter.
A Cl¯ ion in the selectivity
filter is represented as a green
sphere.

8
The study of these molecules has always been hindered by their complexity.
Hence the incentive for chemists and biochemists to design and study smaller model
molecules that retain the ion transport activity but at the same time allow for easier
synthesis, manipulation and study.
Previous reports of synthetic ion transporters Due to the macrocyle’s ability to complex various ions, structures such as crown
ethers,5 calixarenes,6 and cyclodextrins7 have been attractive for scientists desiring to
design new ion channels. As exemplified below, these structures have been widely
utilized by various groups.
One of the first reported synthetic ion channels was the one published by Tabushi
and coworkers in 1982.8 Since then quite a large number of structures have been
designed, analyzed and studied in the growing field of ion channels.
The Tabushi channel was based on a β-cyclodextrin (Figure 1.8A).8 The channel
character was confirmed by monitoring the transport of copper and cobalt ions. As far as
the transport mechanism it was speculated that two molecules come together in a “tail to
tail” arrangement, thus forming a pore that allowed the ions to pass.
Another design that bears a number of structural similarities with Tabushi’s
compound is the one reported by Gin and coworkers. In this case the cyclodextrin was
functionalized with long polietheric tails, that were intended to span the phospholipid
bilayer and thus reducing the number of molecules required for transport to one (Figure
1.8B).9 Data reported shows that this structure is an anion selective transporter.

9
Davis and coworkers reported an active channel based on a different
conformation of the calix[4]arenes (1,3-alternate conformer) that bound HCl (Figure
1.9A).10 A design that combined calixarenes and crown ethers was developed jointly by
the Mendoza and Gokel labs. The crown ethers served as headgroups while the 1,3-
alternate conformer of calix[4]arene is used as a central relay (Figure 1.9B).11
OO
OO
NH HNO O
NHHN O O
A
O
O
O
O
ON
OO
O
N
ON
OO
O
NO
NO
O
ON
O
NOO
ON
B Figure 1.9 A) Davis's synthetic ion channels. B) calix[4]arene-crown synthetic ion
channels
While a number of other macrocyles have been used in the design of ion channels,
probably the most utilized are the crown ethers. In 1982, a channel-like arrangement of
crown ethers was observed in the solid state structure of 18-crown-6.12 Researchers
envisioned the use of crown ethers as central scaffolds with hydrophobic chains attached
Figure 1.8 A) Tabushi channel. B) Gin's cyclodextrin channel

10
in order to favor the insertion into membranes and thus mediating the transport of ions.13
Fyles and coworkers used a tartaric acid-18-crown-6 backbone to design a new family of
active ion channels.14 In a slightly different approach Voyer and coworkers used crown
ethers and alpha-helical peptides that would self-assemble and form a transmembrane
pore as shown in Figure 1.10B.15 Matile and coworkers used a polyaromatic backbone
composed of eight phenyl units that had six crown ethers attached (Figure 1.10C).16 All
of the structures discussed have well documented channel behavior.
O
O
OO
O
O
R
R
RR
R
OO
OOOO
O
O
O
O
S COOHSO
R= OO
OOOO
O
O
O
OS COOHS
O
HN
HN
HNNH
HN
O
OO
O
O
NH
O
O
OMe
OO O O
OOO
OOOO
O OO
O
O
O
O
O
OOOO
OOO
O
O
OO
N
O
O
O
OO
N
O
O
O
OO
N
O
O
O
O O
N
O
O
O
O O
N
O
O
O
O O
N
O
SMe+H3NH2CH2CS
A
B C
O
3
Figure 1.10 A) Flyes tartaric crown ether ion transporter. B) Voyer family of synthetic ion
transporter. C) Matile polyphenylene ion transporter
The Gokel goup has reported a number of structures that act as ion transporters,
and these families are presented briefly as follows.

11
Hydraphyles One of the first families of compounds17 that our group has developed is
exemplified in Figure 1.11. The the two distal macrocyles (two diaza-18-crown-6 ethers)
that are linked through an aliphatic spacer to a central relay (usually the third diaza-18-
crown-6 ether is present here) are characteristic structural features for these compounds.
The two headgroups are substituted at both nitrogens, and the spacer and the sidearm may
or may not be identical.
Figure 1.11 General structure of the hydraphiles.
This family of compounds proved to be a cation transporter with the two distal
macrocycles acting as entry portals while the central relay is placed within the membrane.
We believe that one molecule of hydraphyle can insert in the membrane and arrange in
such a way as to create a pathway for ions and water molecules. A cartoon representation
of this mechanism is depicted in Figure 1.12.

12
Figure 1.12 Putative
transport mechanism
for hydraphyles.
Applospans Another group of compounds that proved to be active as ion transporters is what
we called “applospans”, a name suggested from the Greek απλőσ (simple) + span for
simple, membrane-spanning structures that mediate ion transport.
NH
ONH
OO O
O O
NO
OH
OHN
HO
HO
O
Figure1.13 Structure of an applospan
As the structure shown in Figure 1.13 suggests, they share structural features with
the hydraphyles: a central relay, two entry portals and two spacers. Though the molecule
is a lot simpler and the central relay and the two head groups are not moieties that we
usually think as being capable of mediating the transport of ions the compound still
exhibited ion transport with modest cation selectivity.18

13
Peptide based transporters Chronologically the second family of ion transporters that was designed in our lab
is one based on peptides. The general structure of these compounds is presented in
Figure 1.14.
Figure 1.14 General structure of the peptide
based ion transporters
The N-terminal end of the peptidic sequence (red in figure 1.14) is linked through
a diglycolic acid residue (blue in Figure 1.14) to a dialkyl amino residue (green in Figure
1.14). The dialkyl groups can have different lengths and act as an anchoring point for the
molecule in the membrane. The peptidic sequence is composed of three glycine residues
followed by a proline. This amino acid sequence is inspired from the putative ion
conduction pathway for the proteins in the ClC family where a G-X-X-P unit is
conserved.19 The proline is attached to another tri-glycine sequence which is capped as an
ester to avoid potential electrostatic repulsions.
These compounds have been shown to be active as Cl¯ transporters. We believe
that two molecules insert in the membrane and aggregate to form a dimeric pore. The
molecules are not long enough to span the whole bilayer so the dimeric pore is

14
responsible for disturbing the lower leaflet of the membrane as well and in this way
creating a pore for the Cl¯ ions to pass. This mechanism is depicted in Figure 1.15.
Figure 1.15 Putative transport mechanism for the
peptide based transporters
Our group has studied extensively this family of compounds20, performing
structure relationship activity studies on all of the structural modules: the dialkyl amino
group21, the diglycolic acid residue22, the peptide sequence23 and the C-terminus ester24.
Pyrogallol[4]arenes Another group of compounds in which we became interested relatively recently
are the pyrogallol[4]arenes.25,26,27,28 The general structure of these compounds is
presented in Figure 1.16.
This family of compounds was studied extensively by Atwood and coworkers.29
A more in depth discussion of these molecules and their behavior in solution is the object
of Chapter 3 of this thesis.
15
HOOH
OH
HO
HO
HO
OHHO OH
OH
OH
OH
R R
RR
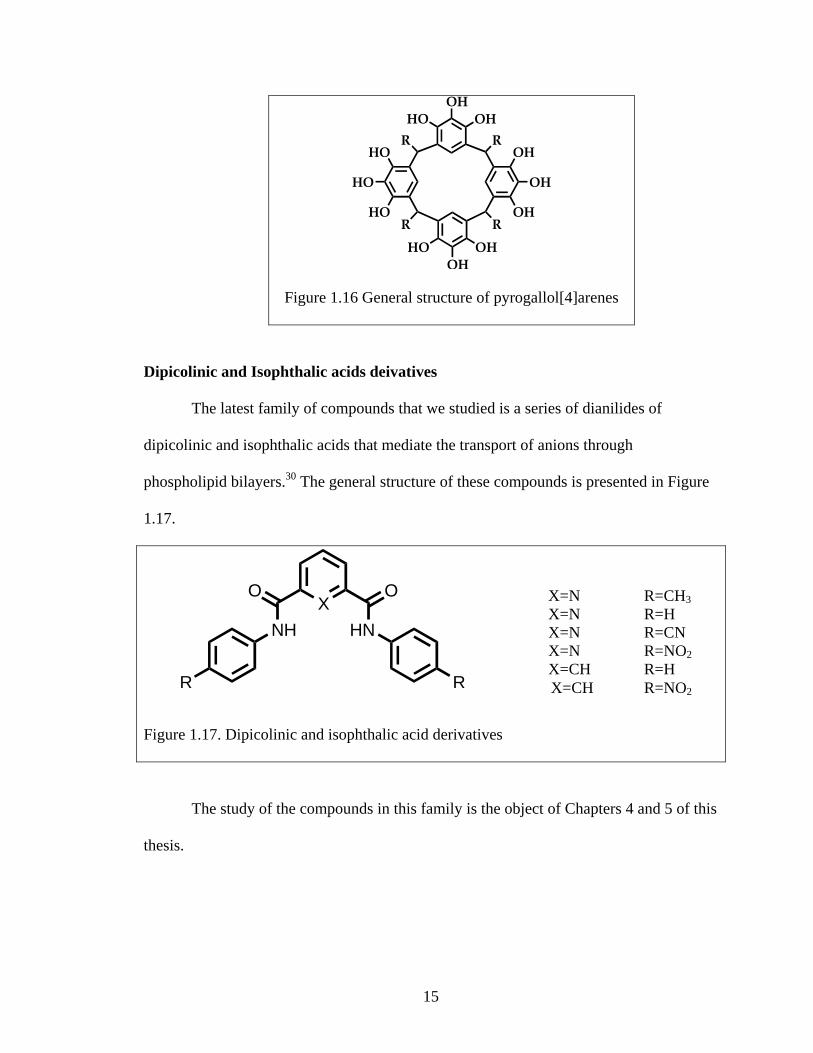
Figure 1.16 General structure of pyrogallol[4]arenes
Dipicolinic and Isophthalic acids deivatives
The latest family of compounds that we studied is a series of dianilides of
dipicolinic and isophthalic acids that mediate the transport of anions through
phospholipid bilayers.30 The general structure of these compounds is presented in Figure
1.17.
Figure 1.17. Dipicolinic and isophthalic acid derivatives
The study of the compounds in this family is the object of Chapters 4 and 5 of this
thesis.
X=N R=CH3 X=N R=H X=N R=CN X=N R=NO2 X=CH R=H X=CH R=NO2
XO
HN
O
NH
R R

16
Conclusions
Our laboratory has extensive experience in the field of synthetic ion channels.
Throughout this dissertation two families of ion transporters will be examined:
pyrogallol[4]arenes and dianilides of dipicolinic and isophthalic acid. Along with well
established tools in the ion channel field like planar bilayer experiments, fluorescence
quenching or binding constants determination we have used in our studies methods such
as gas-phase calculations, HPLC and electrospray mass spectrometry. The use of these
methods might surprise but we have proven that they can be very effective and can
provide insight and reliable data where other more traditional methods might fail to do
so.

17
References 1 Image reproduced from http://www.williamsclass.com/SeventhScienceWork/CellTheoryParts.htm 2 Darnell, J. E.; Lodish, H. F.; Baltimore, D., Molecular cell biology. 2nd ed.; Scientific American Books : Distributed by W.H. Freeman: New York, N.Y., 1990; 1105 p. 3 Hanahan, D. J. A Guide to Phospholipid Chemistry; Oxford University Press: Oxford, 1997 p 214. 4 Hille, B. Ionic channels of excitable membranes (third edition); 3rd ed.; Sinauer Associates: Sunderland, MA, 2001. 5 Pedersen, C. J. Journal of the American Chemical Society 1967, 89, 7017-7036. 6Boehmer, V. Angewandte Chemie, International Edition in English 1995, 34, 713-745. 7 Ohvo, H.; Slotte, J. P. Biochemistry 1996, 35, 8018-8024. 8 Tabushi, I.; Kuroda, Y.; Yokota, K. Tetrahedron Letters 1982, 23, 4601-4604. 9 Madhavan, N.; Robert, E. C.; Gin, M. S. Angewandte Chemie, International Edition 2005, 44, 7584-7587. 10 Sidorov, V.; Kotch, F. W.; Abdrakhmanova, G.; Mizani, R.; Fettinger, J. C.; Davis, J. T. J Am Chem Soc 2002, 124. 11 de Mendoza, J.; Cuevas, F.; Prados, P.; Meadows, E. S.; Gokel, G. W. Angewandte Chemie, International Edition 1998, 37, 1534-1537. 12 Behr, J. P.; Lehn, J. M.; Dock, A. C.; Moras, D. Nature 1982, 295, 526-527. 13 (a) Jullien, L.; Lehn, J. M. Tetrahedron Letters 1988, 29, 3803-3806; (b) Pechulis, A. D.; Thompson, R. J.; Fojtik, J. P.; Schwartz, H. M.; Lisek, C. A.; Frye, L. L. Bioorg Med Chem 1997, 5, 1893-1901. 14 (a) Fyles, T. M.; James, T. D.; Pryhitka, A.; Zojaji, M. Journal of Organic Chemistry 1993, 58, 7456-7468; (b) Fyles, T. M.; James, T. D.; Kaye, K. C. Journal of the American Chemical Society 1993, 115, 12315-12321; (c) Carmichael, V. E.; Dutton, P. J.; Fyles, T. M.; James, T. D.; Swan, J. A.; Zojaji, M. Journal of the American Chemical Society 1989, 111, 767-769. 15 Voyer, N.; Roby, J.; Deschenes, D.; Bernier, J. Supramolecular Chemistry 1995, 5, 61-69.
18
16 Sakai, N.; Gerard, D.; Matile, S. Journal of the American Chemical Society 2001, 123, 2517-2524. 17 O. Murillo, S. Watanabe, A. Nakano, G. W. Gokel. J. Am. Chem. Soc. 1995, 117, 7665 18 W. Wang, R. Li, G. W. Gokel. Chem. Commun. 2009, 911-913. 19 Maduke, M.; Miller, C.; Mindell, J. A. Annu. Rev. Biomol. Struct. 2000, 29, 411-438 20 (a) You, L.; Li, R.; Gokel, G. W. Org. Biomol. Chem. 2008, 6, 2914-2923. (b) You, L.; Ferdani, R.; Li, R.; Kramer, J. P.; Winter, R. E.; Gokel, G. W. Chemistry 2008, 14, 382-396. (c) Cook, G. A.; Pajewski, R.; Aburi, M.; Smith, P. E.; Prakash, O.; Tomich, J. M.; Gokel, G. W. J. Am. Chem. Soc. 2006, 128, 1633-1638. (d) Ferdani, R.; Pajewski, R.; Djedovic, N.; Pajewska, J.; Schlesinger, P. H.; Gokel, G. W. New J. Chem. 2005, 29, 673-680. (e) Schlesinger, P. H.; Ferdani, R.; Pajewski, R.; Pajewska, J.; Gokel, G. W. Chem. Commun. 2002, 840-841. (f) Ferdani, R.; Li, R.; Pajewski, R.; Pajewska, J.; Winter, R. K.; Gokel, G. W. Org Biomol Chem 2007, 5, 2423-2432. 21 a) Pajewski, R.; Ferdani, R.; Pajewska, J.; Li, R.; Gokel, G. W. J. Am. Chem. Soc. 2005, 126, 18281-18295. 22 Pajewski, R.; Pajewska, J.; Li, R.; Daschbach, M. M. Fowler, E. A.; Gokel, G. W. New J. Chem. 2007, 31, 1960-1972. 23 Ferdani, R.; Pajewski, R.; Pajewska, J.; Schlesinger, P. H.; Gokel, G. W. Chem. Comm. 2006, 439-441 24 Pajewski, R.; Pajewska, J.; Li, R.; Fowler, E. A.; Gokel, G. W. New J. Chem. 2007, 31, 1960-1972. 25 Kulikov, O. V.; Rath, N. P.; Zhou, D.; Carasel, I. A.; Gokel, G. W. New J. Chem. 2009, 33, 1563-1569. 26 Kulikov, O. V.; Daschbach, M. M.; Yamnitz, C. R.; Rath, N.; Gokel, G. W. Chem Commun (Camb) 2009, 7497-7499. 27 Li, R.; Kulikov, O. V.; Gokel, G. W. Chem. Comm. 2009, 6092-6094. 28 Kulikov, O.; Li, R.; Gokel, G. W. Angew. Chem. Int. Ed. 2009, 48, 375-377. 29 (a) L. R. MacGillivray, J. L. Atwood, Nature, 1997, 389, 469-472. (b) A. Shivanyuk, J. C. Friese, S. Doring, J. Rebek Jr., J. Org. Chem. 2003, 68, 6489-6496. (c) T. Gerkensmeier, W. Iwanek, C. Agena, R. Frölich, S. Kotila, C. Näther, J. Mattay, Eur. J. Org. Chem. 1999, 2257-2262. (d) T. Evan-Salem, I. Baruch, L. Avram, Y. Cohen, L. C. Palmer, J. Rebek Jr., Proc. Nat. Acad. Sci. 2006, 103, 12296-12300.

19
30 Yamnitz, C. R.; Negin, S.; Carasel, I. A.; Winter, R. K.; Gokel, G. W. Chem. Commun. 2010, 46, 2838-2840

20
Chapter 2. Triacsin C and derivatives: Synthesis and study of biological properties

21
Introduction Triacsin C is part of a family of four naturally occurring compounds discovered in
a culture of Streptomyces sp. in 1980.1 The other members of the family are Triacsin A,
B and D. They have been of interest in the biochemical community for some time
because they inhibit a type of enzymes known as long chain acyl-CoA synthetases.2,3,4,5
The structures are presented in Figure 2.1.
The four triacsin molecules share a number of structural characteristics. All of the
Triacsins possess the unusual triazenol moiety (=N-N=N-OH) at one end of the molecule.
The triacsins contain a linear chain of 11 carbons, several of which are unsaturated. The
double bond system is generally, but not always, conjugated. The stereochemistry of the -
C=C- is always trans.
The triazenol functional group and the carbon skeleton up to and including C5 are
identical in Triacsins A-D. The differences in structure begin at C6 and these are
N N N OH
Triacsin A
N N N OH
N N N OH
N N N OH
Triacsin B
Triacsin C
Triacsin D
Figure 2.1. Structure of Triacsin A, B, C, D.

22
highlighted in red in Figure 2.1. Triacsins B and D have a double bond at C6 while A and
C do not. Triacsin B has another double bond between C8-C9 and triacsin C has a double
bond between C7-C8.
Inhibitory potency of the Triacsin A, B, C and D As noted above, the four triacsins inhibit the action of long chain acyl-CoA
synthetases, although to different extents.6 The results of an inhibition study are presented
in Figure 2.2. The most active compound is triacsin C (red line in Figure 2.2) followed by
A (blue line), both of which are much more active than B (green) and D (black).
Concentration of Triacsin(µM) Figure 2. 2 Inhibitory activity of Triacsin A, B, C and D.
Triacsin B
Triacsin C
Triacsin A
Triacsin D

23
Triacsin C use in biochemical reseach The ability of triacsins to inhibit acyl CoA enzymes has made this family of
structures useful as tools in the field of biochemical research.7,8,9,10,11 Acyl-CoA
synthetase is an enzyme involved in the metabolism of fatty acids, transforming the free
fatty acids into CoA esters. Several enzymes are known within the general family. They
are generally designated “short”, “medium” and “long” chain variants. The short chain
enzyme, usually designated “SC”, typically has as its substrate aliphatic acids in two- to
four- carbon range. Substrates for the medium chain (“MC”) enzyme have acyl chains of
four- to twelve carbons. The long chain (“LC”) enzyme acts on fatty acids having twelve
carbons or more, typically 12-24.
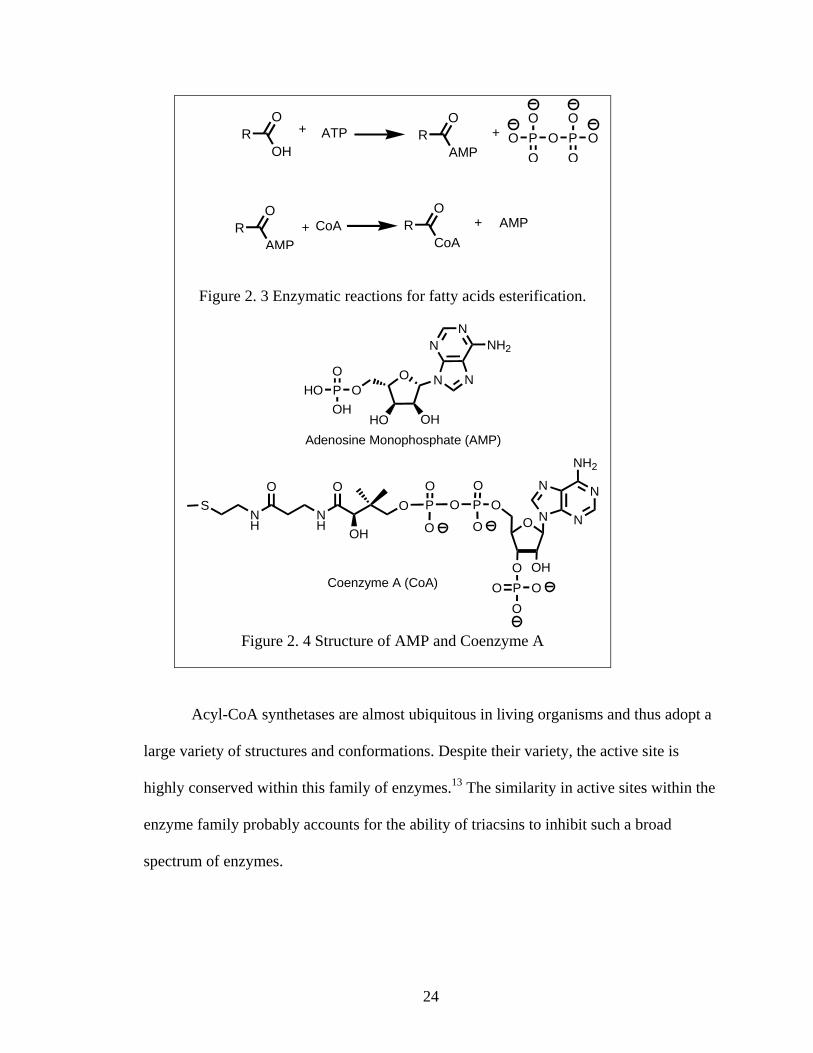
Enzymatic mechanism for LC Acyl-CoA synthetase LC Acyl-CoA synthetases react by a two-step mechanism (Figure 2.3).12 In the
first step, the fatty acids react with adenosine triphosphate (ATP) to form an acyl-
adenosine monophosphate (acyl-AMP) mixed anhydride. Pyrophosphate is the byproduct
of this step. The mixed anhydride activates the fatty acid so that coenzyme A can be
attached. The enzyme requires Mg2+ as a cofactor and the hydrolysis of the
pyrophosphate renders the enzymatic process irreversible.
It is the CoA activating group that will be important for subsequent metabolism of
the fatty acids.
24
Figure 2. 3 Enzymatic reactions for fatty acids esterification.
Adenosine Monophosphate (AMP)HO OH
O N N
NH2
NN
PO
OHOOH
SNH
O
NH
O
OH
O P
O
OO P
OO
O O N
N
N
N
NH2
OHOPO OO
Coenzyme A (CoA)
Figure 2. 4 Structure of AMP and Coenzyme A
Acyl-CoA synthetases are almost ubiquitous in living organisms and thus adopt a
large variety of structures and conformations. Despite their variety, the active site is
highly conserved within this family of enzymes.13 The similarity in active sites within the
enzyme family probably accounts for the ability of triacsins to inhibit such a broad
spectrum of enzymes.
RO
OH
+ ATP RO
AMP+ O P
O
OO P
O
OO
CoARO
AMP+ R
O
CoA+ AMP

25
The structure of LC Acyl-CoA synthetase from Thermus thermophilus was
reported by Hisanaga in 200413 and is shown in Figure 2.5. This enzyme is a
homodimeric structure. The two monomers are linked at the N-terminal ends.
Figure 2. 5 The structure of LC Acyl-CoA synthetase from Thermus thermophilus (image
reproduced from Hisanaga et al13).
Each part of the homodimer is linked in such a way that a cavity is created
between them. This cavity is referred as the “central valley”, which acts as an access
point for the fatty acid substrate. It is important to notice that the fatty acids enter the
active site of the enzyme with the carboxyl moiety pointing forward. After the
esterification process occurred, the Acyl-CoA fatty acid molecule exits the enzyme
through the “funnel cavity”, which is situated opposite to the “central valley”.
A more detailed representation of the active site of the enzyme is presented in
Figure 2.6.

26
Figure 2. 6 The active site of the LC Acyl-CoA synthetase from Thermus thermophilus
(image reproduced from Hisanaga et al13)
When the enzyme is in the apo form, the fatty acids binding tunnel is occupied by
the indole residue of a tryptophan molecule (W234). The esterification process begins
with the binding of an ATP molecule at the end of the tunnel. This event triggers a series
of conformational changes that result in the rotation of the W234 indole ring, clearing the
path for the fatty acids to enter the active site. The tail of the fatty acid is placed inside
the “dead end branch”. This portion serves as a size selectivity filter: the fatty acids that

27
are not of appropriate size either can’t fit or are too short and the esterification process
does not occur. After the esterification is complete the product is released through the
“funnel cavity”.
Study of Triacsin C analogs In a study published from the Gokel lab in 1995,14 a group of structurally related
compounds were assayed versus an Acetyl-CoA synthetase isolated from S. cerevisiae.
These experiments were aimed at identifying the crucial structural elements necessary for
the inhibitory activity. These structures are presented in Figure 2.7, along with Triacsin C
for comparison.
NOH
NOH
NOH
Deca-2,4-dienal oxime
Nona-2,4-dienal oxime
Tridecanal oxime
NN
NOH
Triacsin C
Figure 2. 7 Triacsin C and derivatives.
The structural similarities between the synthetic analogs and triacsin C are
highlighted in blue. Tridecanal oxime has the same chain length as triacsin C and
contains only the terminal oxime moiety. The two other compounds have extended

28
unsaturations (three conjugated double bonds) to mimic the triazenol moiety present in
triacsin C’s structure, but have overall shorter chains.
The inhibition values in the form of IC50 (the concentration at which 50% of
growth is inhibited) are presented in Table 2.1.
Compound IC50 (µM)
NOH
Tridecanal oxime
245 ± 17
NOH
Deca-2,4-dienal oxime
16 ± 1
NOH
Nona-2,4-dienal oxime
6 ± 0.5
NN
NOH
Triacsin C
0.080 ± 0.010
Table 2.1. IC50 determined for Triacsin C and derivatives.
While the study only included three new compounds and the most active analog
turned out to be 75 fold less active than triacsin C a few interesting structure – activity
relationships can be observed. First, the data in Table 2.1 show that the two unsaturated
oximes are more active than tridecanal oxime. The high IC50 of tridecanal oxime (~3000
fold less active than triacsin C) indicates that the overall length and the presence of only
the oxime moiety (=N-OH) is insufficient for achieving satisfactory inhibitory activity.
Reducing the overall length of the carbon skeleton but adding adjacent unsaturations to
29
the oxime moiety dramatically reduces the IC50 (the case of nona- and deca- 2,4-dienal
oximes) suggesting that the conjugated system is more important for the inhibitory
activity than the overall length of the molecule. The higher activity observed for the
unsaturated oximes points to the fact that the rather unusual triazenol moiety is important
but not crucial. A conjugated system including two -CH=CH- double bonds and only one
-CH=N- double bond, while not as active still results in significant enzyme inhibition.
The overall length of the molecule does not seem to have such an important role.
While initially LC Acyl-CoA synthetases were regarded as being involved only in
the fatty acid metabolism, more recent work points more and more towards a regulatory
role for this family of enzymes. The regulatory role is exercised through variations in the
concentration of their products – fatty acid CoA esters.
For example, the activity of endothelial nitric oxide synthase (eNOS – an enzyme
responsible for production of NO) is inhibited upon palmitoylating two cysteine
residues.15 I f the palmitoyl-CoA concentration is varied (by inhibiting or promoting the
activity of L C A cyl-CoA responsible for the esterification of palmitic acid) a direct
correlation is observed in the activity of eNOS. Same data suggest that palmitoylation is
not only the rate limiting step but also a regulatory point in eNOS’ activity.
Isoforms are proteins having similar amino acid sequences and with the same
function.16 Due to the important regulatory role of LC Ac-CoA enzymes refining the
design of enzymatic inhibitors to the point where they can distinguish between isoforms
has increased in importance.
In a collaborative effort with Professor Margaret Weis’ laboratory at Texas Tech
the response of two LC Acyl-CoA synthetase isoforms to Triacsin C and three oximes

30
(tridecanal oxime, nona- and deca- 2,4-dienal oximes) was studied. The two isoforms
studied (named BP1 and BP2) were isolated from rat brain. If the two isoforms show
significant differences in their IC50 values when exposed to a certain compound that is
indicative of differences in the inhibitory mechanism; differences that could potentially
be exploited for the development of isoform-specific inhibitors.
Due to its significance in enzymatic studies, Triacsin C is a commercially
available compound obtained through biosynthesis. There is however a previously
reported synthesis for Triacsin C.17 To the best of my knowledge there are no reported
syntheses for the other triacsins (A, B and D).
Results The synthesis of tridecanal oxime, nona- and deca- 2,4-dienal oximes (Scheme
2.1) followed a previously reported synthetic route.17
ONH2OH
Py/EtOHN
OH
ONH2OH
K2CO3/EtOHN
OH
ONH2OH
K2CO3/EtOHN
OHDeca-2,4-dienal oximeDeca-2,4-dienal
Nona-2,4-dienal oximeNona-2,4-dienal
Tridecanal oximeTridecanal
Scheme 2.1. Synthesis of Tridecanal oxime, Nona-2,4-dienal oxime and Deca-2,4-dienal
oxime.

31
The two isoforms (BP1 and BP2) were exposed to triacsin C and the three
synthesized oximes. T he IC50 values for these two enzymes were recorded and a
comparison of this data is presented in T able 2.2.
Compound IC50(µM)
BP1 BP2
Tridecanal oxime 303 ± 33 246 ± 31
Nona-2,4-dienal oxime 180 ± 32 74.0 ± 8.3
Deca-2,4-dienal oxime 80.6 ± 13 53.2 ± 8.0
Triacsin c 0.094 ± 0.013 0.098 ± 0.023
Table 2.2. IC50 for BP1 and BP2
Triacsin C inhibits both isoforms in a similar way, but significant differences in
the IC50 values can be observed for the three oxime compounds. The three oximes clearly
inhibit BP2 to a higher degree than BP1. The IC50 values are ~25% (for tridecanal
oxime), ~150% (for nona-2,4-dienal oxime) and ~50% (for deca-2,4-dienal oxime)
higher for BP1 than BP2. This result is encouraging for the development of isoform
specific inhibitors.
Conclusions Triacsin C and compounds structurally akin to Triacsin C can be used in a variety
of ways. One obvious way is to explore the requirements for inhibitory activity with the
goal of producing new compounds with enhanced activity and increased selectivity.
While the search for a stronger and more selective inhibitor is a worthy goal, not
always a more potent inhibitor is necessary. Compounds eliciting lower but still

32
detectable activity can provide us with useful information helping us to better understand
various facets of enzymatic mechanisms. We have used three of these derivatives
(tridecanal oxime, nona-2,4-dienal oxime and deca-2,4-dienal oxime) to probe the
differences in substrate requirement for two isoforms of LC Acyl-CoA synthetase. The
variations observed in the inhibitory responses from these two isoforms when exposed to
the three synthesized compounds are indicative that substrate selectivity for these two
isoforms can be obtained. Further development of the present structures has potential to
yield compounds eliciting inhibitory activity only on one isoform and thus providing us
with tool to regulate various metabolic and signaling pathways.

33
Experimental section
Synthesis of tridecanal oxime, CH3(CH2)11-CH=N-OH
Tridecanal oxime was synthesized as previously reported and the 1H-NMR and melting
points correlated well with published data.14
Synthesis of nona-2,4-dienal oxime CH3(CH2)3-CH=CH-CH=CH-CH=N-OH
Nona-2,4-dienal oxime was synthesized as previously reported and the 1H-NMR and
melting points correlated well with published data.14
Synthesis of deca-2,4-dienal oxime CH3(CH2)4-CH=CH-CH=CH-CH=N-OH
Deca-2,4-dienal oxime was synthesized as previously reported and the 1H-NMR and
melting points correlated well with published data.14

34
References 1 Yoshida, K. M.; Okamoto, K.; Umehara, M.; Iwami, M.; Kohsaka, H.; Aoki H.; J. Antibiotics, 1982, 151; 2 Korchak H. M, Kane L.H., Rossi M.W., Corkey B.E.; J Biol Chem 1994; 30281. 3 Noel R.J., Antinozzi P.A., McGarry D.J., Newgard C.B., J Biol Chem 1997; 18621. 4 Tomoda H., Igarishi K., Cyong J.-C., Omura S., J Biol Chem 1991; 4214. 5 Vessey D.A., Kelley M., Warren R.S. J Biochem Mol Toxicol 2004; 100. 6 Omura, S.; Tomoda, H.; Xu, Q.M.; Takahashi, Y.; Iwai, Y; J. Antibiot., 1986, 39, 1211-1218;
7 Van Horn, C. G.; Caviglia, J.M., Li, L.O.; Wang, S., Granger, D.A., Coleman, R., A.; Biochemistry, 2005,1635 8., Crumley, J. L.; Young, L.H.; Stallone, J. L., Weis. M.T.; Cardiovascular Research, 2004, 338 9 Lam, T.K., Pocai1, A.; Gutierrez-Juarez1, R., Obici1, S., Bryan, J., Aguilar-Bryan, L., Schwartz1, G. J., Rossetti, L.; Nature Med, 2005, 320 10 Thimmarayappa, J., Sun, J., Schultz, L. E., Dejkhamron, P., Lu, C., Giallongo, A., Merchant, J. L.; Menon, R.K., Molecular Endocrinology 2006, 2747 11 Shumilina, E., Klocker, N., Korniychuk, G., Rapedius, M., Lang, F., Baukrowitz, T., J Physiol, 2006, 433 12 Cleland, W. W. (1963) Biochim. Biophys. Acta 67, 104 13 Hisanaga, Y., Ago, H., Nakagawa, N., Hamada, K., Ida,K., Yamamoto, M., Hori, T., Arii, Y., Sugahara, M., Kuramitsu, S., Yokoyama, S., Miyano, M. J. Biol. Chem. 2004, 31717-31726; 14 Knoll, L. J.; Schall, O. F.; Suzuki, I.; Gokel, G.W.; Gordon, J. I.; J. Biol. Chem, 1995, 20090-20097. 15 Liu, J.; Garcia-Cardena, G.; Sessa W. C., , Biochemistry, 1996, 13277-13281. 16 http://ghr.nlm.nih.gov/glossary=isoforms 17 Tanaka, H.; Yoshida, K.; Itoh, Y.; Imanaka, H.; Tetrahedron Letters, 1982, 3421-3422;

35
Chapter 3. Pyrogallol[4]arenes solution equilibrium studies

36
Introduction In a patent1 that issued in 1909 with the title “Condensation Product and Method
of Making Same,” Leo Baekeland reported the formation of a new polymeric material
resulting from the condensation of phenol and formaldehyde. This product bears a name
derived from its inventor “Bakelite”, and it gained rapid popularity due to its electrical
and thermal insulating properties.
This basic reaction between phenols and various aldehydes led to the formation of
many other materials, one of the most notable being the cyclic structures named
calixarenes2 and resorcinarenes.3 The aromatic reagents used for the synthesis of
macrocycles similar to calixarenes are phenol, resorcinol or pyrogallol. The nomenclature
for calixarene is quite simple and is formed from the name of the phenol followed by the
number of the repeating aromatic unit: for example a calixarene-analog containing four
resorcinol units rather than four phenols would be named resorcinol[4]arene.
Pyrogallol[4]arene synthesis The condensation products that pyrogallol forms and especially
pyrogallol[4]arenes were extensively studied by Atwood and coworkers for their
properties as capsule forming units.4,5,6,7,8 These compounds are synthesized by refluxing
pyrogallol with the corresponding aldehyde in ethanol, in the presence of HCl. Upon
cooling, a solid separates from the reaction mixture. After washing the solid with ethanol,
the product is typically pure enough for further experiments. The general reaction for the
synthesis of these compounds is shown in Scheme 3.1.

37
As in all macrocycle syntheses the question of the conformation of the four
aromatic rings must be addressed. In calixarene chemistry the various conformations are
cone (rccc), partial cone (rcct), 1,3-alternate and 1,2-alternate(Figure 3.1).
Previously, the formation of up to five pyrogallol[4]arene conformers has been
reported,9 the boat, crown, chair, diamond, and saddle configurations. The 12 hydroxyl
groups present on the outer rim make an extended hydrogen-bond network likely, which
Scheme 3.1. Synthesis of pyrogallol[4]arenes
Figure 3. 1 Various conformations of calixarenes.
HOOH
OH
OH
OH
OH
OHOH
HO
HO
HO
HOOH
OHHO
R R
RR
+ R H
OHCl
EtOH
R=C1-C18, 2-propyl; 3-pentyl; 4-heptyl;
R RR RR
R
R
RR
R R RR RR R
Cone (rccc) Partial cone (rcct)
1,3-Alternate 1,2-Alternate
38
in turn would favor an all cis conformation of the sidechains. Even so, it is possible that
all other possible conformations form.
Significant effort has been expended in elucidating the conformation or
conformations of the material(s) isolated from the synthetic process. According to the X-
ray analysis, the isolated material is in the cone conformation. We attribute this to the
higher symmetry of this conformer that allows it to crystallize more readily than the other
conformational possibilities.
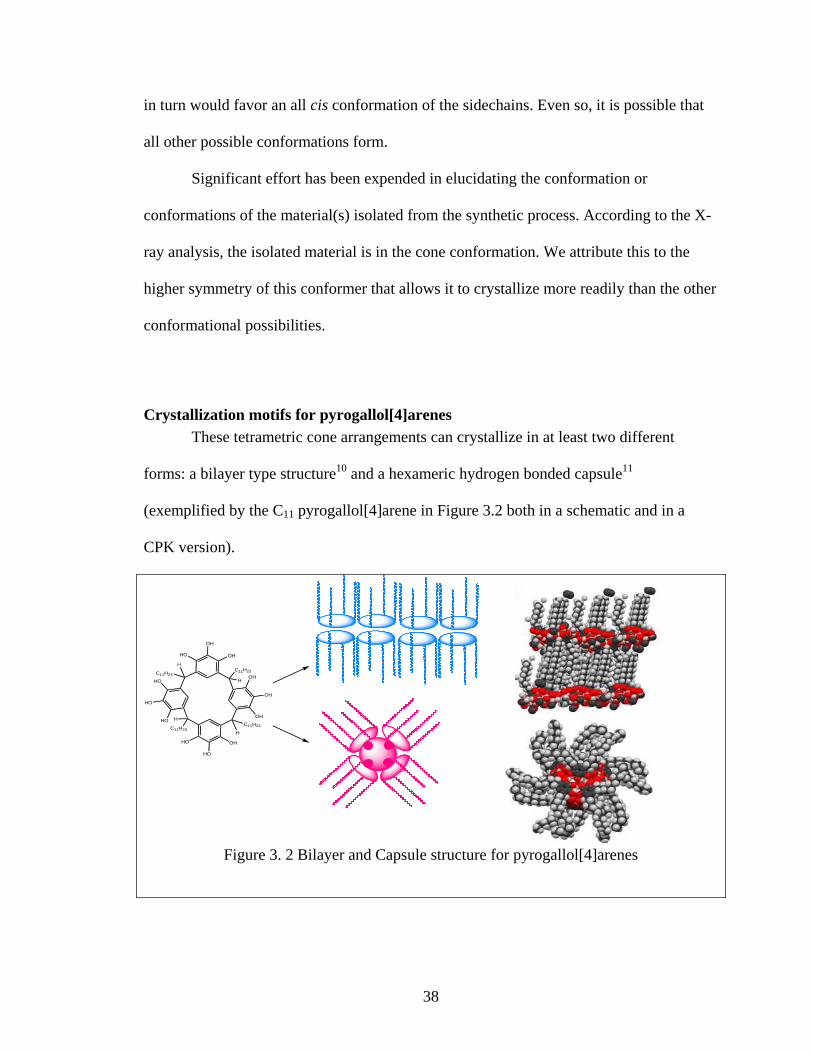
Crystallization motifs for pyrogallol[4]arenes These tetrametric cone arrangements can crystallize in at least two different
forms: a bilayer type structure10 and a hexameric hydrogen bonded capsule11
(exemplified by the C11 pyrogallol[4]arene in Figure 3.2 both in a schematic and in a
CPK version).
Figure 3. 2 Bilayer and Capsule structure for pyrogallol[4]arenes
OHHO
OH
HO
HO
HO
H
C11H23
H
C11H23
HO OH
HO
OH
OH
OH
H
C11H23
H
C11H23

39
Both the bilayer and the hexameric capsule have been characterized by X-ray
analysis to confirm the identity of the unit cell.
Membrane properties of C11 pyrogallol[4]arenes In a paper published from our group in 2009 the ion transport properties of these
compounds through membranes have been studied using the planar bilayer method.12 The
study focuses on both the bilayer and the hexameric arrangements of the C11
pyrogallol[4]arene.
The planar bilayer conductance method is an analytical technique that studies the
membrane properties of compounds with a focus on their ability to mediate the transport
of ions through a phospholipid bilayer.13 A schematic representation of this apparatus is
presented in Figure 3.3.
Figure 3. 3 Schematic representation of a planar bilayer apparatus.

40
The apparatus is composed of two chambers (labeled cis and trans) that are
communicating through a small orifice of ~200 µm in diameter. The two chambers are
filled with aqueous buffer and in each chamber an electrode is connected to a detector. A
phospholipid bilayer is painted on the orifice so that the two chambers are completely
isolated. At the start of the experiment, the compound to be studied is added in the cis
chamber and the resulting current is monitored. If the compound is able to insert in the
bilayer and mediate the transport of ions, an electrical current is detected. A typical
planar bilayer trace is presented in Figure 3.4.
Time
Figure 3. 4 A representative trace for a planar bilayer experiment
In Figure 3.4 the traces indicated by the red arrows represent the portions of the
experiment where the channel inserted in the bilayer is not functional/open and is not
transporting ions. The traces indicated by the green arrows represent channel openings.
When the channel is open, ions can pass from one chamber to the other and the resulting
Channel open Time
Cur
rent
Channel closed

41
electric current is being detected. The open–closed behavior exemplified in Figure 3.4 is
characteristic of channels and not of carriers so this experiment is the definitive proof for
a channel mechanism.
These pyrogallolarene compounds contain both long hydrocarbon chains (which
are lipophilic) and hydroxyl groups (which are hydrophilic and can hydrogen bond with
various anions) making this family of compounds a likely candidate for insertion and
pore formation in a membrane. Planar bilayer experiments for both the bilayer and the
hexameric capsule were performed in order to investigate the membrane properties of
these compounds.
In Figure 3.5 the traces obtained from the C11 bilayer in the presence of Cl¯ are
presented (the horizontal arrow indicates a 10 s span).
Figure 3. 5 Planar bilayer traces for C11 bilayer.

42
Observing stable open-closed behavior is often a time dependent process. When
the putative ionophore is added to the buffer, it may not immediately insert into the
planar bilayer and form a functional pore. Often transient opening events are observed
initially and after a certain period of time a stable open-closed behavior is recorded. The
three traces presented in Figure 3.5 pertain to the same experiment and were recorded
consecutively at three different voltages. In the first two traces, we observe open and
closed states. Many of these are very short although some more clearly defined states are
apparent. At the beginning of the experiment the ionophores are still inserting in the
phospholipid bilayer and are inducing transient disturbances in the membrane that are
responsible for the currents observed. Over time, a stable open-closed behavior with
longer, better-defined openings can be observed (third trace). The intensity of the current
is also twice that observed in the first two traces, giving more credit to the formation of a
functional channel. Most likely C11 bilayer breaks apart into monomers and these
monomers can then insert into the membrane and form aggregates of various sizes that
then mediate the transport of anions.
When the same experiment was conducted on the C11 hexameric capsule, no
transport event was observed for more than an hour, after which behavior similar to that
shown in Figure 3.5 was observed.
We expected that if transport was mediated by both forms (bilayer and capsule) it
might occur by different mechanisms or involve different species. The fact that the
capsules seemed inactive (and were for ~60 minutes) but eventually gave results similar
to those observed with the bilayer was troubling. The time necessary for the capsule to
begin transporting ions seemed too long for a simple induction/insertion phase. These
43
results begged the question whether or not the discordance in the time necessary to obtain
transport was due to different transport mechanisms or the formation of a similar
transport mediator that occurred at different rates from the bilayer and capsule. If the
bilayer and capsule share the same transport mechanism, then the extra time necessary for
achieving transport by the capsule variety is most likely due to the breaking apart of the
hexameric assembly into smaller oligomers. These oligomers are then responsible for the
ion transport in a similar fashion as the C11 bilayer.
To our knowledge, the only data available about these compounds was structural
information from the solid state experiments (X-ray analysis of crystals).4,5 There was
little information available about their stability in solution, aggregation behavior, or
whether or not an equilibrium existed between the various forms. In order to investigate
the stability of the hexameric capsules in solution and the existence of such an
equilibrium we decided to use the high performance liquid chromatography (HPLC)
method to analyze the starting materials.
HPLC is an analytical technique used mostly for purification and separation of
complex mixture of compounds. It uses high purity solvents and tightly packed columns
to obtain clear separation between the components. Based on the polarity of the
chromatographic column (stationary phase), there are essentially two types of HPLC:
normal phase and reverse phase. In the normal phase, the stationary phase (usually silica
packed columns) is relatively polar and for reverse phase HPLC, the stationary phase is
nonpolar (long hydrocarbon chains grafted on a thin silica coating). For all the HPLC
experiments the solvent system (mobile phase) is of opposite polarity to the stationary
phase. For instance, in an experiment using a reverse phase column a common solvent

44
system is water/methanol. The mixture of compounds is injected into the column and
then the different components are identified and separated based on their elution time.
Based on their relative affinity for the stationary or mobile phase, the components elute at
different times, times that are characteristic and can be used to identify them. Detectors
used for HPLC can be based on UV-VIS absorbance, refractive index or ES-MS.
Results The work presented in this section is part of a paper published in 2009 from our
group.12 It appeared that the ability of an HPLC column to resolve complex mixtures of
structurally related compounds might be useful in the investigation of the dynamics of
pyrogallolarene bilayer and capsule samples. If the bilayer dissociated homogenously
into monomer, we would only observe one peak, whereas if multiple species are present,
several peaks would be apparent in the HPLC trace. Different peaks can be observed only
if the corresponding structures have different partition coefficients. While our compounds
are oligomers of the pyrogallol[4]arenes we assumed that doubling or tripling the molar
mass of the monomer would result in different partition coefficients which would allow
us to distinguish them. The same would be true of the capsule sample. If the capsule
remained stable in solution and no decomposition or deaggregation occurred, only one
peak would be observed. Again if in both cases we would get several peaks, by
comparing the elution times for the capsule and bilayer traces we can draw conclusions
on the composition of those samples.
45
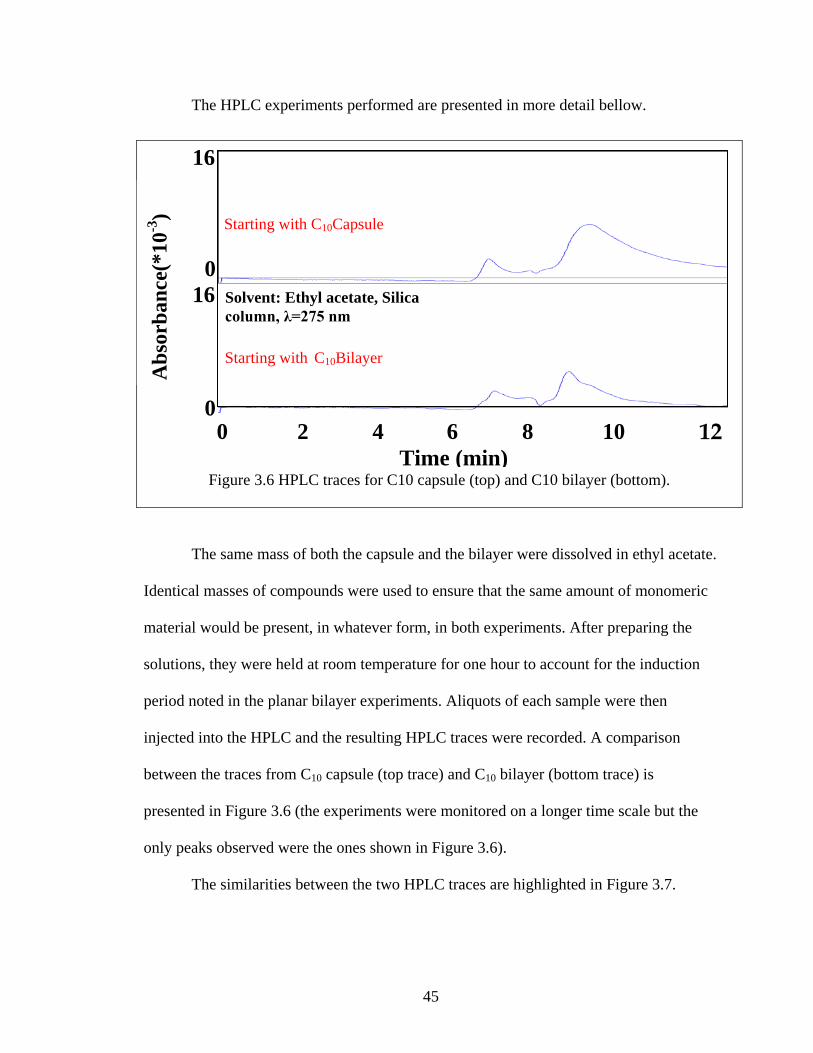
The HPLC experiments performed are presented in more detail bellow.
The same mass of both the capsule and the bilayer were dissolved in ethyl acetate.
Identical masses of compounds were used to ensure that the same amount of monomeric
material would be present, in whatever form, in both experiments. After preparing the
solutions, they were held at room temperature for one hour to account for the induction
period noted in the planar bilayer experiments. Aliquots of each sample were then
injected into the HPLC and the resulting HPLC traces were recorded. A comparison
between the traces from C10 capsule (top trace) and C10 bilayer (bottom trace) is
presented in Figure 3.6 (the experiments were monitored on a longer time scale but the
only peaks observed were the ones shown in Figure 3.6).
The similarities between the two HPLC traces are highlighted in Figure 3.7.
Figure 3.6 HPLC traces for C10 capsule (top) and C10 bilayer (bottom).
Abs
orba
nce(
*10-3
)
12 0 2 4 6 8 10 Time (min)
Solvent: Ethyl acetate, Silica column, λ=275 nm
Starting with C10Capsule
Starting with C10Bilayer
16
0
16 0

46
Figure 3. 7 HPLC traces for C10 capsule and C10 bilayer
The similarity between the two traces is apparent in Figure 3.7. The first peak in
both mixtures begins eluting at ~7 minutes and the overall traces are nearly identical. In
both traces three similar regions can be observed and they are highlighted in red, green,
and blue in Figure 3.7.
The first region (highlighted in red in Figure 3.7) includes a peak, which we
attribute to the monomer. The smaller size of this structure makes it the most likely
component of the first peak with the fastest elution time. The second region (green in
Figure 3.7) contains a number of less well-defined shoulders that we attribute to various
oligomers (dimmers, trimers, tetramers). These are most likely forming as intermediates
between the long array of linked monomers present in bilayer or capsule and the
monomer. The last region in the trace (blue in Figure 3.7) contains a broader and more
Abs
orba
nce(
*10-3
)
12 0 2 4 6 8 10 Time (min)
Starting with C10Capsule
Starting with C10Bilayer
16
0
16 0

47
intense peak which we attribute to the hexameric capsule and to any other higher
oligomers that might form in this environment.
Conclusions Long chain pyrogallol[4]arenes have very interesting membrane properties. Based
on their crystallization motif, they can insert in and mediate the transport of anions
through bilayers membranes in a time dependent fashion. The bilayer structure inserts
and forms aggregates capable of mediating the transport of ions faster than the capsule.
Our efforts were channeled in the direction of understanding the mechanism of
action for these compounds. We investigated their anion transport behavior with planar
bilayer experiments (which confirmed the anion transport) and with HPLC experiments
aimed at examining the solution stability of these compounds.
HPLC experiments are presented that show similar compositions for the solutions
of both bilayer and capsule. These compositions are complex but the many similarities in
the traces make us confident in concluding that they are in essence the same. Based on
these arguments we believe that both the bilayer and the capsule are breaking apart into
monomers in solution. These monomers are in turn responsible for inserting into the
membrane and forming oligomeric pores of various sizes that can mediate the transport
of ions.
Data from the planar bilayer experiments allow us to estimate the dimensions of
the pores that are responsible for the current passing through the phospholipid
membrane.13 Correlating that data with the sizes of the monomer we can hypothesize on
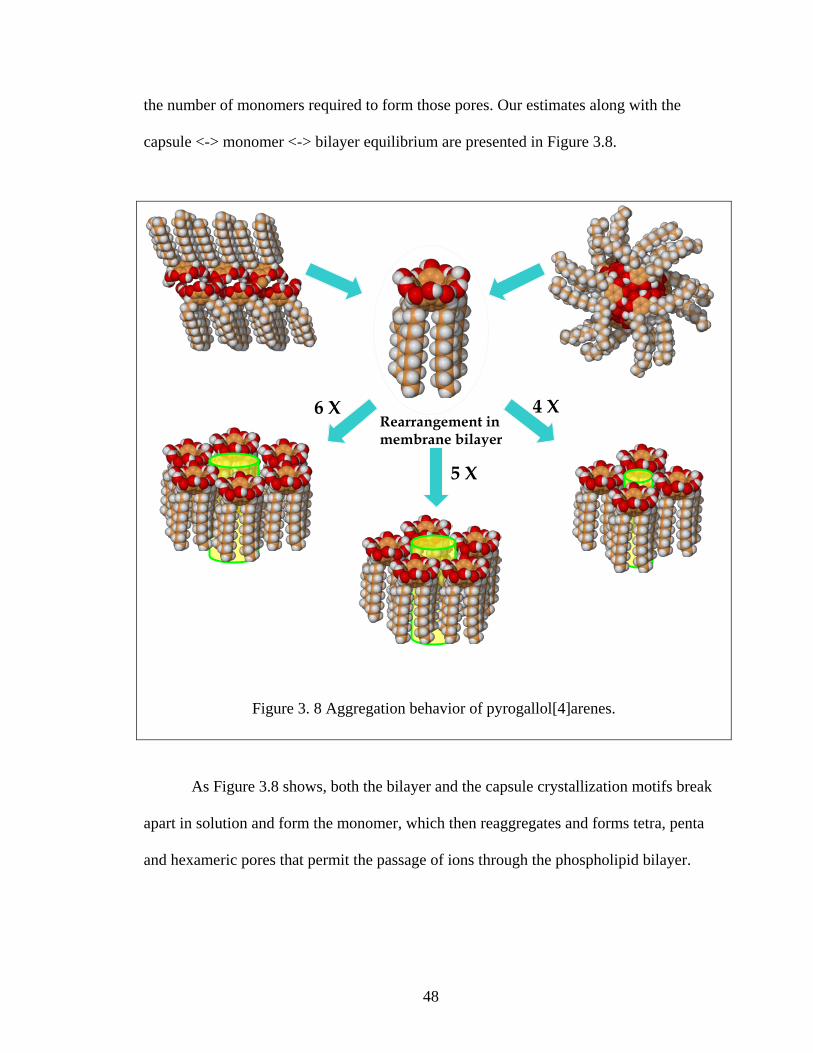
48
the number of monomers required to form those pores. Our estimates along with the
capsule <-> monomer <-> bilayer equilibrium are presented in Figure 3.8.
As Figure 3.8 shows, both the bilayer and the capsule crystallization motifs break
apart in solution and form the monomer, which then reaggregates and forms tetra, penta
and hexameric pores that permit the passage of ions through the phospholipid bilayer.
Figure 3. 8 Aggregation behavior of pyrogallol[4]arenes.
Rearrangement in membrane bilayer
4 X
5 X
6 X

49
Experimental Section
Pyrogallol[4]arenes have been synthesized and purified previously reported and have
been used without further purification.12
High performance liquid chromatography
HPLC experiments were conducted on an Xper-Chrom Model 1400 HPLC equipped with
a UV-vis detector (λ = 275nm) using a Shodex 5SIL 10E normal phase column.
Experiments were performed at least in triplicate, and traces were recorded using Peak
Simple v. 2.08 software. Samples were dissolved in EtOAc, and the mobile phase was
also EtOAc.

50
References 1 L. H. Baekeland, “Condensation Product And Method Of Making Same”, United States Patent 942, 809 1909. 2 a) C. D. Gutsche, Calixarenes; Royal Society of Chemistry: Cambridge, 1989; Vol. 1; (b) C. D. Gutsche, Calixarenes Revisited; Royal Society of Chemistry: Cambridge, 1998; Vol. 6. 3 Sliwa, W.; Kozlowski, C. Calixarenes and Resorcinarenes: Synthesis, Properties, and Applications; Wiley-VCH Verlag GmbH & Co.: Weinheim, 2009. 4 Cave, G. W.; Antesberger, J.; Barbour, L. J.; McKinlay, R. M.; Atwood, J. L.; Angewandte Chemie International Edition, 2004, 5263.; 5 J. L. Atwood, L. J. Barbour, A. Jerga, Chem. Commun. 2001, 2376 – 2377.;
6 S. J. Dalgarno, G. W. V. Cave, J. L. Atwood, Angew. Chem. Int. Ed., 2006, 45, 570-574.; 7 S. J. Dalgarno, D. B. Bassil, S. A. Tucker, J. L. Atwood, Angew. Chem. Int. Ed., 2006, 45, 7019-7022.
8 S. J. Dalgarno, N. P. Power, J. L. Atwood, Coordination Chemistry Reviews, 2008, 252, 825-841 9 Dueno, E. E.; Hunter, A. D.; Zeller, M.; Ray, T. A.; Salvatore, R. N.; Zambrano, C. H., Crystal Structure of 2,8,14,20-tert-Butylpyrogallol[4]arene, J. Chem. Crystallogr. 2008, 38, 181-187. 10 Kulikov, V. O.; Rath, N. P.; Zhou, D.; Carasel, I. A.; Gokel, G. W.; New Journal of Chemistry, 2009, 1563. 11 G. W. V. Cave, S. J. Dalgarno, J. Antesberger, M. C. Ferrarelli, R. M. McKinlay, J. L. Atwood, Supramol. Chem. 2008, 20, 157 –159. 12 Li, R.; Kulikov, O. V.; Gokel, G. W.; Chemical Communications, 2009, 6092. 13 Hille, B. Ionic Channels of Excitable Membranes (Third Edition); 3rd ed.; Sinauer Associates: Sunderland, MA, 2001, p814

Chapter 4. Dipicolinamides and Isophthalamides Anion transport studies

52
Introduction Ion binding and transport are of fundamental interest for biology and of
compelling interest to chemists who strive to better understand binding selectivity and the
interactions that control them. Inorganic anions and cations are pervasive in natural
systems and their concentrations are closely regulated by numerous complex proteins.
Many ions also play a role as enzymatic cofactors, in forming buffer systems, or in
maintaining the cellular membrane potential necessary for signaling. Understanding the
ability to bind, to transport, and to regulate ion concentrations is of fundamental
importance as a scientific matter and of the greatest consequence in the control of
biological processes.
The transport of anions in nature occurs most often through two mechanisms. The
mechanisms are usually referred to as carrier and channel1 (Figure 4.1).
Figure 4. 1 Cartoon representation of carrier (top panel) and channel
(lower panel) mechanism.

53
The carriers are typically smaller than channels and transport ions by a “receptor
binding, diffusion, ion release” mechanism. The ions bind to the carrier at either the
extracellular or intracellular surface of the membrane; the carrier envelops an ion in order
to solvate it and to shield it from the lipophilic environment at the core of the membrane.
The receptor-cation complex then diffuses down its concentration gradient to the opposite
side of the membrane. The rate at which the carriers transport ions varies but can be as
high as 104 ions per second. This maximal rate is significantly slower than cation
transport by a channel,2 which can exceed 107 ions per second. The rate limiting step in
carrier transport is most likely the diffusion through the membrane.3
Natural ion channels are large proteins that reside inside the membrane. Their
transport mechanism is based on forming an opening or pore allowing ions to pass
through the membrane through a low energy pathway. The naturally occurring channels
tend to be selective for the ions that they transport. The origin of the selectivity is
certainly not known for all channels but for the KcsA voltage gated potassium channel4
an array of main chain carbonyl groups are positioned so that only certain ions can pass.
This section of the channel is often called “the selectivity filter.” The transport rate of
channels can be up to 108 ions per second.2
The transport of ions, whether by a carrier or channel mechanism, will naturally
be driven by the concentration gradient. This type of transport does not require the
consumption of additional energy in order to occur. In certain situations there is a need to
transport ions in the opposite direction (from the lower concentration to the higher
concentration) and this comes at an energy cost (usually obtained in natural systems by
the hydrolysis of ATP). This kind of transport is performed by channels.
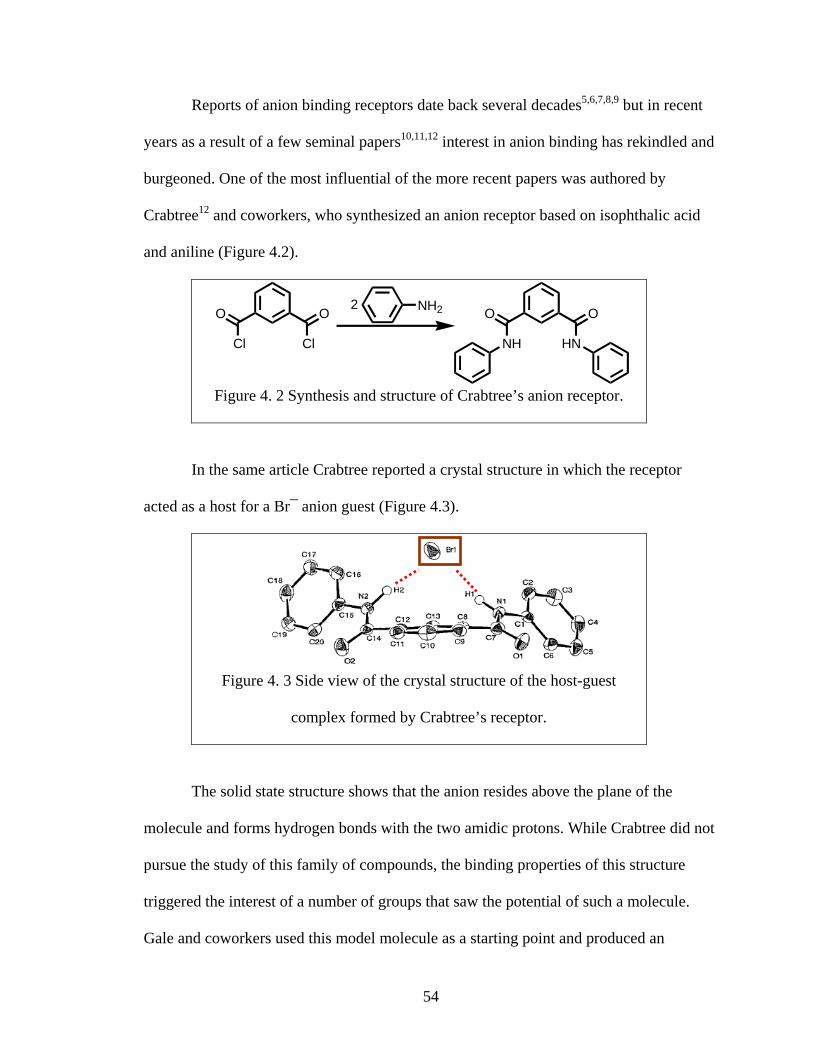
54
Reports of anion binding receptors date back several decades5,6,7,8,9 but in recent
years as a result of a few seminal papers10,11,12 interest in anion binding has rekindled and
burgeoned. One of the most influential of the more recent papers was authored by
Crabtree12 and coworkers, who synthesized an anion receptor based on isophthalic acid
and aniline (Figure 4.2).
Figure 4. 2 Synthesis and structure of Crabtree’s anion receptor.
In the same article Crabtree reported a crystal structure in which the receptor
acted as a host for a Br¯ anion guest (Figure 4.3).
Figure 4. 3 Side view of the crystal structure of the host-guest
complex formed by Crabtree’s receptor.
The solid state structure shows that the anion resides above the plane of the
molecule and forms hydrogen bonds with the two amidic protons. While Crabtree did not
pursue the study of this family of compounds, the binding properties of this structure
triggered the interest of a number of groups that saw the potential of such a molecule.
Gale and coworkers used this model molecule as a starting point and produced an
O
HN
O
NH
O
Cl
O
Cl
NH22

55
impressive library of isophthalic acid dianilides.13 The receptor has been used as an
anion-binding subunit into ion-pair hosts,14 while isophthalamides that replace the aniline
subunit with other aromatics such as aminoindoles15,16 or with alkylamines17 have been
reported. Numerous pyridine-2,6-dicarboxylic acid dianilides are known as well although
most were prepared for study in a context other than anion complexation.18
Dipicolinamides have been incorporated as subunits into structures such as Lehn's
helices19 and Anslyn's cyclophane receptor for trigonal planar anions.20
Another interesting result obtained with compounds bearing structural similarities
with Crabtree’s receptor was published by Li and coworkers.21 They demonstrated by use
of a planar bilayer experiment that the molecule in Figure 4.4 mediates the transport of
chloride through a phospholipid bilayer and exhibits channel – like behavior.
Figure 4.4 Li’s receptor and the planar bilayer traces.
The planar bilayer traces shown indicate the formation of two conductance states,
one corresponding to 54 pS and another one to 108 pS.
This result was both surprising and interesting. First, it shows that Crabtree–like
molecules are able to mediate the transport of ions through a phospholipid bilayer.
Second, this work suggests that such structures organize into ion channels. The planar
HN
O
NH
O
O O
NH HN OO

56
bilayer conductance results confirm the latter but the authors neither disclosed structural
information nor speculated upon it.
In order to bridge a phospholipid bilayer, a molecule or assembly must span ~35-
40 Ǻ. The size of the Li et al. channel former is about half of that at best depending on
conformation. The size issue alone suggests that it is impossible for a single molecule to
be responsible for the channel behavior observed. The size requirements point to the
formation of oligomeric aggregates either in the aqueous media or through lateral
diffusion inside the phospholipid bilayer. The inference we draw is that aggregates must
form a pore that mediates the transport of chloride ions.
Results The results discussed below are presented in the paper that our group published in
Chemical Communication in 2010.22 I have performed the electrospray-ionization mass
spectrometry studies detailed here. The calculations, syntheses, proton NMR binding
studies, chloride transport studies, and optical spectroscopy were performed by a former
coworker Dr Carl Yamnitz. Saeedeh Negin, another member of the Gokel research group
and a graduate student at the University of Missouri-St. Louis, performed the planar
bilayer studies.
The combination of numerous Crabtree-type variants that have appeared in the
literature and the intriguing but surprising results of Li et al. inspired our interest in this
group of compounds. The family of compounds shown in Figure 4.5 was prepared and
their anion transport properties were investigated. Four of the compounds shown in
Figure 4.5 are dianilides of dipicolinic acid and two are dianilides of isophthalic acid.
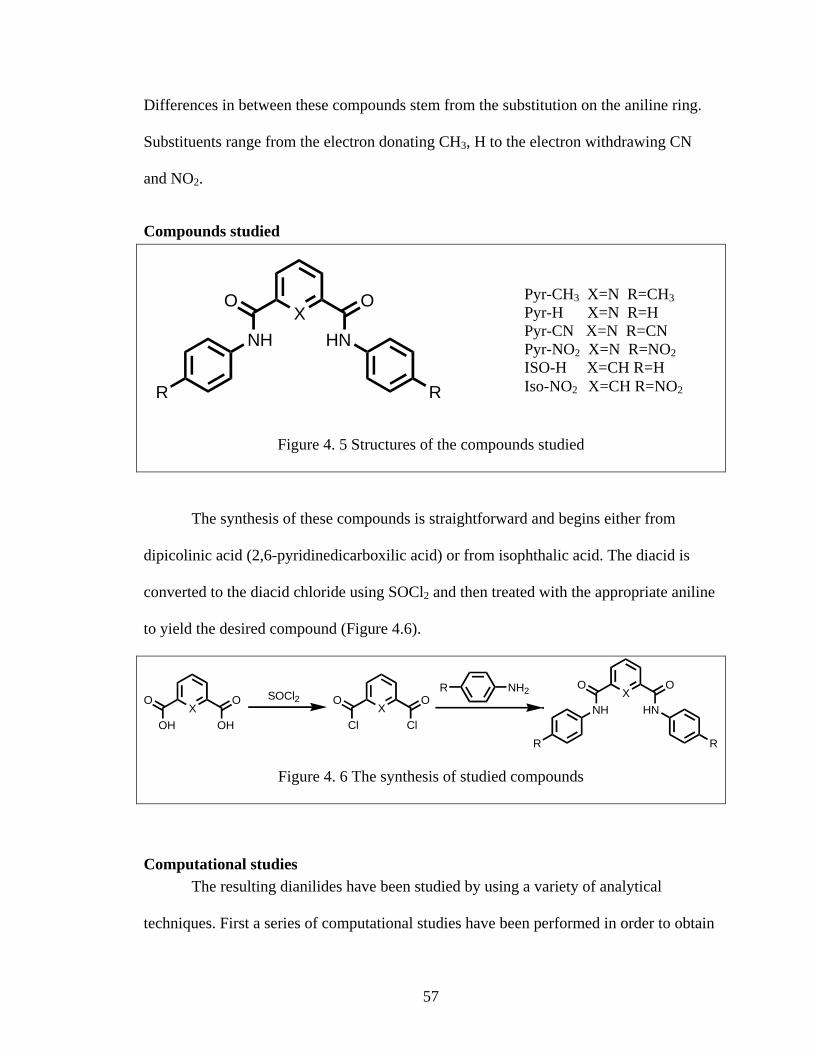
57
Differences in between these compounds stem from the substitution on the aniline ring.
Substituents range from the electron donating CH3, H to the electron withdrawing CN
and NO2.
Compounds studied
Figure 4. 5 Structures of the compounds studied
The synthesis of these compounds is straightforward and begins either from
dipicolinic acid (2,6-pyridinedicarboxilic acid) or from isophthalic acid. The diacid is
converted to the diacid chloride using SOCl2 and then treated with the appropriate aniline
to yield the desired compound (Figure 4.6).
XO
OH
O
OH
SOCl2X
O
Cl
O
Cl
NH2R XO
HN
O
NH
R R
Figure 4. 6 The synthesis of studied compounds
Computational studies The resulting dianilides have been studied by using a variety of analytical
techniques. First a series of computational studies have been performed in order to obtain
Pyr-CH3 X=N R=CH3 Pyr-H X=N R=H Pyr-CN X=N R=CN Pyr-NO2 X=N R=NO2 ISO-H X=CH R=H Iso-NO2 X=CH R=NO2
XO
HN
O
NH
R R

58
information about the gas phase conformations. These computational studies have been
performed by Dr Carl Yamnitz, at the DFT level of theory using Spartan 06 software
package. In Figure 4.7 the gas phase calculations for the unsubstituted isophthalamide
(left) and dipicolinamide (right) derivatives without any anions present are shown.
Figure 4. 7 Gas phase conformation of unsubstituted isophthalamide (left) and
dipicolinamide (right) in the absence of guest anions
Isophthalanilides have a syn-anti conformation with one of the aromatic sidearms
twisted. This particular conformation can be explained by the tendency of these
compounds to minimize the overall dipole of the molecule. The optimal conformation is
to have the dipoles of the carbonyl moieties pointing in opposite directions.
The unsubstituted dipicolinamide has a different conformation where the two
aromatic side-arms are in a syn–syn conformation. Again minimization of the overall
molecular dipole is the driving force for the conformation. In this particular case we also
have the dipole induced by the nitrogen atom incorporated in the pyridine ring. Another
difference is the opportunity for hydrogen bonding between the pyridyl nitrogen and the
two amidic protons, which locks the molecule in this planar arrangement and makes the
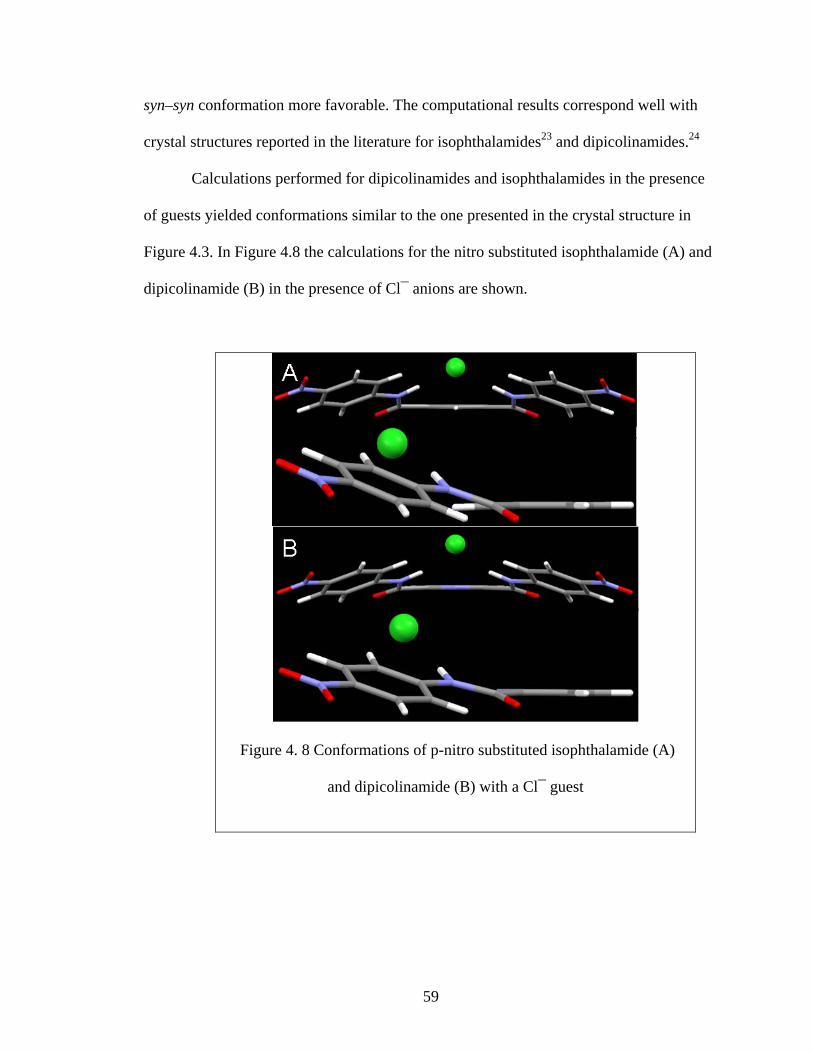
59
syn–syn conformation more favorable. The computational results correspond well with
crystal structures reported in the literature for isophthalamides23 and dipicolinamides.24
Calculations performed for dipicolinamides and isophthalamides in the presence
of guests yielded conformations similar to the one presented in the crystal structure in
Figure 4.3. In Figure 4.8 the calculations for the nitro substituted isophthalamide (A) and
dipicolinamide (B) in the presence of Cl¯ anions are shown.
Figure 4. 8 Conformations of p-nitro substituted isophthalamide (A)
and dipicolinamide (B) with a Cl¯ guest
B
A

60
In both cases, the Cl¯ resides above the plane of the molecule and the two
aromatic sidearms are rotated in order to favor the formation of hydrogen bonds between
the anion and the two amidic hydrogens.
Solution based studies The experimental behavior of these compounds was determined by the following
studies. Chloride release from the vesicles was measured by ion selective electrode and
fluorescence quenching methods as well as by planar bilayer experiments. Binding
constants were determined in solution by using a previously reported NMR method25.
The data from all of these experiments are in agreement and provide us with a trend for
the ability of these six compounds to bind and transport chloride. The two nitro
compounds and the cyano derivatives are the most active compounds, followed by the
unsubstituted and the methyl derivatives. This trend is in accordance with the electronic
properties of the para-substituents. The electron withdrawing substituents (p-nitro and p-
cyano) reduce the electron density on the aromatic ring and consequently on the N-H
amidic bond, weakening it. A proton involved in a weaker bond is more likely to form
hydrogen bonds with anions. This effect is no longer present for the unsubstituted and p-
methyl derivatives which exhibit lower activity.
While the data was piecing together nicely, what our work was lacking was direct
comparisons in between these compounds to clearly establish a ranking for the binding
and transport activity. A key issue was that differences in solubility precluded us from
obtaining binding constants data in the same solvent for all of the compounds. This, in
turn, made direct comparisons impossible.

61
Electrospray mass sprectrometry We decided to use mass spectrometry to overcome the solubility problem. The
dianilides were therefore studied using electrospray mass spectrometry (ES-MS). The
ES-MS method is a milder ionization technique than electron impact so little or no
fragmentation of the hosts is usually observed. 26 Another advantageous feature of the
ES-MS technique is that it uses solution samples instead of solid samples thus being
better fitted for our needs. A cartoon representation of the ES-MS ionization and
detection process is presented in Figure 4.9.27
Figure 4. 9 ES-MS ionization process
The solution is injected through a capillary placed inside another capillary tube
through which nitrogen gas (called nebulizing gas) is flowing. The tip of the capillary is
maintained at a high electric potential and this electric potential splits the sample into an
aerosol of small droplets. The flow of nitrogen gas directs the droplets towards the mass

62
spectrometer. In their path the droplets lose most of the solvent molecules thus increasing
the concentration of ions inside the droplet. When the electrostatic repulsion becomes too
great, a “Coulombic explosion” occurs that releases the ions into the vapor phase. These
ions are then detected based on their m/Z ratios.
The experiments were run using methanol solutions of the compounds studied and
tetrabutylammonium chloride. Compounds Pyr-NO2 and Iso-NO2 which are less soluble
in methanol were dissolved in a 10/90 (v/v) DMSO/methanol. Admittedly, methanol and
10% DMSO-methanol are not identical. However, both solvents are predominantly
methanol and the dielectric constants of methanol and DMSO are 33 and 44, respectively.
Our goal was to let the hosts compete for the anions so each experiment was
designed accordingly. In each experiment, the concentrations of the two hosts were the
same and the chloride (as tetrabutylammonium salt) was present in a substoichimetric
amount (usually 10-fold lower concentration) to permit the competition.
An example of the data collected from such an experiment is presented in Figure
4.10.

63
Figure 4. 10 Competitive ES-MS experiment between the p-nitro and the
unsubstituted isophthalamide
The data were processed as follows. In each MS experiment, the most intense
peak was used as a reference peak, called the “base peak” and assigned the reference
intensity (height) of 100. The intensities of all the other peaks in the spectrum are
normalized to this base peak so their intensities will be lower than or equal to 100%. The
intensity of the peak is a quantitative measure of the ions that are detected by the
instrument and of the ions that are formed in the mixture. By using ratios between the
peak intensities of the chloride adducts that the two hosts form, we can determine a
selectivity ranking for the two hosts.
In Figure 4.10 the competitive experiment is performed between two
isophthalamide derivatives: the p-nitro and the unsubstituted derivative. All of the peaks
are labeled and they correspond either to the deprotonated hosts or to chloride adducts.
The chloride adducts can be monomeric (one host and one Cl¯) or dimeric (two
molecules of host and one Cl¯). The dimers can be homodimers (the two molecules of the

64
same host) or heterodimers (a molecule of each host). When calculating the ratios of peak
abundances the homodimers are counted twice and heterodimers are counted once for
each host. For example the number of molecules of Iso-NO2 that bind Cl¯ are calculated
with the following formula: [(Iso-NO2)+Cl¯] + [(Iso-NO2)+(Iso-H)+Cl¯] + 2*[2x(Iso-
NO2)+Cl¯].
The data accumulated from the various competitive experiments is presented in
Table 4.1.
Table 4. 1Competitive ES-MS experiment data for the
compounds studied.
Compound X p-substituent Ratios vs Iso-H
Pyr-CH3 CH CH3 0.14 ± 0.01
Pyr-H CH H 0.13 ± 0.02
Pyr-CN CH CN 3.27 ± 0.26
Pyr-NO2 CH NO2 2.82 ± 0.07
Iso-H N H 1.00
Iso-NO2 N NO2 5.44 ± 0.65
In these competitive experiments, the compounds Pyr-CN, Pyr-NO2 and Iso-NO2
bound more Cl¯ than the designated control compound (Iso-H) did and even more than
compounds Pyr-CH3 and Pyr-H did. Compounds Pyr-CN, Pyr-NO2 and Iso-NO2 have
electron withdrawing substituents in the para-position of the aniline ring (cyano or nitro).
The presence of these electron withdrawing substituents reduces the electron density on

65
the aromatic system, which in turn reduces the electron density of the N-H bond. The
resulting N-H is weaker (more acidic) making hydrogen bonding with chloride easier.
The compound Iso-H was chosen to be the reference for several reasons. The
reference structure was required to provide enough binding in order to have a reliable
comparison with the stronger binders, but at the same time it could not be so potent that it
would totally suppress the signal from the weaker binders. Before starting the
experiments, we suspected that compounds Pyr-CH3 and Pyr-H and Iso-H would be the
weaker binders so our standard should be one of them. Our first experiments were
directed to rank these three compounds in order to pick a suitable standard. As can be
seen in Table 4.1, Iso-H is the strongest binder in this series. It was therefore chosen to be
the control structure.
We performed direct comparisons using other potential standards as well. For
instance, we performed a competitive experiment using Pyr-NO2 and Iso-NO2. The
experiment was successful, but the data obtained were difficult to interpret and quantify.
This is because compounds Pyr-NO2 and Iso-NO2 differ only through the identity of the
atom in position 1 on the central arene: N for Pyr-NO2 and CH for Iso-NO2. This
difference translates to only one atomic mass unit difference between the adducts of these
two compounds, so the [Host+Cl¯] is a mixture of [(Iso-NO2)+Cl¯] and [(Pyr-
NO2)+Cl¯] peaks overlapping, while the dimer adduct cluster is composed of three
species: [2x(Iso-NO2)+Cl¯], [(Pyr-NO2)+(Iso-NO2)+Cl¯] and [2x(Pyr-NO2)+Cl¯]. An
example of the composition of the cluster of peaks corresponding to a dimmer is
exemplified in Table 4.2.

66
Deconvoluting these clusters is difficult but possible by using isotope distribution
charts. Starting with the first peak we know it is composed only of the homodimer of Iso-
NO2 and Cl¯. From the isotope distribution charts we get the percentage of the [2x(Iso-
NO2)+1+Cl¯] from [2x(Iso-NO2)+Cl¯]. Subtracting that from the second peak we are left
with only [(Pyr-NO2)+(Iso-NO2)+Cl¯]. Using a similar procedure but taking into
consideration the isotope distribution charts for [(Pyr-NO2)+(Iso-NO2)+Cl¯] we obtain
[2x(Pyr-NO2) +Cl¯] from the third peak and so on.
Interpreting the results of this procedure, while having a lot of merit as a control
experiment, is very tedious and time consuming. We performed it for the Pyr-NO2 and
Table 4. 2Species present in the cluster of peaks corresponding to a
dimmer chloride adduct
m/Z value Species present
848 [(Iso-NO2)+Cl-]
849 [2x(Iso-NO2)+1+Cl¯] + [(Pyr-NO2)+(Iso-NO2)+Cl¯]
850 [2x(Iso-NO2)+2+Cl¯] + [(Pyr-NO2)+(Iso-NO2)+1+Cl¯] +
[2x(Pyr-NO2)+Cl¯]
851 [2x(Iso-NO2)+3+Cl¯] + [(Pyr-NO2)+(Iso-NO2)+2+Cl¯] +
[2x(Pyr-NO2)+1+Cl¯]
852 [2x(Iso-NO2)+4+Cl¯] + [(Pyr-NO2)+(Iso-NO2)+3+Cl¯] +
[2x(Pyr-NO2)+2+Cl¯]

67
Iso-NO2 pair and it resulted in a 1.3:1 selectivity for Iso-NO2 as well as for Pyr-H and
Iso-H pair and it resulted in a 7:1 selectivity for Iso-H. The results from these
experiments correlate well with the data presented in Table 4.1.
The data from the ES-MS experiments points towards the following binding
strength ranking: Iso-NO2, Pyr-CN, Pyr-NO2>Iso-H, Pyr-H, Pyr-CH3. This trend
correlates very well with the results from our other studies.
Conclusions The ability of dianilides of dipicolinic and isophthalic acids to bind and transport
chloride through phospholipid bilayers is clear. Studies using independent analytical
techniques (computational experiments, planar bilayer, influx of chloride into vesicles,
binding constant determination by NMR and ES-MS assays) all point towards the same
activity trend for the members of this family of compounds. The most active compounds
are the ones bearing the electron withdrawing substituents (p-nitro and p-cyano) on the
aniline ring. These three compounds are far superior to the non-substituted compounds or
those molecules having electron donating substituents (methyl) as far as their ability to
bind and transport chloride ions.
While planar bilayer and chloride influx experiments give us data on the anion
transporter character of these compounds, we obtained more detailed data on the binding
process by using 1H-NMR-determined binding constants. The caveat of the NMR
experiments was the difference in solubility between these compounds, which impeded
direct comparisons. To overcome this difficulty we devised competition experiments
using ES-MS so that direct comparisons of these compounds in solution can be made.
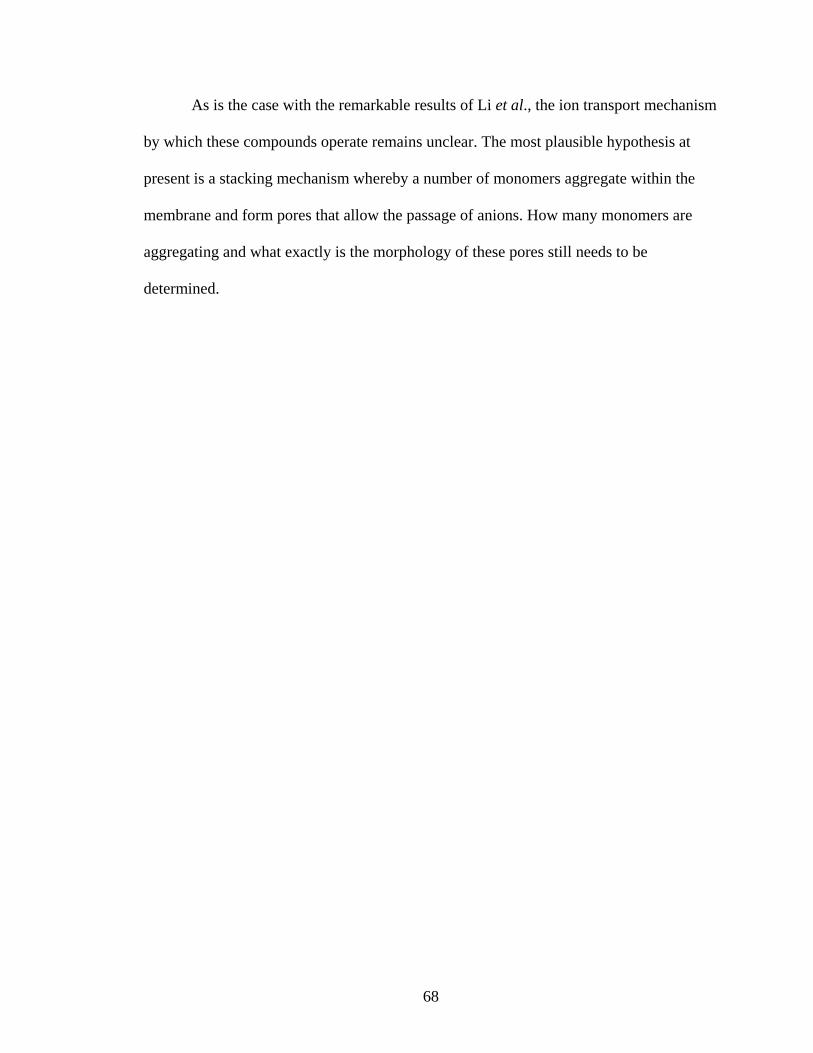
68
As is the case with the remarkable results of Li et al., the ion transport mechanism
by which these compounds operate remains unclear. The most plausible hypothesis at
present is a stacking mechanism whereby a number of monomers aggregate within the
membrane and form pores that allow the passage of anions. How many monomers are
aggregating and what exactly is the morphology of these pores still needs to be
determined.
69
Experimental Section
Synthesis of the compounds studied was performed as previously described15 and
the physical properties of these compounds correlated well with the previously published
compounds.
Competitive chloride binding assayed by electrospray mass spectrometry
In each experiment, competing hosts were present in equimolar concentrations
(50 μM) and chloride (as NBu4Cl salt) was kept sub-stoichiometric (5 µM). The ratios
shown in Table 4.1 were calculated from the total integration of relevant m/Z peaks for
host-Cl¯ adducts. In every case, the total relative abundance of the unsubstituted
isophthalamide, was normalized to 1, with a value established for the competing
compound. Errors are the calculated standard deviations of ratios from at least three
independent experiments.

70
References 1 Hille, B. Ionic channels of excitable membranes (third edition); 3rd ed.; Sinauer Associates: Sunderland, MA, 2001 p 814. 2 Stark, G.; Ketterer, B.; Benz, R.; Lauger, P. Biophys. J. 1971, 11, 981-994. 3 Buck, R. P. J. Phys. Chem. 1987, 91, 2347-2350. 4 Doyle, D. A.; Cabral, J. M.; Pfuetzner, R. A.; Kuo, A.; Gulbis, J. M.; Cohen, S. L.; Chait, B. T.; MacKinnon, R., Science 1998, 280, 69-77. 5 (a) C. H. Park and H. E. Simmons, J. Am. Chem. Soc., 1968, 90, 2431; 6 F. P. Schmidtchen, Angew. Chem., 1977, 89, 751; 7 E. Graf and J.-M. Lehn, J. Am. Chem. Soc., 1975, 97, 5022 8 A. Echavarren, A. Galan, J. De Mendoza, A. Salmeron and J.-M. Lehn, Helv. Chim. Acta, 1988, 71, 685; 9 M. Newcomb and M. T. Blanda, Tetrahedron Lett., 1988, 29, 4261 10 (a) Anion Receptor Chemistry, ed. A. Bianchi, K. Bowman-James and E. Garcia- Espana, Wiley-VCH, New York, 1997; (b) 11 J. L. Sessler, P. A. Gale and W.-S. Cho, Anion Receptor Chemistry, Royal Society of Chemistry, Cambridge, 2006. 12 (a) Kavallieratos, K.; de Gala, S. R.; Austin, D. J.; Crabtree, R. H. J. Am. Chem. Soc. 1997, 119, 2325-2326. (b) Kavallieratos, K.; Bertao, C. M.; Crabtree, R. H. J. Org. Chem. 1999, 64, 1675-1683. 13 (a) Gale, P. A. Acc. Chem. Res. 2006, 39, 465-475. (b) Bates, G. W.; Gale, P. A.; Light, M. E. Chem. Commun. 2007, 2121-2123. 14 Koulov, A. V.; Mahoney, J. M.; Smith, B. D. Org. Biomol. Chem. 2003, 1, 27-29. 15 (a) Bates, G. W.; Gale, P. A.; Light, M. E. Chem. Commun. 2007, 2121-2123. 16 Zielinski, T.; Dydio, P.; Jurczak, J. Tetrahedron 2008, 64, 568-574. 17 Santacroce, P. V.; Davis, J. T.; Light, M. E.; Gale, P. A.; Iglesias-Sanchez, J. C.; Prados, P.; Quesada, R. J. Am. Chem. Soc. 2007, 129, 1886-1887. 18 Lizarraga, E.; Zabaleta, C.; Palop, J. A. J. Thermal Anal. Colorim. 2007, 89, 783-792.

71
19 Berl, V.; Huc, I.; Khoury, R. G.; Lehn, J.-M., Chem. Eur. J. 2001, 7, 2798-2809. 20 Bisson, A. P.; Lynch, V. M.; Monahan, M.-K. C.; Anslyn, E. V. Angew. Chem. Int. Ed. Engl. 1997, 36, 2340-2342. 21 (a) Li, X.; Shen, B.; Yao, X.-Q.; Yang, D. J. Am. Chem. Soc. 2007, 129, 7264-7265. (b) Li, X.; Shen, B.; Yao, X.-Q.; Yang, D. J. Am. Chem. Soc. 2009, 131, 13676–13680. 22 Yamnitz, C. R.; Negin, S.; Carasel, I. A.; Winter, R. K.; Gokel, G. W. Chem. Commun. 2010, 46, 2838-2840 23 Nimmanpipug, P.; Tashiro, K.; Maeda, Y.; Rangsiman, O. J. Phys. Chem. B 2002, 106, 6842-6848. 24 Malone, J. F.; Murray, C. M.; Dolan, G. M. Chem. Mater. 1997, 9, 2983-2989. 25 Connors, K. A. Binding Constants, 1st ed.; John Wiley & Sons: New York, 1987, 189-215. 26 Silverstein, R. M.; Webster, F. X.; Kiemle, D. J.; “Spectrometric Identification of Organic Compounds; Seventh Edition”, John Wiley & Sons, Inc, 2005, p 7. 27 Image reproduced from http://rsl.eng.usf.edu/Pages/ResearchElectrospray.html

72
Chapter 5. Gas Phase Ion Selectivity of 1,3-Diarylamides

73
Introduction The study of ligands, hosts, receptors, etc. for cations and anions has been
underway for a century or more.1,2,3,4,5,6,7,8,9,10 Historically, cation complexation has
received more attention, but during recent years the study of receptors for anions such as
halides has become an area of vigorous research effort. In this range of studies, many
interactions have proved to be important in the complexation process but the most
frequent binding motif for anion complexation is typically hydrogen bonding.11,12,13,14,15,16
The slower development of anion sensors, compared to cation sensors, is due to
the fact that detecting small inorganic anions is often more difficult than detecting
cations. This difficulty stems in part from the fact that the anions are larger than the
isoelectronic cations17 which lowers their charge density and reduces the effectiveness of
electrostatic interactions with a potential ligand. Polyatomic inorganic anions exhibit a
wide range of geometries with charges delocalized over a number of atoms which makes
designing a suitable receptor more difficult.
Another feature of anions is their higher free energy of solvation compared to
cations of almost the same size, which means that the receptor must compete more
effectively with the solvent. For example, F¯ (radius = 1.36 Å) has a ΔG hydration of -
465 kJ/mol, which is significantly greater than a potassium cation with almost the same
size (radius = 1.38 Å) and ΔG hydration of -295 kJ/mol18. These particularities of anions
make the task of binding and detecting anions more difficult.
In a recent paper19 from our group, compounds having the general structure
presented in Figure 5.1 have been shown to bind and transport Cl¯ through phospholipid
bilayers. Binding and transport involving or mediated by these compounds has been

74
investigated using gas-phase calculations and experiments such as planar bilayer
conductance studies, ion release from vesicles, fluorescence studies, and electrospray
mass spectrometry (ES-MS).
The combination of results obtained by the application of these various techniques
established a trend for Cl¯ binding and transport activity. Broadly expressed, binding and
transport mediated by 3, 4 and 6 was greater than observed for 1, 2 and 5.
Each of the experimental techniques enumerated above provides information
about an aspect of the overall ion transport process. For instance, the planar bilayer
experiments provide evidence for transport through a “membrane-like” structure while
fluorescence experiments give data from which the aggregation behavior of these
compounds can be inferred. The electrospray mass spectrometry technique, ES-MS (a
solution based mass spectrometry technique),20 may be used to investigate the anion
binding abilities of these compounds. Experiments are designed so that anions will
compete for a host. This is done because the ES-MS method is not sufficiently
quantitative to compare separate experiments to reliably obtain selectivity data. To ensure
competition the anion concentrations in all experiments significantly exceeded the host
concentration.
X
O
HN
O
NH
R R
Figure 5. 1 General structure of compounds 1-6
1 X=N R=CH3 2 X=N R=H 3 X=N R=CN 4 X=N R=NO2 5 X=CH R=H 6 X=CH R=NO2

75
It was found in earlier work that compounds such as 4 and 6 (see above) are
effective Cl¯ binders.19 This result begged the question of halide ion selectivity and,
indeed, selectivity in binding other types of anions. The first phase of this study was
therefore to probe selectivity in the halogenated anion series (F¯, Cl¯ and Br¯).
Computational data Computational studies were conducted by Dr. Carl Yamnitz in our laboratory,
using the Spartan Software Package at the density functional theory (DFT) level. Details
of the computational work are presented in his doctoral dissertation. Certain results are
recounted here as they help us understand the binding and selectivity properties of the
isophthalamides and the picolinamides. The three halogenated anions used in this study
(F¯, Cl¯ and Br¯) all have the same charge (1¯) but differ in their ionic radii. This
difference is represented visually in Figure 5.2.17
Figure 5. 2 Ionic radii for F¯, Cl¯ and Br¯
Gas phase calculations were performed using both Pyr (4) and Iso (6) either by
themselves or when binding F¯, Cl¯, or Br¯. The results are shown in pictorial form in
Figure 5.3.

76
O
HNO
NH
NO
HN
O
NH
syn-anti syn-syn
Figure 5. 3. Conformation of unsubstituted isophthalamides (left) and dipicolinamides
(right).
The computational studies suggest that hosts Pyr and Iso exist in different
conformations in the absence of any guest (see Figure 5.3): Iso is in a syn-anti
conformation while Pyr is in a syn-syn conformation. For Iso, the driving force for
attaining the syn-anti conformation is minimizing the molecular dipole that arises from
the presence of two amidic moieties. In the case of Pyr, an additional dipole is
contributed by the pyridyl N. There is also the possibility of intramolecular hydrogen
bonding between the pyridyl N and the amidic NH bonds in the Pyr host. The result of
these interactions is a syn-syn conformation.
Pyr Iso

77
The gas phase calculations of host–anion adducts were used to estimate the
distance between the anion and the amidic N (in yellow in Figure 5.4), the angle that the
anion and the central arene form (pink), the torsion angle of the side-arms (green) and the
host-guest binding energies.
Figure 5. 4 The method of data collection used for gas phase calculations.
Both Pyr and Iso bind Cl¯ in a similar manner (exemplified by Iso in Figure 5.5).
The calculations show that Cl¯ resides above the plane of the central arene at a 148º
angle. The two sidearms are rotated to minimize the distance between the amidic protons
and the anion. The dihedral angle between the central benzene ring and the side-arms is
23º and the distance between Cl¯ and the amidic N is 3.29Å.
Figure 5. 5 Host Iso binding Cl¯
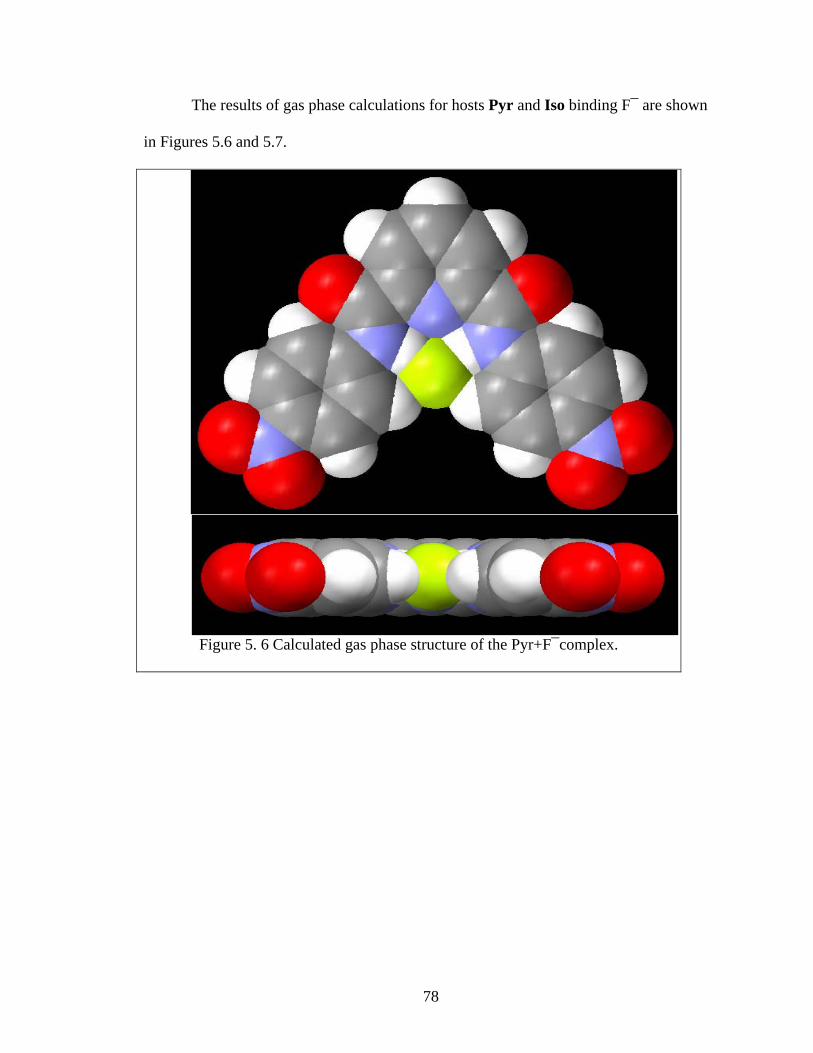
78
The results of gas phase calculations for hosts Pyr and Iso binding F¯ are shown
in Figures 5.6 and 5.7.
Figure 5. 6 Calculated gas phase structure of the Pyr+F¯complex.

79
Figure 5. 7 Calculated gas phase structure of the Iso+F¯.
Data are not shown here for the analogous Br¯ adducts, but they exhibit similar
conformations when binding Cl¯.
The calculated data for all six [host-X¯] adducts are summarized in Table 5.1.
Table 5. 1. Computational data collected for adducts of Pyr and Iso with halogenated
anions (F¯, Cl¯, and Br¯). All experiments were performed at the DFT level of theory.
Adduct X¯ - amidic N
distance (Å)
Central arene
– X¯ angle (º)
Side-arm
torsion (º)
[Host-X¯]
Kcal/mol
[Pyr+F¯] 2.58 178 1 -123
[Pyr+Cl¯] 3.23 146 17 -37
[Pyr+Br¯] 3.45 142 18 -41
[Iso+F¯] 2.66 154 18 -132
[Iso+Cl¯] 3.29 148 23 -42
[Iso+Br¯] 3.47 144 25 -51

80
In the series of adducts formed by Pyr, the selectivity (F¯>Cl¯>Br¯) can be
explained based on differences in hydrogen bond length, the angle that the anion forms
with the plane of the central arene, and side-arm torsion. Both the hydrogen bond
distance and the side-arm torsion increase with increasing atomic mass of the complexed
anion. Concurrently the angle formed by the anion and the central arene decreases,
meaning the respective anion resides higher above the plane of the molecule. These three
changes result in weaker bonding interactions and a corresponding decrease in anion
selectivity.
An analysis of this series using the same parameters as above (H-bond length,
angles and side-arm torsion) shows that the situation is similar for the series of adducts
that host Iso forms with halide ions. F¯ is the preferred anion followed by Cl¯ and Br¯.
An interesting conformation is exhibited by the [Pyr-F¯] adduct (Figure 5.6). In
this case the anion resides in the same plane as the central arene. There is very little
twisting of the two side-arms (~1º) and this lack of rotation results in less disruption of
the conjugation with the amide bond. At the same time the pre-existing hydrogen bonds
between the amidic NH and the pyridyl N are not disturbed, further favoring the planar
conformation. Also the smaller ionic radii of F¯ (1.33Ǻ) and the fact that Pyr has a
nitrogen atom instead of an CH in the 1 position makes accommodating the anion in the
planar conformation possible.
The [Iso-F¯] adduct (Figure 5.7) has different structural characteristics. The F¯
ion resides above the plane of the central arene at an angle of 154º. The two side-arms are
twisted with the N-H bonds pointing towards the F¯ at an angle of 18º and the distance
between F¯ and the amidic N is 2.66Å. So in a direct experiment with Pyr and Iso
81
competing for F¯ we would probably see more of the [Pyr+F¯] forming than the Iso
analog. This is most likely due to the presence of the extra hydrogen atom in the binding
cleft of Iso that occupies part of the space that F¯ would require and pushes the anion out
of the plane, resulting in partial disruption of conjugation.
The Cl¯ complexes of both Pyr and Iso are similar. The only notable difference is
seen in the side-arm torsion angles: 17º for Pyr and 23º for Iso. The difference is
probably caused by the hydrogen bonding that exists between the amidic NH and the
pyridyl N. The existence of these two hydrogen bonds makes the system less prone to
twisting, hence the smaller torsion angle. These data suggests that in a direct comparison
experiment, both hosts would exhibit similar complexation modes. A similar conclusion
can be drawn for the bromide adducts.
Electrospray mass spectrometry experiments
Solutions of hosts Pyr and Iso (0.5 mM) in 10% DMSO/MeOH were prepared
along with solutions of tetrabutylammonium fluoride, chloride, and bromide in MeOH.
Aliquots from solutions of one host and two competing anions were mixed to yield a final
concentration of host equal to 4.5 µM with a ratio of host to anions that is usually 1:10:10
(exceptions are discussed below). This mixture was injected in the ES-MS instrument and
the resulting spectra were collected.
The resulting peaks were analyzed as follows: the intensity of every peak is
normalized to the most intense peak (the base peak) which is set to an arbitrary value of
100. The intensities of each peak are proportional to the amount of anion adduct that is
formed. The hypothesis is that the more anion adduct that is formed, the stronger must be
82
the bond between X¯ and the host. The peak intensities for monomers and the dimers
(either homodimers or heterodimers) of a certain anion are summed and the composite
values are used to determine the ratios between various anion adducts. The resulting
ratios establish rankings of binding strength among anions. These rankings provide us
with information on the selectivity of a certain host for various anions.19
Control experiments
A) ES-MS response to Pyr and Iso
Experiments were preformed that directly compare adducts formed by the two
hosts and one anion. Solutions of hosts Pyr and Iso (0.5 mM) in 10% DMSO/MeOH
were prepared along with solutions of tetrabutylammonium chloride in MeOH. Aliquots
from solutions of the two competing hosts and Cl¯ were mixed to yield a final
concentration of host equal to 4.5 µM with a ratio of Iso:Pyr:Cl¯ of 1:1:10. This mixture
was injected in the ES-MS instrument and the resulting spectra were collected. The mass
spectral peak intensities, obtained from these experiments for [Iso+Cl¯]/[Pyr+Cl¯], gave
a ratio of 1.3:1 (three replicates). Thus, the behavior of the hosts is similar but not
identical. A limitation of this approach is the fact that the molecular weights of Iso and
Pyr differ by only one atomic mass unit. Thus, complexes formed with these two hosts
and the same anion were difficult to distinguish (i.e. the peaks in the ES-MS spectra
overlap). When selectivities observed in subsequent experiments differed by only 30%,
they were interpreted as being the same within experimental error. However, most
selectivity or partition ratios were well outside 30%.

83
B) Partitioning of Pyr and Iso between deprotonation and complexation
The tendency of the two hosts to form adducts or deprotonate has been studied
using ES-MS experiments. For this particular series of experiments solutions of hosts Pyr
and Iso (0.5 mM) in 10% DMSO/MeOH were prepared along with solutions of
tetrabutylammonium fluoride and chloride in MeOH. Aliquots from solutions of the host
and the studied anion were mixed to yield a final concentration of host equal to 4.5 µM.
The binding/deprotonation behavior was studied at host:anion ratios of 1:1 and 1:10. The
mixture (host:Bu4NX or host:10 Bu4NX) was injected into the ES-MS instrument, the
resulting spectra were collected, and the ratios between [Host+X¯] / [Host-H]¯ were
determined. These ratios are presented in Table 5.2 for Pyr and Table 5.3 for Iso.
Table 5.2 Host single anion control experiments for Pyr
Hosta Anionb Host-X¯
ratios
[Host-X¯] /
[Host-H]¯
% Interaction
Binding% Deprotonation%
Pyr F¯ 1:1 2.4:1 70 30
Pyr F¯ 1:10 0.42:1 30 70
Pyr Cl¯ 1:1 17.2:1 94 6
Pyr Cl¯ 1:10 5.5:1 85 15
aStock [Host]=0.5 mM in 10% DMSO/MeOH; Final [Host]=4.5 µM in 0.5%
DMSO/MeOH. bStock [TBAX]=1 mM in MeOH

84
Table 5.3 Host single anion control experiments for Iso
Hosta Anionb Host-X¯
ratios
[Host-X¯] /
[Host-H]¯
% Interaction
Binding% Deprotonation%
Iso F¯ 1:1 3.1:1 75 25
Iso F¯ 1:10 0.2:1 17 83
Iso Cl¯ 1:1 21.3:1 96 4
Iso Cl¯ 1:10 15.6:1 94 6
aStock [Host]=0.5 mM in 10% DMSO/MeOH; Final [Host]=4.5 µM in 0.5%
DMSO/MeOH. bStock [TBAX]=1 mM in MeOH
At least two things can be inferred from the data presented in Tables 5.2 and 5.3,
above. First, at a host:F¯ ratio of 1:1 the ability of F¯ to deprotonate either Iso or Pyr is
similar. Although pyridine is more electron poor than benzene, the nitroaniline
components of each diamide likely dominate the dissociation. The first and second
dissociation constants for isophthalic acid are 3.5 and 4.6, respectively. The
corresponding values for dipicolinic acid are 2.2 and 4.8.21 The difference in pK1 for the
acids is a little more than a power of ten. This difference is likely to be reduced for the
diamides. Thus, Pyr shows approximately 30% deprotonation in the presence of one
equivalent of F¯ compared to 25% by Iso.
Second, in the presence of a 10-fold excess of F¯, deprotonation of Iso is greater
than deprotonation of Pyr, although it is the dominant process in both cases. The Pyr
host is likely more acidic than Iso, but removal of a proton from Pyr leaves two adjacent
lone pairs (deprotonated amide and pyridyl nitrogen lone pair). This is obviously

85
unfavorable but the difference in the two values may well be within the error of the
experiment.
The deprotonation reaction is clearly undesirable in terms of complexation. First,
it depletes the pool of host available for binding, leaving less host available to bind with
anions. In this way the selectivity measurements reflect what happens only to some of the
host and not to the majority of the host. Second, a deprotonated host has a negative
charge in the anion binding cleft. A negative charge can only have a repelling interaction
with an anion.
The data in tables 5.2 and 5.3 show that Cl¯ prefers anion binding over
deprotonation. Very little deprotonation occurs either if Cl¯ is present in a 1:1 ratio (94-
96% binding) or 1:10 ratio (85-94% binding). The higher percent of binding that occurs
for Iso when compared to Pyr can be explained by the higher acidity of the amidic
protons of Pyr caused by the internal hydrogen bonding that causes slightly more
deprotonation to occur. On the other hand F¯ shows 70-75% binding at a 1:1 ratio and
17-30% binding at a 1:10 ratio. If we compare these numbers, either at a 1:1 or at a 1:10
molar ratios, in either case the propensity for deprotonation for F¯ is superior to that of
Cl¯ by a significant margin. Hence in a direct experiment with F¯ and Cl¯ we can expect
that the deprotonation reaction can be attributed mostly to F¯.
The ES-MS control experiments show that F¯ deprotonates the two hosts more
than Cl¯. So even if a stronger binding interaction is expected to occur in the host-F¯
complex than in the Cl¯ or Br¯ analogs this cannot be directly quantified and translated
into the predicted complexation order of F¯>Cl¯>Br¯ within our set of conditions due to
the competition from the deprotonation process.

86
C) UV-vis controls
In our analysis of the UV-vis properties of these compounds we tried to assign the
peaks to the anion adduct and the deprotonated host respectively. To observe the UV-vis
properties of the fully deprotonated host we added excess DMSO solution of a strong
base: dimsyl sodium (pKa of DMSO is 35 making dimsyl sodium a very strong base) and
recorded the UV-vis spectrum in DMSO. The resulting spectrum is presented in Figure
5.8.
275 375 475 575 675 7750
1
2
3
4
5
PyrPyr + Na+DMSO¯
332 401
537
Wavelength (nm)
Abso
rban
ce
Figure 5. 8 UV-vis spectrum of Pyr in DMSO in the presence of excess
Na+DMSO¯
There are significant changes between the two traces. The blue trace that contains
only Pyr has a λmax at 332 nm. The red trace that contains Pyr and dimsyl sodium has a
maximum at 401 nm which probably pertains to the doubly deptotonated host.

87
In a different UV-vis experiment ran in EtOAc, in which 1 equivalent of Pyr is
exposed to 10 equivalents of TBAF (Figure 5.9) a maximum at 343 nm is apparent which
most likely corresponds to the single deprotonated host.
Figure 5. 9 UV-Vis traces in EtOAc for 1 eq Pyr and 10 eq F¯. Final [Pyr]=33 µM.
Titration of Pyr with TBACl
UV-vis titration of Pyr with TBACl resulted in the graph presented in Figure
5.10. 1 mL of a 1 mM solution of Pyr in DMSO was added to 2 mL of EtOAc and the
resulting solution was titrated with aliquots of a 1 mM DMSO solution of TBACl to yield
the molar ratios presented in Figure 5.10.

88
275 375 475 5750.000.250.500.751.001.251.501.752.00 1:0
1:0.251:0.51:0.751:11:21:31:51:10
Wavelength
Abs
orba
nce
Figure 5. 10 UV-vis titration of Pyr with Cl¯
The λmax changes from 322 nm (yellow trace) to 332 nm (black trace). Also the
intensity of the traces is diminishing as we titrate due to dilution. No isosbestic point or
other absorption bands are observed. This data along with the ES-MS study that showed
84-94% Cl¯ binding going from mixtures containing the host:Cl¯ in a 1:1 ratio to 1:10
ratio indicate the prevalence of binding over deprotonation in this experiment.
Results
Anion selectivity data for the Pyr and Iso hosts with halogenated anions, obtained
by the ES-MS method, are summarized in Table 5.4. Each value presented is the average
of at least three trials. Solutions of hosts Pyr and Iso (0.5 mM) in 10% DMSO/MeOH
were prepared along with solutions of tetrabutylammonium fluoride, chloride, and
bromide in MeOH. Aliquots from solutions of one host and two competing anions were
mixed to yield a final concentration of host equal to 4.5 µM with a ratio of host to anions
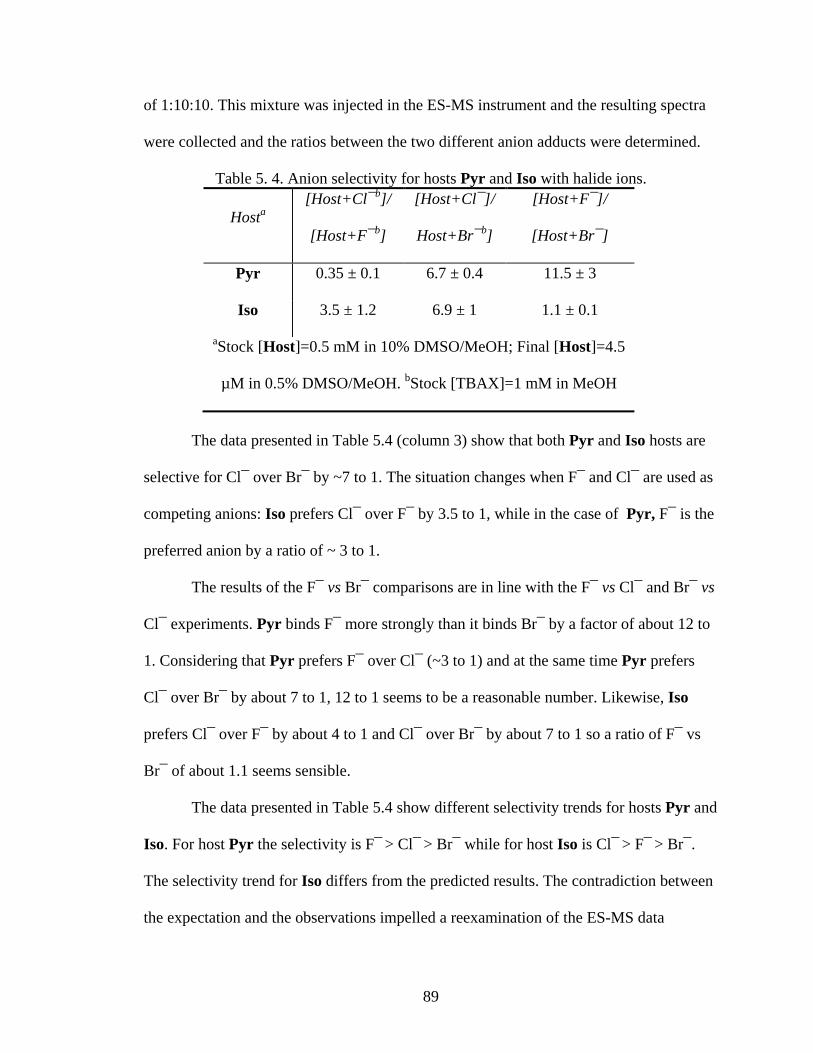
89
of 1:10:10. This mixture was injected in the ES-MS instrument and the resulting spectra
were collected and the ratios between the two different anion adducts were determined.
Table 5. 4. Anion selectivity for hosts Pyr and Iso with halide ions.
Hosta [Host+Cl¯b]/
[Host+F¯b]
[Host+Cl¯]/
Host+Br¯b]
[Host+F¯]/
[Host+Br¯]
Pyr 0.35 ± 0.1 6.7 ± 0.4 11.5 ± 3
Iso 3.5 ± 1.2 6.9 ± 1 1.1 ± 0.1
aStock [Host]=0.5 mM in 10% DMSO/MeOH; Final [Host]=4.5
µM in 0.5% DMSO/MeOH. bStock [TBAX]=1 mM in MeOH
The data presented in Table 5.4 (column 3) show that both Pyr and Iso hosts are
selective for Cl¯ over Br¯ by ~7 to 1. The situation changes when F¯ and Cl¯ are used as
competing anions: Iso prefers Cl¯ over F¯ by 3.5 to 1, while in the case of Pyr, F¯ is the
preferred anion by a ratio of ~ 3 to 1.
The results of the F¯ vs Br¯ comparisons are in line with the F¯ vs Cl¯ and Br¯ vs
Cl¯ experiments. Pyr binds F¯ more strongly than it binds Br¯ by a factor of about 12 to
1. Considering that Pyr prefers F¯ over Cl¯ (~3 to 1) and at the same time Pyr prefers
Cl¯ over Br¯ by about 7 to 1, 12 to 1 seems to be a reasonable number. Likewise, Iso
prefers Cl¯ over F¯ by about 4 to 1 and Cl¯ over Br¯ by about 7 to 1 so a ratio of F¯ vs
Br¯ of about 1.1 seems sensible.
The data presented in Table 5.4 show different selectivity trends for hosts Pyr and
Iso. For host Pyr the selectivity is F¯ > Cl¯ > Br¯ while for host Iso is Cl¯ > F¯ > Br¯.
The selectivity trend for Iso differs from the predicted results. The contradiction between
the expectation and the observations impelled a reexamination of the ES-MS data

90
collected. The most significant difference observed in the ES-MS experiments involved
those in which F¯ was present. In most experiments that have F¯ as one of the competing
anions the base peak corresponds to the deprotonated host and not to one of the anion
adducts. This means that the majority of host is not available to form an anion adduct. We
inferred that the selectivity trends determined in these experiments were not reliable. A
search of the literature revealed reports of F¯ behaving as a base rather than as a guest.22
To examine the selectivity trend for Pyr in a set of conditions where binding was
favored over deprotonation a series of ES-MS experiments was conducted in which the
molar ratios of anions to host were varied. We started with the same conditions used
previously (host : anion molar ratios 1:10:10 in 0.5%DMSO/MeOH) and gradually
reduced the molar ratios of the anions while keeping the concentration of host constant.
We examined the binding/deprotonation equilibrium at host : anion molar ratios of 1:5:5,
1:3:3 and 1:1:1. For each of these experimental conditions we determined the ratio of the
Cl¯ adduct to the F¯ adduct. The results that were obtained are shown in Table 5.5.
Table 5. 5. Base peak and selectivity ratios for Pyr at various anion molar ratios.
Molar Ratio
Pyra : Cl¯b : F¯b
[Pyr + Cl¯] /
[Pyr + F¯] Base Peak M/z Base peak identity
1 : 1 : 1 4.3 ± 1.1 441 [Pyr + Cl¯] Chloride adduct
1 : 3 : 3 1.8 ± 0.7 405 [Pyr-H] ¯ Deprotonated host
1 : 5 : 5 1.2 ± 0.3 405 [Pyr-H] ¯ Deprotonated host
1 : 10 : 10 0.4 ± 0.1 405 [Pyr-H]¯ Deprotonated host
aStock [Host]=0.5 mM in 10%DMSO/MeOH; Final [Host]=4.5 µM in
0.5%DMSO/MeOH. bStock [TBAX]=1 mM in MeOH

91
The data in Table 5.5 show that at high anion molar ratios (10:1, 5:1 and 3:1) the
base peak was the deprotonated host. At a molar ratio of Pyr : Cl¯: F¯ = 1 : 1 : 1 the base
peak was an anion adduct indicating that the majority of the host is involved in
complexation reactions. In this set of experimental conditions the complexation
preference of Pyr is indeed Cl¯ > F¯ > Br¯, similar to the one for Iso.
Having established the apparent halide ion selectivities of Pyr and Iso, it was of
obvious interest to more closely examine the two competing processes: binding and
deprotonation. Closer examination of ES-MS spectra with the goal of quantifying both
deprotonation (represented by how much deprotonated host is present) and binding
(represented by how much of the anion adducts are present) yielded the ratios presented
in Table 5.6 (one host in the presence of one anion) and Table 5.7 (one host with two
competing anions).
Table 5. 6. Binding / deprotonation ratio for Pyr and Iso in the presence of one anion.
Hosta Anionb Molar ratio
Host : A¯ Base peak M/z Major process
Binding/
Deprotonation
Pyr F¯ 1:10 405[Pyr-H]¯ Deprotonation 0.42:1
Iso F¯ 1:10 404[Iso-H]¯ Deprotonation 0.2:1
Pyr Cl¯ 1:10 441[Pyr +Cl¯] Binding 5.5:1
Iso Cl 1:10 440[Iso + Cl¯] Binding 15.6:1
Pyr Br¯ 1:10 485[Iso + Br¯] Binding 5.8:1
Iso Br¯ 1:10 484[Iso + Br¯] Binding 9.0:1
aStock [Host]=0.5 mM in 10%DMSO/MeOH; Final [Host]=4.5 µM in
0.5%DMSO/MeOH. bStock [TBAX]=1 mM in MeOH

92
To determine the binding/deprotonation ratios the peak intensities of the anion
adducts (monomers and dimers) were summed and divided by the sum of the peak
intensities corresponding to the deprotonated host (monomers and dimers).
Table 5. 7. Binding/deprotonation ratio for Pyr and Iso in the presence of two competing
anions.
To determine the overall binding/deprotonation ratios the peak intensities of the
anion adducts (monomers and dimers) corresponding to both anions were summed and
divided by the sum of the peak intensities corresponding to the deprotonated host
(monomers and dimers). The selectivity between anions (A1/A2 in table 5.7) was
Hosta Anion
1(A1)b
Anion
2 (A2)b
Molar ratio
Host:A1:A2
Overall
Binding/
Deprotonation
Major process Selectivity
A1/A2
Pyr F¯ Cl¯ 1:10:10 0.17 Deprotonation 2.8
Pyr F¯ Cl¯ 1:5:5 1.38 Binding 0.83
Pyr F¯ Cl¯ 1.3:3 1.51 Binding 0.55
Pyr F¯ Cl¯ 1:1:1 3.49 Binding 0.23
Pyr Cl¯ Br¯ 1:10:10 1.51 Binding 6.7
Pyr F¯ Br¯ 1:10:10 0.2 Deprotonation 11.5
Iso F¯ Cl¯ 1:10:10 2.56 Binding 0.28
Iso Cl¯ Br¯ 1:10:10 1.51 Binding 6.9
Iso F¯ Br¯ 1:10:10 0.92 Deprotonation 1.1
aStock [Host]=0.5 mM in 10% DMSO/MeOH; Final [Host]=4.5 µM in 0.5%
DMSO/MeOH. bStock [TBAX]=1 mM in MeOH

93
determined by dividing the sum of the peak intensities corresponding to A1 by the sum of
the peak intensities corresponding to A2.
For both hosts, anion binding is favored for Cl¯ and Br¯, whereas F¯ acts
primarily as a base in these control experiments. The binding/deprotonation ratio is
higher for Iso than for Pyr when comparing experiments with the same anions,
presumably due to the higher acidity of Pyr’s amidic protons.
Molar ratios of host : F¯ = 1:10 result in an overall net preference for
deprotonation. Lowering the host:F¯ molar ratios to 1:5, 1:3 and 1:1 promotes
complexation. Deprotonation events are inimical to complexation studies as they result in
a skewed selectivity ratio.
The ratio in which these two competing processes (binding and deprotonation)
interact and what is their dynamic for various anions merited further exploration. This
was done in a series of experiments described below.
NMR titration experiments The first experiment was an 1H-NMR titration in DMSO-d6 in which one
equivalent of Pyr was titrated with increasing quantities of tetrabutylammonium fluoride
(TBAF). Solutions of the receptor molecule in DMSO-d6 were prepared at a
concentration of 1 mM. A 1 mL solution thus prepared was transferred to a glass NMR
tube and titrated with aliquots from a 1 mM solution containing the titrant anion as the
tetrabuthylammonium salt in DMSO-d6. The chemical shifts of the NH and aromatic
protons were monitored as a function of the number of equivalents of anions added. The
1H-NMR spectrum of Pyr is shown in Figure 5.11.

94
An expanded image of the aromatic peaks present in the spectrum and the detailed
assignment of aromatic peaks are shown in Figure 5.12.
PPM 11.5 10.5 9.5 8.5 7.5 6.5 5.5 4.5 3.5 2.5 1.5
DMSO
Aromatic protonsN-H
protons
NO
HN
O
NH
NO2O2N
Pyr in DMSO-D6
PPM 11.5 10.5 9.5 8.5 7.5 6.5 5.5 4.5 3.5 2.5 1.5
DMSO
Aromatic protonsN-H
protons
NO
HN
O
NH
NO2O2N
Pyr in DMSO-D6
Figure 5. 11. 1HNMR spectrum of Pyr.
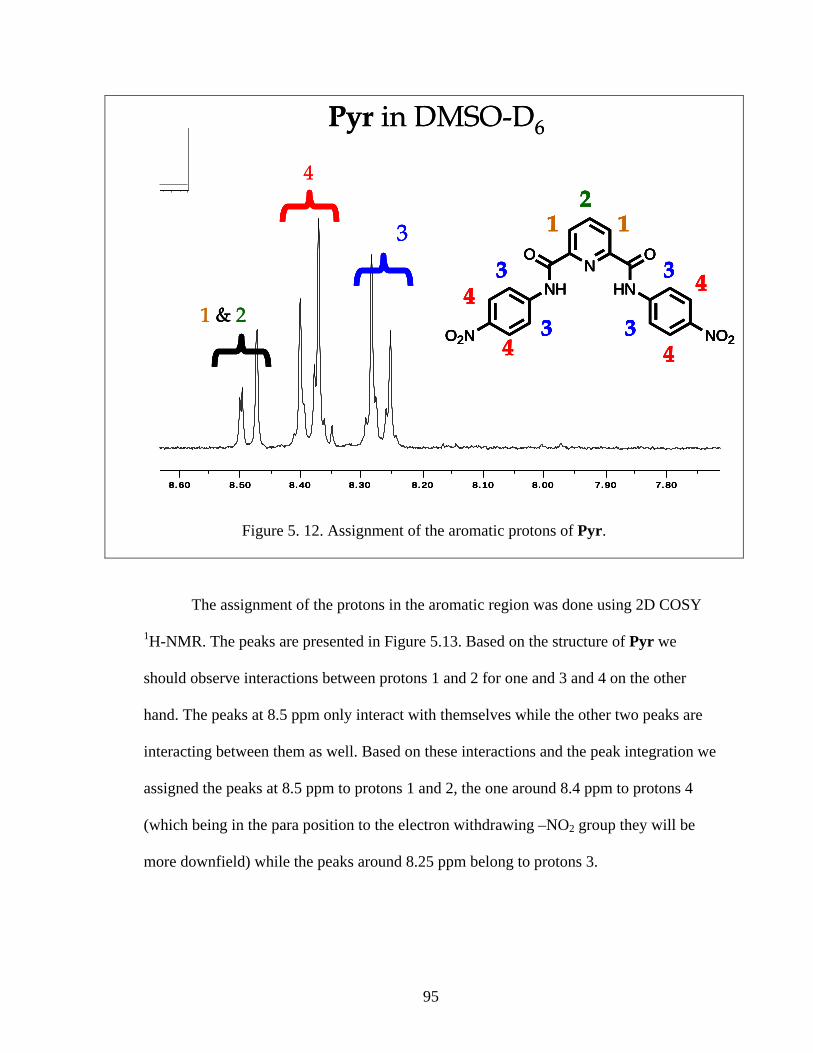
95
8.60 8.50 8.40 8.30 8.20 8.10 8.00 7.90 7.80
NO
HN
O
NH
NO2O2N
1 12
3
3
4
4
3
3
4
4
3
1 & 2
4
Pyr in DMSO-D6
8.60 8.50 8.40 8.30 8.20 8.10 8.00 7.90 7.80
NO
HN
O
NH
NO2O2N
1 12
3
3
4
4
3
3
4
4
3
1 & 2
8.60 8.50 8.40 8.30 8.20 8.10 8.00 7.90 7.80
NO
HN
O
NH
NO2O2N
1 12
3
3
4
4
3
3
4
4
3
8.60 8.50 8.40 8.30 8.20 8.10 8.00 7.90 7.80
NO
HN
O
NH
NO2O2N
1 12
3
3
4
4
3
3
4
4
8.60 8.50 8.40 8.30 8.20 8.10 8.00 7.90 7.80
NO
HN
O
NH
NO2O2N
1 12
3
3
4
4
3
3
4
4N
O
HN
O
NH
NO2O2N
1 12
3
3
4
4
3
3
4
4
3
1 & 2
4
Pyr in DMSO-D6
Figure 5. 12. Assignment of the aromatic protons of Pyr.
The assignment of the protons in the aromatic region was done using 2D COSY
1H-NMR. The peaks are presented in Figure 5.13. Based on the structure of Pyr we
should observe interactions between protons 1 and 2 for one and 3 and 4 on the other
hand. The peaks at 8.5 ppm only interact with themselves while the other two peaks are
interacting between them as well. Based on these interactions and the peak integration we
assigned the peaks at 8.5 ppm to protons 1 and 2, the one around 8.4 ppm to protons 4
(which being in the para position to the electron withdrawing –NO2 group they will be
more downfield) while the peaks around 8.25 ppm belong to protons 3.
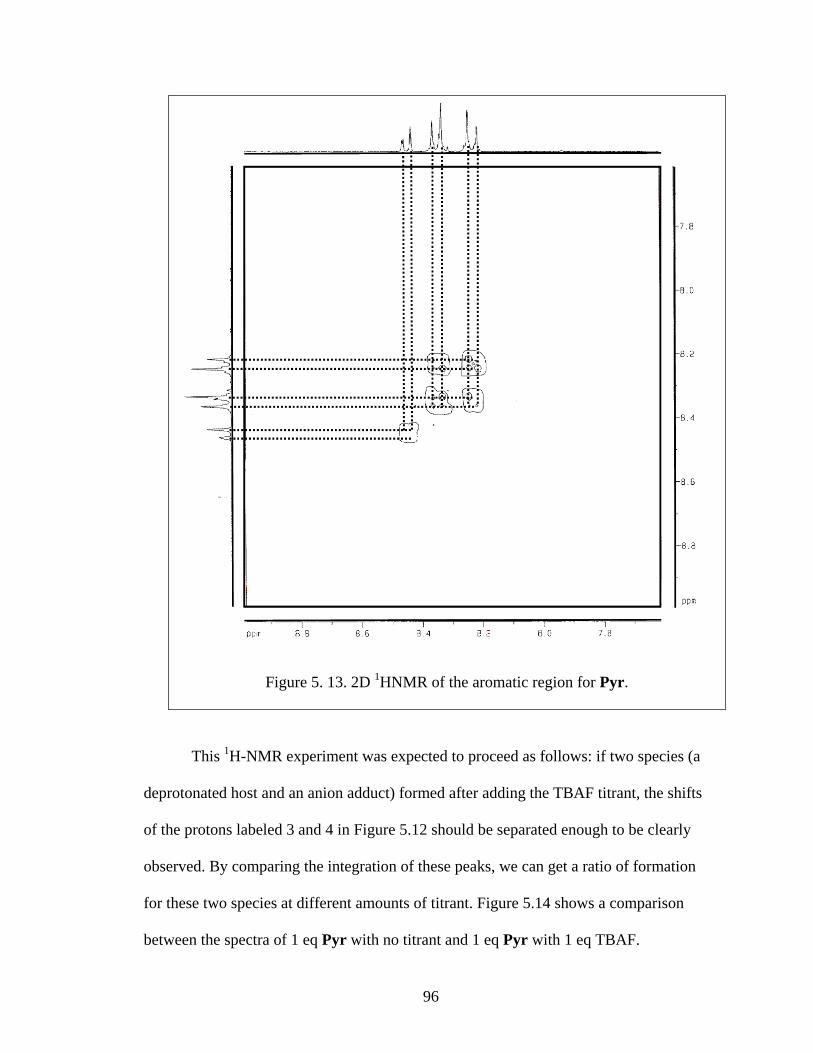
96
Figure 5. 13. 2D 1HNMR of the aromatic region for Pyr.
This 1H-NMR experiment was expected to proceed as follows: if two species (a
deprotonated host and an anion adduct) formed after adding the TBAF titrant, the shifts
of the protons labeled 3 and 4 in Figure 5.12 should be separated enough to be clearly
observed. By comparing the integration of these peaks, we can get a ratio of formation
for these two species at different amounts of titrant. Figure 5.14 shows a comparison
between the spectra of 1 eq Pyr with no titrant and 1 eq Pyr with 1 eq TBAF.
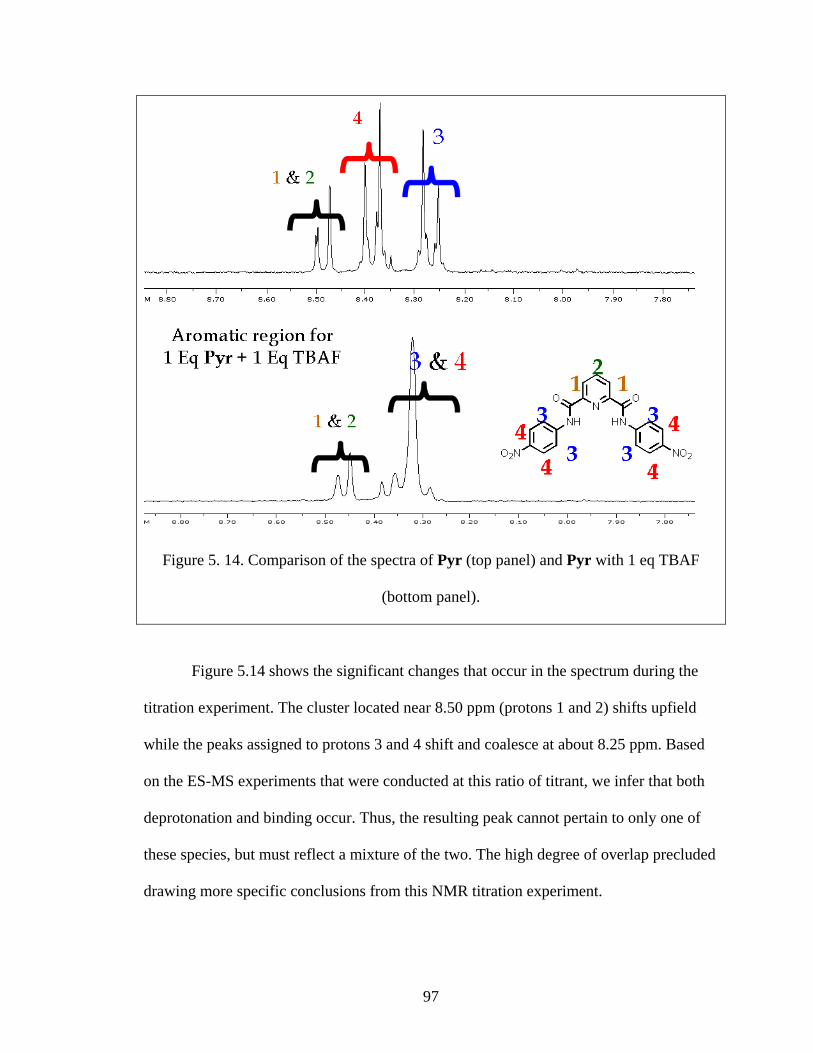
97
Figure 5. 14. Comparison of the spectra of Pyr (top panel) and Pyr with 1 eq TBAF
(bottom panel).
Figure 5.14 shows the significant changes that occur in the spectrum during the
titration experiment. The cluster located near 8.50 ppm (protons 1 and 2) shifts upfield
while the peaks assigned to protons 3 and 4 shift and coalesce at about 8.25 ppm. Based
on the ES-MS experiments that were conducted at this ratio of titrant, we infer that both
deprotonation and binding occur. Thus, the resulting peak cannot pertain to only one of
these species, but must reflect a mixture of the two. The high degree of overlap precluded
drawing more specific conclusions from this NMR titration experiment.
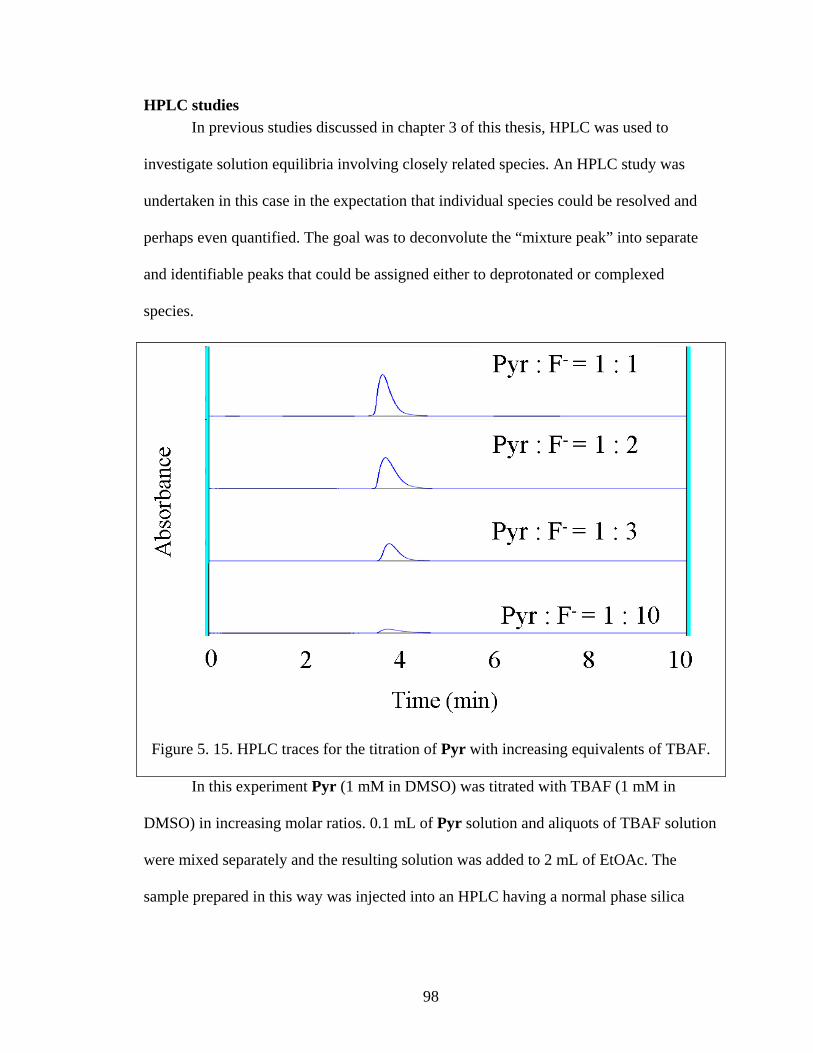
98
HPLC studies In previous studies discussed in chapter 3 of this thesis, HPLC was used to
investigate solution equilibria involving closely related species. An HPLC study was
undertaken in this case in the expectation that individual species could be resolved and
perhaps even quantified. The goal was to deconvolute the “mixture peak” into separate
and identifiable peaks that could be assigned either to deprotonated or complexed
species.
In this experiment Pyr (1 mM in DMSO) was titrated with TBAF (1 mM in
DMSO) in increasing molar ratios. 0.1 mL of Pyr solution and aliquots of TBAF solution
were mixed separately and the resulting solution was added to 2 mL of EtOAc. The
sample prepared in this way was injected into an HPLC having a normal phase silica
Figure 5. 15. HPLC traces for the titration of Pyr with increasing equivalents of TBAF.
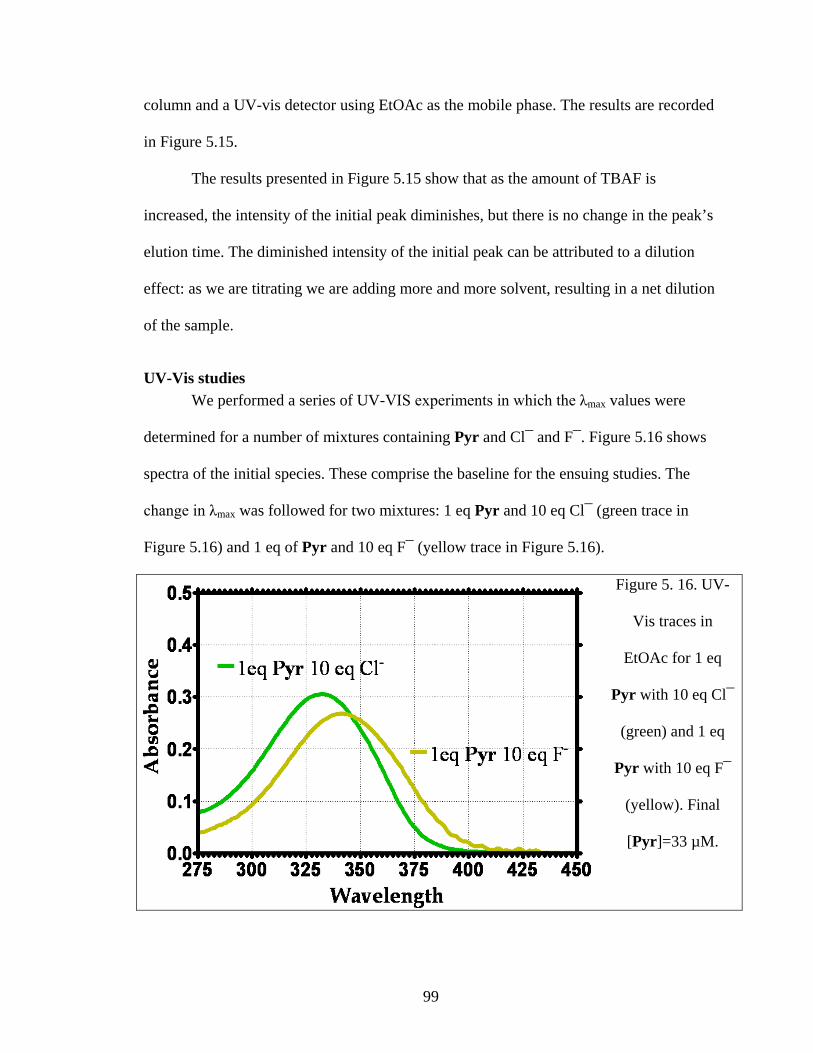
99
column and a UV-vis detector using EtOAc as the mobile phase. The results are recorded
in Figure 5.15.
The results presented in Figure 5.15 show that as the amount of TBAF is
increased, the intensity of the initial peak diminishes, but there is no change in the peak’s
elution time. The diminished intensity of the initial peak can be attributed to a dilution
effect: as we are titrating we are adding more and more solvent, resulting in a net dilution
of the sample.
UV-Vis studies We performed a series of UV-VIS experiments in which the λmax values were
determined for a number of mixtures containing Pyr and Cl¯ and F¯. Figure 5.16 shows
spectra of the initial species. These comprise the baseline for the ensuing studies. The
change in λmax was followed for two mixtures: 1 eq Pyr and 10 eq Cl¯ (green trace in
Figure 5.16) and 1 eq of Pyr and 10 eq F¯ (yellow trace in Figure 5.16).
Figure 5. 16. UV-
Vis traces in
EtOAc for 1 eq
Pyr with 10 eq Cl¯
(green) and 1 eq
Pyr with 10 eq F¯
(yellow). Final
[Pyr]=33 µM.

100
1 mM DMSO solutions of Pyr and tetrabutylammonium salts of F¯ and Cl¯ were
prepared. 0.1 mL of Pyr stock solution was added to 2 mL of EtOAc and the resulting
mixture was titrated with aliquots of the stock anion solution, added in the necessary
amount to yield the desired molar ratios.
We know from our ES-MS experiments that the “green line” mixture reflects
mostly binding and the “yellow line” mixture reflects mostly deprotonation. It is apparent
in Figure 5.16 that there is an 11 nm difference in between the maxima of the two traces,
reflecting the difference in composition between the two mixtures.
An experiment where 1 eq of Pyr was titrated with increasing amounts of TBAF
yielded the curves shown in Figure 5.17. 1 mM DMSO solutions of Pyr and
tetrabutylammonium fluoride were prepared. 0.1 mL of Pyr stock solution was added to
2 mL of EtOAc and the resulting mixture was titrated with aliquots of the stock anion
solution, added to yield the desired molar ratios.
Comparing the maxima for 1 eq of Pyr and 0 eq TBAF (yellow trace) to 1 eq Pyr
and 10 eq TBAF (blue trace) there is a 21 nm shift (343-322 nm) in the λmax.

101
Figure 5. 17 Titration of Pyr with TBAF in EtOAc.
A closer look at the graph reveals the presence of an isosbestic point at 331 nm
(Figure 5.18). The last curve that intersects the isosbestic point is the curve corresponding
to a 1:2 ratio of Pyr : TBAF. An isosbestic point for a reaction mixture is observed when
the stoichiometry of the reaction doesn’t change.23 In other words, up until that point
there was a constant ratio between binding and deprotonation and for all the mixtures
whose curves do not intersect the isosbestic point this ratio changes, most likely favoring
deprotonation.

102
Figure 5. 18. Isosbestic point observed in the titration of Pyr with TBAF.
Plotting the changes in λmax as a function of the number of equivalents of F¯
added gives the graph shown in Figure 5.19.
Figure 5. 19 Changes in λmax when titrating Pyr with F¯
315 325 335 345 3550.95
1.00
1.05
1.10
1.15
1.20
1.25
0:10.25:10.5:10.75:11:12:13:15:110:1
Wavelength
Abs
orba
nce
Isosbestic point

103
Fitting the data points to straight lines rather than a curve makes more chemical
sense and it correlates well both with the presence of the isosbestic point and the ES-MS
data. The two lines intersect close to the point corresponding to the Pyr : F¯ = 1 : 2
mixture. This agrees with the inference that up until that point a certain mixture
composition is present but as the F¯concentration increases beyond that point, the
mixture composition changes more dramatically.
The fact that the λmax values for the data points corresponding to mixtures with 0-2
eq F¯ are close to the λmax of the control experiment using 10 eq Cl¯ indicates that
binding predominates in these mixtures. At higher concentrations of F¯ the λmax increases
(in correlation with the control experiment that used 10 eq F¯) pointing to deprotonation
as the predominant process.
Colorimetric behavior of Pyr and Iso in the presence of various anions.
During the course of the experiments described above, it was noted that solutions
of Pyr and Iso changed color when certain anions were added. This color change is
concentration dependent and anion dependent. The color change was assumed at first to
result from the deprotonation event that occurs when F¯ comes into contact with the host.
Subsequently, it was noticed that color changes also occurred when anions such as
H2PO4¯ (DHP) and acetate were present. Figure 5.20 shows example of host solutions
that change color or fail to do so in the presence of anions.

104
Figure 5. 20. Change in color when adding 1 eq of anion to 1 eq of Host
in DMSO. Final [Host]=0.5 mM.
Confirmation of host binding to H2PO4¯ and acetate acid derivatives (di and tri
phenyl acetic acids) was obtained by ES-MS experiments similar to those described in
detail for the halides. A possible binding mode for acetate ion with the Iso host is shown
in Figure 5.21.
Figure 5. 21 Plausible binding state for Iso
with an acetic acid derivative.
O
N
O
N
O2N NO2
H H
OO
R

105
Both Iso and Pyr hosts were titrated separately with DHP (in EtOAc) and the
UV-Vis absorption spectra were recorded. 1 mM DMSO solutions of Pyr and
tetrabutylammonium dihydrogenphosphate were prepared. 0.1 mL of Pyr stock solution
was added to 2 mL of EtOAc and the resulting mixture was titrated with aliquots of the
stock anion solution, added to yield the desired molar ratios. The resulting traces are
presented in Figure 5.22 and 5.23.
Figure 5. 22 Titration of Pyr with 0-10 eq DHP.

106
Figure 5. 23 Titration of Iso with 0-10 eq DHP
When Iso was the host, diminishing intensity for the peak centered at 330nm was
noted along with the development of a second peak in the region 400-500 nm (see Figure
5.24). What is even more interesting is that the intensity of the secondary peak is directly
proportional with the amount of DHP added. In other words, the secondary peak
intensifies as more DHP is added. This behavior, alongside with color change has been
reported previously to occur between anions and various ligands featuring amidic
hydrogens24,25,26,27,28,29,30,31 Several authors report that such interactions can be useful for
the selective detection of various anions in complex mixtures32,33,34,35,36. No effort was
made to develop a colorimetric sensor based on these hosts but their structural simplicity
suggests that they could be economical scaffolds for this application.

107
Conclusions The initial goal of this work was to assess the binding interactions of
dipicolinamides and isophthalamides with various halogen anions. We found that Iso as
well as Pyr successfully bind the three halogenated anions studied: F¯, Cl¯ and Br¯.
Basing our predictions on ionic radii, charge density and the computational studies
performed on these hosts and hosts-anion pairs the complexation order should be F¯ >
Cl¯ > Br¯. Surprisingly though, competitive ES-MS studies show that in both cases the
preferred anion was Cl¯ followed by F¯ and Br¯. While Br¯ was expected to be the least
preferred guest due to its higher ionic radius and lower charge density, F¯ ranked second
mostly because of it’s propensity for deprotonation rather than binding. In our ES-MS
control experiments we observed that F¯ deprotonates the host more than the other anions
(Cl¯ or Br¯). So even if the host anion binding interaction is expected to be stronger for
Figure 5. 24 Blow up of the new absorption peak formed upon titrating 1 eq of Iso
with 0-10 eq DHP

108
F¯ than for Cl¯ or Br¯ which would result in a complexation order of F¯>Cl¯>Br¯ such a
selectivity ranking cannot be realistically obtained within our experimental conditions
due to the competition from the deprotonation process.
The second finding is that anion binding is always accompanied by host
deprotonation and vice versa. While there were previous reports documenting fluoride
anion’s propensity for host deprotonation, we have found proof that deprotonation and
binding are present with all the anions, albeit in various ratios.
What differentiates the three anions is the degree to which these two competing
processes occur: F¯ always favors deprotonation over binding due to its higher basicity
and higher charge density, while adduct formation dominates in the case of Cl¯ and Br¯.
The two hosts show changes in color when various anions are added to their
solutions: F¯, H2PO4¯, or acetate. This change in color can be useful as a detection
method for these anions.

109
Experimental section
All the solvents used were of HPLC grade as purchased from Sigma Aldrich or
Fisher Scientific.
Computational studies
All calculations and visualizations were performed by Dr. Carl Yamnitz using
Spartan ’06 software from Wavefunction Inc at the DFT level.
In every case, the conformer with the lowest calculated final energy was used for
calculation of the complexation energy advantage. This calculation was performed by
adding the calculated energies of the host and guest, then subtracting the calculated
energy of the complex. The complexation energy is listed as a negative value if the
interaction is favorable, the more negative a value the more favorable the interaction.
Competitive chloride binding assayed by electrospray mass spectrometry
The anion tetrabutyl ammonium salts were dissolved in methanol to yield a stock
solution of 1 mM while the hosts were dissolved in a mixture of 10% DMSO/MeOH to
yield a stock solution of 0.5 mM. In a typical experiment 20 μL of host stock solution and
100 μL of stock anion(s) solution were added to 2 mL of MeOH. The resulted solution
was filtered and injected in the ES-MS machine. This protocol ensured that in each
experiment competing anions were present in equimolar concentrations (45 μM) and the
host was kept at sub-stoichiometric concentrations (4.5 µM). The ratios shown were
calculated from the total integration of relevant m/Z peaks for host-A¯ adducts. Errors

110
are the calculated standard deviations of ratios from at least three independent
experiments.
1H-NMR titrations.
1H-NMR titrations were performed on a 300 MHz Bruckner Advance machine.
Solutions of the receptor molecule in DMSO-d6 were prepared at a concentration of 1
mM. A 1 mL solution thus prepared was transferred to a glass NMR tube and titrated
with aliquots from a 1 mM solution containing the titrant anion as the
tetrabuthylammonium salt in DMSO-d6. The chemical shifts of the NH and aromatic
protons were monitored as a function of the number of equivalents of anions added.
HPLC experiments
HPLC experiments were conducted on a Xper-Chrom Model 1400 HPLC
equipped with a UV-vis detector (λ = 275nm) using a Shodex 5SIL 10E normal phase
column. The host and the tetrabutylammonium salts were dissolved in DMSO to yield 1
mM solutions. Aliquots of the host and anion solutions in the desired ratios were mixed
separately and the resulting solution was added to 2 mL of EtOAc and then loaded onto
the HPLC column. The mobile phase was EtOAc. Experiments were performed at least in
triplicate, and traces were recorded using Peak Simple v. 2.08 software.

111
UV-vis experiments
1 mM DMSO solutions of the host and tetrabutylammonium salts of the anions
were prepared. In a typical experiment 0.1 mL of host stock solution was added to 2 mL
of EtOAc and the resulting mixture was titrated with aliquots of the stock anion solution,
added to yield the desired molar ratios. UV-vis experiments were performed on a
Beckman Coulter DU 7400 Spectrophotometer using EtOAc as a solvent. All the traces
reported are averages of at least three trials.
112
References 1 Gokel, G. W.; Murillo, O. Acc. Chem. Res. 1996, 29, 425-432. 2 Fyles, T. M. Curr. Opin. Chem. Biol. 1997, 1, 497-505. 3 Gokel, G. W.; Mukhopadhyay, A. Chem. Soc. Reviews 2001, 30, 274-286. 4 Gokel, G. W.; Schlesinger, P. H.; Djedovic, N. K.; Ferdani, R.; Harder, E. C.; Hu, J.; Leevy, W. M.; Pajewska, J.; Pajewski, R.; Weber, M. E. Bioorg. Med. Chem. 2004, 12, 1291-1304. 5 (a) Sakai, N.; Mareda, J.; Matile, S. Acc. Chem. Res. 2005, 38, 79-87. (b) Sisson, A. L.; Shah, M. R.; Bhosale, S.; Matile, S. Chem. Soc. Rev. 2006, 35, 1269-1286. 6 B. McNally and W. M. Leevy, Supramol. Chem., 2007, 19, 29–37; (b) B. D. Smith, A. P. Davis and D. Shephard, Chem. Soc. Rev., 2007, 36, 348–357. 7 Tabushi, I.; Kuroda, Y.; Yokota, K. Tetrahedron Lett 1982, 4601-4604. 8 Carmichael, V. E.; Dutton, P. J.; Fyles, T. M.; James, T. D.; Swan, J. A.; Zojaji, M. J. Am. Chem. Soc. 1989, 111, 767-769. 9 Kobuke, Y.; Ueda, K.; Sokabe, M. J. Am. Chem. Soc. 1992, 114, 7618-7822. 10 Ghadiri, M. R.; Granja, J. R.; Buehler, L. K. Nature 1994, 369, 301-304. 11 C. H. Park and H. E. Simmons, J. Am. Chem. Soc., 1968, 90, 2431; 12 F. P. Schmidtchen, Angew. Chem., 1977, 89, 751; 13 E. Graf and J.-M. Lehn, J. Am. Chem. Soc., 1975, 97, 5022 14 A. Echavarren, A. Galan, J. De Mendoza, A. Salmeron and J.-M. Lehn, Helv. Chim. Acta, 1988, 71, 685 15 M. Newcomb and M. T. Blanda, Tetrahedron Lett., 1988, 29, 4261 16 J. L. Sessler, P. A. Gale and W.-S. Cho, Anion Receptor Chemistry, Royal Society of Chemistry, Cambridge, 2006 17 Anslyn, E. V.; Dougherty, D., A., Modern Physical Organic Chemistry, Third Edition, University Science, 2005, p24.

113
18 Anslyn, E. V.; Dougherty, D., A., Modern Physical Organic Chemistry, Third Edition, University Science, 2005, p167. 19 Yamnitz, C. R.; Negin, S.; Carasel, I. A.; Winter, R. K.; Gokel, G. W. Chem. Commun. 2010, 46, 2838-2840 20 Silverstein, R. M.; Webster, F. X.; Kiemle, D. J. John Wiley & Sons, Inc, 2005, p 7. 21 Chiu F.C.K., Lo C.M.Y.; J. Am. Soc. Mass Spectrom.; 2000, 1064 22 Camiolo S.; Gale, P., A.; Hursthouse, M., B.; Light, M., E.; Org. Biomol. Chem, 2003, 741 23 http://goldbook.iupac.org/I03310.html 24 Niyaji, H. Sessler, J., L.; Angew. Chem. Int. Ed, 2001, 154 25 Piatek, P.; Jurczak, J. Chem. Commun., 2002, 2450 26 Ali , P.,H. D.; Kruger, P.E.; Gunnlaugsson, T.; New J. Chem., 2008, 1153 27 Kumar, V.; Kaushik, M. P.; Srivastava, A., K.; Pratap, A.; Thiruvenkatam, V.; Guru Row, T., N.; Analytica Chimica Acta, 2010, 77 28 Han, M., S.; Kim, D., H.; Angew. Chem. Int. Ed. 2002, 3809 29 Palacios, M. A.; Nishiyabu, R., Marquez, M.; Anzenbacher Jr, P.; J. Am. Chem. Soc. 2007, 7538 30 Wang, T.; Ma, L.; Yan, X.-P.; Org. Biomol. Chem, 2008, 1751 31 Moon, K.S.; Singh, N.; Lee, G.W.; Jang, D.O, Tetrahedron, 2007, 9106 32 Kumar, V.; Kaushik, M. P.; Srivastava, A., K.; Pratap, A.; Thiruvenkatam, V.; Guru Row, T., N.; Analytica Chimica Acta, 2010, 77 33 Han, M., S.; Kim, D., H.; Angew. Chem. Int. Ed. 2002, 3809 34 Palacios, M. A.; Nishiyabu, R., Marquez, M.; Anzenbacher Jr, P.; J. Am. Cem. Soc. 2007, 7538 35 Wang, T.; Ma, L.; Yan, X.-P.; Org. Biomol. Chem, 2008, 1751 36 Moon, K.S.; Singh, N.; Lee, G.W.; Jang, D.O, Tetrahedron, 2007, 9106

114
Chapter 6 Future studies

115
A number of various experiments and techniques have been presented in this
dissertation, all of them aimed at investigating and understanding how synthetic ion
transporters interact with phospholipid bilayers, bind with and transport ions. While we
attempted to exhaust our research, there may remain other avenues yet to be explored.
These new directions often come from new developments or fruitful discussions with our
peers that refine our thinking about the various projects that we have worked on. Below I
will list a few of the ideas that we have about continuing the work presented so far.
Triacsin C analogs As presented in Chapter 2, Triacsin C is an enzymatic inhibitor that acts on Long
Chain Acyl-CoA synthetases1, preventing them from transforming free fatty acids into
CoA esters.
Starting from the reported structure of Triacsin C2 we designed three new
compounds that could potentially act as inhibitors (see Figure 6.1).
Figure 6. 1 Structure of Triacsin C and analogs.
NOH
NOH
NOH
Deca-2,4-dienal oxime
Nona-2,4-dienal oxime
Tridecanal oxime
NN
NOH
Triacsin C

116
The structure of these three analogs are designed to mimic either the overall
length of the molecule (tridecanal oxime) or the extended unsaturated system present in
the natural product (nona- and deca-2,4,-dienal oximes).
Enzymatic inhibitory studies performed on these analogs showed that while they
are not as active as Triacsin C, the two unsaturated analogs are significantly more potent
than tridecanal oxime.3
With these results in mind, a number of alternative structures that can be
envisioned that can give us insight into the inhibitory activity of these compounds. The
first set of these structures is presented in Figure 6.2.
Figure 6. 2 Variations of the hydrophilic chain.
An obvious starting point for the design of new analogs would be the extension of
the hydrocarbon chain. We know that Triacsin C has an overall length of 15 atoms, so a
structure that will have the same overall length but also possesses a longer system of
conjugated double bonds should have an inhibitory activity closer to Triacsin C than
tridecanal oxime (structure A).
The active site of the LC Acyl-CoA synthetases is highly conserved among the
enzymes in this family.4 One of the particularities of the active site is the presence of the
NOH
NOH
NOH
X
A
B
C

117
“dead end branch”, a hydrophobic pocket where the hydrophobic tail of the fatty acid
rests during esterification (see Figure 6.3).
Figure 6. 3 The active site of the LC Acyl-CoA synthetase from Thermus thermophilus
(image reproduced from Hisanaga et al4)
A structure with branched hydrophilic chain can take advantage of this bifurcation
and anchor itself better in the active site, blocking the access to both the “dead end
branch” and to the central pathway towards the esterification site, thus inhibiting the
enzyme more effectively. Structure B builds on this hypothesis with the presence of two
n-hexyl chains that can rest both in the “dead end branch” and in the center path.
Hydrophobic pockets created inside the enzymes active site are often times
comprised of aromatic residues. Structure C tries to take advantage of this fact, having in
its structure a substituted aromatic ring. Through the substituent we can modulate the

118
electron density of the arene and favor arene-arene interactions with the other aromatic
residues present in the pocket. If the pocket has electron rich aromatic residues then
electron withdrawing substituents (-NO2, -CN) would yield the best results and vice-versa
if the aromatic residues are electron poor then electron donating substituents (-CH3, -
OCH3) would be the better choice. Polysubstitution of the benzene ring is also an option
worth considering.
The second set of structures with potentially interesting properties is presented in
Figure 6.4.
Figure 6. 4 Second set of Triacsin C analogs.
Once the analysis of the hydrocarbon chain analogs has been performed and an
optimal chain length/branching pattern has been established we can move on to examine
the heteroatoms present in the structure. The original structure has a rather unusual
terminal moiety containing three nitrogen atoms and a hydroxyl (=N-N=N-OH). Previous
enzymatic studies showed that analogs present inhibitory activity just with an unsaturated
oxime thus removing two of the nitrogens from the structure.3 This begs the question of
how important is the terminal hydroxyl and if other functional groups can serve the same
purpose. Structures D-G are designed to investigate this. Structure D completely lacks the
RN
SH
RN
NH2
RNH
RO
OH
D
E
F
G

119
hydrogen attached to a sp3 hybridized heteroatom and while likely inactive, can serve as a
useful negative control for future studies. Structures E and F contain different
heteroatoms that have the same external shell electronic configuration (NH2 and SH),
while structure G contains a hydroxyl group contained in a carboxyl moiety.
Pyrogallol[4]arenes solution equilibrium
Chapter 3 investigates the solution equilibrium of pyrogallol[4]arenes, whose
general structure is shown in Figure 6.5.
Figure 6. 5 General structure of a
pyrogallol[4]arene.
These molecules crystallize in two major conformations: bilayer5 and hexameric
capsule.6 Aliquots from ethyl acetate solutions containing equal masses of solid samples
from these two crystalline motifs, when loaded on an HPLC column have similar
profiles. The traces from C10 capsule and C10 bilayer are shown in Figure 6.6.
Based on the similarities that exist between these traces we assumed an
equilibrium state is reached between the capsule and monomer in solution. We tentatively
assigned the peaks based on their elution times to monomer (shortest elution time) dimer
HOOH
OH
OH
OH
OH
OHOH
HO
HO
HO
HOR R
RR

120
and other small oligomers (medium elution time) and capsule and higher oligomers
(longer elution times).
Figure 6. 6 HPLC traces for C10 capsule (top) and C10 bilayer (bottom).
A positive identification of the compounds present in the various peaks could be
done using an LC-MS ensemble. While the peaks are eluting they are injected into an
electrospray machine and identified based on their M/z ratio.
Another control experiment could be the collection of the fractions corresponding
to just one of the peaks (for example, the last one which we believe corresponds to the
capsule and higher oligomers) and reinjecting an aliquot from these fractions onto the
column. If our hypothesis is correct, after a certain time we should see a trace similar to
the ones that we already in hand.
Abs
orba
nce(
*10-3
)
12 0 2 4 6 8 10 Time (min)
Solvent: Ethyl acetate, Silica column, λ=275 nm
Starting with C10Capsule
Starting with C10Bilayer
16
0
16 0
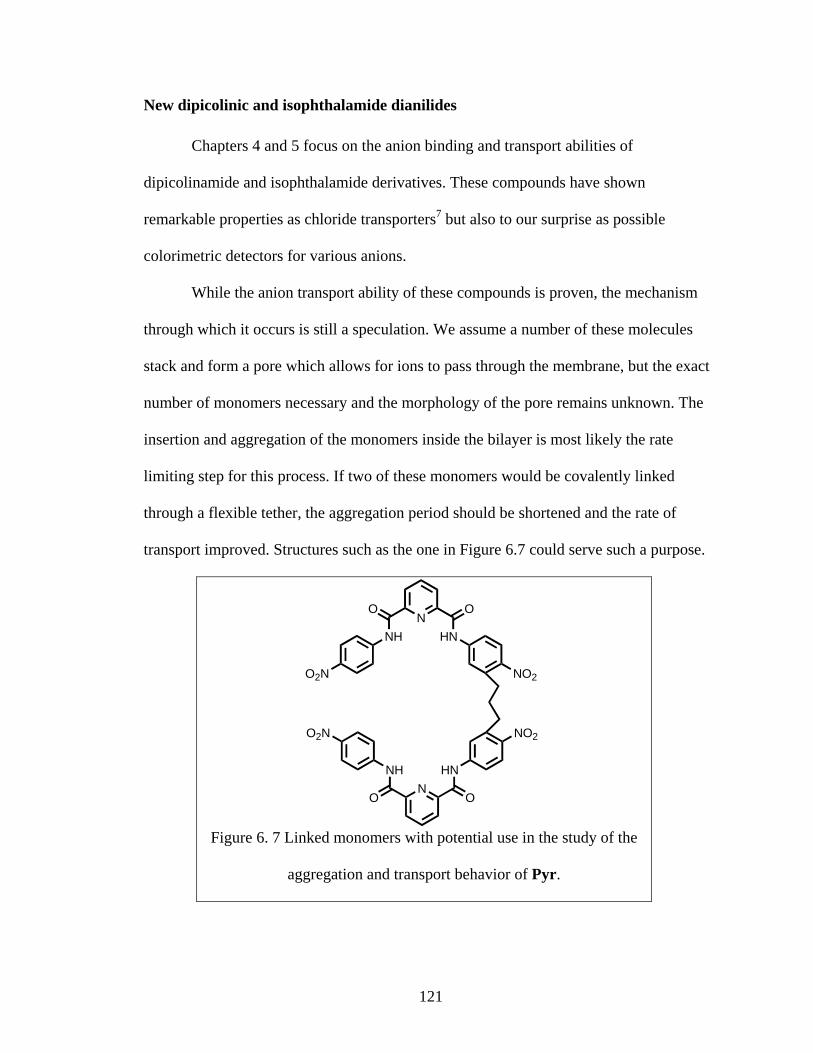
121
New dipicolinic and isophthalamide dianilides
Chapters 4 and 5 focus on the anion binding and transport abilities of
dipicolinamide and isophthalamide derivatives. These compounds have shown
remarkable properties as chloride transporters7 but also to our surprise as possible
colorimetric detectors for various anions.
While the anion transport ability of these compounds is proven, the mechanism
through which it occurs is still a speculation. We assume a number of these molecules
stack and form a pore which allows for ions to pass through the membrane, but the exact
number of monomers necessary and the morphology of the pore remains unknown. The
insertion and aggregation of the monomers inside the bilayer is most likely the rate
limiting step for this process. If two of these monomers would be covalently linked
through a flexible tether, the aggregation period should be shortened and the rate of
transport improved. Structures such as the one in Figure 6.7 could serve such a purpose.
Figure 6. 7 Linked monomers with potential use in the study of the
aggregation and transport behavior of Pyr.
NO
HN
O
NH
NO2O2N
NO
HN
O
NH
NO2O2N
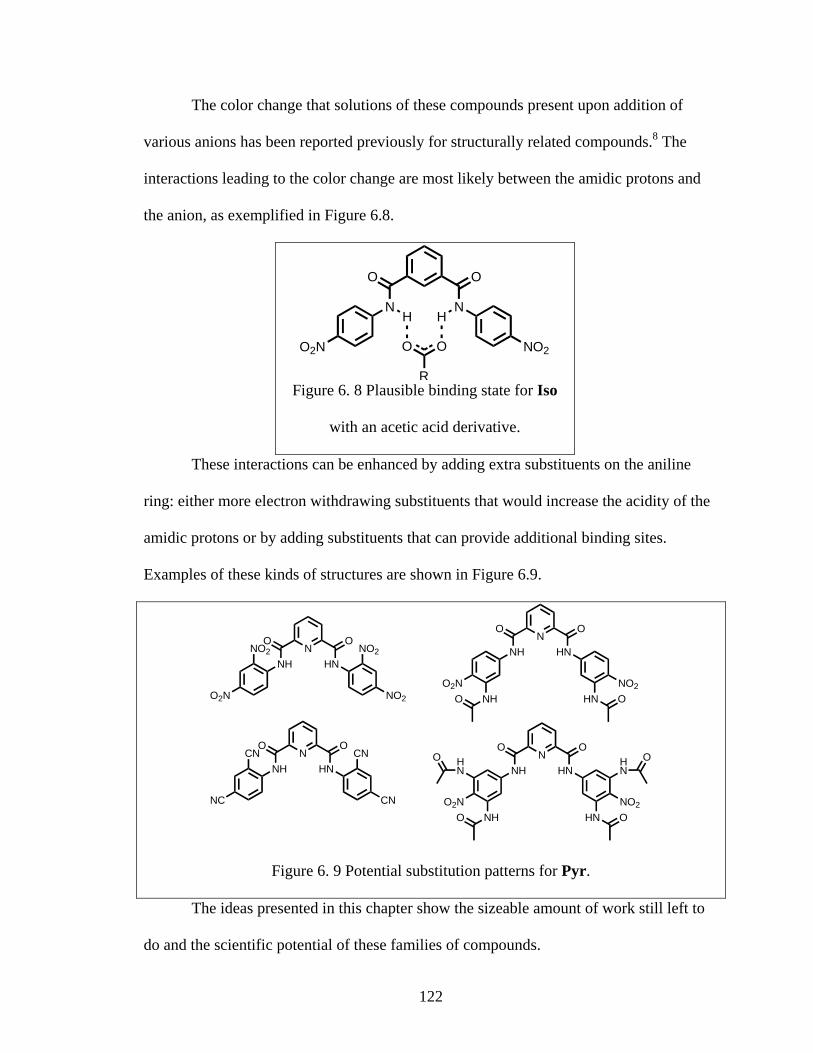
122
The color change that solutions of these compounds present upon addition of
various anions has been reported previously for structurally related compounds.8 The
interactions leading to the color change are most likely between the amidic protons and
the anion, as exemplified in Figure 6.8.
Figure 6. 8 Plausible binding state for Iso
with an acetic acid derivative.
These interactions can be enhanced by adding extra substituents on the aniline
ring: either more electron withdrawing substituents that would increase the acidity of the
amidic protons or by adding substituents that can provide additional binding sites.
Examples of these kinds of structures are shown in Figure 6.9.
NO
HN
O
NH
NO2O2N
NO2NO2
NO
HN
O
NH
CNNC
CNCN
NO
HN
O
NH
NO2O2NNH HNO O
NO
HN
O
NH
NO2O2NNH HNO O
HN
O HN
O
Figure 6. 9 Potential substitution patterns for Pyr.
The ideas presented in this chapter show the sizeable amount of work still left to
do and the scientific potential of these families of compounds.
O
N
O
N
O2N NO2
H H
OO
R
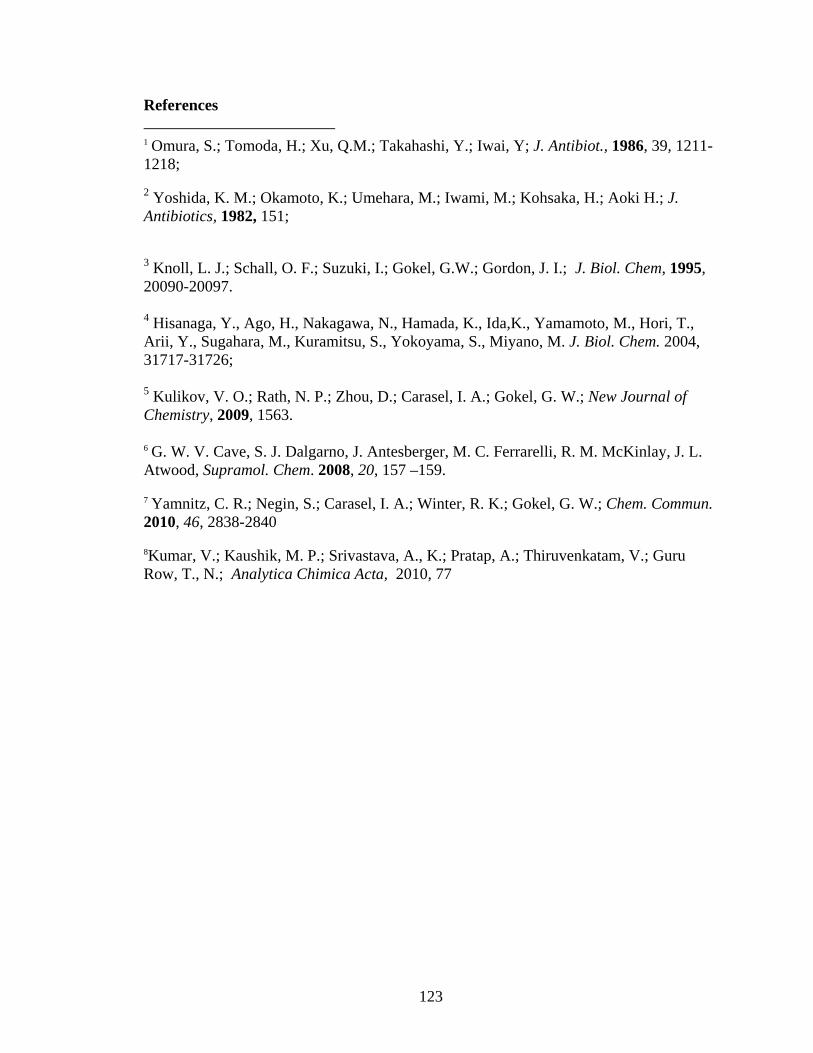
123
References 1 Omura, S.; Tomoda, H.; Xu, Q.M.; Takahashi, Y.; Iwai, Y; J. Antibiot., 1986, 39, 1211-1218; 2 Yoshida, K. M.; Okamoto, K.; Umehara, M.; Iwami, M.; Kohsaka, H.; Aoki H.; J. Antibiotics, 1982, 151; 3 Knoll, L. J.; Schall, O. F.; Suzuki, I.; Gokel, G.W.; Gordon, J. I.; J. Biol. Chem, 1995, 20090-20097. 4 Hisanaga, Y., Ago, H., Nakagawa, N., Hamada, K., Ida,K., Yamamoto, M., Hori, T., Arii, Y., Sugahara, M., Kuramitsu, S., Yokoyama, S., Miyano, M. J. Biol. Chem. 2004, 31717-31726; 5 Kulikov, V. O.; Rath, N. P.; Zhou, D.; Carasel, I. A.; Gokel, G. W.; New Journal of Chemistry, 2009, 1563. 6 G. W. V. Cave, S. J. Dalgarno, J. Antesberger, M. C. Ferrarelli, R. M. McKinlay, J. L. Atwood, Supramol. Chem. 2008, 20, 157 –159. 7 Yamnitz, C. R.; Negin, S.; Carasel, I. A.; Winter, R. K.; Gokel, G. W.; Chem. Commun. 2010, 46, 2838-2840 8Kumar, V.; Kaushik, M. P.; Srivastava, A., K.; Pratap, A.; Thiruvenkatam, V.; Guru Row, T., N.; Analytica Chimica Acta, 2010, 77

124
Ionut Alexandru Carasel
CONTACT INFORMATION Email: [email protected] Address: 825 Leland Avenue Apt 2S
St Louis, MO 63130 Phone: (314) 484-9497
SUMMARY Ph. D. Candidate in Chemistry with five years of scientific research experience in chemical biology working with multiple projects towards the discovery of novel compounds with potential therapeutic applications.
EDUCATION 2010 [Expected] Ph.D. Chemistry, Washington University, St. Louis, MO 2007 A.M. Chemistry, Washington University, St. Louis, MO 2005 B.S. Pharmacy, University of Medicine and Pharmacy, Cluj-Napoca, Romania TECHNIQUES AND INSTRUMENTATION
• MS, ES-MS, competitive MS • Automated peptide synthesis • HPLC • NMR: 1H, 13C, 2D, titrations • Electron microscopy • UV-Vis spectroscopy • FT-IR • Assays of antimicrobial agents • Organic synthesis / purification • Molecular modeling / computation • Fluorescence microscopy • Crystal growth and X-ray structures

125
PROFESSIONAL EXPERIENCE WASHINGTON UNIVERSITY, St. Louis, MO Graduate Research Associate, Chemistry 2006-Present • Used ES-MS extensively to investigate and understand the binding interactions of
synthetic ion transporters with anions and cations. Designed and performed ES-MS competitive experiments using a broad range of compounds and solvent systems. Collaborated closely with MS lab personnel on identifying and solving various experiment and instrument related problems. This work resulted in two publications, one already published (Chem. Commun., 2010-2838) and the second one ready to be submitted.
• Experience with using automated peptide synthesizers and HPLC peptide purification. • Excellent written and oral communication skills resulted from thesis writing,
publication of peer reviewed articles, presenting monthly PowerPoint research progress updates and public speaking events.
• Independently instructed the research activity of three undergraduate interns. • Proficient with using MS Office and Open Office software suites,Adobe, Scifinder,
Chem Draw, Graphpad, Spartan, Mercury, Protein Workshop, Jmol, ImageJ, Spinworks 3 and other instrument specific software.
WASHINGTON UNIVERSITY, St. Louis, MO Graduate Teaching Assistant, Chemistry 2005-Present Supervised laboratories of up to 20 undergraduate chemistry students, conducted help sections covering lecture material with chemistry students, graded lab reports and exams. UNIVERSITY OF MEDICINE AND PHARMACY, Cluj-Napoca, Romania Research Experience for Undergraduates Intern, Chemistry 2001-2005 Designed, synthesized and characterized novel Cu2+ - sulphamide complexes with potential antiviral activity.
PUBLICATIONS AND PRESENTATIONS Carasel I.A., Yamnitz C.R., Gokel G.W., “Isophthalamides and Dipicolinamides – Halogenated anion selectivity” [Manuscript ready to be submitted] Yamnitz C.R., Negin S., Carasel I.A., Winter R.K., Gokel GW. “Dianilides of Dipicolinic Acid Function as Synthetic Chloride Channels.” Chemical Communications 2010, 2838. Yamnitz C.R., Negin S., Carasel I.A., Winter R.K., Gokel G.W. “Synthetic Chloride Channels from Small Molecule Dipicolinic Dianilides.” Abstracts, Inaugural Symposium of the St. Louis Institute for Nanoscience, February 2010.
126
Kulikov O., Rath N.P., Zhou D., Carasel I. A., “Guest molecule entrapment by both capsule and hydrocarbon sidechains in self-assembled pyrogallol[4]arenes” New Journal of Chemistry, 2009, 1563 Gokel G.; Carasel I. A.; “Biologically active, synthetic ion transporters” Chemical Society Reviews, 2007, 378 Daschbach, Megan M.; Elliott, Elizabeth K.; Carasel, Ionut A.; Gokel, George W. “Characterizing the Amphiphilic Behavior of Synthetic Anion Transporters.” Abstracts, 42nd Midwest Regional Meeting of the American Chemical Society, Kansas City, MO, United States, November 7-10, 2007
MEMBERSHIP • The American Chemical Society LANGUAGE FLUENCIES:
• English (advanced) • Spanish (advanced) • Romanian (native)
Professional References George W. Gokel, Ph. D. Distinguished Professor of Science, Associate Director,
Center for Nanoscience, Department of Chemistry and Biochemistry and Department of Biology, University of Missouri, St. Louis, 428 Benton Hall One University Boulevard St. Louis, MO, 63121 USA Phone: (314) 516-5312 Email: [email protected]
Rudolph K Winter, Ph.D Professor of Chemistry, MS Facility supervisor,
Department of Chemistry University of Missouri, St Louis 315j Benton Hall One University Boulevard St. Louis, MO, 63121 USA Phone: (314) 516-5337 Email: [email protected]
Kit Mao, Ph. D. Undergraduate Laboratory Supervisor and Lecturer Department of Chemistry Campus Box 1134
One Brookings Drive

127
Washington University in St. Louis St. Louis, MO 63130, USA Phone: (314) 935-6560 Email: [email protected]