synthetic lipids for drug delivery applications
TRANSCRIPT

Synthetic Lipids for Drug Delivery Applications
by
Michael Weiwei Meanwell
BSc, University of British Columbia, 2014
A Thesis Submitted in Partial Fulfillment
of the Requirements for the Degree of
MASTER OF SCIENCE
in the Department of Chemistry
© Michael Weiwei Meanwell, 2015
University of Victoria
All rights reserved. This thesis may not be reproduced in whole or in part, by
photocopy or other means, without the permission of the author.

ii
Supervisory Committee
Synthetic Lipids for Drug Delivery Applications
by
Michael Weiwei Meanwell
BSc, University of British Columbia, 2014
Supervisory Committee
Dr. Thomas Fyles, Department of Chemistry Supervisor
Dr. Peter Wan, Department of Chemistry Departmental Member

iii
Abstract
Supervisory Committee
Dr. Thomas Fyles, Department of Chemistry Supervisor
Dr. Peter Wan, Department of Chemistry Departmental Member
Solid lipid nanoparticles (SLNPs) and lipid-drug conjugates (LDCs) are
two promising lipid nanoparticle (LNP) based drug delivery systems; this thesis
explores new synthetic lipids that may circumvent the limitations of currently
available components for LNPs with particular focus on the stability of LNP
formulations.
Neutral polyethylene glycol lipids (PEG-lipids) have been designed,
synthesized, and characterized with ESI-MS, for stabilizing SLNPs containing
dsDNA oligomer. 1st and 2nd generation PEG-lipids investigated the effects of
serinol and iminodiacetic acid backbone structures, respectively, and aliphatic
chain sequences within the lipid anchors on the stability of SLNPs. Assays were
developed to analyze LNP stability in both PBS buffer and PBS buffer with 10 %
serum at different incubation temperatures. The results indicate that the
hydrocarbon branching sequence offer additional SLNP stability over straight
chain isomers.
LDC monomers were designed and synthesized to allow for the
formulation of LDC nanocarriers for the thiopurine drugs. These hydrophobic
LDC monomers were made by linking the polar thiopurine drug to a synthetic
lipid. These synthetic lipids investigated branched and straight chain derivatives
– the branched isomers once again demonstrated advantages in the stability of
the LDCs.

iv
Table of Contents
Supervisory Committee …………………………………………………………… ii Abstract …………………………………………………………………………….. iii Table of Contents …………………………………………………………………. iv List of Tables ………………………………………………………………………. v List of Figures ……………………………………………………………………… vii List of Schemes …………………………………………………………………… xi List of Abbreviations ………………………………………………………………. xii List of Compounds ………………………………………………………………… xiv Acknowledgements ……………………………………………………………….. xx Chapter 1: Introduction …………………………………………………………… 1
1.1: Lipid Nanoparticles for Drug Delivery ………………………………... 1 1.2: Solid Lipid Nanoparticles ……………………………………………… 2 1.3: Lipid-Drug Conjugates ………………………………………………… 5 1.4: Lipid Nanoparticle Formation and Characterization ……………….. 7 1.5: Goals of the Thesis …………………………………………………….. 7
Chapter 2: Synthesis of Synthetic Lipids ……………………………………….. 12 2.1: Synthesis of PEG-lipids ………………………………………………. 12 2.2: Synthesis of 1st Generation PEG-Lipids …………………………….. 14 2.3: Synthesis of 2nd Generation PEG-Lipids ……………………………. 25 2.4: Synthesis of LDC Monomers …………………………………………. 32
Chapter 3: Lipid Nanoparticle Formulations and Stability …………………….. 35 3.1: Solid Lipid Nanoparticle Formulations ……………………………….. 35 3.2: Stability Assay for SLNPs …………………………………………….. 41 3.3: Lipid-Drug Conjugate Formulations .………………………………… 48 3.4: Lipid-Drug Conjugate Stability Assay ……………………………….. 49
Chapter 4: Conclusions and Future Work ………………………………………. 55 Bibliography ………………………………………………………………………... 58 Appendix 1: Synthetic Experimental Details …………………………………… 61 Appendix 2: Formulations and Stability Assay Details ……………………….. 77 Appendix 3: 1H-NMR and 13C-NMR for the Synthesized Compounds ………. 86

v
List of Tables
Table 3.1: Physical characterization of formulations done with a DNA loading of
2.9%, a charge ratio of 9, and a composition of 50:10:38.5:1.5 (EPC(14:0):
DSPC: Cholesterol: PEG-lipid) ………………………………………………….. 37
Table 3.2: Physical characterization of formulations done with a DNA loading of
5.1%, a charge ratio of 5, and a composition of 50:10:38.5:1.5 (DOTMA: DSPC:
Cholesterol: PEG-lipid) ……………………………………………………………. 38
Table 3.3: The physical characterizations of formulations using the commercial
lipid mix are shown above. The DNA loading was 5.1% with a corresponding
charge ratio of 5. The composition of the commercial mix was 50: 10: 38: 1.5
(Ionisable lipid: DSPC: Cholesterol: PEG-lipid) where the final 0.5 mol% was a
fluorescent lipid-marker …………………………………………………………… 39
Table 3.4: Physical Characterizations of LDC formulations where the
composition was 90: 5: 5 (LDC Monomer: DMPC: DSPE-PEG). The drug
loading was 15 wt%. ……………………………………………………………… 48
Table A2.1: Concentrations of PEG-lipid solutions and required volumes for
formulations containing 1.5 mol% of different PEG-lipids. The composition for
these SLNPs was 50: 10: 38.5: 1.5 (DOTMA: DSPC: Cholesterol: PEG-lipid) with
a DNA loading of 5.1 wt%. ………………………………………………………. 78
Table A2.2: LDC composition with stock [DSPE-PEG] = 10.0 mg/mL and stock
[DMPC] = 10.0 mg/mL where the composition was 90: 5: 5 (LDC monomer:
DMPC: DSPE-PEG). The drug loading was 15w%. …………………………… 80
Table A2.3: Physical Characterizations of LDC formulations immediately
following dialysis where the composition was 90: 5: 5 (LDC monomer: DMPC:
DSPE-PEG). The drug loading was 15 wt%. ………………………………….. 80
Table A2.4: SLNP storage stability at RT in PBS buffer for formulations
containing 1.5 mol% of different PEG-lipids. The composition for these SLNPs
was 50: 10: 38.5: 1.5 (DOTMA: DSPC: Cholesterol: PEG-lipid) with a DNA
loading of 5.1 wt%. ……………………………………………………………….. 81
Table A2.5: SLNP storage stability at RT in PBS buffer with 10% serum for
formulations containing 1.5 mol% of different PEG-lipids. The composition for
these SLNPs was 50: 10: 38.5: 1.5 (DOTMA: DSPC: Cholesterol: PEG-lipid) with
a DNA loading of 5.1 wt%. ……………………………………………………….. 82
vi
Table A2.6: SLNP stability at 37ᵒC in PBS buffer for formulations containing 1.5
mol% of different PEG-lipids. The composition for these SLNPs was 50: 10: 38.5:
1.5 (DOTMA: DSPC: Cholesterol: PEG-lipid) with a DNA loading of 5.1 wt%. 82
Table A2.7: SLNP stability at 37ᵒC in PBS buffer with 10% serum for
formulations containing 1.5 mol% of different PEG-lipids. The composition for
these SLNPs was 50: 10: 38.5: 1.5 (DOTMA: DSPC: Cholesterol: PEG-lipid) with
a DNA loading of 5.1 wt%. ……………………………………………………….. 82
Table A2.8: LDC storage stability at 4 ᵒC in PBS buffer where the composition
was 90: 5: 5 (LDC monomer: DMPC: DSPE-PEG). The drug loading was 15
wt%. ………………………………………………………………………………… 83
Table A2.9: LDC storage stability at 4 ᵒC in PBS buffer with 10% serum where
the composition was 90: 5: 5 (LDC monomer: DMPC: DSPE-PEG). The drug
loading was 15 wt%. ……………………………………………………………… 83
Table A2.10: LDC storage stability at RT in PBS buffer where the composition
was 90: 5: 5 (LDC monomer: DMPC: DSPE-PEG). The drug loading was 15
wt%. ………………………………………………………………………………… 83
Table A2.11: LDC storage stability at RT in PBS buffer with 10% serum where
the composition was 90: 5: 5 (LDC monomer: DMPC: DSPE-PEG). The drug
loading was 15 wt%. ……………………………………………………………… 84
Table A2.12: LDC storage stability at 37 ᵒC in PBS buffer where the composition
was 90: 5: 5 (LDC monomer: DMPC: DSPE-PEG). The drug loading was 15
wt% .………………………………………………………………………………… 84
Table A2.13: LDC storage stability at 37 ᵒC in PBS buffer with 10% serum where
the composition was 90: 5: 5 (LDC monomer: DMPC: DSPE-PEG). The drug
loading was 15 wt% ………………………………………………………………. 84

vii
List of Figures
Figure 1.1: Examples of the four lipid components of solid lipid nanoparticles. 3
Figure 1.2: Thiopurine drugs 6-thioguanine and 6-mercaptopurine ………….. 6
Figure 1.3: First generation novel PEG-Lipids where the number of repeating
ethyleneoxy monomers, n, is approximately 45. The C16 isomers are drawn to
illustrate different branching sequences …………………………………………. 9
Figure 1.4: Second generation PEG-lipids where the number of repeating
ethyleneoxy monomers is approximately 45. ……………………………………. 10
Figure 1.5: Structures of the LDCs for 6-mercaptopurine and 6-thioguanine .. 11
Figure 2.1: 1H-NMR (CDCl3, 300 MHz) of 2-6b. The protons on the serinol
backbone are in an AA’BB’XY2 spin system. ……………………………………. 15
Figure 2.2: Mass spectrum generated from ESI-MS of the starting material NHS-
PEG. The sample was treated with 0.1% TFA and 0.1% NaCl. This compound
shows the 3Na, 2Na+K, 2Na, Na+K, and 2K ion series where 74 of the 87 ion
clusters are accounted for. ………………………………………………………… 17
Figure 2.3: The intensities of a given n were summed and plotted versus n for
the NHS-PEG. The plot was then fitted to a Gaussian. ………………………… 18
Figure 2.4: The integration of the ethylene protons in the1H NMR (300 MHz) of
NHS-PEG, in CDCl3, was significantly different than the expected values. ….. 19
Figure 2.5: 1H-NMR (CDCl3, 300 MHz) of PEG-G1-C14. The downfield shift of HX
from 3.28 ppm to 4.41 ppm was indicative of amide formation. ……………….. 20
Figure 2.6: Mass spectrum generated from ESI-MS of PEG-G1-C14. Sample
was treated with 0.1% TFA and 0.1% NaCl. The compound shows 3Na, 2Na+H,
2Na, and Na+H ion series where 78 of the 85 ion clusters are assigned. ……. 21
Figure 2.7: Mass spectrum generated from ESI-MS of PEG-G1-C16. Sample
was treated with 0.1% TFA and 0.1% NaCl. The compound shows 3Na, 2Na,
and Na+H ion series where 60 of the 67 ion clusters are assigned. …………. 22
Figure 2.8: Mass spectrum generated from ESI-MS of PEG-G1-dC16. Sample
was treated with 0.1% TFA and 0.1% NaCl. The compound shows 3Na, 2Na,
and Na+H ion series where 56 of the 60 ion clusters are assigned. ………….. 22

x
Figure 2.9: Mass spectrum generated from ESI-MS of PEG-G1-C18. Sample
was treated with 0.1% TFA and 0.1% NaCl. The compound shows 3Na, 2Na+H,
2Na, and Na+H ion series where 79 of the 87 ion clusters are assigned. ……. 23
Figure 2.10: 1H-NMR (CDCl3, 300 MHz of 2-9b. ………………………………… 26
Figure 2.11: Mass spectrum generated from ESI-MS of PEG-G2-C14. Sample
was treated with 0.1% TFA and 0.1% NaCl. The compound shows 4Na, 3Na,
2Na+H, and 2Na ion series where 64 of the 71 ion clusters are assigned. ….. 30
Figure 2.12: Mass spectrum generated from ESI-MS of PEG-G2-C16. Sample
was treated with 0.1% TFA and 0.1% NaCl. The compound shows 4Na, 3Na,
and 2Na+H ion series where 48 of the 56 ion clusters are assigned. ………… 30
Figure 2.13: Mass spectrum generated from ESI-MS OF PEG-G2-dC16. Sample
was treated with 0.1% TFA and 0.1% NaCl. The compound shows 3Na+H, 4Na,
2Na+H, 3Na, and Na+H ion series where 83 of the 92 ion clusters are
assigned….…………………………………………………………………………… 31
Figure 2.14: Mass spectrum generated from ESI-MS of PEG-G2-C18. Sample
was treated with 0.1% TFA and 0.1% NaCl. The compound shows 4Na, 3Na,
2Na+H, and 2Na ion series where 73 of the 83 ion clusters ware assigned. … 31
Figure 3.1: A single strand of the dsDNA used as the nucleic acid load in
formulations ...................................................................................................... 36
Figure 3.2: EPC (14:0) (Compound 3-1) ………………………………………… 36
Figure 3.3: DOTMA (Compound 1-1) ……………………………………………. 37
Figure 3.4: DSPE-PEG2000 (Compound 1-4) …………………………………. 38
Figure 3.5: DSG-PEG2000 (Compound 3-2) ……………………………………. 38
Figure 3.6: DLin-KC2-DMA (Compound 3-3) …………………………………… 39
Figure 3.7: DMG-PEG (Compound 3-4) …………………………………………. 39
Figure 3.8: Cryo-TEM image of PEG-G1-C16 sample showing particles with a
generally spherical morphology. …………………………………………………. 40
Figure 3.9: Cryo-TEM image of PEG-G1-C16 sample ………………………… 41

x
Figure 3.10: SLNP stability at 4ᵒC in PBS buffer for 44 days for formulations
containing 1.5 mol% of different PEG-lipids. The composition for these SLNPs
was 50:10: 38.5: 1.5 (DOTMA: DSPC: Cholesterol: PEG-lipid) with a DNA
loading of 5.1 wt%. …………………………………………………………………. 43
Figure 3.11: SLNP particles incubated at RT in PBS buffer for 7 days for
formulations containing 1.5 mol% of different PEG-lipids. The composition for
these SLNPs was 50: 10: 38.5: 1.5 (DOTMA: DSPC: Cholesterol: PEG-lipid) with
a DNA loading of 5.1 wt%. ………………………………………………………… 44
Figure 3.12: SLNPs incubated at RT in PBS buffer and 10% serum for 7 days for
formulations containing 1.5 mol% of different PEG-lipids. The composition for
these SLNPs was 50: 10: 38.5: 1.5 (DOTMA: DSPC: Cholesterol: PEG-lipid) with
a DNA loading of 5.1 wt%. …………………………………………………………. 45
Figure 3.13: SLNPs incubated at 37ᵒC in PBS for 5 days for formulations
containing 1.5 mol% of different PEG-lipids. The composition for these SLNPs
was 50: 10: 38.5: 1.5 (DOTMA: DSPC: Cholesterol: PEG-lipid) with a DNA
loading of 5.1 wt%. …………………………………………………………………. 46
Figure 3.14: SLNPs incubated at 37ᵒC in PBS buffer and 10% serum for 5 days
for formulations containing 1.5 mol% of different PEG-lipids. The composition for
these SLNPs was 50: 10: 38.5: 1.5 (DOTMA: DSPC: Cholesterol: PEG-lipid) with
a DNA loading of 5.1 wt%. ………………………………………………………… 46
Figure 3.15: SLNPs incubated at 37ᵒC in PBS buffer for 7 days for formulations
containing 1.5 mol% of different PEG-lipids. The composition for these SLNPs
was 50: 10: 38.5: 1.5 (Ionisable lipid: DSPC: Cholesterol: PEG-lipid) with a DNA
loading of 5.1 wt%. …………………………………………………………………. 47
Figure 3.16: LDCs incubated at 4ᵒC in PBS for 60 days formulations where the
composition was 90: 5: 5 (LDC monomer: DMPC: DSPE-PEG). The drug
loading was 15 wt%. ……………………………………………………………….. 50
Figure 3.17: LDCs incubated at 4ᵒC in PBS and 10% serum for 30 days where
the composition was 90: 5: 5 (LDC monomer: DMPC: DSPE-PEG). The drug
loading was 15 wt%. ……………………………………………………………….. 50
Figure 3.18: LDCs incubated at RT in PBS for 60 days where the composition
was 90: 5: 5 (LDC monomer: DMPC: DSPE-PEG). The drug loading was 15
wt%. ………………………………………………………………………………….. 51

x
Figure 3.19: LDCs incubated at RT in PBS and 10% serum for 60 days where
the composition was 90: 5: 5 (LDC monomer: DMPC: DSPE-PEG). The drug
loading was 15 wt%. ……………………………………………………………….. 52
Figure 3.20: LDC incubated at 37ᵒC in PBS for 3 days where the composition
was 90: 5: 5 (LDC monomer: DMPC: DSPE-PEG). The drug loading was 15
wt%. …………………………………………………………………………………… 53
Figure 3.21: LDC incubated at 37ᵒC in PBS and 10% serum for 3 days where
the composition was 90: 5: 5 (LDC monomer: DMPC: DSPE-PEG). The drug
loading was 15 wt%. …………………………………………………………………. 53
xi
List of Schemes
Scheme 2.1.1: Synthesis outline of 1st generation PEG-Lipids ……………….. 12
Scheme 2.1.2: Synthesis outline of 2nd generation PEG-Lipids ……………… 13
Scheme 2.2.1: Synthesis of the 1st generation PEG-lipids. Synthetic details in
Appendix 1, NMR in Appendix 3. …………………………………………………. 14
Scheme 2.3.1: Synthesis of the 2nd generation PEG-lipids. Synthetic details in
Appendix 1, NMR in Appendix 3. …………………………………………………. 25
Scheme 2.3.2: Amide coupling of boc-N-glycine with 2-9(a-d)………………… 27
Scheme 2.3.3: Formation of the 2nd generation PEG-lipids …………………… 29
Scheme 2.4.1: Synthesis of LDCs for 6-thioguanine and 6-mercaptopurine.
Synthetic details in Appendix 1, NMR in Appendix 3. …………………………… 33
Scheme 2.4.2: Asymmetric disulfide formation of thiopurine drug with 11-
mercaptoundecanioc acid …………………………………………………………. 33
Scheme 2.4.3: Amide coupling of synthetic lipid to 2-14(a-b) …………………. 34
Scheme A1.1: Outline of the synthesis for the 1st generation lipids anchor …. 61
Scheme A1.2: Outline of the synthesis for the 2nd generation lipid anchors … 65
Scheme A1.3: Amide formation between PEG-NHS and the free primary amine
on the synthetic lipids ……………………………………………………………… 69

xii
List of Abbreviations
DCM: dichloromethane
DDQ: 2, 3 - dichloro-5,6-dicyano-1,4-benzoquinone
DIPEA: N, N - diisopropyl ethylamine
DMF: N, N - dimethylforamide
DMG-PEG: 1, 2 - dimyristoyl-sn-glycerol, methoxypolyethylene glycol
DMPC: 1, 2 - dimyristoyl-sn-glycero-3-phosphocholine
DMSO: dimethyl sulfoxide
DOTMA: 1, 2 - di-O-octadecenyl-3-trimethylammonium propane
dsDNA: double stranded deoxyribonucleic acid
DSG-PEG: 1, 2 - distearoyl-sn-glycerol, methoxypolyethylene glycol
DSPC: 1, 2 - distearoyl-sn-glycero-3-phosphocholine
DSPE-PEG: 1, 2 - distearoyl –sn- glycerol-3-phosphoethanolamine polyethylene
glycol
EPC (14:0): 1,2 – dimyristoyl-sn-glycero-3-ethylphosphocholine
ESI-MS: electrospray ionisation mass spectrometry
EtOAc: ethyl acetate
Equiv.: equivalents
HBTU: N, N, N’, N’- Tetramethyl-O-(1H-benzotriazol-1-yl) uronium
hexafluorophosphate
HOBt: hydroxybenzotriazole
MeOH: methanol
NHS: N- hydroxysuccinimide
1H-NMR: proton nuclear magnetic resonance
13C-NMR: carbon-13 magnetic resonance
PEG: polyethylene glycol

xiii
R.T.: room temperature
RES: Reticuloendothelial System
siRNA: small interfering ribonucleic acid
TEM: transmission electron microscopy
TFA: trifluoroacetic acid
TLC: thin layer chromatography

xiv
List of Compounds

xv

xvi

xvii

xviii

xix

xx
Acknowledgements
What I have learned in the lab over the past year will soon prove its value
several times over. Despite this, it is the other lessons outside the classroom that
will lend the immeasurable gains in my life. Mental fortitude, wisdom, and
patience are not so easily learnt as the appropriate teacher can be very hard to
find. It is these three attributes that I will value most from what Tom has taught
me. His guidance along with my family’s irreplaceable love and support was all
that was needed to get this done.

Chapter 1: Introduction
1.1: Lipid Nanoparticles for Drug Delivery
The development of effective drug delivery vectors has come to the
forefront of therapeutic efforts in recent years.1,2 Such vectors, including
dendrimers, viruses, and lipid nanoparticles, have been used to deliver nucleic
acids and a broad range of different drugs.3 While each system has its
advantages, recent literature findings support that lipid nanoparticles (LNPs) are
the most promising of these drug delivery systems.
Formulating a drug into a delivery vector is a very drug dependent process.
Optimization of physiochemical properties, storage and in vivo stability,
pharmacokinetics, and toxicity of the formulations can take significant effort and
often lead to little success. Developing and optimizing a more generalized
approach for drug vector formulations would be a huge step forward in improving
therapeutics. Given that drugs rarely possess unifying characteristics, such a
delivery system would need to be designed to address drugs from a very general
perspective. For instance, delivery of nucleic acids and delivery of small
hydrophilic drugs could represent two categories in which different, but related,
vectors can be used. Lipid nanoparticles (LNPs) are a drug delivery system that
has potential for such diversity. In general, LNPs are colloidal carriers composed
of a mixture of different lipids that stabilize the drug load. Variation of the lipids
and their ratios allows for modifications to suit different categories of drugs and
still follow the overall concept of a generalized drug delivery vector.
Lipid-Drug conjugates (LDCs), liposomes, solid lipid nanoparticles
(SLNPs), and lipoplexes all fall under the LNP classification. LDCs consist of a
hydrophobic moiety linked, either through a covalent or ionic bond, to a polar
drug and are primarily used in the delivery of hydrophilic drugs – the hydrophobic
component of the LDC allows for the drug to self-assemble into a nanocarrier.19
Liposomes consist of an aqueous inner compartment where the drug is
1

solubilized – this compartment is bordered by a lipid bilayer. Among the issues
with liposomal delivery is drug leakage, and stability in the aqueous compartment
as some drugs are readily hydrolyzed.1 SLNPs and lipoplexes both represent
alternatives to viral delivery in gene therapy. SLNPs possess a solidified lipid
core that protects the nucleic acid – this core is then solubilized in aqueous
media by a lipid-based surfactant.16 Lipoplexes on the other hand, rely upon the
cationic, or ionisable, lipids to complex with the nucleic acid and it is this complex
that is stable during circulation.20
Current work on LNPs spans a broad range of potential applications from
chemotherapy to central nervous system delivery to gene therapy – such a
robust drug delivery system has long been the target of medicinal research.
However; LNPs have yet to emerge as the predominant therapeutic for patient
treatment. It has been identified that drug delivery systems with therapeutic
potential possess these unique features: 1) the ability to deliver cargo with
efficiency and efficacy, 2) the ability to target specific organs and tissues, 3) the
ability to maintain stable structures in serum and in storage, and 4) have low
toxicity.4 LNPs have not yet successfully met all of these requirements. In
modifying the individual components that make up the LNPs, it would be possible
to improve on these characteristics.
1.2: Solid Lipid Nanoparticles
Viral vectors had long been thought as the ideal delivery system in gene
therapy; however, these have since been shown to be ineffective in many
cases.21 Early clinical trials yielded mostly negative results where one patient
death and two cases of the vector causing the onset of leukemia have been
reported.21 Results since then have been more promising; however, concerns
remain regarding viral vectors with their potential scale-up and purification.27
Solid lipid nanoparticles (SLNPs) represent an emerging alternative in delivering
nucleic acids to cells.
2

1-1 (Cationic Lipid)
1-2 (Neutral Phospholipid)
1-3
1-4 (PEG-Lipid)
Figure 1.1: Examples of the four lipid components of solid lipid nanoparticles
SLNPs are composed of four lipid components (Figure 1.1); cationic lipid
(or ionisable lipid), neutral phospholipid, cholesterol, and PEG (polyethylene
glycol)-lipid. The hydrophobic core of the SLNP is thought of as an amorphous
solid composed of the ionisable lipid, the neutral phospholipid, and cholesterol.
PEG-lipids are used to solubilize and stabilize this core in an aqueous medium
3

such as the blood. Until recently, it was not well understood how the individual
components come together to form the SLNP.16 For oligonucleic acid cargo e.g.
siRNA, the siRNA drug load forms a complex with the cationic lipid within the
hydrophobic core – the ratio of cationic lipid’s cationic groups to the siRNA’s
anionic groups is known as the charge ratio.16 In general the smaller this charge
ratio is, the greater the drug loading will be as a fraction of the total particle mass.
The PEG-lipid is anchored onto the hydrophobic core by aliphatic chains of the
lipid anchors. Literature readings suggest that a composition consisting mainly of
ionisable lipid and cholesterol will most likely lead to the formation of stable
SLNPs.16 The SLNP composition, the drug loading, as well as the identity of the
lipids themselves, will greatly affect the particles’ physiochemical properties and
stability. 8, 17
First generation targeted drug delivery vectors, such as SLNPs, do not
have ligands attached for binding to specific cell surfaces, moreover; these
particles depend on the enhanced permeability retention (EPR) effect. In order to
get the full therapeutic result of the EPR effect the nanocarriers need to have
sufficiently long circulation times – this is related to the physiochemical properties
of the particle. Size, lipid composition, surface charge, and surface coatings have
all been demonstrated to affect biodistribution and pharmacokinetics.5,6 SLNPs
that have sizes within the range of 10-100nm can avoid clearance by the kidneys
and the reticuloendothelial system (RES) leading to extended circulation times
and increased drug accumulation at target sites.7 It has been established
charged species are readily bound to serum proteins resulting in rapid removal
by phagocytic cells.7 Pegylation, a process by which the outer surface of a
particle is covered with PEG, represents a general approach for preventing
clearance of drug delivery vectors.6
PEG has a number of roles in both the formulation and circulation stability
of SLNPs. When formulating SLNPs the PEG prevents aggregation and
contributes to obtaining stable, small, mono-disperse nanoparticles.8 Lipid
anchors that sufficiently anchor the PEG to the hydrophobic core result in
4

formulations that give greater stability under both storage and physiological
conditions. While providing a steric barrier for the SLNP, the hydrophilic polymer
also serves to significantly decrease the surface charge. Together, this is
generally assumed to prevent the SLNPs from associating with serum proteins
and ultimately leads to extended circulation times compared to their non-
pegylated counterparts.6, 8 Current commercially available PEG-lipids have been
found to insufficiently anchor the polymer to the SLNP resulting in limited
circulation times.8 There has been little work done to develop PEG-lipids that
improve the therapeutic efficacy of lipid nanoparticles.
1.3: Lipid-Drug Conjugates
Hydrophilic drugs represent a large portion of available therapeutics in
chemotherapy. Non-targeted drug delivery systems have resulted in harmful side
effects during cancer treatment as the cancer drugs accumulate non-specifically
in all regions of the body.5 Although some recent success has given passive
targeting delivery vectors for anticancer agents doxorubicin and paclitaxel, there
remains a significant need for further development of such nanocarriers.5
Lipid-Drug Conjugates (LDCs) represent a novel carrier that has yet to be
used in chemotherapy. The basic concept is well developed in the use of pro-
drugs to assist polar molecules to transverse membranes followed by metabolic
processing to release the drug inside the cell. The LDC concept involves linking a
polar drug to a hydrophobic component, where this linkage can be either
covalent or ionic. Ultimately, this will result in a moiety that overall is hydrophobic
and thus is capable to self-assemble into a lipid nanoparticle. Following LDC
uptake into the cell, cellular mechanisms will expose the drug inside the cell. As
outlined previously, lipid nanoparticles have the potential to avert toxic side
effects seen with nonspecific drug delivery.5 Effective nanocarriers must be
stable under both storage and physiological conditions, and more importantly, be
able to avoid clearance by the kidneys and the RES (which implies a particle size
5

ranging from 10-100nm). A higher drug loading would possibly lead to fewer side
effects as the exposure to the amount of non-drug components can then be
reduced. Incorporation of a disulfide bond within the LDC can lead to improved
release kinetics. It is well noted that the interior environment of tumor cells is
considerably more reducing than that of the blood plasma; therefore meaning
that the active form of the drug is more readily released within the cell.22 Using an
ester linkage instead, which is what is commonly used in the majority of pro-
drugs, would not give such favorable release kinetics as esters are non-
specifically hydrolyzed by esterases throughout the body.
1-5 1-6
Figure 1.2: Thiopurine drugs 6-thioguanine and 6-mercaptopurine
1-5 and 1-6 are the thiopurines used as frontline drugs in the treatment of
acute lymphoblastic leukemia (ALL). 70% of all people diagnosed with ALL
(cancer of the bone marrow) will survive for five or more years. Despite these
encouraging results, complications associated with systemic non-specific drug
delivery have been found to lead to harmful and sometimes deadly side effects.10
In some cases, ALL can spread into the central nervous system (CNS) where
thiopurine drugs are unable to penetrate the blood brain barrier (BBB).9,11 A
nanocarrier system would have the potential to address the effects associated
with nonspecific delivery as well as the BBB impermeability of these thiopurine
drugs.12 A variable oral bioavailability and short half-life are also among the
issues that would be resolved.
6

1.4: Lipid Nanoparticle Formation and Characterization:
A number of high pressure homogenization techniques and emulsification
methods are used to promote individual components to self-assemble into
LNPs.23 In order to have therapeutic potential, the method must be able to form
LNPs with reproducible physiochemical properties and, at the same time, not
require significant time or effort to perform. Current methods do not offer such
properties.
The Precision Nanosystems (PNI) microfluidic mixer (NanoAssemblrTM)
represents a new technology that has been proven to give efficiently reproducible
LNP formulations. It relies on herringbone grooved mixing channels – this allows
for rapid, rotational mixing of two fluids that eventually lead to the formation of
LNPs. Organic solvents in the final products (such as ethanol, and small
molecules) are readily removed by dialysis. Particle size can easily be
determined by dynamic light scattering (DLS) and the surface charge can also be
determined by a zeta potential analyzer. Further characterization using
transmission electron microscopy (TEM) allows to visualization of these
nanoparticles.
1.5: Goals of the Thesis
In order to have therapeutic potential, LNPs must have the following
properties: 1) high drug loading; 2) particle sizes in the range of 10-100nm; 3)
low polydispersity (monodisperse); 4) low toxicity; 5) target specific cells for
delivery of cargo; 6) deliver cargo with high efficiency and efficacy; and 7) stable
in storage and under physiological conditions.4, 5 Narrowing down a composition
space for each LNP to the point that all of these conditions are satisfied has
proven to be a difficult task. Determining the identity and ratios of the lipids that
go into making these particles takes significant time and effort – rather it would
be better to develop and optimize individual components separately and evaluate
their effects based upon already established compositions. This approach has
7

been used in regard to the cationic lipids and the PEG-lipids in SLNPs which
eventually lead to particles with much improved physiochemical properties.8, 17 It
would be possible to further develop different PEG-lipids for SLNPs by varying
the branching sequences of the lipid anchors as well by exploring different
backbone structures. By doing so, one could arrive at structures that specifically
address the storage stability and short circulation time issues associated with
SLNPs.
The basic concept of LDCs is to make polar drugs more hydrophobic by
linking them to a lipid moiety. Different branching sequences and chain lengths
will determine how hydrophobic the LDC becomes. Too much hydrophobicity
could result in crystallization or very poor processibility. By exploring a range of
synthetic lipids, it would be possible to develop an effective nanocarrier.
Novel PEG-Lipids
PEG-lipids that have the potential to improve SLNP stability under storage
and physiological conditions would represent a great step forward in developing
more effective delivery vectors. Current lipid anchors have been found to
insufficiently anchor the PEG to the SLNP’s hydrophobic core resulting in poor
circulation times.8 By investigating different backbone structures with different
aliphatic branching sequences, it would be possible to arrive at better lipid
anchors. The candidate designs explored in this project are given in Figure 1.3.
8

Figure 1.3: First generation novel PEG-Lipids where the number of repeating
ethyleneoxy monomers, n, is approximately 45. The C16 isomers are drawn to
illustrate different branching sequences.
Incorporating a serinol backbone rather than the glycerol backbone
commonly used in commercial PEG-lipids, led to the first generation structures in
Figure 1.3. Admittedly, these PEG-lipids are quite similar to those currently
available, however; there remain some meaningful differences. The PEG-G1-
dC16 analogue is the first PEG-lipid to possess branched aliphatic chains while
the remaining novel PEG-lipids explored the effect of increasing chain length.
The amide linkage that connects the PEG to the lipid replaced the
phosphodiester bond of other PEG-lipids – this results in an overall neutral
compound which avoids potential problems with anionic nucleic acid cargos.
9

Figure 1.4: Second generation PEG-lipids where the number of repeating
ethyleneoxy monomers is approximately 45.
Second generation structures based on an iminodiacetic acid backbone,
as shown in Fig 1.4, have an interesting element. Both commercial and other
novel PEG-lipids utilize one lipid anchor, however; each of the second generation
analogues have two lipid anchors per PEG chain. This increase in the amount of
“grease” should result in PEG chains which are better anchored to the
hydrophobic core. Similar to the 1st generation, branching and chain length
variation of the aliphatic chains were investigated. Following characterization with
1H-NMR, ESI-MS was used to further determine the number of repeating
ethyleneoxy monomers in the PEG.
The goals of these projects were to; 1) develop chemistry to synthesize
the above lipids, 2) prepare SLNPs using the microfluidic mixer while
investigating different formulation variables, 3) Characterize the particles by size,
polydispersity, and TEM imaging, and 4) evaluate stability under both storage
and physiological conditions. The purpose is to establish what sort of effects the
different branching sequences and backbones have on the stability of the
particles. These studies are in direct comparison to commercial PEG-lipids.
10

LDCs for Thiopurine Drugs
A nanocarrier system would help resolve several challenges associated
with the thiopurine drugs as well as represent a significant advancement in
chemotherapy.
Figure 1.5: Structures of the LDCs for 6-mercaptopurine and 6-thioguanine
A disulfide linkage between the lipid and the thiopurine was chosen to
form the LDC monomers. In removing the free thiol group, the LDC monomers
become less polar and are better candidates for assembly into nanocarriers. The
remaining part of the molecule exists to increase the hydrophobicity of the entire
compound.
The goals of these projects were; 1) develop chemistry to synthesize the
above lipids, 2) prepare LDCs using the microfluidic mixer while investigating
different formulation variables, 3) Characterize the particles by size and
polydispersity and 4) evaluate stability under both storage and physiological
conditions. The purpose is to establish what effects the different branching
sequences have on the stability of the particles.
11
Chapter 2: Synthesis of Synthetic Lipids
2.1: Synthesis of PEG-Lipids
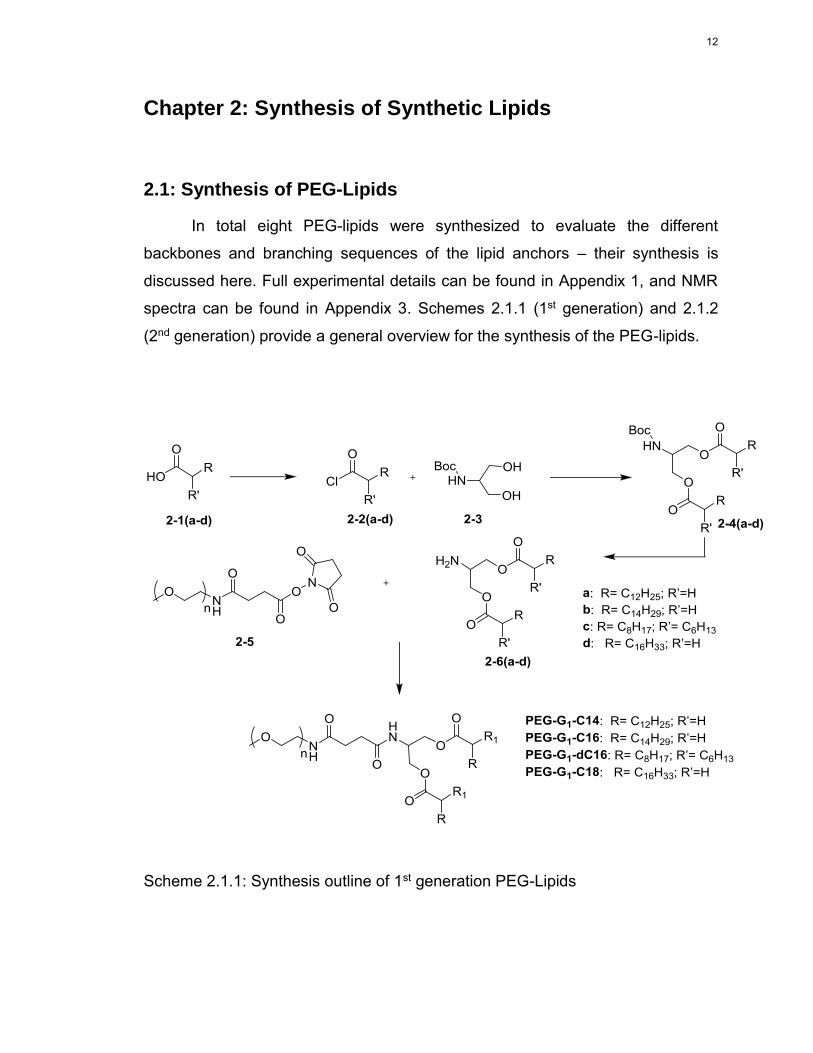
In total eight PEG-lipids were synthesized to evaluate the different
backbones and branching sequences of the lipid anchors – their synthesis is
discussed here. Full experimental details can be found in Appendix 1, and NMR
spectra can be found in Appendix 3. Schemes 2.1.1 (1st generation) and 2.1.2
(2nd generation) provide a general overview for the synthesis of the PEG-lipids.
Scheme 2.1.1: Synthesis outline of 1st generation PEG-Lipids
12

Scheme 2.1.2: Synthesis outline of 2nd generation PEG-Lipids
13

2.2: Synthesis of 1st Generation PEG-Lipids
Scheme 2.2.1: Synthesis of the 1st generation PEG-lipids. Synthetic details in
Appendix 1, NMR in Appendix 3.
The first step in the synthesis of the 1st generation PEG-lipids was to make
the 1st generation lipid anchor. This starts with converting fatty acids 2-1(a-d) to
their respective acid chlorides 2-2(a-d) by dissolving 2-1(a-d) in excess thionyl
chloride while heating. 1 H-NMR monitored the downfield shift of the α-proton(s)
signal from 2.35 (2H) ppm to 2.70 ppm (2H) – this was expected given that
chlorine electrons donate less readily into the π*c=o orbital. In order to ensure the
complete removal of thionyl chloride, 2-2(a-d) was left overnight on the high
vacuum. Yields were assumed to be quantitative.
Initial attempts to synthesize 2-4(a-d) were unsuccessful. Residual thionyl
chloride reacted with the boc-N-serinol hydroxyl groups leading to a mixture of
undesired products. Room temperature conditions, where pyridine functioned as
the solvent and the sacrificial base, gave a reaction time of 3 days but eventually
14

produced the desired products. 1H-NMR revealed an upfield shift from 2.70 ppm
(2H) to 2.36 ppm (2H) of the carbonyl alpha protons. The methylene protons on
the serinol backbone shifted from 3.82 ppm (4H) to 4.15 ppm (4H) and the singlet
at 1.45 ppm (9H) confirmed the stability of boc protecting group. Disappearance
of the signal at 3.82 ppm established complete conversion to the di-ester.
Though acyl chlorides readily form esters with primary alcohols, the steric
hindrance of the aliphatic chains and the close proximity of the alcohol groups led
to slower reaction rates. Moderate heating yielded 2-4(a-d) within two hours.
The boc deprotection of 2-4(a-d) with TFA gave the pure 1st generation lipid
anchors in yields varying from 66-75% over 3 steps.
Figure 2.1: 1H-NMR (CDCl3, 300 MHz) of 2-6b. The protons on the serinol
backbone are in an AA’BB’XY2 spin system.
The isolated products gave 1H-NMR spectra that were generally in line
with expectations. However, due to conformational preference within the serinol-
derived fragment, the methylene protons are in different chemical environments.
1H-1H COSY showed there was a correlation within the 4.05 ppm multiplet
supporting that two chemically inequivalent protons contributed to the signal. The
15

methine proton was identified at 3.28 ppm (1H) with 1H-1H COSY revealing
correlations between this and the 4.05 ppm multiplet. The triplet at 2.32 ppm (4H)
corresponds to the carbonyl α-protons. The absence of a singlet at 1.45 ppm
confirms a successful boc-deprotection. ESI-MS showed the singly charged
species (2-6(a-d) + H)+ with required mass/charge ratio for the assigned
structures in all cases.
Linkage of the PEG to the lipid anchor proved to be difficult. The first few
iterations of this reaction were done at room temperature failed to link the two
moieties as detected by thin-layer chromatography analysis. NHS-activated
esters are quite reactive such that r.t.25 reactions with free primary amines
proceed to give the desired products; however, the PEG chain hinders the
accessibility of the activated carbonyl carbon for nucleophilic attack. Moderate
heating over 48 hours in pyridine afforded PEG-lipids in yields of 66-70%
following chromatographic purification.
To characterize these PEG-lipids both ESI-MS and 1H-NMR were used.
For formulation purposes, it was necessary to accurately determine n – the
number of repeating ethylene monomers in the PEG chain. Unfortunately,
integration of the signal for ethylene protons from the 1H-NMR was inconclusive.
PEG-lipids have a high sensitivity to ESI-MS since the ethylene chains possess a
high affinity towards positively charged species such as protons, potassium or
sodium ions. Information obtained from the ESI-MS spectra allowed for the
determination of n.
16

Figure 2.2: Mass spectrum generated from ESI-MS of the starting material NHS-
PEG. The sample was treated with 0.1% TFA and 0.1% NaCl. This compound
shows the 3Na, 2Na+K, 2Na, Na+K, and 2K ion series where 74 of the 87 ion
clusters are accounted for.
ESI-MS of the NHS-PEG starting material shows five different series for
multiply-charged species (Figure 2.2). Given the instrument’s m/z range does not
extend beyond m/z =2000, the singly charged species was not observed. Sigma-
Aldrich the supplier reported that n ̴ 45 for the commercial sample of NHS-PEG
used, so it was expected that the triply charged species would appear around
m/z = 700-800. There exists two triply charged series in the mass spectrum; one
corresponding to ionization by two sodium ions and another to one potassium
(orange squares) and another to ionization by three sodium ions (blue squares).
Here, the blue squares indicate the more intense series. Together, these form
the 3+ cluster which was identifiable by the peak spacing of m/z = 14.7 between
consecutive peaks in the same series and relates to the different degrees of
polymerization of the ethylene oxide. The series themselves were readily
differentiated based simply on the fact that each has unique mass-to-charge
ratios due to being ionized by different ions. Series belonging to the 2+ cluster
were identified by having a peak spacing of m/z = 22.0 between consecutive
peaks of the same series that also relate to the different degrees of
polymerization of the ethylene oxide. Three doubly charged series appeared with
17

mass-to-charge ratios around 1000; one corresponding to ionization by two
sodium ions (red dots), one showing the dipotassium ion series (yellow dots),
and another corresponding to ionization by one sodium and one potassium
(green dots). Once again, each series within the 2+ cluster was identified based
upon unique mass-to-charge ratios. Here, red indicates the most intense series
while yellow shows the least intense one.
Figure 2.3: The intensities of a given n were summed and plotted versus n for the
NHS-PEG. The plot was then fitted to a Gaussian distribution.
Within each series, n = 45 was present and indicated on the spectrum –
so for the single species with n = 45 there were five mass-to-charge ratios at
which this appears. Once the peaks were assigned, the intensities for a given n
can then be summed, and the summed intensities plotted versus n with the data
fit to a Gaussian with a high reliability. The center of the Gaussian is 43 which is
consistent with a polymeric structure. Commercial samples are quoted as n = 45,
though this may just be an approximation by the suppliers. Regardless, the ESI-
MS proves that the NHS-PEG is the starting material where 85% of the peaks
were assigned.
18

Figure 2.4: The integration of the methylene protons in the1H NMR (300 MHz) of
NHS-PEG, in CDCl3, was significantly different than the expected values.
The singlets observed in the1H-NMR of the NHS-PEG (Figure 2.4) at 2.72
ppm and 2.76 ppm gave evidence that the starting material contained impurities.
The expected integration of the ethylene protons should be ̴ 174 H; however,
the observed integration was 297 H indicating that there may be polymeric
impurities present. Although there were unassigned peaks in the ESI-MS (Figure
2.2), these peaks were not found to correspond to a polymeric series. The
impurity was unable to be confidently identified. The singlet for the terminal
methoxy shows at 3.39 ppm with an integration of 5.2 H which is considerably
greater than the expected 3 H. This indicates that the polymeric impurity is at
least terminated in methoxy at one end. In fact when working through the
integrations it is most likely that both ends terminate with methoxy groups –
suggesting an OMe-PEG-OMe like structure. Qualitative purity calculations
based on the ethylene proton signal and methoxy proton signal give mol %
purities of 58 % and 63 %, respectively. Averaging of these two approximations
gives 61 % purity for the NHS-PEG starting material.
19

Figure 2.5: 1H-NMR (CDCl3, 300 MHz) of PEG-G1-C14. The downfield shift of HX
from 3.28 ppm to 4.41 ppm was indicative of amide formation.
Significant effort was invested in the characterization of the synthesized
PEG-lipids. 1H-NMR of PEG-G1-C14 (Figure 2.5) showed the conversion of the
amine in 2-6(a-d) to the amide linkage which was supported by the downfield
shift of the methine proton on the serinol backbone from 3.28 ppm to 4.41 ppm
(Figure 2.5 shows PEG-G1-C14 as an example). Furthermore, due to lack of free
bond rotation at the amide, the methylene protons on the serinol backbone
experience a greater difference in chemical environment – thus resulting in a
more observable difference in their chemical shifts (4.12 ppm) than in the starting
amines. Integration of the ethylene protons at 3.64 ppm highlight that there may
be polymeric impurities contributing to this signal. The expected integration
should be ̴ 174 H but in the 1H-NMR this comes out to be 371 H. A similar purity
as done with the NHS-PEG can be used here. The mol % purity based on the
ethylene proton signal and the methoxy proton signal was 47 % and 51 %,
respectively. The average of these two approximations gives a mol % purity of
49 %. Additionally, the singlet observed at 2.71 ppm was unable to be assigned
and likely corresponds to the same impurity present in the starting material.
These same impurities were observed in the 1H-NMR of the other PEG-lipids.
20

The mol % purities for the remaining 1st generation PEG-lipids were found to be
84 % (PEG-G1-dC16), 54 % (PEG-G1-C18), and 69 % (PEG-G1-C16).
Figure 2.6: Mass spectrum generated from ESI-MS of PEG-G1-C14. Sample was
treated with 0.1% TFA and 0.1% NaCl. The compound shows 3Na, 2Na+H, 2Na,
and Na+H ion series where 78 of the 85 ion clusters are assigned.
21

Figure 2.7: Mass spectrum generated from ESI-MS of PEG-G1-C16. Sample was
treated with 0.1% TFA and 0.1% NaCl. The compound shows 3Na, 2Na, and
Na+H ion series where 60 of the 67 ion clusters are assigned.
Figure 2.8: Mass spectrum generated from ESI-MS of PEG-G1-dC16. Sample
was treated with 0.1% TFA and 0.1% NaCl. The compound shows 3Na, 2Na,
and Na+H ion series where 56 of the 60 ion clusters are assigned.
22

Figure 2.9: Mass spectrum generated from ESI-MS of PEG-G1-C18. Sample was
treated with 0.1% TFA and 0.1% NaCl. The compound shows 3Na, 2Na+H, 2Na,
and Na+H ion series where 79 of the 87 ion clusters are assigned.
Structural confirmation based solely on 1H-NMR proved to be difficult
because of the prominence of the signal due to the ethylene protons. Therefore,
the integration data was relatively unreliable due the presence of polymeric
impurities. PEG-lipids have a high sensitivity to ESI-MS. Figures 2.6-2.10 are the
mass spectra for the first generation PEG-lipids. In each case, there exists a 2+
cluster and a 3+ cluster which are identifiable by their peak spacing of m/z =22
and m/z =14.7 respectively. Within the clusters are different series depending on
which ion is picked up during ionization. The 3Na, 2Na+H, 2Na, and Na+H ion
series were observed in the mass spectra of PEG-G1-C14 and PEG-G1-C18
(Figures 2.6 + 2.8) where 92% and 91% of the peaks were assigned respectively.
The mass spectra of the PEG-G1-C16 and PEG-G1-dC16 (Figures 2.7 + 2.9)
showed the 3Na, 2Na, and Na+H ion series in which 90% and 93% of the peaks
were assigned respectively. A higher percentage of peaks were assigned in the
PEG-lipids than in NHS-PEG. As done with the starting material, the summed
intensities were plotted versus n for each PEG-lipid and then fitted to a Gaussian
to find n. The centers were found to be at n= 43, 44, 43, and 44 for PEG-G1-C14,
PEG=G1-C16, PEG-G1-dC16, and PEG-G1-C18, respectively. By averaging
23

these values, an n value of 43.5 was used for molecular weight determinations. It
is unlikely the lower than expected n value can be explained by ESI-MS
preferentially ionizing shorter chained polymers. This would require that average
distance between positive charges to be closer on the shorter chained polymers
– producing some unfavorable electrostatic repulsion.
There were consistently peaks in the PEG-lipids that were unassignable
suggesting that there were impurities in the starting material. The mass spectrum
of the NHS-PEG, Figure 2.2, shows unassigned sequences. This concurs with
what was observed in the 1H NMRs of the PEG-lipids (Appendix 2) and the NHS-
PEG starting material. In all cases, the signal for the ethylene protons was
significantly greater than expected suggesting that there was an inseparable
polymeric impurity present in the starting material contributing to this signal.
Though the signal at 2.71 ppm could be N-hydroxysuccinimide, it is also possible
that this peak is due to this same impurity. No remaining PEG-NHS starting
material was observed in either the 1H NMR or ESI-MS of the lipid products
24

2.3: Synthesis of 2nd Generation PEG-Lipids
Scheme 2.3.1: Synthesis of the 2nd generation PEG-lipids. Synthetic details in
Appendix 1, NMR in Appendix 3.
25

The second generation lipids are built from the first generation lipids
added to an iminodiacetic acid core. Common amide coupling conditions were
effective despite the congested iminodiacid backbone. Conversion of the diacid
to the diamide was monitored by the downfield shift of the methine proton (1H) in
the serinol backbone from 3.28 ppm to 4.47 ppm. Complete conversion was
established by a relative integration of 1H (3.28 ppm) to 10H (4.47 ppm) for these
methine signals. Following boc deprotection with TFA, pure 2-9(a-d) were
afforded in yields varying from 51-60%.
Figure 2.10: 1H-NMR (CDCl3, 300 MHz) of 2-9b.
1H-NMR supported the isolated products. Due to the lack of free bond
rotation at the amides, the methylene protons on the serinol backbone
experience a more different chemical environment than previously observed in
the 1st generation lipid anchors. This results in the greater difference of chemical
shift of these methylene protons as seen at 4.26 ppm (2H) and 4.14 ppm (2H).
The methylene protons on the iminodiamide backbone appear as a singlet at
3.27 ppm (4H). Disappearance of the singlet at 1.78 ppm (9H) confirmed a
successful boc deprotection. ESI-MS showed the singly charged species (2-9(a-
d) + H)+ with required mass/charge for the assigned structures in all cases.
26

The initial intent was to use 2-9(a-d) as the 2nd generation lipid anchor;
however, the secondary amine proved to be unreactive towards the NHS-PEG.
Heating up to 120 ᵒC in DIPEA, resulted in the decomposition of 2-9(a-d) as well
as an intramolecular cyclization of the NHS-PEG to produce a PEG terminated in
an imide as detected in the ESI-MS spectrum of the crude products. Though the
electron density on the secondary amine is very similar to that of the primary
amine in 2-6(a-d), the increased steric bulk on the secondary amine makes the
activated carbonyl in the NHS-PEG inaccessible. With the observed lack of
reactivity of the secondary amine with NHS-PEG, it was decided to install a
primary amine to link to the lipid anchor to the PEG.
Scheme 2.3.2: Amide coupling of boc-N-glycine with 2-9(a-d).
27

Attempts to couple 2-9(a-d) to boc-N-glycine with just HBTU were
unsuccessful. The reaction proceeded well following the addition of HOBt as
indicated in the 1H NMR by the disappearance of the 3.27 ppm singlet for the
methylene proton (4H) signal on the iminodiamide backbone. These methylene
protons now appear downfield as two separate singlets at 3.91 ppm and 4.00
ppm rather a single signal (3.27 ppm) due to the lack of free rotation at the
tertiary amide. The disappearance of the signal at 1.43 ppm indicated a
successful boc deprotection. ESI-MS for 2-12b and 2-12c gave m/z =1290.00
and m/z=1289.93 respectively. Though from the 1H-NMR it was clear that
impurities such as unreacted 2-9(a-d) were present in the isolated products, the
crude products were carried on without purification. As detailed previously,
having 2-9(a-d) present while reacting 2-12(a-d) with NHS-PEG will not interfere
as it was unreactive towards the NHS-PEG. Beyond 1H-NMR, the other
analogues were not further characterized with ESI-MS as it was assumed the
chemistry should precede the same.
28

Scheme 2.3.3: Formation of the 2nd generation PEG-lipids
The final step of the 2nd generation PEG-lipid synthesis proceeded under
the same conditions used in the linking the 1st generation PEG-lipid to the PEG
giving yields from 33-54% after chromatography. 1H-NMR supported that the
desired products were isolated. The multiplet at 4.39 ppm (2H) corresponds to
the methine protons on the serinol backbone while the cluster of peaks between
3.89 - 4.26 ppm integrated to the expected 14Hs. Chemical inequivalence of the
protons on the two lipid anchors was created by the tertiary amide linkage in the
iminodiamide backbone – supported by the overlapping triplets at 2.29 ppm (4H)
and 2.31 ppm (4H). As was found in the analysis of the first generation PEG-
lipids, the integration of the ethylene protons was significantly different than
expected and the singlet at 2.71 ppm was also present in the second generation
PEG-lipids. The mol % purities were determined to be 80 % (PEG-G2-C14), 70 %
29

(PEG-G2-C16), 72 % (PEG-G2-dC16), and 59 % (PEG-G2-C18). ESI-MS once
again was used to confirm the identity of the compounds (Figures 2.11-2.14).
Figure 2.11: Mass spectrum generated from ESI-MS of PEG-G2-C14. Sample
was treated with 0.1% TFA and 0.1% NaCl. The compound shows 4Na, 3Na,
2Na+H, and 2Na ion series where 64 of the 71 ion clusters are assigned.
Figure 2.12: Mass spectrum generated from ESI-MS of PEG-G2-C16. Sample
was treated with 0.1% TFA and 0.1% NaCl. The compound shows 4Na, 3Na,
and 2Na+H ion series where 48 of the 56 ion clusters are assigned.
30

Figure 2.13: Mass spectrum generated from ESI-MS OF PEG-G2-dC16. Sample
was treated with 0.1% TFA and 0.1% NaCl. The compound shows 3Na+H, 4Na,
2Na+H, 3Na, and Na+H ion series where 83 of the 92 ion clusters are assigned.
Figure 2.14: Mass spectrum generated from ESI-MS of PEG-G2-C18. Sample
was treated with 0.1% TFA and 0.1% NaCl. The compound shows 4Na, 3Na,
2Na+H, and 2Na ion series where 73 of the 83 ion clusters ware assigned.
31

Figures 2.11-2.14 are the mass spectra of the second generation PEG-
lipids where the 2+ cluster, 3+ cluster, and 4+ cluster are identifiable by their
peak spacing of m/z = 22.0, m/z = 14.7, and m/z = 11.0, respectively. The 4Na,
3Na, 2Na+H, and 2Na ion series are observed in the mass spectrums of PEG-
G2-C14 and PEG-G2-C18 where 90% and 88% of peaks are assigned. From the
mass spectrum of PEG-G2-C16, ion series of 4Na, 3Na, and 2Na+H accounted
for 86% of all peaks. A Gaussian fit of the summed intensities versus n gave
plots centered at n = 43 for both of these PEG-lipids. Five ion series appear in
the mass spectrum of PEG-G2-dC16; 3Na+H, 4Na, 2Na+H, 3Na, and Na+H ion
series where 90% of the peaks are accounted for. An n value of 47 was
determined suggesting that some fractionation of the polymer mixture occurred
during column chromatography.
2.4: Synthesis of LDC Monomers
In total seven LDC monomers were synthesized to evaluate the branching
chains of the lipid anchors and their ability to self-assemble into LDC
nanoparticles – their synthesis is detailed here. Full experimental details can be
found in Appendix 1, and NMR spectra can be found in Appendix 2. Scheme 2.4
provides a general overview for the synthesis of the LDC.
32

Scheme 2.4.1: Synthesis of LDCs for 6-thioguanine and 6-mercaptopurine.
Synthetic details in Appendix 1, NMR in Appendix 3.
Scheme 2.4.2: Asymmetric disulfide formation of thiopurine drug with 11-
mercaptoundecanioc acid
Oxidation with DDQ provides the asymmetric disulfide in surprisingly good
selectivity. 2-14(a-b) was precipitated by adding water to the reaction mixture –
the water also reacted with remaining DDQ formally producing HCN athough the
pH of the medium was unknown. Workup was delayed (rt) to allow outgassing of
33

any HCN present. Given that DMSO (as well as the solutes) is readily absorbed
by the skin, caution was taken while handling the mixture.
Interestingly, only the asymmetric disulfide was observed in both 1H-NMR
and ESI-MS aliquots. This selectively has been well demonstrated for aromatic
thiols forming disulfides with alkyl thiols.15 It is thought that the homo-oxidized
alkyl disulfide is formed most readily; however, in the presence of aromatic thiol
the alkyl disulfide is subject to a disulfide exchange reaction resulting in the
formation of the asymmetric disulfide. Only nucleophilic attack by the aromatic
thiol is possible since it is considerably more acidic than the alkyl thiol. At near
neutral conditions, only the aromatic thiolate would be present in solution.18
Scheme 2.4.3: Amide coupling of synthetic lipid to 2-14(a-b)
Amide coupling with HBTU proceeded in poor to moderate yields (18-54%)
for the 7 LDC analogues. Though unlikely, the only concern here was the
possible amide formation between the aromatic amine (of 6TG) and the lipid
anchor. 1H-NMR revealed only one methine proton signal at 4.48 ppm (1H) as
well as ESI-MS gave the corresponding expected mass to charge ratios. 6TG-
C18 was attempted to be synthesized; however, initial efforts of purification were
unsuccessful – it was decided that until the effectiveness of these compounds
could be established no further time should be spent on 6TG-C18.
34

Chapter 3: Lipid Nanoparticle Formulations and Stability
3.1 Solid Lipid Nanoparticle Formulations
PEG-lipids mainly function to stabilize LNPs under both storage and
physiological conditions. LNPs that are unstable tend to aggregate with each
other and, under physiological conditions, with serum proteins. In the case of
extreme aggregation, precipitation can be observed. PEG-lipids serve to
minimize this aggregation and thus allow for the particles to maintain their
optimized physiochemical properties. In animal models, SLNPs formulated using
commercially available PEG-lipids were rapidly cleared from the circulatory
system.8 It is generally assumed the ability of PEG-lipids to stabilize SLNPs is
dependent upon the lipid anchors, and that insufficiently anchored PEG leads to
aggregation.6, 8
Using these novel synthetic PEG-lipids, it may be possible to show that
these compounds are better than their commercial counterparts with respect to
particle stability. Furthermore, varying backbone structure and chain length may
lead to a correlation between these features and particle stability. To evaluate the
stability effects of these PEG-lipids, a suitably stable SLNP composition was first
determined by investigating different lipids and their respective ratios. Ideally,
these particles would have the following characteristics: be smaller than 100 nm
in diameter, be monodisperse, be able to carry a therapeutically relevant drug
load, and be stable under storage conditions. Having a stable composition
allowed for the variation of the PEG-lipid identity to observe any structure-related
stability effects, under a variety of conditions, of different PEG-lipids.
There are five components that constitute a SLNP – all of which can affect
a particle’s physiochemical properties. It was well established in the literature that
the composition needed to be close to 40:11.5:47.5:1 (cationic lipid: DSPC:
cholesterol: PEG-lipid) mole composition with a nucleic acid loading of near 6 wt%
to obtain stable SLNPs with pharmaceutical potential.16 Nucleic acid loadings
35

were calculated based on wt%, that is, the mass of the nucleic acid was divided
by the total mass of the entire mixture. The ratio of the positive charge due to the
cationic lipid to the negative charge of the nucleic acid is known as the charge
ratio – high charge ratios correspond to low nucleic acid loadings. Given this,
formulations were carried out to explore the effects of using different nucleic acid
loadings and different cationic lipids .
5’-CGC GCG TAT ATA CGC GCG-3’
Figure 3.1: A single strand of the dsDNA used as the nucleic acid load in
formulations.
siRNA is unstable at room temperature and requires especially careful
handling. All equipment and bench tops must be washed with RNA nuclease
denaturing agent and RNA nuclease free water must be used for making buffer
solutions. For these reasons, a small oligomer dsDNA was used instead as
dsDNA (Figure 3.1) is greatly more stable than siRNA and does not have
extensive handling requirements. Given that both siRNA and dsDNA are short
oligomers with a helical double stranded structure, it is reasonable to assume
that the formulation data gathered from using dsDNA should also be applicable
for siRNA.
3-1
Figure 3.2: EPC (14:0) (Compound 3-1)
The major issue here is that commercially available cationic lipids and
ionisable lipids have been demonstrated to be rather useless in forming effective
SLNPs.17 Keeping these limitations in mind, initial attempts used EPC(14:0)
(Figure 3.2) as the cationic lipids. From a mole composition ratio of
50:10:38.5:1.5 SLNPs were synthesized by microfluidic mixing, and dynamic light
scattering was used to measure the particle diameter (see Appendix 1). In
36

general, formulations containing EPC yielded particles that were monodisperse
with sizes ranging from 75 nm to 310 nm. A monodisperse formulation falls under
a polydispersity index (PDI) value of less than 0.10. PDI and refers to the breadth
of the size distribution of the particles. The smaller this value is, the narrower the
distribution and the smaller variation there is between individual particles.
Unfortunately, compositions using EPC (14:0) were unable to lead to a general
composition for SLNPs as these particles were generally too large to be of
therapeutic interest.
PEG-lipid Particle Diameter (nm) PDI
PEG-G1-C14 260.8 0.098
PEG-G1-C16 306.9 0.102
PEG-G1-dC16 74.3 0.246
PEG-G1-C18 268.7 0.094
Table 3.1: Physical characterization of formulations done with a DNA loading
of 2.9%, a charge ratio of 9, and a composition of 50:10:38.5:1.5 (EPC(14:0):
DSPC: Cholesterol: PEG-lipid)
1-1
Figure 3.3: DOTMA (Compound 1-1)
Formulations using DOTMA (Figure 3.3) as the cationic lipid were more
successful in that particles were smaller and were able to hold a higher DNA load.
DSPE-PEG (Figure 3.4), a negatively charged PEG-lipid, and DSG-PEG, a
neutral PEG-lipid, (Figure 3.5) were used as the two commercial comparisons.
See Appendix 2 for details on formulations.
37

PEG-Lipids Particle Diameter (nm)
PDI
PEG-G1-C14 104.5 0.288
PEG-G1-C16 76.9 0.259
PEG-G1-dC16 156.1 0.248
PEG-G1-C18 146.1 0.335
PEG-G2-C14 181.4 0.280
PEG-G2-C16 211.1 0.373
PEG-G2-dC16 119.5 0.351
PEG-G2-C18 165.6 0.394
DSG-PEG 80.5 0.268
DSPE-PEG 89.0 0.297
Table 3.2: Physical characterization of formulations done with a DNA loading
of 5.1%, a charge ratio of 5, and a composition of 50:10:38.5:1.5 (DOTMA:
DSPC: Cholesterol: PEG-lipid)
1-4
Figure 3.4: DSPE-PEG2000 (Compound 1-4)
3-2
Figure 3.5: DSG-PEG2000 (Compound 3-2)
The 1st generation PEG-lipids gave particles that had reasonable
diameters and therefore were further evaluated for stability. It is likely that this
composition was not well optimized for the 2nd generation PEG-lipids and given
the significant structural differences between the 2nd generation PEG-lipids and
the other PEG-lipids this was expected. Attempts to optimize the 2nd generation
38

PEG-lipid formulations by varying the mole ratio of PEG-lipid from 0.75% to 3.0%
failed to improve the physiochemical properties of the particles.
3-3
Figure 3.6: DLin-KC2-DMA (Compound 3-3)
Eventually an optimized commercial lipid mix (provided by Precision
NanoSystems) was used to formulate the dsDNA into SLNPs with the 2nd
generation PEG-lipids. Though Precision NanoSystems did not disclose the
composition of this commercial lipid mix, it is quite likely it contains the novel
ionisable lipid 3-3 (Figure 3.6). 3-3 is commonly used and is among the best
ionisable lipids to use for SLNP formulations. 16, 26
PEG-Lipid Particle Diameter (nm)
PDI
DMG-PEG 65.2 0.249
PEG-G2-dC16 73.6 0.112
PEG-G2-C16 86.1 0.262
Table 3.3: The physical characterizations of formulations using the commercial
lipid mix are shown above. The DNA loading was 5.1% with a corresponding
charge ratio of 5. The composition of the commercial mix was 50: 10: 38: 1.5
(Ionisable lipid: DSPC: Cholesterol: PEG-lipid) where the final 0.5 mol% was a
fluorescent lipid-marker.
3-4
Figure 3.7: DMG-PEG (Compound 3-4)
Using this optimized lipid mix and the 2nd generation PEG-lipids, yielded
SLNPs with desirable physiochemical properties (Table 3.3). DMG-PEG (Figure
39

3.7) was provided by PNI and used as the commercial comparison in these
experiments. DMG-PEG is structurally very similar to DSG-PEG with only
difference being found in the length of their respective aliphatic chains. PEG-G2-
dC16 gave more promising SLNPs than the commercial DMG-PEG.
Cryo-TEM images (Figures 3.8 -3.9) were prepared by applying the
sample, doped with 5 nm gold particles for calibration, to an EM grid. Filter paper
was then used to blot the sample and to dehydrate it. This was then frozen in
liquid ethane. It was very important to ensure that the sample was consistently
kept cool by liquid nitrogen at all times to prevent the formation of ice crystals.
This made it difficult to successfully transfer the grid to the grid holder – great
care was taken to keep the sample in the liquid nitrogen while doing the transfer.
If not handled correctly, the grid can easily be damaged rendering the sample
useless. Following imagining with the TEM microscope, it was confirmed
spherical particles were formed and the dispersions were moderately
polydisperse which concurs with DLS experiments.
Figure 3.8: Cryo-TEM image of PEG-G1-C16 sample showing particles with a
generally spherical morphology.
40

Preparation steps may have damaged the sample – specifically
dehydration of the sample likely caused this “flaking” effect observed on the
particle’s surface in Figure 3.9. It is possible there was water trapped in the core
of the particle that was removed during dehydration leading to this “flaking” effect.
Given that the interior of SLNPs are postulated to be solid, the fact that water
may be being removed from inside of the particle goes against this idea. It was
not possible to conclude that these particles contained a solid interior as some of
the TEM images revealed what looked like a lipid bilayer. In Figure 3.9, the white
bars indicate 4-10 nm and are centered in regions that could be a lipid bilayer. If
confirmed in future imaging, the lipid bilayer would signify the particles are more
similar to liposomes rather than SLNPs. However, it is also possible that these
regions are a depth-of-field artefact.
Figure 3.9: Cryo-TEM image of PEG-G1-C16 sample
3.2 Stability Assay for SLNPs
The effectiveness of the 1st generation PEG-lipids to stabilize the SLNPs
was evaluated through a stability assay under 6 different conditions and
41

compared to DSG-PEG and DSPE-PEG, two commercially available PEG-lipids.
The experimental details are documented in Appendix 2.
Commonly, particle stability is evaluated by monitoring particle size and
PDI over a time period in PBS buffer. An increase in particle size is indicative of
aggregation meaning that when poorly anchored PEG comes off the particle
surface the hydrophobic core is exposed to the aqueous medium. These
hydrophobic surfaces will associate with each other resulting in an overall
increase in particle size. In extreme cases where the PEG was so poorly
anchored to the particle, precipitates can be observed in the formulation. In
addition to changes in particle size, changes in PDI can indicate aggregation or
redistribution within a population of particles. A significant increase in PDI is
evidence of particle instability.
Currently, an assay that can assess particle stability under physiological
conditions does not exist. Though incubation of formulations at 37 ᵒC in PBS
buffer does provide information on thermal stability, it does not take into account
the effects associated with serum. Serum contains proteins that can bind and
interact with the nanoparticles and, in some cases, cause aggregation. Such
aggregation with other particles or with serum proteins will lead to increase in the
apparent diameter of particles. The issue with running DLS experiments on
media containing 10% serum was that the particles in the serum also scatter light;
however, it was still possible to derive meaningful information from these
experiments. The reading from the DLS experiments represents a weighted size
average between the LNPs and the serum particles. If there was significant
increase in the average diameter observed, it would suggest that there was
substantial aggregation between serum proteins and the LNPs or between LNPs
themselves. In extreme cases, it is possible to observe precipitation of these
aggregates.
42

Figure 3.10a: SLNP apparent diameter at 4ᵒC in PBS buffer for 44 days for
formulations containing 1.5 mol% of different PEG-lipids. The composition for
these SLNPs was 50:10: 38.5: 1.5 (DOTMA: DSPC: Cholesterol: PEG-lipid) with
a DNA loading of 5.1 wt%.
Figure 3.10b: SLNP PDI at 4ᵒC in PBS buffer for 44 days for formulations
containing 1.5 mol% of different PEG-lipids. The composition for these SLNPs
was 50:10: 38.5: 1.5 (DOTMA: DSPC: Cholesterol: PEG-lipid) with a DNA
loading of 5.1 wt%.
0
20
40
60
80
100
120
140
DSG-PEG PEG-G1-C14 PEG-G1-C16
Par
ticl
e S
ize
(n
m)
Day 1
Day 45
0.24
0.245
0.25
0.255
0.26
0.265
0.27
0.275
0.28
0.285
0.29
0.295
DSG-PEG PEG-G1-C14 PEG-G1-C16
PD
I
Day 1
Day 45
43

Figure 3.10c: SLNP diameter % difference at 4ᵒC in PBS buffer for 44 days for
formulations containing 1.5 mol% of different PEG-lipids. The composition for
these SLNPs was 50:10: 38.5: 1.5 (DOTMA: DSPC: Cholesterol: PEG-lipid) with
a DNA loading of 5.1 wt%.
Before proceeding with stability test it was first necessary to establish that
the SLNPs using DOTMA as the cationic lipid were at least stable at 4ᵒC in PBS
buffer. This condition was where it was expected particles to be most stable and
thus represented a starting point for whether the determined composition was
adequate for further stability tests. In Figure 3.10a is the apparent particle
diameter for different formulations monitored over a 44 day period. Clearly, over
the course of 44 days the average apparent diameter for each of these
formulations has slightly increased. This increase in the average apparent
diameter is most evident in PEG-G1-C16; moreover, the increase in the PDI
observed in Figure 3.10b further signifies instability of the formulation. 16%, 56%,
and 31% are the apparent diameter increases shown in Figure 3.10c for PEG-
G1-C14, PEG-G1-C16, and DSG-PEG, respectively. In considering the change in
the average apparent diameters, it was possible to rank these three formulations
in order of highest to lowest stability; PEG-G1-C14 > DSG-PEG > PEG-G1-C16.
Two room temperature storage conditions, as well as physiological
stability, were Investigated. Formulations were stored at RT in two different
0.0
10.0
20.0
30.0
40.0
50.0
60.0
DSG-PEG PEG-G1-C14 PEG-G1-C16
Dia
me
ter
% d
iffe
ren
ce
44

media; PBS buffer and PBS buffer with 10% serum. Sizes and PDI of the
formulations were monitored over one week. To subject the particles to
conditions that more resembled physiological conditions, formulations were
incubated at 37 ᵒC with and without 10% serum in PBS buffer. Particle sizes and
PDIs were recorded over a time of 5 days.
Figure 3.11: SLNP particles incubated at RT in PBS buffer for 7 days for
formulations containing 1.5 mol% of different PEG-lipids. The composition for
these SLNPs was 50: 10: 38.5: 1.5 (DOTMA: DSPC: Cholesterol: PEG-lipid) with
a DNA loading of 5.1 wt%.
0
10
20
30
40
50
60
70
80
90
100
% D
iam
ete
r D
iffe
ren
ce
45

Figure 3.12: SLNPs incubated at RT in PBS buffer and 10% serum for 7 days for
formulations containing 1.5 mol% of different PEG-lipids. The composition for
these SLNPs was 50: 10: 38.5: 1.5 (DOTMA: DSPC: Cholesterol: PEG-lipid) with
a DNA loading of 5.1 wt%.
Despite the best efforts to arrive at a stable SLNP composition, storage at
room temperature revealed that even over just 7 days in PBS buffer the particles
begin to show aggregation (Figure 3.11). However, it was still possible to deduce
the relative stability of these formulations. Under this condition, both PEG-G1-
dC16 and PEG-G1-C18 appeared to be the most stable formulations with
respective diameter increases of 13% and 17%. It follows that the relative
stability of these formulations from highest to lowest is: PEG-G1-dC16 ̴ PEG-G1-
C18 > commercial PEG-lipids > PEG-G1-C14 > PEG-G1-C16. When this
experiment was done in PBS buffer with 10% serum, the average apparent
diameter from DLS experiments represents a weighted average between the
serum particles and the SLNPs (Figure 3.12). Also as result of the serum
particles, the PDI values were large and, due to this, provide little stability
information. PEG-G1-dC16 shows the smallest proportional increase in apparent
diameter suggesting that it is the most stable formulation in PBS buffer with 10%
0
5
10
15
20
25
30
35
40
45
50
% D
iam
ete
r D
iffe
ren
ce
46

serum at room temperature. Overall, PEG-G1-dC16 appears to produce the most
stable formulation.
Figure 3.13: SLNPs incubated at 37ᵒC in PBS for 5 days for formulations
containing 1.5 mol% of different PEG-lipids. The composition for these SLNPs
was 50: 10: 38.5: 1.5 (DOTMA: DSPC: Cholesterol: PEG-lipid) with a DNA
loading of 5.1 wt%.
Figure 3.14: SLNPs incubated at 37ᵒC in PBS buffer and 10% serum for 5 days
for formulations containing 1.5 mol% of different PEG-lipids. The composition for
these SLNPs was 50: 10: 38.5: 1.5 (DOTMA: DSPC: Cholesterol: PEG-lipid) with
a DNA loading of 5.1 wt%.
0
50
100
150
200
250
300
% D
iam
ete
r D
iffe
ren
ce
Day 2
Day 5
0
10
20
30
40
50
60
% D
iam
ete
r D
iffe
ren
ce
Day 2
Day 5
47

Further experiments at 37ᵒC in PBS buffer and PBS buffer with 10%
serum, Figures 3.13-3.14, showed increase the apparent diameter of the SLNPs.
Looking at Figure 3.13, it is shown that DSG-PEG SLNPs readily aggregate at
37ᵒC in PBS buffer as both the apparent diameter and the PDI increased
significantly over the 5 day incubation period. PEG-G1-dC16 and PEG-G1-C18
once again appear to be the most stable formulations with apparent diameter
increases of 16% and 48% respectively. This however is difficult to see in Figure
3.14 when the SLNPs are incubated at 37ᵒC in PBS buffer with 10% serum. This
is explainable by the fact that subtle aggregation is less detectable in these
experiments as the serum particles mask this effect. In any case, PEG-G1-dC16
shows the smallest proportional increase in diameter – further supporting it as
contributing to the most stable formulation.
Figure 3.15: SLNPs incubated at 37ᵒC in PBS buffer for 7 days for formulations
containing 1.5 mol% of different PEG-lipids. The composition for these SLNPs
was 50: 10: 38.5: 1.5 (Ionisable lipid: DSPC: Cholesterol: PEG-lipid) with a DNA
loading of 5.1 wt%.
Only a small amount of the commercial lipid mix was available – this
limited the number PEG-lipids that were evaluated. A stability experiment was
carried out at 37ᵒC in PBS buffer over 7 days. Preliminary results on the 2nd
0
50
100
150
200
250
300
350
400
DMG-PEG PEG-G2-dC16 PEG-G2-C16
% D
iam
ete
r D
iffe
ren
ce
48

generation lipids, PEG-G2-dC16 and PEG-G2-C16, were compared to the
commercial DMG-PEG. Over the incubation period, PEG-G2-dC16 showed the
smallest proportional increase in apparent diameter at 68% compared to DMG-
PEG at 366%. To this point, the PEG-G2-dC16 formulation was found to be
significantly more stable than both DMG-PEG and PEG-G2-C16. Further stability
tests need to done; specifically in regard to PBS with 10% serum at 37ᵒC. This
continues to outline branching lipids as a favorable stabilizing factor for SLNPs.
3.3 Lipid-Drug Conjugate Formulations
It was important to first establish a general composition for the
formulations. Formulating LDC nanocarriers is fairly unexplored, though there are
some evident starting points. Hydrophobic compounds rarely by themselves self-
assemble into nanocarriers and usually crystallize or precipitate out of aqueous
media. Initial attempts to form the LDC nanocarriers confirmed this as LDC
monomers precipitated out of solution. Since the LDC monomers are
hydrophobic moieties, it was necessary to incorporate a surfactant into the LDC
formulations to improve their solubility. Furthermore, incorporating a co-lipid was
thought to stabilize the interior.
LDC Particle Diameter (nm)
PDI
6MP-C14 489.7 0.343
6MP-C16 216.7 0.288
6MP-dC16 80.9 0.277
6MP-C18 560.3 0.358
6TG-C14 227.5 0.346
6TG-C16 102.2 0.237
6TG-dC16 64.8 0.220
Table 3.4: Physical Characterizations of LDC formulations where the
composition was 90: 5: 5 (LDC monomer: DMPC: DSPE-PEG). The drug
loading was 15 wt%.
Several different compositions were investigated before arriving at 5%
PEG-DSPE, 5% DMPC, and 90% LDC monomer mole ratio. The drug loading for
49

all of these formulations was 15 wt% calculated from the thiopurine drug mass
over the total mass of the mixture. Tween 80 was also evaluated at various mole
ratios; however, this surfactant failed to yield LDCs that were stable enough to
manipulate over 1-2 days. The particle sizes follow the C14 > C16 > dC16 lipid
series. None of the lipids gave any distinct advantage in forming LDCs with low
PDIs. Further optimization of the composition may lend to yielding formulations
with low PDIs – there exist other surfactants such as DSG-PEG or any of the
novel PEG-lipids prepared here that may improve the PDI. Following arrival at
this stable composition, the stability of these particles was evaluated over a time
period under 6 different conditions.
3.4 Lipid-Drug Conjugate Stability Assay
Identifying stable LDC formulations consistent with eventual therapy
application was done as previously described. These were evaluated under 6
different conditions to establish storage stability and physiological stability. The
experimental details are documented in Appendix 2.
Figure 3.16: LDCs incubated at 4ᵒC in PBS for 60 days formulations where the
composition was 90: 5: 5 (LDC monomer: DMPC: DSPE-PEG). The drug
loading was 15 wt%.
-20
0
20
40
60
80
100
120
% D
iam
ete
r D
iffe
ren
ce
Day 30
Day 60
50

Figure 3.17: LDCs incubated at 4ᵒC in PBS and 10% serum for 30 days where
the composition was 90: 5: 5 (LDC monomer: DMPC: DSPE-PEG). The drug
loading was 15 wt%.
6MP-C14, 6MP-C18, and 6TG-C14 were observed to show a greater than 40%
apparent diameter increase after 30 days and were concluded to be unstable in
PBS buffer at 4 ᵒC (Figure 3.16). 6MP-C16, 6MP-dC16, 6TG-C16, and 6TG-
dC16 were shown to maintain their apparent diameters and PDI values –
therefore it was concluded that these LDCs were stable under these conditions.
These four formulations were then incubated at 4ᵒC in PBS buffer and 10%
serum for 30 days (Figure 3.17). The apparent diameters remained constant over
this time period and no precipitates were observed meaning that aggregation
between particles and serum proteins were relatively low.
0
0.5
1
1.5
2
2.5
3
6MP-C16 6MP-dC16 6TG-C16 6TG-dC16
% D
iam
ete
r D
iffe
ren
ce
51

Figure 3.18: LDCs incubated at RT in PBS for 60 days where the composition
was 90: 5: 5 (LDC monomer: DMPC: DSPE-PEG). The drug loading was 15
wt%.
Figure 3.19: LDCs incubated at RT in PBS and 10% serum for 60 days where the
composition was 90: 5: 5 (LDC monomer: DMPC: DSPE-PEG). The drug
loading was 15 wt%.
-10
-5
0
5
10
15
20
25
6MP-C16 6MP-dC16 6TG-C16 6TG-dC16
% D
iam
ete
r D
iffe
ren
ceDay 30
Day 60
-20
0
20
40
60
80
100
6MP-C16 6MP-dC16 6TG-C16 6TG-dC16
Day 30
Day 60
52

Experiments at room temperature in PBS (Figure 3.18) also showed that
6MP-C16, 6MP-dC16, 6TG-C16, and 6TG-dC16 maintained constant apparent
diameters. Therefore, these formulations were stable under this condition. The
apparent diameter for 6MP-C16 was shown to increase significantly while
incubated at room temperature in PBS with 10% serum (Figure 3.19). No
precipitates were observed signifying the formulations were relatively stable.
Figure 3.20: LDC incubated at 37ᵒC in PBS for 3 days where the composition
was 90: 5: 5 (LDC monomer: DMPC: DSPE-PEG). The drug loading was 15
wt%.
0
10
20
30
40
50
60
70
80
90
6MP-C16 6MP-dC16 6TG-C16 6TG-dC16
% D
iam
ete
r D
iffe
ren
ce
Day 2
Day 3
53

Figure 3.21: LDC incubated at 37ᵒC in PBS and 10% serum for 3 days where the
composition was 90: 5: 5 (LDC monomer: DMPC: DSPE-PEG). The drug
loading was 15 wt%.
Monitoring stability at 37 ᵒC in PBS buffer over 3 days, Figure 3.20, shows
6MP-dC16 and 6TG-dC16 formulations with constant apparent diameters while a
moderate increase of 79% was observed for 6TG-C16. At 37 ᵒC in PBS buffer
with 10% serum (Figure 3.21), the experiment that most closely resembled
physiological conditions, no stability differences were discernible between the 4
formulations. Formulations maintained apparent diameters and no precipitates
were observed suggesting that all these were stable. 6TG-dC16 and 6MP-dC16
appear to be the most stable and represent the most promising as their particle
sizes fall within the 10-100 nm range for high therapeutic potential. The PDI
values indicated mildly polydisperse formulations with values between 0.20 - 0.30
– it would be possible to optimize this by investigating different surfactants in the
LDC composition at the expense of reduced drug loading.
0
5
10
15
20
25
6MP-C16 6MP-dC16 6TG-C16 6TG-dC16
% D
iam
ete
r D
iffe
ren
ceDay 2
Day 3
54

Chapter 4: Conclusions and Future Work
Eight different PEG-lipids were designed and synthesized for purposes in
lipid nanoparticle delivery. These structures explored serinol and iminodiacetic
acid backbones as well as different branching sequences in the aliphatic chains.
Lipid anchors were linked to PEG by an amide linkage through the reaction of a
free primary amine on the lipid anchors with NHS-activated ester PEG. PEG-
lipids were isolated in moderate yields. Purification using silica gel in column
chromatography was unable to remove some inherent impurities from the NHS-
PEG. The synthesis leaves potential for scale-up.
These PEG-lipids were then used to formulate SLNPs through microfluidic
mixing. The composition that was determined for these SLNPs was stable
enough to not only distinguish stability differences between the novel and
commercial PEG-lipids but also provide insight into structural advantages of the
synthetic lipids. The relative stability of the first generation PEG-lipids is as
follows: PEG-G1-dC16 > PEG-G1-C18 > PEG-G1-C14 > PEG-G1-C16. PEG-G1-
dC16 and PEG-G1-C18 were shown to be more stable than commercial PEG-
lipids DSG-PEG and DSPE-PEG. While no stability comparison was able to be
done to evaluate stability influences of the different backbone structures, it was
evident that branching lipids provides stability advantages over their straight
chain counterparts. A commercial lipid mix allowed for comparisons between
PEG-G2-dC16, PEG-G2-C16, and DMG-PEG. Preliminary results indicated that
PEG-G2-dC16 provides the greatest stabilizing effects of these three. With two
examples directly comparing branching (dC16) and non-branching (C16) lipids, it
appears that branching sequences are better at stabilizing SLNPs.
Moving forward, it is important to further establish branching lipids as a
stabilizing feature. There are commercially available C20 fatty acids straight and
branch chain isomers that can further explore this question. A stable composition
for the SLNPs needs to be obtained to compare what stability effects, if any, the
different backbone structures have on SLNPs. The 2nd generation PEG-lipids
55

have much unexplored compositions/applications to be discovered in LNP drug
delivery given that they are significantly different from current PEG-lipids.
Once a stable composition is obtained and a correlation between PEG-
lipid structure and SLNP stability has been established, it would be possible to
investigate the effects PEG-lipid structure has on SLNP transfection ability.
SLNP formulations could be done with a short DNA oligomer that is covalently
linked to a fluorescent probe. Cells would be treated with these SLNPs, at
varying concentrations, and monitored for the amount of fluorescence in the cells
following treatment. This experiment only considers the ability of the SLNPs to
get into the cells – it does not, however, give any information on whether the
nucleic acid is able to be active once inside the cell. A gene knockdown assay
would be required to investigate this. This involves formulating SLNPs with
siRNA that is covalently linked to a fluorescent probe (to once again track
whether the SLNP is getting into the cell). The siRNA must have correct
complementary base interactions for the target mRNA to observe a gene
knockdown.
Seven different LDC monomers were designed and synthesized for
applications in chemotherapy. The asymmetric disulfide was formed to link the
thiopurine drugs to synthetic lipids. Pure LDCs were isolated in moderate yields.
The reductive environment within the cell would be expected to readily cleave the
disulfide – releasing the free drug into the cytoplasm.
LDCs were formulated by microfluidic mixing. Four of the proposed LDCs
self-assembled into stable nanocarriers. 6MP-dC16 and 6TG-dC16 formed
particles with sizes less than 100 nm while showing the greatest stability under
physiological conditions. These nanocarriers may be further optimized to
investigate their therapeutic potential by further investigating different
compositions – more specifically by considering different surfactants such as
DMG-PEG or these novel PEG-lipids. Different formulation buffers may also
affect the physiochemical properties of these LDCs. A cell viability assay against
HeLa cells, or another cancerous cell-line, would determine whether these LDC
56

nanocarriers can kill cancerous cells at the same, or better, rate as the thiopurine
drugs by themselves.
The toxicity of the LDCs’ individual components also needs to be
evaluated. Determining this toxicity is not as simple as treating the cells with
varying concentrations of each component as this does not take into account the
fact that the components are in getting into the cells in different amounts when
formulated as a LDC. The best approach to this would be to synthesize an
analogue of the LDC monomers that incorporates a known relatively nontoxic
component in place of the drug and using this to formulate a pseudo-LDC.
Treating cells with this would show whether the remaining components of the
LDC as a whole are toxic.
Both the PEG-lipids and LDCs support branching lipids as more stabilizing
than their straight chain counterparts. More examples comparing this branching
effect needs to be investigated – as mentioned, synthesizing PEG-lipids and LDC
monomers starting from the commercial fatty acids C20 for the straight and
branch isomers would be an accessible starting point. The stability assay
developed for evaluating stability in PBS with 10% serum certainly needs some
work and, at this point, remains as a qualitative assay only. Beyond dramatic
increases in apparent diameters and observing precipitation, little information can
be gathered from this experiment.
57

Bibliography
1. Allen, T.M. and Cullis, P.R. “Liposomal drug delivery systems: From
concept to clinical applications”. Advanced Drug Delivery Reviews. 65
(2013) 36-48.
2. Vives, E.; Schmidt, J. and Pelegrin, A. “Cell-penetrating and cell targeting
peptides in drug delivery”. Biochimica et Biophysica Acta. 1786 (2008)
126-138.
3. Tiwari, G.; Tiwari, R.; Sriwastawa, B.; Bhati, L.; Pandey, S.; Pandey, P.
and Bannerjee, S.K.. “Drug delivery systems: An updated review”.
International Journal of Pharmaceutical Investigation. 2 (2012) 2-11.
4. Zhou, J.; Patel, T.; Fu, M.; Bertram, J.P. and Saltzman, W.M.. “Octa-
funtional PLGA nanoparticles for targeted and efficient siRNA delivery to
tumors”. Biomaterials. 33 (2012) 583-591.
5. Wicki, A.; Witzigmann, D.; Balasubrannanian, V. and Huwyler, J.
“Nanomedicine in cancer therapy: Challenges, opportunities, and clinical
applications”. Journal of Controlled Release. 200 (2015) 138-157.
6. Semple, S.C; Chonn, A. and Cullis, P.R. “Interactions of liposomes and
lipid-based carrier systems with blood proteins: Relation to clearance
behaviour in vivo”. Advanced Drug Delivery. 32 (1998) 3-17.
7. Petros, R. A. and DeSimone, J.M. “Strategies in the design of
nanoparticles for therapeutic applications”. Nature Reviews Drug
Discovery. 9 (2010) 615-627.
8. Heyes, J.; Hall, K.; Tailor, V.; Lenz, R. and MacLachlan, I. “Synthesis and
characterization of novel poly(ethylene glycol)-lipid conjugates suitable for
use in drug delivery.” Journal of Controlled Release. 112 (2006) 280-290.
9. Ohtsuki, S. and Terasaki, T. “Contribution of Carrier-Mediated Transport
Systems to the Blood-Brain Barrier as a supporting and protecting
Interface for the Brain; Importance for CNS Drug Discovery and
Development”. Pharmaceutical Research. 24 (2007) 1745-1758.
10. Karran, P. and Attard, N. “Thiopurines in current medical practice:
molecular mechanisms and contributions to therapy-related cancer”.
Nature Reviews Cancer. 8 (2008) 24-36.
11. Mori, S.; Ohtsuki, S.; Takanaga, H.; Kikkawa, T.; Kang, Y. and Terasaki,
T. “Organic anion transporter 3 is involved in the brain-to-blood efflux
transport of thiopurine nucleobase analogs”. Journal of Neurochemistry.
90 (2004) 931-941.
12. Blasi, P.; Giovagnoli, S.; Schoubben, A.; Ricci, M. and Rossi, C. “Solid
lipid nanoparticles for targeted brain drug delivery”. Advanced Drug
Delivery Reviews. 59 (2007) 454-477.
58

13. Gasparini, G.; Bang, E.; Molimard, G.; Tulumello, D.V.; Ward, S.; Kelley,
S.O.; Roux, A.; Sakai, N. and Matile, S. “Cellular uptake of Substrate-
initiated Cell-Penetrating Poly(disulfide)s. J.Am.Chem.Soc. 136 (2014)
6069-6074.
14. Aubry, S.; Burlina, F.; Dupont, E.; Delarouche, D.; Joliot, A.; Lavielle, S.;
Chassaing, G.; and Sagan, S. “Cell-surface thiols affect cell entry of
disulfide-conjugated peptides”. The FASEB Journal. 23 (2009) 2956-2967.
15. Vandavasi, J.K.; Hu, W.; Chen, C, and Wang, J. “Efficient synthesis of
unsymmetrical disulfides”. Tetrahedron. 67(2011) 8895-8907.
16. Leung, A.K.K.; Hafez, I.M.; Baoukina, S.; Belliveau, N.M.; Zhigaltsev, I.V.;
Afshinmanesh, E.; Tieleman, D.P.; Hansen, C.L.; Hope, M.J., and Cullis,
P.R. “Lipid Nanoparticles containing siRNA synthesized by microfluidic
mixing exhibit an electron dense nanostructured core”. The Journal of
Physical Chemistry. 116(2012) 18440-18450.
17. Semple, S.C.; Akinc, A.; Chen, J.; Sandhu, A.P.; Hui, B.L.; Cho, C.K.;
Sah, D.W.Y.; Stebbing, D.; Crosley, E.J.; Yaworshi, E.; et al. “Rational
design of cationic lipids for siRNA delivery”. Nature Biotechnology.
28(2010) 172-178.
18. Houk, J; Singh, R; Whitesides, G.M. “Measurement of thiol-disulfide
interchange reactions and thiol pKa values”. Methods in Enzymology. 143
(1987) 634-647.
19. Olbrich, C.; Gessner, A.; Schroder, W.; Kayser, O.; and Muller, R. “Lipid-
drug conjugate nanoparticles of the hydrophilic drug diminezene-
cytotoxicity testing and mouse serum adsorption”. Journal of Controlled
Release. 96 (2004) 425-435.
20. Tros de llarduya, C.; Sun, Y.; and Duzganes, N. “Gene delivery by
lipoplexes and polyplexes”. European Journal of Pharmaceutical Sciences.
40 (2010) 159-170.
21. Thomas, C.E.; Ehrhardf, A.; and Kay, M.A. “Progress and Problems with
the use of viral vectors for gene therapy”. Nature Reviews Genetics. 4
(2003) 346-358.
22. Wang, Y.; Liu, D.; Zheng, Q.; Zhao, Q.; Zhang, H.; Ma, Y.; Fallon, J.; Fu,
Q.; Haynes, M.; Lin, G.; Zhang, R.; Wang, D.; Yang, X.; Zhao, L.; He, Z.;
and Lin, F. “ Disulfide bond bridge insertion turns hydrophilic anticancer
prodrugs into self-assembled Nanomedicines”. NanoLetters. 2014.
23. Raziyabegum, S.K.; Mohanvarma, M.; Madan Mohanreddy, M.; Ankarao,
E.; Mahidhar reddy, D.; and Jyothirmai, K. “A Novel Review in
Nanopharma Technology – Solid lipid Nanoparticles”. Int.J. Inv. Pharm.
Sci. 1 (2013) 81-84.
59

24. Williams, M.S.; Longmuir, K.J.; and Yager, P. “A practical guide to
staggered herringbone mixer”. Lab Chip. 8(2008) 1121-1129.
25. McIlhinney, H. “Determination of N-terminal myristoylation of proteoins
using a combined gas chromatographic/ mass spectrometric assay of
derived myristoylglycine: Electron impact-induced fragmentation of
acylglycine derivatives”. Journal of Mass Spectrometry. 30 (1995) 900-910.
26. Jayaraman, M.; Ansell, S.M.; Mui, B.L.; Tam, Y.K.; et al. “Maximizing the
Potency of siRNA Lipid Nanoparticles for Hepatic Gene Silencing In Vivo”.
Angew. Chem. Int. Ed. 51 (2012) 8529-8533.
27. Morenweiser, R. “Downstream processing of viral vectors and vaccines”.
Gene Therapy. 12 (2005) 103-110.
60

Appendix 1: Synthetic Experimental Details
General Procedures:
Chemicals and solvents were used as received from known suppliers,
except dry DCM which was obtained from a MBRAUN-SPS. NMR spectra were
collected on a 300 MHz Bruker instrument. ESI-MS spectra were recorded on a
LCQ-Classic instrument.
Synthetic Detail:
2-6: 1st Generation Lipid Anchor Synthesis:
Scheme A1.1: Outline of the synthesis for the 1st generation lipids anchor
General Procedure:
In a round bottom flask a stirred solution of thionyl chloride (10.0 equiv.) and 2-
1(a-d) (1.0 equiv.) was refluxed for 2 hours under a CaSO4 drying tube. The
reaction was monitored by 1H-NMR analysis of aliquots. The reaction was
allowed to cool and subsequently the thionyl chloride was removed under
vacuum on a roto-evaporator to obtain 2-2(a-d). In a round bottom flask 2-3 (1.0
equiv.) was dissolved in pyridine (10.0 equiv.) and 2-2(a-d) (2.5 equiv.) was
added dropwise . The mixture was then heated to 70 ᵒC and left to stir for 3 hours
61

under a CaSO4 drying tube. The reaction was monitored by 1H-NMR analysis of
aliquots. Once completed, the reaction was cooled and diluted with DCM. The
solution was then washed 3 times with 1 M HCI and 3 times with 1 M NaOH. The
organic layer was then dried over anhydrous sodium sulfate and then gravity
filtered. The solvent was removed under vacuum to obtain 2-4(a-d). Excess TFA
was added dropwise to 2-4(a-d) in a round bottom flask. The reaction was left
stirring for 1 hour at room temperature and was monitored by TLC (silica gel,
EtOAc/ Hexanes as eluent, visualized by KMnO4). Following completion of the
reaction, TFA was removed on a roto-evaporator. NaOH (1 M) was then added
and 2-6(a-d) was extracted with DCM and washed 3 times with 1 M NaOH. The
organic layer was dried with anhydrous sodium carbonate and subsequently
gravity filtered. DCM was removed on a roto-evaporator yielding 2-6(a-d). No
chromatography was necessary.
2-6a:
Following the general procedure, 2-2a was prepared from thionyl chloride (6.35
mL, 87.6 mmol) and 2-1a (2.000 g, 8.757 mmol) 2-4a was prepared from 2-3
(0.596 g, 3.13 mmol) in pyridine (2.53 mL, 31.3 mmol) and 2-2a (1.931 g, 7.835
mmol). 2-6a was prepared from TFA (5 mL) and 2-4a affording a waxy yellow
solid in a 66% yield (1.06 g). 1H-NMR (300 MHz, CDCl3) δ: 4.07 (m, 2H), 4.05 (m,
2H), 3.28 (m, 1H), 2.33 (t, 4H, 7.7 Hz), 1.62 (m, 4H), 1.48 (s(br), 2H), 1.26 (s,
40H), 0.88 (t, 6H, 7.0 Hz). 13C-NMR (75 MHz, CDCl3): 173.6, 65.8, 49.3, 34.2,
31.9, 29.6, 29.6, 20.4, 29.3, 29.2, 29.1, 24.9, 22.7, 14.1 MS ((+) ESI; Exact
mass): calc’d for C31H62NO4+ = 512.47 amu, obtained = 512.33 amu.
2-6b:
Following the general procedure, 2-2b was prepared from thionyl chloride (5.61
mL, 78.0 mmol) and 2-1b (2.000 g, 7.800 mmol). 2-4b was prepared from 2-3
(0.558 g, 2.92 mmol) in pyridine (2.31 mL, 29.2 mmol) and 2-2b (2.000 g, 7.299
mmol). 2-6b was prepared from TFA (5 mL) and 2-4b affording a waxy white
62

solid in a 73% yield (1.21 g). 1H-NMR (300 MHz, CDCl3) δ: 4.06 (m, 2H), 4.05 (m,
2H), 3.28 (m, 1H), 2.32 (t, 4H, J=7.8 Hz), 1.61 (m, 4H), 1.24 (s, 48H), 0.87 (t, 6H).
13C-NMR (75 MHz, CDCl3) δ: 173.8, 66.0, 49.5, 34.4, 32.1, 29.9, 29.9, 29.8, 29.7,
29.6, 29.5, 29.4, 25.2, 22.9, 14.3. MS ((+) ESI; Exact mass): calc’d for
C35H70NO4+ = 568.53 amu, obtained = 568.33 amu.
2-6c:
Following the general procedure, 2-2c was prepared from thionyl chloride (5.66
mL, 78.2 mmol) and 2-1c (2.30 mL, 7.82 mmol) 2-4c was prepared from 2-3
(0.488 g, 2.55 mmol) in pyridine (2.46 mL, 30.6 mmol) and 2-2c (2.10 g, 7.64
mmol) 2-6c was prepared from TFA (5 mL) and 2-4c affording a light yellow oil in
a 75% yield (1.09 g). 1H-NMR (300 MHz, CDCl3) δ: 4.06 (m, 2H), 4.04 (m, 2H),
3.26 (m, 1 H), 2.34 (m, 2 H), 1.57, 1.44 (m, 8 H), 1.24 (s, 40 H), 0.86 (t, 12 H,
J=7.0 Hz). 13C-NMR (75 MHz, CDCl3): 176.2, 65.5, 53.4, 49.4, 45.7, 32.4, 31.8,
31.6, 29.5, 29.4, 29.2, 29.2, 27.4, 27.4, 22.6, 22.6, 14.0, 14.0. MS ((+) ESI;
Exact mass): calc’d for C35H70NO4+ = 568.53 amu, obtained = 568.33 amu.
2-6d:
Following the general procedure, 2-2d was prepared from thionyl chloride (5.10
mL, 70.3 mmol) and 2-1d (2.000 g, 7.030 mmol). 2-4d was prepared from 2-3
(0.510 g, 2.67 mmol) in pyridine (2.15 mL, 26.7 mmol) and 2-2d (2.020 g, 6.668
mmol) 2-6d was prepared from TFA (5 mL) and 2-4d affording a waxy white solid
in a 67% yield (1.09 g). 1H-NMR (300 MHz, CDCl3) δ: 4.09 (m, 2H), 4.07 (m, 2H),
3.30 (m, 1H), 2.34 (t, 4H, J=7.5 Hz), 1.63 (m, 4H), 1.26 (s, 56H), 0.89 (t, 6H,
J=6.8 Hz). MS ((+) ESI; Exact mass): calc’d for C39H78NO4+ = 624.59 amu,
obtained = 624.53 amu.
63

2-12(a-d): 2nd Generation Lipid Anchor Synthesis:
Scheme A1.2: Outline of the synthesis for the 2nd generation lipid anchors.
64

General Procedure:
In a round bottom flask was dissolved 2-7 (1.0 equiv.) in dried DCM/DMF
(1:1;10mM). HBTU (2.4 equiv.), 2-6(a-d) (2.2 equiv.) and triethylamine (4.0 equiv.)
were subsequently added. The solution was stirred for 20 hours at room
temperature and was monitored by 1H-NMR. Once completed, the reaction
solution was diluted with EtOAc and washed 3 times with 1M HCl and 3 times
with H2O. The organic layer was then dried over anhydrous sodium sulfate,
followed by gravity filtration. EtOAc and DCM were roto-evaporated to yield 2-
8(a-d). Excess TFA was added dropwise to 2-8(a-d) in a round bottom flask. The
reaction was left to stir for 1 hour and monitored by 1H-NMR. Following
completion of the reaction, TFA was removed on roto-evaporator and 1 M NaOH
was added to the round bottom flask. 2-9(a-d) was extracted with DCM and
washed 3 times with 1 M NaOH. The organic layer was then dried over sodium
carbonate, followed by gravity filtration. DCM was removed on a roto-evaporator
and 2-9(a-d) was isolated. The crude product was subsequently characterized as
no purification was necessary. [Characterization- 1H-NMR, 13C-NMR, ESI-MS] In
a round bottom flask was dissolved 2-10 (1.1 equiv.) in dried DCM/DMF
(1:1;10mM). To this, HOBt (1.2 equiv.), HBTU (1.2 equiv.), 2-9(a-d) (1.0 equiv.),
and triethylamine (3.0 equiv.) were then added and the resulting solution was left
stirring at room temperature for 20 hours. When the reaction was complete,
visualized by 1H-NMR, the reaction solution was diluted with EtOAc, and washed
once with 1 M HCl and 3 times with H2O. The organic layer was then dried over
anhydrous sodium sulfate and then gravity filtered. DCM and EtOAc were
removed by roto-evaporation to yield crude 2-11(a-d). Excess TFA was added to
2-11(a-d) in a round bottom flask and the reaction was left for 1 hour. Following
completion, as monitored by 1H-NMR, TFA was removed on a roto-evaporator.
NaOH (1 M) was added to convert to the amine and 2-12(a-d) was extracted with
diethyl ether and subsequently washed with 3 times with 1 M NaOH. The organic
layer was dried with anhydrous sodium carbonate and then gravity filtered.
Diethyl ether was removed to obtain the crude product.
65

2-12a:
Following the general procedure, 2-8a was prepared from 2-7 (0.104 g, 0.444
mmol) in dried DCM/DMF (22.2 mL/22.2 mL;10 mM). HBTU (0.404 g, 1.066
mmol), 2-6a (0.500 g, 0.977 mmol) and triethylamine (0.25 mL, 1.8 mmol). 2-9a
was prepared from TFA (5 mL) and 2-8a affording a waxy light yellow solid in 53%
yield (0.264 g). The crude product was subsequently characterized as no
chromatography was necessary. 1H-NMR (300 MHz, CDCl3) δ: 7.02 (d, 2H, J=8.6
Hz), 4.46 (m, 2H), 4.24 (m, 4H), 4.12 (m, 4H), 3.25 (s, 4H), 2.31 (t, 8 H, J=7.8
Hz), 1.59 (m, 8H), 1.25 (s, 80H), 0.87 (t, 12H, J=6.9 Hz). 13C-NMR (75 MHz,
CDCl3) δ: 174.0, 170.8, 62.9, 52.8, 48.0, 34.3, 32.1, 29.9, 29.9, 29.7, 29.6, 29.5,
29.4, 25.1, 22.9, 14.3. MS ((+) ESI; Exact mass): calc’d for C66H126N3O10+ =
1120.94 amu, obtained = 1121.00 amu. Following the general procedure, 2-11a
was prepared from 2-10 (0.033g, 0.19 mmol) in dried DCM/DMF (9.0 mL/9.0
mL;10mM). To this, HOBt (0.029 g, 0.21 mmol), HBTU (0.080 g, 0.21 mmol), 2-
9a (0.20 g, 0.179 mmol), and triethylamine (0.075 mL, 0.53 mmol). 2-12a was
prepared from 2-11a and TFA (5 mL) affording a light brown solid.
2-12b:
Following the general procedure, 2-8b was prepared from 2-7 (0.093 g, 0.40
mmol) in dried DCM/DMF (20.0 mL/20.0 mL;10 mM). HBTU (0.364 g, 0.960
mmol), 2-6b (0.500 g, 0.880 mmol) and triethylamine (0.22 mL, 1.6 mmol). 2-9b
was prepared from TFA (5 mL) and 2-8b affording a light brown waxy solid in 55%
yield (0.272 g). The crude product was subsequently characterized as no
chromatography was necessary. 1H-NMR (300 MHz, CDCl3) δ: 7.03 (d, 2H, J=8.7
Hz), 4.47 (m, 2H), 4.26 (m, 4H), 4.14 (m, 4H), 3.27 (s, 4H), 2.33 (t, 8H, J=7.3 Hz),
1.60 (m, 8H), 1.27 (s, 96H), 0.89 (t, 12H, J=6.8). 13C-NMR (75 MHz, CDCl3) δ:
174.0, 170.8, 62.8, 52.7, 48.0, 34.31, 32.1, 29.9, 29.7, 29.6, 29.5, 29.4, 25.1,
22.9, 14.3. MS ((+) ESI; Exact mass): calc’d for C74H142N3O10+ = 1233.07 amu,
obtained = 1233.00. Following the general procedure, 2-11b was prepared from
66

2-10 (0.030 g, 0.17 mmol) in dried DCM/DMF (8.1 mL/8.1 mL;10mM). To this,
HOBt (0.026 g, 0.20 mmol), HBTU (0.074 g, 0.20 mmol), 2-9b (0.201, 0.162
mmol), and triethylamine (0.068 mL, 0.49 mmol). 2-12b was prepared from TFA
(5 mL) and 2-11b affording a light brown oil. MS ((+) ESI; Exact mass): calc’d for
C76H145N4O11+ = 1290.09 amu, obtained = 1290.00 amu.
2-12c:
Following the general procedure, 2-8c was prepared from 2-7 (0.093 g, 0.40
mmol) in dried DMF (20.0 mL). HBTU (0.363 g, 0.960 mmol), 2-6c (0.500 g,
0.880 mmol) and triethylamine (0.22 mL, 1.6 mmol). 2-9c was prepared from
TFA (5 mL) and 2-8c affording a colorless oil in 60% yield (0.296 g). The crude
product was subsequently characterized as no chromatography was necessary.
1H-NMR (300 MHz, CDCl3) δ: 7.07 (d, 2H, J=8.6 Hz), 4.46 (m, 2H), 4.25 (m, 4H),
4.11 (m, 4H), 3.23 (s, 4H), 2.34 (m, 4H), 1.56, 1.45 (m, 16H), 1.24 (s, 80H), 0.86
(t, 24H, J=7.4 Hz). 13C-NMR (75 MHz, CDCl3) δ: 176.4, 170.4, 62.3, 52.6, 48.0,
45.6, 34.6, 34.4, 32.9, 32.7, 32.5, 32.3, 32.2, 31.8, 31.6, 31.5, 29.6, 29.5, 29.4,
29.2, 29.2, 29.0, 27.4, 27.4, 25.2, 22.6, 22.6, 20.6, 14.0, 14.0, 11.3. MS ((+) ESI;
Exact mass): calc’d for C74H142N3O10+ = 1233.07 amu, obtained = 1232. 87 amu.
Following the general procedure, 2-11c was prepared from 2-10 (0.030 g, 0.17
mmol) in dried DCM (1.62 mL). To this, HOBt (0.026 g, 0.20 mmol), HBTU (0.074
g, 0.20 mmol), 2-9c (0.200 g, 0.162 mmol), and triethylamine (0.068 mL, 0.49
mmol) 2-12c was prepared from TFA (5 mL) and 2-11c affording a light brown oil.
MS ((+) ESI; Exact mass): calc’d for C76H145N4O11+ = 1290.09 amu, obtained =
1289.93 amu.
2-12d:
Following the general procedure, 2-8d was prepared from 2-7 (0.088 g, 0.36
mmol) in dried DCM/DMF (18.2 mL/18.2 mL;10 mM). HBTU (0.329 g, 0.867
mmol), 2-6d (0.500 g, 0.801 mmol) and triethylamine (0.20 mL, 1.5 mmol) 2-9d
was prepared from TFA (5 mL) and 2-8d affording a white waxy solid in a 51%
67
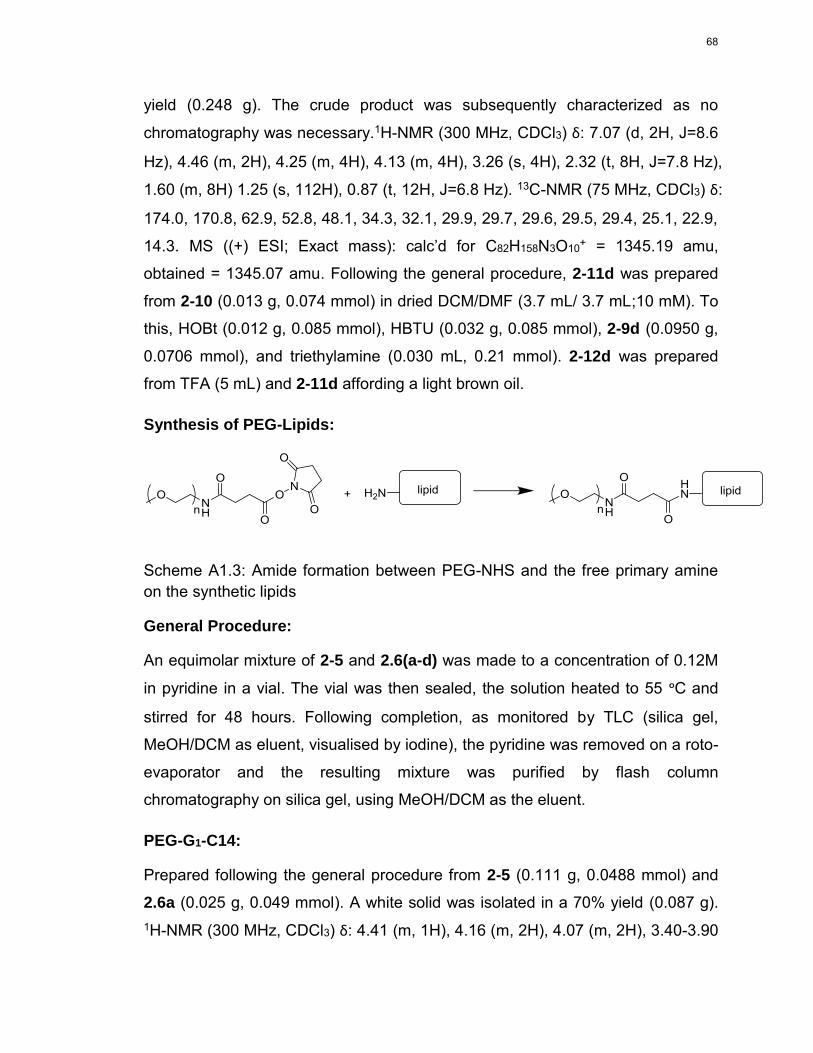
yield (0.248 g). The crude product was subsequently characterized as no
chromatography was necessary.1H-NMR (300 MHz, CDCl3) δ: 7.07 (d, 2H, J=8.6
Hz), 4.46 (m, 2H), 4.25 (m, 4H), 4.13 (m, 4H), 3.26 (s, 4H), 2.32 (t, 8H, J=7.8 Hz),
1.60 (m, 8H) 1.25 (s, 112H), 0.87 (t, 12H, J=6.8 Hz). 13C-NMR (75 MHz, CDCl3) δ:
174.0, 170.8, 62.9, 52.8, 48.1, 34.3, 32.1, 29.9, 29.7, 29.6, 29.5, 29.4, 25.1, 22.9,
14.3. MS ((+) ESI; Exact mass): calc’d for C82H158N3O10+ = 1345.19 amu,
obtained = 1345.07 amu. Following the general procedure, 2-11d was prepared
from 2-10 (0.013 g, 0.074 mmol) in dried DCM/DMF (3.7 mL/ 3.7 mL;10 mM). To
this, HOBt (0.012 g, 0.085 mmol), HBTU (0.032 g, 0.085 mmol), 2-9d (0.0950 g,
0.0706 mmol), and triethylamine (0.030 mL, 0.21 mmol). 2-12d was prepared
from TFA (5 mL) and 2-11d affording a light brown oil.
Synthesis of PEG-Lipids:
Scheme A1.3: Amide formation between PEG-NHS and the free primary amine
on the synthetic lipids
General Procedure:
An equimolar mixture of 2-5 and 2.6(a-d) was made to a concentration of 0.12M
in pyridine in a vial. The vial was then sealed, the solution heated to 55 ᵒC and
stirred for 48 hours. Following completion, as monitored by TLC (silica gel,
MeOH/DCM as eluent, visualised by iodine), the pyridine was removed on a roto-
evaporator and the resulting mixture was purified by flash column
chromatography on silica gel, using MeOH/DCM as the eluent.
PEG-G1-C14:
Prepared following the general procedure from 2-5 (0.111 g, 0.0488 mmol) and
2.6a (0.025 g, 0.049 mmol). A white solid was isolated in a 70% yield (0.087 g).
1H-NMR (300 MHz, CDCl3) δ: 4.41 (m, 1H), 4.16 (m, 2H), 4.07 (m, 2H), 3.40-3.90
68

(m, 174H), 3.38 (s, 3H), 2.51 (s, 4H), 2.31 (t, 4H, 7.8 Hz), 1.59 (m, 4H), 1.24 (s,
40H), 0.87 (t, 6H, J=7.0 Hz). ESI-MS see Figure 2.6.
PEG-G1-C16:
Prepared following the general procedure from 2-5 (0.100 g, 0.0440 mmol) and
2.6b (0.025 g, 0.44 mmol). A white solid was isolated in a 66% yield (0.076 g).
1H-NMR (300 MHz, CDCl3) δ: 6.66 (d, 1H, J= 8.3 Hz), 6.53 (m, 1H), 4.40 (m, 1H),
4.16 (m, 2H), 4.07 (m, 2H), 3.38-3.90 (m, 174H), 3.37 (s, 3H), 2.51 (s, 4H), 2.31
(t, 4H, J=7.5 Hz), 1.59 (m, 4H), 1.25 (s, 48H), 0.87 (t, 6H, J=6.8 Hz). ESI-MS see
Figure 2.7
PEG-G1-dC16:
Prepared following the general procedure from 2-5 (0.100 g, 0.0440 mmol) and
2.6c (0.025 g, 0.044 mmol). A gel-like colorless solid was isolated in a 68% yield
(0.087 g). 1H-NMR (300 MHz, CDCl3) δ: 4.40 (m, 1H), 4.19 (m, 2H), 4.04 (m, 2H),
3.39-3.90 (m, 174), 3.38 (s, 3H), 2.51 (s, 4H), 2.34 (m, 2H), 1.57, 1.45 (m, 8H),
1.25 (s, 40H), 0.87 (t, 12H, J=7.2 Hz). ESI-MS see Figure 2.8.
PEG-G1-C18:
Prepared following the general procedure from 2-5 (0.091 g 0.040 mmol) and
2.6d (0.025 g, 0.040 mmol). A white solid was isolated in a 67% yield (0.071 g).
1H-NMR (300 MHz, CDCl3) δ: 6.69 (d, 1H, J= 8.9 Hz), 6.61 (m, 1H), 4.41 (m, 1H,),
4.16 (m, 2H), 4.07 (m, 2H), 3.38-3.90 (m, 174H), 3.37 (s, 3H), 2.51 (s, 4H), 2.31
(t, 4H, J=7.8 Hz), 1.61 (m, 4H), 1.24 (s, 56H), 0.87 (t, 6H, J=7 Hz). ESI-MS see
Figure 2.9.
PEG-G2-C14:
Prepared following the general procedure from was added 2-5 (0.098 g, 0.043
mmol) and crude 2.12a (0.051 g, 0.043 mmol). A white solid was isolated in a 52%
yield (0.072 g). 1H-NMR (300 MHz, CDCl3) δ: 4.39 (m, 2H) 3.89-4.26 (m, 14H),
69

3.37-3.90 (m, 174H), 3.36 (s, 3H), 2.52 (m, 4H), 2.31 (t, 4H, J=7.6 Hz), 2.29 (t,
4H, J=7.6 Hz), 1.24 (s, 80H), 0.86 (t, 12H, 6.8 Hz). ESI-MS see Figure 2.11.
PEG-G2-C16:
Prepared following the general procedure from 2-5 (0.123 g, 0.054 mmol) and
crude 2.12b (0.070 g, 0.054 mmol). A white solid was afforded in 54% yield
(0.096 g) 1H-NMR (300 MHz, CDCl3) δ: 4.38 (m, 2H), 3.88-4.26 (m, 14H), 3.37-
3.87 (m, 174H), 3.36 (s, 3H), 2.53 (m, 4H), 2.31 (t, 4H, J=7.6 Hz), 2.29 (t, 4H,
J=7.6 Hz), 1.24 (s, 96H), 0.86 (t, 12H, J=7.0 Hz). ESI-MS see Figure 2.12
PEG-G2-dC16:
Prepared following the general procedure from 2-5 (0.130 g, 0.0572 mmol) and
crude 2.12(c) (0.074 g, 0.057 mmol). A white solid was afforded in 33% yield
(0.061 g). 1H-NMR (300 MHz, CDCl3) δ: 6.74 (s, 1H), 6.66 (d, 1H, J= 7.5 H), 6.47
(s, 1H), 4.40 (m, 2H), 3.87-4.22 (m, 14H), 3.36-3.87 (m, 174H), 3.35 (s, 3H), 2.51
(m, 4H), 2.31 (m, 4H), 1.42, 1.53 (m, 16H), 1.22 (s, 80H), 0.85 (t, 24H, J= 7.0
Hz) . ESI-MS see Figure 2.13.
PEG-G2-C18:
Prepared following the general procedure from 2-5 (0.065 g, 0.029 mmol) and
crude 2.12d (0.040 g, 0.029 mmol, 1.0 equiv.). A gel-like solid was isolated in a
47% yield (0.047 g). 1H-NMR (300 MHz, CDCl3) δ: 4.39 (m, 2H), 3.89-4.27 (m,
14H), 3.38-3.89 (m, 174H), 3.37 (s, 3H), 2.53 (m, 4H), 2.32 (t, 4H, J=7.4 Hz),
2.29 (t, 4H, J=7.4 Hz), 1.24 (s, 112H), 0.87 (t, 12H, J=7.0 Hz) . ESI-MS see
Figure 2.14.
70

2-14a: Asymmetric Disulfide Formation:
In a round bottom flask was dissolved 6-mercaptopurine monohydrate (0.500 g,
2.94 mmol) and 2-13 (0.641 g, 2.94 mmol) in DMSO (9.0 mL; 0.33M). While the
reaction was stirred, solid DDQ (0.669 g, 2.94 mmol) was slowly added over 10
minutes and then left at room temperature for 1 hour. The reaction was
monitored by TLC (silica gel, MeOH/DCM as eluent, visualized by iodine).
Following completion, the product was precipitated by adding 20 mL water to the
reaction solution. The resulting mixture was left for 6 hours before being vacuum
filtered and isolating a red solid was isolated. The crude product was redissolved
in hot methanol and cooled in an ice water bath then vacuum filtered. A white
powder was afforded in a 60% yield (0.622 g). 1H-NMR (300 MHz, DMSO-d6) δ:
8.84 (s, 1H), 8.57 (s, 1H), 2.96 (t, 2H, J= 7.0 Hz), 2.21 (t, 2H, J=7.3 Hz), 1.67
(quintet, 2H, J=7.5 Hz), 1.50, 1.40 (m, 4H), 1.25 (s, 10H). 13C-NMR (75 MHz,
DMSO-d6) δ: 174.4, 151.7, 38.1, 33.6, 28.8, 28.7, 28.5, 28.1, 27.6, 24.5. ( MS ((+)
ESI; Exact mass): calc’d for C16H25N4O2S2+ = 369.14 amu, obtained = 369.13
amu.
71

2-14b: Asymmetric Disulfide Formation:
In a round bottom flask was dissolved 6-thioguanine (0.500 g, 2.99 mmol) and 2-
13 (0.652 g, 2.99 mmol) in DMSO (0.15M). While the reaction was stirred, solid
DDQ (0.679 g, 2.99 mmol) was slowly added over 10 minutes and then left at
room temperature for 1 hour. The reaction was monitored by TLC (silica gel,
MeOH/DCM as eluent, visualized by iodine). Following completion, the product
was precipitated by adding water to the reaction solution. The resulting mixture
was left for 6 hours before being vacuum filtered and isolating a red solid was
isolated. The crude product was redissolved in hot acetone and cooled in an ice
water bath then vacuum filtered. A yellowish powder was afforded in 64% yield
(0.707 g). 1H-NMR (300 MHz, DMSO-d6) δ: 7.98 (s, 1H), 6.45 (s, 2H), 2.90 (t, 2H,
J=7.1 Hz), 2.17 (t, 2H, J=8.4 Hz), 1.62 (quintet, 2H, J=7.0), 1.46, 1.35 (m, 4H),
1.21 (s, 10H). 13C-NMR (75 MHz, CDCl3) δ: 174.5, 159.9 156.9, 140.1, 38.10,
33.6, 28.8, 28.7, 28.5, 28.01, 27.7, 24.5. MS ((+) ESI; Exact mass): calc’d for
C16H26N5O2S2+ = 384.15 amu, obtained = 384.27 amu.
72

LDC: Lipid Coupling:
General Procedure:
In a round bottom flask was dissolved 2-14(a-b) (1.1 equiv.) in dried DCM/DMF
(1:1;10 mM). To this, HBTU (1.2 equiv.), 2-6(a-d) (1.0 equiv.), and triethylamine
(2.0 equiv.) were then added and the resulting solution was left stirring at room
temperature for 20 hours. When the reaction was complete, visualized by 1H-
NMR, the reaction solution was diluted with EtOAc, and washed once with 1 M
HCl and 3 times with H2O. The organic layer was then dried over anhydrous
sodium sulfate and then gravity filtered. DCM and EtOAc were removed by roto-
evaporation. The crude product was purified by flash column chromatography on
silica, using EtOAc/Hexanes as the eluent.
6MP-C14:
Prepared following the general procedure, 2-14a (0.113 g, 0.308 mmol) in dried
DCM/DMF (14.6 mL/ 14.6 mL;10 mM), HBTU (0.133 g, 0.352 mmol, 1.20 equiv.),
2-6a (0.150 g, 0.293 mmol), and triethylamine (0.082 mL, 0.59 mmol). A light
yellow solid was afforded in a 28% yield (0.072 g) 1H-NMR (300 MHz, CDCl3) δ:
11.75 (s, 1H), 8.90 (s, 1H), 8.22 (s, 1H), 6.02 (d, 1H, J= 8.3 Hz) 4.52 (m, 1H),
4.30 (m, 2H), 4.11 (m, 2H), 2.91(t, 2H, J=7.0 Hz), 2.32 (t, 4H, J=7.9 Hz), 2.02 (t,
2H, J=7.9 Hz), 1.66 (m, 6H), 1.26, 1.12 (m, 54H), 0.88 (t, 6H, J=7.0). MS ((+) ESI;
Exact mass): calc’d for C47H84N5O5S2+ = 862.59 amu, obtained = 862.53 amu.
73

6MP-C16:
Prepared by the general procedure from 2-14a (0.0648 g, 0.176 mmol) in dried
DCM/DMF (9.0 mL/9.0 mL;10 mM), HBTU (0.112 g, 0.211 mmol), 2-6b (0.0648 g,
0.176 mmol), and triethylamine (0.076 mL, 0.53 mmol) . A white solid was
afforded in a 63% yield (0.102 g) 1H-NMR (300 MHz, CDCl3) δ: 12.88 (s, 1H),
8.91 (s, 1H), 8.29 (s, 1H), 6.05 (d, 1H, J=8.2 Hz), 4.50 (m, 1H), 4.26 (m, 2H),
4.09 (m, 2H), 2.91 (t, 2H, 7.1 Hz), 2.30 (t, 4H, J=7.6 Hz), 2.20 (t, 2H, J=7.1 Hz),
1.65 (m, 6H), 1.24, 1.17 (m, 62H), 0.87 (t, 6H, J=6.9 Hz). 13C-NMR (75 MHz,
CDCl3) δ: 174.1, 173.8, 160.5, 152.6, 149.9, 142.0, 131.4, 62.9, 48.0, 39.3, 36.9,
34.3, 32.1, 29.9, 29.9, 29.8, 29.7, 29.6, 29.5, 29.4, 29.1, 28.7, 28.3, 25.9, 25.1,
22.9, 14.3. MS ((+) ESI; Exact mass): calc’d for C51H92N5O5S2+= 918.65 amu,
obtained = 918.60 amu.
6MP-dC16:
Prepared by the general procedure from 2-14a (0.136 g, 0.370 mmol) in dried
DCM/DMF (17.5 mL/17.5 mL;10 mM), HBTU (0.160 g, 0.422 mmol), 2-6c (0.200
g, 0.352 mmol), and triethylamine (0.126 mL, 0.704 mmol). A light yellow oil was
afforded in a 42% yield (0.137 g) 1H-NMR (300 MHz, CDCl3) δ: 12.8 (s, 1H), 8.90
(s, 1H), 8.29 (s, 1H), 5.97 (d, 1H, J=8.8 Hz), 4.48 (m, 1H), 4.26 (m, 2H), 4.09 (m,
2H), 2.90 (t, 2H, J=7.3 Hz), 2.32 (m, 2H), 2.2 (m, 2H), 1.68, 1.55, 1.42 (m, 14H),
1.22, 1.16 (m, 50H), 0.85 (t, 12H, J=6.9 Hz). 13C (75 MHz, CDCl3) δ: 176.5, 173.3,
152.2, 142.0, 62.4, 48.0, 45.6, 39.1, 36.7, 32.3, 32.0, 31.8, 31.6, 29.7, 29.5, 29.4,
29.2, 29.2, 28.9, 28.5, 28.2, 27.4, 27.4, 25.6, 22.6, 22.6, 14.0, 14.0. MS ((+) ESI;
Exact mass): calc’d for C51H92N5O5S2+= 918.65 amu, obtained = 918.53 amu.
6MP-C18:
Prepared by the general procedure from 2-14a (0.062g, 0.168 mmol) in dried
DCM/DMF (8.0 mL/8.0 mL;10 mM), HBTU (0.073 g, 0.19 mmol), 2-6d (0.100 g,
74

0.160 mmol), and triethylamine (0.045 mL, 0.32 mmol). A white solid was
afforded in a 32% yield (0.050 g). 1H-NMR (300 MHz, CDCl3) δ: 8.91 (s, 1H),
8.27 (s, 1H), 6.01 (d, 1H, J=8.3 Hz), 4.50 (m, 1H), 4.26 (m, 2H), 4.09 (m, 2H),
2.90 (t, 2H, J=7.2 Hz), 2.30 (t, 4H, J=7.8 Hz), 2.20 (t, 2H, J=7.8 Hz), 1.68, 1.59
(m, 6H), 1.24, 1.15 (m, 70H), 0.87 (t, 6H, J=6.9 Hz). 13C-NMR (75 MHz, CDCl3) δ:
173.8, 173.5, 152.3, 62.7, 47.7, 39.1, 36.7, 34.1, 31.9, 29.7, 29.6, 29.5,, 29.3,
29.2, 29.1, 29.1, 29.0, 28.9, 28.8, 28.4, 28.0, 25.6, 24.9, 22.7, 14.1. MS ((+) ESI;
Exact mass): calc’d for C55H100N5O5S2+ = 974.72 amu, obtained = 974.67 amu.
6TG-C14:
Prepared by the general procedure from 2-14b (0.118 g, 0.308 mmol) in dried
DCM/DMF (14.6 mL/ 14.6 mL;10 mM), HBTU (0.133 g, 0.352 mmol), 2-6a (0.150
g, 0.293 mmol), and triethylamine (0.082 mL, 0.586 mmol). A light yellow solid
was afforded in 18% yield (0.047 g) 1H-NMR (300 MHz, CDCl3) δ: 7.92 (s, 1H),
6.10 (d, 1H, J=8.10 Hz), 5.31 (s, 2H), 4.52 (m, 1H), 4.29 (m, 2H), 4.12 (m, 2H),
2.88 (t, 2H, J=7.3 Hz), 2.32 (t, 4H, J=7.3 Hz), 2.18 (t, 2H, J=7.3 Hz), 1.68, 1.59
(m, 6H), 1.25, 1.18 (m, 54H), 0.88 (t, 6H, J=6.9 Hz). 13C-NMR (75 MHz, CDCl3) δ:
174.1, 173.7, 159.7, 139.6, 63.0, 48.0, 39.4, 36.9, 34.3, 32.1, 29.9, 29.9, 29.8,
29.7, 29.6, 29.5, 29.4, 29.4, 29.3, 29.1, 28.7, 28.3, 25.8, 14.3. MS ((+) ESI;
Exact mass): calc’d for C47H85N6O5S2+= 877.60 amu, obtained = 877.67 amu.
6TG-C16:
Prepared by the general procedure from 2-14b (0.068 g, 0.18 mmol) in dried
DCM/DMF (8.8 mL/ 8.8 mL;10 mM), HBTU (0.112 g, 0.211 mmol), 2-6b (0.120 g,
0.18 mmol), and triethylamine (0.076 mL, 0.53 mmol) A light yellow solid was
afforded in a 49% yield (0.081 g). 1H-NMR (300 MHz, CDCl3) δ: 11.23 (s, 1H),
7.87 (s, 1H), 6.08 (d, 1H, J=8.4 Hz), 5.24 (s, 2H), 4.51 (m, 1H), 4.29 (m, 2H),
4.11 (m, 2H), 2.87 (t, 2H, J=7.0 Hz), 2.31 (t, 2H, J=7.5 Hz), 2.17 (t, 2H, J=7.6 Hz),
1.68, 1.60 (m, 6H), 1.24, 1.17 (m, 62H), 0.87 (t, 6H, J=7.0 Hz). 13C-NMR (75
75

MHz, CDCl3): 173.9, 173.5, 159.4, 62.8, 47.7, 39.2, 36.6, 34.1, 31.9, 29.7, 29.6,
29.4, 29.3, 29.2, 29.1, 29.0, 29.0, 28.8, 28.4, 28.1, 25.6, 24.9, 22.7, 14.1. MS ((+)
ESI; Exact mass): calc’d for C51H93N6O5S2+ = 933.66 amu, obtained = 933.73
amu.
6TG-dC16:
Prepared by the general procedure from 2-14b (0.071 g, 0.19 mmol) in dried
DCM/DMF (8.8 mL/8.8 mL;10 mM), HBTU (0.080 g, 0.21), 2-6c (0.100 g, 0.176
mmol), and triethylamine (0.049 mL, 0.35 mmol). A light yellow liquid was
afforded in a 37% yield (0.061 g) 1H-NMR (300 MHz, CDCl3) δ: 7.88 (s, 1H),
6.05 (d, 1H, J=8.2 Hz), 5.20 (s, 2H), 4.50 (m, 1H), 4.30 (m, 2H), 4.12 (m, 2H),
2.87 (t, 2H, J=7.1 Hz), 2.35 (m, 2H), 2.15 (t, 2H, J=7.4 Hz), 1.68, 1.57, 1.45 (m,
14H), 1.24, 1.16 (m, 50H) 0.86 (t, 12H, J=6.5 Hz). 13C-NMR (75 MHz, CDCl3) δ:
176.7, 173.3, 159.4, 62.5, 48.0, 45.7, 39.1, 36.6, 32.3, 31.8, 31.6, 29.7, 29.6,
29.4, 29.3, 29.2, 29.1,29.0, 29.0, 28.8, 28.4, 28.0, 27.4, 27.4, 25.5, 22.6, 22.6,
14.1, 14.00. MS ((+) ESI; Exact mass): calc’d for C51H93N6O5S2+ = 933.66 amu,
obtained = 933.60 amu.
76

Appendix 2: Preparation and Stability of Lipid
Nanoparticles
A2.1: Lipid Nanoparticle Preparation
SLNP Preparation: SNPs were prepared using a NanoAssemblrTM microfluidic
mixer by the controlled mixing of ethanol solutions of lipid mixture with aqueous
buffer. The molar composition used in formulating the SNPs was 1.5:10:38.5:50
(PEG-Lipid: Neutral Lipid: Cholesterol: Cationic/Ionizable Lipid) and with a lipid
concentration of 12.5 mM. Stock solutions were made up in ethanol and the
required amounts were transferred and then made to the required concentration
by dilution with ethanol. The lipid mixture was made up in an Eppendorf tube
from stock solutions of PEG-lipid (see Table A2.1), DSPC (20 mg/mL; volume
added: 27.2 uL), DOTMA (40 mg/mL; volume added: 57.6 uL)), and cholesterol
(20 mg/mL; volume added: 51.2 uL).The final volume was made up to a total
volume of 0.55 mL with additional ethanol (see Table A2.1). The mixture was
then sealed and heated to 43 ᵒC for 5 minutes in the oven. A stock solution of
the dsDNA oligomer (50.00 mg/mL) was made up in PBS buffer (10.0 mM
Na3PO4, 0.154 M NaCl, and made to pH 7.4 using concentrated HCl, in Millipore
water). To a glass vial, 6.0 uL of the dsDNA stock solution was added and made
up to a volume of 2.244 mL with sodium acetate buffer (25.00 mM; pH 4 using
concentrated HCl to adjust the pH).
Prior to each SLNP preparation, the NanoAssemblerTM cartridge was washed
with the sodium acetate buffer in a 3 mL syringe (left port) and ethanol in a 3 mL
syringe (right port) with a 12 mL/min. flow rate and a 1:1 (aqueous:ethanol ratio)
flow ratio. A total of 4 mL of wash was collected and discarded. The
NanoAssemblrTM microfluidic mixer was then used to make the SNPs. In a 3 mL
syringe (left port) was loaded the 2.244 mL aqueous dsDNA solution and in
another 3 mL syringe (right port) was loaded the 0.55 mL lipid mixture. The flow
rate was set to 12 mL/min., the flow ratio to 3:1 (aqueous: EtOH), and the total
77

volume collected set to 2 mL with the initial 300 uL at the beginning and 50 uL at
the end being discarded. The collected formulation was immediately transferred
to a 3 mL Slide-A-Lyzer® Dialysis Cassette G2 (10,000 molecular weight cutoff)
and dialyzed against PBS buffer for 6 hours. The PBS was refreshed after 3
hours and the removal of ethanol from the formulation was monitored using
potassium dichromate (stable orange colour without greenish reaction indicated
EtOH removal).
Diameters of the SNPs were determined by dynamic light scattering (DLS)
experiments (on a Brookhaven Instrument, ZetaPALS particle sizing software)
The SNPs were then stored at 4 ᵒC.
PEG-Lipid PEG-Lipids [Stock] (mg/mL)
Volume of PEG-Lipid Added (uL)
Volume of EtOH Added (uL)
PEG-G1-C14 19.2 13.6 400.4
PEG-G1-C16 18.6 14.4 399.6
PEG-G1-dC16 17.4 15.4 398.6
PEG-G1-C18 17.9 15.3 398.8
PEG-G2-C14 30.6 10.8 403.3
PEG-G2-C16 29.6 11.6 402.5
PEG-G2-dC16 29.0 11.8 402.3
PEG-G2-C18 30.3 11.7 402.4
DSG-PEG 20.0 13.5 400.5
DSPE-PEG 10.0 28.9 385.1
Table A2.1: Concentrations of PEG-lipid solutions and required volumes for
formulations containing 1.5 mol% of different PEG-lipids. The composition for
these SLNPs was 50: 10: 38.5: 1.5 (DOTMA: DSPC: Cholesterol: PEG-lipid) with
a DNA loading of 5.1 wt%.
78

PEG-Lipids SNP Diameter (nm)
Polydispersity
PEG-G1-C14 104.5 ± 1.5 0.307 ± 0.006
PEG-G1-C16 76.9 ± 0.7 0.259 ± 0.004
PEG-G1-dC16 156.1± 1.9 0.248 ± 0.008
PEG-G1-C18 146.1± 1.4 0.335 ± 0.003
PEG-G2-C14 181.4 ± 21.4 0.280 ± 0.137
PEG-G2-C16 211.1± 4.8 0.373 ± 0.016
PEG-G2-dC16 119.5 ± 7.1 0.351± 0.025
PEG-G2-C18 165.6 ± 11.3 0.394 ± 0.031
DSG-PEG 80.5 ± 0.9 0.268 ± 0.005
DSPE-PEG 89.0 ± 0.4 0.297± 0.002
Table 3.2: Physical characterization of the SNP formulations immediately
following preparation for formulations containing 1.5 mol% of different PEG-lipids.
The composition for these SLNPs was 50: 10: 38.5: 1.5 (DOTMA: DSPC:
Cholesterol: PEG-lipid) with a DNA loading of 5.1 wt%.
LDC Preparation: Stock solutions of lipids were made up in ethanol with a lipid
concentration of ̴ 10 mM (see Table A2.3). In an eppendorf tube, the lipid mixture
of PEG-lipid (5.00 mol %), DMPC (5.00 mol %), and LDC (90.00 mol %) was
made up to a total volume of 0.25 mL with additional ethanol (see Table A2.3).
The mixture was then heated to 43 ᵒC for 5 minutes in the oven.
Prior to using, the NanoAssemblerTM cartridge was washed with PBS buffer in a
3 mL syringe (left port) and ethanol in a 3 mL syringe (right port) with a 12
mL/min. flow rate and a 1:1 (aqueous:ethanol ratio) flow ratio. A total of 4 mL of
wash was collected and discarded. The NanoAssemblrTM microfluidic mixer was
then used to make the LDCs. In a 3 mL syringe (left port) was loaded 2 mL PBS
buffer and in another 3 mL syringe (right port) was loaded the 0.25 mL lipid
mixture. The flow rate was set to 4 mL/min., the flow ratio to 3:1 (aqueous:EtOH),
and the total volume collected 1 mL with the initial 300 uL at the beginning and
50 uL at the end being discarded. An aliquot (0.50 mL) of the collected
formulation was then diluted to 0.40 mM (thiopurine) with PBS buffer, transferred
to a 3 mL Slide-A-Lyzer® Dialysis Cassette G2 (10,000 molecular weight cutoff)
and dialyzed against PBS buffer for 5 hours. The PBS was refreshed after 3
hours and the removal of ethanol from the formulation was monitored using
potassium dichromate (VI). Diameters of the SNPs were determined by dynamic
79

light scattering (DLS) experiments (on a Brookhaven Instrument, ZetaPALS
particle sizing software). The results are in Table A2.4. The SNPs were then
stored at 4 ᵒC.
LDC LDC [Stock]
(mg/mL)
Volume of LDC Added
(uL)
Volume of DSPE-PEG Added (uL)
Volume of DMPC
Added (uL)
Volume of EtOH Added
(uL)
6MP-C14 10.0 204.0 36.9 8.9 0.0
6MP-C16 10.4 199.0 35.0 8.5 7.9
6MP-dC16 10.0 206.5 35.0 8.5 0.0
6MP-C18 12.4 168.9 33.4 8.1 39.7
6TG-C14 17.7 115.7 36.4 8.8 89.1
6TG-C16 13.7 151.1 34.6 8.4 55.9
6TG-dC16 16.6 124.8 34.6 8.4 82.3
Table A2.2: LDC composition with stock [DSPE-PEG] = 10.0 mg/mL and stock
[DMPC] = 10.0 mg/mL where the composition was 90: 5: 5 (LDC monomer:
DMPC: DSPE-PEG). The drug loading was 15 wt%.
LDC LDC Diameter (nm)
Polydispersity (PDI)
Volume of PBS buffer Added (mL)
6MP-C14 489.7 ± 14.1 0.343 ± 0.007 2.59
6MP-C16 216.7 ± 7.7 0.288 ± 0.004 2.44
6MP-dC16 80.9 ± 0.9 0.277 ± 0.003 2.44
6MP-C18 560.3 ± 10.1 0.358 ± 0.010 2.30
6TG-C14 227.5 ± 11.3 0.346 ± 0.009 2.55
6TG-C16 102.2 ± 2.2 0.237 ± 0.006 2.40
6TG-dC16 64.8 ± 1.2 0.220 ± 0.007 2.40
Table A2.3: Physical Characterizations of LDC formulations immediately
following dialysis where the composition was 90: 5: 5 (LDC monomer: DMPC:
DSPE-PEG). The drug loading was 15 wt%.
80

A2.2: Lipid Nanoparticle Stability
LNP Stability Assay: The stability of the formulated SNPs was assessed under
6 conditions: LNPs were stored at 3 different temperatures; 4 ᵒC, RT, and 37 ᵒC,
and incubated in 2 different media; PBS buffer and PBS buffer with 10% serum
(by volume). To a polystyrene cuvette, 200 uL of LNPs solution and 2.30 mL of
PBS buffer were added and the diameters measured in a DLS experiment.
Cuvettes were then sealed and incubated under the indicated conditions.
Diameter measurements were taken regularly. To a polystyrene cuvette, 200 uL
of LNPs solution, 2.05 mL of PBS buffer, and 0.25 mL of serum were added and
the diameters measured in a DLS experiment. Cuvettes were sealed and
incubated under the indicated conditions. Stability results for the SLNPs and the
LDCs are in Tables A2.5-A2.8 and Tables A2.9-A2.14, respectively.
Formulation Day 1 Size (nm); PDI
Day 8 Size (nm); PDI
PEG-G1-C14 104.5 ± 1.5; 0.307 ± 0.006
166.7 ± 2.4; 0.222 ± 0.004
PEG-G1-C16 76.9 ± 0.7; 0.259 ± 0.004
144.2 ± 1.3; 0.212 ± 0.003
PEG-G1-dC16 156.1 ± 1.9; 0.248 ± 0.008
176.6 ± 2.1; 0.232 ± 0.007
PEG-G1-C18 146.1 ± 1.4; 0.335 ± 0.003
172.0 ± 1.6; 0.280 ± 0.002
DSG-PEG 80.5 ± 0.9; 0.268 ± 0.005
118.2 ± 1.3; 0.268 ± 0.005
DSPE-PEG 89.0 ± 0.4; 0.297 ± 0.002
126.2 ± 0.6; 0.293 ± 0.002
Table A2.4: SLNP storage stability at RT in PBS buffer for formulations
containing 1.5 mol% of different PEG-lipids. The composition for these SLNPs
was 50: 10: 38.5: 1.5 (DOTMA: DSPC: Cholesterol: PEG-lipid) with a DNA
loading of 5.1 wt%.
81

Formulation Day 1 Size (nm); PDI
Day 8 Size (nm); PDI
PEG-G1-C14 134.1± 1.1 ; 0.350 ± 0.001
197.1 ± 1.6; 0.345 ± 0.001
PEG-G1-C16 129.6 ± 1.4; 0.340 ± 0.000
225.1 ± 2.4; 0.381 ± 0.005
PEG-G1-dC16 178.3 ± 5.5; 0.337 ± 0.005
249.1 ± 7.7; 0.338 ± 0.005
PEG-G1-C18 166.8 ± 4.4; 0.345 ± 0.003
290.7 ± 7.7; 0.376 ± 0.003
DSG-PEG 117.9 ± 2.2; 0.357 ± 0.004
223.7 ± 4.2; 0.383 ± 0.004
DSPE-PEG 129.0 ± 4.8; 0.349 ± 0.005
212.3 ± 7.9; 0.389 ± 0.006
Table A2.5: SLNP storage stability at RT in PBS buffer with 10% serum for
formulations containing 1.5 mol% of different PEG-lipids. The composition for
these SLNPs was 50: 10: 38.5: 1.5 (DOTMA: DSPC: Cholesterol: PEG-lipid) with
a DNA loading of 5.1 wt%.
Formulation Day 1 Size (nm); PDI
Day 2 Size (nm); PDI
Day 5 Size (nm); PDI
PEG-G1-C14 104.5 ± 1.5; 0.307 ± 0.006
175.2 ± 1.1; 0.194 ± 0.010
228.6 ± 1.4; 0.164 ± 0.008
PEG-G1-C16 76.9 ± 0.7; 0.259 ± 0.004
157.2 ± 1.4; 0.204 ± 0.002
194.3 ± 1.7; 0.131 ± 0.001
PEG-G1-dC16 156.1± 1.9; 0.248 ± 0.008
198.7 ± 7.5; 0.088 ± 0.042
180.5 ± 6.8; 0.363 ± 0.012
PEG-G1-C18 146.1 ± 1.4; 0.335 ± 0.003
173.0 ± 1.4; 0.245 ± 0.008
216.3 ± 1.8; 0.204 ± 0.007
DSG-PEG 80.5 ± 0.9; 0.268 ± 0.005
299.1± 16.0; 0.230 ± 0.004
192.1 ± 10.3; 0.187 ± 0.003
DSPE-PEG 89.0 ± 0.4; 0.297 ± 0.002
136.5 ± 1.7; 0.255 ± 0.005
175.4 ± 2.2; 0.146 ± 0.003
Table A2.6: SLNP stability at 37ᵒC in PBS buffer for formulations containing 1.5
mol% of different PEG-lipids. The composition for these SLNPs was 50: 10: 38.5:
1.5 (DOTMA: DSPC: Cholesterol: PEG-lipid) with a DNA loading of 5.1 wt%.
82

Formulation Day 1 Size (nm); PDI
Day 2 Size (nm); PDI
Day 5 Size (nm); PDI
PEG-G1-C14 134.1 ± 1.1; 0.350 ± 0.001
190.1± 2.8; 0.291 ± 0.012
194.8 ± 2.9; 0.349 ± 0.014
PEG-G1-C16 129.6 ± 1.4; 0.340 ± 0.000
171.5 ± 1.9; 0.344 ± 0.005
165.3 ± 1.8; 0.351 ± 0.005
PEG-G1-dC16 178.3 ± 5.5; 0.337 ± 0.005
211.1 ± 16.8; 0.194 ± 0.069
180.5 ± 14.4; 0.363 ± 0.047
PEG-G1-C18 166.8 ± 4.4; 0.345 ± 0.003
237.9 ± 23.3; 0.320 ± 0.042
204.2 ± 19.9; 0.363 ± 0.048
DSG-PEG 117.9 ± 2.2; 0.357 ± 0.004
167.9 ± 9.4; 0.366 ± 0.002
120.5 ± 6.7; 0.356 ±0.002
DSPE-PEG 129.0 ± 4.8; 0.349 ± 0.005
149.4 ± 6.0; 0.370 ± 0.005
197.8 ± 7.9; 0.365 ± 0.005
Table A2.7: SLNP stability at 37ᵒC in PBS buffer with 10% serum for formulations
containing 1.5 mol% of different PEG-lipids. The composition for these SLNPs
was 50: 10: 38.5: 1.5 (DOTMA: DSPC: Cholesterol: PEG-lipid) with a DNA
loading of 5.1 wt%.
LDC Day 1 Size(nm); PDI
Day 30 Size(nm); PDI
Day 60 Size(nm); PDI
6MP-C14 227.5 ± 11.3; 0.346 ± 0.009
1013.7 ± 85.4; 0.427 ± 0.036
--
6MP-C16 216.7 ± 7.7; 0.288 ± 0.004
220.2 ± 2.3; 0.209 ± 0.013
205.4 ± 2.1; 0.231 ± 0.014
6MP-dC16 80.9 ± 0.9; 0.277 ± 0.003
90.1 ± 0.5; 0.284 ± 0.002
100.5 ± 0.6; 0.296 ± 0.002
6MP-C18 560.3 ± 10.1; 0.358 ± 0.010
807.4 ± 10.8; 0.371 ± 0.003
--
6TG-C14 489.7 ± 14.1; 0.343 ± 0.007
438.4 ± 5.4; 0.267 ± 0.004
--
6TG-C16 102.2 ± 2.2; 0.237 ± 0.006
101.6 ± 0.3; 0.215 ± 0.008
113.9 ± 0.3; 0.279 ± 0.010
6TG-dC16 64.8 ± 1.2; 0.220 ± 0.007
73.8 ± 1.3; 0.245 ± 0.009
93.8 ± 1.7; 0.314 ± 0.012
Table A2.8: LDC storage stability at 4 ᵒC in PBS buffer where the composition
was 90: 5: 5 (LDC monomer: DMPC: DSPE-PEG). The drug loading was 15
wt%.
83

LDC Day 1 Size(nm); PDI
Day 30 Size(nm); PDI
6MP-C16 160.7 ± 3.7; 0.399 ± 0.004
162.1 ± 4.8; 0.401 ± 0.007
6MP-dC16 126.8 ± 2.3; 0.406 ± 0.002
128.7 ± 2.6; 0.396 ± 0.003
6TG-C16 134.8 ± 3.1; 0.408 ± 0.002
138.4 ± 1.7; 0.405 ± 0.004
6TG-dC16 128.6 ± 7.4; 0.413 ± 0.004
131.7 ± 2.5; 0.405 ± 0.003
Table A2.9: LDC storage stability at 4 ᵒC in PBS buffer with 10% serum where
the composition was 90: 5: 5 (LDC monomer: DMPC: DSPE-PEG). The drug
loading was 15 wt%.
LDC Day 1 Size(nm); PDI
Day 30 Size (nm); PDI
Day 60 Size (nm); PDI
6MP-C16 216.7 ± 7.7; 0.288 ± 0.004
205.2 ± 7.3; 0.224 ± 0.003
220.5 ± 7.8; 0.212 ± 0.003
6MP-dC16 80.9 ± 0.9; 0.277 ± 0.003
83.3 ± 0.9; 0.259 ± 0.003
81.3 ± 0.9; 0.261 ± 0.003
6TG-C16 102.2 ± 2.2; 0.237 ± 0.006
121.6 ± 2.6; 0.147 ± 0.004
124.4 ± 2.7; 0.164 ± 0.004
6TG-dC16 64.8 ± 1.2; 0.220 ± 0.007
73.8 ± 1.4; 0.275 ± 0.009
69.5 ± 1.3; 0.219 ±0.007
Table A2.10: LDC storage stability at RT in PBS buffer where the composition
was 90: 5: 5 (LDC monomer: DMPC: DSPE-PEG). The drug loading was 15
wt%.
LDC Day 1 Size(nm); PDI
Day 30 Size (nm); PDI
Day 60 Size (nm); PDI
6MP-C16 160.7 ± 3.7; 0.399 ± 0.004
230.8 ± 5.3; 0.413 ± 0.004
309.0 ± 7.1; 0.418 ± 0.004
6MP-dC16 126.8 ± 2.3; 0.406 ± 0.002
163.5 ± 3.0; 0.397 ± 0.002
123.3 ± 2.3; 0.353 ± 0.002
6TG-C16 134.8 ± 3.1; 0.408 ± 0.002
134.4 ± 3.1; 0.407 ± 0.002
139.6 ± 3.2; 0.413 ± 0.002
6TG-dC16 128.6 ± 7.4; 0.413 ± 0.004
126.8 ± 7.3; 0.401 ± 0.004
199.8 ± 11.5; 0.433 ± 0.004
Table A2.11: LDC storage stability at RT in PBS buffer with 10% serum where
the composition was 90: 5: 5 (LDC monomer: DMPC: DSPE-PEG). The drug
loading was 15 wt%.
84

LDC Day 1 Size(nm); PDI
Day 2 Size(nm); PDI
Day 3 Size (nm); PDI
6MP-C16 216.7 ± 7.7; 0.288 ± 0.004
262.1 ± 5.0; 0.208 ± 0.007
260.5 ± 2.5 ; 0.221 ± 0.010
6MP-dC16 80.9 ± 0.9; 0.277 ± 0.003
101.5 ± 4.2; 0.315 ± 0.007
95.0 ± 4.1; 0.309 ± 0.008
6TG-C16 102.2 ± 2.2; 0.237 ± 0.006
189.3 ± 5.7; 0.208 ± 0.011
182.5 ± 0.7; 0.173 ± 0.005
6TG-dC16 64.8 ± 1.2; 0.220 ± 0.007
72.9 ± 1.9; 0.251 ± 0.003
76.3 ± 1.8; 0.258 ± 0.013
Table A2.12: LDC storage stability at 37 ᵒC in PBS buffer where the composition
was 90: 5: 5 (LDC monomer: DMPC: DSPE-PEG). The drug loading was 15
wt%.
LDC Day 1 Size(nm); PDI
Day 2 Size(nm); PDI
Day 3 Size (nm); PDI
6MP-C16 160.7 ± 3.7; 0.399 ± 0.004
189.3 ± 2.3; 0.393 ± 0.003
186.0 ± 1.3; 0.402 ± 0.008
6MP-dC16 126.8 ± 2.3; 0.406 ± 0.002
139.6 ± 16.8; 0.379 ± 0.001
134.4 ± 2.6; 0.388 ± 0.005
6TG-C16 134.8 ± 3.1; 0.408 ± 0.002
143.3 ± 7.1; 0.378 ± 0.008
139.2 ± 3.0; 0.388 ± 0.004
6TG-dC16 128.6 ± 7.4; 0.413 ± 0.004
154.3 ± 15.1; 0.387 ± 0.001
155.4 ± 2.8; 0.375 ± 0.004
Table A2.13: LDC storage stability at 37 ᵒC in PBS buffer with 10% serum where
the composition was 90: 5: 5 (LDC monomer: DMPC: DSPE-PEG). The drug
loading was 15 wt%.
85

-1
14
13
12
11
10
98
76
54
32
10
ppm
0.8781.2611.4791.621
2.326
3.278
4.0494.066
7.258
5.995
38.9005.809
4.042
1.037
4.000
86Appendix 3: 1H-NMR and 13C-NMR for the Synthesized Compounds

220
200
180
160
140
120
100
80
60
40
20
ppm
14.0722.6624.9129.1329.2329.3229.4429.5729.6131.8934.1649.30
65.80
173.58
87

-1
13
12
11
10
98
76
54
32
10
ppm
0.869
1.244
1.607
2.318
3.277
4.0464.061
7.250
6.104
51.065
4.051
4.066
1.000
4.055
88

220
200
180
160
140
120
100
80
60
40
20
ppm
14.3222.9025.1529.3729.4729.5729.6829.8229.8729.9032.1434.3949.53
65.97
77.20
173.83
89

-1
14
13
12
11
10
98
76
54
32
10
ppm
0.8581.2371.4471.573
2.340
3.263
4.0394.058
7.259
12.008
39.3187.988
1.996
1.001
4.000
90

220
200
180
160
140
120
100
80
60
40
20
ppm
14.0014.0422.5622.6127.4027.4529.1829.2329.3929.5331.6331.8132.3845.6949.4353.3665.54
176.23
91

-1
13
12
11
10
98
76
54
32
10
ppm
0.887
1.263
1.626
2.339
3.302
4.0674.089
7.280
6.220
58.861
4.057
0.958
4.068
92

220
200
180
160
140
120
100
80
60
40
20
ppm
14.3222.9025.1429.3829.4829.5729.6929.8329.8729.9132.1434.3849.57
65.76
77.23
173.80
93

-1
13
12
11
10
98
76
54
32
10
ppm
0.870
1.2481.585
2.311
3.248
4.1194.2414.459
7.0167.267
12.296
83.681
7.956
3.911
4.0093.9832.000
1.709
94

220
200
180
160
140
120
100
80
60
40
20
ppm
14.3122.8925.1229.3829.5029.5629.7129.8729.8932.1334.3248.0452.7762.87
77.24
170.78174.00
95

-1
13
12
11
10
98
76
54
32
10
ppm
0.890
1.2651.603
2.331
3.269
4.1414.2624.473
7.0347.280
11.976
98.649
8.001
4.000
4.0573.9832.156
1.885
96

220
200
180
160
140
120
100
80
60
40
20
ppm
14.3022.8925.1029.3729.5029.5629.7129.9032.1334.3148.0052.72
62.84
77.26
170.80173.97
97

-1
13
12
11
10
98
76
54
32
10
ppm
0.8621.2411.4481.562
2.341
3.229
4.1074.2504.455
7.0727.275
23.721
78.38515.971
3.978
3.851
3.8493.8442.000
1.652
98

220
200
180
160
140
120
100
80
60
40
20
ppm 25.23
27.3627.4129.0129.1829.2529.3929.5429.6431.5331.6231.8132.2232.2632.5032.7032.8534.4634.6245.6148.0452.5862.26
170.38
176.38
99

-1
13
12
11
10
98
76
54
32
10
ppm
0.875
1.251
1.601
2.317
3.255
4.1294.2504.462
7.0737.267
12.054
115.0877.926
8.038
3.950
3.9924.0402.000
1.753
100

220
200
180
160
140
120
100
80
60
40
20
ppm
14.3122.9025.1229.3929.5129.5729.7229.9232.1434.3448.0652.78
62.88
170.75174.00
101

-1
13
12
11
10
98
76
54
32
10
ppm
1.2471.4011.5041.6672.2132.540
2.965
8.5758.844
9.9064.0762.000
2.064
2.163
0.9810.920
102

220
200
180
160
140
120
100
80
60
40
20
0ppm
24.4627.6328.1128.4928.6628.7833.6438.1339.52
151.67
174.45
103

-1
13
12
11
10
98
76
54
32
10
ppm
1.2101.3451.4621.6212.1672.499
2.900
6.445
7.976
9.6513.8991.892
2.046
2.000
1.579
0.878
104

220
200
180
160
140
120
100
80
60
40
20
0ppm
24.4627.7028.0228.5228.6828.8033.6438.1039.50
140.09
156.90159.88
174.47
105

-1
13
12
11
10
98
76
54
32
10
ppm
0.8851.1231.2611.661
2.2182.322
2.915
4.1134.2934.517
6.026
8.219
8.904
6.17455.728
2.0184.011
1.970
2.1662.0320.919
0.974
0.935
1.000
106

-1
13
12
11
10
98
76
54
32
10
ppm
0.8661.1721.2381.654
2.1982.304
2.907
4.0904.2624.499
6.050
8.293
8.908
12.881
5.935
64.678
2.0874.093
2.000
2.0262.0911.032
0.907
0.886
0.963
0.729
107

220
200
180
160
140
120
100
80
60
40
20
ppm 22.89
25.1025.9228.3228.6929.1429.3629.4829.5629.6929.8329.8729.9032.1334.3236.9239.2947.9662.93
131.37
141.97
149.89152.56
160.53
173.75174.06
108

-1
13
12
11
10
98
76
54
32
10
ppm
0.8461.1621.2201.4151.5481.6802.1682.3242.897
4.0944.2574.476
5.973
7.255
8.293
8.895
12.804
11.964
49.52113.857
1.9142.189
2.000
2.0371.9921.043
0.900
0.958
1.016
0.737
109

220
200
180
160
140
120
100
80
60
40
20
ppm
25.5927.3927.4428.1728.5528.9429.1729.2329.3929.5329.6531.6231.8032.0432.2736.6939.1245.6348.0162.41
142.02
152.22
173.31176.54
110

-1
13
12
11
10
98
76
54
32
10
ppm
0.8681.1461.2401.5931.6832.1972.305
2.900
4.0884.2644.495
6.008
7.267
8.267
8.908
6.100
72.008
6.525
2.1243.967
1.993
1.9582.0581.000
0.791
0.894
0.881
111

220
200
180
160
140
120
100
80
60
40
20
ppm 24.85
25.6428.0428.4328.8529.0029.0729.1229.2429.3229.4529.6329.6731.8934.0836.6739.1147.7162.6876.99
152.31
173.50173.81
112

-1
13
12
11
10
98
76
54
32
10
ppm
0.8761.1781.2491.5891.6842.1832.315
2.882
4.1164.2894.518
5.311
6.096
7.269
7.922
5.958
54.199
6.373
2.0003.901
1.923
1.9761.9200.961
1.428
0.910
0.872
113

220
200
180
160
140
120
100
80
60
40
20
ppm 25.83
28.3128.6629.1029.2529.2929.3529.4129.4729.5629.6829.8329.8529.8832.1234.3336.8739.4147.9363.01
139.60
159.65
173.69174.10
114

-1
13
12
11
10
98
76
54
32
10
ppm
0.8721.1651.2441.5961.6772.1692.314
2.873
4.1094.2884.507
5.247
6.082
7.267
7.870
11.228
5.915
61.5697.307
2.1154.112
1.907
2.0792.0321.000
1.715
0.856
0.873
0.739
115

220
200
180
160
140
120
100
80
60
40
20
ppm 24.85
25.5928.0528.3928.8528.9829.0329.1229.2429.3229.4529.6329.6631.8934.0936.6339.1547.6962.78
159.42
173.45173.88
116

-1
13
12
11
10
98
76
54
32
10
ppm
0.8631.1581.2401.4521.5651.6822.1512.3462.871
4.1244.3034.499
5.202
6.055
7.883
12.39453.20413.739
2.0422.090
2.000
2.0101.9981.051
1.730
0.792
0.945
117

220
200
180
160
140
120
100
80
60
40
20
ppm
27.4027.4528.0428.3728.8428.9729.0129.0529.1929.2529.4129.5529.6731.6331.8232.2936.6339.1245.6647.9962.55
159.40
173.29176.65
118

-1
13
12
11
10
98
76
54
32
10
ppm
0.869
1.2441.595
2.3082.513
3.3843.6404.0704.1624.408
7.267
6.364
42.3994.022
4.1943.983
5.937371.107
4.0000.902
119

-1
13
12
11
10
98
76
54
32
10
ppm
0.869
1.2481.592
2.3072.507
3.3673.6334.0694.1644.404
6.5306.656
7.267
6.259
49.9803.798
4.0004.023
4.659267.672
2.0892.0521.067
0.9011.030
120

-1
14
13
12
11
10
98
76
54
32
10
ppm
0.8681.2461.4501.574
2.3362.516
3.3753.6394.0444.1924.404
6.7086.755
12.350
43.0378.435
2.1884.000
3.903210.282
2.1332.1031.178
1.950
121

-1
13
12
11
10
98
76
54
32
10
ppm
0.868
1.245
1.613
2.3092.506
3.3703.6364.0704.1644.406
6.6086.692
7.267
6.088
56.216
4.0004.011
5.730332.602
1.9172.0431.070
0.8130.962
122

-1
14
13
12
11
10
98
76
54
32
10
ppm
0.862
1.239
2.2882.3132.525
3.3633.6293.8854.2584.393
12.168
80.812
7.9934.146
4.152223.559
14.3752.000
123

-1
14
13
12
11
10
98
76
54
32
10
ppm
0.864
1.237
2.2872.3122.528
3.3633.6283.8794.2594.381
12.044
93.107
7.8024.179
4.681257.629
13.7132.000
124

-1
14
13
12
11
10
98
76
54
32
10
ppm
0.8451.2211.4291.535
2.3122.515
3.350
3.8714.2234.397
6.4746.6636.7377.244
24.256
83.10115.658
4.0293.950
4.561250.714
13.6432.000
125

-1
14
13
12
11
10
98
76
54
32
10
ppm
0.868
1.238
2.2882.3182.529
3.3683.6323.8904.2724.389
12.924
112.343
8.0004.014
5.288318.193
13.7112.125
126