sysmax risk management pptx
TRANSCRIPT

Risk Management

Risk Management Objectives
• Reduce waste (non productive time / cost)
• Communicate risk and likely costs to management
• Evaluate options and choose the best• Evaluate options and choose the best
– Cost / Time / Productivity / Safety
• Integrate wells, facilities and reservoir risk to achieve optimal development

Track Record Over 250 projects Indicative Examples
• ERD vs Subsea vs MMFP– Harding (BP), Claymore (Talisman), Tilapia (Ranger Congo), Zhoa Dong
(Apache China), Espoire (Ranger Cote d’Ivoire)
• Conceptual Field Design Optimisation– Jasmine (ConocoPhillips), Shiehallion & Foinavon (BP)
• Well design / planning optimisation– Tartan, Auk, Burghley, Gyda, South Angsi (Malaysia) (Talisman)– Tartan, Auk, Burghley, Gyda, South Angsi (Malaysia) (Talisman)– Erskine workover (Total)– Nini (Dong – Denmark)
• Potential major incident (confidential)– Shut in production for riser replacement or not?– Commence relief well or not?– Deepwater Xmas tree deployment (Total Dalian Angola)
• Risk Based Well cost estimation – custom build Tullow Oil, • >100 field acquisitions

Products & Services
Risk identificationProbability of occurrenceImpact assessment
Risked cost estimation
Risk based economic evaluationValue optimisation
Monte Carlo based decision treeOption comparisons

Risk Management Toolbox
Risk Management
Risked Well Cost Estimation
Risk Based Option Analysis
Optimise asset performance
www.sysmax.com

Product Details
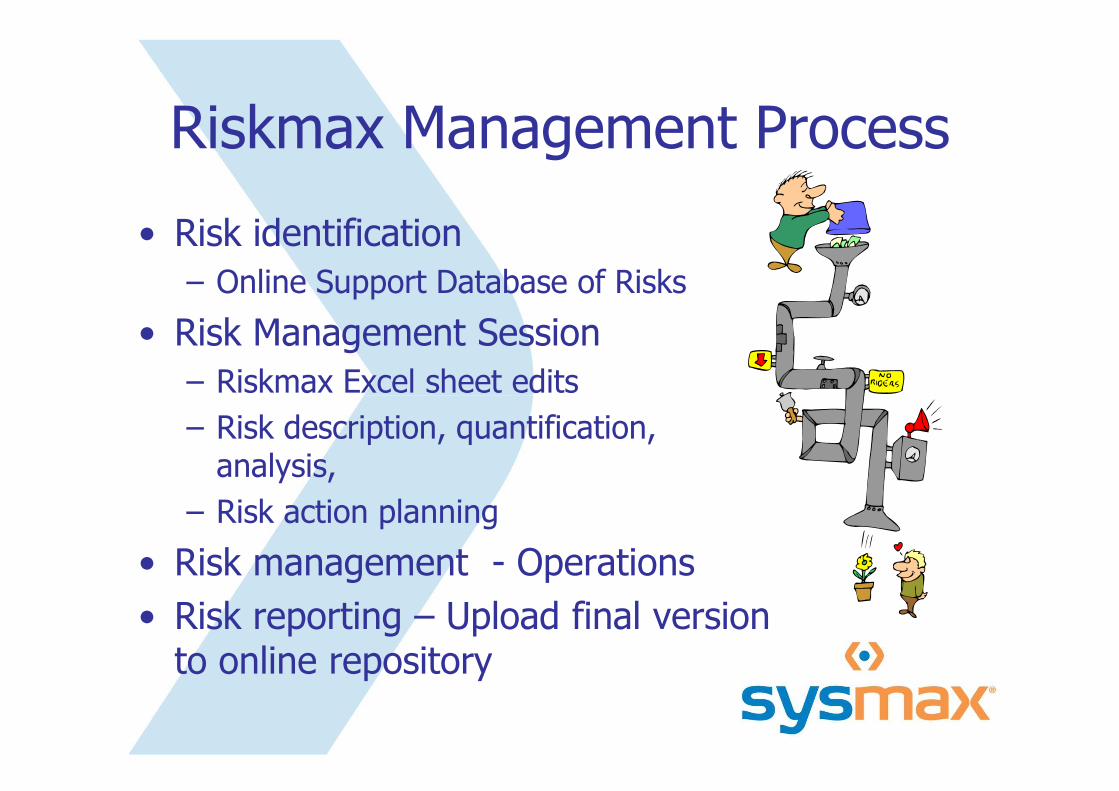
Riskmax Management Process
• Risk identification
– Online Support Database of Risks
• Risk Management Session
– Riskmax Excel sheet edits– Riskmax Excel sheet edits
– Risk description, quantification, analysis,
– Risk action planning
• Risk management - Operations
• Risk reporting – Upload final version to online repository
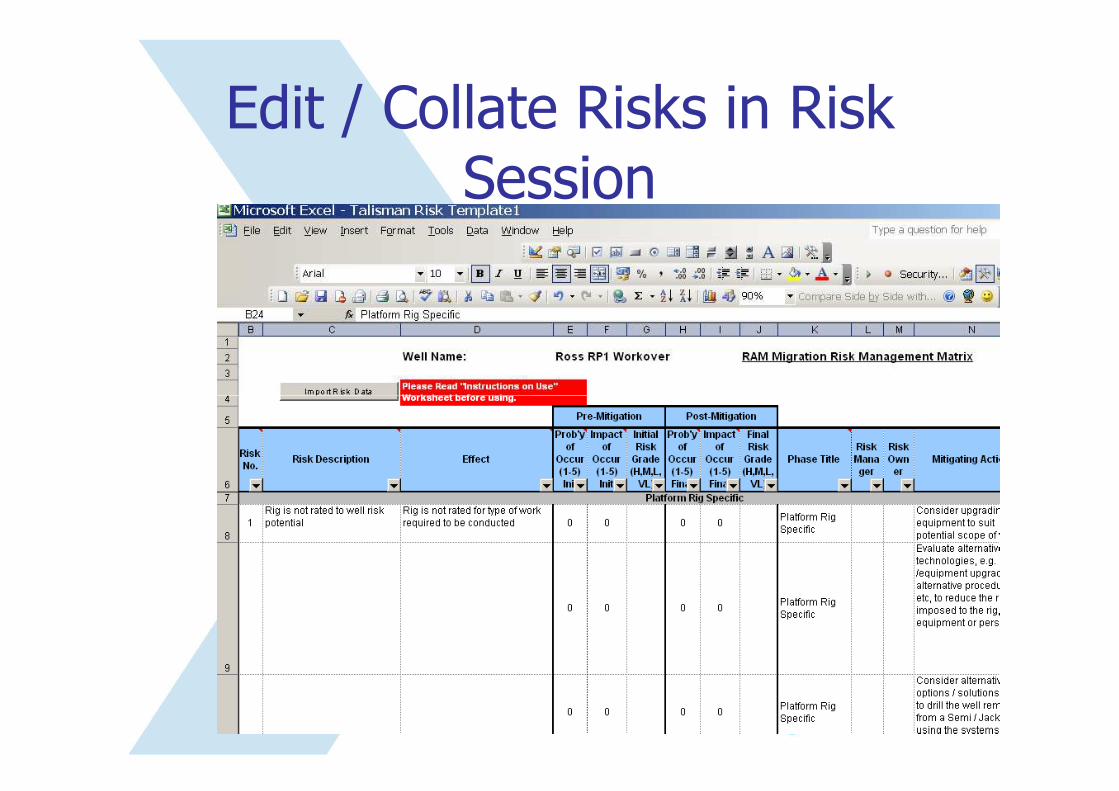
Edit / Collate Risks in Risk Session
Produce Reports
• Tornado Charts
• Boston Square
• Management Reports
– Comparison of projects– Comparison of projects
20 July 2010 PAGE 9

Tornado Chart

Boston Square

Management Monitoring
Drillmax Risked Well Cost Estimation
• First Monte Carlo Well Cost Estimation Simulator
• Excel & Crystal Ball based
• Produces AFE & Budget level cost • Produces AFE & Budget level cost estimates
• Daily cost estimate capture & comparison with predicted costs

Drillmax

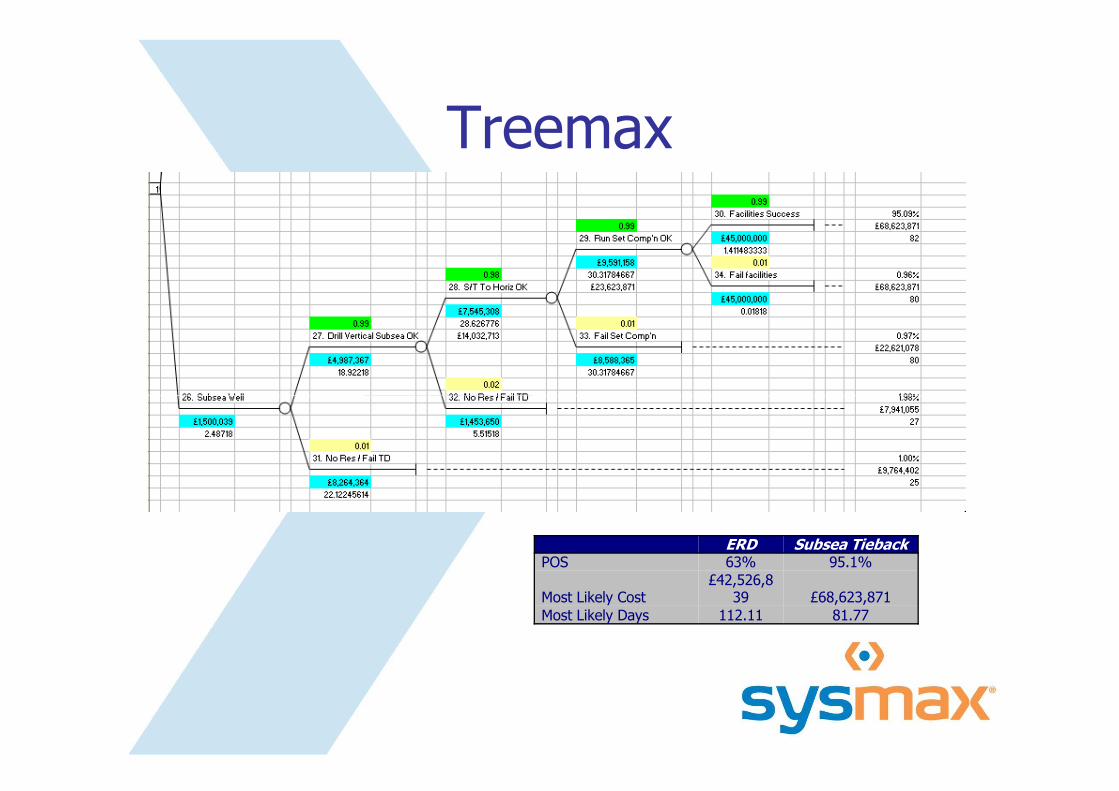
Treemax Risked Option Analysis Tool
• Monte Carlo simulator behind a modified decision tree
• End results of each branch represent
– chances of getting there – chances of getting there
– likely costs / time / impact
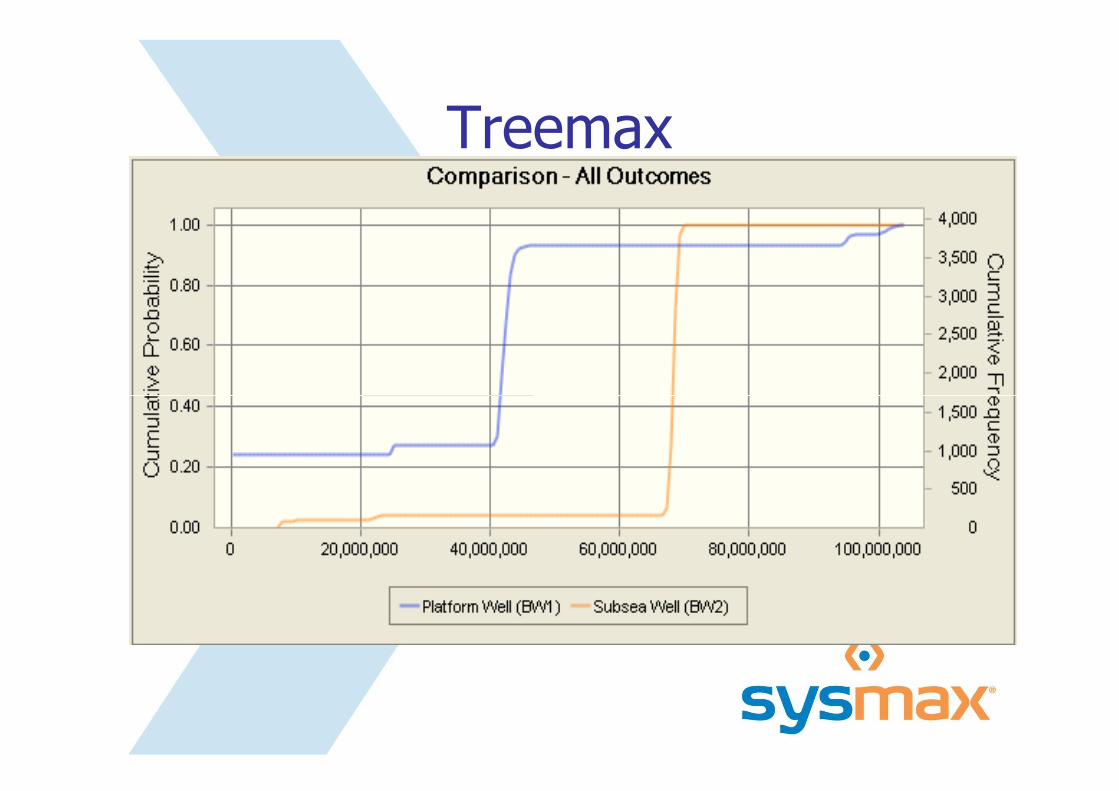
• Graphical comparison of all options against each other
Treemax
ERD Subsea TiebackPOS 63% 95.1%
Most Likely Cost£42,526,8
39 £68,623,871
Most Likely Days 112.11 81.77

0.996. Facilities Success 63.02%
0.99 £42,526,8395. Run Set Comp'n OK £250,000 112
0.01818£6,794,798 0.01
0.95 40.07784667 8. Fail Facilities 0.64%4. Drill 8 1/2" OK 112.0773053 £42,776,839
£500,000 115£2,432,652 3.394784167
16.70949333 0.01£10,482,041 7. Fail Set Comp'n 0.64%
72 £43,487,413£8,005,372 118
46.129836670.99
30. Facilities Success 3.22%0.99 £101,673,222
0.95 29. Run Set Comp'n OK £45,000,000 1593. Drill 12 1/4" OK 1.411483333
£9,591,158 0.01£6,198,541 0.98 30.31784667 34. Fail facilities 0.03%42.5767853 28. S/T To Horiz OK £101,673,222
£45,000,000 158£7,545,308 0.01818
0.99 28.62677597 0.0127. Drill Vertical Subsea OK 33. Fail Set Comp'n 0.03%
£55,670,429£4,987,367 £8,588,365 158
18.92218 30.317846670.05 0.02
9. Fail Drill 8 1/2" 32. No Res / Fail TD 0.07%£40,990,406
£1,500,000 £1,453,650 10424.41616 5.51518
0.010.95 31. No Res / Fail TD 0.03%
2. Slot Recovery OK £42,813,754£8,264,364 102
£1,850,848 22.1224561412.71318 0.99
30. Facilities Success 3.39%0.99 £95,474,681
29. Run Set Comp'n OK £45,000,000 1381.411483333
£9,591,158 0.010.98 30.31784667 34. Fail facilities 0.03%
28. S/T To Horiz OK £95,474,681£45,000,000 136
£7,545,308 0.01818£7,545,308 0.018180.75 0.99 28.62677597 0.01
1. Platform Well 27. Drill Vertical Subsea OK 33. Fail Set Comp'n 0.03%£49,471,888
£25,000,000 £4,987,367 £8,588,365 1360.01818 18.92218 30.31784667
0.05 0.0216. Fail Drill 12 1/4" 32. No Res / Fail TD 0.07%
£34,791,865£1,500,000 £1,453,650 8345.7808367 5.51518
0.0131. No Res / Fail TD 0.04%
£36,615,212£8,264,364 81
22.122456140.05
25. Slot Recovery Fail 3.75%£25,000,000
£0 161 16.16083667
0 0.9930. Facilities Success 95.09%
0.99 £68,623,87129. Run Set Comp'n OK £45,000,000 82
1.411483333£9,591,158 0.01
0.98 30.31784667 34. Fail facilities 0.96%28. S/T To Horiz OK £23,623,871 £68,623,871
£45,000,000 80£7,545,308 0.01818
0.99 28.626776 0.0127. Drill Vertical Subsea OK £14,032,713 33. Fail Set Comp'n 0.97%
£22,621,078£4,987,367 £8,588,365 80
18.92218 30.317846670.02
26. Subsea Well 32. No Res / Fail TD 1.98%£7,941,055
£1,500,039 £1,453,650 272.48718 5.51518
0.0131. No Res / Fail TD 1.00%
£9,764,402£8,264,364 25
22.12245614
Treemax

Treemax

Fieldmax Risked Economic Evaluation Tool
• Comparison of cost and revenues for different scenarios:
– Risked:
• Well costs, production profiles, facilities costs, oil • Well costs, production profiles, facilities costs, oil prices, chances of success / productivity
– Produces:
• Risked NPV, IRR, Reserves
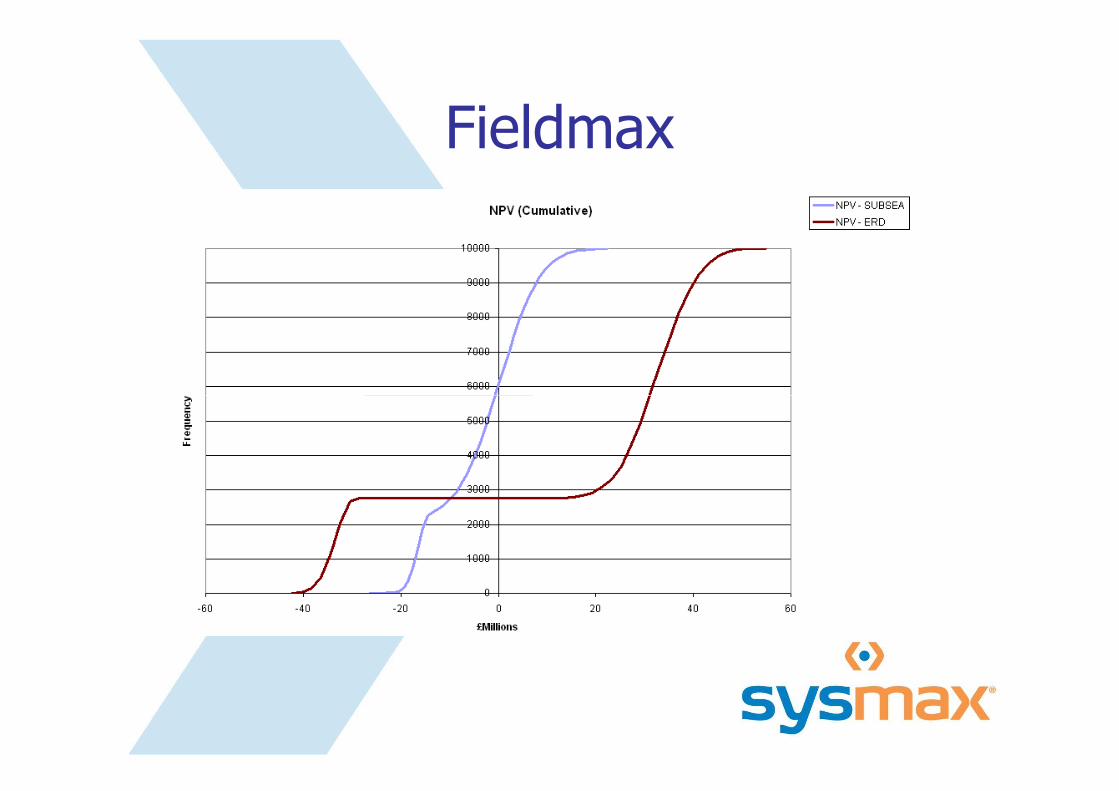
Fieldmax

Discounted Profitability Index

Fieldmax