system 800xa information management - abb group · pdf file · 2017-03-01system...
TRANSCRIPT

Power and productivity
for a better worldTM
System 800xA Information ManagementProfile Historian Operation
System Version 6.0


System 800xA Information ManagementProfile Historian Operation
System Version 6.0

NOTICEThis document contains information about one or more ABB products and may include a descriptionof or a reference to one or more standards that may be generally relevant to the ABB products. Thepresence of any such description of a standard or reference to a standard is not a representation thatall of the ABB products referenced in this document support all of the features of the described or ref-erenced standard. In order to determine the specific features supported by a particular ABB product,the reader should consult the product specifications for the particular ABB product.
ABB may have one or more patents or pending patent applications protecting the intellectual propertyin the ABB products described in this document.
The information in this document is subject to change without notice and should not be construed asa commitment by ABB. ABB assumes no responsibility for any errors that may appear in this document.
Products described or referenced in this document are designed to be connected, and to communicateinformation and data via a secure network. It is the sole responsibility of the system/product owner toprovide and continuously ensure a secure connection between the product and the system networkand/or any other networks that may be connected.
The system/product owners must establish and maintain appropriate measures, including, but not lim-ited to, the installation of firewalls, application of authentication measures, encryption of data, installa-tion of antivirus programs, and so on, to protect the system, its products and networks, against securitybreaches, unauthorized access, interference, intrusion, leakage, and/or theft of data or information.
ABB verifies the function of released products and updates. However system/product owners are ulti-mately responsible to ensure that any system update (including but not limited to code changes, con-figuration file changes, third-party software updates or patches, hardware change out, and so on) iscompatible with the security measures implemented. The system/product owners must verify that thesystem and associated products function as expected in the environment they are deployed.
In no event shall ABB be liable for direct, indirect, special, incidental or consequential damages of anynature or kind arising from the use of this document, nor shall ABB be liable for incidental or conse-quential damages arising from use of any software or hardware described in this document.
This document and parts thereof must not be reproduced or copied without written permission fromABB, and the contents thereof must not be imparted to a third party nor used for any unauthorized pur-pose.
The software or hardware described in this document is furnished under a license and may be used,copied, or disclosed only in accordance with the terms of such license. This product meets the require-ments specified in EMC Directive 2004/108/EC and in Low Voltage Directive 2006/95/EC.
TRADEMARKSAll rights to copyrights, registered trademarks, and trademarks reside with their respective owners.
Copyright © 2003-2016 by ABB. All rights reserved.
Release: September 2016Document number: 3BUF001121-600 A
3BUF001121-600 A 5
Table of Contents
About this User ManualGeneral ..........................................................................................................................9
User Manual Conventions ...............................................................................................10
Warning, Caution, Information, and Tip Icons................................................................10
Terminology.....................................................................................................................11
Released User Manuals and Release Notes.....................................................................11
Section 1 - Introduction
Section 2 - InstallationIntroduction .....................................................................................................................21
Profile Historian Client Installation Procedure ...............................................................21
Post Installation Procedure ..............................................................................................23
Connecting and Uploading the Accuray Object Server...................................................24
Section 3 - Application Start-upRunning the Profile Historian Client in Internet Explorer ..............................................31
Running the Profile Historian Client in Display Services ...............................................33
Section 4 - ConfigurationConfiguring Profile Specifications ..................................................................................38
Changing Default Colors for Profile Specifications ........................................................44
Specifying the Log List for Manual Entry ......................................................................45
Section 5 - OperationContourMDCD View.......................................................................................................58
Contour Map ........................................................................................................59

Table of Contents
6 3BUF001121-600 A
Cross Hair Control .............................................................................. 60
Zooming ...................................................................................... 61
Showing the Roll/Set Grid .................................................................. 62
Zooming On a Roll or Set................................................................... 63
Viewing/Modifying the ROLLSetup................................................... 64
Grade Status ...................................................................................... 69
Tool Bar ...................................................................................... 70
Machine Direction ............................................................................................... 70
Ruler ...................................................................................... 71
Tool Bar ...................................................................................... 72
Cross Direction .................................................................................................... 74
Ruler ...................................................................................... 75
Tool Bar ...................................................................................... 76
Legend ............................................................................................................ 77
3MDScanAverage View .................................................................................................. 79
3CDScanAverage View................................................................................................... 80
2ContourLegend View .................................................................................................... 81
Single View ..................................................................................................................... 82
Customizing Your View .................................................................................................. 84
Working with Queries .......................................................................................... 84
Filtering Queries ................................................................................. 85
Filter Query By Machine .................................................................... 86
Querying Between Specified Start and End Times............................. 87
Querying By Specified Time Range ................................................... 88
Querying By Name ............................................................................. 90
Custom Queries for Archive Data....................................................... 91
Executing a Manual Data Query......................................................... 92
Applying a History Profile Specification............................................................. 93
Making Ad-hoc Adjustments to the Profile View................................................ 94
Adjusting the Quality Measurement Range........................................ 95
Changing Contour Level Ranges and Colors...................................... 96
Zooming ............................................................................................................ 98

Table of Contents
3BUF001121-600 A 7
7
Section 6 - PDL Access for Profile HistorianPDL Tasks ....................................................................................100
Task Variables ...................................................................................101
Task / History Log Associations ........................................................................102
SQL Access for PDL Data ............................................................................................104
Query for Task Variables....................................................................................104
Finding Task IDs for all Reels/Grades/Dayshifts..............................104
Query for History Associations..........................................................................105
Accessing Archived Data ...................................................................................106
Tables and Views for Restored Archive Data ................................................................108
TASK Table Attributes ..................................................................................................109
TASK_VARIABLE Table Attributes.............................................................................112
TASK_VARIABLES_OCCURRENCES Table Attributes ...........................................113
HISTORY_ASSOCIATIONS Table Attributes .............................................................115
HISTORY_ASSOC_OCC_START Table Attributes ....................................................117
HISTORY_ASSOC_OCC_END Table Attributes ........................................................118
MODIFICATIONS_ATTRIBUTES Table Attributes ...................................................120
PDL_TASK_VIEW Table Attributes ............................................................................122
PDL_VARIABLE_VIEW Table Attributes...................................................................124
PDL_HISTORY_VIEW Table Attributes .....................................................................126
Revision HistoryIntroduction ...................................................................................................................129
Revision History ............................................................................................................129
Updates in Revision Index A.........................................................................................129
Index

Table of Contents
8 3BUF001121-600 A
3BUF001121-600 A 9
About this User Manual
General
This User Manual describes how to use the Profile Historian Client to view quality measurement profiles for flat-sheet manufacturing applications. The History Profile client is part of the Profile Historian software suite. The Profile Historian server collects quality measurements for reel turn-up and product grade change reports. Client displays let you view quality profiles with industry-standard Contour Maps, Machine Direction (MD) graphs, and Cross Direction (CD) graphs.
This User Manual is not the sole source of instruction for Profile Historian. It is recommended that Profile Historian users attend the applicable training courses offered by ABB. The following is a brief overview of the contents of this User Manual.
Learning About Profiles Client Functionality
For an overview of the Profile Historian architecture and functionality, refer to Product Overview on page 13.
Any security measures described in this User Manual, for example, for user access, password security, network security, firewalls, virus protection, etc., represent possible steps that a user of an 800xA System may want to consider based on a risk assessment for a particular application and installation. This risk assessment, as well as the proper implementation, configuration, installation, operation, administration, and maintenance of all relevant security related equipment, software, and procedures, are the responsibility of the user of the 800xA System.

User Manual Conventions About this User Manual
10 3BUF001121-600 A
Application Start-up
You can run the Profile Historian client in Internet Explorer, or in Display Services. For details see Section 3, Application Start-up.
Customizing and Optimizing Your User Interface
You can configure profile specifications to optimize the measurement range, number of contour (quality) levels, and color-coding for specific quality measurements. This and other set-up considerations are described in Section 4, Configuration.
Viewing History Profiles
A quick tutorial for viewing profile client displays is provided in Viewing Profiles - Basic Procedure on page 49. To learn about viewing options for customizing the history profile view, refer to Customizing Your View on page 84.
User Manual ConventionsMicrosoft Windows conventions are normally used for the standard presentation of material when entering text, key sequences, prompts, messages, menu items, screen elements, etc.
Warning, Caution, Information, and Tip IconsThis publication includes Warning, Caution, and Information where appropriate to point out safety related or other important information. It also includes Tip to point out useful hints to the reader. The corresponding symbols should be interpreted as follows:
Electrical warning icon indicates the presence of a hazard which could result in electrical shock.
Warning icon indicates the presence of a hazard which could result in personal injury.

About this User Manual Terminology
3BUF001121-600 A 11
Although Warning hazards are related to personal injury, and Caution hazards are associated with equipment or property damage, it should be understood that operation of damaged equipment could, under certain operational conditions, result in degraded process performance leading to personal injury or death. Therefore, fully comply with all Warning and Caution notices.
TerminologyA complete and comprehensive list of Terms is included in System 800xA System Guide Functional Description (3BSE038018*). The listing includes terms and definitions that apply to the 800xA System where the usage is different from commonly accepted industry standard definitions and definitions given in standard dictionaries such as Webster’s Dictionary of Computer Terms.
Released User Manuals and Release NotesA complete list of all User Manuals and Release Notes applicable to System 800xA is provided in System 800xA Released User Manuals and Release Notes (3BUA000263*).
System 800xA Released User Manuals and Release Notes (3BUA000263*) is updated each time a document is updated or a new document is released. It is in pdf format and is provided in the following ways:
• Included on the documentation media provided with the system and published to ABB SolutionsBank when released as part of a major or minor release, Service Pack, Feature Pack, or System Revision.
Caution icon indicates important information or warning related to the concept discussed in the text. It might indicate the presence of a hazard which could result in corruption of software or damage to equipment/property.
Information icon alerts the reader to pertinent facts and conditions.
Tip icon indicates advice on, for example, how to design your project or how to use a certain function

Released User Manuals and Release Notes About this User Manual
12 3BUF001121-600 A
• Published to ABB SolutionsBank when a User Manual or Release Note is updated in between any of the release cycles listed in the first bullet.
Table 1 lists all documentation related to Profile Historian.
A product bulletin is published each time System 800xA Released User Manuals and Release Notes (3BUA000263*) is updated and published to ABB SolutionsBank.
Table 1. Related Documentation
Title Description
System 800xA Information Management Configuration (3BUF001092*)
Provides an overview of the Profile Historian function in the 800xA system and describes how to use History Services software to configure profile logs and reel/grade reports.
System 800xA Information Management Data Access and Reports (3BUF001094*)
Describes how to query for History Profile data using Open Data Access and add-ins to Microsoft Excel.

3BUF001121-600 A 13
Section 1 Introduction
Product OverviewHistory profiles are used to monitor critical quality measurements in flat-sheet manufacturing applications. For instance, in the Pulp and Paper industry history profiles may be used to monitor basis weight and moisture content. Collection, storage and retrieval of the profile data is supported by the Profile Historian option for Information Management.
Profile Historian consists of three basic components - AccuRay Object Server, Profile Historian Server, and Profile Historian Client. Figure 1 illustrates how these components are integrated into your manufacturing application.
Quality measurements associated with reel turn-ups and grade changes are recorded by frames (scanners) on one or more machines. These measurements are routed via each machine’s dedicated controller to the AccuRay Object Server, where the measurements are consolidated in an OPC Database.
The Profile Historian Server contains the History Server and History database where the profile data is stored. History Services lets you configure profile logs which collect and store quality measurements from the Accuray Object Server.
Reel-turn ups, grade changes, and dayshift events for each machine are processed according to the Reel/Grade report which is created via the Reel Report Configuration Tool. The names, time stamps and other information associated with these events are stored in Production Data Logs (PDLs) in History. This information may be accessed by Information Management client applications such as DataDirect and Display Services, and by other reporting applications that support SQL queries.
The Profile Historian Client lets you view the quality measurements with industry-standard Contour Maps, Machine Direction (MD) graphs, and Cross Direction (CD) graphs.

Section 1 Introduction
14 3BUF001121-600 A
The AccuRay Object Server, Profile Historian Server, and Profile Historian Client applications all run on the Windows server operating system. These applications may be installed on the same PC or dedicated PCs. The Profile Historian Server must be installed on the Information Management Server.
Figure 1. Profile Historian Architecture
AccuRay
Profile Historian
Profile Logs in History Database
Reel/Grade ReportConfiguration
Profile Historian
ClientDisplays
Machines 1..n
Frame S1-1
AC 800MControllers Object
TCP/IP
1) Measurements Recordedby Frames are Routed toAccuray Object Server
2) Profile Logs on the Server 3) Client DisplaysAccess ProfileServer Collect and Store
Frame S1-2 Server
Server Client
Profile Data
1..n
Data
Profile Historian Application

Section 1 Introduction
3BUF001121-600 A 15
Configuring Data Collection and Storage for the History Profile Server
There are four aspects to configuring data collection and storage for your Profile Historian application:
• Configuring profile logs to collect and store quality measurements. The quality measurements are collected and stored in profile logs. These logs must be configured via the Information Management History application.
• Configuring reel-turn ups, grade changes, and dayshift events. The Reel/Grade Report configuration specifies reel turn-up, grade change, and dayshift events on a machine-by-machine basis. This report configuration must be created via the Reel Report Configuration Tool in Information Management History.
• Connecting the Profile Historian Server and AccuRay Object Server. The Profile Historian Server collects from the System 800xA OPC DA server. The AccuRay Object Server must be connected into the System 800xA OPC DA server as described in the applicable System 800xA documentation.
• Configuring PDL archive and maintenance. You can configure the History Services archive function to archive profile data on a timed basis, or you can perform manual archives. This includes the quality measurements stored in profile logs, as well as the reel and grade event information stored in PDLs. Profile log data is automatically archived with the corresponding PDL, therefore, you are only required to configure the PDL archive function for Profile Historian.
Also, reel/grade data stored in PDLs must be deleted when the profile data for the time range covered by the reel or grade is no longer available in the profile log. Again, this can be configured to occur on a timed basis, or you can perform this function manually.
These procedures are described in System 800xA Information Management Configuration (BUF001092*). For further information on how to access PDLs for Profile Historian applications, refer to Appendix A, Production Data Log Attributes.

Section 1 Introduction
16 3BUF001121-600 A
User InterfaceThe client displays are composed of a series of ActiveX controls that are displayed via Internet Explorer, Figure 2, or via Information Management Display Services. The main control is functionally divided into five areas: Navigator, Display Selector, Query Selector, Menu Bar, and Display Area.
Figure 2. Profile Historian User Interface in Internet Explorer
Internet Explorer
Profile Historian Client
Display Selector
Menu Bar
Display Area
Navigator
Query Selector

Section 1 Introduction
3BUF001121-600 A 17
Navigator
The Navigator shows the layout of machines, reels, and quality measurements in your mill. Use the Navigator to locate and select a quality measurement for viewing.
The navigator tree structure is configured via the Reel Report Configuration Tool as described in System 800xA Information Management Configuration (3BUF001092*).
Display Selector
This lets you select one of five History Profile displays:
• ContourMDCD View combines a Contour Map with two Cross Direction (CD) views, and two Machine Direction (MD) views. The same quality measurement is displayed in all views. This lets you monitor both the Profile and Average for a measurement on one display.
• 3CDScanAverage View - three CD views let you compare CD averages for three different quality measurements on three separate CD graphs.
• 3MDScanAverage View - three MD views let you compare MD averages for three different quality measurements on three separate MD graphs.
• 2ContourLegend View - two contour maps let you compare two different quality measurements on two separate contour maps.
• Single View - combines a Contour Map with one Cross Direction and one Machine Direction view.
Display Area
This area shows the display selected via the Display Selector.
Query Selector
The Query Selector contains a list of standard queries, as well as any custom queries that you create. Selecting a query from this list populates the quality measurement objects in the Navigator with data for the time range specified in the query.

Section 1 Introduction
18 3BUF001121-600 A
Menu Bar
• Configure > Profile Specification - displays the dialog for configuring a Profile Specification. See Configuring Profile Specifications on page 38.
• Configure > Query - displays the dialog for creating and executing custom queries for History Profile data. See Working with Queries on page 84.
• Configure > Options - displays the Settings dialog for customizing your application. See Section 4, Configuration.
• Help > Content - displays the on-line help for Profile Historian client.
Example History Profile
The most basic history profile display combines a contour map with two cross direction views and two machine direction views, Figure 3. The contour map shows a quality measurement over a specified time for a selected reel. Quality variations are indicated with color. You can set the quality range (upper/lower bounds), specify the number of distinguishable contour levels, and specify a color to identify each contour level. A cross-hair tool lets you point to a location on the contour map to display the corresponding value.

Section 1 Introduction
3BUF001121-600 A 19
The machine direction views provide an overhead view of the reel as the reel moves along the machine. These views use the same y-axis as the contour map. The Average view shows the average value for all data points at the time selected by the ruler. The Profile view shows the value of the data point selected by the contour map cross hair control. The x-axis shows the average and profile value ranges which are calculated for each quality measurement.
The cross direction views provide a side-to-side view of the reel. These views use the same x-axis as the contour map. The Average view shows the average value over the full time range for the data point selected by the ruler. The profile view shows
Figure 3. Example History Profile
Machine
Cross
Contour
Shared
DirectionViews
ViewsDirection Legend

Section 1 Introduction
20 3BUF001121-600 A
the data point value for the time selected by the contour map cross hair control. The y-axis shows the average and profile value ranges which are calculated for each quality measurement. Contour levels are indicated by color-coded dotted lines.
Apply & OK Buttons
Some dialogs have both an OK button and an Apply button. Use Apply when you want the dialog to remain open after you confirm your entries. This lets you continue to work with the dialog. Use OK when you want to close the dialog after confirming your entries.

3BUF001121-600 A 21
Section 2 Installation
IntroductionThis section describes how to install the Profile Historian client and integrate the Accuray Object server. The client must be installed on all Information Management server nodes, and may also be installed on PC clients where you want to run the Profile Historian displays. In addition to Operating Systems supported by system 800xA SV6.0, the Profiles Client can be installed on Windows client operating systems, professional or higher versions.
Profile Historian Client Installation ProcedureThe installation is provided with the System 800xA installation media, Figure 4.
1. Run ABB Inform IT - Profile Client.msi.
Figure 4. Locating the Executable for Information Management

Profile Historian Client Installation Procedure Section 2 Installation
22 3BUF001121-600 A
2. Click Install Now, Figure 5. The wizard indicates the progress of the install.
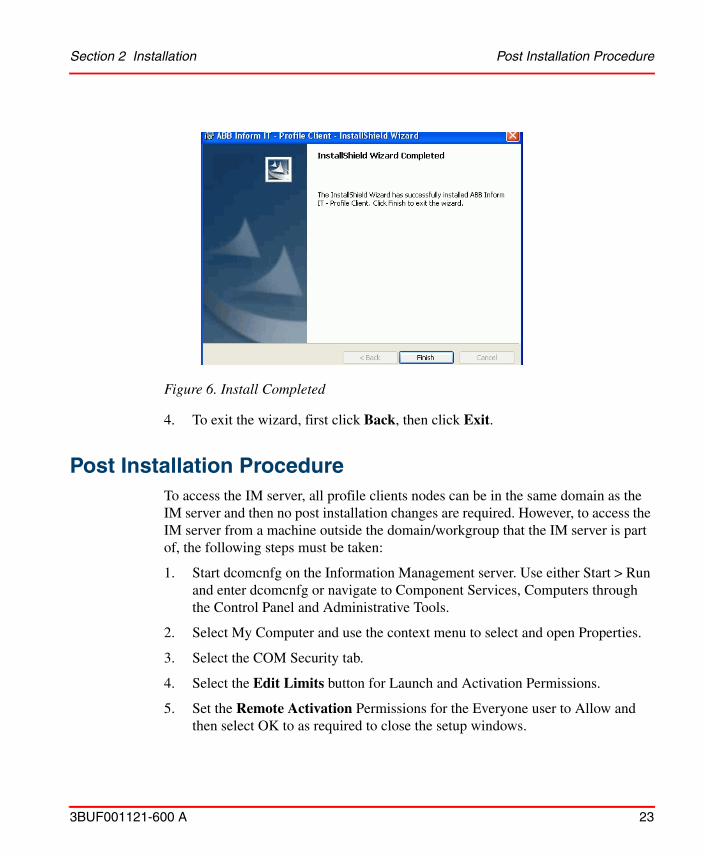
3. When the InstallShield Wizard Completed message is displayed, click Finish, Figure 6.
Figure 5. InstallShield Wizard
Section 2 Installation Post Installation Procedure
3BUF001121-600 A 23
4. To exit the wizard, first click Back, then click Exit.
Post Installation ProcedureTo access the IM server, all profile clients nodes can be in the same domain as the IM server and then no post installation changes are required. However, to access the IM server from a machine outside the domain/workgroup that the IM server is part of, the following steps must be taken:
1. Start dcomcnfg on the Information Management server. Use either Start > Run and enter dcomcnfg or navigate to Component Services, Computers through the Control Panel and Administrative Tools.
2. Select My Computer and use the context menu to select and open Properties.
3. Select the COM Security tab.
4. Select the Edit Limits button for Launch and Activation Permissions.
5. Set the Remote Activation Permissions for the Everyone user to Allow and then select OK to as required to close the setup windows.
Figure 6. Install Completed
Connecting and Uploading the Accuray Object Server Section 2 Installation
24 3BUF001121-600 A
6. Enable the guest user account on the Profile Historian server.
Once this is set, it is also necessary to create the 800xA service account on the Profiles Client. The service account name can be found on the Domain controller. Make sure the name is the same in case and the passwords are identical.
Connecting and Uploading the Accuray Object ServerThe Accuray Object server must be integrated into the 800xA system by:
• Establishing an OPC DA connection between the Profile Historian and Accuray Object servers.
• Uploading the profile objects from the Accuray Object server to the 800xA aspect directory.
• The Accuray Object Server user account (QCSApp) with the same password must be created on the 800xA System Connectivity Server. Also, the 800xA Service account must be created on the Accuray Object Server. If the Accuray Object Server is not in the 800xA System (outside the domain), these accounts must be created before continuing with the following procedure. Further, use a node where these accounts exist to complete this procedure.
To do this:

Section 2 Installation Connecting and Uploading the Accuray Object Server
3BUF001121-600 A 25
1. Create a Generic OPC Network object in the Control structure, Figure 7, then click Next.
Figure 7. Creating a Generic OPC network

Connecting and Uploading the Accuray Object Server Section 2 Installation
26 3BUF001121-600 A
2. Select the Profile Historian server as the Connectivity Server for the Accuray Object server. To do this (reference Figure 8):
a. Click Add in the Additional Arguments dialog.
b. Select the Profile Historian server from the Select Connectivity Servers list, then click OK.
c. Click Create in the Additional Arguments dialog.
This creates a service group/service provider object set for the network under the OpcDA Connector Service object in the Service structure.
Figure 8. Selecting the Connectivity Server

Section 2 Installation Connecting and Uploading the Accuray Object Server
3BUF001121-600 A 27
3. Specify the Accuray Object server. To do this (reference Figure 9):
a. Go to the Service structure and find the service group/service provider set for the Accuray Object server’s Generic OPC Network.
b. Select the service provider object and click the Special Configuration tab.
c. Enter the computer name or IP address for the Accuray Object server in the Remote OPC node field.
d. Click the Refresh button for the OPC server identity pick list. This populates the list with all OPC servers on the specified Accuray Object server.
e. Select Accuray.Object.Server.1 then click Apply.

Connecting and Uploading the Accuray Object Server Section 2 Installation
28 3BUF001121-600 A
4. Enable the Service Provider. On the Configuration tab, make sure the Profile Historian server is selected in the Server list, check Enable, and click Apply.
Figure 9. Establishing the OPC DA Connection to the Accuray Object Server

Section 2 Installation Connecting and Uploading the Accuray Object Server
3BUF001121-600 A 29
5. Upload the profile objects from the Accuray Object server (reference Figure 10):
a. In the Control structure, select the Generic OPC Network object created for the Accuray Object server.
b. Select the Uploader aspect.
c. Click Start.
Figure 10. Uploading the Profile Objects to the 800xA Aspect Directory
UploadedObjects
Uploader aspect

Connecting and Uploading the Accuray Object Server Section 2 Installation
30 3BUF001121-600 A

3BUF001121-600 A 31
Section 3 Application Start-up
You can run the Profile Historian client in Internet Explorer, or in Display Services. Before you launch the profile client, the client must be connected to the profile server as described in the profile client installation instructions in the Profile Historian Administrator’s Guide.
Running the Profile Historian Client in Internet ExplorerTo run the Profile Historian client in Internet Explorer, from the Windows task bar choose: ABB Start Menu > ABB Industrial IT 800xA >Information Management > Profiles > Profile Display,
If you need to open multiple client windows simultaneously, use File>Open in Internet Explorer to find and open the AdvProfOuterCtl.html file, Figure 11. Using Windows Explorer as described above will simply replace the current instance of the file with a new one in the same Internet Explorer window.

Running the Profile Historian Client in Internet Explorer Section 3 Application Start-up
32 3BUF001121-600 A
As an option, you may create a shortcut for the executable file AdvProfOuterCtl.html on your desktop. This file is located in C:\Program Files(x86)\ABB Industrial IT\InformIT\History\bin, Figure 11.
Figure 11. Navigating to the Executable File

Section 3 Application Start-up Running the Profile Historian Client in Display Services
3BUF001121-600 A 33
Running the Profile Historian Client in Display ServicesTo run the Profile Historian client in Display Services:
1. From the task bar, choose: ABB Start Menu >ABB Industrial IT 800xA>Information Management >Display Services >Client > IM Display Client
2. Enter the required information as described in Table 2, then click OK. This launches the Display Services client.
Figure 12. Display Services Client Log In Dialog

Running the Profile Historian Client in Display Services Section 3 Application Start-up
34 3BUF001121-600 A
3. Use the Display Client navigation tool to select and launch the Profile Client display. The path is localhost > Profiles > Profile Client, Figure 13.
Table 2. Login Information
Field Description
Language This field indicates the language for the user interface. You can use the pull-down menu to select a different language. To create additional language files, refer to the Managing Users for Display Services topic in System 800xA Information Management Configuration (3BUF001092*).
User Enter the user name in this field as defined during the IM configuration for Display services.The Browser and StatusBar are not visible, in order to provide a fullscreen display.
You can create additional users as required. For details, refer to the Managing Users for Display Services topic in System 800xA Information Management Configuration (3BUF001092*).
Password Enter the user password in the field as defined during the IM configuration. You can assign new passwords as required. For details, refer to the Managing Users for Display Services topic in System 800xA Information Management Configuration (3BUF001092*).
Host Enter the computer name for the PC where the Profile Historian server is installed. To find this, at the server PC, go to the Network Identification tab on the System Properties dialog (Settings>Control Panel>System).
Access The access mode determines the functionality you will be able to access. Enter the access mode corresponding to the level of functionality that you require:
• Build - This gives you access to both build and runtime functions.
• MDI Run- Multiple Document (Display) Interface. This gives you runtime access, and lets you run multiple displays at the same time.
• SDI Run- Single Document (Display) Interface. This also gives you runtime access; however, you can only run one display at a time.
• Additional - This is for starting applications that use Display Services as a container (meaning that the application’s objects and controls are accessible from the Display Services Object Browser).

Section 3 Application Start-up Running the Profile Historian Client in Display Services
3BUF001121-600 A 35
Figure 13. Launching the Profile Client Display

Running the Profile Historian Client in Display Services Section 3 Application Start-up
36 3BUF001121-600 A

3BUF001121-600 A 37
Section 4 Configuration
GeneralYou can use any of the configuration procedures described here to customize and optimize viewing of history profiles via the client displays.
Access to these configuration procedures is via the Profile Historian client menu bar. Therefore, the Profile Historian client must be running in order to perform these procedures. You can run the Profile Historian client in Internet Explorer, or in Display Services. Refer to Section 3, Application Start-up for details.
Configuring Profile SpecificationsA profile specification is a set of range, contour level, and color coding specifications for a specific quality measurement. It is recommended that you configure a profile specification for each type of quality measurement in your system. This optimizes the viewing parameters for the corresponding quality measurement. For details, see Configuring Profile Specifications on page 38.
Building a Log List for Manual QueriesManual Entry is a method for executing an ad-hoc query for profile data. This method requires you to enter the log name and time range corresponding to the quality measurement. The Log Name pick list in the Manual Entry dialog may be populated with a permanent list of log names and descriptions. If you don’t configure this list, you will be required to enter log names manually on an ad-hoc basis. The procedure for configuring the log list is described in Specifying the Log List for Manual Entry on page 45.

Configuring Profile Specifications Section 4 Configuration
38 3BUF001121-600 A
Configuring Profile SpecificationsA profile specification is a set of range, contour level, and color coding specifications for a specific quality measurement. When you view a quality measurement on a History Profile display, you typically apply the corresponding profile specification to optimize viewing for that measurement.
This specification sets the range (upper and lower bounds) for the quality measurement, the number of distinguishable contour levels within that range, and the color-coding for each contour level. It is recommended that you configure a dedicated profile specification for each type of quality measurement that your system uses.
To configure a Profile Specification:
1. Choose Configure>Profile Specifications from the Menu Bar, Figure 14.
This displays the Profile Specifications tree.
2. Click as shown in Figure 15 to expand the Profile Specification tree and show the profile specification folders. Specifications are grouped by customer and product.
Figure 14. Profile Specifications Context Menu
Figure 15. Profile Specification Folders
Clicking here alternatelyshows and hides the folders

Section 4 Configuration Configuring Profile Specifications
3BUF001121-600 A 39
3. Right click on either the CUSTOMER or PRODUCT folder and choose New Specification from the context menu, Figure 16.
This creates a new folder under the selected category, Figure 17. The folder represents a new product (or customer), and will store profile specifications for the quality measurements associated with that product (or customer).
Figure 16. Creating a New Specification
Figure 17. New Specification Represented in Profile Specifications Tree

Configuring Profile Specifications Section 4 Configuration
40 3BUF001121-600 A
4. Rename the new folder, for example: Paper-3, Figure 18.
5. Create a profile specification for a quality measurement associated with the product (or customer) that this folder represents.
To start, right click on the new folder and choose New Quality Measurement from the context menu, Figure 19.
6. As in step 4, give the new specification a meaningful name. After you press ENTER to accept the name, the PDL Specification Properties dialog is displayed, Figure 20.
Figure 18. Naming the New Specification
Figure 19. Adding a Quality Measurement

Section 4 Configuration Configuring Profile Specifications
3BUF001121-600 A 41
7. Use the Specification tab, Figure 20, to label the quality measurement, specify the number of contour levels and specify the upper and lower bounds.
Each contour level is assigned a color, based on the specification palette (configured as described in Changing Default Colors for Profile Specifications on page 44). At this point the profile specification is complete, unless you want to adjust the color or lower bounds for any contour levels.
Quality Measurement Enter a descriptive label.
Quality (Contour) Level Specify the number of distinguishable contour levels within the range for this quality measurement. The default span of each level is calculated by dividing range by the number of levels: (upper bound-lower bound)/no. of contour levels. Contour level ranges and colors are indicated on the Legend tab.
Upper & Lower Bounds The upper and lower bounds are integers that represent the highest and lowest possible values for the quality measurements.
The actual number of levels created is the specified number plus 1. For instance, if you enter 5, the number of levels created is 6.

Configuring Profile Specifications Section 4 Configuration
42 3BUF001121-600 A
8. Use the Legend tab, Figure 21, to adjust contour level specifications as needed.
The Legend tab lets you change the color and/or lower bound for each contour level.
9. Click OK when you are finished.
10. Repeat steps 5-9 for as many quality measurements as required.
The Legend tab contains a row for each contour level, Figure 21. The range for each contour level is indicated at the far right side of each row. The default color for each contour level is set according to the specification palette configuration as described in Changing Default Colors for Profile Specifications on page 44.
You may select a new color to represent a contour level, if you do not want to use the default colors. You can also adjust the lower bound for any contour level on an as-needed basis.
Figure 20. PDL Specification Properties - Specification Tab

Section 4 Configuration Configuring Profile Specifications
3BUF001121-600 A 43
Figure 21. PDL Specification Properties - Legend Tab
To select new color To adjust lower bound
Level 0
Level 8

Changing Default Colors for Profile Specifications Section 4 Configuration
44 3BUF001121-600 A
Changing Default Colors for Profile SpecificationsThe color palette in the Settings dialog specifies the default color for each of the nine possible contour levels in a user-configured profile specification. You can change these default color specifications as needed. To do this:
1. Choose Configure>Options from the Menu Bar, Figure 22.
Figure 22. Opening the Settings Dialog

Section 4 Configuration Specifying the Log List for Manual Entry
3BUF001121-600 A 45
This displays the Settings dialog, open to the Palette tab, Figure 23. Each of the nine possible contour levels is represented by a colored box, starting with the lowest level at the far left.
2. Click the box corresponding to the level whose color you want to change. This displays a palette for selecting a different color.
3. Select a color, then click OK.
4. Repeat steps 2 and 3 for any contour level whose color you want to change.
5. Click Apply (or OK) in the Settings dialog when you are finished.
Specifying the Log List for Manual EntryManual Entry is an alternative method for querying profile logs to populate quality measurement objects in the Navigator. The Log Name pick list in the Manual Entry dialog may be populated with a permanent list of log names and descriptions. If you
Figure 23. Configuring the Default Palette
Level 0 Level 8

Specifying the Log List for Manual Entry Section 4 Configuration
46 3BUF001121-600 A
don’t configure this list, you will be required to enter log names manually on an ad-hoc basis.
To configure the log list:
1. Choose Configure>Options. This displays the Settings dialog.
2. Click the Log Descriptions tab, Figure 24.
The Log Name list is empty initially.
Figure 24. Log Descriptions

Section 4 Configuration Specifying the Log List for Manual Entry
3BUF001121-600 A 47
3. Click the Add button, then use the New Log dialog to specify the log name and description, Figure 25.
4. Repeat step 3 for as many logs as you need to add.
Once the Log Name list is populated, you can use the pull-down menu to select a log whose description you want to change, Figure 26. Enter a new description in the Description field.
You can also delete a log from the list. To do this, select the log and then click Delete.
Click Apply (or OK) in the Settings dialog when you are finished. This saves the log list to a text file which is used to populate the Log Name pick list in the Manual Entry dialog.
Figure 25. New Log Dialog
Figure 26. Log Name List

Specifying the Log List for Manual Entry Section 4 Configuration
48 3BUF001121-600 A

3BUF001121-600 A 49
Section 5 Operation
You can run the Profile Historian client in Internet Explorer, or in Display Services. Refer to Section 3, Application Start-up for details. Once you’ve launched the profile client in either Internet Explorer or Display Services, refer to Viewing Profiles - Basic Procedure below for a quick introduction to using the profile displays.
Viewing Profiles - Basic ProcedureThe following procedure shows the basic steps for displaying a history profile. To learn about additional viewing options for customizing the history profile view, refer to Customizing Your View on page 84.
To display a history profile:
1. Use the Display Selector to select a display format, Figure 27.
Figure 27. Selecting a Display Format

Section 5 Operation
50 3BUF001121-600 A
This puts an empty display (without data) in the Display Area, Figure 28.
Figure 28. Example, Empty Display

Section 5 Operation
3BUF001121-600 A 51
2. Select a query from the Query Selector, Figure 29. No data will be retrieved while -SELECT QUERY- is selected.
Four pre-configured queries are provided as standard. These are described in Table 3.
Figure 29. Selecting a Query
Table 3. Standard Queries
Query Name Description
LAST SIX HOURS This retrieves data for six hours from the current time.
YESTERDAY This retrieves data for 24 hours from the current time.
LAST WEEK This retrieves data for the previous week.
ARCHIVED This retrieves all archive data restored from the archive media to the restored archive database on the Profile Historian server. For details on archiving and restoring archive data, refer to System 800xA Information Management Configuration (3BUF001092*).
If you need to reselect the currently selected query, go back to SELECT QUERY before reselecting the query.

Section 5 Operation
52 3BUF001121-600 A
Selecting a pre-configured query retrieves data for the selected time range. The progress bar at the top of the display lets you know data is being retrieved.
When this process is finished, markers corresponding to days in the specified time range are inserted in the Navigator. Two examples are shown in Figure 30. If you choose the LAST SIX HOURS query, there is just one day marker. The LAST WEEK query spans eight days.
3. Click on a day marker. This makes the quality measurements available under that marker.
4. Click the corresponding (+/-) button to show the REEL and GRADE objects under the marker, Figure 31.
By default, these queries retrieve REEL and GRADE data for all machines. You can apply a filter to return just REEL data or just GRADE data, or REEL and GRADE data for specific machines only. See Filtering Queries on page 85.
Figure 30. Day Markers in Navigator
One Day Markerfor LAST SIX HOURS
Eight Day Markersfor LAST WEEK

Section 5 Operation
3BUF001121-600 A 53
The reel and grade object names are generated by the AccuRay Object Server and consists of:
• a root - REEL or GRADE
• a sequential number generated by the AccuRay Object Server, and stored in the reel or grade’s Number variable (specified via Reel Report Configuration Tool)
• the name of the machine as specified via the Reel Report Configuration Tool
• the reel or grade’s end time (current time)
For example: REEL4_PM1_03012001_123607. This name indicates reel #4 on machine PM1, ended at 12:36:07 on March 1, 2001.
5. Click the (+/-) button for the reel or grade whose quality measurement you want to view.
Figure 31. Quality Measurements Under Selected Marker
GRADE Objects Underthe Selected Marker
Click to Show REEL and

Section 5 Operation
54 3BUF001121-600 A
6. Select (highlight) the quality measurement from the Navigator, then drag and drop it on the applicable view (contour map CD, or MD). As you drag the quality measurement over the display area, its location is represented as a rectangle, Figure 32.
Figure 33 shows the display when populated with data.
For some displays, one quality measurement is applied to all views. For other displays, you must apply a different quality measurement to each view.
• For ContourMDCD View and Single View - select just one measurement. That measurement is applied to all views on the display.
• For 3CDScanAverage View, 3MDScanAverage View, or 2ContourLegend View, select a different measurement for each view.
Figure 32. Selecting a Quality Measurement
Selected Grade
Selected Measurement Represented as a Rectangle as You Drag it ontothe Display
Selected Measurement

Section 5 Operation
3BUF001121-600 A 55
Figure 33. Example, Display with Data

Section 5 Operation
56 3BUF001121-600 A
Auto-adjusting Contour Levels within a Quality MeasurementFor each quality measurement, the range is derived from the low and high values for the applied data. By default, this range is divided into nine contour (quality) levels. These levels are color-coded on contour maps, machine direction views, and cross direction views. For any quality measurement, you can adjust the number of contour levels, as well as the upper and lower bounds for each level.
The quickest method is to set the number of contour levels, and then let the Profile Historian software automatically adjust the bounds for each level. To do this, click the pyramid-shaped contour levels icon in the legend tool bar, Figure 34.
This displays the dialog for specifying the quantity of levels, Figure 35. The value you enter here is not actually the number of levels, but rather the number of the highest level. Since this range is zero-based (0-99), the quantity of levels created is the specified number plus one. For instance, if you enter 5, the number of levels created is 6. Enter a number up to 99, then click OK.
The bounds for each level are automatically established by dividing the full measurement range by the number of levels. Color coding is automatically adjusted based on the specified number of levels.
Figure 34. Contour levels Icon on Legend Toolbar
Figure 35. Dialog for Specifying Number of levels
Click Here

Section 5 Operation
3BUF001121-600 A 57
If you need to set upper and lower bounds for contour levels with greater precision, or if you want to customize color coding for contour levels, you should apply the corresponding profile specification as described in Applying a History Profile Specification on page 93. You can also make ad-hoc adjustments as described in Making Ad-hoc Adjustments to the Profile View on page 94.
Using the Profile Historian Client DisplayRefer to one of the following based on the type of display you selected:
• ContourMDCD View on page 58
• 3CDScanAverage View on page 80
• 3MDScanAverage View on page 79
• 2ContourLegend View on page 81
• Single View on page 82

ContourMDCD View Section 5 Operation
58 3BUF001121-600 A
ContourMDCD ViewThe ContourMDCD view combines a Contour Map with two Machine Direction (MD) views, and two Cross Direction (CD) views, Figure 36. The same measurement is applied to all views. This lets you show MD and CD views for both the profile and average. These five views share a common legend which describes the contour level settings, and provides a tool bar for making contour level adjustments.
Figure 36. ContourMDCD View
Machine
Cross
Contour
MachineDirection
CrossDirection
Shared
DirectionViews
Legend
DirectionViews

Section 5 Operation Contour Map
3BUF001121-600 A 59
Contour MapThe contour map shows the variation of a quality measurement for a selected reel over time. Variations in the quality (contour) level are indicated by color. The y-axis shows time range for the selected query. The x-axis shows the number of data points per scan, as determined by the machine.
The following functions are provided for viewing profiles on the contour map:
• Cross Hair Control for reading data point times and values.
• Zooming to get a more detailed view of a specific area on the contour map.
• Showing the Roll/Set Grid - to view the distribution of a reel’s sets and rolls on the contour map.
• Zooming On a Roll or Set
• Viewing/Modifying the ROLLSetup
• Grade Status to display grade status as ON or OFF. See Grade Status on page 69
• Tool Bar controls for changing the machine direction, printing the contour map, or copying the contour map image to another Windows application such as Microsoft Word.
Reel/Grade & Quality Measurement Tag
The log name for the selected quality measurement, and the name of the selected reel or grade are indicated at the top of the contour map, Figure 37. The reel and grade names are generated by the AccuRay Object Server and consist of:
• a root - REEL or GRADE
• a sequential number generated by the AccuRay Object Server, and stored in the reel or grade’s Number variable (specified via Reel Report Configuration Tool)
• the name of the machine as specified via the Reel Report Configuration Tool
• the reel or grade’s end time (Current time)
For example: REEL4_PM1_03012001_123607. This name indicates reel #4 on machine PM1, ended at 12:36:07 on March 1, 2001.

Contour Map Section 5 Operation
60 3BUF001121-600 A
Cross Hair Control
Click on the contour map to display the cross hair control. The cross hair moves in both the machine (vertical) and cross (horizontal) directions. As you move this control, the time and data point value corresponding to the current position are displayed in parenthesis below the tool bar, Figure 37.
Figure 37. Time and Data Point Values for Contour
Cross Hair
Data Point Range
Time Range forSelected Query
Color-coded
Cross Hair Reading
Position
for Data Point, Time,and Value
Log Name for Selected
Name for SelectedReel or Grade
Quality Measurement
Cross Hair Readingfor Machine Position Contour Levels
Grade Status

Section 5 Operation Contour Map
3BUF001121-600 A 61
Zooming
The Zoom-in feature lets you increase the resolution for a specific area on the contour, Figure 38. To select the area where you want to zoom in, right click inside the contour area and drag the mouse to outline the area. When you release the mouse button, the selected area fills the entire contour view. The x-axis and y-axis ranges are adjusted accordingly. You can repeat this to get a continually more detailed view.
To return the contour view to its original resolution, click the unzoom button on the Tool Bar. This returns the view back to its original resolution in one step.
Figure 38. Using the Zoom Function
Selecting the Zoom Area
Zoom Result
Unzoom

Contour Map Section 5 Operation
62 3BUF001121-600 A
Showing the Roll/Set Grid
You can configure a ROLLSetup report on a machine-basis. This procedure is described in System 800xA Information Management Configuration (3BUF001092*). If the machine whose quality measurements you are viewing has a ROLLSetup report configured, the Roll/Set button in the tool bar is enabled when you place a quality measurement on the contour map. This button lets you show/hide the roll/set grid on the contour map.
This grid shows the distribution of sets and rolls on the current reel according to the preconfigured ROLLSetup. This setup divides the reel lengthwise (machine direction) into a specified number of sets. Each set is divided by width (cross direction) into a specified number of rolls. This is illustrated in Figure 39.
Figure 39. Roll/Set Distribution on the Reel

Section 5 Operation Contour Map
3BUF001121-600 A 63
When you click the Roll/Set button, a grid is superimposed on the Contour map to show the distribution of sets and rolls, Figure 40.
Figure 40. Roll/Set Grid
Show Roll/Set Grid
Sets
Rolls

Contour Map Section 5 Operation
64 3BUF001121-600 A
Zooming On a Roll or Set
You can zoom on the area for a specific set or roll. To do this simply double-click inside the corresponding cell in the grid, Figure 41. To return the view to its original resolution, click the unzoom button on the Tool Bar.
Viewing/Modifying the ROLLSetup
The ROLLSetup is initially configured via the Reel Report Configuration Tool as described in System 800xA Information Management Configuration (3BUF001092*). You can view and edit this configuration by selecting a quality measurement under the reel whose ROLLSetup you want to view, and then right-clicking and choosing Roll/Set Config from the context menu, Figure 42.
Figure 41. Example, Zooming on a Roll
Unzoom

Section 5 Operation Contour Map
3BUF001121-600 A 65
This displays the Roll/Set Configuration dialog, Figure 43.
Roll/Set parameters are described in Table 4.
Figure 42. Displaying the Roll/Set Configuration Dialog
Figure 43. Roll/Set Configuration Dialog

Contour Map Section 5 Operation
66 3BUF001121-600 A
Table 4. RollSet Specifications
Signal Description
ReelTrim Indicates the width of the reel.
RollTrimArray One value for each roll in the current set indicate the width of each roll.
SetFootage Indicates the actual length of the current set.
Section 5 Operation Contour Map
3BUF001121-600 A 67
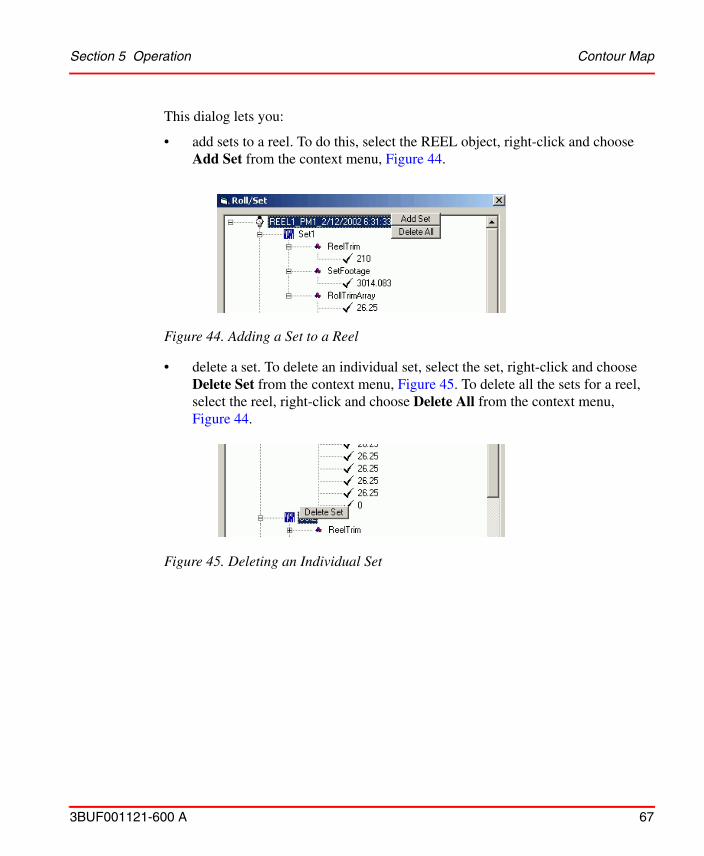
This dialog lets you:
• add sets to a reel. To do this, select the REEL object, right-click and choose Add Set from the context menu, Figure 44.
• delete a set. To delete an individual set, select the set, right-click and choose Delete Set from the context menu, Figure 45. To delete all the sets for a reel, select the reel, right-click and choose Delete All from the context menu, Figure 44.
Figure 44. Adding a Set to a Reel
Figure 45. Deleting an Individual Set

Contour Map Section 5 Operation
68 3BUF001121-600 A
• edit the RollTrim specification for individual rolls. To do this, expand the applicable set to show all variables for that set. Then expand the RollTrimArray, select the roll, and edit the value, Figure 46.
• edit the footage and ReelTrim specifications for individual sets. To do this, go to the set whose footage or ReelTrim you want to edit, select the variable and edit the value.
Figure 46. Editing the RollTrimArray
The sum of RollTrimArray values for all rolls cannot exceed the Set Footage.

Section 5 Operation Contour Map
3BUF001121-600 A 69
Grade Status
The Grade Status field indicates the grade status at the current cross hair position. You can show grade status on the contour map by clicking the Grade Status button on the tool bar, Figure 47.
Figure 47. Off Grade Status
Grade Status Field
Cross Hair inOff Grade Area
Grade Status Button

Machine Direction Section 5 Operation
70 3BUF001121-600 A
Tool Bar
The toolbar, Figure 48, provides the following controls:
• Change Machine Direction - This button flips the y-axis and contour map top-to-bottom so the data flow is reversed.
• Unzoom - After using the zoom function, this button returns the view to the original (unzoomed) state.
• Show Roll/Set Grid - See Showing the Roll/Set Grid on page 62.
• Grade Status to display grade status as ON or OFF. See Grade Status on page 69
• Print - This displays a standard Windows Print dialog.
• Copy/Paste - This lets you copy the contour map image to another Windows application such as Microsoft Word.
Machine DirectionThe Machine Direction views provide an overhead view of the reel as it moves along the machine. The Average view shows the average value for all data points at the time selected by the ruler. The Profile view shows the value for one data point selected by the Contour Map Cross Hair Control. These views use the same y-axis (time) as the Contour Map. The x-axis shows the calculated average or profile value range.
The following controls are for viewing profiles on the machine direction view:
• Ruler for reading data point times and values.
Figure 48. Controls for Contour Map
Change Machine Direction
Unzoom
Paste
Show/Hide Roll/Set Grid
Show/Hide Grade Status

Section 5 Operation Machine Direction
3BUF001121-600 A 71
• Zooming for getting a more detailed view of a specific area on the machine direction view. This is basically the same as described for the Contour Map.
• Tool Bar for:
– changing the machine direction– printing the machine direction view – copying the view to another Windows application such as Microsoft Word– locking/unlocking the machine direction ruler so you can operate it
independent of the Contour Map Cross Hair Control.
Ruler
Click on a view to display its ruler. The ruler moves in the machine direction with time. As you move the ruler, the time and data point value corresponding to the current position are displayed in parenthesis below the tool bar, Figure 49. You can synchronize the operation of this ruler with the Contour Map cross hair, or operate the ruler independently via the Lock/Unlock Ruler button on the Tool Bar. The pull-

Machine Direction Section 5 Operation
72 3BUF001121-600 A
down menu lets you select whether to show the average or profile measurement. You can use this menu to switch the left and right views.
Tool Bar
The tool bar for the Machine Direction view is shown in Figure 50.
This tool bar lets you:
Figure 49. Time and Data Point Values for Machine Direction
Figure 50. Controls for Machine Direction View
Ruler
Pull-down menu
Data Point
Ruler Read-Out
lets you chooseProfile or Average
Value Range
(Time, Value)
Allow/Disable Lock
Change Machine Direction
UnZoom Paste

Section 5 Operation Machine Direction
3BUF001121-600 A 73
• Change Machine Direction - This button flips the y-axis and machine direction graph top-to-bottom so the data flow is reversed.
• Unzoom - After using the zoom function, this button returns the view to the original (unzoomed) state.
• Print - This displays a standard Windows Print dialog.
• Copy/Paste - This lets you copy the machine direction image to another Windows application such as Microsoft Word.
• Enable/disable the Ruler Lock - This button lets you lock the machine direction ruler so you can operate it independent of the Contour Map Cross Hair Control. When the button is in the unlocked position as shown in Figure 50, the MD Ruler is synchronized (moves) with the Contour Map Cross Hair Control. When the button is in the locked position, Figure 51, the MD Ruler does not move with the Contour Map Cross Hair Control, and can be operated independently.
Figure 51. Locked Position

Cross Direction Section 5 Operation
74 3BUF001121-600 A
Cross DirectionThe Cross Direction views provide a side-to-side view of the reel. The Average view shows the average value over the full time range for the data point selected by the ruler. The Profile shows the data point value for the point in time selected by the Contour Map Cross Hair Control.
These views use the same x-axis (data point range) as the Contour Map. The y-axis shows the calculated average or profile value range. Contour levels are indicated by color-coded dotted lines.
The following controls are provided for viewing profiles on the cross direction view:
• Ruler for reading data point times and values.
• Zooming for getting a more detailed view of a specific area on the cross direction view. This is basically the same as described for the Contour Map.
• Tool Bar for:
– printing the cross direction view
– copying the view to another Windows application such as Microsoft Word
– locking/unlocking the cross direction ruler so you can operate it independent of the Contour Map Cross Hair Control.

Section 5 Operation Cross Direction
3BUF001121-600 A 75
Ruler
Click on a view to display the ruler. The ruler moves in the cross direction. As you move this ruler, the data point number and data point value corresponding to the current position are displayed in parenthesis below the tool bar, Figure 52. You can synchronize the operation of this ruler with the Contour Map cross hair, or operate the ruler independently via the Lock/Unlock Ruler button on the Tool Bar. The pull-down menu lets you select whether to show the average or profile measurement. You can use this menu to switch the top and bottom views.
Figure 52. Time and Data Point Values for Cross Direction
Ruler
Pull-down menu lets youchoose Average or Profile
Ruler Read-Out(Data Point, Value)
Data Point Range
Value Range

Cross Direction Section 5 Operation
76 3BUF001121-600 A
Tool Bar
The tool bar for the Cross Direction view is shown in Figure 53.
This tool bar lets you:
• Unzoom - After using the zoom function, this button returns the view to the original (unzoomed) state.
• Print - This displays a standard Windows Print dialog.
• Copy/Paste - This lets you copy the CD image to another Windows application such as Microsoft Word.
• Enable/disable the Ruler Lock - This button lets you lock the CD ruler so you can operate it independent of the Contour Map Cross Hair Control. When the button is in the unlocked position as shown in Figure 53, the CD Ruler is synchronized (moves) with the Contour Map Cross Hair Control. When the button is in the locked position, Figure 54, the CD Ruler does not move with the Contour Map Cross Hair Control, and can be operated independently.
Figure 53. Controls for CD
Figure 54. Locked Position
Lock/Unlock Ruler
Unzoom Copy/Paste

Section 5 Operation Legend
3BUF001121-600 A 77
LegendEvery display has one or more legends corresponding to the number of quality measurements shown on the display. For example, the ContourMDCD View shows one quality measurement which is applied to all five views. Therefore this display has one common legend. The 3MDScanAverage View shows three different quality measurements, and so it requires three separate legends.
The legend indicates the following information for its corresponding quality measurement: the number of contour levels, the color coding for each level, and the lower bound for each level, Figure 55.
The legend tool bar lets you:
• Set the number of contour levels. See Auto-adjusting Contour Levels within a Quality Measurement on page 56.
• Apply the configured profile specification that corresponds to the quality measurement. See Applying a History Profile Specification on page 93.
• Redefine the quality measurement range (upper/lower bounds). See Adjusting the Quality Measurement Range on page 95.
Figure 55. Legend
Set Number ofContour Levels
Set Min/MaxContour Level
Lock/UnlockContour Level
Apply a ProfileSpecification
Copy

Legend Section 5 Operation
78 3BUF001121-600 A
• Change the color coding and adjust the bounds for a selected contour level. See Changing Contour Level Ranges and Colors on page 96.

Section 5 Operation 3MDScanAverage View
3BUF001121-600 A 79
3MDScanAverage ViewThis view combines three MD average views, Figure 56. You can apply a different quality measurement to each view. This lets you compare the MD average for three different quality measurements simultaneously. The y-axis shows the time range for the selected query. The x-axis shows the average value range for the quality measurement.
Figure 56. Example, 3MD View

3CDScanAverage View Section 5 Operation
80 3BUF001121-600 A
The operation of these MD views is basically the same as the Machine Direction views on the ContourMDCD View. The operation of the Legends is also the same.
3CDScanAverage ViewThis view combines three CD average views, Figure 57. You can apply a different quality measurement to each view. This lets you compare the CD average for three different quality measurements simultaneously. The y-axis shows the value range for this quality measurement. The x-axis shows the number of data points.

Section 5 Operation 2ContourLegend View
3BUF001121-600 A 81
Operation is basically the same as for the Cross Direction views on the ContourMDCD View. The operation of the Legends is also the same.
2ContourLegend ViewThis view combines two contour views, Figure 58. Operation of these contour maps is basically the same as the Contour Map on the ContourMDCD View, except that
Figure 57. Example, 3CD View

Single View Section 5 Operation
82 3BUF001121-600 A
each map shows a different quality measurement. The operation of the Legends is also the same.
Single ViewThe Single view combines a Contour Map with one average Machine Direction (MD) view, and one average Cross Direction (CD) view, Figure 59. The same measurement is applied to all views. Operation of these views is basically the same as for the ContourMDCD View. The operation of the Legend is also the same.
Figure 58. Example, 2Contlegend View

Section 5 Operation Single View
3BUF001121-600 A 83
Figure 59. Example, Single View

Customizing Your View Section 5 Operation
84 3BUF001121-600 A
Customizing Your ViewYou can customize the profile client user interface to meet your viewing requirements by any of the following methods:
• Refine the standard queries by filtering out REEL or GRADE data for one or more machines, and create custom queries. See Working with Queries on page 84
• Apply custom profile specifications to their respective measurements as you view them. See Applying a History Profile Specification on page 93.
• Make ad-hoc adjustments to the quality measurement range, number of contour levels, and color coding for those levels. See Making Ad-hoc Adjustments to the Profile View on page 94.
Working with QueriesQueries retrieve data from all profile logs for a specified time range. There are four pre-configured queries as described in Table 5.
By default, these queries return REEL and GRADE data for all machines. You can refine your queries by filtering REEL or GRADE data for one or more machines. See Filtering Queries on page 85.
To configure and save a custom query, see:
• Querying Between Specified Start and End Times on page 87
Table 5. Standard Queries
Query Name Description
LAST SIX HOURS Retrieves data for six hours from the current time.
YESTERDAY Retrieves data for the last 24 hours from the current time.
LAST WEEK Retrieves data for the previous week.
ARCHIVED Retrieves all archive data restored from the archive media to the restored archive database on the Profile Historian server. For details on archiving and restoring, refer to System 800xA Information Management Configuration (3BUF001092*).

Section 5 Operation Working with Queries
3BUF001121-600 A 85
• Querying By Specified Time Range on page 88
• Querying By Name on page 90
• Custom Queries for Archive Data on page 91
Filtering Queries
By default, these queries return REEL and GRADE data for all machines. You can refine your queries by filtering REEL or GRADE data for one or more machines.
To do this, from the menu bar choose Configure>Filter Query By>Filter Option, Figure 60. The filter options are described in Table 6.
Figure 60. Query Filter Menu
Table 6. Query Filter Options
Filter Description
ALL Returns REEL and GRADE data for all machines. This is the default mode of operation.
GRADE Return just GRADE data for all machines.
REEL Returns just REEL data for all machines.
MACHINE>REALTIMEMACHINE>ARCHIVED
Displays a dialog where you can specify the query to return REEL and/or GRADE data for specific machines. See Filter Query By Machine on page 86.

Working with Queries Section 5 Operation
86 3BUF001121-600 A
Filter Query By Machine
Selecting either the MACHINE>REALTIME or MACHINE>ARCHIVED filter option displays the Select Machine dialog, Figure 61. This dialog lets you select one or more machines from which to retrieve data.
Selecting the Query By All check box is equivalent to the ALL filter option. This selects REEL and GRADE data for all machines, and disables all other check boxes so you cannot change these selections.
By unchecking the Query By All check box, you enable the machine check boxes as well as the Reel and Grade check boxes. This lets you filter out one or more machines by unchecking their corresponding check box. You can also filter out Reel or Grade data by unchecking the corresponding check box. In the example in Figure 61, queries will return Reel and Grade data for machine PM1.
Figure 61. Select Machine Dialog
Select Individual Machinesfrom which to Retrieve Data
Select Reel or Grade or Both
Section 5 Operation Working with Queries
3BUF001121-600 A 87
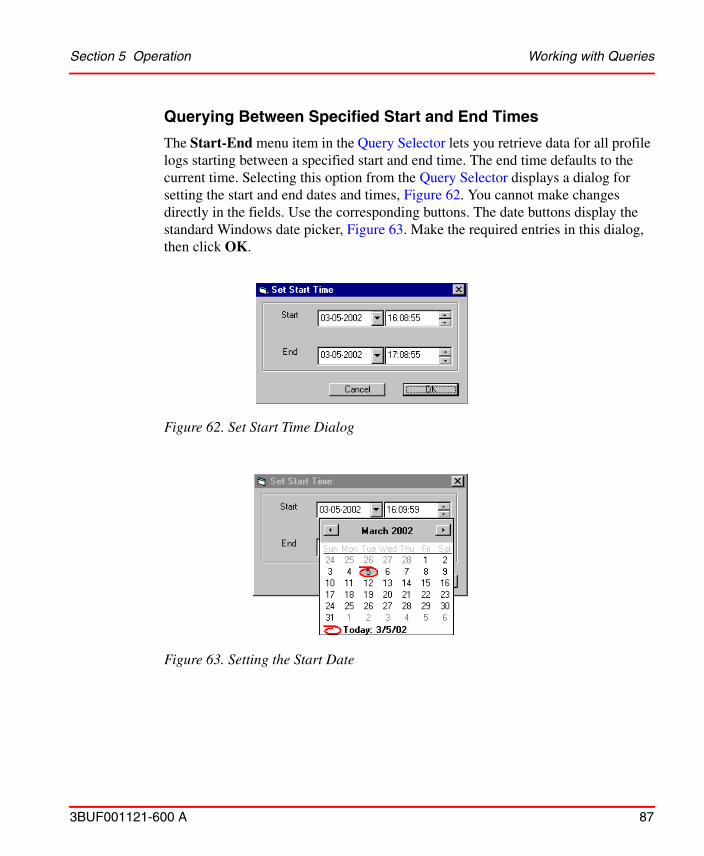
Querying Between Specified Start and End Times
The Start-End menu item in the Query Selector lets you retrieve data for all profile logs starting between a specified start and end time. The end time defaults to the current time. Selecting this option from the Query Selector displays a dialog for setting the start and end dates and times, Figure 62. You cannot make changes directly in the fields. Use the corresponding buttons. The date buttons display the standard Windows date picker, Figure 63. Make the required entries in this dialog, then click OK.
Figure 62. Set Start Time Dialog
Figure 63. Setting the Start Date

Working with Queries Section 5 Operation
88 3BUF001121-600 A
Querying By Specified Time Range
This method lets you specify a start and/or end time for the query. To do this:
1. Choose Configure>Query from the Menu Bar. This displays the Query dialog, Figure 64.
2. Select a query from the Query Name menu. The dialog will not retrieve data while -SELECT QUERY- is selected.
3. Specify the time range for which you want to retrieve data:
– to retrieve data between a specific starting and ending time, enter those times in their respective fields, and check the Start and End check boxes.
– to retrieve all data from a specific starting time to present, enter the starting time and check the Start check box. Do not check End. (This is equivalent to Querying Between Specified Start and End Times.)
– to retrieve all data up to a specific end time, enter the end time and check the End check box. Do not check Start.
4. Click Run Query. This retrieves data for all profile logs for the specified time range. The Query Name field will go blank.
5. Enter a unique name for the query in the Query Name field, Figure 65.
Figure 64. Initial Query Dialog

Section 5 Operation Working with Queries
3BUF001121-600 A 89
6. Click Save Query. This makes the query available in the Query Selector.
Figure 65. Example Query Result

Working with Queries Section 5 Operation
90 3BUF001121-600 A
Deleting Rows (Measurements) from the Query Result
Before saving the query, you can further customize the query by deleting selected rows (measurements). To do this select the row or rows, then click Delete. After saving, the next time the query is run it will retrieve data only for those measurements that were not deleted.
Querying By Name
You can also create a query that does not use a time range, and retrieves all data for specified measurements. To do this:
1. First create the query using a time range as described in Querying By Specified Time Range on page 88.
2. When you get the query result, delete any measurements that you don’t want to save.
3. Before saving the query, click the Save Data By Name check box, Figure 66. This makes the save function ignore (not save) the specified time range.
4. Click Save to save the new query.
The next time the query is run, the query will retrieve all data for the specified quality measurements.
Figure 66. Selecting Retrieve/Save Data By Name

Section 5 Operation Working with Queries
3BUF001121-600 A 91
Custom Queries for Archive Data
The pre-configured Archived query retrieves all restored archive data. You can use the Query form to specify a custom archive query. To do this:
1. Choose Configure>Query from the Menu Bar.
2. Choose Archived from the Query Name pull-down menu, then check the Retrieve/Save Archived Data By Time check box, Figure 67. This activates the Start and End fields for the query. If you do not check this box, the Start and End times will be ignored.
3. Specify the time range for which you want to retrieve data:
– to retrieve data between a specific starting and ending time, enter those times in their respective fields, and check the Start and End check boxes.
– to retrieve all data from a specific starting time to present, enter the starting time and check the Start check box. Do not check End.
– to retrieve all data up to a specific end time, enter the end time and check the End check box. Do not check Start.
4. Click Run Query. This retrieves the data.
5. Enter a unique name for the query in the Query Name field.
6. Click Save Query. This makes the query available in the Query Selector.
Figure 67. Creating a Custom Archive Query

Working with Queries Section 5 Operation
92 3BUF001121-600 A
Executing a Manual Data Query
This is an alternative method for specifying a time range and selecting a quality measurement. With Manual Entry, you are not required to select a query. Instead, select Manual Entry and drop it on the Display Area. Manual Entry is located under Custom in the Navigator, Figure 68.
This displays the Manual Data Query dialog, Figure 69.
The Log Name defaults to the last entry in this dialog. The first time you use the dialog the Log Name field is blank. The Log Name pick list may be populated via the Log Descriptions dialog as described in Specifying the Log List for Manual Entry on page 45. If you don’t configure this list, you will be required to enter log names manually on an ad-hoc basis.
Enter the profile log name, as well as the start and end times, then click Submit.
Figure 68. Selecting Manual Entry
Figure 69. Manual Data Query Dialog
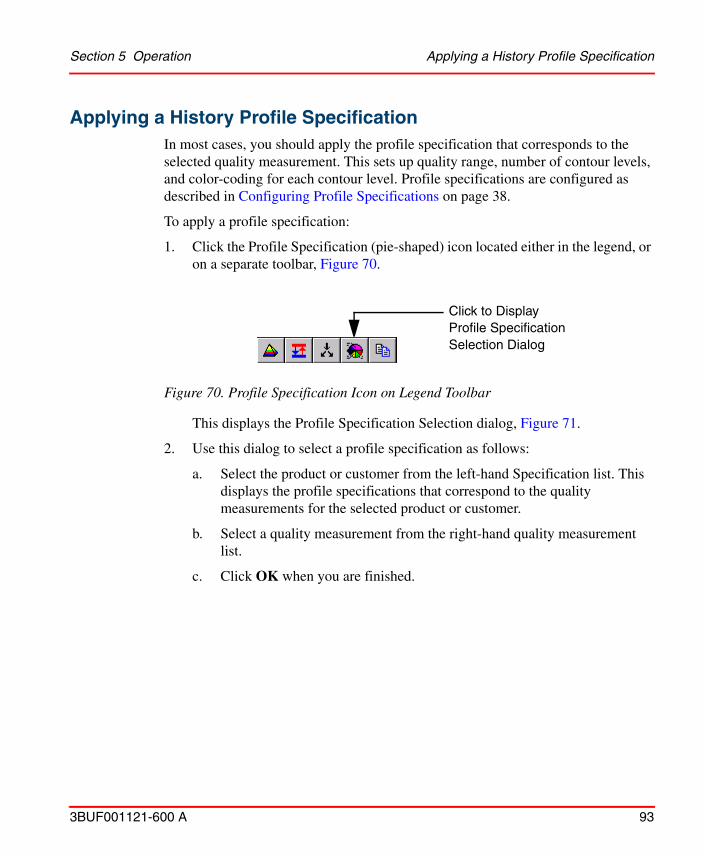
Section 5 Operation Applying a History Profile Specification
3BUF001121-600 A 93
Applying a History Profile SpecificationIn most cases, you should apply the profile specification that corresponds to the selected quality measurement. This sets up quality range, number of contour levels, and color-coding for each contour level. Profile specifications are configured as described in Configuring Profile Specifications on page 38.
To apply a profile specification:
1. Click the Profile Specification (pie-shaped) icon located either in the legend, or on a separate toolbar, Figure 70.
This displays the Profile Specification Selection dialog, Figure 71.
2. Use this dialog to select a profile specification as follows:
a. Select the product or customer from the left-hand Specification list. This displays the profile specifications that correspond to the quality measurements for the selected product or customer.
b. Select a quality measurement from the right-hand quality measurement list.
c. Click OK when you are finished.
Figure 70. Profile Specification Icon on Legend Toolbar
Click to DisplayProfile SpecificationSelection Dialog

Making Ad-hoc Adjustments to the Profile View Section 5 Operation
94 3BUF001121-600 A
Making Ad-hoc Adjustments to the Profile View
The legend provides controls for making ad-hoc adjustments to the current view:
• Set the Number of Contour Levels - See Auto-adjusting Contour Levels within a Quality Measurement on page 56.
• Set the upper and lower bounds for the quality measurement range. See Adjusting the Quality Measurement Range on page 95.
• Change the color and/or range for a specific contour level. See Changing Contour Level Ranges and Colors on page 96.
Figure 71. Selecting a Specification and Quality Measurement
These ad-hoc changes only apply while you are viewing this profile. If a profile specification has been applied, the profile specification itself is not changed.

Section 5 Operation Making Ad-hoc Adjustments to the Profile View
3BUF001121-600 A 95
Adjusting the Quality Measurement Range
This procedure adjusts the minimum and maximum quality measurement values. The upper and lower bounds for the contour levels are adjusted accordingly. To do this:
1. Click the Set Min/Max button in the legend tool bar, Figure 72.
2. Use the Set Min/Max dialog to adjust the minimum and maximum values, Figure 73.
3. Click the lock button on the legend tool bar, Figure 74. This locks your adjustments; otherwise, the Profile Historian software will automatically adjust all bounds back to their default settings to fit the applied data.
Figure 72. Displaying the Set Min/Max Dialog
Figure 73. Set Min/Max Dialog
Click to Display Dialog for AdjustingQuality Range Min/Max Values
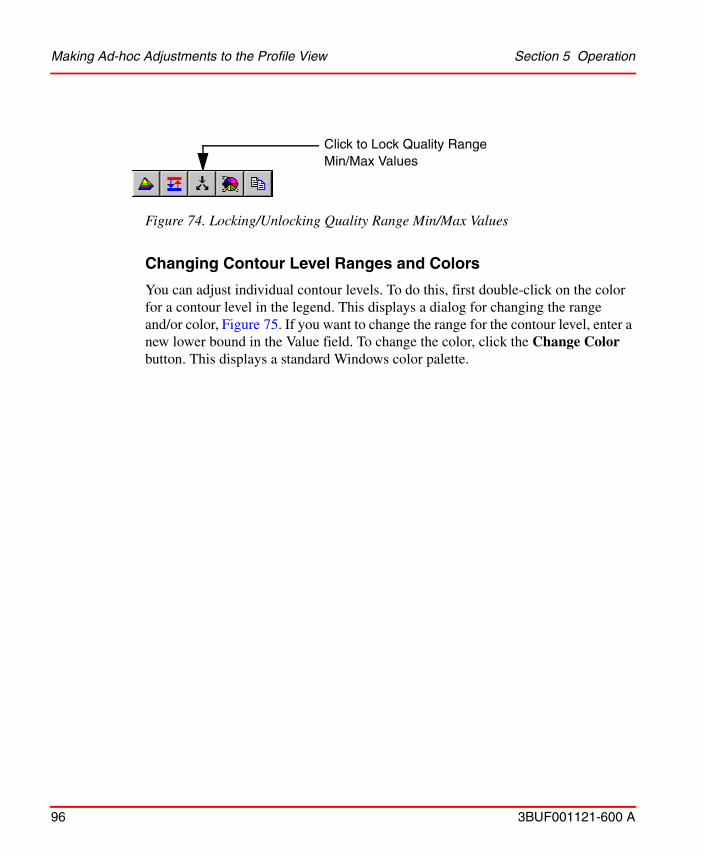
Making Ad-hoc Adjustments to the Profile View Section 5 Operation
96 3BUF001121-600 A
Changing Contour Level Ranges and Colors
You can adjust individual contour levels. To do this, first double-click on the color for a contour level in the legend. This displays a dialog for changing the range and/or color, Figure 75. If you want to change the range for the contour level, enter a new lower bound in the Value field. To change the color, click the Change Color button. This displays a standard Windows color palette.
Figure 74. Locking/Unlocking Quality Range Min/Max Values
Click to Lock Quality RangeMin/Max Values

Section 5 Operation Making Ad-hoc Adjustments to the Profile View
3BUF001121-600 A 97
Figure 75. Adjusting Contour Level Range and Color
Enter New
Click Change Color buttonto Display Color Selection Dialog
Double-click aColor to DisplayLegend LevelDialog
Value Here

Zooming Section 5 Operation
98 3BUF001121-600 A
ZoomingThe Zoom function on the Tool Bar lets you zoom in on an area on the contour map, machine direction view, or cross direction view. You can also expand the entire display to make time and value scales easier to read. To do this, use the View>Zoom menu, Figure 76.
Figure 76. Zoom Menu

3BUF001121-600 A 99
Section 6 PDL Access for Profile Historian
Product OverviewThis overview describes PDL Structures, Data Access Methods, PDL Maintenance, and PDL Maintenance.
PDL StructuresA Production Data Log is a composite of the following components:
• Tasks maintain a record of reel turn-ups, grade changes, and day shifts that occur in your process.
• Task Variables record the variables and parameters associated with a specific reel turn-up or grade change.
• History Associations establish associations between reel turn-ups/grade changes and the corresponding profile logs that collect and store the quality measurements. These associations facilitate retrieval of data from the profile logs. History associations are not created for day shift tasks.

Section 6 PDL Access for Profile Historian
100 3BUF001121-600 A
PDL Tasks
PDL tasks for Profile Historian are hierarchically organized on three levels, Figure 77. The ProfileData task (level 0) is a placeholder and does not actually store data. Tasks for reel turn-up, grade changes and day shifts are level 1 tasks. RollSetup level 2 tasks are children of Reel tasks.
Task-level data is available via the pdl_task_view as described in Table 15 in Appendix A, Production Data Log Attributes.
Figure 77. Sample Task Hierarchy, Profile Historian Application
ProfileData
Reel
Level 0
Level 1
RollSetup Level 2
Grade Day Shift

Section 6 PDL Access for Profile Historian
3BUF001121-600 A 101
Task Variables
The variables and parameters associated with a specific task are recorded in the PDL. Task variable data is available via the pdl_variable_view which is described in Table 16 in Appendix A, Production Data Log Attributes. The relation of tasks and task variables is shown in Figure 78.
Figure 78. Sample Application with Task Variables
Level 0 - ProfileData
Task Variables
User-defined
Tasks
Level 1 - Grade Task• • • Trigger
Number
Level 1 - Day Shift TaskUser-defined
Trigger
• • •
• • •
Level 2 - Rollsetup TaskSetFootage
SetLength
SetNumber
SetupReadyTrigger
NumberOfRolls
ReelNumber
ReelTrim
ReelTrimArrayLevel 2 - Rollsetup Task • • •
Level 1 - Reel Task

Task / History Log Associations Section 6 PDL Access for Profile Historian
102 3BUF001121-600 A
Task / History Log AssociationsThe file-based profile logs are linked to their respective reel and grade tasks via History Associations. Day shift and rollsetup tasks do not use history associations.
You can use the History Association to query for historical data for a specific task without having to know the actual time when that task was executed.
Associations are only pointers to time frames of data within existing profile logs and do not in themselves perform any collection or storage functions required to record process variables. These functions are performed by History.
History association data is available via the pdl_history_view which is described in Table 17 in Appendix A, Production Data Log Attributes.
Data Access MethodsMethods for PDL data access are illustrated in Figure 79. PDLs can be read via:
• DataDirect - DataDirect is an add-in for Microsoft® Excel. DataDirect supports PDL access via SQL queries, and a PDL browser dialog.
• Display Services - Display Services let you build and view dynamic runtime displays on client nodes connected to a Display server.
• Oracle SQL*NET
PDL data are stored in tables in an Oracle database. Several PDL views are provided to facilitate accessing PDL data. It is generally easier to use the views rather than the PDL tables. Refer to Appendix A, Production Data Log Attributes for a description of all PDL tables and views.
Guidelines for building data queries for PDL applications are provided in SQL Access for PDL Data on page 104. The quality measurements corresponding to the reel/grade/day shift tasks are read via profile client displays as described in Section 5, Operation.
Configuration RequirementsFile-based profile logs for storing reel and grade measurements must be configured in History as described in System 800xA Information Management Configuration (3BUF001092*).You are not required to configure PDLs in the History database.

Section 6 PDL Access for Profile Historian Task / History Log Associations
3BUF001121-600 A 103
When the PDL option is installed on the History node, PDL tasks are created when reel turn-ups, grade changes, day shifts, and rollsetup events occur.
PDL MaintenanceWhen the quality measurements corresponding to a reel/grade task are no longer stored in the profile logs (have been overwritten by more current data), the reel/grade task should be deleted. If you do not delete these tasks, the PDL tablespace will eventually run out. You can also archive PDL data to a removable media. These procedures are described in System 800xA Information Management Configuration (3BUF001092*).
Figure 79. PDL Data Access
PDL
PDL ViewsODBCADO
DisplayServices DataDirect SQL*NET
SQL*NET
ODBC API Oracle API
ODBC
Server
ClientsUses SQL 92 Syntax
Uses OracleSQL Syntax
PDL Views

SQL Access for PDL Data Section 6 PDL Access for Profile Historian
104 3BUF001121-600 A
SQL Access for PDL DataThis section provides example SQL queries for typical PDL retrieval applications. There are two basic PDL access applications for Profile Historian:
• Query for Task Variables
• Query for History Associations
Tables and Oracle views for PDL attributes are described in Appendix A, Production Data Log Attributes.
Guidelines for accessing archived data are provided in Accessing Archived Data on page 106.
Query for Task VariablesThe values for task variables may be accessed via the pdl_variable_view. Variables are connected to their corresponding tasks in this view by taskid; therefore the query must specify the taskid of the task for the reel turn-up, grade change, day shift, or rollsetup whose variables you want to access.
Using a Nested SELECT Statement To Find TaskID
If you know the task name, you can use a nested SELECT statement to get the taskid for the named task. An example is shown below:
SELECT variablename, variablevalue, FROM pdl_variable_viewWHERE taskid = (SELECT taskid FROM pdl_task_view WHERE taskname LIKE ‘%REEL2747%’)
This query retrieves the names, values and timestamps for all variables associated with a specified reel turn-up or and grade change.
Finding Task IDs for all Reels/Grades/Dayshifts
If you do not know the task name, you can use the following query to retrieve the taskids for all reel, grade, and day shift tasks:

Section 6 PDL Access for Profile Historian Query for History Associations
3BUF001121-600 A 105
SELECT taskname,taskidFROM pdl_task_viewWHERE levelnumber = 1
This query will return the taskname and taskid for all level 1 tasks. If you are using PDL with other applications such as TCL or Produce IT, the list of tasks returned may include tasks not related to Profile Historian.
Once you find the task whose variables you want to access, specify the taskid directly in the query as shown below:
SELECT variablename, variablevalue, FROM pdl_variable_viewWHERE taskid = 684
Query for History AssociationsHistory log associations are created for each quality measurement associated with a reel turn-up or grade change. The history association links the profile log with its corresponding task.
Associations are only pointers to time frames of data within existing profile logs and do not in themselves perform any collection or storage functions required to record process variables. These functions are performed by History.
You can retrieve a list of profile logs associated with a given task via the pdl_history_view which is described in Table 17 in Appendix A, Production Data Log Attributes.
History associations are connected to their corresponding tasks in this view by taskid; therefore the query must specify the taskid of the task for the reel turn-up or grade change whose history associations you want to access. The method for finding the taskid when the taskname is known is shown in the example below. The method for finding taskids when tasknames are not known is described in Finding Task IDs for all Reels/Grades/Dayshifts in Query for Task Variables on page 104.
SELECT s.associationname, s.ftimeperiodstart, s.ftimeperiodend, t.taskname FROM pdl_task_view t, pdl_history_view sWHERE t.taskid = s.taskid AND t.taskid = (SELECT taskid FROM pdl_task_view WHERE taskname LIKE ‘%REEL2747%’)

Accessing Archived Data Section 6 PDL Access for Profile Historian
106 3BUF001121-600 A
Accessing Archived DataArchived data for reel and grade changes, day shifts, and rollsetups can be restored from the archive media, and then be accessed by external applications such as Display Services and User API. The procedure is essentially the same as for accessing runtime data. The only difference is that you must reference the restored table names or view names in your queries. The restored table and view names are listed in Appendix A, Production Data Log Attributes. Instructions for restoring archived data are provided in the Reading and Managing Archive Data section of System 800xA Information Management Data Access and Reports (3BUF001094*).
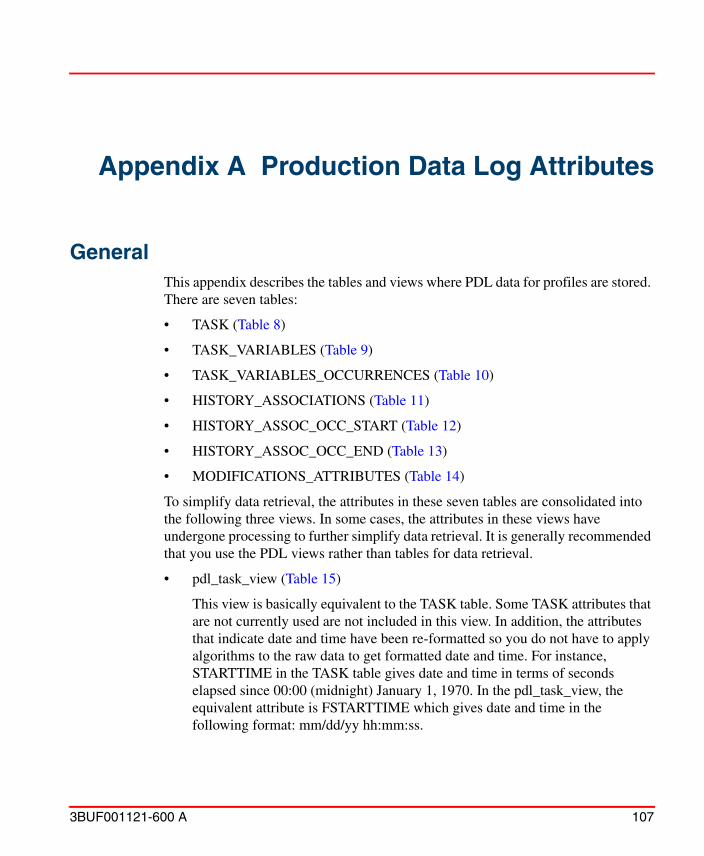
3BUF001121-600 A 107
Appendix A Production Data Log Attributes
GeneralThis appendix describes the tables and views where PDL data for profiles are stored. There are seven tables:
• TASK (Table 8)
• TASK_VARIABLES (Table 9)
• TASK_VARIABLES_OCCURRENCES (Table 10)
• HISTORY_ASSOCIATIONS (Table 11)
• HISTORY_ASSOC_OCC_START (Table 12)
• HISTORY_ASSOC_OCC_END (Table 13)
• MODIFICATIONS_ATTRIBUTES (Table 14)
To simplify data retrieval, the attributes in these seven tables are consolidated into the following three views. In some cases, the attributes in these views have undergone processing to further simplify data retrieval. It is generally recommended that you use the PDL views rather than tables for data retrieval.
• pdl_task_view (Table 15)
This view is basically equivalent to the TASK table. Some TASK attributes that are not currently used are not included in this view. In addition, the attributes that indicate date and time have been re-formatted so you do not have to apply algorithms to the raw data to get formatted date and time. For instance, STARTTIME in the TASK table gives date and time in terms of seconds elapsed since 00:00 (midnight) January 1, 1970. In the pdl_task_view, the equivalent attribute is FSTARTTIME which gives date and time in the following format: mm/dd/yy hh:mm:ss.
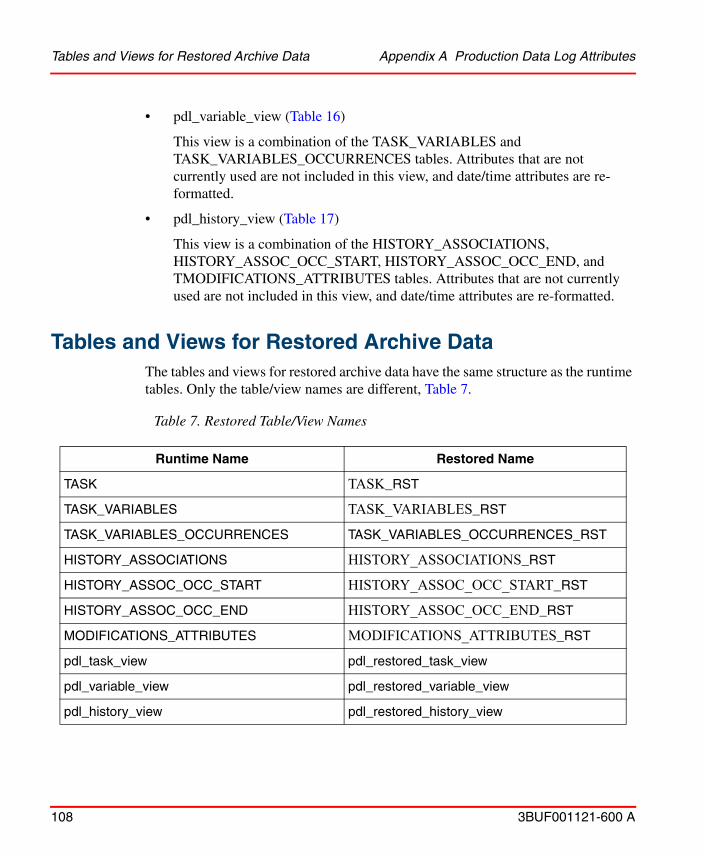
Tables and Views for Restored Archive Data Appendix A Production Data Log Attributes
108 3BUF001121-600 A
• pdl_variable_view (Table 16)
This view is a combination of the TASK_VARIABLES and TASK_VARIABLES_OCCURRENCES tables. Attributes that are not currently used are not included in this view, and date/time attributes are re-formatted.
• pdl_history_view (Table 17)
This view is a combination of the HISTORY_ASSOCIATIONS, HISTORY_ASSOC_OCC_START, HISTORY_ASSOC_OCC_END, and TMODIFICATIONS_ATTRIBUTES tables. Attributes that are not currently used are not included in this view, and date/time attributes are re-formatted.
Tables and Views for Restored Archive DataThe tables and views for restored archive data have the same structure as the runtime tables. Only the table/view names are different, Table 7.
Table 7. Restored Table/View Names
Runtime Name Restored Name
TASK TASK_RST
TASK_VARIABLES TASK_VARIABLES_RST
TASK_VARIABLES_OCCURRENCES TASK_VARIABLES_OCCURRENCES_RST
HISTORY_ASSOCIATIONS HISTORY_ASSOCIATIONS_RST
HISTORY_ASSOC_OCC_START HISTORY_ASSOC_OCC_START_RST
HISTORY_ASSOC_OCC_END HISTORY_ASSOC_OCC_END_RST
MODIFICATIONS_ATTRIBUTES MODIFICATIONS_ATTRIBUTES_RST
pdl_task_view pdl_restored_task_view
pdl_variable_view pdl_restored_variable_view
pdl_history_view pdl_restored_history_view

Appendix A Production Data Log Attributes TASK Table Attributes
3BUF001121-600 A 109
TASK Table Attributes
Table 8. TASK Table Attributes
Attribute Data Type Data Source[] = optional
Description
NAME Character (40) Application The Task name is the name of the reel or grade for which the task was created. This name is generated by the AccuRay Object Server and consists of:
• a root - REEL, GRADE, DAYSHIFT, or RollSetup
• a sequential number generated by the AccuRay Object Server, and stored in the reel or grade’s Number variable (specified via Reel Report Configuration Tool) This is not applicable for DAYSHIFT.
• the name of the machine as specified via the Reel Report Configuration Tool)
• the task end time (UTC time)
For example: REEL8_PM1_03012001_123607 indicates reel #8 on machine PM1, ended at 12:36:07 on March 1, 2001.
Task Name is used with Occurrence in query for retrieval of task data.
OCCURRENCE Numeric System Occurrence of this task within the parent task. Example: 2
TASKID NumericNot Null
System System-generated ID. Example: 5
PARENTID Numeric [Application] Taskid of the task that started this task. Supplied by application at time of task log creation. Example: 0

TASK Table Attributes Appendix A Production Data Log Attributes
110 3BUF001121-600 A
LEVELNUMBER Numeric Application PDL task level number (0 through 15)
0 = ProfileData1 = REEL, GRADE, or DAYSHIFT2 = RollSetupAll other levels reserved for future use.
TYPE Character (32) System Task type can be: REEL, GRADE, DAYSHIFT or RollSetup
CREATOR Character(32) [Application] User-defined identifier of process that created the task. Not used in this release.
CREATIONTIME Date/Time System or [Application]
Time stamp generated when task was created. Time is given as local time with resolution to the second. Use application supplied time unless 0 passed in.
CREATIONTIMEUTC Number System or [Application]
Creation time as Universal Time Coordinate (UTC) - Number of seconds since January 1, 1970.
CREATIONTIMEMSEC Number System Number of milliseconds into the second that creation time occurred.
STARTTIME Date/Time System or [Application]
Time stamp generated when task started. Time is given as local time with resolution to the second. Use application supplied time unless 0 passed in.
STARTTIMEUTC Number System or [Application]
Start time as Universal Time Coordinate (UTC) in seconds since January 1, 1970.
STARTTIMEMSEC Number System Number of milliseconds into the second that start time occurred.
Table 8. TASK Table Attributes (Continued)
Attribute Data Type Data Source[] = optional
Description

Appendix A Production Data Log Attributes TASK Table Attributes
3BUF001121-600 A 111
ENDTIME Date/Time System or [Application]
Time stamp generated when task is ended. Time is given as local time with resolution to the second. Use application supplied time unless 0 passed in.
ENDTIMEUTC Number System or [Application]
End time as Universal Time Coordinate (UTC) in seconds since January 1, 1970.
ENDTIMEMSEC Number System or [Application]
Number of milliseconds into the second that end time occurred.
USERCOMMENT Character(255) [Application] In the case of real configuration data, this field contains the OPC Item ID.
USERPARAMETER1 Numeric [Application] Not used in this release.
USERPARAMETER2 Character (32) [Application] Not used in this release.
USERNAME Character (32) [Application] Not used in this release.
Table 8. TASK Table Attributes (Continued)
Attribute Data Type Data Source[] = optional
Description

TASK_VARIABLE Table Attributes Appendix A Production Data Log Attributes
112 3BUF001121-600 A
TASK_VARIABLE Table Attributes
Table 9. TASK_VARIABLE Table Attributes
Attribute Data Type Data Source[] = optional
Description
NAME Character (32)Not Null
Application The Variable Name is used in combination with Occurrence in query for retrieval of variable data.
Reel and grade tasks have two standard variables - Trigger and Number. Others may be specified via the Reel Report Configuration Tool as required.
For dayshift tasks the only standard variable is Trigger. As with reel and grade tasks, user-defined variables may be specified.
RollSetup tasks have seven variables: NumberOfRolls, ReelNumber, ReelTrim, ReelTrimArray, SetFootage, SetLength, SetNumber, SetupReadyTrigger. User defined variables are not supported for RollSetup tasks.
TASKID NumericNot Null
Application Task identifier for associated task.
TYPE Character (1) System Describes the type of variable.n = normalp = parameter
CREATIONTIME Date/Time System/
[Application]
Time stamp generated when the reel or grade was created. Currently, this time stamp comes from the AccuRay Object Server. Time is given as local time with resolution to the second. PDL computes time stamp if application passes 0.

Appendix A Production Data Log Attributes TASK_VARIABLES_OCCURRENCES Table Attributes
3BUF001121-600 A 113
TASK_VARIABLES_OCCURRENCES Table Attributes
CREATIONTIMEUTC Number System or [Application]
Creation time as Universal Time Coordinate (UTC) - Number of seconds since January 1, 1970.
CREATIONTIMEMSEC Number System Number of milliseconds into the second that creation time occurred.
TAGNAME Character (32) [Application] Not used in this release.
DESCRIPTION Character (32) [Application] Not used in this release.
UNITS Character (10) [Application] Not used in this release.
FORMAT Character (30) [Application] Not used in this release.
Table 10. TASK_VARIABLES_OCCURRENCES Table Attributes
Attribute Data Type Data Source[] = optional
Description
NAME Character (32)Not Null
Application See description of variable name attribute in Table 9.
OCCURRENCE NumericNot Null
System or [Application]
Occurrence of this variable within the task. Example: 2
TASKID NumericNot Null
Application Task identifier for associated task.
VARIABLEVALUE Numeric Not Null
Application Initial value of the variable. If another request comes in to record to the same variable and occurrence, the times and value are put in the RESULT fields.
Table 9. TASK_VARIABLE Table Attributes (Continued)
Attribute Data Type Data Source[] = optional
Description

TASK_VARIABLES_OCCURRENCES Table Attributes Appendix A Production Data Log Attributes
114 3BUF001121-600 A
VARIABLETIME Date/Time System or [Application]
Time stamp at time of variable entry operation. Time is given as local time with resolution to the second.
For lab data entries where actual value will be entered later. PDL computes time stamp if application passes 0.
VARIABLETIMEUTC Number System or [Application]
Variable time as Universal Time Coordinate (UTC) - Number of seconds since January 1, 1970.
VARIABLETIMEMSEC Number System Number of milliseconds into the second that variable time occurred.
RESULTVALUE NumericNot Null
Application Updated value of the variable when another request comes in to record to the same variable and occurrence.
RESULTTIME Date/Time Time stamp at time of variable entry operation. Time is given as local time with resolution to the second.
For lab data entries where actual value will be entered later. PDL computes time stamp if application passes 0.
RESULTTIMEUTC Number System or [Application]
Result time as Universal Time Coordinate (UTC) - Number of seconds since January 1, 1970.
RESULTTIMEMSEC Number System Number of milliseconds into the second that result time occurred.
Table 10. TASK_VARIABLES_OCCURRENCES Table Attributes (Continued)
Attribute Data Type Data Source[] = optional
Description

Appendix A Production Data Log Attributes HISTORY_ASSOCIATIONS Table Attributes
3BUF001121-600 A 115
HISTORY_ASSOCIATIONS Table Attributes
Table 11. HISTORY_ASSOCIATIONS Table Attributes
Attribute Data Type Data Source[] = optional
Description
NAME Character (32)Not Null
Application Name of association. Log name of associated log as indicated in Log Attribute Edit window in History is used. For example: $HSPM1_AC450B.FRAME1.WEIGHT1.SCANPROP-1-o. Used during retrieval along with occurrence.
TASKID Numeric Not Null
Application System generated ID. Example: 5
LOGTYPE Character (1) Application N = Numeric Log
M = Message Log
STORAGEINTERVAL Numeric [Application]/
System
Recording rate of process object in seconds.
Example: 10 (sec)
DATASOURCE Data source for history log as defined in Composite log window in History.
CAPACITY Numeric [Application]/System
Not used in this release.
LOGNAME Character (32) Application/System
Same as ASSOCIATIONNAME.
FAILURENOTIFY Numeric Application Indicates that application will be notified in event of history log failure. Requires application to be able to handle notification and take appropriate action.
Y = Notify in event of failure
N = Do not notify in event of failure
Not used in this release.

HISTORY_ASSOCIATIONS Table Attributes Appendix A Production Data Log Attributes
116 3BUF001121-600 A
TIMEPERIODSOURCE TBD [Application] Association time is set relative to the start or end of the task which is linked to this association.
S:Task+5:00 (5 min + task start)
E:S+30:00 (30 min from start (S))
Not used in this release.
CREATIONTIME Date/Time System/[Application]
Time stamp generated at time when History association was created. Time is given as local time with resolution to the second. PDL computes time stamp if application passes 0.
CREATIONTIMEUTC Number System or [Application]
Creation time as Universal Time Coordinate (UTC) - Number of seconds since January 1, 1970.
CREATIONTIMEMSEC Number System Number of milliseconds into the second that creation time occurred.
STATUS Character (10) [Application] Not used in this release.
USERPARAMETER1 Numeric [Application] Not used in this release.
USERPARAMETER2 Character (32) [Application] Not used in this release.
USERNAME Character (32) Application Not used in this release.
USERCOMMENT Character(255) [Application] Not used in this release.
ARCHIVESTATUS Numeric System Indicates if this log has been saved to archive media.
Table 11. HISTORY_ASSOCIATIONS Table Attributes (Continued)
Attribute Data Type Data Source[] = optional
Description

Appendix A Production Data Log Attributes HISTORY_ASSOC_OCC_START Table Attributes
3BUF001121-600 A 117
HISTORY_ASSOC_OCC_START Table Attributes
Table 12. HISTORY_ASSOC_OCC_START Table Attributes
Attribute Data Type Data Source[] = optional
Description
NAME Character (32)
Application Name of association. Log name of associated log as indicated in Log Attribute Edit window in History is used. For example: $HSPM1_AC450B.FRAME1.WEIGHT1.SCANPROP-1-o. Used during retrieval along with occurrence.
OCCURRENCE Numeric System Occurrence of this resource usage within the task.
Example: 1
TASKID Numeric Application Task that created the association. System generated ID.
Example: 5
BATCHTASKID Numeric Application Task (reel or grade) in which this association was created.
TYPE Character (1)
Application N = Numeric Log
M = Message Log
TIMEPERIODSTART Date/Time System Time stamp generated at time of start association. Time is given as local time with resolution to the second.
TIMEPERIODSTARTUTC Number System or [Application]
Time period start time as Universal Time Coordinate (UTC) - Number of seconds since January 1, 1970.
TIMEPERIODSTARTMSEC Number System Number of milliseconds into the second that time period start time occurred.
ENTRYTIME Date/Time System Same as TIMEPERIODSTART.

HISTORY_ASSOC_OCC_END Table Attributes Appendix A Production Data Log Attributes
118 3BUF001121-600 A
HISTORY_ASSOC_OCC_END Table Attributes
ENTRYTIMEUTC Number System or [Application]
Same as TIMEPERIODSTARTUTC
ENTRYTIMEMSEC Number System Same as TIMEPERIODSTARTMSEC
USERNAME Character (32)
Application Not used in this release.
USERCOMMENT Character(255)
[Application] Not used in this release.
ARCHIVESTATUS Numeric System Indicates if this log has been saved to archive media.
Table 13. HISTORY_ASSOC_OCC_END Table Attributes
Attribute Data Type Data Source[] = optional
Description
NAME Character (32) Application Name of association. Log name of associated log as indicated in Log Attribute Edit window in History is used. For example: $HSPM1_AC450B.FRAME1.WEIGHT1.SCANPROP-1-o. Used during retrieval along with occurrence.
OCCURRENCE Numeric System Occurrence of this resource usage within the task.
Example: 1
Table 12. HISTORY_ASSOC_OCC_START Table Attributes (Continued)
Attribute Data Type Data Source[] = optional
Description
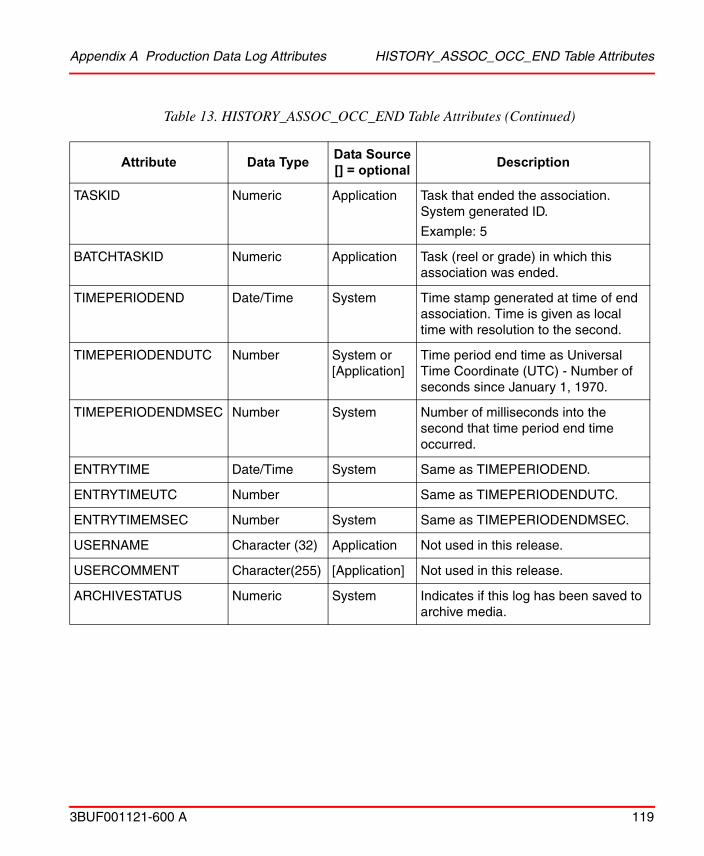
Appendix A Production Data Log Attributes HISTORY_ASSOC_OCC_END Table Attributes
3BUF001121-600 A 119
TASKID Numeric Application Task that ended the association. System generated ID.
Example: 5
BATCHTASKID Numeric Application Task (reel or grade) in which this association was ended.
TIMEPERIODEND Date/Time System Time stamp generated at time of end association. Time is given as local time with resolution to the second.
TIMEPERIODENDUTC Number System or [Application]
Time period end time as Universal Time Coordinate (UTC) - Number of seconds since January 1, 1970.
TIMEPERIODENDMSEC Number System Number of milliseconds into the second that time period end time occurred.
ENTRYTIME Date/Time System Same as TIMEPERIODEND.
ENTRYTIMEUTC Number Same as TIMEPERIODENDUTC.
ENTRYTIMEMSEC Number System Same as TIMEPERIODENDMSEC.
USERNAME Character (32) Application Not used in this release.
USERCOMMENT Character(255) [Application] Not used in this release.
ARCHIVESTATUS Numeric System Indicates if this log has been saved to archive media.
Table 13. HISTORY_ASSOC_OCC_END Table Attributes (Continued)
Attribute Data Type Data Source[] = optional
Description

MODIFICATIONS_ATTRIBUTES Table Attributes Appendix A Production Data Log Attributes
120 3BUF001121-600 A
MODIFICATIONS_ATTRIBUTES Table Attributes
Table 14. MODIFICATIONS_ATTRIBUTES Table Attributes
Attribute Data Type Data Source[] = optional
Description
TASKID Numeric Application ID of task being modified. Example: 5
MODIFYTIME Date/Time System/
[Application]
Time stamp generated at time of modify operation. PDL generates time stamp if application passes 0. Time is given in local time with resolution to the second.
MODIFYTIMEUTC Number System or [Application]
Modify time as Universal Time Coordinate (UTC) - Number of seconds since January 1, 1970.
MODIFYTIMEMSEC Number System Number of milliseconds into the second that modify time occurred.
ITEMNAME Character (32) [Application] Item name within log being updated.
ITEMOCCURRENCE Numeric [Application] Occurrence number of item being updated. Example: 3
ATTRIBUTECHANGED Character (15) Application Name of attribute being modified. For example: “Value”
OLDVALUE Binary, Integer, Real, Date/Time, String, File, Oracle Table
Application Previous Value
Example: 4.00
NEWVALUE Same as OLDVALUE
Application Updated Value
Example: 3.56
USERNAME Character (32) Application Not used in this release.

Appendix A Production Data Log Attributes MODIFICATIONS_ATTRIBUTES Table Attributes
3BUF001121-600 A 121
USERCOMMENT Character(255) [Application] Not used in this release.
ARCHIVESTATUS Numeric System Indicates if this log has been saved to archive media.
Table 14. MODIFICATIONS_ATTRIBUTES Table Attributes (Continued)
Attribute Data Type Data Source[] = optional
Description

PDL_TASK_VIEW Table Attributes Appendix A Production Data Log Attributes
122 3BUF001121-600 A
PDL_TASK_VIEW Table Attributes
Table 15. pdl_task_view Attributes
Attribute Data Type Data Source[] = optional
Description
TASKNAME Character (40) Application The Task name is the name of the reel or grade for which the task was created. This name is generated by the AccuRay Object Server and consists of:
a root - REEL, GRADE, DAYSHIFT, or RollSetup
a sequential number generated by the AccuRay Object Server, and stored in the reel or grade’s Number variable (specified via Reel Report Configuration Tool) This is not applicable for DAYSHIFT.
the name of the machine as specified via the Reel Report Configuration Tool)
the task end time (UTC time)
For example: REEL8_PM1_03012001_123607 indicates reel #8 on machine PM1, ended at 12:36:07 on March 1, 2001.
Task Name is used with Occurrence in query for retrieval of task data.
TASKTYPE Character (32) System Task type can be: REEL, GRADE, DAYSHIFT or RollSetup
OCCURRENCE Numeric System Occurrence of this task within the parent task.
Example: 2
TASKID Numeric
Not Null
System System-generated identifier.
Example: 14

Appendix A Production Data Log Attributes PDL_TASK_VIEW Table Attributes
3BUF001121-600 A 123
PARENTID Numeric [Application] Supplied by application at time of task log creation. Example: 12
LEVELNUMBER Numeric Application PDL task level number (0 through 15)
0 = ProfileData1 = REEL, GRADE, or DAYSHIFT2 = RollSetupAll other levels reserved for future use.
FCREATIONTIME Character (75) System or [Application]
Formatted time stamp generated when task was created. Use application supplied time unless 0 passed in.
Example: 25-AUG-2000 14:45:00
FSTARTTIME Character (75) System or [Application]
Same as FCREATIONTIME.
FENDTIME Character (75) System or [Application]
Formatted time stamp generated when task is ended Use application supplied time unless 0 passed in.
Example: 25-AUG-2000 14:45:00
DURATION Numeric Application Duration of the task given in seconds elapsed.
Table 15. pdl_task_view Attributes (Continued)
Attribute Data Type Data Source[] = optional
Description

PDL_VARIABLE_VIEW Table Attributes Appendix A Production Data Log Attributes
124 3BUF001121-600 A
PDL_VARIABLE_VIEW Table Attributes
Table 16. pdl_variable_view Attributes
Attribute Data Type Data Source[] = optional
Description
VARIABLENAME Character (32)Not Null
Application The Variable Name is used in combination with Occurrence in query for retrieval of variable data.
Reel and grade tasks have two standard variables - Trigger and Number. Others may be specified via the Reel Report Configuration Tool as required.
For dayshift tasks the only standard variable is Trigger. As with reel and grade tasks, user-defined variables may be specified.
RollSetup tasks have seven variables: NumberOfRolls, ReelNumber, ReelTrim, ReelTrimArray, SetFootage, SetLength, SetNumber, SetupReadyTrigger. User defined variables are not supported for RollSetup tasks.
TASKID NumericNot Null
Application Task identifier for associated task.
TASKTYPE Character (19) Application See TASKTYPE in Table 15.
OCCURRENCE NumericNot Null
System or
[Application]
Occurrence of this variable within the task. Example: 2
VARIABLETYPE Character (1) System Describes the type of variable.n = normalp = parameter

Appendix A Production Data Log Attributes PDL_VARIABLE_VIEW Table Attributes
3BUF001121-600 A 125
VARIABLEVALUE NumericNot Null
Application Initial value of the variable. If another request comes in to record to the same variable and occurrence, the times and value are put in the Result fields.
FCREATIONTIME Character (75) System or [Application]
Formatted time stamp generated when the request to create this variable was made. Currently, this time stamp comes from TCL. Use application supplied time unless 0 passed in.
Example: 25-AUG-2000 14:45:00
FVARIABLETIME Character (75) System or
[Application]
Formatted time stamp at time of variable entry operation.
To be used with lab data entries where actual value will be entered later. PDL computes time stamp if application passes 0.
Example: 25-AUG-2000 14:45:00
RESULTVALUE NumericNot Null
Application Updated value of the variable when another request comes in to record to the same variable and occurrence.
FRESULTTIME Character (75) Application Formatted time stamp at time of at time of variable entry operation.
TASKNAME Character (40) Application Name for task. TASKNAME is used in combination with OCCURRENCE in query for retrieval of task data.
Table 16. pdl_variable_view Attributes (Continued)
Attribute Data Type Data Source[] = optional
Description

PDL_HISTORY_VIEW Table Attributes Appendix A Production Data Log Attributes
126 3BUF001121-600 A
PDL_HISTORY_VIEW Table Attributes
LEVELNUMBER Numeric Application PDL task level number (0 through 15)
0 = ProfileData
1 = BatchAll other levels are reserved for future use.
PARENTID Numeric [Application] Supplied by application at time of task log creation. Example: 5
Table 17. pdl_history_view Attributes
Attribute Data Type Data Source[] = optional
Description
ASSOCIATIONNAME Character (32)Not Null
Application Name of association. Log name of associated log as indicated in Log Attribute Edit window in History is used. For example: $HSPM1_AC450B.FRAME1.WEIGHT1.SCANPROP-1-o. Used during retrieval along with occurrence.
OCCURRENCE NumericNot Null
System Occurrence of this history association usage within the task.
TASKID NumericNot Null
Application Task identifier for associated task.
BATCHTASKID Numeric Application Task (reel or grade) in which this association was created.
TYPE Character (1) Application N = Numeric Log
M = Message Log
Table 16. pdl_variable_view Attributes (Continued)
Attribute Data Type Data Source[] = optional
Description
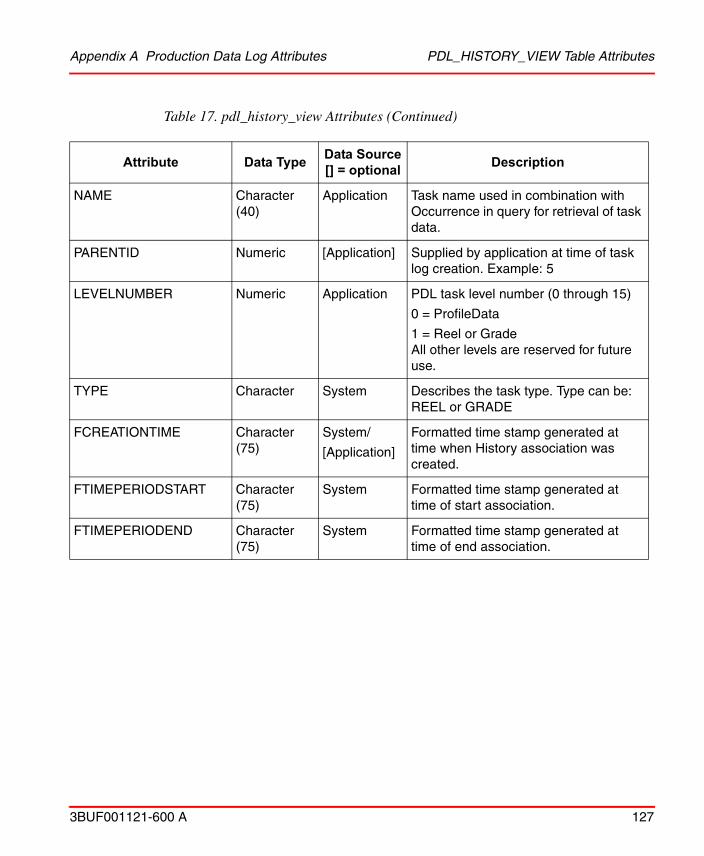
Appendix A Production Data Log Attributes PDL_HISTORY_VIEW Table Attributes
3BUF001121-600 A 127
NAME Character (40)
Application Task name used in combination with Occurrence in query for retrieval of task data.
PARENTID Numeric [Application] Supplied by application at time of task log creation. Example: 5
LEVELNUMBER Numeric Application PDL task level number (0 through 15)
0 = ProfileData
1 = Reel or GradeAll other levels are reserved for future use.
TYPE Character System Describes the task type. Type can be: REEL or GRADE
FCREATIONTIME Character (75)
System/
[Application]
Formatted time stamp generated at time when History association was created.
FTIMEPERIODSTART Character (75)
System Formatted time stamp generated at time of start association.
FTIMEPERIODEND Character (75)
System Formatted time stamp generated at time of end association.
Table 17. pdl_history_view Attributes (Continued)
Attribute Data Type Data Source[] = optional
Description

PDL_HISTORY_VIEW Table Attributes Appendix A Production Data Log Attributes
128 3BUF001121-600 A

3BUF001121-600 A 129
Revision History
IntroductionThis section provides information on the revision history of this User Manual.
Revision HistoryThe following table lists the revision history of this User Manual.
Updates in Revision Index AThe following table shows the updates made in this User Manual for System 800xA 6.0.3:
The revision index of this User Manual is not related to the 800xA 6.0 System Revision.
Revision Index
Description Date
- First version published for 800xA 6.0 August 2014
A Updated for 800xA 6.0.3 September 2016
Updated Section/Sub-section Description of Update
Introduction and Installation sections Updated Operating System References

Updates in Revision Index A
130 3BUF001121-600 A

3BUF001121-600 A 131
Bbounds
upper and lower 41
Cclient 102contour level 41, 56contour map 59cross direction 74cross direction view 70cross hair 60
Ddisplays 17, 49
Ggetting started 49
Hhost 34
Llegend 77
configuring 42
Mmachine direction 70machine direction view 74manual data query 92MDI 34menu
help 18profile specification 18query 18
menu bar 18
Nnavigator 17
Oon-line help 18
Pprofile logs 13profile specification
applying to a view 93creating 37 to 38
Qquality level 41
ad-hoc adjustment 94auto-adjust 56
quality measurementcreating 40select for viewing 54
quality range 41queries
by name 90by time range 88configuring custom queries 84deleting rows 90for archive data 91manual 92selecting 51standard 51start-end ad-hoc 87
Index

Index
132 3BUF001121-600 A
Index
Rruler
cross direction 75machine direction 71
SSDI 34start-up 21, 31
Display Services 33Internet Explorer 31
Ttool bar
cross direction 76machine direction 72
toolbarcontour 70
Uuser interface 16
Vviews
3CDScanAverage 803MDScanAverage 79contourCDMD 58, 82ContourLegend 81contourMDCD 58single 82
Zzoom 61


Power and productivityfor a better worldTM
Contact us
Copyright© 2016 ABB.All rights reserved.
3BU
F00
1121
-600
Awww.abb.com/800xAwww.abb.com/controlsystems