system noise and link budget - sonoma …//homes.esat.kuleuven.be/~cuypers/satellite_noise.pdf...
TRANSCRIPT

SYSTEM NOISE AND LINK BUDGET Updates: 9/24/13; 10/6/14
Introduction • Any system (wired or wireless) receives and generates
unwanted signals • Natural phenomena or man-made (Noise) • Unwanted signals from other systems (Interferences)
• Man-made Noise: due to other subsystems (e.g.; power supply)
• Natural Noise: due to random movements and agitation of electrons in resistive components (e.g., due to temperature)
We focus on system thermal noise!
Thermal Noise Characteristics • Thermal noise due to agitation of electrons
• Except at absolute zero temperature, the electrons in every conductor (resistor) are always in thermal motion
• Function of temperature • Present in all electronic devices and transmission media
• Cannot be eliminated • Particularly significant for satellite communication
• The Sun contributes to the thermal noise at the receiver
http://homes.esat.kuleuven.be/~cuypers/satellite_noise.pdf

Spectral Power Density of (white) Noise • Amount of thermal noise to be found in a bandwidth of 1Hz in any device or conductor is:
• N0 = noise power density (in watts) per 1 Hz of bandwidth
• k = Boltzmann's constant = 1.3803 × 10⁻²³ J/K (or W/(K.Hz))
• T = temperature, in kelvin (absolute temperature) • Note Watt = J/sec = J.Hz
N0 = kT W/Hz( )
Thermal Noise Noise Power
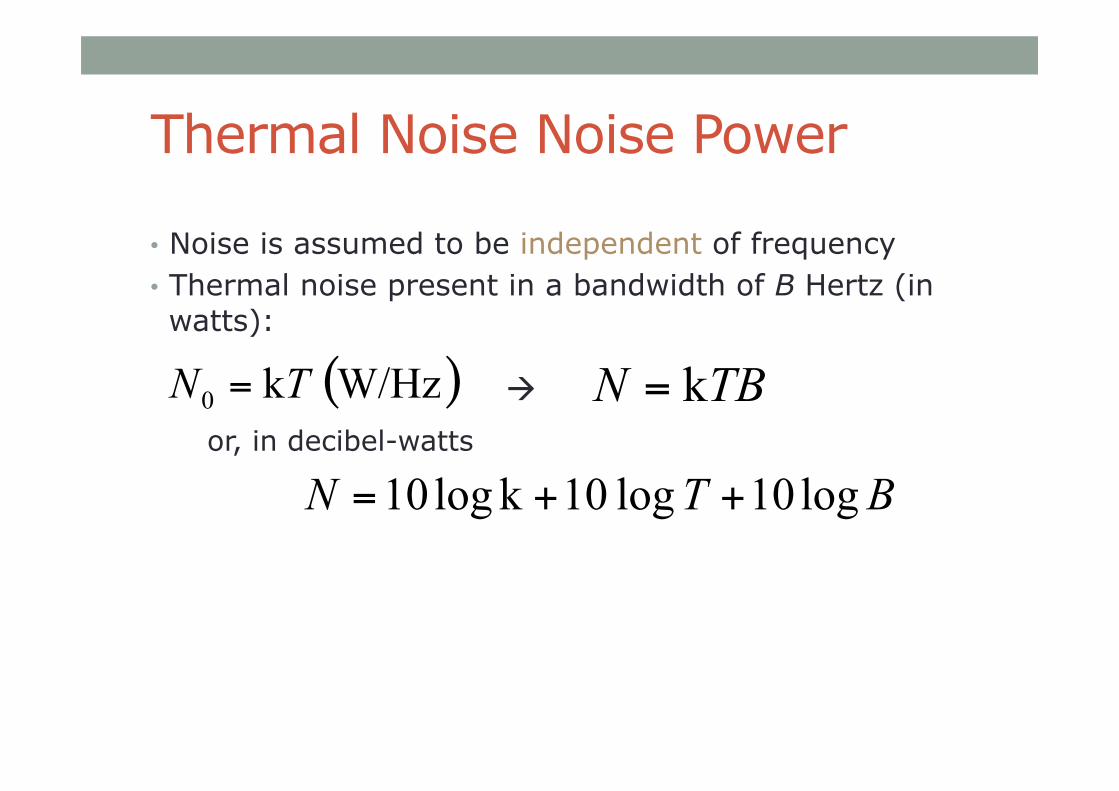
• Noise is assumed to be independent of frequency • Thermal noise present in a bandwidth of B Hertz (in watts):
or, in decibel-watts
( )W/Hz k0 TN = TBN k=
BTN log10 log 10k log10 ++=
à

Thermal or White Noise • From the plot of the spectral density of thermal noise over
frequency, can see that the noise is flat frequency spectrum till around 100GHz or so and starts to fall off at around 1TeraHz
Thermal Noise Model
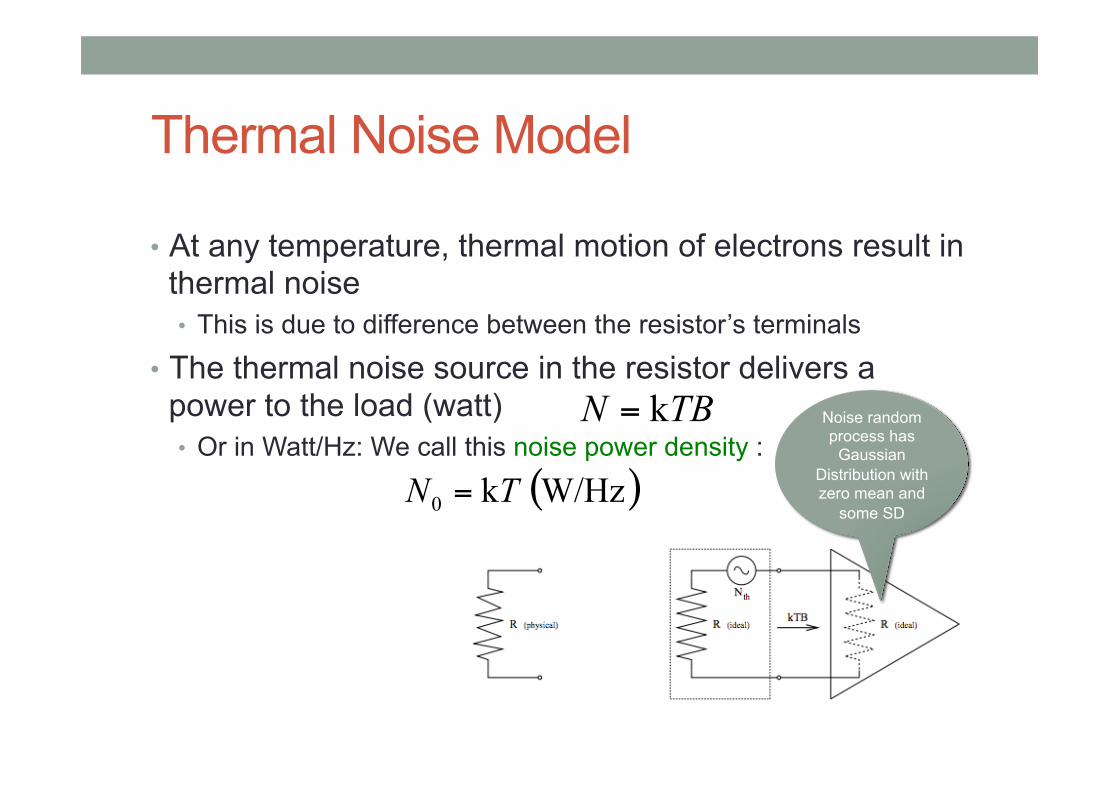
• At any temperature, thermal motion of electrons result in thermal noise • This is due to difference between the resistor’s terminals
• The thermal noise source in the resistor delivers a power to the load (watt) • Or in Watt/Hz: We call this noise power density :
TBN k= Noise random process has
Gaussian Distribution with zero mean and
some SD ( )W/Hz k0 TN =

Modeling the Thermal Noise (Open Circuit – No Load) • The noise generated due to temperature T by a resistive
component has normalized power spectrum (also called mean-square voltage spectrum): 2RkT(V^2/Hz)
• k = Boltzmann's constant = 1.3803 × 10⁻²³ J/K • T = temperature, in kelvin (absolute temperature)
• Therefore the average power that a voltage or current source can deliver (available) is: 2RkT.2B=4RkTB (V^2)
• The RMS voltage equivalent of the thermal noise will be
Vrms = AveragenoisePower = 4kTRB V( )
Example A: Calculate the open-circuit Vrms reading when we connect a true RMS voltmeter to a 100Kohm resistor at room temperature (20 deg. C) with BW=1MHz to measure the generated thermal noise. Draw the equivalent circuit.
True RMS Multimeter
R
Vrms
Equivalent Thermal Noise Model
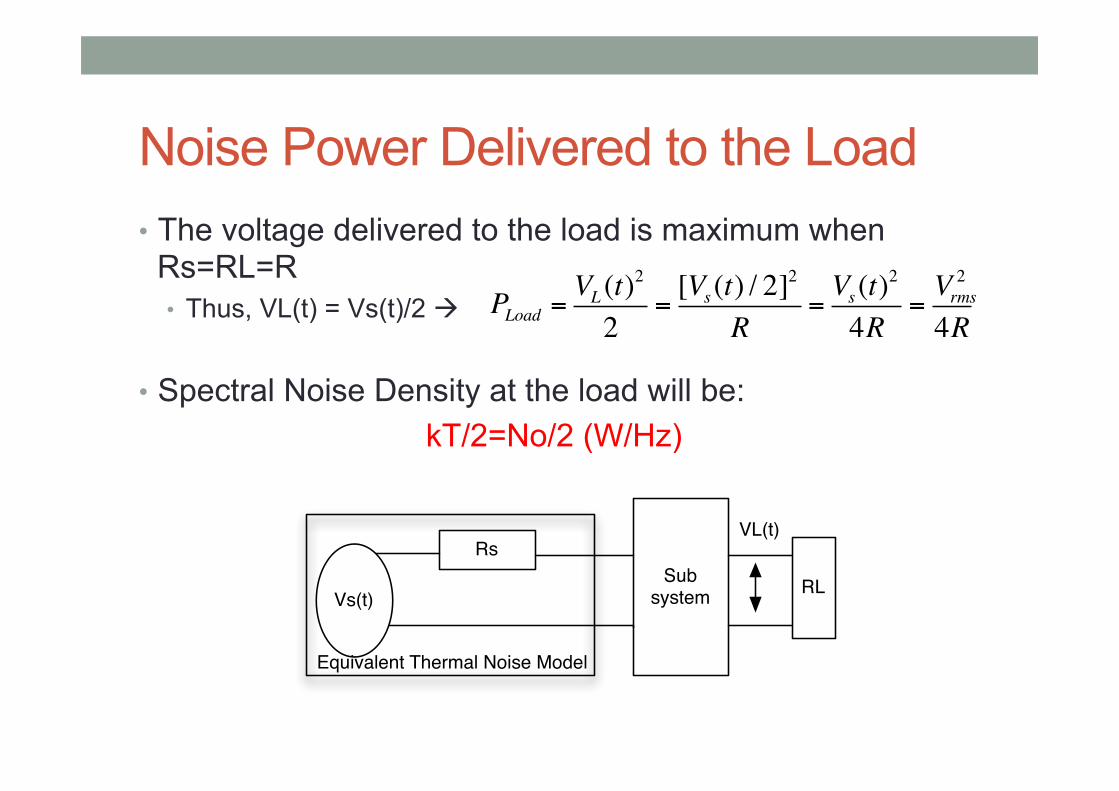
Noise Power Delivered to the Load • The voltage delivered to the load is maximum when
Rs=RL=R • Thus, VL(t) = Vs(t)/2 à
• Spectral Noise Density at the load will be: kT/2=No/2 (W/Hz)
Subsystem
Rs
Vs(t) RL
VL(t)
Equivalent Thermal Noise Model
PLoad =VL (t)
2
2=[Vs (t) / 2]
2
R=Vs (t)
2
4R=Vrms2
4R

Thermal Noise Power %MATLAB CODE: T= 10:1:1000; k= 1.3803*10^-23; B=10^6; No=k*T; N=k*T*B; N_in_dB=10*log10(N); semilogy(T,N_in_dB) title(‘Impact of temperature in
generating thermal noise in dB’) xlabel(‘Temperature in Kelvin’) ylabel(‘Thermal Noise in dB’)
0 100 200 300 400 500 600 700 800 900 1000
-102.15
-102.16
-102.17
-102.18
-102.19
-102.2
Impact of temperature in generating thermal noise in dB
Temperature in Kelvin
Ther
mal
Noi
se in
dB
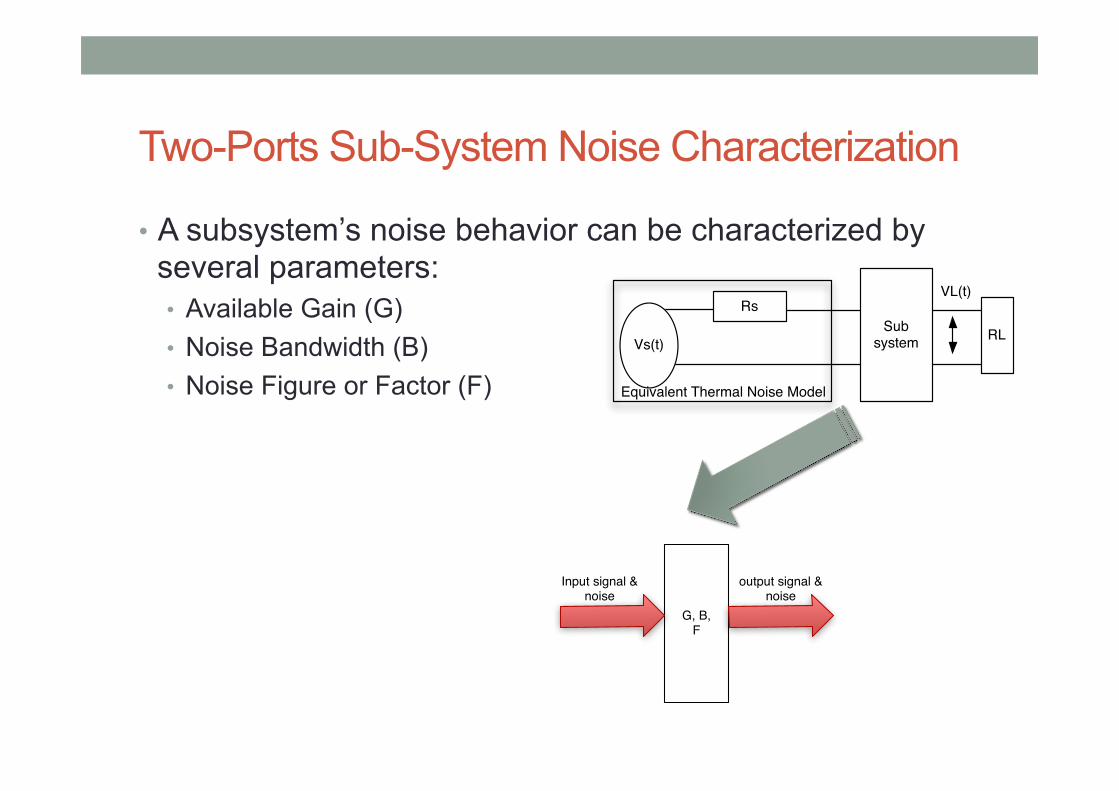
Two-Ports Sub-System Noise Characterization
• A subsystem’s noise behavior can be characterized by several parameters: • Available Gain (G) • Noise Bandwidth (B) • Noise Figure or Factor (F)
G, B,F
Input signal & noise
output signal & noise
Subsystem
Rs
Vs(t) RL
VL(t)
Equivalent Thermal Noise Model

Two-Ports Sub-System Noise Characterization
• A subsystem’s noise behavior can be characterized by several parameters: • Available Gain (G) • Noise Bandwidth (B) • Noise Figure or Factor (F)
• Available Gain: • The available output noise spectral density due to input white noise
will be:
• The available output noise power due to input white noise will be:
Sao =G ⋅N0 / 2 W/Hz( )
Pao =G ⋅2B ⋅N0 / 2 W( )
G, B,F
Input signal & noise
output signal & noise
Sao & Pao No /2

System Noise Bandwidth (B) Two-Ports System
• Assuming the system is driven by white noise!
• So is the available output power spectral density (W/Hz)
• Pao is the available output power (W)
• G=Go is the mid-band available gain (DC gain)
So( f ) =G( f )Si ( f ) =G( f )No
2
Pao = So( f )df =−∞
∞
∫ No
2G( f )df
−∞
∞
∫
Pao =G ⋅2B ⋅N0 / 2 W( )
→ B = 12G
G( f )df−∞
∞
∫
G(f)
Output Power Spectrum Density
So(f)
Input Power Spectrum Density
Si(f)
The available output noise power due to input white noise

Example A • (1) Find the BW for a first-order low-pass Butterworth filter
whose gain is given as follow (assume DC gain Go=1):
• (2) Assuming the input of the system above is driven by
white noise, find the output available power.
G( f ) = 11+ ( f / f3dB )
2
G(f)
Output Power Spectrum Density
So(f)
Input Power Spectrum Density
Si(f)
f3dB
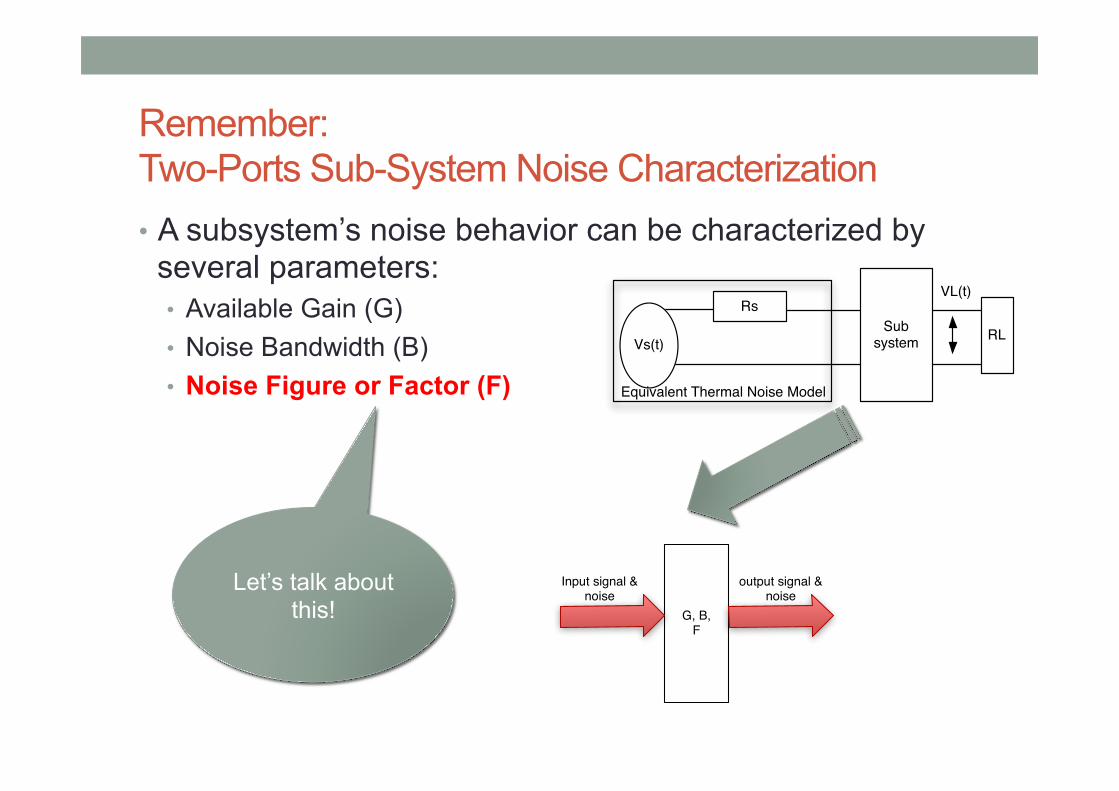
Remember: Two-Ports Sub-System Noise Characterization • A subsystem’s noise behavior can be characterized by
several parameters: • Available Gain (G) • Noise Bandwidth (B) • Noise Figure or Factor (F)
G, B,F
Input signal & noise
output signal & noise
Subsystem
Rs
Vs(t) RL
VL(t)
Equivalent Thermal Noise Model
Let’s talk about this!

System Noise Figure (F)
F = SNRi / SNRo
=1+ TeTo
• The most basic definition of noise figure came into popular use in the 1940’s when Harold Friis defined the noise figure F of a network to be the ratio of the signal-to-noise power ratio at the input to the signal-to-noise power ratio at the output.
http://cp.literature.agilent.com/litweb/pdf/5952-8255E.pdf

G, B,F, Te
SubSystem
Input Signal Power =Psi
Input Noise PowerSpectrum Density Sni=kT
Psi.G
Available Noise PowerDue to input thermal noise: kTGB
Available Noise PowerDue to internal noise: kToGB(F-1) = Nr
System Noise Figure (F) • We define the Noise Figure (Noise Factor) as: à • We often express F in dB • Note that F>1 • Nr is the available output noise power due to the two-port
sub-system • Te is effective (internal) temperature of the subsystem • To is output equivalent temperature into the subsystem
F = SNRi / SNRo
=1+ TeTo
Pao(noise) =kTGB+ kToGB(F −1) =kGB(T +To(F −1))) =k(T +Te) ⋅G ⋅B
Find the expression for SNRi? SNRi = Psi/kToB
Note: T=To

Example B
• Assume the antenna contributes to the input thermal noise of the system by T=10K
• Find the available input noise spectral density (Sai) • Find the available output noise spectral density (Sao) • Find the available output noise power (Pao) • Find the noise figure for the system (F) • Draw the thermal noise circuit model for the antenna
Gain = 100dB B=150 KHz Te = 140 K
output signal & noise
Antenna

Cascaded System
• Cascaded sub-‐systems can be simplifies by combining available gains and noise proper7es (B=B1=B2=B3….) • G_total = Go = G1.G2.G3….. • F_total = F1 + (F2-‐1)/G1 + (F3-‐1)/(G1.G2) + ……. • Te_total = (F_total – 1).Toà F_total = 1+[Te_total /To]
• Note that:
Unit 2 (F2, G2, B2) Pao
Antenna (G, To, R) Or à(G, T)
Unit 1 (F1, G1, B1)
Unit 3 (F3, G3, B3)
Total Gain
R is the equivalent antenna resistance T is effective temperature resulting in noise

Example C Cascaded System
• T_ant=20K • For LNA: G1=10 dB, F1 = 3 dB • For Mixer: G2 = 9 dB, F2 = 6.5 dB • Find G_total, F_total, Te, Noise Power, Pnd • Simplified Model:
• G_total = G1.G2 • F_total = F1 + (F2-‐1)/G1 • Te = (F_total – 1).To
Mixer (F2, G2, B2) Pnd
Antenna (G, T)
To IF Amp Low Noise Amp (F1, G1, B1)
RX Model (F_total, G_total, Te, B) Pnd=Pao
Psd Antenna Noise
Received Power
See notes!
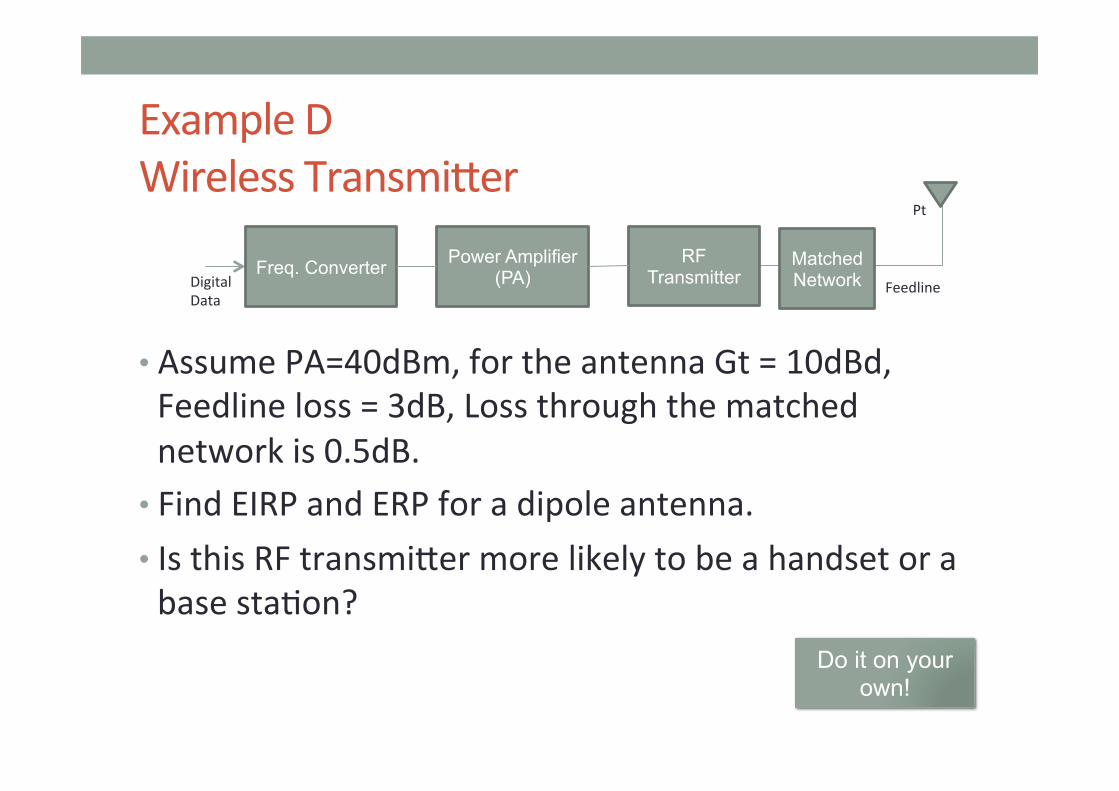
Example D Wireless Transmi`er
• Assume PA=40dBm, for the antenna Gt = 10dBd, Feedline loss = 3dB, Loss through the matched network is 0.5dB.
• Find EIRP and ERP for a dipole antenna. • Is this RF transmi`er more likely to be a handset or a base sta7on?
Power Amplifier (PA) Feedline
Pt
RF Transmitter Digital
Data
Freq. Converter Matched Network
Do it on your own!
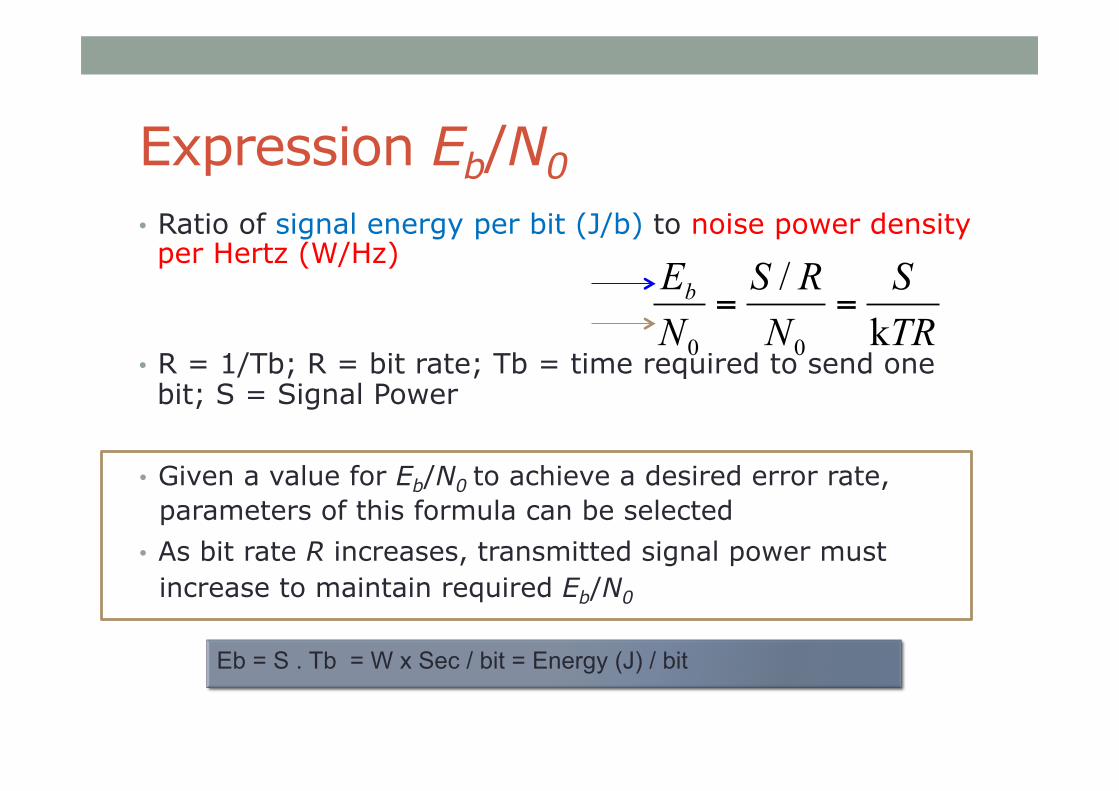
Expression Eb/N0 • Ratio of signal energy per bit (J/b) to noise power density per Hertz (W/Hz)
• R = 1/Tb; R = bit rate; Tb = time required to send one bit; S = Signal Power
TRS
NRS
NEb
k/
00
==
Eb = S . Tb = W x Sec / bit = Energy (J) / bit
• Given a value for Eb/N0 to achieve a desired error rate, parameters of this formula can be selected
• As bit rate R increases, transmitted signal power must increase to maintain required Eb/N0
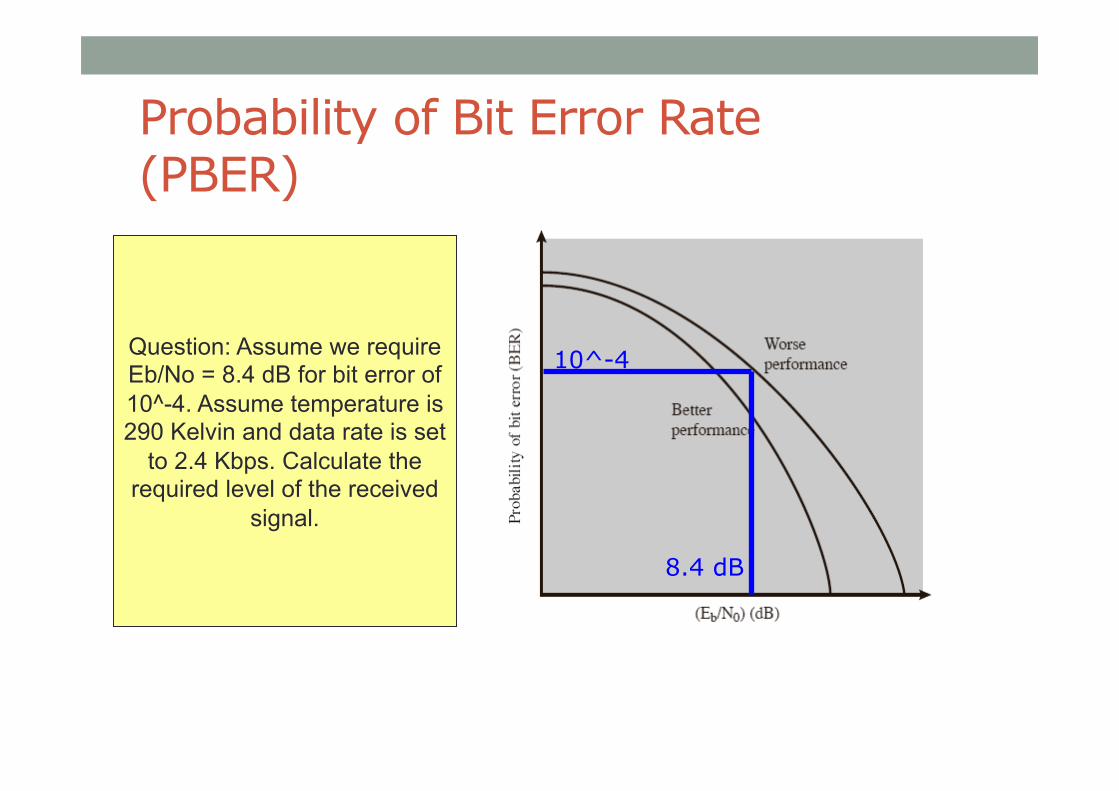
Probability of Bit Error Rate (PBER)
Question: Assume we require Eb/No = 8.4 dB for bit error of 10^-4. Assume temperature is 290 Kelvin and data rate is set
to 2.4 Kbps. Calculate the required level of the received
signal.
8.4 dB
10^-4
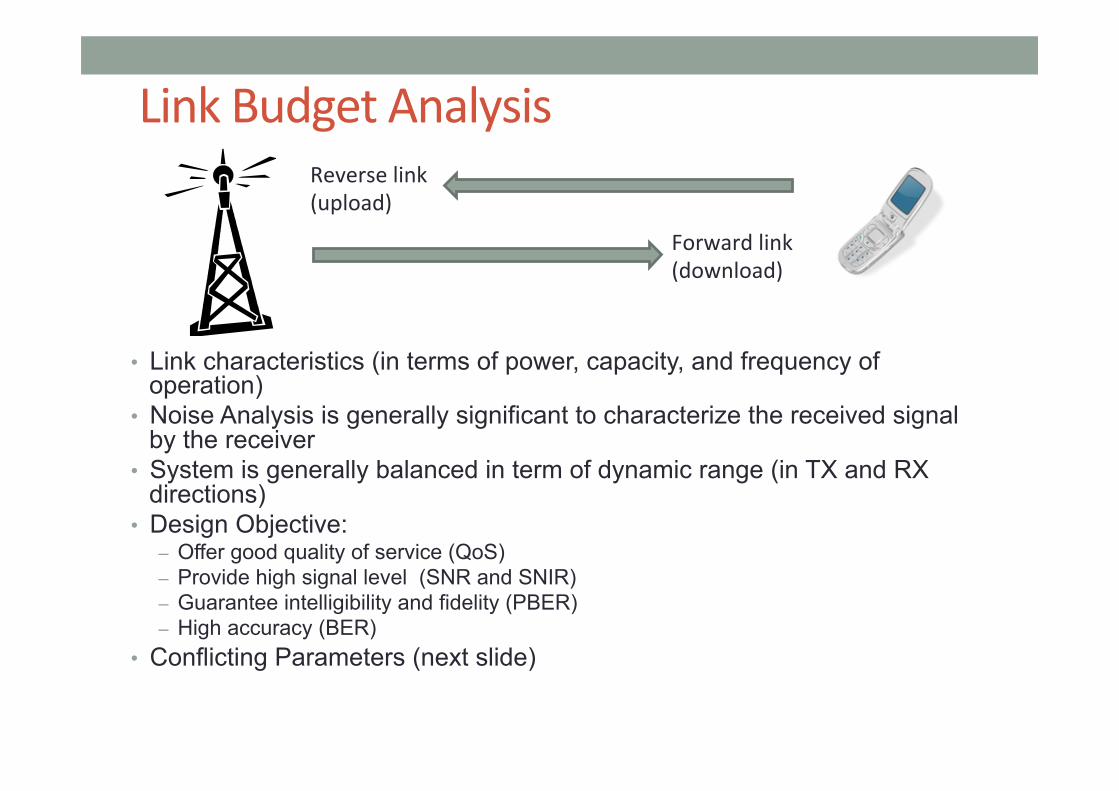
Link Budget Analysis
• Link characteristics (in terms of power, capacity, and frequency of operation)
• Noise Analysis is generally significant to characterize the received signal by the receiver
• System is generally balanced in term of dynamic range (in TX and RX directions)
• Design Objective: – Offer good quality of service (QoS) – Provide high signal level (SNR and SNIR) – Guarantee intelligibility and fidelity (PBER) – High accuracy (BER)
• Conflicting Parameters (next slide)
Forward link (download)
Reverse link (upload)
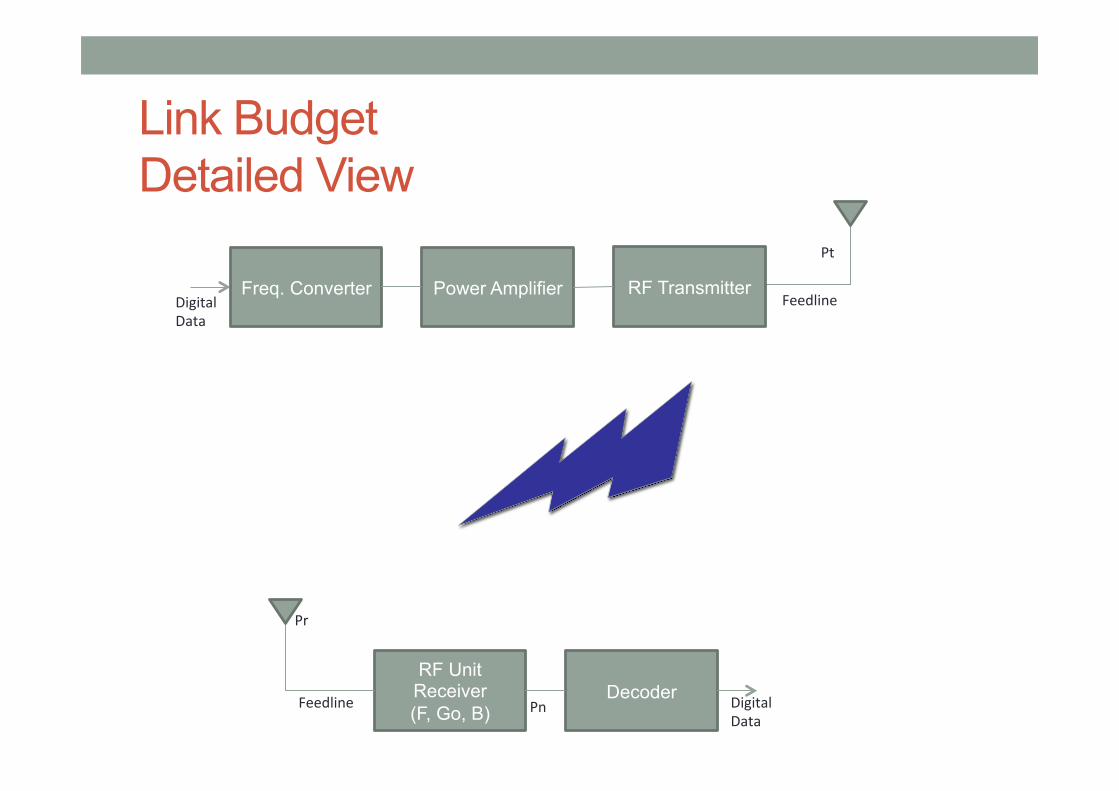
Link Budget Detailed View
RF Unit Receiver (F, Go, B) Feedline
Pr
Decoder Pn Digital
Data
Power Amplifier Feedline
Pt
RF Transmitter Digital Data
Freq. Converter

Budget Link Analysis - Conflicting Parameters
• BW & QoS & Thermal Noise • SNR & QoS/Fidelity & Pt & Cost • BER & QoS & SNR & Pt & Cost • Freq. & Fidelity & Dynamic Range • System Loss & Dynamic Range & QoS & Material & Cost • Quiescent Power Dissipa7on & Life Time & Cost & Complexity • Bit rate & Noise • Temperature & SNR •
Let us see how through an example! à
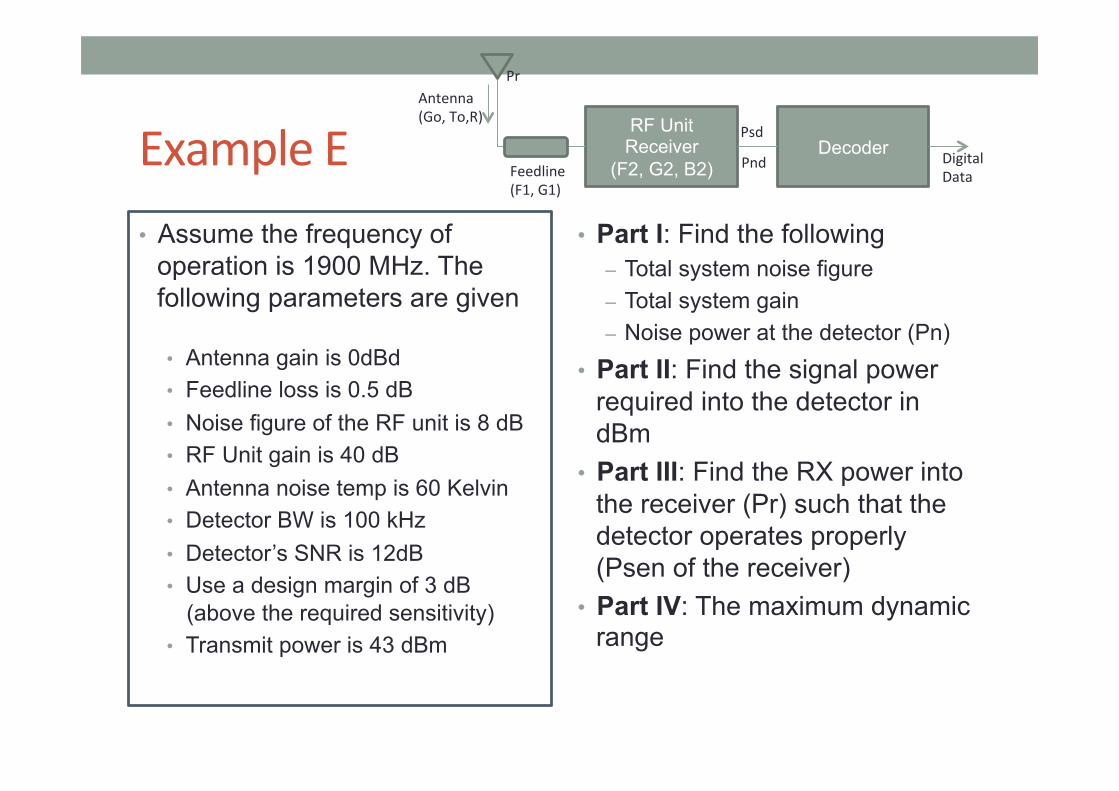
Example E • Assume the frequency of
operation is 1900 MHz. The following parameters are given
• Antenna gain is 0dBd • Feedline loss is 0.5 dB • Noise figure of the RF unit is 8 dB • RF Unit gain is 40 dB • Antenna noise temp is 60 Kelvin • Detector BW is 100 kHz • Detector’s SNR is 12dB • Use a design margin of 3 dB
(above the required sensitivity) • Transmit power is 43 dBm
• Part I: Find the following – Total system noise figure – Total system gain – Noise power at the detector (Pn)
• Part II: Find the signal power required into the detector in dBm
• Part III: Find the RX power into the receiver (Pr) such that the detector operates properly (Psen of the receiver)
• Part IV: The maximum dynamic range
RF Unit Receiver
(F2, G2, B2) Feedline (F1, G1)
Pr
Decoder Pnd Digital
Data
Antenna (Go, To,R)
Psd

Example E – Part I Solu7on • No = KT • F1= Feedline Loss • G1 = 1/F1 = for Transmission Line • F_total = F1 + (F2-‐1)/G1 • Go=0 dB; G_total=Go.G1.G2 • Pnd = k.To.G_total.B.F_total • Te = (F_total – 1).To
RF Unit Receiver
(F2, G2, B2) Feedline (F1, G1)
Pr
Decoder Pnd Digital
Data
Antenna (Go, T)
Psd
RX Model (F_total, G_total, Te, B) Pnd
Psd Antenna Noise
Received Power
Part II Solu+on: • Signal Power Required for the Detector – Noise Power = Psd – Pnd = SNR dB
Part III Solu+on: • Pr (min) + G_total = Psdà Psens = Psd – G_total
Part IV Solu+on:
• L_path + Pt – P_marg = Psens (dB)

Budget Link Analysis - Review Conflicting Parameters
• BW & QoS & Thermal Noise • SNR & QoS/Fidelity & Pt & Cost • BER & QoS & SNR & Pt & Cost • Freq. & Fidelity & Dynamic Range • System Loss & Dynamic Range & QoS & Material & Cost • Quiescent Power Dissipa7on & Life Time & Cost & Complexity • Bit rate & Noise • Temperature & SNR •

Other Types of Noise
• Intermodulation noise – occurs if signals with different frequencies share the same medium • Interference caused by a signal produced at a frequency that
is the sum or difference of original frequencies • Crosstalk – unwanted coupling between signal paths • Impulse noise – irregular pulses or noise spikes
• Short duration and of relatively high amplitude • Caused by external electromagnetic disturbances, or faults
and flaws in the communications system
Question: Assume the impulse noise is 10 msec. How many bits of DATA are corrupted if we are using a Modem operating
at 64 Kbps with 1 Stop bit?
64000 x 7/8 = 56000 bit / sec 56000 x .01 = 560 data bits effected
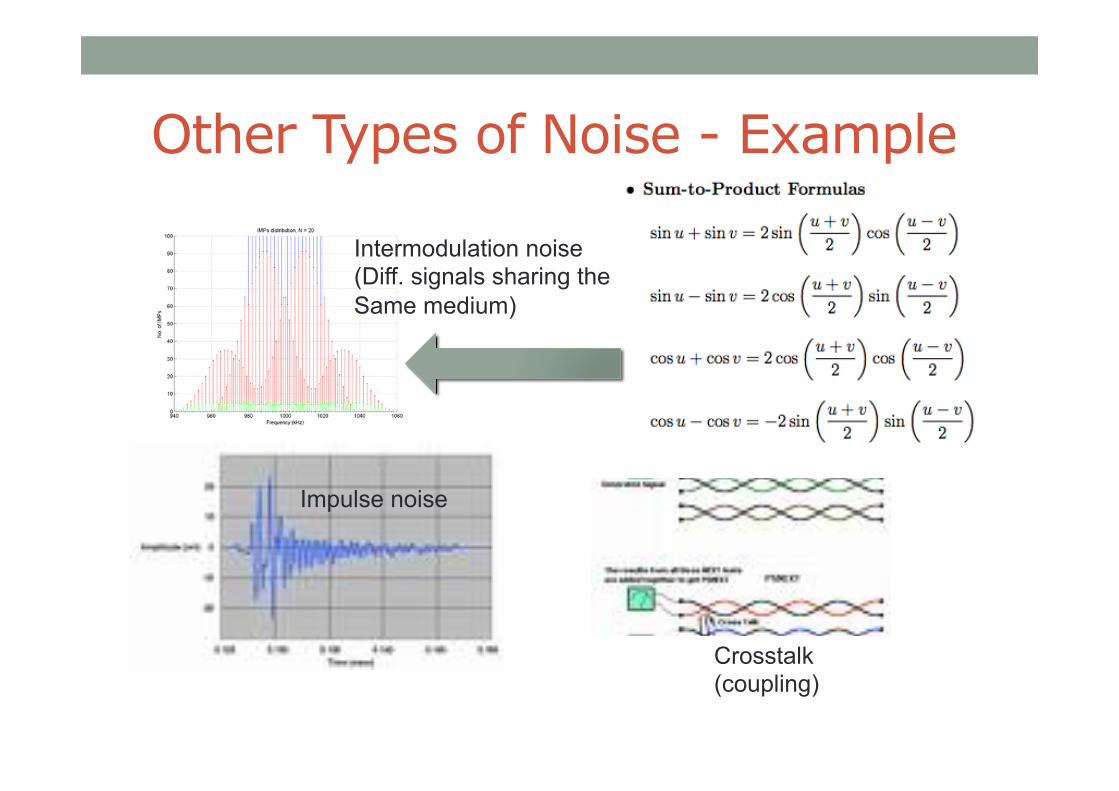
Other Types of Noise - Example
Intermodulation noise (Diff. signals sharing the Same medium)
Crosstalk (coupling)
Impulse noise
What Next? • Other types of impairments….. • Channel characteristics
Other Impairments • Atmospheric absorption – water vapor and oxygen contribute to attenuation
• Multipath – obstacles reflect signals so that multiple copies with varying delays are received
• Refraction – bending of radio waves as they propagate through the atmosphere
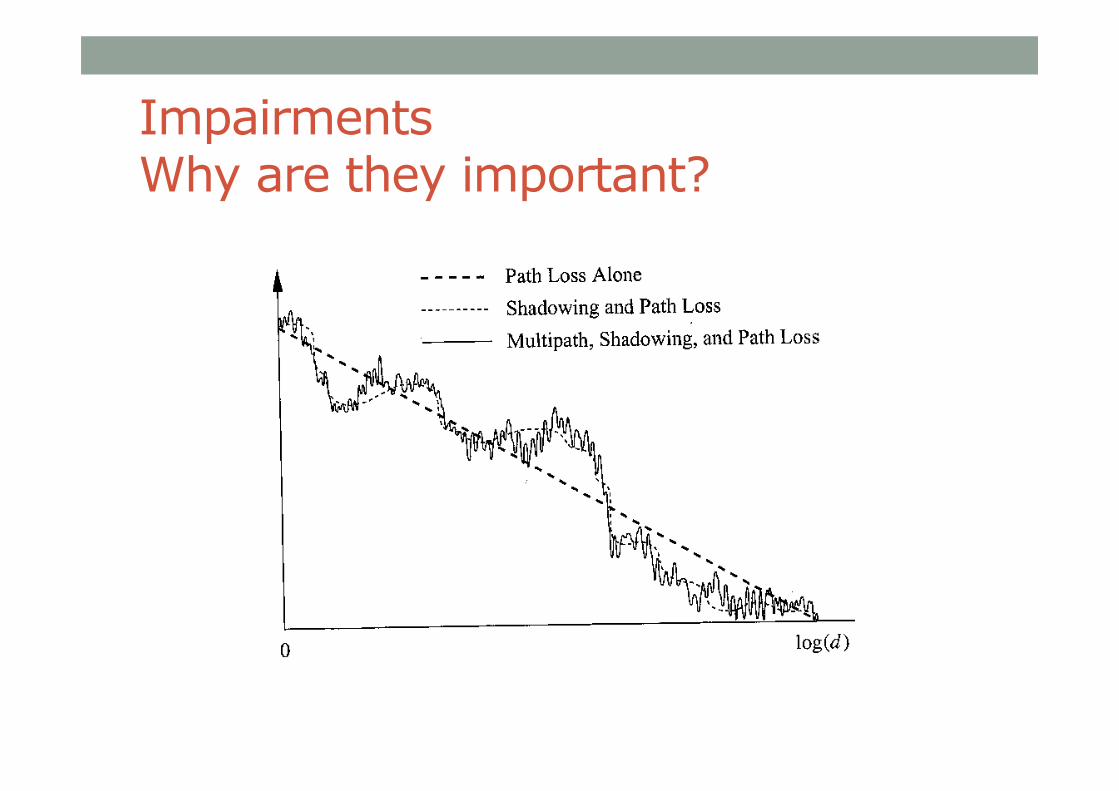
Impairments Why are they important?

References • Black, Bruce A., et al. Introduction to wireless systems. Prentice Hall PTR, 2008, Chapter 2
• Stallings, William. Wireless Communications & Networks, 2/E. Pearson Education India, 2009; Section 5.3
• M F Mesiya, Contemporary Communication Systems, First edition Chapter 6.