systems analysis and design allen dennis and …handout.pdfthe overall system. ... & roth...
TRANSCRIPT
Alan Dennis, Barbara Haley Wixom, and Roberta RothJohn Wiley & Sons, Inc.
Slides by Cristina G. RiveraBataan Peninsula State University
PowerPoint Presentation for Dennis, Wixom, & Roth Systems Analysis and Design, 3rd EditionCopyright 2006 © John Wiley & Sons, Inc. All rights reserved.
Chapter 5
PowerPoint Presentation for Dennis, Wixom, & Roth Systems Analysis and Design, 3rd EditionCopyright 2006 © John Wiley & Sons, Inc. All rights reserved.
Key Definitions
Process model
A formal way of representing how a
business system operates
Illustrates the activities that are
performed and how data moves among
them
Data flow diagramming
A common technique for creating process
models
PowerPoint Presentation for Dennis, Wixom, & Roth Systems Analysis and Design, 3rd EditionCopyright 2006 © John Wiley & Sons, Inc. All rights reserved.

Key Definitions
Logical process models describe
processes without suggesting how they
are conducted
Physical process models provide
information that is needed to build the
system
PowerPoint Presentation for Dennis, Wixom, & Roth Systems Analysis and Design, 3rd EditionCopyright 2006 © John Wiley & Sons, Inc. All rights reserved.
PowerPoint Presentation for Dennis, Wixom, & Roth Systems Analysis and Design, 3rd EditionCopyright 2006 © John Wiley & Sons, Inc. All rights reserved.
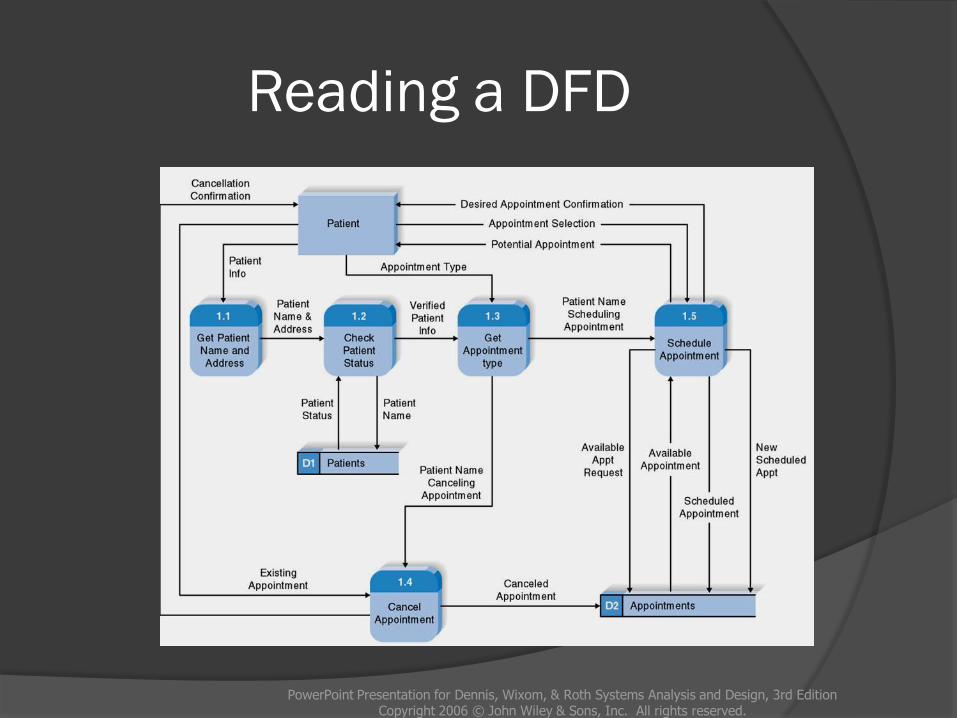
Reading a DFD
PowerPoint Presentation for Dennis, Wixom, & Roth Systems Analysis and Design, 3rd EditionCopyright 2006 © John Wiley & Sons, Inc. All rights reserved.
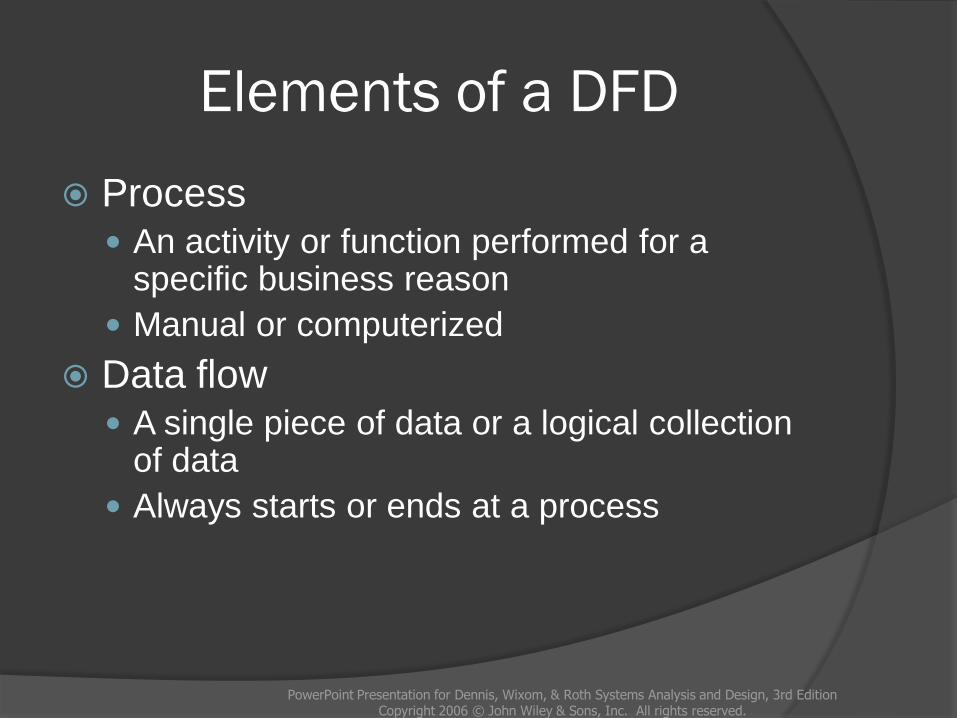
Elements of a DFD
Process An activity or function performed for a
specific business reason
Manual or computerized
Data flow A single piece of data or a logical collection
of data
Always starts or ends at a process
PowerPoint Presentation for Dennis, Wixom, & Roth Systems Analysis and Design, 3rd EditionCopyright 2006 © John Wiley & Sons, Inc. All rights reserved.
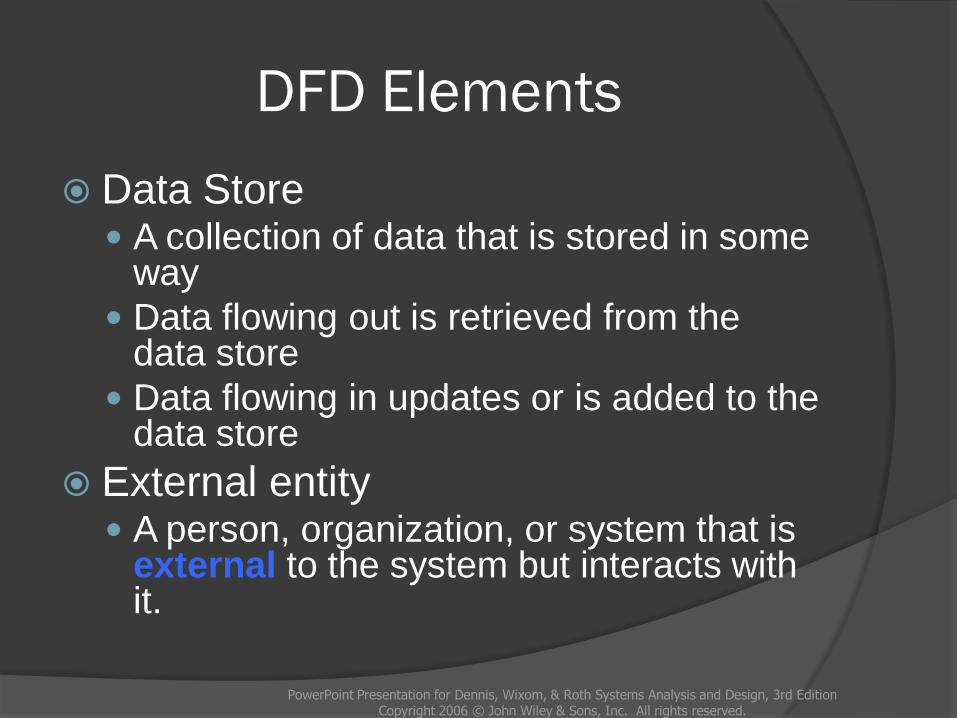
DFD Elements
Data Store A collection of data that is stored in some
way
Data flowing out is retrieved from the data store
Data flowing in updates or is added to the data store
External entity A person, organization, or system that is
external to the system but interacts with it.
PowerPoint Presentation for Dennis, Wixom, & Roth Systems Analysis and Design, 3rd EditionCopyright 2006 © John Wiley & Sons, Inc. All rights reserved.
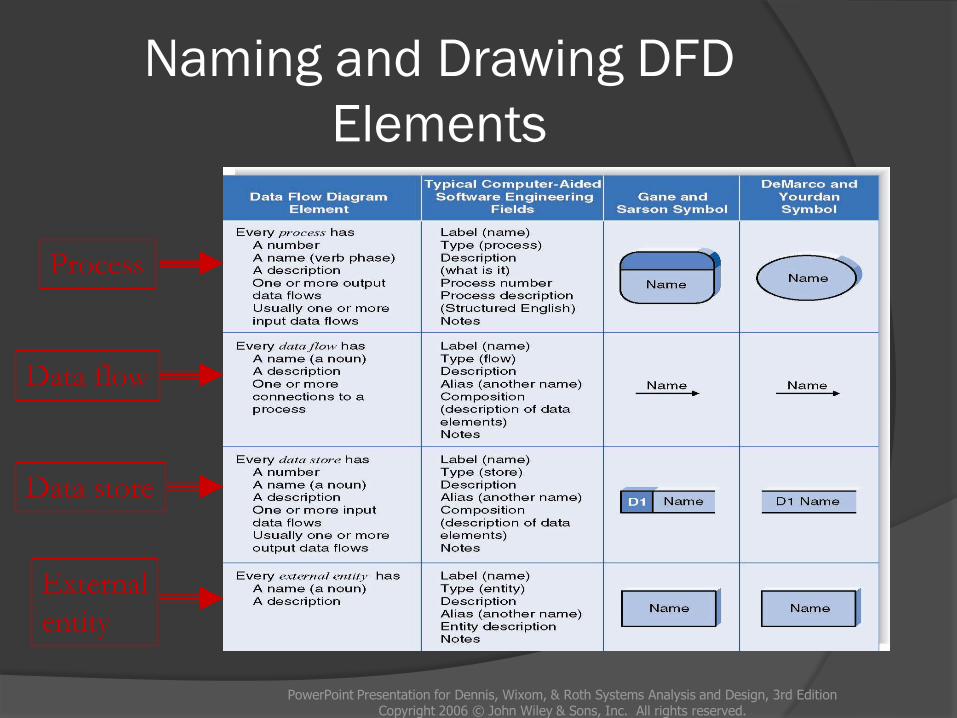
Naming and Drawing DFD
Elements
PowerPoint Presentation for Dennis, Wixom, & Roth Systems Analysis and Design, 3rd EditionCopyright 2006 © John Wiley & Sons, Inc. All rights reserved.
Process
Data flow
Data store
External
entity
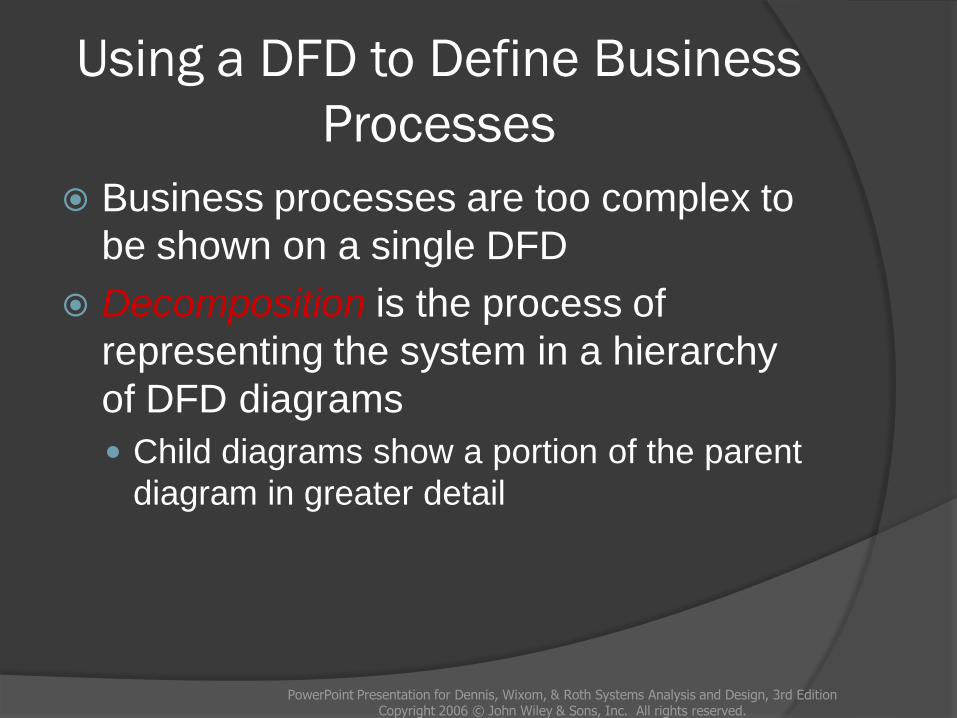
Using a DFD to Define Business
Processes
Business processes are too complex to
be shown on a single DFD
Decomposition is the process of
representing the system in a hierarchy
of DFD diagrams
Child diagrams show a portion of the parent
diagram in greater detail
PowerPoint Presentation for Dennis, Wixom, & Roth Systems Analysis and Design, 3rd EditionCopyright 2006 © John Wiley & Sons, Inc. All rights reserved.
Key Definition
PowerPoint Presentation for Dennis, Wixom, & Roth Systems Analysis and Design, 3rd EditionCopyright 2006 © John Wiley & Sons, Inc. All rights reserved.
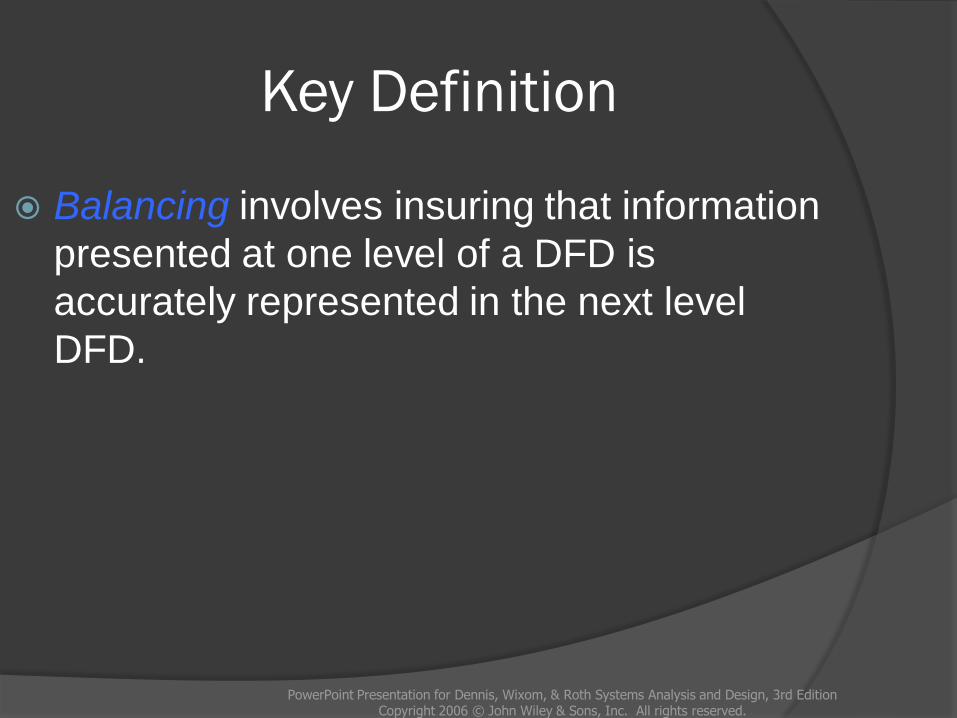
Balancing involves insuring that information
presented at one level of a DFD is
accurately represented in the next level
DFD.
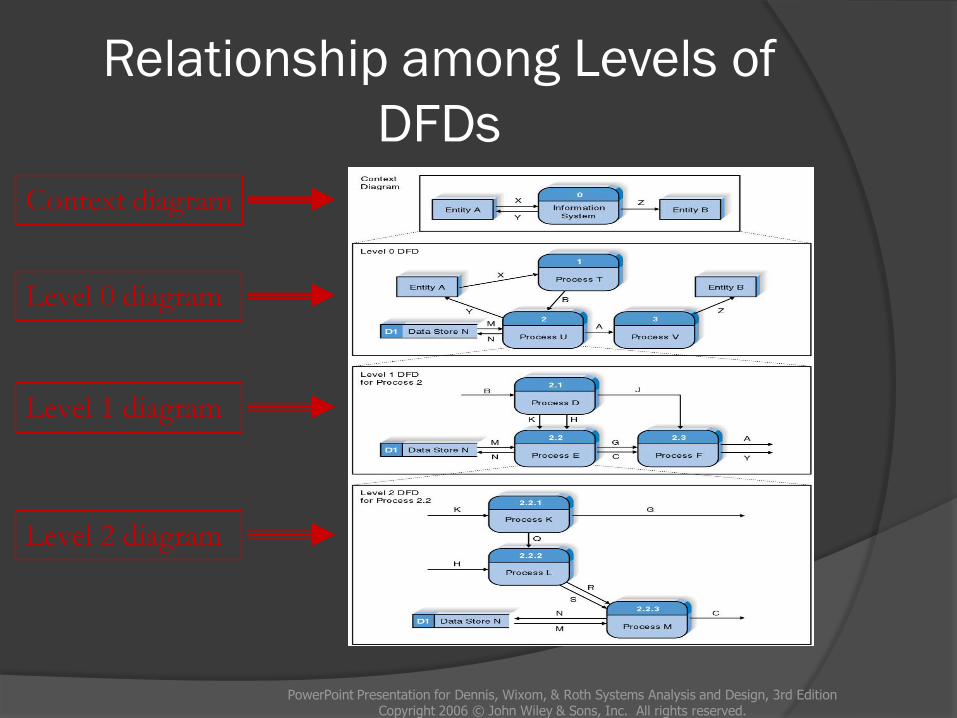
Relationship among Levels of
DFDs
PowerPoint Presentation for Dennis, Wixom, & Roth Systems Analysis and Design, 3rd EditionCopyright 2006 © John Wiley & Sons, Inc. All rights reserved.
Context diagram
Level 0 diagram
Level 1 diagram
Level 2 diagram
Context Diagram
PowerPoint Presentation for Dennis, Wixom, & Roth Systems Analysis and Design, 3rd EditionCopyright 2006 © John Wiley & Sons, Inc. All rights reserved.
First DFD in every business process
Shows the context into which the
business process fits
Shows the overall business process as
just one process (process 0)
Shows all the external entities that
receive information from or contribute
information to the system
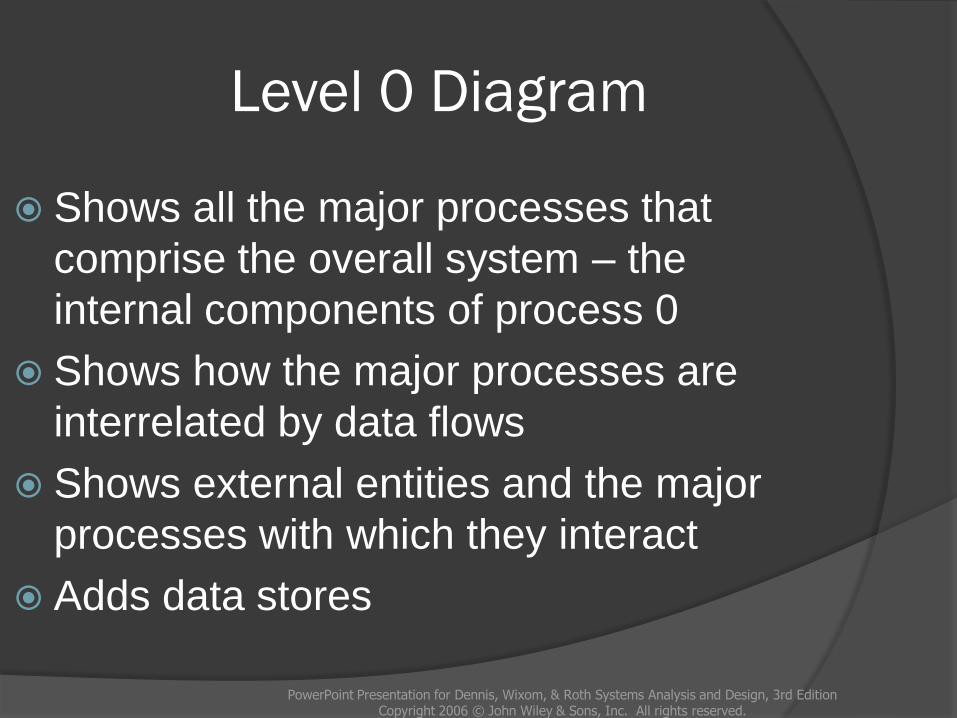
Level 0 Diagram
PowerPoint Presentation for Dennis, Wixom, & Roth Systems Analysis and Design, 3rd EditionCopyright 2006 © John Wiley & Sons, Inc. All rights reserved.
Shows all the major processes that
comprise the overall system – the
internal components of process 0
Shows how the major processes are
interrelated by data flows
Shows external entities and the major
processes with which they interact
Adds data stores
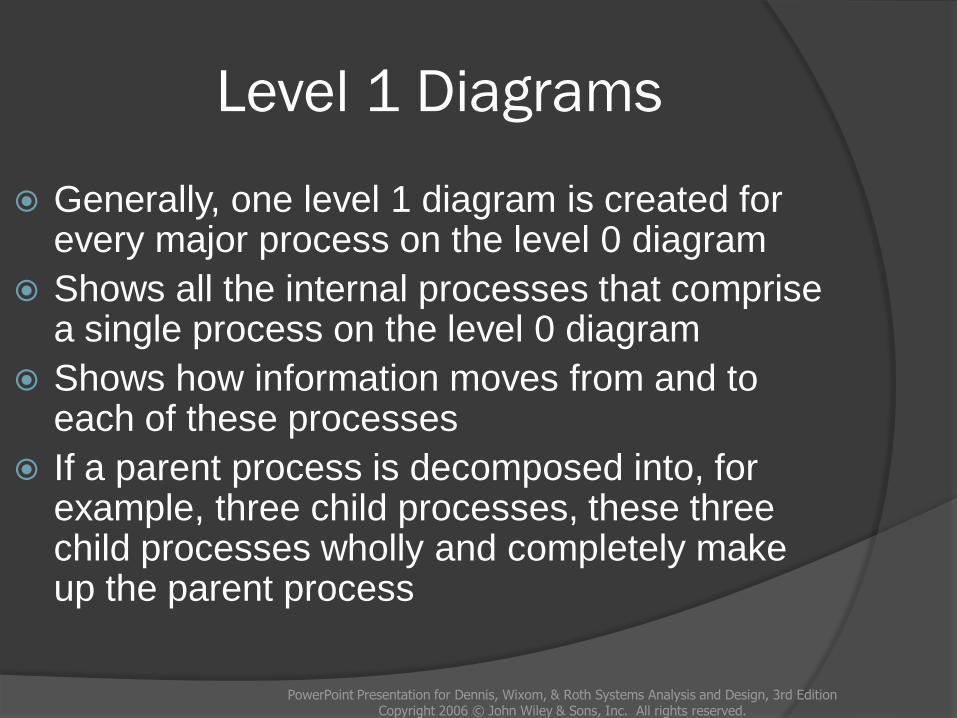
Level 1 Diagrams
PowerPoint Presentation for Dennis, Wixom, & Roth Systems Analysis and Design, 3rd EditionCopyright 2006 © John Wiley & Sons, Inc. All rights reserved.
Generally, one level 1 diagram is created for every major process on the level 0 diagram
Shows all the internal processes that comprise a single process on the level 0 diagram
Shows how information moves from and to each of these processes
If a parent process is decomposed into, for example, three child processes, these three child processes wholly and completely make up the parent process
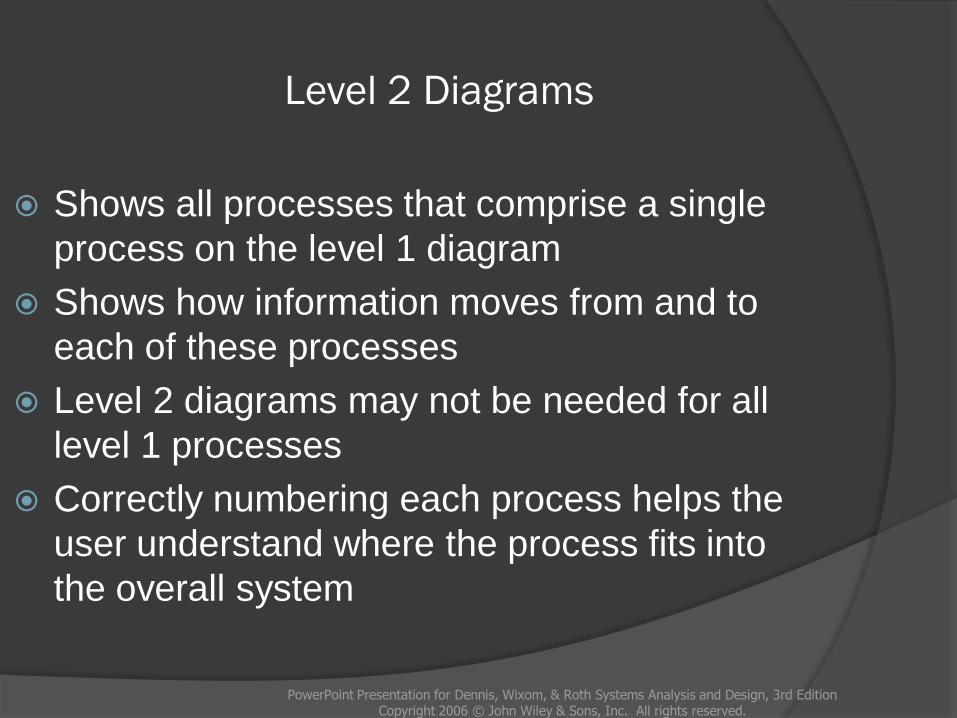
Level 2 Diagrams
PowerPoint Presentation for Dennis, Wixom, & Roth Systems Analysis and Design, 3rd EditionCopyright 2006 © John Wiley & Sons, Inc. All rights reserved.
Shows all processes that comprise a single
process on the level 1 diagram
Shows how information moves from and to
each of these processes
Level 2 diagrams may not be needed for all
level 1 processes
Correctly numbering each process helps the
user understand where the process fits into
the overall system
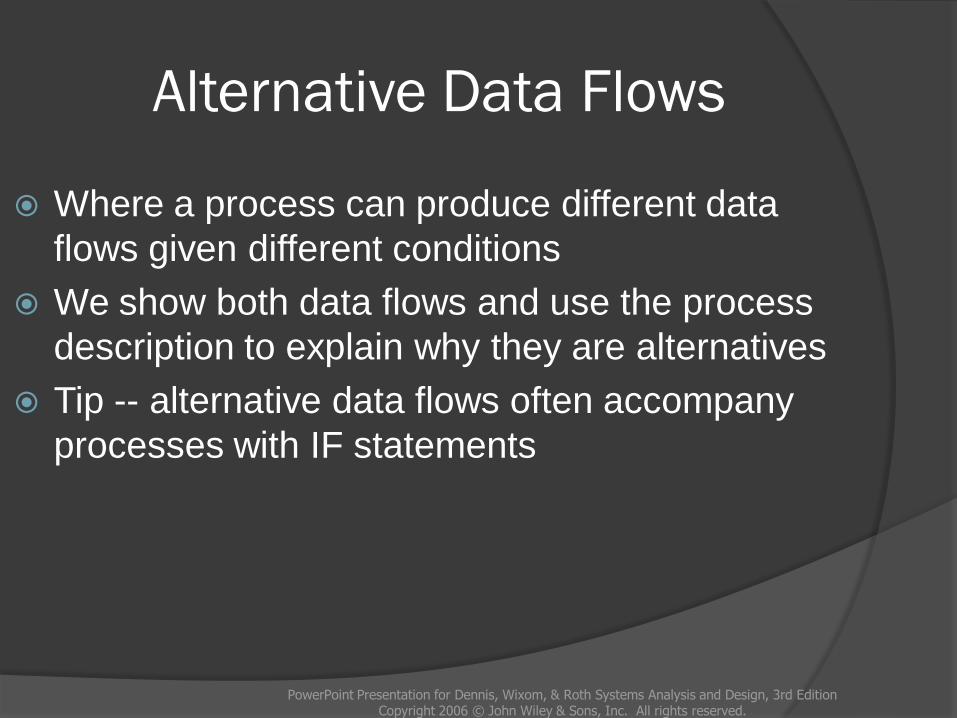
Alternative Data Flows
PowerPoint Presentation for Dennis, Wixom, & Roth Systems Analysis and Design, 3rd EditionCopyright 2006 © John Wiley & Sons, Inc. All rights reserved.
Where a process can produce different data
flows given different conditions
We show both data flows and use the process
description to explain why they are alternatives
Tip -- alternative data flows often accompany
processes with IF statements
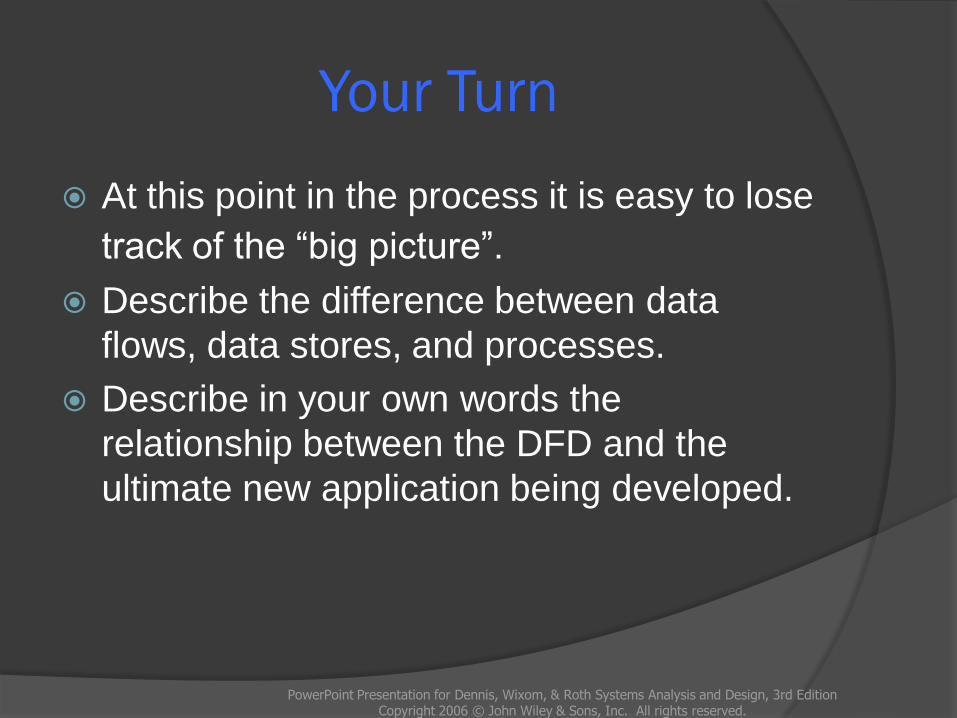
Your Turn
At this point in the process it is easy to lose
track of the “big picture”.
Describe the difference between data
flows, data stores, and processes.
Describe in your own words the
relationship between the DFD and the
ultimate new application being developed.
PowerPoint Presentation for Dennis, Wixom, & Roth Systems Analysis and Design, 3rd EditionCopyright 2006 © John Wiley & Sons, Inc. All rights reserved.
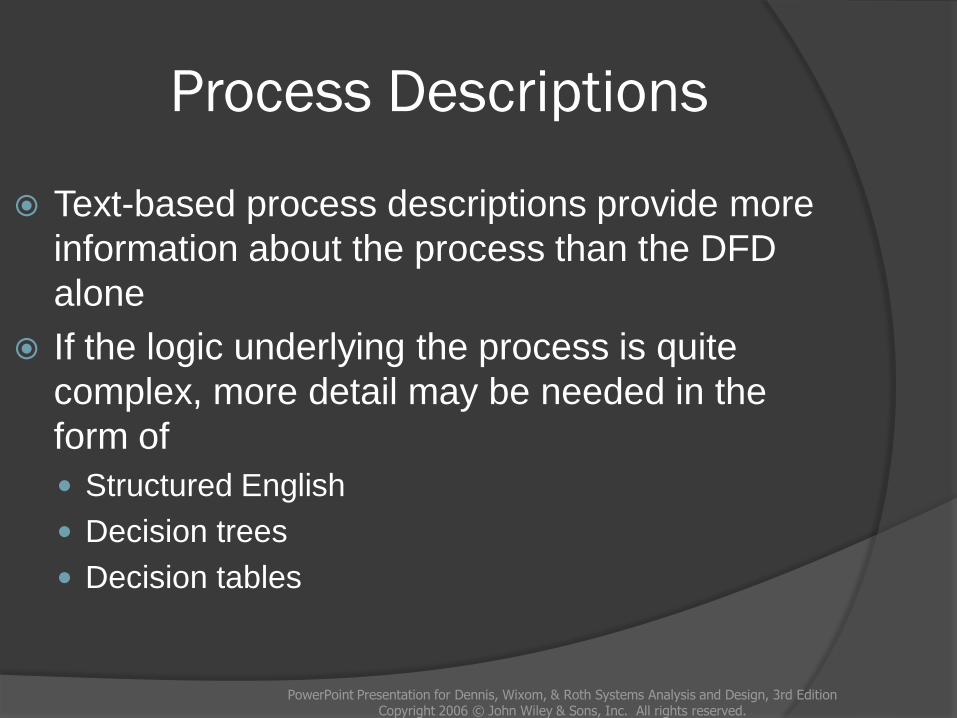
Process Descriptions
PowerPoint Presentation for Dennis, Wixom, & Roth Systems Analysis and Design, 3rd EditionCopyright 2006 © John Wiley & Sons, Inc. All rights reserved.
Text-based process descriptions provide more
information about the process than the DFD
alone
If the logic underlying the process is quite
complex, more detail may be needed in the
form of
Structured English
Decision trees
Decision tables
PowerPoint Presentation for Dennis, Wixom, & Roth Systems Analysis and Design, 3rd EditionCopyright 2006 © John Wiley & Sons, Inc. All rights reserved.
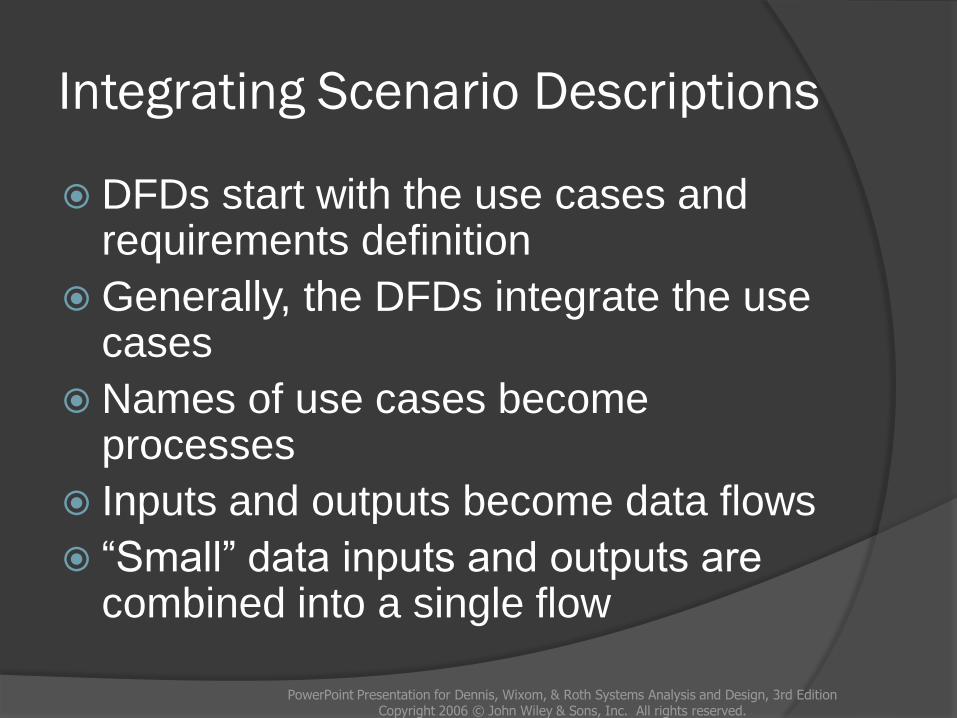
Integrating Scenario Descriptions
DFDs start with the use cases and requirements definition
Generally, the DFDs integrate the use cases
Names of use cases become processes
Inputs and outputs become data flows
“Small” data inputs and outputs are combined into a single flow
PowerPoint Presentation for Dennis, Wixom, & Roth Systems Analysis and Design, 3rd EditionCopyright 2006 © John Wiley & Sons, Inc. All rights reserved.
Steps in Building DFDs
Build the context diagram
Create DFD fragments for each use case
Organize DFD fragments into level 0 diagram
Decompose level 0 processes into level 1 diagrams as needed; decompose level 1 processes into level 2 diagrams as needed; etc.
Validate DFDs with user to ensure completeness and correctness
PowerPoint Presentation for Dennis, Wixom, & Roth Systems Analysis and Design, 3rd EditionCopyright 2006 © John Wiley & Sons, Inc. All rights reserved.
Creating the Context Diagram
Draw one process representing the
entire system (process 0)
Find all inputs and outputs listed at
the top of the use cases that come
from or go to external entities; draw
as data flows
Draw in external entities as the
source or destination of the data flows
PowerPoint Presentation for Dennis, Wixom, & Roth Systems Analysis and Design, 3rd EditionCopyright 2006 © John Wiley & Sons, Inc. All rights reserved.
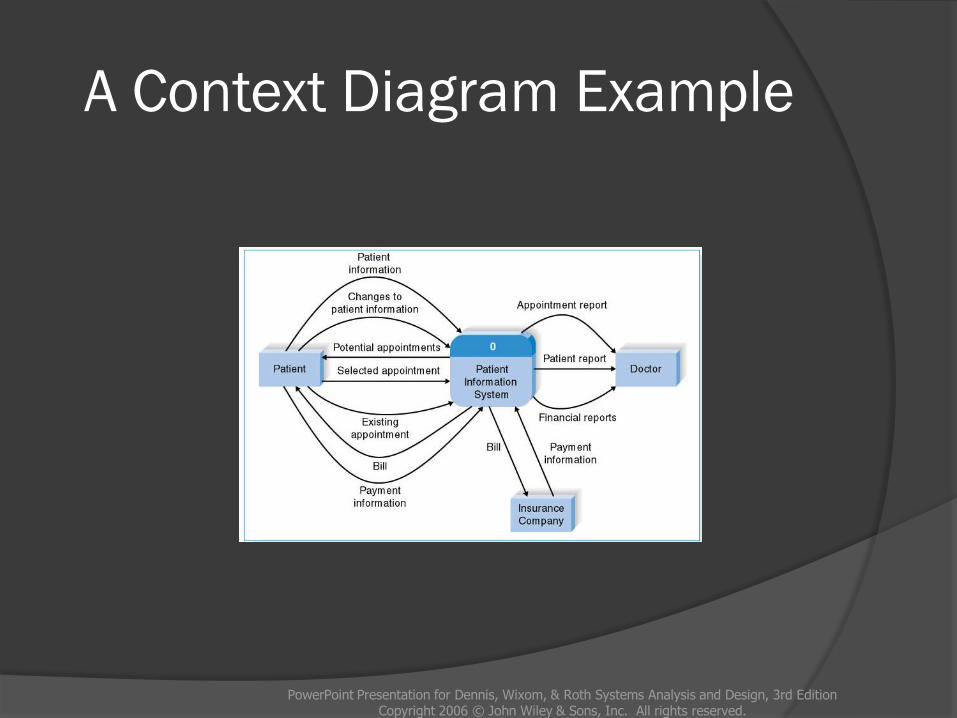
A Context Diagram Example
PowerPoint Presentation for Dennis, Wixom, & Roth Systems Analysis and Design, 3rd EditionCopyright 2006 © John Wiley & Sons, Inc. All rights reserved.
Creating DFD Fragments
Each use case is converted into one DFD
fragment
Number the process the same as the use
case number
Change process name into verb phrase
Design the processes from the viewpoint of
the organization running the system
PowerPoint Presentation for Dennis, Wixom, & Roth Systems Analysis and Design, 3rd EditionCopyright 2006 © John Wiley & Sons, Inc. All rights reserved.
Creating DFD Fragments
Add data flows to show use of data
stores as sources and destinations of
data
Layouts typically place
processes in the center
inputs from the left
outputs to the right
stores beneath the processes
PowerPoint Presentation for Dennis, Wixom, & Roth Systems Analysis and Design, 3rd EditionCopyright 2006 © John Wiley & Sons, Inc. All rights reserved.
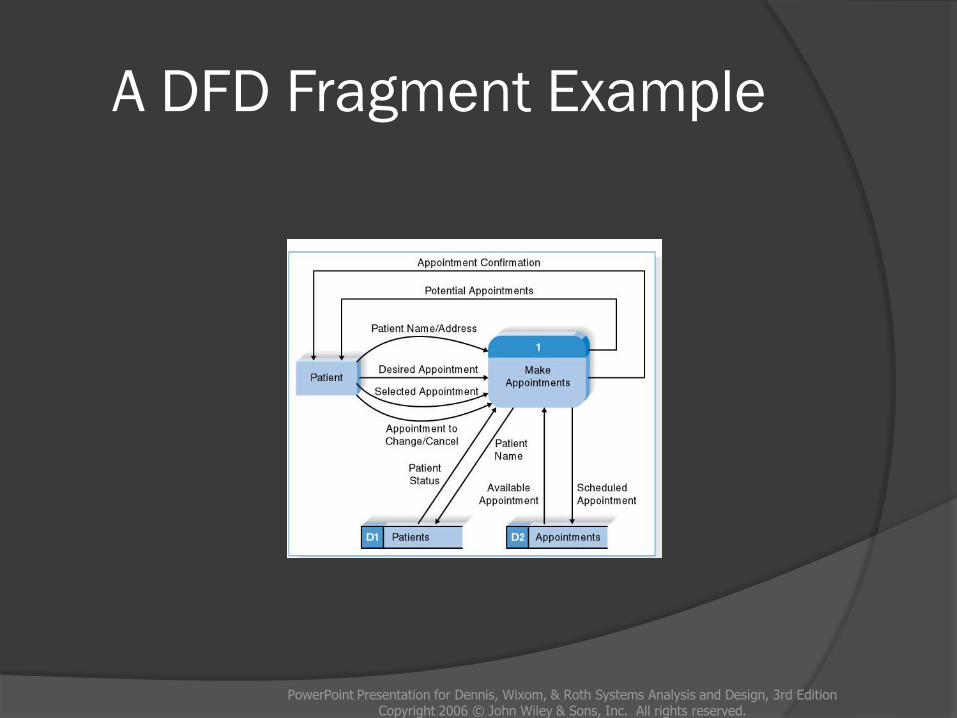
A DFD Fragment Example
PowerPoint Presentation for Dennis, Wixom, & Roth Systems Analysis and Design, 3rd EditionCopyright 2006 © John Wiley & Sons, Inc. All rights reserved.
Creating the Level 0 Diagram
Combine the set of DFD fragments into one diagram
Generally move from top to bottom, left to right
Minimize crossed lines
Iterate as needed
DFDs are often drawn many times before being finished, even with very experienced systems analysts
PowerPoint Presentation for Dennis, Wixom, & Roth Systems Analysis and Design, 3rd EditionCopyright 2006 © John Wiley & Sons, Inc. All rights reserved.
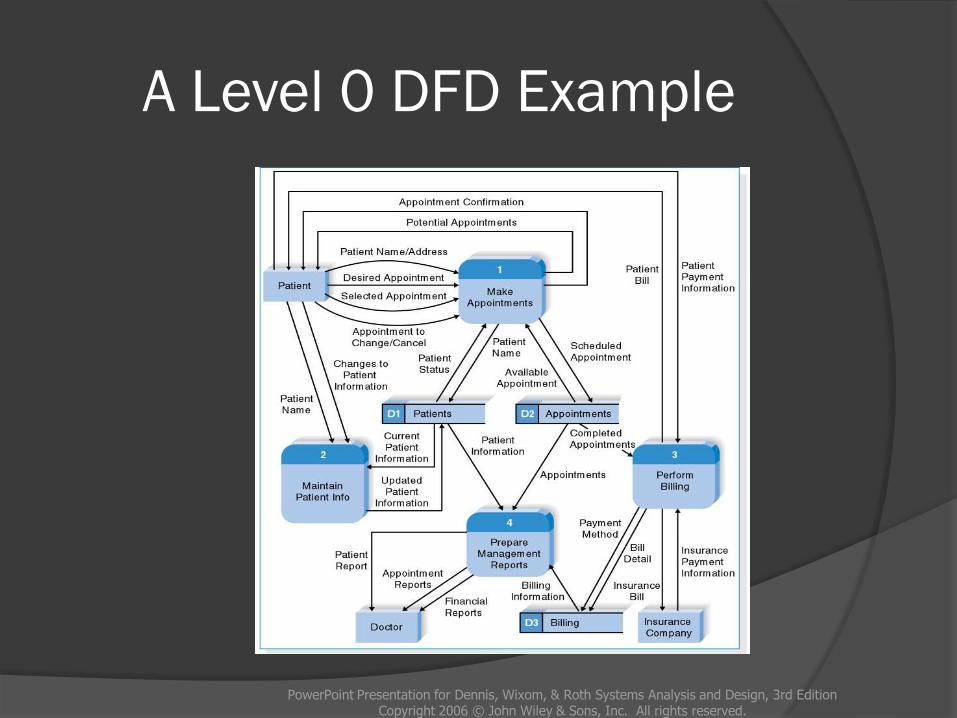
A Level 0 DFD Example
PowerPoint Presentation for Dennis, Wixom, & Roth Systems Analysis and Design, 3rd EditionCopyright 2006 © John Wiley & Sons, Inc. All rights reserved.
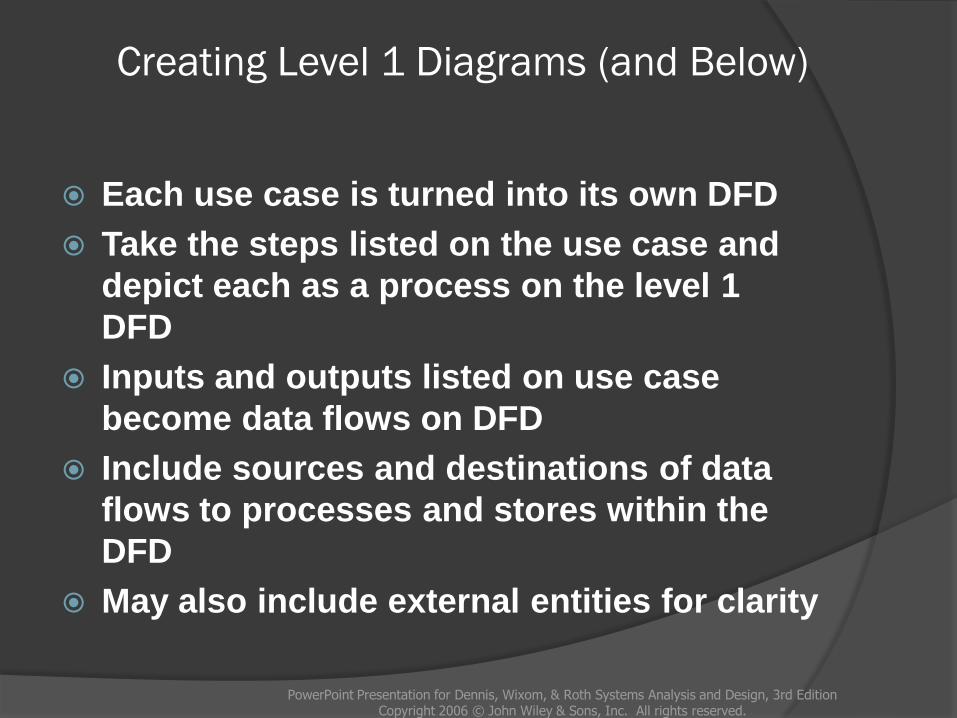
Creating Level 1 Diagrams (and Below)
Each use case is turned into its own DFD
Take the steps listed on the use case and
depict each as a process on the level 1
DFD
Inputs and outputs listed on use case
become data flows on DFD
Include sources and destinations of data
flows to processes and stores within the
DFD
May also include external entities for clarity
PowerPoint Presentation for Dennis, Wixom, & Roth Systems Analysis and Design, 3rd EditionCopyright 2006 © John Wiley & Sons, Inc. All rights reserved.
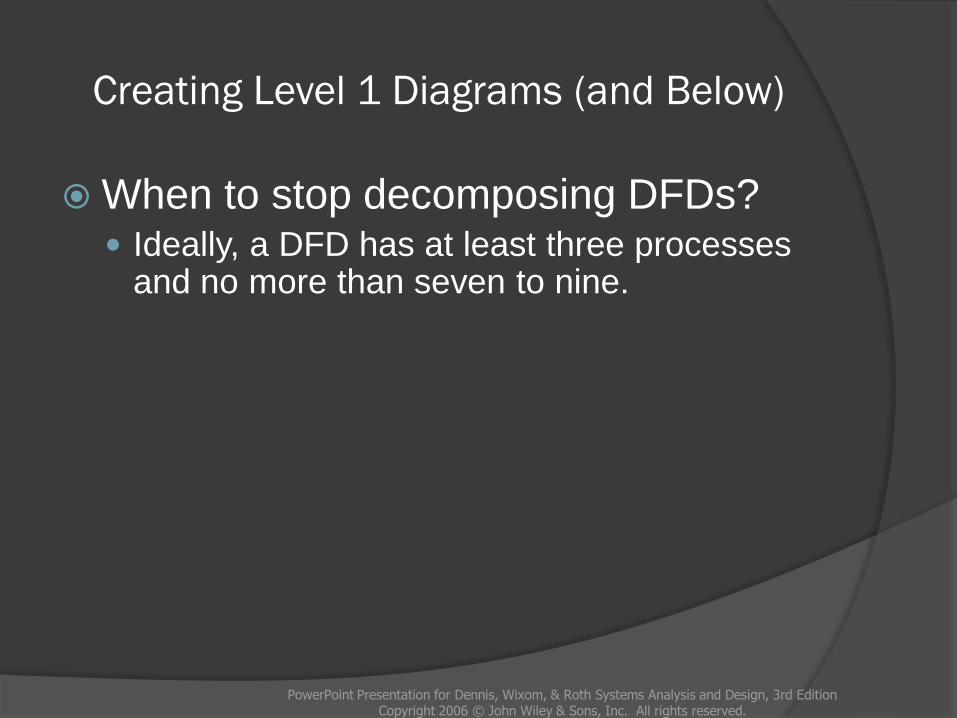
Creating Level 1 Diagrams (and Below)
When to stop decomposing DFDs? Ideally, a DFD has at least three processes
and no more than seven to nine.
PowerPoint Presentation for Dennis, Wixom, & Roth Systems Analysis and Design, 3rd EditionCopyright 2006 © John Wiley & Sons, Inc. All rights reserved.
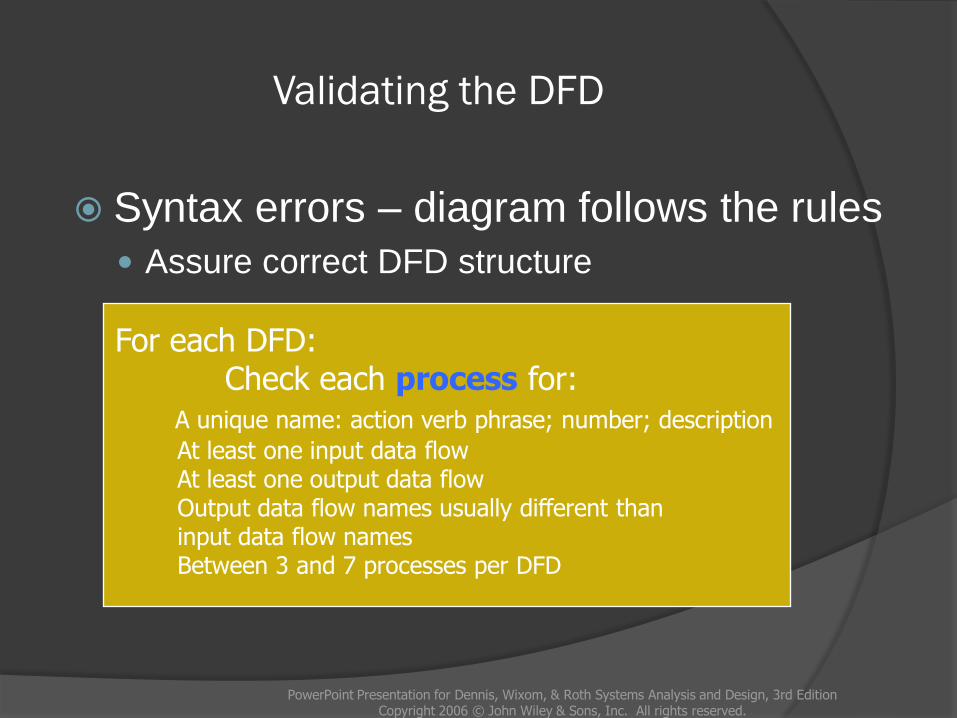
Validating the DFD
Syntax errors – diagram follows the rules
Assure correct DFD structure
PowerPoint Presentation for Dennis, Wixom, & Roth Systems Analysis and Design, 3rd EditionCopyright 2006 © John Wiley & Sons, Inc. All rights reserved.
For each DFD:Check each process for:
A unique name: action verb phrase; number; description
At least one input data flowAt least one output data flowOutput data flow names usually different thaninput data flow namesBetween 3 and 7 processes per DFD
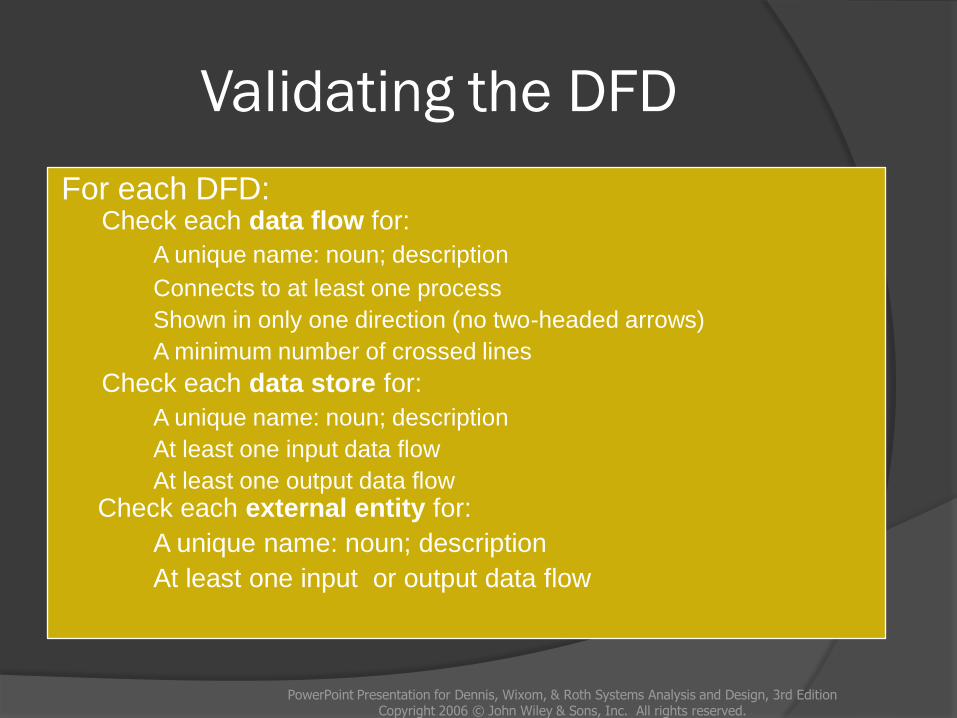
Validating the DFD
For each DFD:Check each data flow for:
A unique name: noun; description
Connects to at least one process
Shown in only one direction (no two-headed arrows)
A minimum number of crossed lines
Check each data store for:
A unique name: noun; description
At least one input data flow
At least one output data flow
Check each external entity for:
A unique name: noun; description
At least one input or output data flow
PowerPoint Presentation for Dennis, Wixom, & Roth Systems Analysis and Design, 3rd EditionCopyright 2006 © John Wiley & Sons, Inc. All rights reserved.
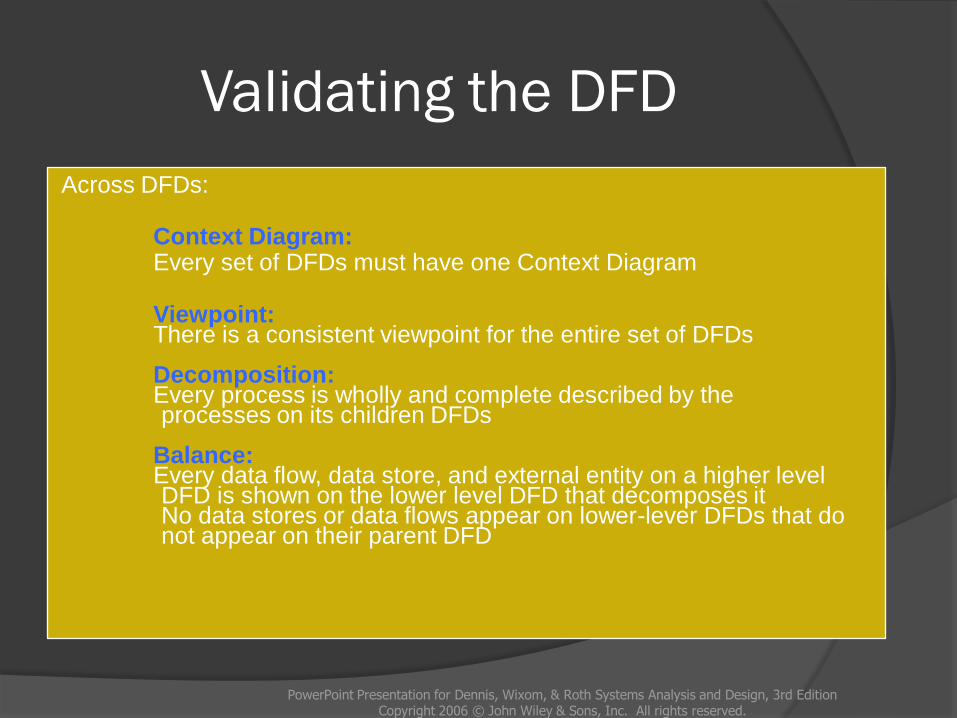
Validating the DFD
Across DFDs:
Context Diagram:Every set of DFDs must have one Context Diagram
Viewpoint:There is a consistent viewpoint for the entire set of DFDs
Decomposition:Every process is wholly and complete described by the processes on its children DFDs
Balance:Every data flow, data store, and external entity on a higher level DFD is shown on the lower level DFD that decomposes itNo data stores or data flows appear on lower-lever DFDs that do not appear on their parent DFD
PowerPoint Presentation for Dennis, Wixom, & Roth Systems Analysis and Design, 3rd EditionCopyright 2006 © John Wiley & Sons, Inc. All rights reserved.
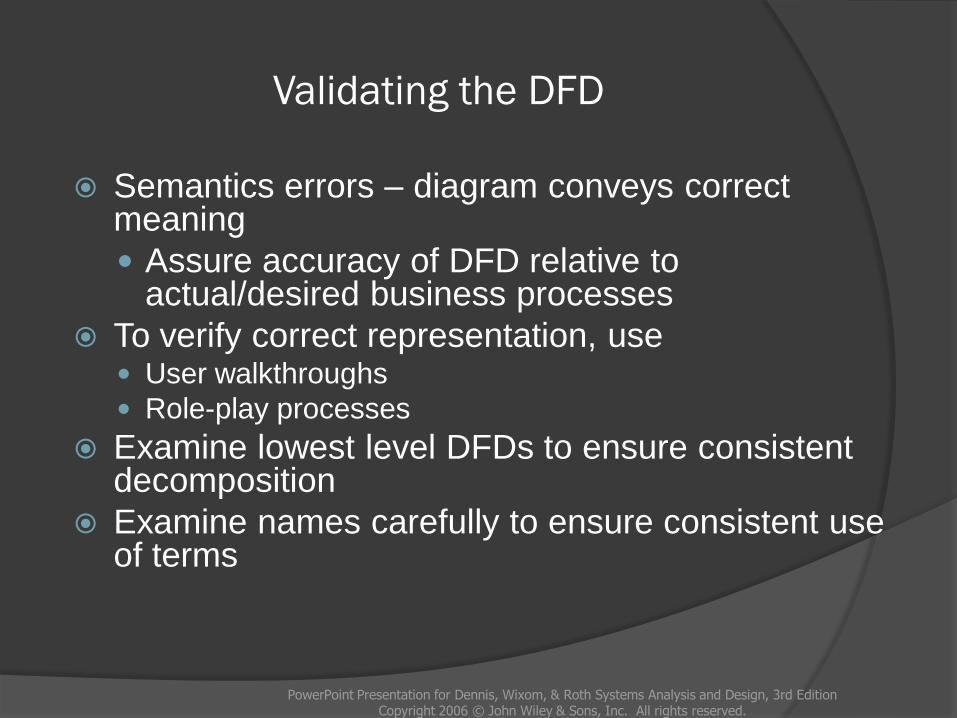
Validating the DFD
Semantics errors – diagram conveys correct meaning
Assure accuracy of DFD relative to actual/desired business processes
To verify correct representation, use User walkthroughs
Role-play processes
Examine lowest level DFDs to ensure consistent decomposition
Examine names carefully to ensure consistent use of terms
PowerPoint Presentation for Dennis, Wixom, & Roth Systems Analysis and Design, 3rd EditionCopyright 2006 © John Wiley & Sons, Inc. All rights reserved.
A Quick Review of Decomposition for CD
Selections
PowerPoint Presentation for Dennis, Wixom, & Roth Systems Analysis and Design, 3rd EditionCopyright 2006 © John Wiley & Sons, Inc. All rights reserved.
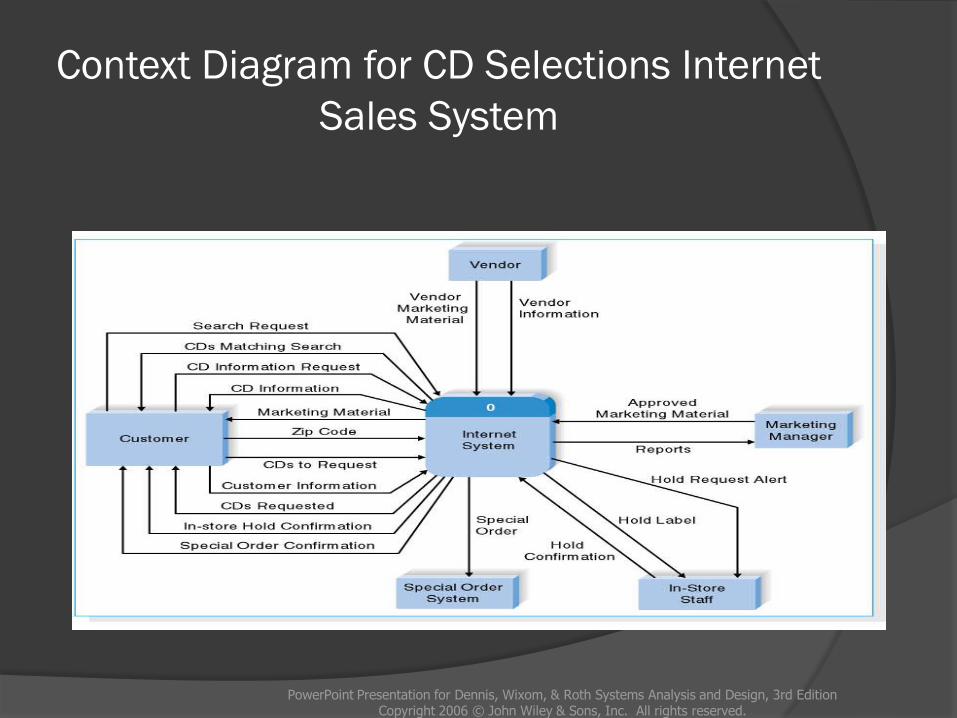
Context Diagram for CD Selections Internet
Sales System
PowerPoint Presentation for Dennis, Wixom, & Roth Systems Analysis and Design, 3rd EditionCopyright 2006 © John Wiley & Sons, Inc. All rights reserved.
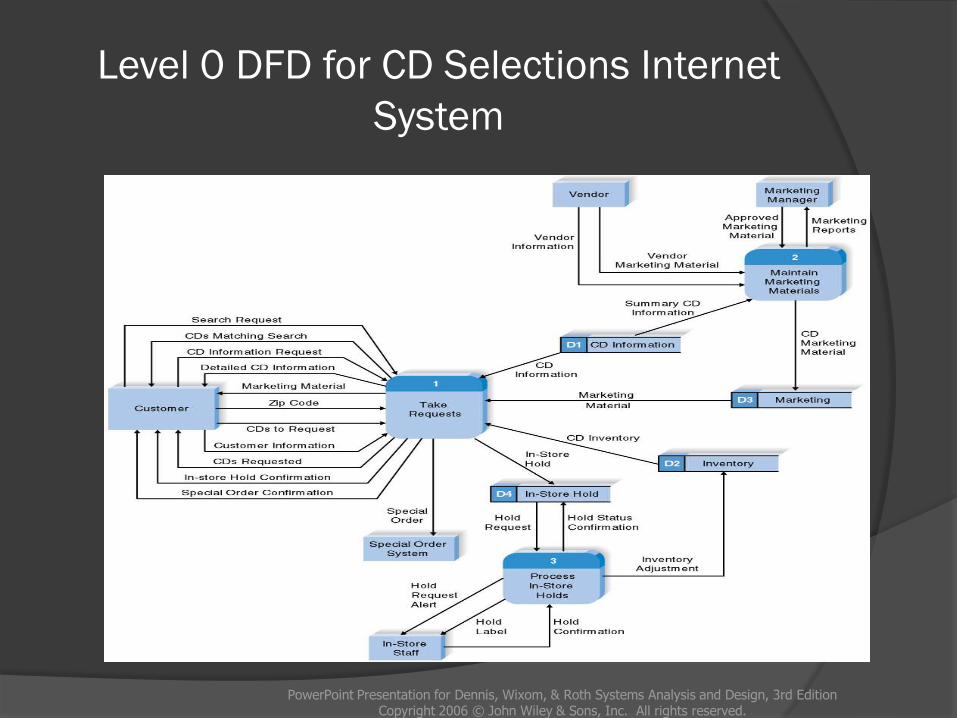
Level 0 DFD for CD Selections Internet
System
PowerPoint Presentation for Dennis, Wixom, & Roth Systems Analysis and Design, 3rd EditionCopyright 2006 © John Wiley & Sons, Inc. All rights reserved.
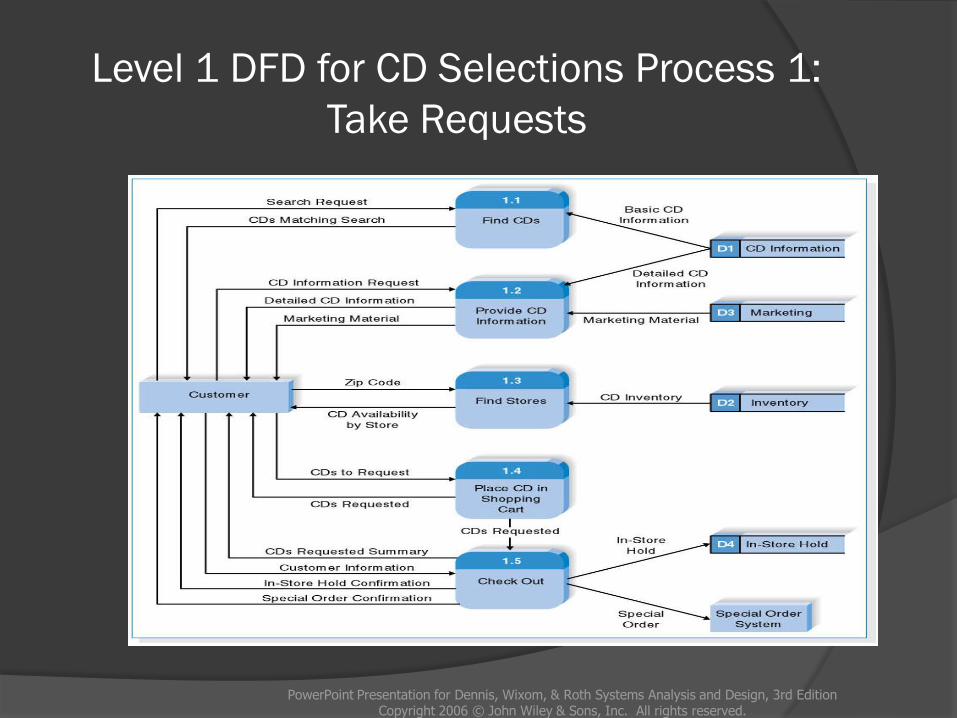
Level 1 DFD for CD Selections Process 1:
Take Requests
PowerPoint Presentation for Dennis, Wixom, & Roth Systems Analysis and Design, 3rd EditionCopyright 2006 © John Wiley & Sons, Inc. All rights reserved.
Summary
The Data Flow Diagram (DFD) is an
essential tool for creating formal
descriptions of business processes.
Use cases record the input, transformation,
and output of business processes and are
the basis for process models.
Eliciting use cases and modeling business
processes are critically important skills for
the systems analyst to master.
PowerPoint Presentation for Dennis, Wixom, & Roth Systems Analysis and Design, 3rd EditionCopyright 2006 © John Wiley & Sons, Inc. All rights reserved.