t akeda chemical industries, ltd. - morningstar, inc
TRANSCRIPT

Year ended March 31, 2003
Year ended M
arch 31, 2003
Takeda Ch
emical In
dustries, L
td.A
NN
UA
L REP
OR
T 20
03
Printed in Japan
TA K E D A A N N U A L R E P O R T
2 0 0 3
C O N T R I B U T E S T O T H E H E A LT H O F I N D I V I D U A L S W O R L D W I D EC O N T R I B U T E S T O T H E H E A LT H O F I N D I V I D U A L S W O R L D W I D E
Printed on 100% recycled paper.

Contents
FORWARD-LOOKING STATEMENTS
This annual report contains forward-looking statements regarding the Company’s plans, outlook, strategies and results for the future. All forward-looking statementsare based on judgements derived from the information available to the Company at the time of publication.
Certain risks and uncertainties could cause the Company’s actual results to differ materially from any projections presented in this report. These risks and uncertaintiesinclude, but are not limited to, the economic circumstances surrounding the Company’s business; competitive pressures; related laws and regulations; product develop-ment programs; and changes in exchange rates.
The content of this annual report is based on information available as of July 31, 2003, except where indicated otherwise.
The Takeda Group contributes to the health of individuals and to the progress of medicine by applying all our assets, both fiscal and intellectual,concentrating on our pharmaceuticals business,creating superior pharmaceutical products andoffering top-quality services. This is our missionand raison d’être.
Financial Highlights
To Our Shareholders
Our Presence
Research and Development
Our Pipeline
Production System
Marketing
1
2
6
8
14
16
18
Corporate Citizenship
Financial Section
Independent Auditor’s Report’
Board of Directors, Auditors and Corporate Officers
Main Subsidiaries and Affiliates
Corporate Information
22
23
48
49
50
52
T A K E D A A N N U A L R E P O R T 2 0 0 3 T A K E D A M A N A G E M E N T M I S S I O N T A K E D A A N N U A L R E P O R T 2 0 0 3

Financial Highlights
Net sales
Operating income
Income before income taxes and minority interests
Net income
Research and development costs
Capital investments
Depreciation and amortization
Per share amounts (Yen and U.S. Dollars)
Net income
Cash dividends
Total assets
Shareholders’ equity
Number of employees
Note: The U.S. dollar amounts in this report represent translations of Japanese yen, for convenience only, at the rate of ¥120= US$1, the approximate exchange rate at March 31, 2003. Figures in parentheses indicate a decrease.
Millions of yen
Takeda Chemical Industries, Ltd. and SubsidiariesYears ended March 31, 2003 and 2002
% changeThousands of
U.S. dollars (Note)
2003
¥1,046,081
310,686
431,898
271,762
124,230
35,888
29,962
¥ 307.63
65.00
¥2,059,369
1,567,732
14,547
2003
$ 8,717,347
2,589,052
3,599,155
2,264,685
1,035,253
299,071
249,690
$ 2.56
0.54
$17,161,409
13,064,440
2002
¥1,005,060
281,243
373,427
235,656
100,278
44,766
28,430
¥ 267.02
60.00
¥1,965,216
1,420,081
14,511
2003/2002
4.1%
10.5
15.7
15.3
23.9
(19.8)
5.4
15.2%
8.3
4.8%
10.4
Note: Fiscal years ended March 31, 2003, 2002, 2001, 2000, 1999 and 1998.
Net Sales
1,200(¥ Billion) (¥ Billion)
(Fiscal year)
1,000
800
’97 ’98 ’99 ’00 ’01 ’02
600
400
200
0
1,046
Net Income and Earnings per Share (EPS)
Net
Inc
ome
EPS
R&
D C
osts
(¥)
(Fiscal year)
Net incomeEarnings per share
’97 ’98 ’99 ’00 ’01 ’02
300
360
240
180
60
120
0
250
300
200
150
50
100
0
Rat
io o
f R&
D C
osts
to
Net
Sal
es15
10
5
0
271.7307.63
Return on Equity (ROE)
20
(Fiscal year)
15
’97 ’98 ’99 ’00 ’01 ’02
10
5
0
18.28.2
R&D Costs and Ratio of R&D Costs to Net Sales
150(¥ Billion) (%)(%)
(Fiscal year)
125
100
’97 ’98 ’99 ’00 ’01 ’02
75
50
25
0
124.2R&D costsRatio of R&D costs 11.9
p.01T A K E D A A N N U A L R E P O R T 2 0 0 3 F I N A N C I A L H I G H L I G H T S T A K E D A A N N U A L R E P O R T 2 0 0 3

t a Special Board Meeting of Takeda Chemical Indus-
tries, Ltd., held following the General Shareholders’ Meeting
convened on June 27, 2003, Kunio Takeda was appointed
Chairman of the Board and Chief Executive Officer (CEO) and
Yasuchika Hasegawa was appointed President and Chief Operat-
ing Officer (COO).
In the past, the top management positions of chair-
man, president, and executive vice president have combined the
management strategy planning function of a CEO with the oper-
ations execution function of a COO. In view of the rapidly
changing global business environment, which poses increasingly
complex challenges for management, Takeda has decided to sep-
arate these two functions and delineate their respective roles.
This will expedite decision-making, make operational execution
more dynamic, and make the decision and execution processes
more transparent.
Chairman Takeda, as CEO, chairs the Board of Di-
rectors, exercises overall leadership of the Takeda Group,
oversees corporate management, and makes strategic deci-
sions regarding management as a whole. President Hasegawa,
as COO, shall exercise overall leadership of the execution of
general operations.
Under this new top management structure, Takeda
will continue to increase the efficiency of its management, tar-
geting a complete transformation into a world-class pharma-
ceutical company capable of responding firmly and rapidly to all
changes in the business environment. Takeda’s goal is to be true’
to its management mission—“we strive toward better health for
individuals and progress in medicine by developing superior
pharmaceutical products”—everywhere the Takeda Group oper-
ates. Takeda also prioritizes steady growth in business perfor-
mance that will continue to enhance corporate value, and is
committed to becoming a company that grows along with its
shareholders and other stakeholders.
Kunio Takeda (right) Chairman and Chief Executive Officer
Yasuchika HasegawaPresident and Chief Operating Officer
A
T A K E D A A N N U A L R E P O R T 2 0 0 3 T O O U R S H A R E H O L D E R S T A K E D A A N N U A L R E P O R T 2 0 0 3p.02

Fiscal 2002 Business Performance
ALL-TIME HIGHS SUSTAIN PERIOD OF GROWTH
akeda’s increased income and profits for ’ fiscal 2002,
ended on March 31, 2003, can be attributed to growth in our
ethical pharmaceuticals business. In recent years, the ethical
pharmaceuticals market has seen an increasing number of devel-
oped countries introduce policies placing spending restrictions
on medical expenses and caps on drug spending. Even the Unit-
ed States, the world’s largest market, is switching to generic
drugs as patents on major products expire, while the broader
deployment of caps on drug spending continues to
impact the high growth rates the market had
become accustomed to. Moreover, interna-
tional corporate competition is growing
more intense, with research and de-
velopment costs rising amid a
worldwide shortage of new prod-
ucts. Despite this challenging busi-
ness environment, in fiscal 2002
Takeda saw growing sales of our
mainstay products, including our
international strategic products,
and increased investment in our re-
search and development pipeline (new
drug candidates). In addition, we also
moved proactively into an optimal business
management structure that utilizes alliances and
other ties with non-pharmaceutical businesses. These
developments were the primary factors in the business perform-
ance described below.
Consolidated net sales in fiscal 2002 grew 4.1% year-
on-year to ¥1.046 trillion, driven by increased sales of Takeda’s’
main product lines and other factors such as a lower yen. Oper-
ating income increased 10.5% to ¥310.6 billion on increased
sales of high value-added products such as Takeda’s ethical ’
drugs, which offset higher R&D and sales expenses to strength-
en our businesses in the US and Europe. Net income rose
15.3%, at ¥271.7 billion, bringing earnings per share (EPS) up
by ¥40.6 to ¥307.6 per share. Return on equity (ROE) improved
by 0.3 percentage point to 18.2%. We increased cash dividends
by ¥5 to ¥65 per share. These results continued a remarkable
trend: Takeda has now realized 12 consecutive fiscal years of
growing net sales, 11 of increasing operating income, 9 of im-
proved net income, and 10 of rising cash dividends.
Contributing to Takeda’s strong growth overall were ’
sales growth of 11.7% in the ethical drugs business, which
brought in ¥856.4 billion, and sales in overseas markets, which
were up 21.3% to ¥394.4 billion on continued growth in inter-
national strategic products: the antidiabetic drug Actos (generic
name: pioglitazone hydrochloride), the peptic ulcer treatment
Prevacid (generic name: lansoprazole), the prostate cancer andd
endometriosis treatment Lupron Depot (generic name: leupro-
lide acetate), and the hypertension treatment Blopress (generic
name: candesartan cilexetil). In order to strengthen Takeda’s ’
business foundation in Europe, in April 2002,
Takeda secured the management rights to
Takeda Pharma GmbH, the sales company
in Germany, and included that company
and its two sales subsidiaries, Takeda
Pharma Ges.m.b.H. and Takeda
Pharma AG—the respective sales
companies for Austria and Swit-
zerland—in the Takeda Group’s ’
consolidated performance. This
move contributed to a total sales
increase of ¥19.6 billion. In Japan,
Takeda pursued the provision of
high-quality information to counter
increasingly stiff competition, focusing
efforts on our mainstay products. As a result,
sales of Blopress reached ¥70.1 billion, a major
increase over the previous year, while sales of Prevacid,
Lupron Depot, the postprandial hyperglycemia treatment Basen,
and other main Takeda products also grew, resulting in a 4.6%
increase in sales in Japan to ¥462.0 billion.
Progress of the 2001-2005 Medium-term Management Plan
BUILDING THE FOUNDATIONS FOR THE LAUNCH OF THE NEW ‘‘TAKEDA PHARMACEUTICAL COMPANY”
he Takeda Group has utilized the 1995-2000 Medi-
um-term Management Plan and the 2001-2005 Medium-term
Management Plan to transform its business structure from a di-
versified corporation focusing on the Japanese market to an
R&D-driven pharmaceutical company well positioned for the
international market. Another major goal of the plans has been
increasing the efficiency of management. In particular, the
Takeda Group has refocused on the pharmaceutical business,
T
T
p.03T A K E D A A N N U A L R E P O R T 2 0 0 3 T O O U R S H A R E H O L D E R S T A K E D A A N N U A L R E P O R T 2 0 0 3

establishing R&D programs emphasizing core therapeutic areas,
and building a development structure that is strong not only in
Japan, but also in the US and Europe. Other forward-looking
policy measures included promoting overseas operations, mov-
ing toward independence for non-pharmaceutical businesses,
and introducing a results-based employee performance manage-
ment system. Throughout the period, sales and income perform-
ance has seen steady growth, consistently exceeding initial pro-
jections.
It has been two years since the start of the 2001-2005
Medium-term Management Plan, and fiscal 2003 marks the
mid-point. In fiscal 2002, we were ahead of schedule on one of
the goals of the Medium-term Management Plan—one trillion
yen in annual sales of in-house ethical drugs*. We also attained
73% of total sales in overseas markets*. We also launched
Japan EnviroChemicals, Ltd., in April 2003, as part of our ef-
forts to restructure Takeda’s non-pharmaceutical businesses for
“complete independence,” thus laying the groundwork for the
transition to being a truly world-class pharmaceutical company,
the new “Takeda Pharmaceutical Company.”
With progress on all these fronts, we selected 2004 for
the launch of Takeda as a world-class pharmaceutical company,
and now, in fiscal 2003, we are engaged in preparations for
that occasion, focusing on the following issues:
Ensuring sources of growth that can provide support for our sus-
tained growth beyond 2005 by strengthening the R&D pipeline.
Reviewing and strengthening cost management initiatives and
moving toward a more cost effective structure capable of sustaining
profitability in drastic market change.
Establishing a simple, clear business management structure suita-
ble for a world-class pharmaceutical company.
* These figures include sales of companies that are not reflected in consolidated
results because Takeda’s share of ownership is 50% or less.
ENSURING SOURCES OF GROWTH BY STRENGTH- ENING THE R&D PIPELINE
he key to becoming a world-class pharmaceutical com-
pany, and to put it in rather extreme terms, even to surviving as a
company, is a strong research pipeline yielding new products that
can be launched as quickly as possible. In the world’s largest and
most important market, the United States, branded products can
be replaced in a matter of just a few weeks after generic drugs are
launched. The only way to survive such a tough market environ-
ment is to continue to launch a line of new products. As our over-
seas sales, with the United States as the primary contributor, make
up an ever-higher proportion of Takeda’s total sales, we will con-
tinue to be aggressive in promoting forward-looking investment.
At Takeda, our R&D priorities are strengthening re-
search into lifestyle-related diseases and reinforcing technologies
for identifying drug discovery targets using genome information.
Projects launched in fiscal 2002 included a five-year partnership
with the United Kingdom’s Oxford Centre for Diabetes and joint
research with the Beth Israel Deaconess Medical Center of the
Harvard Medical School in the United States into drug discovery
targets for diabetes and obesity.
Another way to strengthen Takeda’s proprietary research
pipeline is to bring in strong results from other companies by way
of alliances. In August 2002, Takeda signed a contract with Kissei
Pharmaceutical Co., Ltd., for joint marketing within Japan of Mi-
tiglinide, a short-acting insulin secretagogue for suppressing hy-
perglycemia that was developed and manufactured by Kissei.
At Takeda, we will continue to actively expand our
R&D pipeline, recognizing it as the source of corporate
growth, striving to add to our currently successful products
through early launch of new products that contribute to better
health for people around the world.
REVIEWING AND STRENGTHENING COST MANAGEMENT INITIATIVES
n addition to active investments to strengthen the
pipeline, Takeda is also moving forward with the transition to a
more efficient cost structure through a process of reviews and
T
I
T A K E D A A N N U A L R E P O R T 2 0 0 3 T O O U R S H A R E H O L D E R S T A K E D A A N N U A L R E P O R T 2 0 0 3p.04

cost controls improvements. Despite Takeda’s success in recent
years, with the market environment growing ever more challeng-
ing, we recognize the importance of distancing ourselves from
the conventional assumption that costs can be managed merely
through continual growth. We are striving to be more effective at
controlling costs in order to ensure we will have the flexibility
to deal with any sudden fluctuation in business performance.
ESTABLISHING A SIMPLE, CLEAR BUSINESS MANAGEMENT STRUCTURE
ith the increasing strategic importance of US opera-
tions to Takeda, we are engaged in a comprehensive review of
our organization, programs, and structures, working toward
establishing a business management structure befitting a
world-class pharmaceutical company. Our top priority is press-
ing forward with the management reforms needed to lay the
groundwork for smooth management of the worldwide Takeda
Group. These reforms include building a global governance
structure, executing a comprehensive review of head office
functions and organization management systems, and reform-
ing personnel systems.
TAKEDA’S MANAGEMENT MISSION AND VISION
akeda’s management mission is: “We strive toward bet-
ter health for individuals and progress in medicine by develop-
ing superior pharmaceutical products.” To achieve this mission,
our vision at Takeda involves realization of the following spe-
cific management priorities.
Building a multinational company, driven by research and de-
velopment, which leads the world through its unique strengths
Takeda will strive to upgrade its strengths in R&D, manufacturing,
and marketing to world-class levels, contributing to medical
progress and society.
Building a company with highly integrated global operations
Takeda will work to develop a management structure that en-
ables sharing of strategies and rules and facilitates efficiency and
speed throughout the Takeda Group, maximizing the Group’s
integrated strengths.
Building a company that meets the needs of people around the
world through superior products and services
With an expanded R&D pipeline, Takeda will seek to respond
to people’s expectations with an unceasing supply of superior
products and services, winning the trust of individuals and
societies around the world.
Building a company that grows together with its shareholders
and other stakeholders
Takeda’s goal is to continue to grow along with its shareholders
and all other stakeholders.
Building an energetic company that attracts and retains highly
qualified personnel from all over the world
Takeda will build a global personnel system and foster an energetic
corporate atmosphere that inspires and encourages employees.
With a new top management structure in place, and
through the efforts of every employee of the Takeda Group, Takeda y
is moving forward rapidly toward the achievement of this vision.forward rapidly toward the achievp yrapidly toward rapidly towarrapidly rapidd rapd rdardo waorward rapidly towwiddidiididddrapirapparrapiii totottt wawarwarward raddwawarddwwwrwarrwardw rarward rd rrrwardwwward rap rd the achievthe ard the achiehe acahrd e achievachievrd d
Making the most of the steady progress made undergresmost ot of the y pprogreMMakMakinMakinakinkingngg tthehe m redyst otMMMMM the steady progrhe ssteady grgdyyydhe he rogresogresgresteadyyyyhe steadydy progthe she ogggggdyydydyyyhe s
the 2001-2005 Medium-term Management Plan, we havean, M agem nt Plan,e 2020001--2 05 M dium- Plnag001-2005 Medi00 M d000000000 MeeMeMeeddddd2020the 2001-2005 Medium-term Mmthe 0 tethhehhhethethhehe 2001-20thhhhh i Mthhehhettthhtthththh Mhe 2001--2000 ediumm-ter--2005 Medium-term agemagemagem
rked to promote reforms and strategies in preparation forratrate in eparratratke a ataaprnd stworked to promote reforms and worrked t p om e for ant f da d nd keek d t t f dannd rkekkek ananked to promote reforms andkk d
world-class pharmaceutical company,mparm tica omw cla meuorl pthe launch of Takeda as a world-che au h T a wa wow rld-cworw d-cla wooorld
o further growth in the Takeda Group tope T a G uphe wth otheand have pressed on to further grd e se pe pressed osd have r gro g
value. We ask for your continuing supportortin sup oWe yo osor yoyue.ue.maximize shareholder valuma z e v ulull
in this vital enterprise.in v t
31, 2003July 31, 20033 031,31, 20,
TakedaddKunio To TT
Chairman and Chief Executive Officerma f ffOfficerffamamaChairmChaairma
Yasuchika HasegawaYasuucasu HaYasuchika Hasegawauchikuchikkh kkkakkkk HaHasHa H egHaHHaHHaH aawawa
President and Chief Operating Officernt and Chief Operatiend Cnd C Operatindddnd Chief OperatiCChihChiChief Operatef Operatieie perpperatperatCChief OperatiChief OperatieeCd Chief Opie OperatiOperatiOperatCddddddndddd C Opd Cd CCnd
T
W
1)
2)
3)
4)
5)
p.05T A K E D A A N N U A L R E P O R T 2 0 0 3 T O O U R S H A R E H O L D E R S T A K E D A A N N U A L R E P O R T 2 0 0 3

A
Hitoshi and Tsuyako Komuro of Kanagawa Prefecture, Japan, received a seven-day eradication treatment with Takepron prescribed by a doctor.
Dr. John E. Garnett, assistant professor of Northwestern University in Illinois, U.S., talking to a patient about Lupron Depot.
LANSOPRAZOLE FOR PEPTIC ULCERS
LEUPROLIDE ACETATE FOR PROSTATE CANCER AND ENDOMETRIOSIS
Brand Names: Takepron (Japan, Asia)Prevacid (U.S., Asia)dOgast, Lansox, Agopton (Europe)
fter the treatment to eradicate Helicobacter pyloriAfter the treatment to eradicate Helicobacter pylori Awith Takepron, our heartburn was gone. We are grateful thatwe can enjoy drinking together again. (Hitoshi Komuro)
Brand Names: Leuplin (Japan)Lupron Depot (U.S.)Enantone, etc. (Europe, Asia)
Drug delivery system (DDS) research hasresulted in the formulation of leuprolideacetate as a long-term, sustained-releasetreatment for prostate cancer and endome-triosis. The long-term, sustained-releaseformulation, Lupron Depot, available in the U.S., contributes significantly to improving the quality of life of patients, as a single in-jection provides therapeutic effects for fourmonths. Leuprolide acetate is marketed in over 70 countries and is considered a goldstandard therapy for prostate cancer.
Once-daily dosing with Lansoprazole, a proton pump* inhibitor (PPI) developed by Takeda, provides fast symptom relief for gastric and duodenal ulcers, and achieves high healing rates. Supported by this excellent profile, Lansoprazole is marketed in around 100 countries and is recognized as the top brand in major countries.
*Proton pump An enzyme that functions in the final stages of acid secretion in gastric parietal cells.
T A K E D A A N N U A L R E P O R T 2 0 0 3 O U R P R E S E N C E T A K E D A A N N U A L R E P O R T 2 0 0 3p.06

S
A
Jean Emile of Paris, France, was treated with Blopress.
CANDESARTAN CILEXETIL FOR HYPERTENSION
Brand Names:Blopress (Japan, Europe, Asia)Amias, Kenzen (Europe)
Candesartan cilexetil is an angiotensin II receptor antagonist*, a class of agents thatis revolutionizing hypertension treatment. In over 60 countries, the medi-cal profession relies on candesar-tan, as once-daily dosing pro-vides patients with gradual andsteady protection that lasts manyhours, with fewer side effects.
*Angiotensin II receptor antagonist Inhibits angiotensin II, a hormone that increases blood pressure.
ince I started taking ince I started taking S Blopress, my blood pressure has stabilized. Now I enjoy the life of a healthy person.
Maria Vargas of California, U.S., received treatment for diabetes with Actos from Dr. Christine C. Ponzio.
PIOGLITAZONE HYDROCHLORIDE FOR DIABETES
Brand Name: Actos (Japan, U.S., Europe, Asia)
Pioglitazone hydrochloride offers a new mechanism for treating Type 2 diabetes. Once-daily dosing with pioglitazone im-proves insulin resistance and reducesblood sugar levels, without placing an ad-ditional burden on the pancreas. The drug is marketed in over 50 countries and is valued by physicians for use in patients where strict blood sugar level control isrequired.
once-daily dose allows me to control my blood sugar.Thanks to Actos, I have the confidence to live a full life, de-spite my diabetes.
p.07T A K E D A A N N U A L R E P O R T 2 0 0 3 O U R P R E S E N C E T A K E D A A N N U A L R E P O R T 2 0 0 3

Takeda researchers working to identify drug-discovery targets using genome data.
T A K E D A A N N U A L R E P O R T 2 0 0 3 R E S E A R C H A N D D E V E L O P M E N T T A K E D A A N N U A L R E P O R T 2 0 0 3p.08

K+
ATP Ca2+
Ca2+
GLUT2GPR40
INSULIN SECRETION FROM ß CELLS
NOVEL ORPHAN LIGANDS IDENTIFIED BY TAKEDA
Ligands Receptors Target disease/area
Prolactin-Releasing Peptide (PrRP) hGR3 Gynecology Apelin APJ HIV infection Galanin-like Peptide (GALP) GalR2 Obesity RF amide-Related Peptide (RFRP) OT7T022 Gynecology Metastin OT7T175 Gynecology Neuropeptide W (NPW) GPR7/GPR8 Obesity Neuropeptide B (NPB) GPR7 Obesity
NOVEL ORPHAN RECEPTORS (LIGANDS ARE KNOWN) IDENTIFIED BY TAKEDA
Ligands Receptors Target disease/area
Melanin Concentrating Hormone (MCH) SLC-1 Obesity Urotensin II SENR (GPR14) Cardiovascular diseases Neuromedin U FM3/TGR1 Hypertension EG-VEGF ZAQ/I5E Gynecology Bile acid TGR5 Immunology Fatty acid GPR40 Diabetes
ORPHAN RECEPTOR RESEARCH DISCOVERIES SHOW HIGH NEW DRUG DEVELOPMENT POTENTIAL
ince the early 1990s, Takeda has focused on iden-
tifying drug-discovery targets using a cutting-edge gene
expression database. For example, take Takeda’s research
into orphan receptors. The binding of a ligand to a cell
surface receptor causes the human cell to adjust its own
functions, a mechanism clearly essential to medicinal
treatment of disease. Those receptors whose ligands have
not yet been identified are called orphan receptors, and
these have great potential for the development of new
drugs. Takeda has been working to identify the ligands
that correspond to these orphan receptors as well as re-
ceptor-activating substances that act on the binding of
ligands to receptors. This groundbreaking research has
enabled Takeda to discover seven new peptide ligands.
The Company has also identified receptors that bind pre-
viously discovered, physiologically active peptides and in
vivo low molecular compounds.
In another noteworthy accomplishment, Takeda
has become the first in the world to have verified that free
fatty acids, commonly known as an important nutritional
element and source of energy, activate the orphan receptor
GPR40, promoting the secretion of insulin from pancreatic
beta cells. Compounds that act specifically on GPR40 may
have the potential to control insulin levels in the blood.
Takeda expects this breakthrough to lead to the develop-
ment of drugs with a novel mechanism of action for the
prevention and treatment of diabetes.
S
p.09T A K E D A A N N U A L R E P O R T 2 0 0 3 R E S E A R C H A N D D E V E L O P M E N T T A K E D A A N N U A L R E P O R T 2 0 0 3

The functional analysis facility built in May 2003 (left) and Takeda’s Tsukuba Research Center.
NEW FUNCTIONAL ANALYSIS FACILITY BUILT IN TSUKUBA
n May 2003, Takeda finished construction of a
functional analysis facility at its Tsukuba Research Center.
The facility is tasked with the analysis of gene and protein
function as well as exploring the cutting-edge field of re-
generative gene research. Such analysis is expected to lead
to the earliest possible creation of groundbreaking new
drugs using the orphan receptors, ligands, and disease-
specific expression profiles for
differentially regulated genes
discovered during new
compound research.
RESEARCH ACCELERATED BY IN-LICENSING GENOMIC DATABASES
n fiscal 2000, Takeda in-licensed the genomic da-
tabases of the US firm, Celera Genomics. Takeda uses
these databases in the search for orphan receptors, ligands
and disease-specific expression profiles for differentially
regulated genes, developing potential targets for the dis-
covery of new drugs. To elucidate the gene functions dis-
covered through this research and assess the value of the
findings as drug discovery targets, Takeda employs a gene
expression database on diseased and normal human tis-
sues and a gene expression database on the organs of rats
administered with various compounds, both in-licensed
from the US firm, Gene Logic. Using these databases,
Takeda is putting gene information to work to accelerate
the identification of drug discovery targets. Moreover, this
approach improves the efficiency and success rate of drug
discovery research by enabling early toxicity prediction for
the compounds developed.
Gene discovered gTarget disease
CLCA1 p yRespiratory diseases
LLPL Arteriosclerosis
DISEASE-SPECIFIC EXPRESSION PROFILES FOR DIFFERENTIALLY REGULATED GENES IDENTIFIED BY TAKEDA
T A K E D A A N N U A L R E P O R T 2 0 0 3 RESEARCH AND DEVELOPMENT T A K E D A A N N U A L R E P O R T 2 0 0 3p.10

p.11T A K E D A A N N U A L R E P O R T 2 0 0 3 RESEARCH AND DEVELOPMENT T A K E D A A N N U A L R E P O R T 2 0 0 3
Young researchersat Takeda’s Tsukuba’Research Center.
RESEARCH PARTNERSHIPS
akeda is also actively involved in joint research
with world-class research institutions. In fiscal 2002,
Takeda signed a partnership agreement with the Oxford
Centre for Diabetes, Endocrinology and Metabolism (OC-
DEM), which integrates basic and clinical research, clini-
cal treatment, and educational functions relating to diabe-
tes and other disorders of the endocrine and metabolic
systems. Under the agreement, Takeda enjoys a coopera-
tive relationship for joint interdisciplinary researches and
dispatches researchers to Oxford. Further, as a member of
the Partnership Board, Takeda will also be involved in the
management of the Centre.
Takeda is also involved in ongoing joint research
related to diabetes and obesity with Beth Israel Deaconess
Medical Center of Harvard Medical School. With Array
BioPharma and Albany Molecular Research, Inc., Takeda is
conducting joint researches on lead compound synthe-
sis.Through such partnerships, Takeda aims to extend the
reach of its in-house researches and strive toward better health
for individuals and progress in medicine.
MAIN JOINT RESEARCH ACTIVITIESIn JapanPartners
■ BF Research Institute
■ New Energy & Industrial Technology Development Organization (NEDO) Project
■ Kagoshima University
■ RIKEN (The Institute of Physicaland Chemical Research)
■ Biomolecular Engineering Research Institute
■ Shin Nippon Biomedical Laboratories
■ Keio University
Overseas
Partners
■ WHO
■ Celera■ Gene Logic ■ The University of Oxford
■ Beth Israel Deaconess MedicalCenter (Harvard Medical School)
■ Array BioPharma■ Albany Molecular Research
Research subject
Basic research on development of medicines for dementia
Development of a support system for screening of pharmaceutical compounds (NEDO project)
Research on efficacy evaluation of anti-HIV drugs
Research on application of biomolecular functions
Research on toxico-genomics
Research on human genomes related to hypertension and diabetic organopathy
Country
U.S.A.U.S.A.U.K.
U.S.A.
U.S.A.U.S.A.
Research subject
Research on antimalarial drug discovery
Research on human genome
Database of gene expression
Partnership with The Oxford Centre for Diabetes, Endocrinology and Metabolism (OCDEM)
Research on drug discovery related to diabetes and obesity
Research on lead compound synthesis
Research on lead compound synthesis
Research on physiological functionof p51 oncogene, an original form of p53,and its application to medical treatmentResearch on human genome related to osteoarthritis

DRUGS PRIORITIZED FOR EARLY MARKETING
pharmaceutical company’s future depends on its
ability to realize the earliest possible launch of a steady stream
of new products. Takeda will achieve this by maintaining a
strong pipeline of products under development. Takeda has
set four core therapeutic areas* for its R&D. Takeda assigns
priority status to certain drugs, earmarking them for intensive
development efforts. Current priority compounds are TAK-
375 for primary insomnia, TAK-677 for diabetes and obesity,
TAK-013 for endometriosis and uterine fibroids, and TAK-
559 for diabetes. Takeda’s global development organization,
with bases in Japan, the United States, and Europe, is work-
ing toward early marketing of these priority drugs.
* Four core therapeutic areas:
LIFE CYCLE MANAGEMENT FOR ADDED VALUE
akeda is maximizing the added value of its inter-
national strategic products—Lupron Depot, Prevacid, Blo-
press, and Actos—by obtaining additional indications, de-
veloping new formulations, and conducting outcome
studies (large-scale and long-term clinical trails).
Takeda has been very successful with additional
indications and new formulations. In June 2002 in Japan,
Takeda launched a new orally disintegrating tablet formu-
lation of Prevacid (Takepron OD Tablets), and in Decem-
ber 2002 launched Lansap, a new formulation combining
Prevacid with two other drugs for use in the eradication of
Helicobacter pylori. Also in December 2002, Takeda ap-
plied for approval of small capsules of Prevacid in Japan
and for an injectable preparation in the U.S. In the same
month, the Company also applied for approval of a fixed
combination of Blopress with a diuretic in Japan. Earlier,
in June 2002, Takeda received approval in Japan for con-
comitant use of Actos with an α-glucosidase inhibitor
(such as Basen). In December 2002, Takeda applied for
approval for Actos as a monotherapy in Europe. Takeda
also applied in late 2002 and early 2003 for approval for a
45mg additional dosage of Actos for use in combination
therapy in the U.S. and Europe. The Company is also con-
ducting clinical trials on Lupron Depot in a new formula-
tion as a 6-month sustained release drug.
Outcome studies include a CHARM study for
Blopress, a placebo-controlled study of efficacy vis-à-vis
the mortality and hospitalization rates of chronic heart
failure patients. Another is a DIRECT study to examine
the efficacy of Blopress in preventing and treating diabetic
retinopathy. Takeda’s ongoing PROactive trial is investigat-
ing the efficacy of Actos on macrovascular disease in pa-
tients with type 2 diabetes. This year, Takeda initiated two
clinical trials in the United States, PERISCOPE and CHI-
CAGO, to study the potential of Actos to reduce risk of
cardiovascular disease in patients with type 2 diabetes.
Takeda hopes that additional indications resulting from
these studies will contribute to evidence-based medicine.
CONTRIBUTION OF IN-LICENSING ENHANCED
akeda is also intensifying the use of in-licensing
to complement in-house research and life cycle manage-
ment of products. TAK-677, which Takeda in-licensed
from Dainippon Pharmaceutical Co., Ltd., is undergoing
Phase II clinical trails in the U.S. as a new medication for
improving lipid and glucose metabolism in patients with
type 2 diabetes and obesity. MCC-135, which Takeda in-
licensed from Mitsubishi Pharma Corporation, is also un-
dergoing Phase II clinical trails in the U.S. and Europe as a
medication with a new mechanism for treating chronic
heart failure and myocardial infarction.
In fiscal 2002, Takeda signed a co-marketing
agreement in Japan with Kissei Pharmaceutical Co., Ltd.,
for Mitiglinide, a short-acting insulin secretagogue for
suppressing postprandial hyperglycemia, for which Kissei
is currently applying for approval. Takeda is confident that
the agreement with Kissei will help further improve quali-
ty of life for diabetic patients, as Mitiglinide is added to
Takeda’s current line of drugs for diabetes in Japan, Basen
and Actos.
In May 2002, Takeda launched Benet, which
Takeda in-licensed from Ajinomoto Co., Inc. Takeda has
also agreed with Ajinomoto to co-develop a once-a-week
formulation to enhance convenience for users.
A
Diabetes
Cancer, urological and digestive system diseases
Cardiovascular and central nervous system diseases
Bone, joint and allergic diseases
T A K E D A A N N U A L R E P O R T 2 0 0 3 RESEARCH AND DEVELOPMENT T A K E D A A N N U A L R E P O R T 2 0 0 3p.12

INTELLECTUAL PROPERTY SYSTEMS ESTABLISHED IN THREE REGIONS
n order to more effectively support the expansion
of Takeda’s pharmaceutical business activities in Japan, the
United States and Europe, the Company’s Intellectual
Property Department has expanded its reach by establish-
ing operational centers in Chicago and London, in addi-
tion to Japan.
Increasing overseas sales of international strategic
products has brought consistent annual growth in royalty
income, which reached ¥43.9 billion in fiscal 2002.
INTELLECTUAL PROPERTY MADE A VITAL PART OF CORPORATE BUSINESS STRATEGY
n light of the lengthy periods of time and enor-
mous capital investments required to research and devel-
op new drugs, the effective protection and utilization of
the intellectual property that results from R&D is a critical
management concern for any pharmaceutical company.
Takeda has taken this recognition one step further by de-
vising an intellectual property strategy that seamlessly in-
tegrates research, development, production, marketing
and alliances—and making it a key component of the
Company’s business strategy itself. Takeda will continue to
explore any option with the potential to prolong the life-
span of its international strategic products as well as the
innovative step of patenting themes under R&D.
MORE GENE-RELATED PATENT APPLICATIONS FILED
akeda’s research benefits from the use of gene
information to identify drug discovery targets. This ap-
proach has helped Takeda to file an increasing number of
applications for gene-related patents based on gene func-
tion analyses, pursuit of disease-specific expression
profiles for differentially regulated genes, and related
screening methods.
PERFORMANCE-BASED COMPENSATION DRAMATICALLY INCREASED
akeda has made extensive changes to its former
system of performance-based compensation for inventors,
tripling compensation amounts. (For example, if a prod-
uct exceeds annual sales of ¥150 billion, performance-
based compensation now increases from ¥10 million to
¥30 million annually.) In addition to rewarding the achieve-
ments of its researchers, Takeda strives to ensure that the
work environment encourages researchers to rise to the
challenge of innovative research.
ROYALTY INCOME
50
40
30
’97 ’98 ’99 ’00 ’01 ’02
20
10
0
(¥ Billion)
Corporate business strategy
Research, development, production, marketing and alliance functions
Researchstrategy
Development strategy
Production strategy
Marketing strategy
Integration Coordination
Intellectual property strategy
INTELLECTUAL PROPERTY STRATEGY AT TAKEDAINTELLECTUAL PROPERTY STRATEGY AT TAKEDA
(Fiscalyear)
p.13T A K E D A A N N U A L R E P O R T 2 0 0 3 RESEARCH AND DEVELOPMENT T A K E D A A N N U A L R E P O R T 2 0 0 3

Code Generic Name Drug Class Brand Name(Country/Region)
Indication (Formulation)
AG-1749
TAP-144-SR
TCV-116
AD-4833
AO-128
TAK-453-SR
MH-15E
NE-58095
TAK-375
TAK-637
(Clinical trialsare placed onclinical hold)
TAK-427
TAK-677
TAK-013
MCC-135
TAK-559
TAK-370
TAK-475
TAK-428
α
β
Fast disintegrating tablets
Symptomatic-GERD
Injectable formulation
Injectable formulation
Smaller capsule
3-month depot/prostate cancer
3-month depot/premenopausal breast cancer
6-month depot/prostate cancer
Chronic heart failure
Diabetic nephropathy
Fixed combination with diuretic
High dose
Outcome study, DIRECT(DIabetic REtinopathy Candesartan Trial)
Outcome study, PROactive (PROspectivePioglitAzone Clinical Trial In MacroVascular Events)
Monotherapy (30mg),(30mg), ( High dose(45mg)(45mg) ( for combined therapy45mg tabletCombination therapy (45mg)
Delay in progression of atherosclerosis
Impaired glucose tolerance (IGT)
Fast disintegrating tablet
Cancerous pain
Cancerous pain
Osteoporosis (once-a-week formulation)
Primary insomnia
Circadian rhythm sleep disorder (CRSD)
Urinary incontinence
Depression
Irritative bowel syndrome (IBS)
Allergic rhinitis
Diabetes mellitus
Obesity
Endometriosis, uterine fibroid
Chronic heart failure, myocardial infarction
Diabetes mellitus
Gastro-esophageal reflux disease (GERD)
Hyperlipemia
Diabetic neuropathy
Diabetes Cancer, urological and digestive system diseases Cardiovascular and central nervous system diseases Bone, joint and allergic diseases
Overview of Product Status
T A K E D A A N N U A L R E P O R T 2 0 0 3 O U R P I P E L I N E T A K E D A A N N U A L R E P O R T 2 0 0 3p.14

p.15T A K E D A A N N U A L R E P O R T 2 0 0 3 O U R P I P E L I N E T A K E D A A N N U A L R E P O R T 2 0 0 3
Regulatory Authority Region
U.S.A.
Japan
Japan
U.S.A.
Japan
Japan
Japan
U.S.A.Europe
JapanEurope
Japan
Japan
Japan
Europe
Europe
EuropeEuropeU.S.A.
U.S.A.
Japan
Japan
Japan
Japan
Japan
Japan
U.S.A.Europe
U.S.A.
Japan
U.S.A.
Europe
U.S.A.
U.S.A.
Japan
U.S.A.
U.S.A.
Japan
U.S.A.
Europe
U.S.A.
Europe
Japan
U.S.A.
Europe
U.S.A.
Europe
U.S.A.
Europe
Phase I Phase II Phase III NDASubmission
NDAApproval
June 2002
July 2002
* The content of this overview is based on information available as of June 30, 2003.
(Note)(Note)
Note: Positive opinion received from CPMP for monotherapy and 45mg combined therapy in May 2003, and for 45mg tablet in June 2003.

PLANT IN IRELAND
ESTABLISHING A GLOBAL PRODUCTION SYSTEM
akeda is in the process of establishing an opti-
mum global production system for the expansion of the
Company’s pharmaceutical business worldwide.
A bulk manufacturing plant is currently under
construction in Ireland. It will begin production of bulk
pharmaceuticals in fiscal 2004 and is scheduled to supply
bulk medicines for products in the clinical stage as well as
the bulk active ingredient of Actos. With the opening of
the new plant, bulk production will be underway at two
locations: the Hikari plant in Japan, and in Ireland.
Takeda manufactures pharmaceuticals in Japan,
Europe — through Takeda Ireland Ltd. and Takeda Italia
Farmaceutici S.p.A.— and Asia — through Tianjin Takeda
Pharmaceuticals Co., Ltd., Takeda (Thailand), Ltd., and
P.T. Takeda Indonesia. Takeda Ireland Ltd., which began
production in 1999, has been working to meet the sharp
increase in demand in the United States and Europe.
As Takeda increases purchasing within Europe of
intermediates for bulk pharmaceuticals, it is expected that
the plants in Ireland and Italy will make significant contri-
butions to reducing physical distribution costs. Further-
more, as part of the restructuring of the production sys-
tem in Japan, the Shonan plant is scheduled to cease
operation at the end of fiscal 2005.
BUILDING A GLOBAL QUALITY ASSURANCE SYSTEM
akeda is enhancing its global quality assurance
system along with the establishment of its global produc-
tion system. Inspections based on the Takeda Quality As-
surance Standards are conducted both at the company’s
own plants and at the plants of its overseas affiliates and
toll-manufacturers. Takeda has implemented a system
whereby identical quality is assured at all production sites
around the world.
STRATEGIC USE OF OUTSOURCING
akeda uses outsourcing strategically to establish
co-prosperous and dependable relationships with the
companies to which it entrusts production. As a result, the
share of production outsourced by Takeda has risen from
about 30% at the start of fiscal 2001 to about 55% at the
end of the fiscal 2002. Naturally, Takeda continues to un-
dertake in-house production processes that can only be
conducted using Takeda’s core production technologies.
T T
T
With the completion of a new bulk pharmaceutical manufacturing plant in Ireland in fiscal 2004,
Takeda will have in place an integrated system for producing a range of materials for Europe and the United States—from bulk compounds to the company’s main pharmaceutical products.
T A K E D A A N N U A L R E P O R T 2 0 0 3 P R O D U C T I O N S Y S T E M T A K E D A A N N U A L R E P O R T 2 0 0 3p.16

MANUFACTURING BASESACTU AS
BASIC ENVIRONMENTAL POLICIES
1 To promote the 2nd Responsible Care Program.
2 To improve environmental and accident prevention management systems.
3 To promote the 8th Five-Year Plan for Energy Conservation and the Fiscal 2010 Plan.
4 To raise environmental and accident prevention awareness and improve education and training.
1) Reduce the volume of waste at final disposal;*1
2) Reduce the volume of chemical substances released into the environment;*2
3) Achieve the numerical targets of the 8th Five-Year Plan for Energy Conservation;4) Conduct further education and training; and5) Maintain and improve the living environment in local communities where Takeda operates.
• IRELAND (Bulk pharmaceuticals, under construction)
• IRELAND (Pharmaceuticals)
• ITALY (Pharmaceuticals)
•• THAILAND (Pharmaceuticals)
• CHINA (Pharmaceuticals)
• INDONESIA (Pharmaceuticals)
• JAPAN (Bulk Pharmaceuticals)• JAPAN (Pharmaceuticals)
Takeda is working hard to preserve the global environment. In 1992, Takeda developed its Basic Principles on the Environment, which begin with the Company’s funda-’smental commitment: “Give serious consideration to the impact on the environ-ment in every aspect of corporate activities and make the best efforts toconserve and improve the environment.” Today, Takeda’s ongoing 2’s nd
Responsible Care Program includes the following objectives:
*1 Takeda has set a target of 20% reduction in the volume of waste at final disposal by fiscal 2005 as compared to fiscal 2000 levels.*2 Takeda has set a target of 30% reduction at each plant in the release of priority control chemical substances by fiscal 2005 as compared to fiscal 2000 levels.
p.17T A K E D A A N N U A L R E P O R T 2 0 0 3 P R O D U C T I O N S Y S T E M T A K E D A A N N U A L R E P O R T 2 0 0 3

T A K E D A A N N U A L R E P O R T 2 0 0 3 M A R K E T I N G T A K E D A A N N U A L R E P O R T 2 0 0 3p.18

Laboratoires Takeda’s MRs’
The Heart of Diabetes team celebrates the beginning of the program's second year.
T
L
LABORATOIRES TAKEDA, TAKEDA IN FRANCEENHANCING QUALITY OF LIFE FOR PATIENTS WITH LIFESTYLE-RELATED DISEASES
aboratoires Takeda, the oldest of Takeda’s six mar’ -
keting companies in Europe, has been bringing Takeda’s su’ -
perior products to the French people for more than 20 years.
In the general practitioner market which repre-
sents more than 80% of the French market for ethical
pharmaceuticals, Laboratoires Takeda fields medical repre-
sentatives (MRs) in three therapeutic lines, specializing in
the digestive system, the cardiovascular system and diabe-
tes. Respectively, the three groups promote Ogast (lanso-
prazole), Kenzen (candesartan), and Actos (pioglitazone).
Teams of three MRs—one from each group— join forces
to provide high quality information in the spirit of “offering
the right information to the right audience at the right
time.”
Laboratoires Takeda also conducts training sessions
for young cardiologists throughout France, helping them to
improve their skills in echocardiography as well as their
knowledge of treatment options for cardiovascular patients.
These initiatives have been highly rated by medical profession
and patient alike.
Laboratoires Takeda is determined to continue to
win the confidence of the French medical profession, ex-
ceeding all expectations by providing superior products to
patients in all of France.
TAKEDA PHARMACEUTICALS NORTH AMERICA (TPNA)PROMOTING UNDERSTANDING OF DIABETES AND INSULIN RESISTANCE
PNA has been marketing the antidiabetic drugPNA has been marketing the antidiabetic drug TActos since 1999. The company not only exchanges infor-
mation with physicians, but also provides diabetes-related
information to patients. The company emphasizes educa-
tion and awareness initiatives. For instance, along with the
provision of information on cardiovascular disease and in-
sulin resistance through the Heart of Diabetes Program co-
developed by TPNA and the American Heart Association,
TPNA produced a video in which diabetes specialists offer
a simple explanation of insulin resistance. The video was
then offered for broadcast by TV stations around the Unit-
ed States. TPNA also created a website, Actos.com, to sup-
port the health management of diabetes patients. The site
has been very well received, and welcomes about 40,000
visitors every month.
Based on these wide-ranging exchanges of infor-
mation and its superior product-profile, Actos has already
been prescribed to nearly three million patients since sales
began in the U.S. in 1999. In 2002, Actos became the fifth
quickest product in the history of the U.S. pharmaceutical
market to achieve annual sales of $1 billion. TPNA is
looking forward to providing more helpful information to
patients and healthcare professionals, and hopes in so do-
ing to contribute to quality of life for patients.
p.19T A K E D A A N N U A L R E P O R T 2 0 0 3 M A R K E T I N G T A K E D A A N N U A L R E P O R T 2 0 0 3

Tokyo Branch MR Hidetaka Nakanoprovidesproduct information toDr. Yoshihito Atsumi, Director, Department of Internal Medicine, Tokyo Saiseikai Central Hospital
PURSUING EVERY OPPORTUNITY TO IMPROVE HEALTH
akeda strives toward better health for individuals
and progress in medicine by developing superior pharma-
ceutical products”— this is the mission that inspires Takeda
to provide new products to patients and healthcare profes-
sionals, while extending the benefits of existing products
through additional indications and new formulations. In fis-
cal 2002 alone, the company demonstrated prolific accom-
plishments: the launch of Benet for osteoporosis treatment;
an additional indication for the antidiabetic drug Actos to
be concomitantly used with anα-glucosidase inhibitor; a
new orally disintegrating tablet formulation of Prevacid for d
the treatment of peptic ulcers; the launch of Lansap 400
and Lansap 800, which are combination packs of Prevacid
with two other drugs for eradicating Helicobacter pylori;
and a new 3-month depot
version of Lupron Depot
called Leuplin SR for
the treatment of
prostate cancer.
QUALITY INFORMATION CONTRIBUTES TO MEDICAL KNOWLEDGE
akeda MRs execute the basic philosophy of provid-
ing “superior drugs and quality information to all health-
care professionals and all patients.” Takeda MRs deliver
high quality product information to healthcare professionals
daily. Their efforts consistently receive high marks on physi-
cian surveys done by external firms.
Takeda also supports its MRs by holding seminars
for physicians, building networks of leading physicians in the
treatment of lifestyle-related diseases, supporting medical co-
operation among universities, large hospitals and local clinics,
and holding nationwide virtual lectures via videoconference.
INFORMATION TECHNOLOGY MAXIMIZES EFFICIENCY
akeda provides training programs, on-the-job-
training and self-learning opportunities to every MR. At the
flagship Takeda MR University, MRs are equipped with ad-
vanced expertise on cardiovascular disease and diabetes.
Takeda also invests in IT infrastructure to enable efficient
information sharing, learning and collaboration. IT systems
for MRs include e-Learning for
self-learning and Knowledge
Force, which enables MRs
to share success factors.
Takeda has also created
a comprehensive web-
site for physicians, and
recently introduced an
Internet-based tool that
supports interactive com-
munication between physicians
and Takeda MRs.
COMPLIANCE PROGRAM UNIVERSALLY ADOPTED
T kedaakedaT ’s board members, auditors, and employees’
all adhere to the Company’s Compliance Program. Everyone’
representing Takeda is required to practice compliance in
personal conduct and company business. In regard to ex-
changes of medical information, the Program obliges staff to
possess a high level of expertise, conduct themselves ethi-
cally as good partners enjoying the trust of healthcare pro-
fessionals, abide by laws and regulations, and exchange in-
formation properly. Whether exchanging information when
working with physicians and pharmacists, or contributing
in general to the appropriate usage of products and the ad-
vancement of medicine, all Takeda staff earnestly strive to
comply with ethical standards.
“T
T
T
T A K E D A A N N U A L R E P O R T 2 0 0 3 M A R K E T I N G T A K E D A A N N U A L R E P O R T 2 0 0 3p.20

From left;Alinamin EX,Benza Block IP,Hicee White 2,Alinamin V
Benet, a treatment for osteoporosisAvailable in JapanLarge-scale clinical investigations have confirmed that once-daily dosing with Benet increases bone mass and inhibits fractures. Benet is also valued for the ease with which it can be taken by elderly pa-tients due to the convenience of its small, film-coated tablets.
Basen, an antidiabetic agent that improves postprandial hyperglycemia
Available in Japan and AsiaBasen, a drug for treating postprandial
hyperglycemia, has been gaining attention in recent years for its ability to delay the
digestion and absorption of carbohydrates by inhibiting α-glucosidase. It has been win-ning high acclaim as a diabetic treatment
particularly suited to Japanese dietary habits and clinical presentations.
Takeda is currently developing Basen with the aim of offering an additional indication
for impaired glucose tolerance (IGT, a condi-tion that can lead to diabetes).
Takeda’s Consumer Health Care Company, which develops and ’markets consumer healthcare (over-the-counter) drugs, places business priority on meeting the needs of customers’ daily lives. Takeda’s consum’ -er healthcare portfolio includes medicines such as nutritional health pro-moting products, cold remedies, skin care products, laxatives, and prod-ucts to treat athlete’s foot.’
The Alinamin brand, a series of health promoting products con-taining the vitamin B1 derivative fursultiamine, includes the tablets Ali-namin EX andX Shin Alinamin A, the health tonics Alinamin V, Alinamin 7, and Alinamin 7 Gold, as well as Alinamin V&V New, which was launched in May 2003. The Alinamin brand has enjoyed patronage for nearly 50 years since the first product was launched in 1954. The“concept of managing fatigue” is the key phrase of the Alinamin brand, which will continue to contribute to health and help people make the most of their daily lives.
Under the Benza brand of cold remedies, in fiscal 2002, Takeda alaunched Benza Block IP Sairyu (powder), as well as two medicines for specific cold-related symptoms, Benza Block Sekidome Jo (cough tablets)
and Benza Ace Sekidome Jelly (cough jelly). Takeda’s diversified portfolio ’of products related to cold meets the varied needs of people’s daily lives.’
The Hicee brand of skin care products addresses people’s concerns ’over skin trouble. The flagship product of the Hicee brand is Hicee White 2, which combines vitamin C with other ingredients beneficial for the skin. This product lightens liver spots and freckles, and was launched in May 2002. The vitamin B2 and B6 product Hicee B Mateprotects the skin from acne and roughness.
The Scorba brand of athletea ’s foot treatments saw the launch in ’February 2003 of the Scorba Dash Series. This series includes Scorba Dash, Scorba Dash Eki (liquid), and Scorba Dash Cream, all of which contain butenafine hydrochloride, an ingredient that was approved for use in over-the-counter drugs in addition to prescription medicines.
Furthermore, in March 2003, Takeda launched Actage AN Jo (tab-lets) as a new brand of oral medication that is positioned for joint pain. Supplementing conventional ointments and patches, Takeda offers an option of taking medicine orally. Takeda is striving to become the leader in this new category.
TINFORMATION ON LIFESTYLE-RELATED DISEASES PROVIDED
akeda undertakes various educational programs to akeda undertakes various educational programs to Tassist the public to be aware of the seriousness of lifestyle-
related diseases, which often develop without symptoms
and can go unnoticed. These programs include public lec-
tures throughout Japan, and lifestyle-related disease seminars
for the mass media.
Takeda also presents helpful information on its
website about lifestyle-related diseases. Menu items include:
Discussions on Osteoporosis, Lending a Hand: Dietary Therapy,
Men’s Corner, Gastric/Duodenal Ulcers and H. pylori, and Wom’ -
en’s Corner.’ In March 2003 Takeda introduced a new menu
item, Heartburn: Reflux Esophagitis. This site provides infor-
mation on reflux esophagitis, which has recently been on
the rise among Japanese and which can be caused by a west-
ernization of eating habits, aging, and increased stress
(http://www.takeda.co.jp/pharm/jap/seikatu/index.html
[ Japanese language website]). Takeda will continue to pro-
vide information on lifestyle-related diseases.
p.21T A K E D A A N N U A L R E P O R T 2 0 0 3 M A R K E T I N G T A K E D A A N N U A L R E P O R T 2 0 0 3

Members of Team Takedatake part in “America“ ’s’Walk for Diabetes” in
ChicagoTAKEDA GLOBAL CONCERTS IN JAPAN, THE U.S., AND EUROPE
ontributing to society through music, Takeda has
sponsored concert tours by the London Symphony Or-
chestra in Japan, the U.S., and Europe since 1989. The
London Symphony Orchestra, the oldest and most promi-
nent orchestra in London, enjoys the patronage of H.M.
Queen Elizabeth II, and will celebrate its 100th anniver-
sary in 2004. Meeting the expectations of classical music
aficionados around the world, Takeda is currently spon-
soring a world tour, which began with performances in
Europe in April 2003 and will extend through March
2004 with stops in the U.S. and Japan.
SUPPORTING INTRACTABLY ILL CHILDREN AND THEIR FAMILIES
akeda endorses The Peter Pan Children’s Fund*
and offers support by providing opportunities for intract-
ably ill children and their families to meet with specialists to
learn more about the illnesses they are suffering from and
the care to be provided, and to share information with
other families experiencing similar difficulties. Since 1999,
Takeda has sponsored The Peter Pan Children’s Fund Sym-
posium ten times at various locations throughout Japan.
Takeda hopes these symposia will serve as a catalyst for
thinking about how to help intractably ill children.
*The Peter Pan Children’s FundIn 1852, the Great Ormond Street Children’s Hospital opened in Lon-don, becoming the world’s first children’s hospital. Peter Pan author Sir James Barrie visited the hospital 50 years later and, sympathetic to the hospital’s purpose, donated all rights related to Peter Pan to the hospi-tal and established The Peter Pan Children’s Fund.
GROWING INITIATIVES FOR GOOD CORPORATE CITIZENSHIP IN THE UNITED STATES
n fiscal 2002, Takeda’s U.S. sales company, Takeda
Pharmaceuticals North America, Inc. (TPNA), provided
support to over 100 non-profit organizations. In fiscal
2003, TPNA will team up with the American Diabetes
Association (ADA) nationally to establish the TPNA Men-
tor-Based Minority Postdoctoral Fellowship Program, a
scholarship program for physicians. On a local level, the
company is the main sponsor of the ADA event, America’s
Walk for Diabetes, in Chicago. Over 30% of TPNA em-
ployees in Chicago plan to participate in the event this
year. TPNA is also a supporter of the School Walk for Dia-
betes, an event that highlights the importance of exercise
in preventing diabetes in children.
TAP Pharmaceutical Products Inc. (TAP), a joint
venture between Takeda and Abbott Laboratories, is a
founding sponsor of the non-profit organization Center
for Companies That Care, and continues to endorse the
Center’s activities. The Center was established to encour-
age companies to maintain work environments based on
dignity and respect for all employees, and to contribute to
their local communities. By bettering work environments,
the Center also aims to encourage employees to work ethi-
cally and to engage in noble-minded activities for the
community in their spare time.
Both TPNA and TAP encourage employees to par-
ticipate in community activities by sponsoring fundraising
drives and offering time off for volunteer work.
C
T
I
For Takeda, being “a company that grows to-gether with its stakeholders” is a stated management policy. Of course, Takeda’s business activities contri-bute significantly to society at large, but the company also places importance on its relationships with local communities and offers specific support for cultural, health and sporting initiatives.
T A K E D A A N N U A L R E P O R T 2 0 0 3 C O R P O R A T E C I T I Z E N S H I P T A K E D A A N N U A L R E P O R T 2 0 0 3p.22

p.23T A K E D A A N N U A L R E P O R T 2 0 0 3 F I N A N C I A L S E C T I O N T A K E D A A N N U A L R E P O R T 2 0 0 3
T A K E D A A N N U A L R E P O R T 2 0 0 3 F I N A N C I A L S E C T I O N T A K E D A A N N U A L R E P O R T 2 0 0 3p.24
R E V I E W O F O P E R A T I O N S A N D F I N A N C I A L C O N D I T I O NTakeda Chemical Industries, Ltd. and SubsidiariesYear ended March 31, 2003 (Fiscal 2002)
In the ethical pharmaceuticals industry—Takeda’s core business—market growth slowed as industrialized countriesincreased measures to contain healthcare costs. In addition, there iscurrently a shortage of new drug launches worldwide. Simultaneously,R&D expenses rose sharply, creating even more fierce competitionamong pharmaceuticals companies. Annual growth in the UnitedStates, the world’s largest pharmaceuticals market, remained strongat over 10% compared with the previous fiscal year. However, itsconsistently high growth rate is beginning to show signs of weakening due to the federal government’s promotion of genericdrugs usage, measures by the states to hold back drug prices andother factors. In Japan, where National Health Insurance (NHI)drug price revisions were enacted in April 2002, the overall phar-maceuticals market was about level with the prior fiscal year.In Europe, many countries have taken measures to contain thecost of drugs, causing a general slowdown in market expansion.
In this environment, Takeda continued to focus the goals of our2001–2005 Medium-term Management Plan by taking actions toincrease sales of our mainstay products which consist primarily ofinternational strategic products, and enhance our R&D pipeline. We continued to implement measures to build optimal businessstructures in our non-pharmaceuticals businesses.
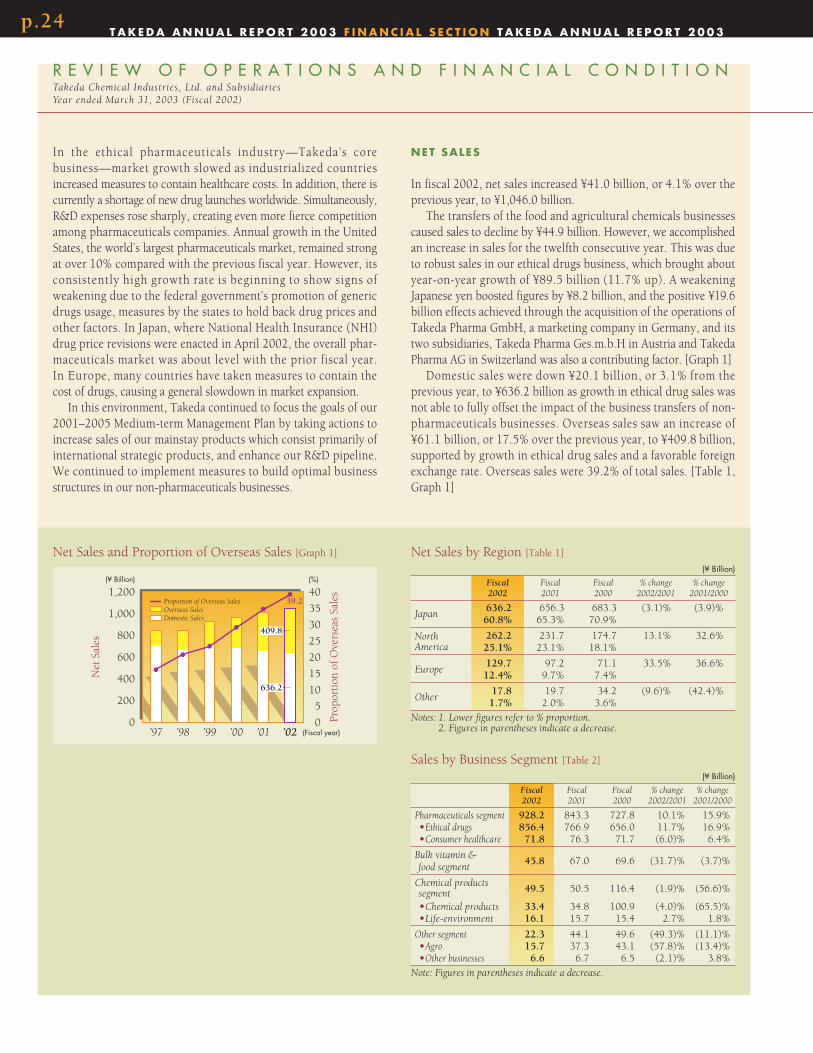
NET SALES
In fiscal 2002, net sales increased ¥41.0 billion, or 4.1% over theprevious year, to ¥1,046.0 billion.
The transfers of the food and agricultural chemicals businessescaused sales to decline by ¥44.9 billion. However, we accomplishedan increase in sales for the twelfth consecutive year. This was dueto robust sales in our ethical drugs business, which brought aboutyear-on-year growth of ¥89.5 billion (11.7% up). A weakeningJapanese yen boosted figures by ¥8.2 billion, and the positive ¥19.6billion effects achieved through the acquisition of the operations ofTakeda Pharma GmbH, a marketing company in Germany, and itstwo subsidiaries, Takeda Pharma Ges.m.b.H in Austria and TakedaPharma AG in Switzerland was also a contributing factor. [Graph 1]
Domestic sales were down ¥20.1 billion, or 3.1% from the previous year, to ¥636.2 billion as growth in ethical drug sales wasnot able to fully offset the impact of the business transfers of non-pharmaceuticals businesses. Overseas sales saw an increase of¥61.1 billion, or 17.5% over the previous year, to ¥409.8 billion,supported by growth in ethical drug sales and a favorable foreignexchange rate. Overseas sales were 39.2% of total sales. [Table 1,Graph 1]
0
200
400
600
800
1,000
1,200
’02’01’00’99’98’97
(¥ Billion)
Proportion of Overseas SalesOverseas SalesDomestic Sales
Net
Sal
es
(Fiscal year)0
5
10
15
20
25
30
35
40
Prop
orti
on o
f Ove
rsea
s Sa
les
(%)
39.2
409.8
636.2
Net Sales and Proportion of Overseas Sales [Graph 1] Net Sales by Region [Table 1]
(¥ Billion)
Fiscal Fiscal Fiscal % change % change2002 2001 2000 2002/2001 2001/2000
Japan636.2 656.3 683.3 (3.1)% (3.9)%60.8% 65.3% 70.9%
North 262.2 231.7 174.7 13.1% 32.6%America 25.1% 23.1% 18.1%
Europe129.7 97.2 71.1 33.5% 36.6%12.4% 9.7% 7.4%
Other17.8 19.7 34.2 (9.6)% (42.4)%1.7% 2.0% 3.6%
Notes: 1. Lower figures refer to % proportion.2. Figures in parentheses indicate a decrease.
Sales by Business Segment [Table 2]
(¥ Billion)
Fiscal Fiscal Fiscal % change % change2002 2001 2000 2002/2001 2001/2000
Pharmaceuticals segment 928.2 843.3 727.8 10.1% 15.9%•Ethical drugs 856.4 766.9 656.0 11.7% 16.9%•Consumer healthcare 71.8 76.3 71.7 (6.0)% 6.4%
Bulk vitamin & 45.8 67.0 69.6 (31.7)% (3.7)%
food segment
Chemical products49.5 50.5 116.4 (1.9)% (56.6)%segment
•Chemical products 33.4 34.8 100.9 (4.0)% (65.5)%•Life-environment 16.1 15.7 15.4 2.7% 1.8%
Other segment 22.3 44.1 49.6 (49.3)% (11.1)%•Agro 15.7 37.3 43.1 (57.8)% (13.4)%•Other businesses 6.6 6.7 6.5 (2.1)% 3.8%
Note: Figures in parentheses indicate a decrease.

p.25T A K E D A A N N U A L R E P O R T 2 0 0 3 F I N A N C I A L S E C T I O N T A K E D A A N N U A L R E P O R T 2 0 0 3
NET SALES BY BUSINESS SEGMENT [Table 2]
Pharmaceuticals segmentIn the pharmaceuticals segment, which is made up of ethical drugsand consumer healthcare (OTC products) businesses, the mainactivities are the manufacture and sale of ethical drugs, OTC products and reagents.
Segment sales increased ¥84.9 billion, or 10.1% over the previous year, to ¥928.2 billion. [Graph 2]
Ethical drug sales increased ¥89.5 billion from the previous yearto ¥856.4 billion.
In Japan, competition from foreign companies is intensifying.To become more competitive, Takeda has concentrated on increas-ing sales of core products by providing high-quality scientificinformation to medical professionals. One result was a substantialincrease to ¥70.1 billion in sales of the antihypertensive Blopress.Sales of the anti-ulcerant Takepron continued to grow, rising to¥33.9 billion in fiscal 2002. Contributing to this performance wasthe June 2002 introduction of a new orally disintegrating tablet formulation of this drug, and the December 2002 launch ofLansap, a combination pack with two other drugs for eradicationof Helicobacter pylori. Among other mainstay products, Basen,which improves postprandial hyperglycemia in diabetes, andLeuplin, a treatment for prostate cancer and endometriosis, bothposted higher sales. Also contributing to sales growth was theosteoporosis treatment Benet, which went on sale in May 2002.As a result, ethical drug sales increased ¥20.2 billion, or 4.6% overthe previous year, to ¥462.0 billion despite the April 2002 revisionto the NHI prices for drugs.
In December 2002, Takeda sold all its shares of ShimizuPharmaceutical Co., Ltd., an equity-method affiliate, and terminated an exclusive sales contract with this company as ofMarch 31, 2003.
Outside Japan, mainstay products continued to post highersales. Among these products were the anti-diabetic drug Actos, thetreatment of peptic ulcer, lansoprazole (domestic brand name:Takepron), leuprolide acetate (domestic brand name: Leuplin) for the treatment of prostate cancer and endometriosis, and thetreatment of hypertension, candesartan cilexetil (domestic brandname: Blopress). As a result, overseas sales increased ¥69.2 billion,or 21.3% over the previous year, to ¥394.4 billion.
To enable Takeda to become a world-class pharmaceuticalscompany, the minimum target in goal in our 2001–2005 Medium-term Management Plan of achieving single-year sales* of in-house ethical drugs of over one trillion yen was achieved in fiscal 2002.Including the effect of a weaker yen, sales of these drugs increased¥116.2 billion, or 12.4% over the previous year, to ¥1,053.3 billion.[Graph 3, Table 3]
0
200
400
600
800
1,000
’02’01’00’99’98’97
(¥ Billion)
Consumer HealthcareEthical Drugs (Overseas)Ethical Drugs (Domestic)
(Fiscal year)
394.4
71.8
462.0
Net Sales in the Pharmaceuticals Segment [Graph 2]
0
200
400
600
800
1,000
1,200
’02’01’00’99’98’97
(¥ Billion) (%)
Proportion of Overseas SalesOverseas SalesDomestic Sales
Net
Sal
es
(Fiscal year)0
10
20
30
40
50
60
70
80
Prop
orti
on o
f Ove
rsea
s Sa
les73.3
772.0
281.2
Net Sales of In-house Ethical Drugs and Proportion of Overseas Sales [Graph 3]
Net Sales of International Strategic Products [Table 3]
(¥ Billion)
Fiscal Fiscal Fiscal % change % change2002 2001 2000 2002/2001 2001/2000
Leuprolide 105.1 98.1 83.8 7.1% 17.0%[Lupron Depot ] 194.0 180.3 154.7 7.6% 16.5%
Lansoprazole 133.2 114.2 94.3 16.6% 21.1%[Prevacid ] 471.3 421.2 338.1 11.9% 24.6%
Candesartan 105.4 77.4 48.3 36.1% 60.3%[Blopress] 105.5 81.8 50.6 29.0% 61.5%
Pioglitazone 155.3 120.4 69.5 29.0% 73.1%[Actos] 155.3 121.8 69.3 27.6% 75.7%
Notes: 1. Names in square brackets refer to representative brand names.2. Upper figures are consolidated net sales, lower figures are global net
sales including affiliates accounted for by the equity method.
*Includes sales of equity-method affiliates, which are not included in consolidatednet sales because Takeda’s ownership is 50% or less.

T A K E D A A N N U A L R E P O R T 2 0 0 3 F I N A N C I A L S E C T I O N T A K E D A A N N U A L R E P O R T 2 0 0 3p.26
By region, sales were up ¥77.3 billion in the Americas, ¥17.3billion in Europe and ¥20.1 billion in Japan. Overall, Takeda wasable to increase sales, chiefly of international strategic products, inall regions. [Graph 3, Table 4]
In the consumer healthcare products business, sales were strongfor Hicee White 2, a product that was launched in May 2002 as a means of making freckles less conspicuous. However, adversemarket conditions in the consumer healthcare business broughtdown sales of the tablets and health tonics of the Alinamin brand.Total consumer healthcare product sales thus decreased ¥4.5 billion,or 6.0% over the previous year, to ¥71.8 billion.
Non-pharmaceuticals segmentThe non-pharmaceuticals business segment is made up of the bulkvitamin and food segment, the chemical products segment, and theother business segment. The bulk vitamin and food segment is mainly engaged in the manufacture and sale of bulk vitamins,beverages and healthcare foods. The chemical products segment isdivided into the chemical products business and life-environmentbusiness. Major products are inorganic industrial chemicals, photo-graphic film chemicals, activated carbon and wood preservatives.The other segment is divided into the agro and other businesses.The agro business manufactures and sells agricultural chemicalssuch as insecticides, herbicides and fungicides, as well as animalhealth products.
Bulk vitamin and food segmentSales in this segment were affected by the transfer of the food busi-ness to Takeda-Kirin Foods Corporation on April 1, 2002 in accor-dance with an alliance with Kirin Brewery Company, Limited.As this transfer reduced sales by ¥23.6 billion, total sector saleswere down ¥21.2 billion, or 31.7% over the previous year, to¥45.8 billion.
Chemical products segmentIn the life-environment business, wood preservatives posted highersales, but sales of activated carbon were lower. Segment sales werefurther reduced by the October 2002 transfer of the latex businessto Nippon A&L, Inc. As a result, sales decreased ¥0.9 billion, or1.9%, to ¥49.5 billion.
To retain its competitive superiority and conduct operationseven more efficiently, Takeda spun off the life-environment business on April 1, 2003 as a wholly owned subsidiary calledJapan EnviroChemicals, Ltd.
Other segmentIn this segment, Sumitomo Chemical Takeda Agro Company,Limited began operations in November 2002 through an alliancewith Sumitomo Chemical Co., Ltd., a move that involved transfer-ring Takeda’s agricultural chemicals business to this joint venture.As this reduced sales by ¥20.0 billion, segment sales fell ¥21.7 billion,or 49.3% over the previous year, to ¥22.3 billion. [Graph 4]
0
20
40
60
80
100
’02’01’00’99’98’97
(%)
Other 2.1
Pharmaceuticals 88.7
Bulk Vitamin and Food 4.4
Chemical Products 4.7
(Fiscal year)
Proportion of Each Business Segment to Total Net Sales[Graph 4]
Net Sales of In-house Ethical Drugs by Region [Table 4]
(¥ Billion)
Fiscal Fiscal Fiscal % change % change2002 2001 2000 2002/2001 2001/2000
Japan281.2 261.1 240.8 7.7% 8.4%26.7% 27.9% 31.4%
Americas658.2 580.8 453.6 13.3% 28.1%62.5% 62.0% 59.1%
Europe103.7 86.3 64.7 20.1% 33.5%9.8% 9.2% 8.4%
Other10.0 8.6 8.8 15.7% (1.2)%1.0% 0.9% 1.1%
Notes: 1. Lower figures refer to % proportion.2. Figure in parentheses indicates a decrease.

p.27T A K E D A A N N U A L R E P O R T 2 0 0 3 F I N A N C I A L S E C T I O N T A K E D A A N N U A L R E P O R T 2 0 0 3
OPERATING INCOME
Fiscal 2002 operating income increased ¥29.4 billion, or 10.5%over the previous year, to ¥310.6 billion. [Graph 5]
The gross profit increased ¥78.5 billion, or 11.8% over the previous year, by a greater amount than sales, to ¥745.7 billion,and the gross profit margin improved by 4.9 percentage pointsfrom the previous year, to 71.3%. It is mainly a reflecting of growthof sales of high-value-added products, chiefly of in-house ethicaldrugs, and of transfers of non-pharmaceuticals businesses.
Research and development costs increased ¥23.9 billion overthe previous year. Selling, general and administrative expensesexcluding research and development costs increased ¥25.1 billiondue to the increase in selling and other costs in U.S. and Europeanoperations, the inclusion of newly consolidated subsidiary TakedaPharma GmbH, and others. The higher gross profit more than offsetthese increases, resulting in the eleventh consecutive year ofgrowth in operating income. Operating margin rose to 29.7%, anincrease of 1.7 percentage point over the previous year. [Graph 6]
In the pharmaceuticals segment, growth in sales of in-houseethical drugs, primarily international strategic products, wasgreater than the increase in costs, resulting in a ¥34.2 billion, or12.6% over the previous year, increase in operating income to¥306.4 billion.
In the bulk vitamin and food segment, there was an operatingloss of ¥1.2 billion, down ¥1.3 billion from the prior year’s profit.In the chemical products segment, operating income was down¥1.1 billion, or 28.4% over the previous year, to ¥2.9 billion. Inthe other segment, operating income fell ¥2.1 billion, or 45.0%over the previous year, to ¥2.6 billion.
Due to these factors, the pharmaceuticals business accountedfor 98.6% of total operating income. [Table 5]
Fiscal 2002 R&D costs increased ¥23.9 billion, or 23.9% overthe previous year, to ¥124.2 billion. The ratio of R&D costs to netsales in all businesses rose by 1.9 percentage point to 11.9%compared with the previous year, and the ratio of R&D costsrelated to ethical drugs to its net sales rose by 1.8 percentage pointover the previous year, to 13.9%. [Graph 7]
R&D investments were increased to strengthen and accelerateactivities to expand our R&D pipeline, the source of future growth,and rapidly bring to market new drugs that can join currentmainstay products.
0
50
100
150
200
250
300
350
’02’01’00’99’98’97
(¥ Billion)
(Fiscal year)
310.6
Operating Income [Graph 5]
0
20
40
60
80
100
’02’01’00’99’98’97
(%)
Operating Income 29.7
Cost of Sales 28.7
SG&A Expenses 41.6
(Fiscal year)
Ratio of Operating Costs and Expenses, and OperatingIncome to Net Sales [Graph 6]
0
30
60
90
120
150
’02’01’00’99’98’97
(¥ Billion) (%)
Ratio of R&D Costs to Net Sales in Ethical Drugs BusinessRatio of R&D Costs to Net Sales in All BusinessesR&D Costs
R&
D C
osts
(Fiscal year)0
5
10
15
20
Rat
io o
f R&
D C
osts
to
Net
Sal
es
13.9
124.2
11.9
R&D Costs and Ratio to Net Sales [Graph 7]
Operating Income by Business Segment [Table 5]
(¥ Billion)
Fiscal Fiscal Fiscal % change % change2002 2001 2000 2002/2001 2001/2000
Pharmaceuticals306.4 272.2 220.3 12.6% 23.5%98.6% 96.8% 97.5%
Bulk vitamin & food(1.2) 0.1 (5.1) — —
(0.4)% 0.1% (2.3)%
Chemical products2.9 4.0 6.0 (28.4)% (33.2)%
0.9% 1.4% 2.7%
Other2.6 4.7 4.6 (45.0)% 1.8%
0.8% 1.7% 2.1%Notes: 1. Upper figures in parentheses indicate a loss.
2. Lower figures refer to % proportion.3. Lower figures in parentheses indicate a decrease.

T A K E D A A N N U A L R E P O R T 2 0 0 3 F I N A N C I A L S E C T I O N T A K E D A A N N U A L R E P O R T 2 0 0 3p.28
Regarding in-house R&D, Takeda upgraded activities targeting lifestyle-related diseases, its core therapeutic areas, theuse of genome information to identify new drug targets, ways toaccelerate processes for new projects, and added value to existingproducts by adding new indications and formulations. In fiscal2002, Takeda began a five-year partnership with the Oxford Centrefor Diabetes. And in partnership with the Beth Israel DeaconessMedical Center, which is affiliated with Harvard University MedicalSchool, joint research began to develop the seeds of new therapiesfor diabetes and obesity.
Along with in-house R&D, Takeda is making extensive use ofalliances to maintain a full pipeline of promising drugs. In August 2002,an agreement was signed with Kissei Pharmaceutical Co., Ltd. forco-marketing in Japan of Mitiglinide (a short-acting insulin secret-agogue to suppress postprandial hyperglycemia), a drug that thiscompany created and developed.
NET INCOME
Net income increased ¥36.1 billion, or 15.3% over the previous fiscal year, to ¥271.7 billion. [Graph 8]
Equity in earnings of affiliates increased ¥14.3 billion, mainlydue to higher earnings at TAP Pharmaceutical Products Inc.
Losses from bulk vitamin and other cartel issues were ¥8.5 billion. Conversely, gains from the transfers of the food business, agricultural chemicals business and the stocks of ShimizuPharmaceutical Co., Ltd. totaled ¥29.9 billion. There was also again of ¥5.2 billion on the sale of fixed assets. As a result of theabove factors, net other income increased ¥29.0 billion.
Consequently, Takeda was able to report higher net income forthe ninth consecutive year.
Earnings per share (EPS) increased ¥40.6, or 15.2% over theprevious year, to ¥307.6. The return on equity (ROE) was 18.2%,0.3 percentage point higher than one year earlier. [Graph 9]
0
50
100
150
200
250
300
350
’02’01’00’99’98’97
(¥)
ROEEPS
EPS
(Fiscal year)0
5
10
15
20
RO
E
(%)
18.2
307.6
EPS/ROE [Graph 9]
0
50
100
150
200
250
300
’02’01’00’99’98’97
(¥ Billion)
(Fiscal year)
271.7
Net Income [Graph 8]

p.29T A K E D A A N N U A L R E P O R T 2 0 0 3 F I N A N C I A L S E C T I O N T A K E D A A N N U A L R E P O R T 2 0 0 3
CASH DIVIDENDS
Takeda’s basic policy is to distribute earnings each fiscal year in linewith its consolidated results of operations. The Company also takesinto consideration the outlook for funds required for investmentsneeded to increase its future corporate value and the outlook for the financial position. Accordingly, the Company conducts a stable distribution of benefits generated by its operating activities.
Retained earnings are used for investments that will lead to newsources of growth, such as ethical drug R&D activities and theexpansion of operations in the US and Europe. At the annual general meeting held on June 27, 2003, shareholders approvedmanagement’s plans to purchase treasury stocks. The objectives areto use capital more productively and gain the ability to conductmore flexible financial actions in accordance with shifts in theoperating environment. A decision on the purchase of treasurystocks will be taken by the time of the ordinary general shareholders’meeting for the next year depending on a comprehensive evalua-tion of relevant factors, including the operating environment, stocksupply-demand balance and stock price trends.
Takeda has paid cash dividends per share applicable to fiscal2002 of ¥65, consisting of a term-end dividend of ¥33 and aninterim dividend of ¥32. This is ¥5 more than the dividendsapplicable to the prior fiscal year. [Graph 10]
CAPITAL EMPLOYMENT AND F INANCING [Table 6]
As of March 31, 2003, total assets amounted to ¥2,059.3 billion.The transfers of the food, agricultural chemicals and other businessesreduced assets by ¥44.6 billion, and the decline in valuations ofmarketable securities due to lower market prices reduced assets by¥95.3 billion. However, an improvement in cash flows led to anincrease of ¥225.1 billion in liquidity on hand (cash and cashequivalents + time deposits) and marketable securities. Along withother factors, the result was an increase of ¥94.1 billion over theprevious year in total assets. [Graph 11]
Notes and accounts receivable declined ¥32.4 billion over the pre-vious year to ¥202.6 billion, mainly because of the transfers of the foodand agricultural chemicals businesses. The notes and accounts receivableturnover increased 0.68 times to 5.16 times over the previous year.
Property, plant and equipment decreased ¥10.1 billion over theprevious year to ¥203.2 billion, mostly the net result of capital expen-ditures of ¥35.8 billion and the effect of the transfers of the businesses.
With regards to financing, total liabilities decreased ¥54.8 billion, or 10.8%, over the previous year, to ¥451.0 billion.
Shareholders’ equity increased ¥147.6 billion to ¥1,567.7 billion. Although there was a decrease of ¥42.9 billion in unreal-ized gain on available-for-sale securities, the growth in earningsraised retained earnings by ¥216.7 billion. The shareholders’ equityratio increased from 72.3% at the previous year-end to 76.1% and book value per share increased by ¥167.9 from the previousyear-end to ¥1,777.2. [Graph 12]
0
500
1,000
1,500
2,000
2,500
’02’01’00’99’98’97
(¥ Billion)
(Fiscal year)
2,059.3
Total Assets [Graph 11]
0
500
1,000
1,500
2,000
’02’01’00’99’98’97
(¥ Billion)
Shar
ehol
ders
’ Equ
ity
(Fiscal year)
Shareholders’ Equity RatioShareholders’ Equity
0
20
40
60
80
Shar
ehol
ders
’ Equ
ity
Rat
io
(%)
76.11,567.7
Shareholders’ Equity and Shareholders’ Equity Ratio[Graph 12]
Balance Sheet Highlights [Table 6]
(¥ Billion)
Fiscal Fiscal Fiscal % change % change2002 2001 2000 2002/2001 2001/2000
Current assets 1,542.1 1,345.0 1,138.9 14.7% 18.1%
Property, plant and 203.2 213.3 220.3 (4.7)% (3.2)%
equipment
Investments and313.8 406.7 388.4 (22.8)% 4.7%
other assets
Total assets 2,059.3 1,965.2 1,747.7 4.8% 12.4%
Liabilities 451.0 505.8 497.6 (10.8)% 1.6%
Minority interests 40.5 39.2 37.2 3.4% 5.5%
Shareholders’ equity 1,567.7 1,420.0 1,212.8 10.4% 17.1%Note: Figures in parentheses indicate a decrease.
0
10
20
30
40
50
60
70
’02’01’00’99’98’97
(¥)
(Fiscal year)
65.0
Cash Dividends per Share [Graph 10]

T A K E D A A N N U A L R E P O R T 2 0 0 3 F I N A N C I A L S E C T I O N T A K E D A A N N U A L R E P O R T 2 0 0 3p.30
CASH FLOWS [Table 7]
In fiscal 2002, net cash provided by operating activities increased¥22.8 billion over the previous year to ¥263.4 billion. Althoughthere was a ¥24.8 billion increase in income taxes paid, incomebefore income taxes and minority interests rose ¥58.4 billion.
Net cash provided by investing activities increased ¥14.9 billionover the previous year, to ¥140.1 billion, mainly due to gains(¥60.4 billion) from the transfers of the food and agriculturalchemicals businesses, and stocks of Shimizu Pharmaceutical Co., Ltd.
Net cash used in financing activities increased ¥6.3 billion overthe previous year, to ¥58.9 billion, primarily due to an increase of¥5.8 billion in dividends paid.
As a result, cash and cash equivalents (marketable securities andtime deposits with original maturities of three months or less)increased to ¥1,022.9 billion at the end of the fiscal year.
EMPLOYEES
The workforce of Takeda and its subsidiaries was 14,547 as ofMarch 31, 2003, a net increase of 36 compared with one year earlier. Although the transfers of certain businesses reducedemployment, there was an increase of 1,032 employees in thepharmaceuticals segment.
In Japan, the number of employees decreased 1,001 to 10,024 andoutside Japan there was an increase of 1,037 to 4,523. [Graph 13]
Fiscal 2002
Overseas
Domestic
Fiscal 2001
Overseas
Domestic
Total: 14,547
Total: 14,511
31.1%
31.1%
68.9%
24.0%
24.0%
76.0%
4,523
3,486
10,024
11,025
Number of Employees [Graph 13]Cash Flow Highlights [Table 7]
(¥ Billion)
Fiscal Fiscal Fiscal2002 2001 2000
Net cash provided by operating activities 263.4 240.5 212.6
Net cash provided by (used in) investing 140.1 125.2 (58.2)activities
Net cash used in financing activities (58.9) (52.6) (41.9)
Effect of exchange rate change (19.9) 23.4 8.3
Net change in cash and cash equivalents 324.6 336.6 120.8
Change through new consolidations — — (1.1)and eliminations
Cash and cash equivalents, 324.6 336.6 119.7change from the beginning balance
Note: Figures in parentheses indicate a decrease.

p.31T A K E D A A N N U A L R E P O R T 2 0 0 3 F I N A N C I A L S E C T I O N T A K E D A A N N U A L R E P O R T 2 0 0 3
FURTHER RESTRUCTURING OF NON-PHARMACEUTICALS BUSINESSES [Table 8]
In the non-pharmaceuticals businesses, the transition to a new management framework was completed. With the conversion of our life-environment business operations into a wholly owned sub-sidiary in April 2003, all non-pharmaceuticals businesses are nowunder a new management framework that enables Takeda to fullyconcentrate on the pharmaceuticals business. The Company willcontinue to enact a variety of measures to improve the operationsof the life-environment business. At the same time, Takeda willexplore ways to give this business an operating base that can lead toeven greater accomplishments in the future. Regarding other non-pharmaceuticals businesses that are already operating under newmanagement frameworks, the Company will work more closely withjoint venture partners to raise the stature of these businesses in theirrespective fields.
L IT IGATION
Regarding the cartel issues including the bulk vitamin cartel, civillitigation in the United States and Canada is ongoing. In addition,regarding losses alleged to have been sustained as a result ofmarketing and sales practices for leuprolide acetate by TAPPharmaceutical Products Inc. (TAP), in which Takeda’s whollyowned subsidiary Takeda America Holdings, Inc. (TAH) owns a 50percent stake (the other 50 percent is owned by AbbottLaboratories), lawsuits seeking damages have been brought againstTAP, Abbott Laboratories, TAH and the Company in federal andstate courts by patients and insurance companies and others.Takeda is diligently coping with these matters.
Restructuring of Non-pharmaceuticals Businesses [Table 8]
Takeda’sDate Segment Business Tie-up with/transfer to holding after Form of tie-up/transfer
tie-up/transfer
1999/08 Other Takeda Kagaku Shiryo Co., Ltd. BASF Japan Ltd. — Transfer of business to BASF Japan Ltd.
2000/06 Other Animal health business Schering-Plough K.K. 40%Transfer of business to Takeda Schering-Plough Animal Health K.K.
2000/06Chemical Takeda Badisches Urethanes
BASF Japan Ltd. —Elimination of joint venture contract and transfer of shares
products Industries, Ltd. to BASF Japan Ltd.
2001/01Bulk vitamin
Bulk vitamins business BASF Aktiengesellschaft— Transfer of shares of overseas subsidiary to BASF Aktiengesellschaft
& food 34% Transfer of domestic business to BASF Takeda Vitamins Ltd.
2001/03Chemical
Ganz Chemical Co., Ltd. Aica Kogyo Co., Ltd. — Transfer of sharesproducts
Chemical Urethane and other chemicalTransfer of business to Mitsui Takeda Chemicals, Inc.
2001/04products products business
Mitsui Chemicals, Inc. 49% *Upon 5 years after start of operation, all the shares held by Takeda will transfer to Mitsui Chemicals, Inc.
Bulk vitamin Kirin Brewery Company, Transfer of business to Takeda-Kirin Foods Corporation
2002/04& food
Food businessLimited
49% *Upon 5 years after start of operation, all the shares held by Takeda will transfer to Kirin Brewery Company, Limited.
2002/10Chemical Synthetic rubber latex business
Nippon A&L, Inc. — Transfer of business to Nippon A&L, Inc.products Latex business
Transfer of business to Sumitomo Chemical Takeda Agro Sumitomo Chemical
40%Company, Limited.
2002/11 Other Agricultural chemicals businessCo., Ltd. *Upon 5 years after start of operation, all the shares held by
Takeda will transfer to Sumitomo Chemical Co., Ltd.
2003/04Chemical
Life-environment business ― 100%A wholly-owned subsidiary, Japan EnviroChemicals, Ltd.,
products was formed.

T A K E D A A N N U A L R E P O R T 2 0 0 3 F I N A N C I A L S E C T I O N T A K E D A A N N U A L R E P O R T 2 0 0 3p.32
E L E V E N - Y E A R S U M M A R Y O F S E L E C T E D F I N A N C I A L D A T ATakeda Chemical Industries, Ltd. and Subsidiaries
2003 2002 2001 2000
Net sales ¥1,046,081 ¥1,005,060 ¥ 963,480 ¥ 923,132
Operating income 310,686 281,243 226,102 171,443
Income before income taxes and minority interests 431,898 373,427 263,076 202,764
Income taxes 157,485 134,892 114,148 81,446
Minority interests 2,651 2,879 2,073 1,693
Net income 271,762 235,656 146,855 119,625
Capital investments 35,888 44,766 27,411 37,893
Depreciation and amortization 29,962 28,430 33,605 33,364
Research and development costs 124,230 100,278 89,846 77,260
Per share amounts (Yen and U.S. dollars)
(See Note 12 to consolidated financial statements):
Net income ¥ 307.63 ¥ 267.02 ¥ 166.39 ¥ 135.55
Cash dividends 65.00 60.00 50.00 32.00
Current assets ¥1,542,198 ¥1,345,094 ¥1,138,951 ¥ 938,236
Property, plant and equipment (net of accumulated depreciation) 203,282 213,385 220,356 240,531
Investments and other assets 313,889 406,737 388,465 252,895
Total assets 2,059,369 1,965,216 1,747,772 1,431,662
Current liabilities 344,705 371,785 345,626 314,747
Long-term liabilities 106,339 134,099 152,065 104,781
Minority interests 40,593 39,251 37,217 37,220
Shareholders’ equity 1,567,732 1,420,081 1,212,864 974,914
Number of shareholders 76,107 53,364 50,921 51,495
Number of employees 14,547 14,511 15,900 16,254
Notes: 1. The U.S. dollar amounts in this report represent translations of Japanese yen, for convenience only, at the rate of ¥120=US$1, the approximate exchange rate atMarch 31, 2003.
2. Effective April 1, 1999, all subsidiaries were consolidated and all affiliates were accounted for by the equity method. (See Note 2 to consolidated financialstatements for details.)

p.33T A K E D A A N N U A L R E P O R T 2 0 0 3 F I N A N C I A L S E C T I O N T A K E D A A N N U A L R E P O R T 2 0 0 3
Thousands ofMillions of yen U.S. dollars (Note 1)
1999 1998 1997 1996 1995 1994 1993 2003
¥ 844,643 ¥ 841,816 ¥ 838,824 ¥ 801,341 ¥ 771,667 ¥ 727,845 ¥ 720,140 $ 8,717,347
142,220 132,952 127,350 112,707 95,285 88,434 76,675 2,589,052
182,142 166,649 147,985 125,787 107,145 103,210 93,029 3,599,155
89,019 83,368 75,094 64,837 54,424 54,520 43,827 1,312,377
1,368 1,671 1,508 1,106 1,291 1,064 1,168 22,093
91,755 81,610 71,383 59,844 51,430 47,626 48,034 2,264,685
29,241 34,091 30,741 30,358 36,337 42,965 37,953 299,071
32,651 32,763 31,473 33,255 29,768 27,922 27,508 249,690
80,034 79,039 71,754 68,006 67,159 62,934 62,277 1,035,253
¥ 103.52 ¥ 92.97 ¥ 81.52 ¥ 68.35 ¥ 58.74 ¥ 54.43 ¥ 54.98 $ 2.56
29.00 21.25 17.25 15.00 14.00 13.00 12.00 0.54
¥ 839,702 ¥ 841,240 ¥ 798,752 ¥ 787,615 ¥ 721,814 ¥ 693,837 ¥ 662,777 $12,851,640
224,229 232,092 229,400 231,532 241,506 210,236 196,441 1,694,019
250,114 215,628 186,294 153,086 147,428 148,350 147,427 2,615,750
1,314,045 1,288,960 1,214,449 1,172,233 1,110,748 1,052,423 1,006,645 17,161,409
278,857 323,375 292,249 299,032 275,636 271,498 249,853 2,872,528
111,753 116,010 146,029 147,825 157,323 145,657 158,628 886,165
29,236 27,792 26,621 25,467 24,666 21,407 20,508 338,276
894,199 821,783 749,549 699,909 653,123 613,861 577,656 13,064,440
54,059 59,008 71,172 81,278 87,897 89,384 88,446
15,776 16,443 16,586 17,258 17,580 15,792 15,781

T A K E D A A N N U A L R E P O R T 2 0 0 3 F I N A N C I A L S E C T I O N T A K E D A A N N U A L R E P O R T 2 0 0 3p.34
C O N S O L I D A T E D B A L A N C E S H E E T STakeda Chemical Industries, Ltd. and SubsidiariesYears ended March 31, 2003 and 2002
Thousands ofMillions of yen U.S. dollars (Note 1)
2003 2002 2003Assets
Current assets:
Cash and cash equivalents ¥1,022,958 ¥ 698,316 $ 8,524,654
Time deposits 25,000 55,000 208,333
Marketable securities (Note 3) 118,427 187,889 986,897
Notes and accounts receivable—
Trade notes 23,496 43,966 195,805
Trade accounts 168,923 177,002 1,407,698
Due from affiliates 10,224 14,084 85,193
Allowance for doubtful receivables (704) (958) (5,868)
Total 201,939 234,094 1,682,828
Inventories (Note 4) 89,485 96,094 745,711
Deferred income taxes (Note 11) 62,749 56,405 522,911
Other current assets 21,640 17,296 180,306
Total current assets 1,542,198 1,345,094 12,851,640
Property, plant and equipment (Note 5):
Land 55,036 53,878 458,640
Buildings and structures 240,941 244,522 2,007,846
Machinery and equipment 296,787 332,396 2,473,229
Construction in progress 6,869 5,556 57,232
Total 599,633 636,352 4,996,947
Accumulated depreciation (396,351) (422,967) (3,302,928)
Net property, plant and equipment 203,282 213,385 1,694,019
Investments and other assets:
Investments in and advances to affiliates (Note 3) 76,149 77,532 634,576
Investment securities (Note 3) 217,326 312,687 1,811,054
Deferred income taxes (Note 11) 5,675 5,282 47,297
Other assets 14,739 11,236 122,823
Total investments and other assets 313,889 406,737 2,615,750
TOTAL ¥2,059,369 ¥1,965,216 $17,161,409
See notes to consolidated financial statements.

p.35T A K E D A A N N U A L R E P O R T 2 0 0 3 F I N A N C I A L S E C T I O N T A K E D A A N N U A L R E P O R T 2 0 0 3
Thousands ofMillions of yen U.S. dollars (Note 1)
2003 2002 2003Liabilities and shareholders’ equity
Current liabilities:
Bank loans (Note 5) ¥ 3,738 ¥ 4,881 $ 31,155
Current portion of long-term debt (Note 5) 964 1,564 8,038
Notes and accounts payable—
Trade notes 2,987 3,696 24,892
Trade accounts 54,406 56,947 453,389
Due to affiliates 19,213 26,248 160,103
Total 76,606 86,891 638,384
Accrued expenses 110,808 116,694 923,401
Income taxes payable 84,298 82,769 702,486
Other current liabilities 68,291 78,986 569,064
Total current liabilities 344,705 371,785 2,872,528
Long-term liabilities:
Long-term debt (Note 5) 4,866 5,492 40,553
Reserve for retirement benefits (Note 6) 55,648 58,188 463,739
Deferred income taxes (Note 11) 36,007 59,613 300,062
Reserve for SMON compensation (Note 7) 5,040 5,240 42,008
Other long-term liabilities 4,778 5,566 39,803
Total long-term liabilities 106,339 134,099 886,165
Minority interests 40,593 39,251 338,276
Commitments and contingencies (Note 15)
Shareholders’ equity (Notes 8 and 16):
Common stock,authorized 2,400,000,000 shares; issued 889,272,395 shares in 2003 and 2002 63,540 63,540 529,508
Capital surplus 49,637 49,637 413,650
Retained earnings 1,392,639 1,175,938 11,605,330
Unrealized gain on available-for-sale securities 72,794 115,715 606,622
Foreign currency translation adjustment (8,215) 16,480 (68,471)
Treasury stock, at cost; 3,999,407 shares in 2003, 6,831,980 shares in 2002 (2,663) (1,229) (22,199)
Total shareholders’ equity 1,567,732 1,420,081 13,064,440
TOTAL ¥2,059,369 ¥1,965,216 $17,161,409
See notes to consolidated financial statements.

T A K E D A A N N U A L R E P O R T 2 0 0 3 F I N A N C I A L S E C T I O N T A K E D A A N N U A L R E P O R T 2 0 0 3p.36
C O N S O L I D A T E D S T A T E M E N T S O F I N C O M ETakeda Chemical Industries, Ltd. and SubsidiariesYears ended March 31, 2003, 2002 and 2001
Thousands ofMillions of yen U.S. dollars (Note 1)
2003 2002 2001 2003
Net sales (Notes 3 and 14) ¥1,046,081 ¥1,005,060 ¥963,480 $8,717,347
Operating costs and expenses (Note 14):
Cost of sales (Note 3) 300,344 337,854 384,013 2,502,869
Selling, general and administrative (Note 9) 435,051 385,963 353,365 3,625,426
Total operating costs and expenses 735,395 723,817 737,378 6,128,295
Operating income (Note 14) 310,686 281,243 226,102 2,589,052
Other income (expenses):
Interest and dividend income 10,129 9,610 9,927 84,413
Interest expenses (420) (759) (1,020) (3,500)
Equity in earnings of affiliates (Notes 3 and 13) 88,591 74,282 20,963 738,262
Gain on sale of businesses (Note 10) 29,974 26,436 3,861 249,789
Gain on sale of fixed assets 5,282 — — 44,025
Losses on bulk vitamin and other cartel cases (Note 13) (8,527) (12,222) (2,990) (71,058)
Other—net (3,817) (5,163) 6,233 (31,828)
Total other income (expenses) 121,212 92,184 36,974 1,010,103
Income before income taxes and minority interests 431,898 373,427 263,076 3,599,155
Income taxes (Note 11):
Current 158,792 138,411 120,640 1,323,272
Deferred (1,307) (3,519) (6,492) (10,895)
Total income taxes 157,485 134,892 114,148 1,312,377
Income before minority interests 274,413 238,535 148,928 2,286,778
Minority interests 2,651 2,879 2,073 22,093
Net income ¥ 271,762 ¥ 235,656 ¥146,855 $2,264,685
Yen U.S. dollars (Note 1)
Amounts per common share (Note 12):
Net income ¥307.63 ¥267.02 ¥166.39 $2.56
Cash dividends applicable to the year 65.00 60.00 50.00 0.54
See notes to consolidated financial statements.

p.37T A K E D A A N N U A L R E P O R T 2 0 0 3 F I N A N C I A L S E C T I O N T A K E D A A N N U A L R E P O R T 2 0 0 3
C O N S O L I D A T E D S T A T E M E N T S O F S H A R E H O L D E R S ’ E Q U I T YTakeda Chemical Industries, Ltd. and SubsidiariesYears ended March 31, 2003, 2002 and 2001
Thousands ofMillions of yen U.S. dollars (Note 1)
2003 2002 2001 2003
Common stock:
Balance, beginning of year ¥ 63,540 ¥ 63,540 ¥ 63,540 $ 529,508
Balance, end of year ¥ 63,540 ¥ 63,540 ¥ 63,540 $ 529,508
Capital surplus:
Balance, beginning of year ¥ 49,637 ¥ 49,637 ¥ 49,637 $ 413,650
Balance, end of year ¥ 49,637 ¥ 49,637 ¥ 49,637 $ 413,650
Retained earnings:
Balance, beginning of year ¥1,175,938 ¥ 989,129 ¥896,827 $ 9,799,483
Net income 271,762 235,656 146,855 2,264,685
Cash dividends paid; ¥62.00 ($0.52)—2003,¥55.00—2002 and ¥41.50—2001 (per share) (54,705) (48,542) (36,626) (455,882)
Bonuses to directors and corporate auditors (356) (305) (286) (2,956)
Effect on beginning retained earnings of applying the cost method of accounting to previously consolidated subsidiaries and investments in former affiliates previously accounted for using the equity method — — (17,641) —
Balance, end of year ¥1,392,639 ¥1,175,938 ¥989,129 $11,605,330
Unrealized gain on available-for-sale securities:
Balance, beginning of year ¥ 115,715 ¥ 122,388 ¥ — $ 964,292
Net change (42,921) (6,673) 122,388 (357,670)
Balance, end of year ¥ 72,794 ¥ 115,715 ¥122,388 $ 606,622
Foreign currency translation adjustment:
Balance, beginning of year ¥ 16,480 ¥ (11,370) ¥ (34,341) $ 137,333
Net change (24,695) 27,850 22,971 (205,804)
Balance, end of year ¥ (8,215) ¥ 16,480 ¥ (11,370) $ (68,471)
Treasury stock (Note 8):
Balance, beginning of year ¥ (1,229) ¥ (460) ¥ (749) $ (10,242)
Purchases of treasury stock (1,599) (1,461) (4,013) (13,330)
Sales of treasury stock — 692 4,302 —
Effect of adopting a new accounting standard 165 — — 1,373
Balance, end of year ¥ (2,663) ¥ (1,229) ¥ (460) $ (22,199)
See notes to consolidated financial statements.

T A K E D A A N N U A L R E P O R T 2 0 0 3 F I N A N C I A L S E C T I O N T A K E D A A N N U A L R E P O R T 2 0 0 3p.38
C O N S O L I D A T E D S T A T E M E N T S O F C A S H F L O W STakeda Chemical Industries, Ltd. and SubsidiariesYears ended March 31, 2003, 2002 and 2001
Thousands ofMillions of yen U.S. dollars (Note 1)
2003 2002 2001 2003
Operating activities:Income before income taxes and minority interests ¥ 431,898 ¥373,427 ¥263,076 $3,599,155Adjustments to reconcile income before income taxes and minority interests to net cash provided by operating activities:
Income taxes paid (157,660) (132,851) (92,036) (1,313,842)Depreciation and amortization 29,962 28,430 33,605 249,690Loss (gain) on sales and disposals of property, plant and equipment (3,307) (309) 816 (27,565)Equity in earnings of affiliates (1,269) (21,550) 34,693 (10,580)Gain on sale of businesses (29,974) (26,436) (3,861) (249,789)Changes in assets and liabilities:
Decrease (increase) in notes and accounts receivable 17,667 5,859 (42,374) 147,226Decrease (increase) in inventories (5,170) (1,611) (1,745) (43,087)Increase (decrease) in notes and accounts payable (5,776) (590) 9,077 (48,135)
Other (12,922) 16,217 11,411 (107,659)Net cash provided by operating activities 263,449 240,586 212,662 2,195,414
Investing activities:Payment for purchases of marketable securities (141,762) (307,636) (182,496) (1,181,351)Proceeds from sales or maturities of marketable securities 255,718 216,972 197,760 2,130,991Increase in time deposits (67,500) (544,800) (846,300) (562,500)Decrease in time deposits 97,500 762,500 804,100 812,500Payment for purchases of property, plant and equipment (33,477) (37,523) (26,941) (278,980)Proceeds from sales of property, plant and equipment 5,913 1,495 260 49,276Payment for purchases of investment securities (38,469) (38,945) (24,603) (320,575)Proceeds from sales of investment securities 9,358 15,147 1,080 77,991Proceeds from sale of businesses 60,409 58,911 16,535 503,409Payment for acquiring a majority interest in former affiliates (6,056) — — (50,467)Other (1,486) (882) 2,356 (12,391)
Net cash provided by (used in) investing activities 140,148 125,239 (58,249) 1,167,903Financing activities:
Net decrease in short-term bank loans (1,233) (1,230) (315) (10,281)Proceeds from issuance of long-term debt 731 1,518 3,726 6,098Repayment of long-term debt (1,546) (2,282) (8,348) (12,891)Dividends paid (54,435) (48,541) (36,610) (453,625)Other (2,507) (2,123) (363) (20,885)
Net cash used in financing activities (58,990) (52,658) (41,910) (491,584)Effect of exchange rate changes on cash and cash equivalents (Note 2) (19,965) 23,474 8,361 (166,378)Net increase in cash and cash equivalents 324,642 336,641 120,864 2,705,355Cash and cash equivalents, beginning of year 698,316 361,675 241,918 5,819,299Effect from removing subsidiaries from consolidation on cash and cash equivalents at beginning of year — — (1,107) —Cash and cash equivalents, end of year ¥1,022,958 ¥698,316 ¥361,675 $8,524,654Additional cash flow information:
Interest paid ¥ 432 ¥ 872 ¥ 922 $ 3,607Non-cash investing and financing activity:
Assets decreased by removing subsidiaries from consolidation — — (28,363) —Liabilities decreased by removing subsidiaries from consolidation — — (24,339) —Assets and liabilities decreased by sale of businesses and associated proceeds and gain
Sales price 62,260 60,000 17,102 518,833Cash and cash equivalents (1,851) (1,089) (567) (15,424)Proceeds from sale of businesses 60,409 58,911 16,535 503,409Assets and liabilities
Current assets 30,261 26,639 10,560 252,183Non-current assets 14,387 17,351 3,691 119,898Current liabilities (18,217) (15,427) (8,967) (151,814)Non-current liabilities (365) (1,245) (61) (3,042)Minority interests — (428) — —Foreign currency translation adjustment (1) 369 7,451 (16)
Net assets 26,065 27,259 12,674 217,209Unrealized gain 4,370 5,216 — 36,411Gain on sale of businesses ¥ 29,974 ¥ 26,436 ¥ 3,861 $ 249,789
See notes to consolidated financial statements.

N O T E S T O C O N S O L I D A T E D F I N A N C I A L S T A T E M E N T STakeda Chemical Industries, Ltd. and SubsidiariesYears ended March 31, 2003, 2002 and 2001
p.39T A K E D A A N N U A L R E P O R T 2 0 0 3 F I N A N C I A L S E C T I O N T A K E D A A N N U A L R E P O R T 2 0 0 3
Note 1: Basis of Presenting Consolidated Financial StatementsThe accompanying consolidated financial statements are prepared from theconsolidated financial statements issued for domestic reporting purposesin accordance with the provisions set forth in the Japanese Securities andExchange Law. Takeda Chemical Industries, Ltd. (the “Company”) and itsdomestic subsidiaries maintain their accounts and records in accordancewith the provisions set forth in the Japanese Commercial Code and in conformity with generally accepted accounting principles and practices in Japan, which are different in certain respects as to application and disclosure requirements of International Financial Reporting Standards,while its overseas subsidiaries and affiliates do so in conformity with thoseof the countries of their domicile. The consolidated financial statementsare not intended to present the financial position, results of operations and cash flows in accordance with accounting principles and practicesgenerally accepted in countries and jurisdictions other than Japan.
In preparing the consolidated financial statements, certain reclassifica-tions and rearrangements have been made to the consolidated financialstatements issued domestically in Japan in order to present them in a formwhich is more familiar to readers outside Japan.
The financial statements are stated in Japanese yen, the currency of the country in which the Company is incorporated and operates. Thetranslations of Japanese yen amounts into U.S. dollar amounts areincluded solely for the convenience of readers outside Japan and have beenmade at the rate of ¥120 to U.S.$1, the approximate rate of exchange atMarch 31, 2003. Such translations should not be construed as representa-tions that the Japanese yen amounts could be converted into U.S. dollars atthat or any other rate.
Note 2: Summary of Significant Accounting PoliciesPrinciples of ConsolidationThe accompanying consolidated financial statements include the accountsof the Company and all of its subsidiaries (together the “Companies”).Investments in affiliated companies are accounted for by the equitymethod. All significant intercompany balances and transactions are eliminated in consolidation.
Financial information for certain subsidiaries is based on their fiscalyear end of December 31.
During the year ended March 31, 2001, the Company began applyingthe cost method to two previously consolidated subsidiaries and one affiliated company previously accounted for by the equity method due to adecrease in ownership of these companies. The retained earnings at April1, 2000 were retroactively adjusted. Additionally, the Companies sold fivesubsidiaries and an affiliated company during the year ended March 31,2001, and acquired minority interests in two newly established companies,which have been accounted for by the equity method.
During the year ended March 31, 2002, the Company established onenew subsidiary and acquired a minority interest in one newly establishedcompany, which has been accounted for by the equity method. The com-pany also sold five subsidiaries and two affiliated companies during the yearended March 31, 2002. Additionally, three subsidiaries have been removedfrom the consolidation scope due to mergers with other subsidiaries.
During the year ended March 31, 2003, the Company established onenew subsidiary and one affiliated company. In addition, one affiliatedcompany accounted for by the equity method in prior periods, and two ofits subsidiaries, were included in the consolidation as subsidiaries since theCompany acquired additional equity in the companies. Further, during theyear ended March 31, 2003, the Company sold four subsidiaries and oneaffiliated company and liquidated one subsidiary, which were excludedfrom the consolidation.Cash EquivalentsCash equivalents are short-term investments that are readily convertible intocash and are exposed to insignificant risk of changes in value. Cash equiva-lents include time deposits, certificates of deposit, commercial paper andmutual funds investing in bonds that represent short-term investments, all ofwhich mature or become due within three months of the date of acquisition.
Marketable and Investments SecuritiesEffective April 1, 2000, the Companies adopted a new accounting standard for financial instruments, including marketable and investmentsecurities.
The standard requires all applicable securities to be classified andaccounted for, depending on management’s intent, as follows:
i) trading securities, which are held for the purpose of earning capitalgains in the near term, are reported at fair value, and the related unrealizedgains and losses are included in earnings, ii) held-to-maturity debt securities, which are expected to be held to maturity with the positiveintent and ability to hold to maturity, are reported at amortized cost, andiii) available-for-sale securities, which are securities not classified as either ofthe aforementioned securities, are reported at fair value, with unrealizedgains and losses, net of applicable taxes, reported as a separate componentof shareholders’ equity.
The cost of securities sold is determined based on the moving-averagemethod. Non-marketable available-for-sale securities are stated at costdetermined by the moving-average method. For other than temporarydeclines in fair value, non-marketable available-for-sale securities arereduced to net realizable value by a charge to income.InventoriesAll inventories are stated at the lower of cost or market. The average costmethod is used to determine cost for the majority of inventories.Property, Plant and EquipmentProperty, plant and equipment are stated at cost. Depreciation of property,plant and equipment of the Company and its domestic subsidiaries is computed substantially by the declining-balance method while the straight-line method is applied to buildings acquired by the domestic companiesafter April 1, 1998, and is principally applied to the property, plant andequipment of foreign subsidiaries. The range of useful lives is from 15 to 50years for buildings, from 4 to 15 years for machinery and equipment.
T A K E D A A N N U A L R E P O R T 2 0 0 3 F I N A N C I A L S E C T I O N T A K E D A A N N U A L R E P O R T 2 0 0 3p.40
GoodwillThe excess of the purchase price over the fair value of the net assets(“goodwill”) of an acquired subsidiary is amortized using the straight-linemethod over five years. Goodwill amounts at March 31, 2003 were ¥6,272million ($52,273 thousand), net of amortization of ¥1,568 million($13,068 thousand).Reserve for Retirement BenefitsEmployees of the Companies terminating their employment either voluntarily or upon reaching the mandatory retirement age are entitled toseverance payments based on the rate of pay at the time of termination,length of service and certain other factors.
Previously, the Company accounted for retirement benefits based onthe present value of projected future retirement benefits attributable toemployee services rendered by the fiscal year end, less amounts fundedunder a contributory pension plan.
Effective April 1, 2000, the Company and domestic subsidiariesadopted a new accounting standard for employees’ retirement benefits andaccounted for the liability for retirement benefits based on projected benefit obligations and plan assets at the balance sheet data. The entiretransitional obligation of ¥5,048 million, determined as of April 1, 2000,was charged to income. As a result, net periodic benefit costs, as comparedwith the prior method, increased and income before income taxes andminority interests decreased by ¥4,178 million.
Actuarial gains or losses are amortized primarily by the straight-linemethod over a period within the average remaining years of service of theemployees (generally five years). Effective April 1, 2002, the Companyadopted a method of amortization over the period starting in the year inwhich the actuarial gains or losses were incurred. Previously, amortizationof actuarial gains and losses started in the year after the year in whichincurred. The effect of this change was to increase retirement benefitexpenses for the fiscal year ended March 2003 by ¥6,191 million and decrease income before income taxes and minority interests by anequivalent amount, compared to amounts that would have resulted if theprevious method had been applied.
Retirement allowances for directors and corporate auditors arerecorded to state the liability at the amount that would be required if alldirectors and corporate auditors retired at each balance sheet date. Theseamounts are paid subject to approval of the shareholders in accordancewith the Japanese Commercial Code.Stock and Bond Issue CostsStock and bond issue costs are charged to income as incurred.Foreign Currency TransactionsThe Companies have adopted “Accounting Standards for Foreign CurrencyTransactions”. All short-term and long-term monetary receivables andpayables denominated in foreign currencies are translated into Japaneseyen at the current exchange rates at the balance sheet date.
Revenue and expense items denominated in foreign currencies aretranslated using the rate on the date of the transaction. Related exchangegains or losses are credited or charged to income as incurred.Foreign Currency Financial StatementsThe financial statements of overseas subsidiaries and affiliates are translatedinto Japanese yen by the following methods as set forth by an accountingstandard for foreign currency translation.
The balance sheet accounts of overseas subsidiaries and affiliates aretranslated into Japanese yen at the current exchange rates as of the balancesheet date except inter-company accounts and shareholders’ equity, whichare translated at historical rates. Revenue and expense accounts of overseassubsidiaries and affiliates are translated into Japanese yen at the averageexchange rate for the year.
Differences arising from such translation are shown as “Foreign currency translation adjustment” as a separate component of shareholders’equity.Income TaxesCurrent income taxes are provided for based on amounts currently payablefor each year. Deferred income taxes arising from temporary differences in the recognition of assets and liabilities for tax and financial reporting purposes are reflected in the consolidated financial statements. A deferredtax liability is recognized on undistributed earnings of overseas subsidiariesand affiliates, which are not deemed to be permanently invested.Derivative Financial InstrumentsThe Companies use derivative financial instruments to manage their exposure to fluctuations in foreign exchange and interest rates. Foreignexchange forward contracts, currency options, interest rate swaps, interestrate options, interest rate futures and treasury futures are utilized by the Companies to reduce foreign currency exchange and interest rate risks. The Companies do not enter into derivatives for trading or speculative purposes.
The Companies have adopted “Accounting Standard for FinancialInstruments” and “Accounting Standards for Foreign CurrencyTransactions”. These standards require that: a) all derivatives be recog-nized as either assets or liabilities and measured at fair value, with gains or losses on these derivative transactions being recognized in the statementof income and b) for derivatives used for hedging purposes, if such deriva-tives qualify for hedge accounting due to high correlation and effectivenessbetween the hedging instruments and the hedged items, gains or losses onthese derivative transactions are deferred until maturity.
Foreign exchange forward contracts employed to hedge foreignexchange exposures related to export sales are measured at fair value andthe related unrealized gains/ losses are recognized in income.
Certain accounts denominated in foreign currencies for which foreignexchange forward contracts are used to hedge the foreign currency fluctua-tions are translated at the contracted rate if the forward contracts qualifyfor hedge accounting.
Certain accounts denominated in foreign currencies for which currencyoptions are used to hedge the foreign currency fluctuations are measured atfair value and the related unrealized gains/losses are deferred until maturity.
Interest rate swaps, interest rate options, interest rate futures, and treasury futures employed to hedge interest rate fluctuations are measuredat fair value and the related unrealized gains/losses are recognized in income.
Interest rate swaps that qualify for hedge accounting and meet specificmatching criteria are not remeasured at market value but the differentialpaid or received under the swap agreements is recognized and included ininterest expense or income.

p.41T A K E D A A N N U A L R E P O R T 2 0 0 3 F I N A N C I A L S E C T I O N T A K E D A A N N U A L R E P O R T 2 0 0 3
Appropriations of Retained EarningsAppropriations of retained earnings at each year end are reflected in thefinancial statements for the following year upon shareholders’ approval.Cash DividendsCash dividends charged to retained earnings are those actually paid duringthe year and consist of year-end dividends for the preceding year andinterim dividends for the current year.
ReclassificationsIn preparing the accompanying consolidated financial statements, certainreclassifications have been made to the consolidated financial statementsfor the year ended March 31, 2003 issued domestically. In addition, the consolidated financial statements for 2002 and 2001 have been reclassified to conform to the 2003 presentation.
Note 3: Marketable and Investment SecuritiesThe costs and aggregate fair values of marketable and investment securities at March 31, 2003 and 2002 were as follows:
Significant available-for-sale securities whose fair value is not readily determinable as of March 31, 2003 and 2002 were as follows:
Proceeds from sales of available-for-sale securities for the year endedMarch 31, 2003 and 2002 were ¥6,874 million ($57,283 thousand) and¥89,657 million, respectively. Gross realized gains and losses on thesesales, computed on the moving average cost basis, were ¥12 million ($100thousand) and ¥271 million ($2,258 million), respectively for the year
ended March 31, 2003 and ¥83 million and ¥175 million, respectively forthe year ended March 31, 2002.
The carrying amounts of debt securities by contractual maturity atMarch 31, 2003 are as follows:
Millions of yen2003 Cost Unrealized gain Unrealized loss Fair value
Securities classified as:Trading ¥054,608 ¥000,797 ¥377 ¥055,028Available-for-sale:
Equity securities 35,246 119,077 788 153,535Debt securities 106,776 422 179 107,019
Held-to-maturity 13,049 15 3 13,061
Millions of yen2002 Cost Unrealized gain Unrealized loss Fair value
Securities classified as:Trading ¥053,405 ¥000,079 ¥195 ¥053,289Available-for-sale:
Equity securities 38,423 190,850 346 228,927Debt securities 173,298 782 611 173,469
Held-to-maturity 37,514 23 19 37,518
Thousands of U.S. dollars2003 Cost Unrealized gain Unrealized loss Fair value
Securities classified as:Trading $455,067 $006,642 $3,142 $0,458,567Available-for-sale:
Equity securities 293,717 992,308 6,567 1,279,458Debt securities 889,800 3,517 1,492 891,825
Held-to-maturity 108,742 125 25 108,842
Thousands ofMillions of yen U.S. dollars
2003 2003
Due in one year or less ¥063,306 $527,550Due after one year through five years 55,020 458,500Due after five years 1,504 12,533
Total ¥119,830 $998,583
CostThousands of
Millions of yen U.S. dollars2003 2002 2003
Equity securities ¥6,949 ¥7,211 $57,908

T A K E D A A N N U A L R E P O R T 2 0 0 3 F I N A N C I A L S E C T I O N T A K E D A A N N U A L R E P O R T 2 0 0 3p.42
Investments in and advances to affiliates at March 31, 2003 and 2002 consisted of the following:Thousands of
Millions of yen U.S. dollars2003 2002 2003
Investments at cost ¥37,335 ¥31,009 $311,130Equity in undistributed earnings 37,374 45,083 311,446
Total 74,709 76,092 622,576Advances 1,440 1,440 12,000
Total ¥76,149 ¥77,532 $634,576
Financial information with respect to affiliates, recorded based on theequity method at March 31, 2003 and 2002 and for each of the three years
in the period ended March 31, 2003, is summarized as follows:
Thousands ofMillions of yen U.S. dollars
2003 2002 2003
Current assets ¥287,642 ¥306,693 $2,397,018Other assets 196,673 155,687 1,638,941
Total 484,315 462,380 4,035,959Current liabilities 226,991 219,283 1,891,595Other liabilities 63,949 53,022 532,905
Net assets ¥193,375 ¥190,075 $1,611,459
Thousands ofMillions of yen U.S. dollars
2003 2002 2001 2003
Net sales ¥791,317 ¥726,032 ¥550,488 $6,594,311Net income 178,996 150,588 43,595 1,491,640
Sales to and purchases from affiliates were as follows:Thousands of
Millions of yen U.S. dollars2003 2002 2001 2003
Sales ¥117,986 ¥125,152 ¥116,610 $983,217Purchases 72,944 78,864 73,961 607,867
Note 4: InventoriesInventories at March 31, 2003 and 2002 consisted of the following:
Note 5: Bank Loans and Long-term DebtBank loans consisted of short-term bank loans represented by notes, generally due within one year. The Companies obtain financing by discounting notes and export drafts with banks. Such discounted notesand drafts and the related contingent liabilities are not included in the
consolidated balance sheets but are disclosed as contingent liabilities (see Note 15).
The weighted average annual interest rates of short-term bank loans atMarch 31, 2003 and 2002 were 1.6% and 1.9%, respectively.
Long-term debt at March 31, 2003 and 2002 consisted of the following:
Thousands ofMillions of yen U.S. dollars
2003 2002 2003
Finished products and merchandise ¥38,949 ¥41,536 $324,581Work-in-process 32,602 36,194 271,686Raw materials 17,934 18,364 149,444
Total ¥89,485 ¥96,094 $745,711
Thousands ofMillions of yen U.S. dollars
2003 2002 2003
Unsecured loans from banks and financial institutionsDue 2004 to 2031, weighted-average rate 3.8% ¥1,740 ¥1,866 $14,500
Secured bonds issued by subsidiariesDue 2004 to 2006, weighted-average rate 1.0% 300 800 2,500
Secured loans from banks and financial institutionsDue 2004 to 2007, weighted-average rate 2.6% 3,790 4,390 31,591
Total 5,830 7,056 48,591Less current portion 964 1,564 8,038
Long-term debt, less current portion ¥4,866 ¥5,492 $40,553

p.43T A K E D A A N N U A L R E P O R T 2 0 0 3 F I N A N C I A L S E C T I O N T A K E D A A N N U A L R E P O R T 2 0 0 3
The annual maturities of long-term debt as of March 31, 2003 were as follows:
At March 31, 2003, assets pledged as collateral for long-term debt were as follows:
The components of net periodic benefit costs were as follows:
Assumptions used for the year ended March 31, 2003 and 2002 were set forth as follows:
As is customary in Japan, security must be given if requested by a lendingbank. Banks have the right to offset cash deposited with them against anydebt or obligation that becomes due or, in case of default and certain other
specified events, against all other debt payable to the banks. None of thelenders has ever exercised this right against the Companies’ obligations.
Retirement allowances for directors and corporate auditors are included inReserve for retirement benefits in the consolidated balance sheets. The
amount was ¥1,981 million ($16,511 thousand) and ¥1,923 million atMarch 31, 2003 and 2002, respectively.
Note 6: Retirement BenefitsThe Company has a contributory trusted pension plan that is interrelatedwith the Japanese government social welfare program which consists of abasic portion requiring employee and employer contributions, plus anadditional portion established by the Company. The Company and certainsubsidiaries also have non-contributory trusted pension plans that fund a
portion of the above retirement benefits. Certain other subsidiaries haveunfunded retirement benefit plans.
Reserve for employees’ retirement benefits at March 31, 2003 and 2002consisted of the following:
Thousands ofYear ending March 31 Millions of yen U.S. dollars
2004 ¥0,964 $08,0382005 716 5,9672006 3,164 26,3672007 714 5,9502008 28 2332009 and thereafter 244 2,036
Total ¥5,830 $48,591
Thousands ofMillions of yen U.S. dollars
Property, plant and equipment, net of accumulated depreciation ¥17,541 $146,175
Thousands ofMillions of yen U.S. dollars
2003 2002 2003
Projected benefit obligation ¥296,321 ¥284,248 $2,469,349Fair value of plan assets (190,249) (197,940) (1,585,408)Unrecognized actuarial loss (53,006) (30,773) (441,722)Unrecognized prior service cost 601 730 5,009Reserve for employees’ retirement benefits ¥053,667 ¥056,265 $0,447,228
Thousands ofMillions of yen U.S. dollars
2003 2002 2003
Service cost ¥09,651 ¥12,807 $080,432Interest cost 7,054 6,940 58,786Expected return on plan assets (4,876) (4,479) (40,636)Amortization of actuarial loss 14,131 5,039 117,756Amortization of prior service cost (129) 82 (1,080)Net periodic benefit costs ¥25,831 ¥20,389 $215,258
2003 2002
Discount rate 1.0%–3.0% 2.0%–3.0%Expected rate of return on plan assets 0.3%–2.5% 1.0%–3.5%Recognition period of prior service cost 5 years 5 yearsRecognition period of actuarial gain/ loss 5 years 5 years
Note 7: Reserve for SMON CompensationThe Company was a co-defendant with the Japanese government andother pharmaceutical companies in legal actions in Japan. The plaintiffsclaimed that a certain medicine, a product of one of the co-defendants,which was distributed by the Company, was a cause of SMON (Sub-acuteMyelo Optical Neurophathy), a neurological disease affecting the plaintiffs.
Compromise settlements have been made with all the plaintiffs throughDecember 25, 1996.
The Company has made a provision in the accompanying consolidatedfinancial statements for estimated future medical treatment payments overthe remaining lives of the parties entitled under the compromise settlements.

T A K E D A A N N U A L R E P O R T 2 0 0 3 F I N A N C I A L S E C T I O N T A K E D A A N N U A L R E P O R T 2 0 0 3p.44
Note 8: Shareholders’ EquityJapanese companies are subject to the Japanese Commercial Code (the “Code”) to which certain amendments became effective from October 1, 2001.
Prior to October 1, 2001, the Code required at least 50% of the issue price of new shares, with a minimum of the par value thereof, to bedesignated as stated capital as determined by resolution of the Board ofDirectors. Proceeds in excess of amounts designated as stated capital werecredited to additional paid-in capital. Effective October 1, 2001, the Codewas revised and common stock par values were eliminated resulting in allshares being recorded with no par value.
Prior to October 1, 2001, the Code also provided that an amount atleast equal to 10% of the aggregate amount of cash dividends and certainother cash payments which are made as an appropriation of retained earnings applicable to each fiscal period shall be appropriated and setaside as a legal reserve until such reserve equaled 25% of stated capital.Effective October 1, 2001, the revised Code allows for such appropriationsto be set aside as a legal reserve until the total additional paid-in capitaland legal reserve equals 25% of stated capital. The amount of total additional paid-in capital and legal reserve which exceeds 25% of statedcapital can be transferred to retained earnings by resolution of the shareholders, which may be available for dividends. The Company’s additional paid-in capital was presented as capital surplus and legalreserve, which was included in retained earnings, amounted ¥15,885 million ($132,377 thousand) at March 31, 2003 and 2002.
Note 9: Research and Development CostsResearch and development costs are charged to income as incurred.Research and development costs for the years ended March 31, 2003,
2002 and 2001 were ¥124,230 million ($1,035,253 thousand), ¥100,278million and ¥89,846 million, respectively.
Note 11: Income TaxesThe effective income tax rates of the Companies differed from the statutory tax rates for the following reasons:
Note 10: Sales of BusinessesThe Company sold its animal health business in June 2000 and its bulkvitamin business in January 2001, resulting in a total gain of ¥3,861 million for the year ended March 31, 2001.
The Company sold its urethane and other chemical products businessin April 2001, resulting in a gain of ¥26,436 million for the year endedMarch 31, 2002.
The Companies sold their food business in April 2002, agriculturalchemicals business in November 2002 and shares of ShimizuPharmaceutical Co., Ltd. in December 2002, resulting in a gain of ¥29,974million ($249,789 thousand) for the year ended March 31, 2003.
2003 2002 2001
Statutory tax rate 42.1% 42.1% 42.1%Expenses not deductible for tax purposes 0.9 1.1 1.7Loss in subsidiaries 0.3 0.4 1.5Equity in earnings of affiliates (7.2) (6.9) (3.1)Non-taxable dividend income 0.0 (0.1) (0.2)Tax credits primarily for research and development costs (0.2) (0.1) —Adjustment of deferred tax assets and liabilities at end of period due to change in tax rates (0.3) — —Other—net 0.9 (0.4) 1.4Effective tax rate 36.5% 36.1% 43.4%
The Code permits companies to transfer a portion of additional paid-incapital and legal reserve to stated capital by resolution of the Board of Directors. The Code also permits companies to transfer a portion ofunappropriated retained earnings, available for dividends, to stated capitalby resolution of the shareholders.
The revised Code eliminated restrictions on the repurchase and use oftreasury stock allowing Japanese companies to repurchase treasury stock bya resolution of the shareholders at the general shareholders meeting and dispose of such treasury stock by resolution of the Board of Directors beginning April 1, 2002. The repurchased amount of treasury stock cannotexceed the amount available for future dividend plus amount of commonstock, additional paid-in capital or legal reserve to be reduced in the casewhere such reduction was resolved at the general shareholders meeting.
Under the Code, the amount legally available for dividends is based onretained earnings as recorded in the Company’s book. At March 31, 2003,retained earnings available for future dividends amounted to ¥1,018,183million ($8,484,863 thousand) subject to legal reserve requirements.
Effective April 1, 2002, the Company adopted a new accounting standard, “Accounting Standards for Treasury Stock and the Withdrawal of Legal Reserve” issued by the Accounting Standards Board of Japan.Under the new standard, the stock of the Company, which is held by its subsidiaries and affiliated companies, is stated as treasury stock accordingto the percentage of ownership.
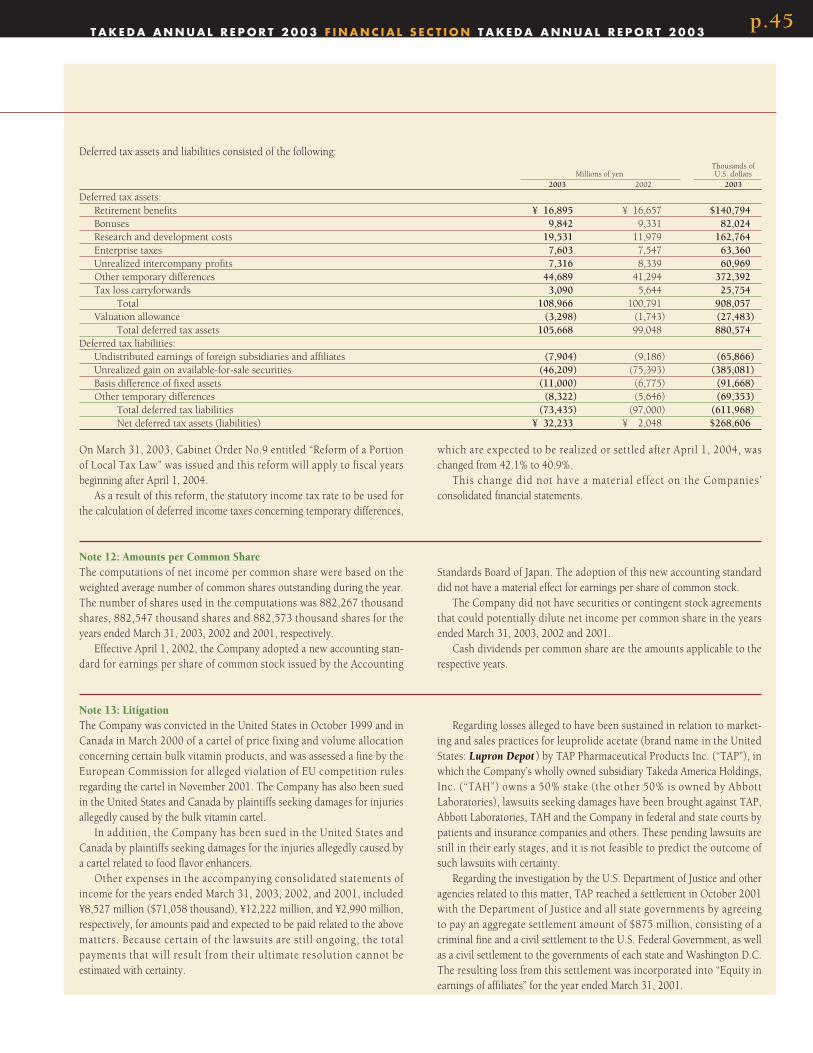
p.45T A K E D A A N N U A L R E P O R T 2 0 0 3 F I N A N C I A L S E C T I O N T A K E D A A N N U A L R E P O R T 2 0 0 3
Note 12: Amounts per Common ShareThe computations of net income per common share were based on theweighted average number of common shares outstanding during the year.The number of shares used in the computations was 882,267 thousandshares, 882,547 thousand shares and 882,573 thousand shares for theyears ended March 31, 2003, 2002 and 2001, respectively.
Effective April 1, 2002, the Company adopted a new accounting stan-dard for earnings per share of common stock issued by the Accounting
Standards Board of Japan. The adoption of this new accounting standarddid not have a material effect for earnings per share of common stock.
The Company did not have securities or contingent stock agreementsthat could potentially dilute net income per common share in the yearsended March 31, 2003, 2002 and 2001.
Cash dividends per common share are the amounts applicable to therespective years.
Deferred tax assets and liabilities consisted of the following:Thousands of
Millions of yen U.S. dollars2003 2002 2003
Deferred tax assets:Retirement benefits ¥016,895 ¥016,657 $140,794Bonuses 9,842 9,331 82,024Research and development costs 19,531 11,979 162,764Enterprise taxes 7,603 7,547 63,360Unrealized intercompany profits 7,316 8,339 60,969Other temporary differences 44,689 41,294 372,392Tax loss carryforwards 3,090 5,644 25,754
Total 108,966 100,791 908,057Valuation allowance (3,298) (1,743) (27,483)
Total deferred tax assets 105,668 99,048 880,574Deferred tax liabilities:
Undistributed earnings of foreign subsidiaries and affiliates (7,904) (9,186) (65,866)Unrealized gain on available-for-sale securities (46,209) (75,393) (385,081)Basis difference of fixed assets (11,000) (6,775) (91,668)Other temporary differences (8,322) (5,646) (69,353)
Total deferred tax liabilities (73,435) (97,000) (611,968)Net deferred tax assets (liabilities) ¥032,233 ¥002,048 $268,606
Note 13: LitigationThe Company was convicted in the United States in October 1999 and inCanada in March 2000 of a cartel of price fixing and volume allocationconcerning certain bulk vitamin products, and was assessed a fine by theEuropean Commission for alleged violation of EU competition rulesregarding the cartel in November 2001. The Company has also been suedin the United States and Canada by plaintiffs seeking damages for injuriesallegedly caused by the bulk vitamin cartel.
In addition, the Company has been sued in the United States andCanada by plaintiffs seeking damages for the injuries allegedly caused by a cartel related to food flavor enhancers.
Other expenses in the accompanying consolidated statements ofincome for the years ended March 31, 2003, 2002, and 2001, included¥8,527 million ($71,058 thousand), ¥12,222 million, and ¥2,990 million,respectively, for amounts paid and expected to be paid related to the abovematters. Because certain of the lawsuits are still ongoing, the total payments that will result from their ultimate resolution cannot be estimated with certainty.
Regarding losses alleged to have been sustained in relation to market-ing and sales practices for leuprolide acetate (brand name in the UnitedStates: Lupron Depot ) by TAP Pharmaceutical Products Inc. (“TAP”), inwhich the Company’s wholly owned subsidiary Takeda America Holdings, Inc. (“TAH”) owns a 50% stake (the other 50% is owned by AbbottLaboratories), lawsuits seeking damages have been brought against TAP,Abbott Laboratories, TAH and the Company in federal and state courts bypatients and insurance companies and others. These pending lawsuits arestill in their early stages, and it is not feasible to predict the outcome ofsuch lawsuits with certainty.
Regarding the investigation by the U.S. Department of Justice and otheragencies related to this matter, TAP reached a settlement in October 2001with the Department of Justice and all state governments by agreeing to pay an aggregate settlement amount of $875 million, consisting of acriminal fine and a civil settlement to the U.S. Federal Government, as wellas a civil settlement to the governments of each state and Washington D.C.The resulting loss from this settlement was incorporated into “Equity inearnings of affiliates” for the year ended March 31, 2001.
On March 31, 2003, Cabinet Order No.9 entitled “Reform of a Portion of Local Tax Law” was issued and this reform will apply to fiscal yearsbeginning after April 1, 2004.
As a result of this reform, the statutory income tax rate to be used forthe calculation of deferred income taxes concerning temporary differences,
which are expected to be realized or settled after April 1, 2004, waschanged from 42.1% to 40.9%.
This change did not have a material effect on the Companies’ consolidated financial statements.

T A K E D A A N N U A L R E P O R T 2 0 0 3 F I N A N C I A L S E C T I O N T A K E D A A N N U A L R E P O R T 2 0 0 3p.46
Note 14: Segment InformationThe Companies’ operations are classified into four business segments:pharmaceuticals, bulk vitamin and food, chemical products, and other.The pharmaceuticals segment is composed of those operations involved inthe production and sale of ethical and over-the-counter pharmaceuticalsand reagents. The bulk vitamin and food segment consists of operationsprincipally involved in the production and sale of vitamins, beverages and food additives. The chemical products segment is involved in the production and sale of inorganic industrial chemicals, photographic film
chemicals, activated carbon and wood preservatives. The other segmentmainly consists of agro products, real estate management and warehousingoperations. The agro products operations include the production and saleof agricultural chemicals such as insecticides, herbicides and fungicides,and animal health products such as veterinary medicines for pets.Summarized financial information by business segment for the years endedMarch 31, 2003, 2002 and 2001 is as follows:
segments include other income and expense items such as interest anddividend income, interest expense, and equity in earnings of affiliates.
There were no significant inter-segment sales. General corporate adminis-trative expenses are generally allocated among the segments in proportionto their operating expenses. Income and expenses not allocated to business
Millions of yenNet sales
2003 2002 2001
Pharmaceuticals ¥0,928,297 ¥0,843,339 ¥727,810Bulk vitamin and food 45,807 67,064 69,613Chemical products 49,591 50,538 116,423Other 22,386 44,119 49,634
Consolidated ¥1,046,081 ¥1,005,060 ¥963,480
Millions of yenOperating income
2003 2002 2001
Pharmaceuticals ¥306,495 ¥272,212 ¥220,398Bulk vitamin and food (1,201) 158 (5,101)Chemical products 2,902 4,051 6,065Other 2,615 4,755 4,669Eliminations (125) 67 71
Consolidated ¥310,686 ¥281,243 ¥226,102
Thousands of U.S. dollarsNet sales Operating income
2003 2003
Pharmaceuticals $7,735,810 $2,554,125Bulk vitamin and food 381,725 (10,010)Chemical products 413,260 24,190Other 186,552 21,795Eliminations — (1,048)
Consolidated $8,717,347 $2,589,052
Millions of yenIdentifiable assets Depreciation and amortization
2003 2002 2003 2002
Pharmaceuticals ¥0,654,759 ¥0,595,687 ¥25,604 ¥21,602Bulk vitamin and food 32,674 53,102 732 1,324Chemical products 92,119 88,057 1,520 2,684Other 46,635 82,544 2,106 2,820
826,187 819,390 29,962 28,430Corporate 1,233,182 1,145,826 — —
Consolidated ¥2,059,369 ¥1,965,216 ¥29,962 ¥28,430
Millions of yenCapital investment
2003 2002
Pharmaceuticals ¥28,238 ¥30,359Bulk vitamin and food 2,038 1,801Chemical products 4,040 9,441Other 1,572 3,165
35,888 44,766Corporate — —
Consolidated ¥35,888 ¥44,766

p.47T A K E D A A N N U A L R E P O R T 2 0 0 3 F I N A N C I A L S E C T I O N T A K E D A A N N U A L R E P O R T 2 0 0 3
Thousands of U.S. dollarsIdentifiable assets Depreciation and amortization Capital investment
2003 2003 2003
Pharmaceuticals $05,456,328 $213,373 $235,318Bulk vitamin and food 272,291 6,100 16,990Chemical products 767,660 12,670 33,672Other 388,620 17,548 13,091
6,884,899 249,691 299,071Corporate 10,276,510 — —
Consolidated $17,161,409 $249,691 $299,071
Corporate assets are principally cash and cash equivalents, marketablesecurities and investment securities. From the year ended March 31, 2002,the business classification of surplus operating capital and long-terminvestments of the U.S. holding company has been changed from
Geographic data for net sales to customers outside Japan are as follows:
“Pharmaceutical” to “Corporate”. As a result of this change, identifiableassets of “Corporate” on March 31, 2002 increased ¥266,764 million.
Geographic segment data are as follows:
Millions of yenNet sales Operating income Identifiable assets
2003 2003 2003
Domestic ¥0,821,631 ¥285,080 ¥0,650,442Overseas 224,450 22,152 197,316Eliminations/Corporate — 3,454 1,211,611
Consolidated ¥1,046,081 ¥310,686 ¥2,059,369
Thousands of U.S. dollarsNet sales Operating income Identifiable assets
2003 2003 2003
Domestic $6,846,931 $2,375,671 $05,420,355Overseas 1,870,416 184,601 1,644,302Eliminations/Corporate — 28,780 10,096,752
Consolidated $8,717,347 $2,589,052 $17,161,409
Thousands ofMillions of yen U.S. dollars
Net sales to Net sales tocustomers customers
outside Japan outside Japan2003 2002 2001 2003
North America ¥262,246 ¥231,794 ¥174,756 $2,185,391Europe 129,781 97,215 71,187 1,081,514Other 17,809 19,705 34,214 148,403
Total ¥409,836 ¥348,714 ¥280,157 $3,415,308
Percentage of consolidated net sales2003 2002 2001
North America 25.1% 23.1% 18.1%Europe 12.4 9.7 7.4Other 1.7 2.0 3.6
Total 39.2% 34.7% 29.1%
Note 15: Commitments and ContingenciesCommitments outstanding at March 31, 2003 for the purchase of property, plant and equipment amounted to approximately ¥29,780 million ($248,173 thousand).
At March 31, 2003, contingent liabilities were as follows:
Note 16: Subsequent EventOn June 27, 2003, the shareholders of the Company approved payment ofa year-end cash dividend of ¥33.00 ($0.28) per share to holders of record at March 31, 2003, totaling ¥29,330 million ($244,417 thousand)
and bonuses to directors and corporate auditors of ¥262 million ($2,183 thousand).
Thousands ofMillions of yen U. S. dollars
Loans guaranteed ¥7,622 $63,523Notes and export drafts discounted 356 2,974

TAKEDA ANNUAL REPORT 2003 INDEPENDENT AUDITORS’ REPORT TAKEDA ANNUAL REPORT 2003p.48
I N D E P E N D E N T A U D I T O R S ’ R E P O R T
Tohmatsu & Co.
Osaka Kokusai Building3-13 Azuchimachi 2-chome,Chuo-ku, Osaka, 541-0052, JapanTel: +81-6-6261-1381Fax: +81-6-6261-1238www.tohmatsu.co.jp
To the Board of Directors of Takeda Chemical Industries, Ltd.:
We have audited the accompanying consolidated balance sheets of Takeda Chemical Industries, Ltd. and
subsidiaries as of March 31, 2003 and 2002, and the related consolidated statements of income,
shareholders’ equity, and cash flows for each of the three years in the period ended March 31, 2003, all
expressed in Japanese yen. These consolidated financial statements are the responsibility of the Company’s
management. Our responsibility is to express an opinion on these consolidated financial statements based
on our audits.
We conducted our audits in accordance with auditing standards, procedures and practices generally
accepted and applied in Japan. Those standards require that we plan and perform the audit to obtain
reasonable assurance about whether the financial statements are free of material misstatement. An audit
includes examining, on a test basis, evidence supporting the amounts and disclosures in the financial
statements. An audit also includes assessing the accounting principles used and significant estimates made
by management, as well as evaluating the overall financial statement presentation. We believe that our
audits provide a reasonable basis for our opinion.
In our opinion, the consolidated financial statements referred to above present fairly, in all material respects,
the consolidated financial position of Takeda Chemical Industries, Ltd. and subsidiaries as of March 31,
2003 and 2002, and the consolidated results of their operations and their cash flows for each of the three
years in the period ended March 31, 2003, in conformity with accounting principles and practices generally
accepted in Japan.
Our audits also comprehended the translation of Japanese yen amounts into U.S. dollar amounts and, in our
opinion, such translation has been made in conformity with the basis stated in Note 1. Such U.S. dollar
amounts are presented solely for the convenience of readers outside Japan.
June 27, 2003

p.49T A K E D A A N N U A L R E P O R T 2 0 0 3 BOARD OF DIRECTORS, ETC. T A K E D A A N N U A L R E P O R T 2 0 0 3
B O A R D O F D I R E C T O R S ,A U D I T O R S A N D C O R P O R A T E O F F I C E R S
Chairman of the Board andChief Executive OfficerKunio Takeda
President and Chief Operating OfficerYasuchika Hasegawa
Executive Vice PresidentShozo NakamuraGeneral ManagerPharmaceutical Production Division
Managing DirectorHiroshi Akimoto, Ph.D.General ManagerIntellectual Property Department
DirectorsMakoto YamaokaGeneral ManagerPharmaceutical Marketing Division
Kiyoshi Kitazawa, Ph.D.General ManagerPharmaceutical DevelopmentDivision
Takashi Soda, Ph.D.General ManagerPharmaceutical Research Division
Hiroshi ShinhaGeneral Manager Legal Department
Toyoji YoshidaGeneral ManagerCorporate CommunicationsDepartment
Full-time Corporate Auditors
Kunio UeshimaYuzuru Takagi
Corporate Auditors
Kiyoshi TauraNaoaki Yoshii
Corporate Officers
Kouichi TsujiGeneral ManagerHuman Resources Department
Hiroshi TakaharaGeneral ManagerFinance & Accounting Department
Katsumi NozawaDeputy General ManagerPharmaceutical Marketing Division
Yoshiro SakataniGeneral ManagerTokyo BranchPharmaceutical Marketing Division
Mutsuho HondaGeneral ManagerOsaka BranchPharmaceutical Marketing Division
Saburo HamanakaGeneral ManagerDivision of Americas
Takashi KandaPresidentConsumer Healthcare Company

Takeda Chemical Industries, Ltd.
Pharmaceuticals
Japan U.S.A. Europe
Wako Pure Chemical Industries, Ltd.1-2, Doshomachi 3-chomeChuo-ku, Osaka 541-0045, JapanTel: +81-6-6203-3741Fax: +81-6-6203-2029Equity Ownership: 68.93%
Nihon Pharmaceutical Co., Ltd.9-8, Higashikanda 1-chomeChiyoda-ku, Tokyo 101-0031, JapanTel: +81-3-3864-8411Fax: +81-3-3864-8837Equity Ownership: 86.49%
Takeda Healthcare Products Co., Ltd.2-21, Osadano-choFukuchiyama-shi Kyoto 620-0853, JapanTel: +81-773-27-5421Fax: +81-773-27-5489Equity Ownership: 100%
Wyeth Lederle Japan, Ltd.Hattori Building10-3, Kyobashi 1-chomeChuo-ku, Tokyo 104-0031, JapanTel: +81-3-3561-8781Fax: +81-3-3561-0267Equity Ownership: 40%
Amato Pharmaceutical Products, Ltd.995 Saso-choFukuchiyama-shi, Kyoto 620-0932, JapanTel: +81-773-22-1100Fax: +81-773-23-3355Equity Ownership: 30%
Takeda America Holdings, Inc.555 Madison AvenueNew York, NY 10022, U.S.A.Tel: +1-212-421-6950Fax: +1-212-355-5243Equity Ownership: 100%
Takeda Research Investment, Inc.435 Tasso Street, Suite 300Palo Alto, CA 94301, U.S.A.Tel: +1-650-328-2900Fax: +1-650-328-2922Equity Ownership: 100%*
Takeda PharmaceuticalsNorth America, Inc. 475 Half Day Road, Suite 500Lincolnshire, IL 60069, U.S.A.Tel: +1-847-383-3000Fax: +1-847-383-3050Equity Ownership: 100%*
TAP Pharmaceutical Products Inc.675 North Field Drive Lake Forest, IL 60045, U.S.A.Tel: +1-847-582-2000Fax: +1-847-582-5797Equity Ownership: 50%*
Takeda Europe Holdings Ltd.14 Waterloo Place, St. JamesLondon SW1Y 4AR United KingdomTel: +44-20-7389-9434Fax: +44-20-7389-9437Equity Ownership: 100%
Takeda Europe Research & Development Centre Ltd.Savannah House 11-12 Charles II StreetLondon SW1Y 4QUUnited KingdomTel: +44-20-7484-9000Fax: +44-20-7484-9062Equity Ownership: 100%**
Laboratoires Takeda15 Quai de Dion Bouton92816 Puteau Cedex, FranceTel: +33-1-4625-1616Fax: +33-1-4697-0011Equity Ownership: 100%**
Takeda UK LimitedTakeda House, The Mercury CentreWycombe Lane, Wooburn GreenHigh Wycombe, BuckinghamshireHP10 OHH, United KingdomTel: +44-1628-537-900Fax: +44-1628-526-615Equity Ownership: 100%**
Takeda Italia Farmaceutici S.p.A.Via Elio Vittorini, 12900144 Rome, ItalyTel: +39-06-502601Fax: +39-06-5011709Equity Ownership: 76.92%**
Takeda Pharma GmbHViktoriaallee 3-552066 Aachen, GermanyTel: +49-241-941-0Fax: +49-241-941-1120Equity Ownership: 100%**
Takeda Pharma Ges.m.b.HSeidengasse 33-35A-1070, Vienna, AustriaTel: +43-1-524-40-64Fax: +43-1-524-40-66Equity Ownership: 100%***
Takeda Pharma AGAlpenblickstrasse 26CH-8853 Lachen, SwitzerlandTel: +41-55-451-5200Fax: +41-55-451-5220Equity Ownership: 100%***
Takeda Ireland LimitedBray Business Park, Kilruddery, Co. Wicklow, IrelandTel: +353-1-205-0600Fax: +353-1-205-0601Equity Ownership: 100%
Takeda Pharma Ireland Limited Bray Business Park, Kilruddery, Co. Wicklow, Ireland Tel: +353-1-205-0800 Fax: +353-1-205-0801 Equity Ownership: 100%
TAKEDA ANNUAL REPORT 2003 MAIN SUBSIDIARIES AND AFFILIATES TAKEDA ANNUAL REPORT 2003p.50

Asia
Bulk Vitamin & Food Chemical Products Other
Tianjin Takeda Pharmaceuticals Co., Ltd.No.11 Xinghua RoadTianjin Xiqing Economic Development AreaTianjin, ChinaTel: +86-22-2397-0011Fax: +86-22-2397-2230Equity Ownership: 75%
Takeda Chemical Industries (Taiwan), Ltd.7th Floor, Great China Bldg.No. 217, Sec.3Nanking East Road, Taipei, TaiwanTel: +886-2-2712-1112Fax: +886-2-2712-1118Equity Ownership: 100%
Boie-Takeda Chemicals, Inc.12th Floor, Sky Plaza Bldg.6788 Ayala Avenue, Oledan SquareMakati City, Metro Manila PhilippinesTel: +63-2-886-6954 to 61Fax: +63-2-886-6941Equity Ownership: 50%
Takeda (Thailand), Ltd.12-A Floor, Si Ayutthaya Bldg.487/1, Si Ayutthaya RoadBangkok 10400, ThailandTel: +66-2-248-0994 to 7Fax: +66-2-248-0998Equity Ownership: 48%
P.T. Takeda IndonesiaPlaza DM 15th FloorJl. Jend. Sudirman Kav. 25Jakarta 12920, IndonesiaTel: +62-21-526-7656Fax: +62-21-526-7657Equity Ownership: 70%
Takeda Food Products, Ltd.20, Imoji 3-chome, Itami-shiHyogo 664-0011, JapanTel: +81-727-78-1121Fax: +81-727-72-5155Equity Ownership: 100%
BASF Takeda Vitamins Ltd.3-3, Kioicho, Chiyoda-ku Tokyo 102-8570, JapanTel: +81-3-3238-2800Fax: +81-3-3238-2523Equity Ownership: 34%
Takeda-Kirin Foods Corporation11th Floor, Nichirei Higashi-Ginza Bldg. 19-20, Tsukiji 6-chomeChuo-ku, Tokyo 104-0045, JapanTel: +81-3-5148-5311Fax: +81-3-5565-0461Equity Ownership: 49%
Japan EnviroChemicals, Ltd. 3-8 Doshomachi, 2-chome, Chuo-ku Osaka 541-0045, Japan Tel: +81-6-6204-2940 Fax: +81-6-6204-2443 Equity Ownership: 100%
Minabe Chemical Industries, Ltd.173-1, Kisato, Minabe-choHidaka-gun, Wakayama 645-0011, JapanTel: +81-739-72-3220Fax: +81-739-72-5009Equity Ownership: 100%
Davao Central Chemical CorporationKm19, Tibungco, Davao City 8000, PhilippinesTel: +63-82-238-0042 to 5Fax: +63-82-238-0046Equity Ownership: 80%
Mizusawa Industrial Chemicals, Ltd.13-6, Nihonbashi-muromachi 1-chome, Chuo-ku, Tokyo 103-0022, JapanTel: +81-3-3270-3821Fax: +81-3-5201-7467Equity Ownership: 53.07%
MITSUI TAKEDA CHEMICALS, INC.2-5, Kasumigaseki 3-chomeChiyoda-ku, Tokyo 100-6009, JapanTel: +81-3-3592-4506Fax: +81-3-3592-5068Equity Ownership: 49%
Century Chemical Works Sdn. Bhd.Mk.1, No.1026 Prai Industrial Complex13609 Prai, Province WellesleyPenang, MalaysiaTel: +60-4-3907966Fax: +60-4-3907817Equity Ownership: 25%
Sumitomo Chemical Takeda Agro Company, LimitedNihonbashi Sunrise Bldg. 13-10 Nihonbashi 2-chome, Chuo-ku, Tokyo 103-0027, Japan Tel: 03-3278-2816 Fax: 03-3278-2750 Equity Ownership: 40%
Takeda Schering-Plough Animal Health K.K.3-7, Hiranomachi 2-chomeChuo-ku, Osaka 541-0046, JapanTel: +81-6-4706-6261Fax: +81-6-4706-6251Equity Ownership: 40%
Development
Manufacturing
Marketing
Manufacturing and Marketing
R&D, Manufacturing and Marketing
Holding Company, etc.
* Owned by Takeda America Holdings, Inc. ** Owned by Takeda Europe Holdings Ltd. *** 100% subsidiary of Takeda Pharma GmbH
p.51TAKEDA ANNUAL REPORT 2003 MAIN SUBSIDIARIES AND AFFILIATES TAKEDA ANNUAL REPORT 2003

As of March 31, 2003
Founded: June 12, 1781
Date of Incorporation:January 29, 1925
Paid-in Capital:¥63,540 million
Number of Shareholders:76,107
Common Shares Issued:889,272,395
Principal Shareholders
Name
Nippon Life Insurance Company 56,396 6.34%Japan Trustee Services Bank, Ltd. (Trust account) 55,663 6.26%The Master Trust Bank of Japan, Ltd. (Trust account) 51,331 5.77%Dai-ichi Life Insurance Company 38,029 4.28%State Street Trust & Banking Co., Ltd. 24,359 2.74%Takeda Science Foundation 17,911 2.01%The Chase Manhattan Bank, N.A. London, Securities Lending Omnibus Account 17,403 1.96%The UFJ Trust and Banking Co., Ltd. (Trust account A) 16,640 1.87%The Chase Manhattan Bank, N.A. London 13,433 1.51%Euroclear Bank SA/NV 12,945 1.46%
Monthly Stock Price Range (Tokyo Stock Exchange)
Independent Certified Public Accountants:Deloitte Touche Tohmatsu(by Tohmatsu & Co., a member firm of Deloitte Touche Tohmatsu)Osaka Kokusai Building3-13, Azuchimachi 2-chomeChuo-ku, Osaka 541-0052, Japan
Stock Exchange Listings:(#4502) Tokyo, Osaka, Nagoya, Fukuoka, Sapporo
Transfer Agent:The UFJ Trust and Banking Co., Ltd.6-3, Fushimi-machi 3-chomeChuo-ku, Osaka 541-8502, Japan
Number of Shares Held (thousands)
Percentage of Total Shares Outstanding
(%)
T A K E D A A N N U A L R E P O R T 2 0 0 3 C O R P O R A T E I N F O R M A T I O N T A K E D A A N N U A L R E P O R T 2 0 0 3p.52

For further information, please contact:
Head Office1-1, Doshomachi 4-chomeChuo-ku, Osaka 540-8645, JapanTel: +81-6-6204-2111Fax: +81-6-6204-2880
Tokyo Head Office12-10, Nihonbashi 2-chomeChuo-ku, Tokyo 103-8668, JapanTel: +81-3-3278-2111Fax: +81-3-3278-2000
URLhttp://www.takeda.com/
p.35

Year ended March 31, 2003
Year ended M
arch 31, 2003
Takeda Ch
emical In
dustries, L
td.A
NN
UA
L REP
OR
T 20
03
Printed in Japan
TA K E D A A N N U A L R E P O R T
2 0 0 3
C O N T R I B U T E S T O T H E H E A LT H O F I N D I V I D U A L S W O R L D W I D EC O N T R I B U T E S T O T H E H E A LT H O F I N D I V I D U A L S W O R L D W I D E
Printed on 100% recycled paper.