t he mot and v enture b usiness prof. takao ito, doctor of economics, ph.d. of engineering, graduate...
TRANSCRIPT

THE MOT AND VENTURE BUSINESS
Prof. Takao Ito, Doctor of Economics, PH.D. of Engineering, Graduate School of Engineering, Hiroshima University
Thursday, October 16, 2014

TOPIC 8 PORTFOLIO MANAGEMENT

TOPIC 8 CAPM BASICS The ROI A performance measure used to
evaluate the efficiency of an investment or to compare the efficiency of a number of different investments.

The P/E Ratio of a stock (price-to-earnings ratio, "P/E", "PER", "earnings multiple," or simply "multiple")
It is a measure of the price paid for a share relative to the annual net income or profit earned by the firm per share.

Basic formula of the ratio of a stock return
0
01
P
DPPR
P0……Initial priceP1……trading priceD…….Dividend yield
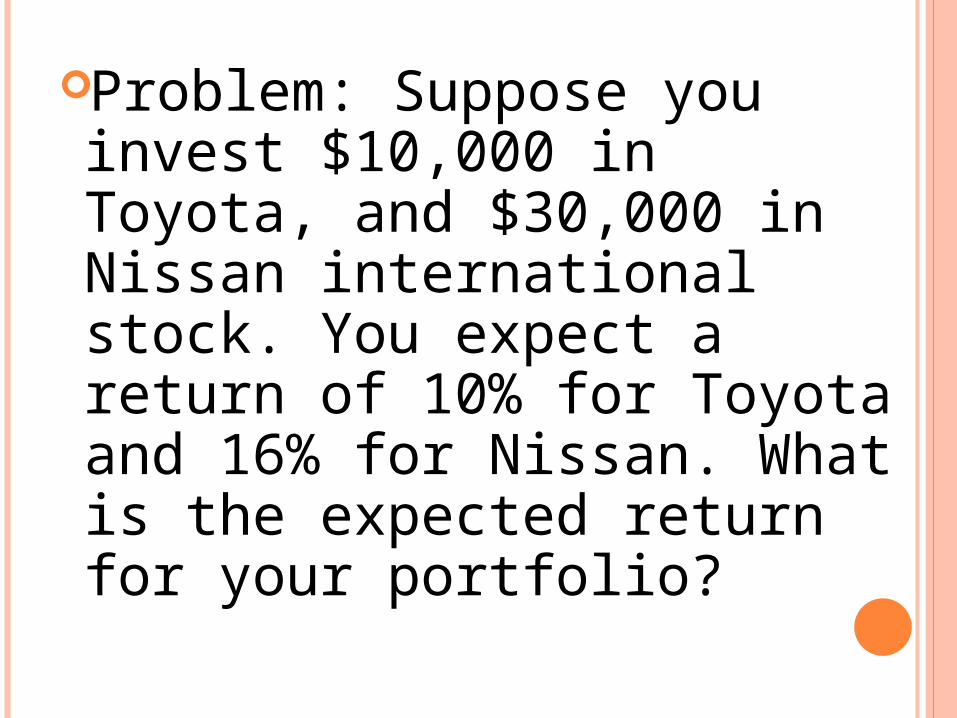
Problem: Suppose you invest $10,000 in Toyota, and $30,000 in Nissan international stock. You expect a return of 10% for Toyota and 16% for Nissan. What is the expected return for your portfolio?

Solution: You have $40,000 invested in total, so your portfolio weight are 10,000/40,000=25% in Toyota and 30,000/40,000=75% in Nissan. Therefore, the expected return on your portfolio is
%5.1416.0%7510.0%25
][][)(
NNTTP RExRExRE

In the case of Stock A
Events Probability Ratio of Return
BetterNormalWorse
0.250.5
0.25
20%12%
4%

Expectation value of stock A
l
kkiki PRRE
1
)(
Expectation value of stock AExpectation value of stock A
l
kkiiki PRERR
1
2))(()(

Then we get
%12425.0125.02025.0)( ARE
%32
)124(25.0)1212(5.0)1220(25.0)( 222
AR

Assume that stock B
Event Probability Ratio of Return
BetterNormalWorse
0.250.5
0.25
7%7%
11%
%81125.075.0725.0)( BRE
%3
)811(25.0)87(5.0)87(25.0)( 222
BR

In the case of two stocks: Stock A and stock B, the expectation value and risk
;1 BA XX
);()()( BBAAi REXREXRE
),(2)()(
)(
2222BABABBAA
i
RRCovXXRXRX
R
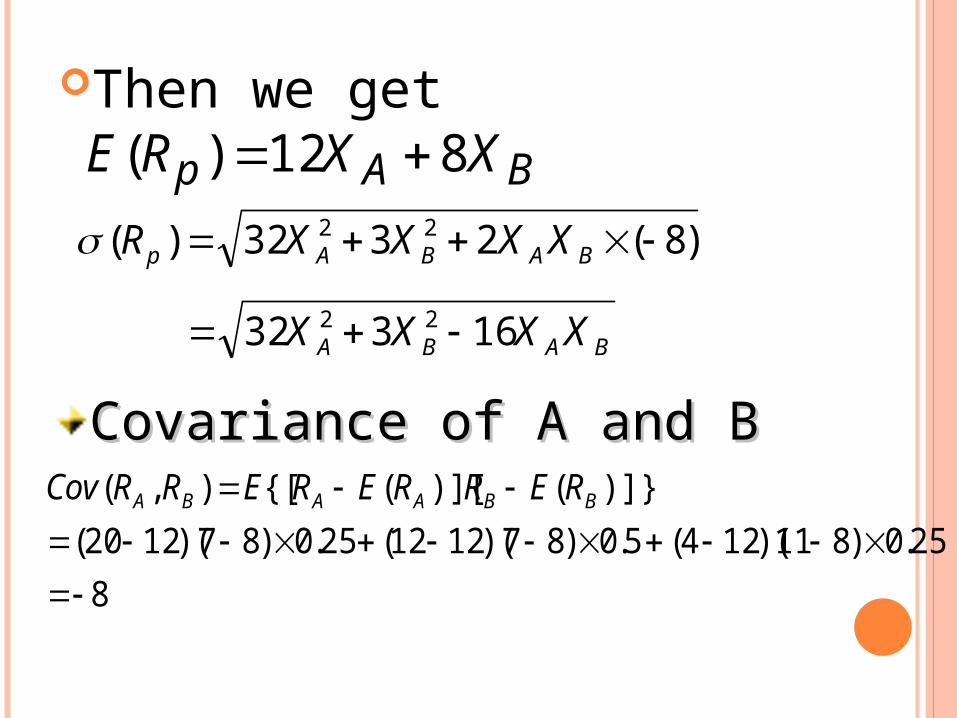
Then we getBAp XXRE 812)(
BABA
BABAp
XXXX
XXXXR
16332
)8(2332)(
22
22
Covariance of A and BCovariance of A and B
8
25.0)811)(124(5.0)87)(1212(25.0)87)(1220(
)]}()][({[),(
BBAABA RERRERERRCov

Correlation ratio of A and B
816.0332
8
)()(
),(
BA
BAAB RR
RRCov
Risk of stocks A and BRisk of stocks A and B
32251
)1(16)1(332
16332)(
2
22
22
AA
AAAA
BABAp
XX
XXXX
XXXXR

Best answer (differentiate)
%5.78;215.0102/22 BA XX
0)(
A
p
dX
Rd
032251
22102
2
1)(
2
AA
A
A
p
XX
X
dX
Rd
Then we getThen we get


M
E(Rp)
RF
σ(Rp)
G
H

)()1()()1()()( SFSFP REXRXREXRXERE
)()1(
)0)(()()1(
)()()1(2)()1()()(
22
2222
S
FS
SFFSSFP
RX
RRX
RRXXRXRXR
Then we getThen we get
)()(
)()( p
M
FMFP R
R
RRERRE
RFM……capital market line

STOCK J AND STOCK MARKET
)()1()()( MjjjP REXREXRE
),()1(2)()1()()( 2222MjjjMjjjP RRCovXXRXRXR
M
E(Rp)
RF
σ(Rp)
G
H

),()(
)()(
2 MjM
FMFj RRCov
R
RRERRE
)(
),(2
M
Mj
R
RRCov
])([)( FMjFj RRERRE
Let
We can easy to get
RF
COV(Rj,RM)
E(R j )

),()(
)()(
2 MkM
FMFk RRCov
R
RRERRE
])([)( FMkFj RRERRE
RF
β k
E(R k )
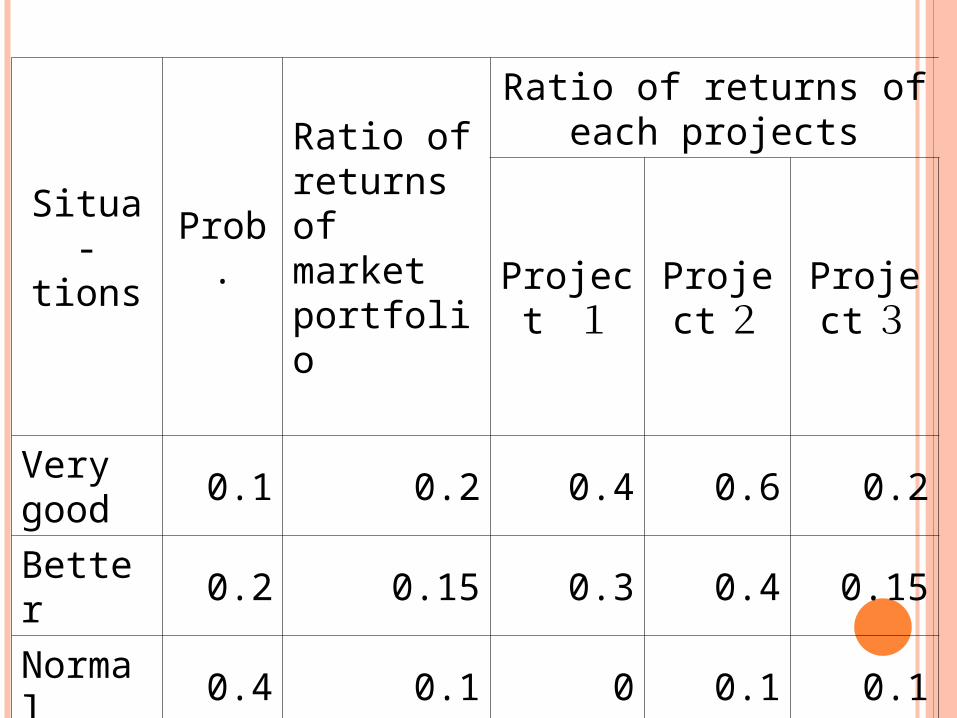
Situa-tions
Prob.
Ratio of returns of market portfolio
Ratio of returns of each projects
Project 1
Project 2
Project3
Very good
0.1 0.2 0.4 0.6 0.2
Better 0.2 0.15 0.3 0.4 0.15
Normal
0.4 0.1 0 0.1 0.1
Worse 0.2 0 -0.1 -0.1 0
Worst 0.1 -0.1 -0.2 -0.4 -0.05

E(RM)=0.1×0.2 + 0.2×0.15 + 0.4×0.1 + 0.2×0 + 0.1× ( -0.1 ) = 0.08
σ 2( RM )= 0.1×(0.2-0.08) 2+ 0.2×(0.15-0.08) 2 + 0.4×(0.1-0.08) 2+ 0.2×(0-0.08) 2 + 0.1×(-0.1-0.08) 2 =0.0071

① ② ③ ④ ⑤ ⑥
Situations Prob.:PRate of
returns:RK
P*R k
[R k- E(Rk) ] [RM - E(R
M) ] ②×⑤
Project 1
1 0.1 0.4 0.04 0.0408 0.00408
2 0.2 0.3 0.06 0.0168 0.00336
3 0.4 0 0 -0.0012 -0.00048
4 0.2 -0.1 -0.02 0.0128 0.00256
5 0.1 -0.2 -0.02 0.0468 0.00468
E(R1)= 0.06 COV(R1,RM)= 0.0142
Project 2
1 0.1 0.6 0.06 0.0648 0.00648
2 0.2 0.4 0.08 0.0238 0.00476
3 0.4 0.1 0.04 0.0008 0.00032
4 0.2 -0.1 -0.02 0.0128 0.00256
5 0.1 -0.4 -0.04 0.0828 0.00828
E(R2)= 0.12 COV(R2,RM)= 0.0224
Project 3
1 0.1 0.2 0.02 0.0168 0.00168
2 0.2 0.15 0.03 0.0063 0.00126
3 0.4 0.1 0.04 0.0008 0.00032
4 0.2 0 0 0.0048 0.00096
5 0.1 -0.05 -0.005 0.0198 0.00198
E(R3)= 0.085 COV(R3,RM)= 0.0062

20071.0
0142.0
)(
),(2
11
M
M
R
RRCov
15.30071.0
0224.0
)(
),(2
22
M
M
R
RRCov
87.00071.0
0062.0
)(
),(2
33
M
M
R
RRCov
03.005.008.0])([ FM RRE

11.0
)05.008.0(205.0])([)( 11
FMF RRERRE
1445.0
)05.008.0(15.305.0])([)( 22
FMF RRERRE
0761.0
)05.008.0(87.005.0])([)( 33
FMF RRERRE

0
0.02
0.04
0.06
0.08
0.1
0.12
0.14
0.16
0.18
1 2 3 4

THANK YOU FOR YOUR ATTENTION!