t2.1 chapter outline chapter 2 financial statements, taxes, and cash flow chapter organization...
TRANSCRIPT

T2.1 Chapter Outline
Chapter 2Financial Statements, Taxes, and Cash Flow
Chapter Organization
2.1 The Balance Sheet
2.2 The Income Statement
2.3 Cash Flow
2.4 Taxes
2.5 Capital Cost Allowance
2.6 Summary and Conclusions CLICK MOUSE OR HIT SPACEBAR TO ADVANCE
copyright © 2002 McGraw-Hill Ryerson,Ltd.

copyright © 2002 McGraw-Hill Ryerson, Ltd Slide 3
T2.2 The Balance Sheet (Figure 2.1)

copyright © 2002 McGraw-Hill Ryerson, Ltd Slide 4
T2.2 The Balance Sheet
Components Assets (Current & Long-Term) Liabilities (Current & Long-Term) Owners Equity
Key concepts Liquidity Net Working Capital
• Current Assets minus Current Liabilities Debt vs. Equity Market vs. Book Value

copyright © 2002 McGraw-Hill Ryerson, Ltd Slide 5
Liquidity
refers to the speed and ease which an asset can be turned into cash
a highly liquid asset then is one which can be quickly sold and turned into cash - without a significant loss in value.
Assets are listed on the balance sheet in order of decrreasng liquidity
liquidity is important - running the day to day business and being in position to pay interest charges, retire loans, pay dividends, etc.
Trade-off - the more liquid an asset is the lower the return to that asset e.g. Cash balances vs inventory vs fixed assets

copyright © 2002 McGraw-Hill Ryerson, Ltd Slide 6
Debt v.s. Equity
Generally, when a firm borrows it gives the bondholder first claim on the firm’s cash flow and assets....equity holders receive the residual value or whatever is left after the creditors are paid.
Thus, shareholders equity is the residual difference between assets and liabilities.
The use of debt financing is called financial leverage - debt financing can magnify returns (gains and losses) to shareholders or equity holders
increases the potential return also increases the risk factor

copyright © 2002 McGraw-Hill Ryerson, Ltd Slide 7
Market Value vs Book Notes
Balance sheet values are book values GAAP requires assets to be shown at historical cost current asset book values can be very close to market value fixed assets can and often have major differences between
historical cost and market value
GAAP Accounting principles of objectivity and conservatism are the drivers behind historical cost.
• No argument about historical cost and because book is usually less than mkt. - they are also conservative( if mkt values fall along way below book - assets will be written down - good examples of this are the recent writedowns of assets by the likes of Nortel Cisco and many other high tech. firms

copyright © 2002 McGraw-Hill Ryerson, Ltd Slide 8
T2.3 Income Statement
Components Revenues Expenses
• Cash and non-cash
• Operating and non-operating Net Income Earnings per share Dividends
3 important concepts for Finance GAAP & Accrual Accounting & Matching Non-cash items Time and Costs

copyright © 2002 McGraw-Hill Ryerson, Ltd Slide 9
Cash Flow
Key concept in the study of Corporate Finance liquidity is about turning assets into cash investment analysis and capital budgeting is about discounted
cash flows valuation of securities is about future discounted cash flow at some
rate of discount e.g bonds - future interest payments and principle repayments discounted back at a certain rate

copyright © 2002 McGraw-Hill Ryerson, Ltd Slide 10
T2.4 Cash Flow
Cash flows are essential to valuation
In Finance, one of the main concern is the timing of cash flows. (another being the discount rate)
Since the income statement includes non-cash items, we will have to adjust it to get information on cash flows
Balance sheet activity plays an important role in the determination of the cash balance (e.g.)
Collections on accounts receivable
Borrowing on accounts payable
Work with reported financial statements to determine historical cash flow.

copyright © 2002 McGraw-Hill Ryerson, Ltd Slide 11
Cash Flow
Cash flow from an historical perspective - calculated from financial statements - our focus in this chapter
how to calculate
projected cash flow - look at in later chapters as we move into the question of valuation of investments and securities

copyright © 2002 McGraw-Hill Ryerson, Ltd Slide 12
T2.4 GAAP versus Cash Flow Time Line
Revenue
recognized
and
matched
expenses
Sale of goods
on credit
Time
Pay Payroll Pay Collect
for checks utilities accounts
raw goodsissued receivable
Cash flowCash flowCash flow Cash flow

copyright © 2002 McGraw-Hill Ryerson, Ltd Slide 13
T2.6 Cash Flow Summary
I. The cash flow identityCash flow from assets = Cash flow to creditors (bondholders)
+ Cash flow to stockholders (owners)
This is based upon the balance sheet identity: Assets = Liabilities + Equity
The equivalent cash flow statement is: cash flow to creditors
Cash flow from assets = +
cash flow to stockholders

copyright © 2002 McGraw-Hill Ryerson, Ltd Slide 14
T2.6 Cash Flow Summary (cont’d)
II. Cash flow from assetsCash flow from assets = Operating cash flow
– Net capital spending – Additions to net working capital (NWC)
where Operating cash flow = Earnings before interest and taxes (EBIT)
+ Depreciation – Taxes Net capital spending = Ending net fixed assets –
Beginning net fixed assets+ Depreciation
Change in NWC = Ending NWC – Beginning NWC
III. Cash flow to creditorsCash flow to creditors = Interest paid – Net new borrowing
IV. Cash flow to stockholdersCash flow to stockholders = Dividends paid – Net new equity raised

copyright © 2002 McGraw-Hill Ryerson, Ltd Slide 15
T2.5 Cash Flow Example
Balance Sheet
Beg End Beg End
Cash $100 $150 A/P $100 $150
A/R 200 250 N/P 200 200
Inv 300 300 C/L 300 350
C/A $600 $700 LTD $400 $420
NFA 400 500 C/S 50 60
R/E 250 370
$300 $430
Total $1000 $1200 Total $1000 $1200
copyright © 2002 McGraw-Hill Ryerson, Ltd Slide 16
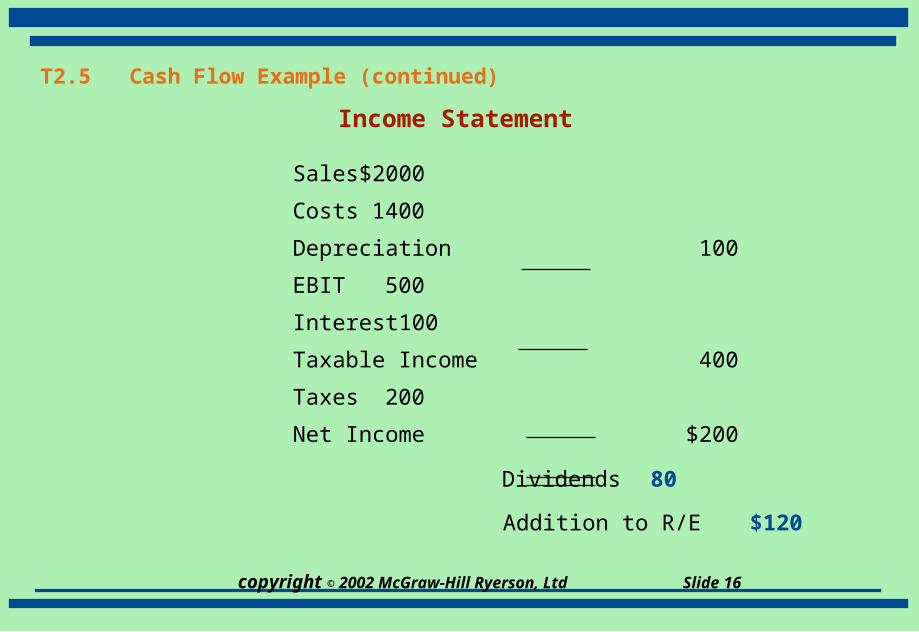
T2.5 Cash Flow Example (continued)
Income Statement
Sales $2000
Costs 1400
Depreciation100
EBIT 500
Interest 100
Taxable Income 400
Taxes 200
Net Income$200
Dividends 80
Addition to R/E $120

copyright © 2002 McGraw-Hill Ryerson, Ltd Slide 17
T2.5 Cash Flow Example (concluded)A. Cash flow from assets
1. Operating cash flow = EBIT + _____________ – Taxes= $500 + 100
– 200= $_____
2. Change in NWC = ___________ – ___________= $350 –
$_____= $_____
3. Net capital spending = $_____ + Dep – _____= $500 + 100
– 400= $_____
4. Cash flow from assets = OCF – chg. NWC – Cap. sp.= $400 – 50
– 200= $150
B. Cash flow to creditors and stockholders
1. Cash flow to creditors = Int. paid – _________________= $100 – 20= $80
2. Cash flow to stockholders = Div. paid – ________________= $80 – 10= $70
Check: $___ from assets = $___ to Bondholders + $___ to Stockholders

copyright © 2002 McGraw-Hill Ryerson, Ltd Slide 18
T2.5 Cash Flow Example (concluded)A. Cash flow from assets
1. Operating cash flow = EBIT + Depreciation – Taxes= $500 + 100 – 200= $400
2. Change in NWC = Ending NWC – Beginning NWC= $350 – 300= $50
3. Net capital spending = Ending NFA + Dep – Beginning NFA= $500 + 100 – 400= $200
4. Cash flow from assets = OCF – chg. NWC – Cap. sp.= $400 – 50 – 200= $150
B. Cash flow to creditors and stockholders
1. Cash flow to creditors = Int. paid – Net new Borrowing= $100 – 20= $80
2. Cash flow to stockholders = Div. paid – Net new Equity= $80 – 10= $70
Check: $150 from assets = $80 to bondholders + $70 to stockholders

copyright © 2002 McGraw-Hill Ryerson, Ltd Slide 19
Taxes - key concepts
Earnings and cash flow are on an after tax basis - taxes represent real costs and cash requirements for firms
Taxes can be a major factor in investment decisions including mergers and acquisitions.
Tax ‘pools’ of the acquired company can be used in the new entity to shelter income - the value of these pools to the acquiring company needs to be established
Financial management considerations - corporate taxation is a complex and specialized field.....good communication between tax experts and other financial staff is important as the after tax impact of business decisions needs to be established.

copyright © 2002 McGraw-Hill Ryerson, Ltd Slide 20
T2.7 Taxes
Key issues: What is an average tax rate? What is a marginal tax rate? Why do we pay attention to marginal tax rates? What are corporate tax rates? What are individual tax rates? How does the difference between corporate and individual
tax rates affect corporate finance?
How do tax rates relate to the goal of corporate finance?
copyright © 2002 McGraw-Hill Ryerson, Ltd Slide 21
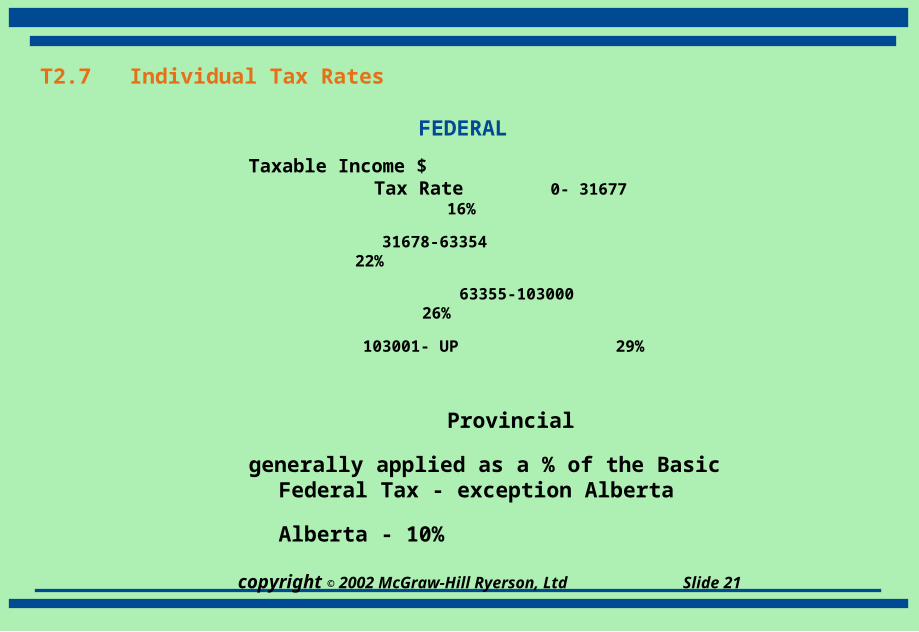
T2.7 Individual Tax Rates
FEDERAL
Taxable Income $ Tax Rate 0- 31677 16%
31678-63354 22%
63355-103000 26%
103001- UP 29%
Provincial
generally applied as a % of the Basic Federal Tax - exception Alberta
Alberta - 10%
copyright © 2002 McGraw-Hill Ryerson, Ltd Slide 22
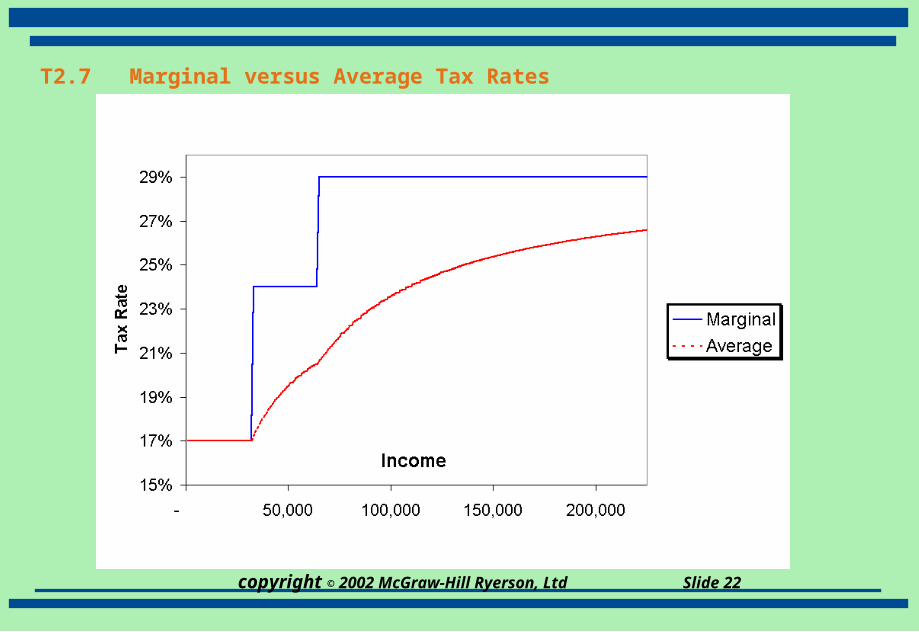
T2.7 Marginal versus Average Tax Rates

copyright © 2002 McGraw-Hill Ryerson, Ltd Slide 23
T2.7 Individual Tax Rates
SELECTED PROVINCIAL(Table 2.5)
Resident of Percentage of Basic Federal Tax
Alberta 44%
Newfoundland 62
Prince Edward Island 57.5
Saskatchewan 48
Northwest Territories 45
Yukon Territory 50

copyright © 2002 McGraw-Hill Ryerson, Ltd Slide 24
Taxes on Investment Income
taxes on dividends and capital gains
dividends two clear goals -
• avoidance of double taxation with corporations paying dividends from after tax income and full taxation in the hands of shareholders -> dividend tax credit
• this tax shelter applies to dividends paid by Canadian Corporations thus encouraging Canadian investors to invest in Canadian firms
Capital Gains rates are coming down with 50% of the gain now being taxed - down
from 75% tax deferral from only realized gains being taxed results in lower
‘effective tax’

copyright © 2002 McGraw-Hill Ryerson, Ltd Slide 25
T2.8 ILLUSTRATION OF DIVIDEND TAX CREDIT FOR ALBERTA RESIDENTSMarginal Tax Rate 17% 24% 29%
Dividends $1,000 $1,000 $1,000
Gross up at 25% 250 250 250
Grossed up dividends 1250 1250 1250
Federal Tax on dividends 212.50 300.00 362.50
Less Dividend Tax Credit
(13.333% x $1,250) (166.67) (166.67) (166.67)
Federal Tax Payable 45.83 133.33 195.83
Provincial Tax at 44% of Federal Tax 20.17 58.67 86.17
Total Tax 66.00 192.00 282.00
Effective Combined Tax Rates 6.6% 19.2% 28.2%
NOTE: Marginal tax rates apply to incomes of less than 32,000 (17%), more than 32,000 but less
than 64000 (25%), and more than 64,000 (29%)

copyright © 2002 McGraw-Hill Ryerson, Ltd Slide 26
T2.9 Corporate Tax Rates
FEDERAL ALBERTA COMBINED
Basic Corporations 26.1 13.0% 39.1%
Manufacturing and Processing 22.1 13.0 35.1
All Small Corporations 13 4.5 17.5(Taxable Income below $200 thousand)

copyright © 2002 McGraw-Hill Ryerson, Ltd Slide 27
Taxable Income
taxable income is different from net income net income needs to conform to GAAP taxable income is calculated according to tax rules
established by the various taxing authorities e.g. book depreciation vs capital cost allowance
• book depreciation attempting to match revenues earned from the use of a tangible depreciable asset with the costs associated with the asset
• capital cost allowance - allowable deductions associated with various types of assets - patchwork of tax rules that often have stemmed from government budget and economic development objectives.
Income is taxed differently across various industries with the ‘rules’ continually changing

copyright © 2002 McGraw-Hill Ryerson, Ltd Slide 28
Capital Cost Allowance
Key concepts and terms: Classes of assets Asset purchases and sales
• net acquisitions are used if multiple purchases
• one half year rule applies to net acquisitions
• sale - the balance in the pool is reduced by the lesser of sale price or original cost
Termination of asset pool
• terminal loss occurs when there is remaining UCC after the last asset disposal - this amount is fully tax deductible
• recaptured CCA occurs with a negative UCC after the last asset disposal - this amount is fully taxable

copyright © 2002 McGraw-Hill Ryerson, Ltd Slide 29
T 2.10 Capital Cost Allowance - Depreciation for tax purposes
Class Rate Assets
1 4% Buildings acquired after 1987
8 20% Furniture, photocopiers
10 30% Vans, trucks, tractors and computer equipment
13 Straight-line Leasehold improvements
16 40% Taxicabs and rental cars
22 50% Pollution control equipment
43 30% Manufacturing equipment

copyright © 2002 McGraw-Hill Ryerson, Ltd Slide 30
T2.11 CCA Example
Depreciation on $22,000 Photocopier (CCA Class 8)
Year UCC t CCA UCC t+1
1 11,000 2,200 $8,800
2 19,800 3,960 15,840
3 15,840 3,168 12,672
4 12,672 2,534 10,138
5 10,138 2,028 8,110
6 8,110 1,622 6,488

copyright © 2002 McGraw-Hill Ryerson, Ltd Slide 31
T2.12 Hermetic, Inc. Balance Sheet
as of December 31($ in thousands)
Assets 1998 1999
Current assets
Cash $ 45 $ 50
Accounts receivable 260 310
Inventory 320 385
Total $ 625$ 745
Fixed assets
Net plant and equipment 985 1100
Total assets $1610 $1845

copyright © 2002 McGraw-Hill Ryerson, Ltd Slide 32
T2.12 Hermetic, Inc. Balance Sheet (concluded)
Liabilities and equity 1998 1999
Current liabilities
Accounts payable $ 210 $ 260
Notes payable 110 175
Total $ 320$ 435
Long-term debt 205 225
Stockholders’ equityCommon stock and
paid-in surplus 290 290
Retained earnings 795 895
Total $1085 $1185
Total liabilities and equity $1610 $1845

copyright © 2002 McGraw-Hill Ryerson, Ltd Slide 33
T2.13 Hermetic, Inc. Income Statement
($ in thousands)
Net sales $710.00
Cost of goods sold 480.00
Depreciation 30.00
Earnings before interest and taxes $200.00
Interest 20.00
Taxable income 180.00
Taxes 53.45
Net income $126.55
Dividends 26.55
Addition to retained earnings $100.00
copyright © 2002 McGraw-Hill Ryerson, Ltd Slide 34
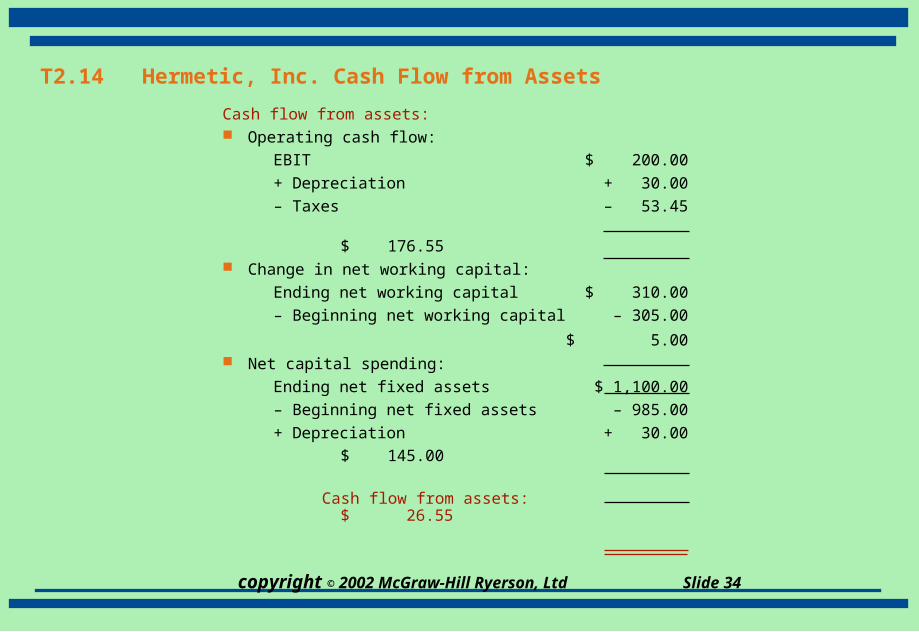
T2.14 Hermetic, Inc. Cash Flow from Assets
Cash flow from assets: Operating cash flow:
EBIT $ 200.00
+ Depreciation + 30.00
– Taxes – 53.45
$ 176.55 Change in net working capital:
Ending net working capital $ 310.00
– Beginning net working capital – 305.00
$ 5.00 Net capital spending:
Ending net fixed assets $ 1,100.00
– Beginning net fixed assets – 985.00
+ Depreciation + 30.00
$ 145.00
Cash flow from assets:
$ 26.55

copyright © 2002 McGraw-Hill Ryerson, Ltd Slide 35
T2.14 Hermetic, Inc. Cash Flow from Assets (concluded)
Total cash flow to creditors and stockholders:
Cash flow to creditors:
Interest paid $ 20.00
– Net new borrowing – 20.00
$ 0.00
Cash flow to stockholders:
Dividends paid $ 26.55
– Net new equity raised 0.00
$ 26.55
Cash flow to creditors and stockholders $ 26.55

copyright © 2002 McGraw-Hill Ryerson, Ltd Slide 36
T2.16 Solution to Problem 2.12
The December 31, 1999 balance sheet Pearl Jelly, Inc. showed long-term debt of $2 million, and the December 31, 2000 balance sheet showed long-term debt of $2.9 million. The 2000 income statement showed interest expense of $700,000. What was cash flow to creditors during 1999?
Cash flow to creditors = Interest paid – Net new borrowing
Interest paid = $700,000
Net new borrowing = $_______ – 2 million = $_______
Cash flow to creditors = $700,000 – (_______)
= _______

copyright © 2002 McGraw-Hill Ryerson, Ltd Slide 37
T2.16 Solution to Problem 2.12
The December 31, 1999 balance sheet Pearl Jelly, Inc. showed long-term debt of $2 million, and the December 31, 2000 balance sheet showed long-term debt of $2.9 million. The 2000 income statement showed interest expense of $700,000. What was cash flow to creditors during 1999?
Cash flow to creditors = Interest paid – Net new borrowing
Interest paid = $700,000
Net new borrowing = $2.9 million – 2 million = $900K
Cash flow to creditors = $700,000 – 900,000
= –$200,000

copyright © 2002 McGraw-Hill Ryerson, Ltd Slide 38
T2.17 Solution to Problem 2.13
The December 31, 1999 balance sheet Pearl Jelly, Inc. showed $500,000 in the common stock account, and $6.6 million in the additional paid-in surplus account. The December 31, 1999 balance sheet showed $550,000 and $7.0 million in the same two accounts. If the company paid out $300,000 in cash dividends during 2000, what was the cash flow to stockholders for the year?
Cash flow to stockholders = Dividends paid – Net new equity Dividends paid = ________ Net new equity = (________+________) – ________ + ________)
Cash flow to stockholders = ________– ________ = ________
copyright © 2002 McGraw-Hill Ryerson, Ltd Slide 39
T2.17 Solution to Problem 2.13
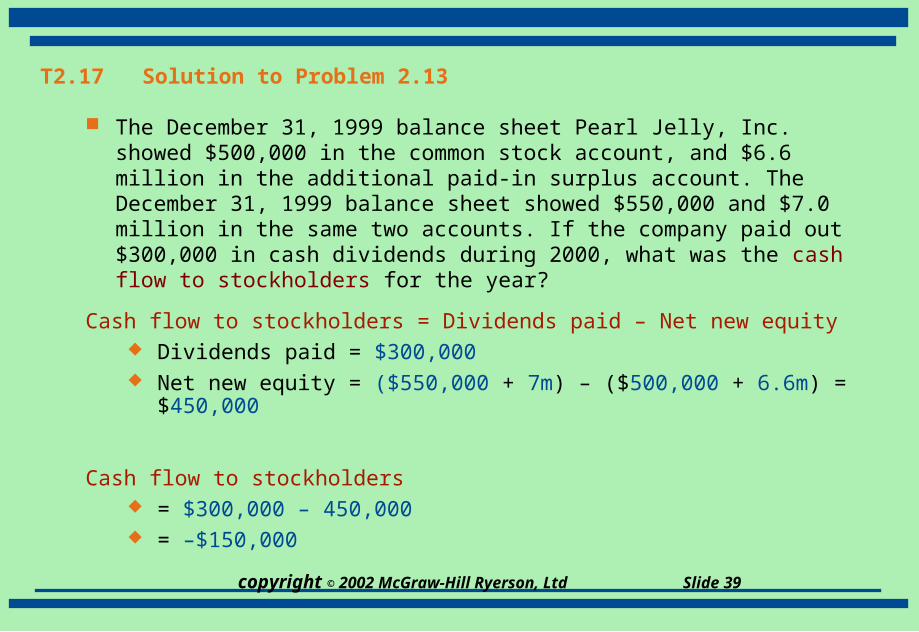
The December 31, 1999 balance sheet Pearl Jelly, Inc. showed $500,000 in the common stock account, and $6.6 million in the additional paid-in surplus account. The December 31, 1999 balance sheet showed $550,000 and $7.0 million in the same two accounts. If the company paid out $300,000 in cash dividends during 2000, what was the cash flow to stockholders for the year?
Cash flow to stockholders = Dividends paid – Net new equity Dividends paid = $300,000 Net new equity = ($550,000 + 7m) – ($500,000 + 6.6m) = $450,000
Cash flow to stockholders = $300,000 – 450,000 = –$150,000

copyright © 2002 McGraw-Hill Ryerson, Ltd Slide 40
T2.18 Solution to Problem 2.14
Given the information for Pearl Jelly, Inc. in problems 12 and 13, suppose you also know that the firm’s net capital spending during 2000 was $500,000, and that the firm reduced its net working capital investment by $135,000. What was the firm’s 2000 operating cash flow, or OCF?
Cash flow from assets (CFA) =
Cash flow to creditors + Cash flow to stockholders
Cash flow to creditors = – $200,000
Cash flow to stockholders = –$150,000
So, Cash flow from assets = –$200K + (–)150,000K = –$350K.
And,
CFA = OCF - chg. in NWC – capital spending
Solving for OCF: OCF = CFA + chg. in NWC + capital spending OCF = _______ + _______+ _______ OCF = $ _______

copyright © 2002 McGraw-Hill Ryerson, Ltd Slide 41
T2.18 Solution to Problem 2.14
Given the information for Pearl Jelly, Inc. in problems 12 and 13, suppose you also know that the firm’s net capital spending during 2000 was $500,000, and that the firm reduced its net working capital investment by $135,000. What was the firm’s 2000 operating cash flow, or OCF?
Cash flow from assets (CFA) =
Cash flow to creditors + Cash flow to stockholders
Cash flow to creditors = – $200,000
Cash flow to stockholders = –$150,000
So, cash flow from assets = –$200K + (–)150,000K = –$350K.
And,
CFA = OCF – Chg. in NWC – Capital spending
Solving for OCF: OCF = CFA + Chg. in NWC + Capital spending OCF = –$350K + (– 135,000) + 500,000 OCF = $15,000