table 12.1 u.s. default factors for calculang co emissions ......3072.3 kg c / mmbtu mmbtu / short...
TRANSCRIPT

Table 12.1 U.S. Default Factors for Calcula ng CO2 Emissions from Fossil Fueland Biomass Combus on
CO2Emission
Factor (Per UnitMass orVolume)
CO2Emission
Factor (Per UnitEnergy)
FractionOxidized
CarbonContent
(Per UnitEnergy)
Heat ContentFuel Type
kg C / MMBtuMMBtu / short tonCoal and Coke kg CO2 /
MMBtukg CO2 / short ton
125.09 28.279091Anthracite 103.69 2601.5821
124.93 25.44Bituminous 93.28 2325.4704
117.25 26.500909Subbituminous 97.17 1676.1825
114.21 26.650909Lignite 97.72 1388.6012
124.8 31.000909Coke 113.67 2819.016
119.73 26.050909Mixed Electric Utility/Electric Power 95.52 1884.6096
121.3 25.71Unspecified Residential/Com* 94.27 2007.951
121.39 25.71Mixed Commercial Sector 94.27 2016.4353
126.28 25.609091Mixed Industrial Coking 93.9 2467.692
122.35 25.819091Mixed Industrial Sector 94.67 2115.8745
kg C / MMBtuBtu / scfNatural Gas kg CO2 / MMBtu kg CO2 / scf
11026 14.471026US Weighted Average 53.06 .05444
1>1000 14.47Greater than 1,000 Btu* 53.056667 varies
1975 – 1,000 14.73975 to 1,000 Btu* 54.01 varies
2015 Climate Registry Default Emission Factors Released April 2015
Page 1 of 79

11,000 – 1,025 14.431,000 to 1,025 Btu* 52.91 varies
11025 – 1035 14.451,025 to 1,035 Btu* 52.983333 varies
11,025 – 1,050 14.471,025 to 1,050 Btu* 53.056667 varies
11,050 – 1,075 14.581,050 to 1,075 Btu* 53.46 varies
11,075 – 1,100 14.651,075 to 1,100 Btu* 53.716667 varies
1>1,100 14.92Greater than 1,100 Btu* 54.706667 varies
114.48(EPA 2010) Full Sample* 53.093333 n/a
114.43(EPA 2010) <1.0% CO2* 52.91 n/a
114.47(EPA 2010) <1.5% CO2* 53.056667 n/a
1<1,050 14.42(EPA 2010) <1.0% CO2 and <1,050 Btu/scf* 52.873333 n/a
1<1,050 14.47(EPA 2010) <1.5% CO2 and <1,050 Btu/scf* 53.056667 n/a
1>1,100 15.31(EPA 2010) Flare Gas* 56.136667 n/a
kg C / MMBtuMMBtu / gallonPetroleum Products kg CO2 / MMBtu
kg CO2 / gallon
10.139 19.977273Distillate Fuel Oil No. 1 73.25 10.18175
10.138 20.170909Distillate Fuel Oil No. 2 73.96 10.20648
10.146 20.465455Distillate Fuel Oil No. 4 75.04 10.95584
10.14 19.89Residual Fuel Oil No. 5 72.93 10.2102
10.15 20.481818Residual Fuel Oil No. 6 75.1 11.265
10.143 18.2Still Gas* 66.733336 9.542867
10.138 20.181818Used Oil 74 10.212
2015 Climate Registry Default Emission Factors Released April 2015
Page 2 of 79

10.135 20.509091Kerosene 75.2 10.152
10.092 16.83LPG 61.71 5.67732
10.091 17.146364Propane (Liquid) 62.87 5.72117
10.091 17.986364Propylene 65.95 6.00145
10.068 16.254545Ethane 59.6 4.0528
10.058 17.989091Ethylene 65.96 3.82568
10.099 17.710909Isobutane 64.94 6.42906
10.103 18.78Isobutylene 68.86 7.09258
10.103 17.664545Butane 64.77 6.67131
10.105 18.741818Butylene 68.72 7.2156
10.125 18.550909Naptha (<401 deg F) 68.02 8.5025
10.11 18.24Natural Gasoline 66.88 7.3568
10.139 20.787273Other Oil (>401 deg F) 76.22 10.59458
10.11 19.096364Pentanes Plus 70.02 7.7022
10.125 19.369091Petrochemical Feedstocks 71.02 8.8775
10.143 27.93Petroleum Coke (Liquid) 102.41 14.64463
10.125 19.729091Special Naptha 72.34 9.0425
10.139 20.329091Unfinished Oils 74.54 10.36106
10.148 20.432727Heavy Gas Oils 74.92 11.08816
10.144 20.255455Lubricants 74.27 10.69488
2015 Climate Registry Default Emission Factors Released April 2015
Page 3 of 79

10.125 19.150909Motor Gasoline 70.22 8.7775
10.12 18.886364Aviation Gasoline 69.25 8.31
10.135 19.696364Kerosene Type Jet Fuel 72.22 9.7497
10.158 20.552727Asphalt and Road Oil 75.36 11.90688
10.138 20.329091Crude Oil 74.54 10.28652
10.132 19.8Waxes* 72.6 9.5832
kg C / MMBtuMMBtu / scfFossil Fuel-derived Fuels (gaseous) kg CO2 / MMBtu kg CO2 / scf
10.00147 19.530056Acetylene** 71.61 .105267
19.2E-05 74.813241Blast Furnace Gas 274.32 .025237
10.000599 12.777204Coke Oven Gas 46.85 .028063
10.002516 16.761779Propane (Gas) 61.46 .154633
10.001388 16.090909Fuel Gas 59 .081892
kg C / MMBtuMMBtu / short tonFossil Fuel-derived Fuels (solid) kg CO2 /
MMBtukg CO2 / short ton
19.95 24.736364Municipal Solid Waste 90.7 902.465
128 23.446364Tires 85.97 2407.16
138 20.454545Plastics 75 2850
130 27.93Petroleum Coke (Solid) 102.41 3072.3
kg C / MMBtuMMBtu / short tonBiomass Fuels-Solid kg CO2 /
MMBtukg CO2 / short ton
117.48 25.581818Wood and Wood Residuals (12% moisturecontent) 93.8 1639.624
18.25 32.228182Agricultural Byproducts 118.17 974.9025
2015 Climate Registry Default Emission Factors Released April 2015
Page 4 of 79

18 30.501818Peat 111.84 894.72
110.39 28.775455Solid Byproducts 105.51 1096.2489
125.554545Kraft Black Liquor (NA hardwood) 93.7 n/a
125.745455Kraft Black Liquor (NA softwood) 94.4 n/a
126.045455Kraft Black Liquor (Bagasse) 95.5 n/a
125.554545Kraft Black Liquor (Bamboo) 93.7 n/a
125.936364Kraft Black Liquor (Straw) 95.1 n/a
19.95 24.736364Municipal Solid Waste (Biomass) 90.7 902.465
kg C / MMBtuMMBtu / scfBiomass Fuels-Gaseous kg CO2 / MMBtu kg CO2 / scf
10.000655 14.200972Biogas (Captured Methane) 52.07 .034106
10.000485 14.2Landfill Gas (50% CH4/50%CO2) 52.066667 .025252
1Varies 14.2Wastewater Treatment Biogas*** 52.066667 Varies
kg C / MMBtuMMBtu / gallonBiomass Fuels - Liquid kg CO2 / MMBtu
kg CO2 / gallon
10.084 18.665455Ethanol (100%) 68.44 5.74896
10.128 20.138182Biodiesel (100%) 73.84 9.45152
10.125 19.38Rendered Animal Fat 71.06 8.8825
10.12 22.240909Vegetable Oil 81.55 9.786
2015 Climate Registry Default Emission Factors Released April 2015
Page 5 of 79

Source: Heat Content and CO2 emission factors per unit energy are from EPA Final Mandatory Reporting of GreenhouseGases Rule Tables C-1 and AA-1. Carbon Content derived using the heat content and/or default emission factor. Except thosemarked with * are from US Inventory of Greenhouse Gas Emissions and Sinks 1990-2012 (April 2014) Annex 2.2, Tables A-37,A-39, A-43 and A-45, A-46, and A-56 (heat content factor for Unspecified Residential/Com. from U.S. Energy InformationAdministration, Monthly Energy Review (January 2015), Table A-5) and ** derived from the API Compendium of GreenhouseGas Emissions Methodologies for the Oil and Gas Industry (August 2009), Section 3.6.3, Table 3-8. A fraction oxidized value of1.00 is from the Intergovernmental Panel on Climate Change (IPCC), Guidelines for National Greenhouse Gas Inventories(2006) and *** EPA Climate Leaders Technical Guidance (2008) Table B-2. n/a= data not available. NOTE: Where not provided from the EPA Final Mandatory Reporting of Greenhouse Gases Rule, default CO2 emission factors(per unit energy) are calculated as: Carbon Content × Fraction Oxidized × 44/12. Default CO2 emission factors (per unit massor volume) are calculated using the equation: Heat Content × Carbon Content × Fraction Oxidized × 44/12 × Conversion Factor(if applicable).
2015 Climate Registry Default Emission Factors Released April 2015
Page 6 of 79

Table 12.2 Canadian Default Factors for Calcula ng CO2 Emissions fromCombus on of Natural Gas, Petroleum Products, and Biomass
CarbonContent
(Per UnitEnergy)
HeatContent
FractionOxidized
CO2 Emission Factor (Per Unit Mass or
Volume)Fuel Type
Natural Gas kg C / GJ GJ / megalitre g CO2 / m3
n/aElectric Utilities, Industry, Commercial, Pipelines,Agriculture, Residential* 38.74 1 1900.455
n/aProducer Consumption* 38.74 1 2400.945
Newfoundland and Labrador
n/aMarketable 38.74 1 1900.455
n/aNonMarketable 38.74 1 2494.41
Nova Scotia
n/aMarketable 38.74 1 1900.455
n/aNonMarketable 38.74 1 2494.41
New Brunswick
n/aMarketable 38.74 1 1900.455
n/aNonMarketable 38.74 1 n/o
Quebec
2015 Climate Registry Default Emission Factors Released April 2015
Page 7 of 79
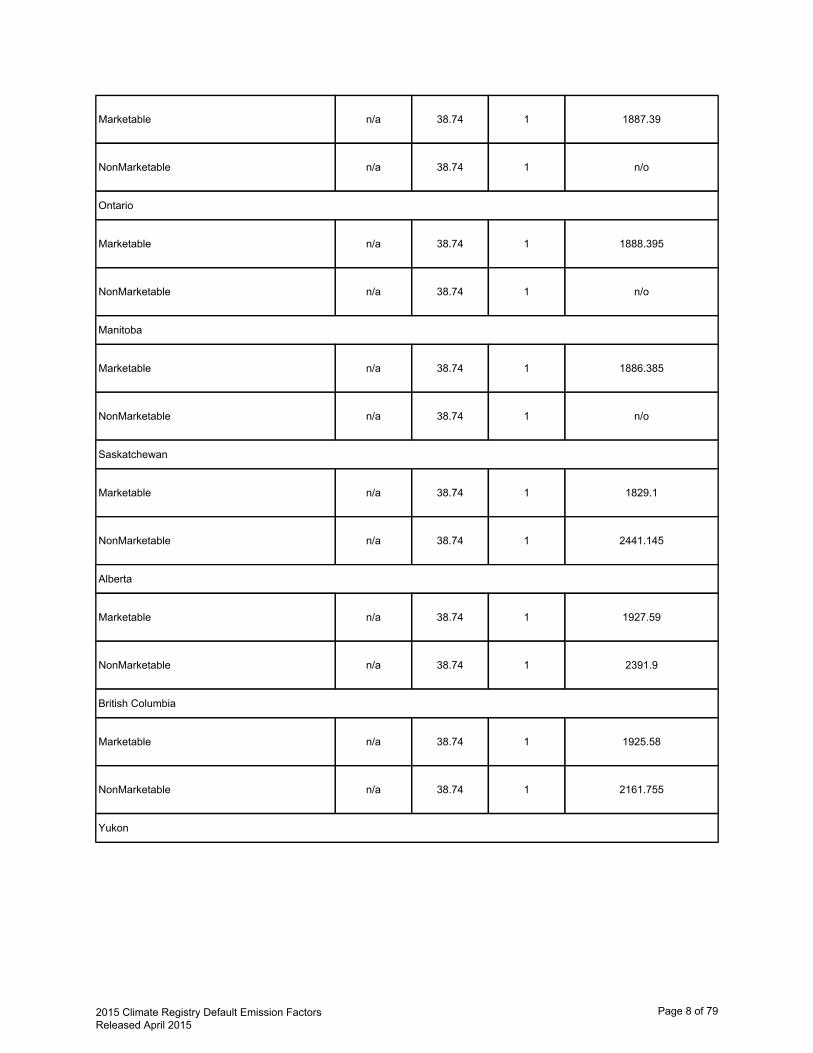
n/aMarketable 38.74 1 1887.39
n/aNonMarketable 38.74 1 n/o
Ontario
n/aMarketable 38.74 1 1888.395
n/aNonMarketable 38.74 1 n/o
Manitoba
n/aMarketable 38.74 1 1886.385
n/aNonMarketable 38.74 1 n/o
Saskatchewan
n/aMarketable 38.74 1 1829.1
n/aNonMarketable 38.74 1 2441.145
Alberta
n/aMarketable 38.74 1 1927.59
n/aNonMarketable 38.74 1 2391.9
British Columbia
n/aMarketable 38.74 1 1925.58
n/aNonMarketable 38.74 1 2161.755
Yukon
2015 Climate Registry Default Emission Factors Released April 2015
Page 8 of 79

n/aMarketable 38.74 1 1900.455
n/aNonMarketable 38.74 1 2400.945
Northwest Territories
n/aMarketable 38.74 1 2466.27
n/aNonMarketable 38.74 1 2466.27
Natural Gas Liquids kg C / GJ GJ / Kilolitre g CO2 / L
n/aPropane: Residential Propane 25.31 1 1514.535
n/aPropane: Other Uses Propane 25.31 1 1514.535
n/aEthane 17.22 1 980.88
n/aButane 28.44 1 1738.65
n/aRefinery LPGs (All Stationary) n/a 1 1629.13
Petroleum Products kg C / GJ GJ / Kilolitre g CO2 / L
n/aLight Fuel Oil Electric Utilities 38.8 1 2752.25
n/aLight Fuel Oil Industrial 38.8 1 2752.25
n/aLight Fuel Oil Producer Consumption 38.8 1 2669.43
2015 Climate Registry Default Emission Factors Released April 2015
Page 9 of 79

n/aLight Fuel Oil Residential 38.8 1 2752.25
n/aLight Fuel Oil Forestry, Construction, PublicAdministration, Commercial/Institutional 38.8 1 2752.25
n/aHeavy Fuel Oil (Electric Utility, Industrial,Forestry, Construction, Public Administration,Commercial/Institutional)
42.5 1 3155.24
n/aHeavy Fuel Oil (Residential) 42.5 1 3155.24
n/aHeavy Fuel Oil (Producer Consumption) 42.5 1 3189.58
n/aKerosene (Electric Utility, Industrial, ProducerConsumption, Residential, Forestry, Construction,Public Administration, Commercial/Institutional)
37.68 1 2559.34
n/aDiesel 38.3 1 2689.63
n/aPetroleum Coke from Upgrading Facilities 40.57 1 3528.94
n/aPetroleum Coke from Refineries & Others 46.35 1 3852.14
n/aStill gas(Upgrading Facilities) 43.24 1 2161.4
n/aStill gas(Refineries & Others) 36.08 1 1616
Biomass kg C / GJ GJ / t g CO2 / kg
n/aWood Fuel/Wood Waste 18 1 848.4
n/aSpent Pulping Liquor 14 1 935.55
n/aLandfill Gas n/a 1 2752
2015 Climate Registry Default Emission Factors Released April 2015
Page 10 of 79

Source: Default CO2 emission factors: Environment Canada, National Inventory Report, 1990-2012: Greenhouse Gas Sourcesand Sinks in Canada (2014), Annex 8: Emission Factors, Tables A8-1, A8-3, A8-4, A8-5, A8-26 and A8-27. Except those markedwith * are from Environment Canada, National Inventory Report, 1990-2006: Greenhouse Gas Sources and Sinks in Canada(2008), Annex 12: Emission Factors, Table A12-1; Default Heat Content: Statistics Canada, Report on Energy Supply andDemand in Canada, 2012-Preliminary (2014), Energy conversion factors, p. 122; Default Carbon Content: Canada-specific carboncontent coefficients are not available. If you cannot obtain measured carbon content values specific to your fuels, you should usethe default emission factor; Default Fraction Oxidized: Intergovernmental Panel on Climate Change (IPCC), Guidelines forNational Greenhouse Gas Inventories (2006). Note: CO2 emission factors from Environment Canada originally included fraction oxidized factors of less than 100%. Valueswere converted to include a 100% oxidation rate using 99.5% for natural gas and NGLs; 99% for petroleum products and woodfuel/wood waste; and 95% for spent pulping liquor based on the rates used to calculate the original factors. n/a=data notavailable. n/o=not occurring.

Table 12.3 Canadian Default Factors for Calcula ng CO2 Emissions fromCombus on of Coal
Carbon Content Heat Content FractionOxidized
CO2 EmissionFactorProvince and Coal Type
kg C / GJ GJ / t g CO2 / kgNewfoundland and Labrador
Canadian Bituminous n/a 28.96 1 2211.9
Foreign Bituminous n/a 29.82 1 2570.45
kg C / GJ GJ / t g CO2 / kgPrince Edward Island
Canadian Bituminous n/a 28.96 1 2211.9
Foreign Bituminous n/a 29.82 1 2570.45
kg C / GJ GJ / t g CO2 / kgNova Scotia
Canadian Bituminous n/a 28.96 1 2211.9
Foreign Bituminous n/a 29.82 1 2570.45
kg C / GJ GJ / t g CO2 / kgNew Brunswick
Canadian Bituminous n/a 26.8 1 2333.1
Foreign Bituminous n/a 29.82 1 2570.45
2015 Climate Registry Default Emission Factors Released April 2015
Page 12 of 79

kg C / GJ GJ / t g CO2 / kgQuebec
Canadian Bituminous n/a 28.96 1 2211.9
Foreign Bituminous n/a 29.82 1 2626
kg C / GJ GJ / t g CO2 / kgOntario
Canadian Bituminous n/a 25.43 1 2211.9
Foreign Bituminous n/a 29.82 1 2626
Foreign Sub-Bituminous n/a 19.15 1 1743.26
kg C / GJ GJ / t g CO2 / kgManitoba
Foreign Sub-Bituminous n/a 19.15 1 1743.26
kg C / GJ GJ / t g CO2 / kgSaskatchewan
Canadian Bituminous n/a 25.43 1 2211.9
Canadian Sub-Bituminous n/a 19.15 1 1762.45
Lignite n/a 15 1 1464.5
kg C / GJ GJ / t g CO2 / kgAlberta
Canadian Bituminous n/a 25.43 1 2211.9
Canadian Sub-Bituminous n/a 19.15 1 1762.45
2015 Climate Registry Default Emission Factors Released April 2015
Page 13 of 79
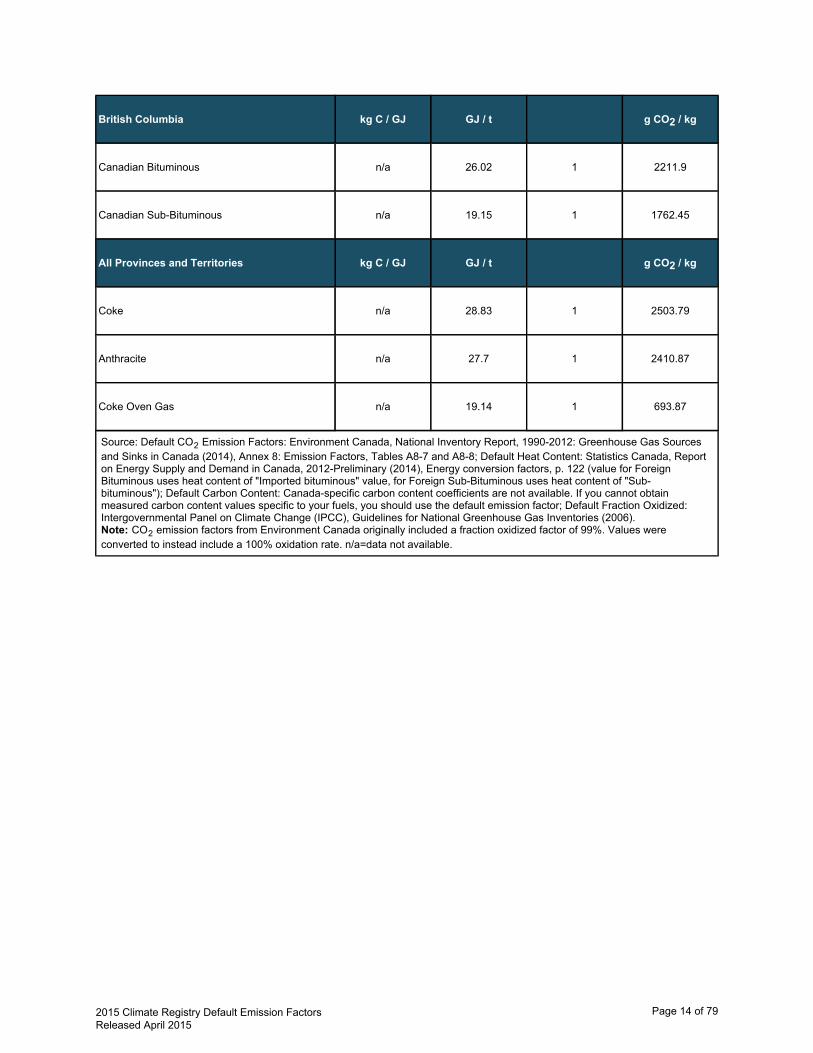
kg C / GJ GJ / t g CO2 / kgBritish Columbia
Canadian Bituminous n/a 26.02 1 2211.9
Canadian Sub-Bituminous n/a 19.15 1 1762.45
kg C / GJ GJ / t g CO2 / kgAll Provinces and Territories
Coke n/a 28.83 1 2503.79
Anthracite n/a 27.7 1 2410.87
Coke Oven Gas n/a 19.14 1 693.87
Source: Default CO2 Emission Factors: Environment Canada, National Inventory Report, 1990-2012: Greenhouse Gas Sourcesand Sinks in Canada (2014), Annex 8: Emission Factors, Tables A8-7 and A8-8; Default Heat Content: Statistics Canada, Reporton Energy Supply and Demand in Canada, 2012-Preliminary (2014), Energy conversion factors, p. 122 (value for ForeignBituminous uses heat content of "Imported bituminous" value, for Foreign Sub-Bituminous uses heat content of "Sub-bituminous"); Default Carbon Content: Canada-specific carbon content coefficients are not available. If you cannot obtainmeasured carbon content values specific to your fuels, you should use the default emission factor; Default Fraction Oxidized:Intergovernmental Panel on Climate Change (IPCC), Guidelines for National Greenhouse Gas Inventories (2006). Note: CO2 emission factors from Environment Canada originally included a fraction oxidized factor of 99%. Values wereconverted to instead include a 100% oxidation rate. n/a=data not available.
2015 Climate Registry Default Emission Factors Released April 2015
Page 14 of 79
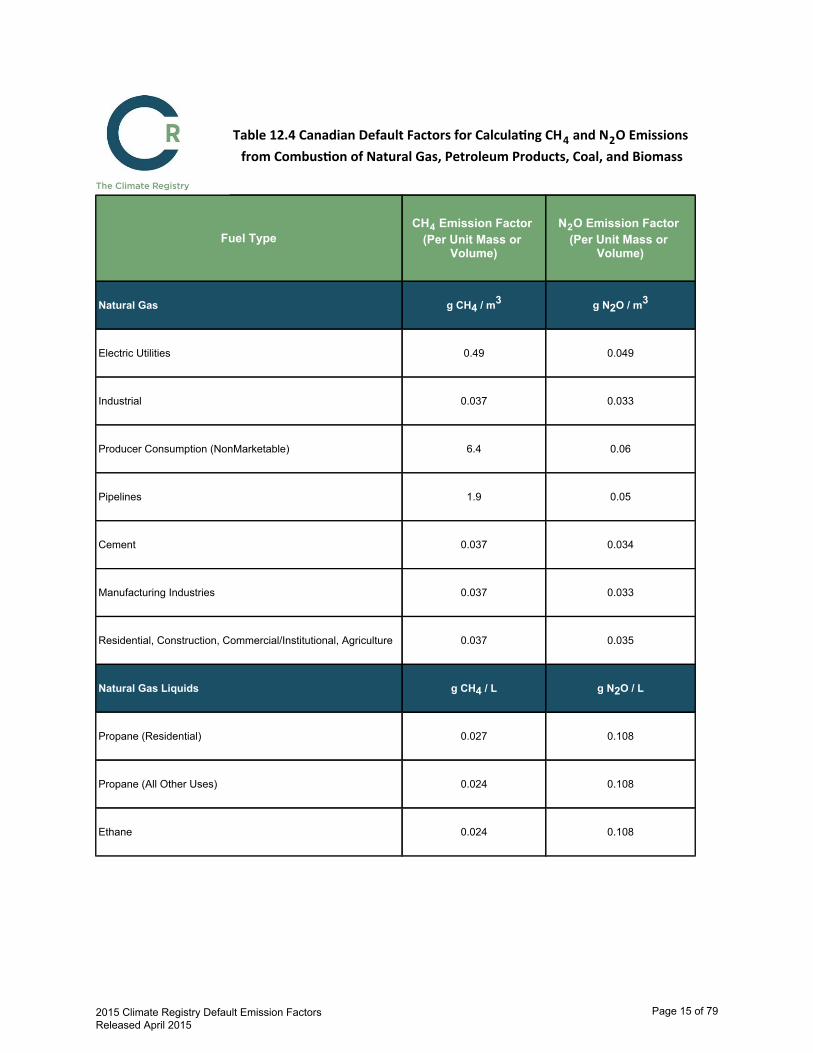
Table 12.4 Canadian Default Factors for Calcula ng CH4 and N2O Emissionsfrom Combus on of Natural Gas, Petroleum Products, Coal, and Biomass
Fuel TypeCH4 Emission Factor
(Per Unit Mass orVolume)
N2O Emission Factor(Per Unit Mass or
Volume)
Natural Gas g CH4 / m3 g N2O / m3
Electric Utilities 0.49 0.049
Industrial 0.037 0.033
Producer Consumption (NonMarketable) 6.4 0.06
Pipelines 1.9 0.05
Cement 0.037 0.034
Manufacturing Industries 0.037 0.033
Residential, Construction, Commercial/Institutional, Agriculture 0.037 0.035
Natural Gas Liquids g CH4 / L g N2O / L
Propane (Residential) 0.027 0.108
Propane (All Other Uses) 0.024 0.108
Ethane 0.024 0.108
2015 Climate Registry Default Emission Factors Released April 2015
Page 15 of 79

Butane 0.024 0.108
Refinery LPGs 0.024 0.108
Refined Petroleum Products g CH4 / L g N2O / L
Light Fuel Oil (Electric Utilities) 0.18 0.031
Light Fuel Oil (Industrial and Producer Consumption) 0.006 0.031
Light Fuel Oil (Residential) 0.026 0.006
Light Fuel Oil (Forestry, Construction, Public Administration,and Commercial/Institutional) 0.026 0.031
Heavy Fuel Oil (Electric Utilities) 0.034 0.064
Heavy Fuel Oil (Industrial and Producer Consumption) 0.12 0.064
Heavy Fuel Oil (Residential, Forestry, Construction, PublicAdministration, and Commercial/Institutional) 0.057 0.064
Kerosene (Electric Utilities, Industrial, and ProducerConsumption) 0.006 0.031
Kerosene (Residential) 0.026 0.006
Kerosene (Forestry, Construction, Public Administration, andCommercial/Institutional) 0.026 0.031
Diesel (Refineries and Others) 0.133 0.4
Diesel (Upgraders) 0.15 1.1
Still Gas n/a 2E-05
2015 Climate Registry Default Emission Factors Released April 2015
Page 16 of 79

Petroleum Coke g CH4 / L g N2O / L
Upgrading Facilities 0.12 0.024
Refineries & Others 0.12 0.0275
Coal g CH4 / kg g N2O / kg
Coal (Electric Utilities) 0.02 0.03
Coal (Industry and Heat & Steam Plants) 0.03 0.02
Coal (Residential, Public Administration) 4 0.02
Coke 0.03 0.02
Coal(gas) g CH4 / m3 g N2O / m3
Coke Oven Gas 0.04 0.04
Biomass g CH4 / kg g N2O / kg
Wood Fuel/Wood Waste (Industrial Combustion) 0.09 0.06
Spent Pulping Liquor (Industrial Combustion) 0.02 0.02
Stoves and Fireplaces (Advance Technology or CatalyticControl) 6.9 0.16
Stoves and Fireplaces (Conventional, Inserts, and Other Wood-Burning Equipment) 15 0.16
Landfill Gas kg CH4 / t kg N2O / t
2015 Climate Registry Default Emission Factors Released April 2015
Page 17 of 79

Landfill Gas (Industrial Combustion) 0.05 0.005
Source: Environment Canada, National Inventory Report, 1990-2012: Greenhouse Gas Sources and Sinks in Canada(2014), Annex 8: Emission Factors, Tables A8-2, A8-3, A8-4, A8-6, A8-9, A8-26, and A-27. n/a=data not available.
2015 Climate Registry Default Emission Factors Released April 2015
Page 18 of 79

Table 12.5 Default CH4and N2O Emission Factors by Technology Type for theElectricity Genera on Sector
Fuel Type and Basic Technology Configuration CH4 (g /MMBtu)
N2O(g / MMBtu)
Liquid Fuels
Residual Fuel Oil/Shale Oil Boilers Normal Firing .8 .3
Residual Fuel Oil/Shale Oil Boilers Tangential Firing .8 .3
Gas/Diesel Oil Boilers Normal Firing .9 .4
Gas/Diesel Oil Boilers Tangential Firing .9 .4
Large Diesel Oil Engines >600hp (447kW) 4.01 n/a
Solid Fuels
Pulverized Bituminous Combustion Boilers Dry Bottom, wall fired .7 .5
Pulverized Bituminous Combustion Boilers Dry Bottom, tangentially fired .7 1.4
Pulverized Bituminous Combustion Boilers Wet Bottom .9 1.4
Bituminous Spreader Stoker Boilers With and without re-injection 1 .7
Bituminous Fluidized Bed Combustor Circulating Bed 1 61.14
2015 Climate Registry Default Emission Factors Released April 2015
Page 19 of 79
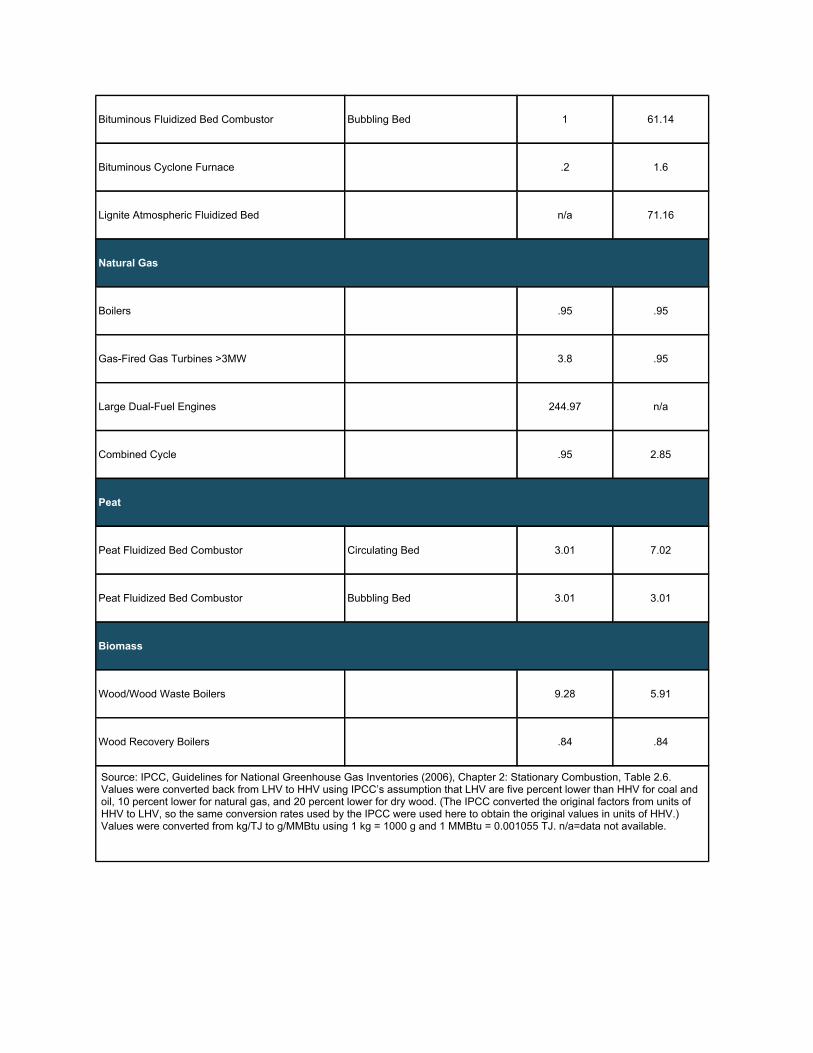
Bituminous Fluidized Bed Combustor Bubbling Bed 1 61.14
Bituminous Cyclone Furnace .2 1.6
Lignite Atmospheric Fluidized Bed n/a 71.16
Natural Gas
Boilers .95 .95
Gas-Fired Gas Turbines >3MW 3.8 .95
Large Dual-Fuel Engines 244.97 n/a
Combined Cycle .95 2.85
Peat
Peat Fluidized Bed Combustor Circulating Bed 3.01 7.02
Peat Fluidized Bed Combustor Bubbling Bed 3.01 3.01
Biomass
Wood/Wood Waste Boilers 9.28 5.91
Wood Recovery Boilers .84 .84
Source: IPCC, Guidelines for National Greenhouse Gas Inventories (2006), Chapter 2: Stationary Combustion, Table 2.6.Values were converted back from LHV to HHV using IPCC’s assumption that LHV are five percent lower than HHV for coal andoil, 10 percent lower for natural gas, and 20 percent lower for dry wood. (The IPCC converted the original factors from units ofHHV to LHV, so the same conversion rates used by the IPCC were used here to obtain the original values in units of HHV.)Values were converted from kg/TJ to g/MMBtu using 1 kg = 1000 g and 1 MMBtu = 0.001055 TJ. n/a=data not available.

Table 12.6 Default CH4 and N2O Emission Factors for Kilns, Ovens, and Dryers
Industry Source CH4 (g /MMBtu)
N2O (g /MMBtu)
Cement, Lime Kilns - Natural Gas 1.04 n/a
Cement, Lime Kilns – Oil 1.0 n/a
Cement, Lime Kilns – Coal 1.0 n/a
Coking, Steel Coke Oven 1.0 n/a
Chemical Processes, Wood, Asphalt, Copper,Phosphate Dryer - Natural Gas 1.04 n/a
Chemical Processes, Wood, Asphalt, Copper,Phosphate Dryer – Oil 1.0 n/a
Chemical Processes, Wood, Asphalt, Copper,Phosphate Dryer – Coal 1.0 n/a
Source: IPCC, Guidelines for National Greenhouse Gas Inventories (2006), Chapter 2: Stationary Combustion, Table 2.8.Values were converted back from LHV to HHV using IPCC's assumption that LHV are five percent lower than HHV for coal andoil and 10 percent lower for natural gas. Values were converted from kg/TJ to g/MMBtu using 1 kg = 1000 g and 1 MMBtu =0.001055 TJ. n/a=data not available.

Table 12.7 Default CH4 and N2O Emission Factors by Technology Type for theIndustrial Sector
Fuel Type and Basic Technology Configuration CH4 (g / MMBtu) N2O (g / MMBtu)
Liquid Fuels
Residual Fuel Oil Boilers 3.01 .3
Gas/Diesel Oil Boilers .2 .4
Large Stationary Diesel Oil Engines >600hp(447 kW) 4.01 n/a
Liquefied Petroleum Gases Boilers .9 4.01
Solid Fuels
Other Bituminous/Sub-bit. Overfeed StokerBoilers 1 .7
Other Bituminous/Sub-bit. Underfeed StokerBoilers 14.03 .7
Other Bituminous/Sub-bituminous Pulverized Dry Bottom, wall fired .7 .5
Other Bituminous/Sub-bituminous Pulverized Dry Bottom, tangentially fired .7 1.4
Other Bituminous/Sub-bituminous Pulverized Wet Bottom .9 1.4
Other Bituminous Spreader Stokers 1 .7
Other Bituminous/Sub-bit. Fluidized BedCombustor Circulating Bed 1 61.14
Other Bituminous/Sub-bit. Fluidized BedCombustor Bubbling Bed 1 61.14
Natural Gas
Boilers .95 .95
2015 Climate Registry Default Emission Factors Released April 2015
Page 22 of 79
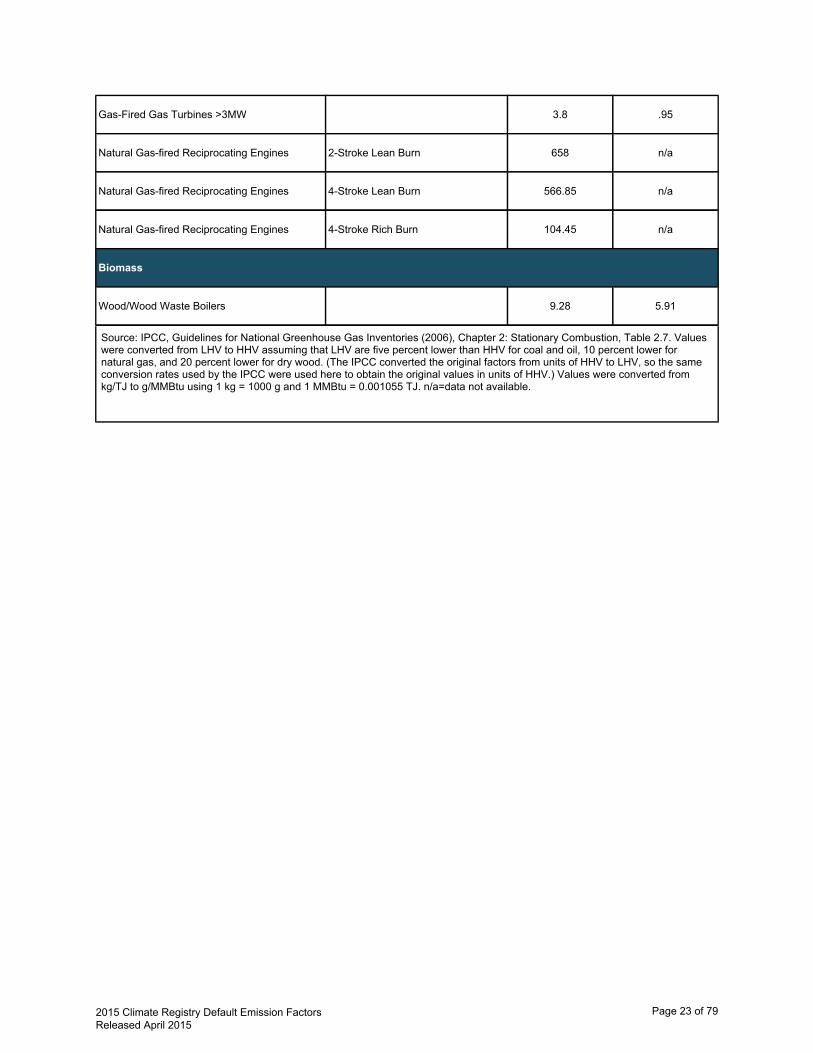
Gas-Fired Gas Turbines >3MW 3.8 .95
Natural Gas-fired Reciprocating Engines 2-Stroke Lean Burn 658 n/a
Natural Gas-fired Reciprocating Engines 4-Stroke Lean Burn 566.85 n/a
Natural Gas-fired Reciprocating Engines 4-Stroke Rich Burn 104.45 n/a
Biomass
Wood/Wood Waste Boilers 9.28 5.91
Source: IPCC, Guidelines for National Greenhouse Gas Inventories (2006), Chapter 2: Stationary Combustion, Table 2.7. Valueswere converted from LHV to HHV assuming that LHV are five percent lower than HHV for coal and oil, 10 percent lower fornatural gas, and 20 percent lower for dry wood. (The IPCC converted the original factors from units of HHV to LHV, so the sameconversion rates used by the IPCC were used here to obtain the original values in units of HHV.) Values were converted fromkg/TJ to g/MMBtu using 1 kg = 1000 g and 1 MMBtu = 0.001055 TJ. n/a=data not available.
2015 Climate Registry Default Emission Factors Released April 2015
Page 23 of 79

Table 12.8 Default CH4 and N2O Emission Factors by Technology Type for theCommercial Sector
Fuel Type and Basic Technology Configuration CH4 (g / MMBtu) N2O (g / MMBtu)
Liquid Fuels
Residual Fuel Oil Boilers 1.4 .3
Gas/Diesel Oil Boilers .7 .4
Liquefied Petroleum Gases Boilers .9 4.01
Solid Fuels
Other Bituminous/Sub-bit. Overfeed StokerBoilers 1 .7
Other Bituminous/Sub-bit. Underfeed StokerBoilers 14.03 .7
Other Bituminous/Sub-bit. Hand-fed Units 87.2 .7
Other Bituminous/Sub-bituminous PulverizedBoilers Dry Bottom, wall fired .7 .5
Other Bituminous/Sub-bituminous PulverizedBoilers Dry Bottom, tangentially fired .7 1.4
Other Bituminous/Sub-bituminous PulverizedBoilers Wet Bottom .9 1.4
Other Bituminous Spreader Stokers 1 .7
Other Bituminous/Sub-bit. Fluidized BedCombustor Circulating Bed 1 61.14
Other Bituminous/Sub-bit. Fluidized BedCombustor Bubbling Bed 1 61.14
Natural Gas
Boilers .95 .95
2015 Climate Registry Default Emission Factors Released April 2015
Page 24 of 79

Gas-Fired Gas Turbines >3MWa 3.8 1.33
Biomass
Wood/Wood Waste Boilers 9.28 5.91
Source: IPCC, Guidelines for National Greenhouse Gas Inventories (2006), Chapter 2: Stationary Combustion, Table 2.10. Valueswere converted from LHV to HHV assuming that LHV are five percent lower than HHV for coal and oil, 10 percent lower fornatural gas, and 20 percent lower for dry wood. (The IPCC converted the original factors from units of HHV to LHV, so the sameconversion rates used by the IPCC were used here to obtain the original values in units of HHV.) Values were converted fromkg/TJ to g/MMBtu using 1 kg = 1000 g and 1 MMBtu = 0.001055 TJ.
2015 Climate Registry Default Emission Factors Released April 2015
Page 25 of 79

Table 12.9.1 Default CH4 and N2O Emission Factors By Fuel TypeIndustrial and Energy Sectors
CH4 (kg / MMBtu) N2O (kg / MMBtu)Fuel Type / End-Use Sector
Coal
Industrial .01 .0016
Energy Industry .01 .0016
Coke
Industrial .01 .0016
Energy Industry .01 .0016
Petroleum Products
Industrial .003 .0006
Energy Industry .003 .0006
Natural Gas
Industrial .001 .0001
Energy Industry .001 .0001
Municipal Solid Waste
Industrial .03 .0042
Energy Industry .03 .0042
Tires
Industrial .03 .0042
Energy Industry .03 .0042
Blast Furnace Gas
Industrial .000022 .0001
Energy Industry .000022 .0001
2015 Climate Registry Default Emission Factors Released April 2015
Page 26 of 79

Coke Oven Gas
Industrial .00048 .0001
Energy Industry .00048 .0001
Biomass Fuels Solid
Industrial .03 .0042
Energy Industry .03 .0042
Biogas
Industrial .0032 .00063
Energy Industry .0032 .00063
Biomass Fuels Liquid
Industrial .0011 .00011
Energy Industry .0011 .00011
Pulping Liquors
Industrial* 0.0019 0.00042
Source: EPA Final Mandatory Reporting of Greenhouse Gases Rule Table C-2. Except those marked with * are fromTable AA-1.
2015 Climate Registry Default Emission Factors Released April 2015
Page 27 of 79

Fuel Type / End-Use Sector CH4 (g / MMBtu)
N2O (g / MMBtu)
Table 12.9.2 Default CH4 and N2O Emission Factors By Fuel TypeResiden al and Commercial Sectors
Coal
Residential 300.68 1.5
Commercial 10.02 1.5
Petroleum Products
Residential 10.02 .6
Commercial 10.02 .6
Natural Gas
Residential 4.75 .09
Commercial 4.75 .09
Wood
Residential 253.2 3.38
Commercial 253.2 3.38
Source: IPCC, Guidelines for National Greenhouse Gas Inventories (2006), Chapter 2: Stationary Combustion, Tables 2.4and 2.5. Values were converted from LHV to HHV assuming that LHV are five percent lower than HHV for coal and oil, 10percent lower for natural gas, and 20 percent lower for dry wood. (The IPCC converted the original factors from units ofHHV to LHV, so the same conversion rates used by the IPCC were used here to obtain the original values in units ofHHV.) Values were converted from kg/TJ to g/MMBtu using 1 kg = 1000 g and 1 MMBtu = 0.001055 TJ.
2015 Climate Registry Default Emission Factors Released April 2015
Page 28 of 79

Table 13.1 US Default CO2 Emission Factors for Transport Fuels
Fuel TypeCarbonContent(Per UnitEnergy)
HeatContent
FractionOxidized
CO2 Emission Factor (PerUnit Volume)
kg C / MMBtu MMBtu / barrel kg CO2 / gallonFuels Measured in Gallons
Gasoline 19.150909 5.25 1 8.7775
Diesel Fuel 20.170909 5.796 1 10.20648
Aviation Gasoline 18.886364 5.04 1 8.31
Jet Fuel (Jet A or A-1) 19.696364 5.67 1 9.7497
Kerosene 20.509091 5.67 1 10.152
Residual Fuel Oil No. 5 19.89 5.88 1 10.2102
Residual Fuel Oil No. 6 20.481818 6.3 1 11.265
Crude Oil 20.315455 5.796 1 10.28652
Biodiesel (B100) 20.138182 5.376 1 9.45152
Ethanol (E100) 18.665455 3.528 1 5.74896
Methanol* n/a n/a 1 4.1
Liquefied Natural Gas (LNG)* n/a n/a 1 4.46
Liquefied Petroleum Gas (LPG) 17.176364 3.864 1 5.67732
Propane (Liquid) 16.761818 3.822 1 5.72117
Ethane 17.083636 2.856 1 4.1124
Isobutane 17.702727 4.158 1 6.29918
Butane 17.768182 4.326 1 6.54177
kg C / MMBtuBtu /
Standard cubic foot
kg CO2 / Standard cubic footFuels Measured in Standard Cubic Feet
Compressed Natural Gas (CNG)* 14.47 1027 1 0.054
2015 Climate Registry Default Emission Factors Released April 2015
Page 29 of 79

Propane (Gas) 16.761818 2516 1 .154633
Source: Heat content and default emission factors are from EPA Final Mandatory Reporting of Greenhouse Gases Rule Table C-1. Carbon content derived using the heat content and default emission factor. Except those marked * are from EPA ClimateLeaders, Mobile Combustion Guidance, Tables B-4 and B-5 (2008). A fraction oxidized of 1.00 is from the IPCC, Guidelines forNational Greenhouse Gas Inventories (2006). Methanol emission factor is calculated from the properties of the pure compounds.n/a=data not available. Note: Carbon contents are calculated using the following equation: (Emission Factor / (44/12) / Heat Content x ConversionFactor. Heat content factors are based on higher heating values (HHV).
2015 Climate Registry Default Emission Factors Released April 2015
Page 30 of 79

Table 13.2 Canadian Default CO2 Emission Factors for Transport Fuels
Fuel TypeCarbonContent
(kg C / GJ)Heat
ContentFractionOxidized CO2 Emission Factors
GJ / kiloliter g CO2 / L
Motor Gasoline n/a 35 1 2311.89
Diesel n/a 38.3 1 2689.63
Light Fuel Oil n/a 38.8 1 2752.25
Heavy Fuel Oil n/a 42.5 1 3155.24
Aviation Gasoline n/a 33.52 1 2365.42
Aviation Turbo Fuel n/a 37.4 1 2559.34
Propane n/a 25.31 1 1529.605
Ethanol n/a n/a 1 1568.7
Biodiesel n/a n/a 1 2571.45
GJ / megaliter g CO2 / L
Natural Gas n/a 38.74 1 1.91835
Source: Default CO2 Emission Factors: Environment Canada, National Inventory Report, 1990-2012: Greenhouse Gas Sourcesand Sinks in Canada (2014) Annex 8: Emission Factors, Table A8-11; Default Heat Content: Statistics Canada, Report on EnergySupply and Demand in Canada, 2012-Preliminary (2014), Energy conversion factors, p. 122; Default Carbon Content: Notavailable for Canada, If you cannot obtain measured carbon content values specific to your fuels, you should use the defaultemission factor. Default Fraction Oxidized: A value of 1.00 is used following the Intergovernmental Panel on Climate Change(IPCC), Guidelines for National Greenhouse Gas Inventories (2006). Note: CO2 emission factors from Environment Canada originally included fraction oxidized factors of less than 100%. Valueswere converted to 100% oxidation rate using 99% for all fuels except natural gas and propane, where a value of 99.5% was used,and Ethanol and Biodiesel, where a value of 95% was used, based on the rates used to calculate the original factors.
2015 Climate Registry Default Emission Factors Released April 2015
Page 31 of 79

Table 13.3 Canadian Default Factors for Calcula ng CH4 and N2OEmissions from Mobile Combus on
Vehicle TypeCH4 Emission
Factor (g CH4/L)N2O Emission Factor
(g N2O/L)
Light-Duty Gasoline Vehicles (LDGVs)
Tier 2 0.14 0.022
Tier 1 0.23 0.47
Tier 0 0.32 0.66
Oxidation Catalyst 0.52 0.2
Non-Catalytic Controlled 0.46 0.028
Light-Duty Gasoline Trucks (LDGTs)
Tier 2 0.14 0.022
Tier 1 0.24 0.58
Tier 0 0.21 0.66
Oxidation Catalyst 0.43 0.2
Non-Catalytic Controlled 0.56 0.028
Heavy-Duty Gasoline Vehicles (HDGVs)
Three-Way Catalyst 0.068 0.2
Non-Catalytic Controlled 0.29 0.047
Uncontrolled 0.49 0.084
Gasoline Motorcycles
Non-Catalytic Controlled 0.77 0.041
Uncontrolled 2.3 0.048
Light-Duty Diesel Vehicles (LDDVs)
Advance Control* 0.051 0.22
2015 Climate Registry Default Emission Factors Released April 2015
Page 32 of 79

Moderate Control 0.068 0.21
Uncontrolled 0.1 0.16
Light-Duty Diesel Trucks (LDDTs)
Advance Control* 0.068 0.22
Moderate Control 0.068 0.21
Uncontrolled 0.085 0.16
Heavy-Duty Diesel Vehicles (HDDVs)
Advance Control 0.11 0.151
Moderate Control 0.14 0.082
Uncontrolled 0.15 0.075
Gas Fueled Vehicles
Natural Gas Vehicles 0.009 6E-05
Propane Vehicles 0.64 0.028
Off-Road Vehicles
Off-Road Gasoline 2.7 0.05
Off-Road Diesel 0.15 1.1
Railways
Diesel Train 0.15 1.1
Marine
Gasoline Boats 1.3 0.066
Diesel Ships 0.15 1.1
Light Fuel Oil Ships 0.26 0.073
Heavy Fuel Oil Ships 0.28 0.079
Aviation
Aviation Gasoline 2.2 0.23
Aviation Turbo Fuel 0.029 0.071
2015 Climate Registry Default Emission Factors Released April 2015
Page 33 of 79
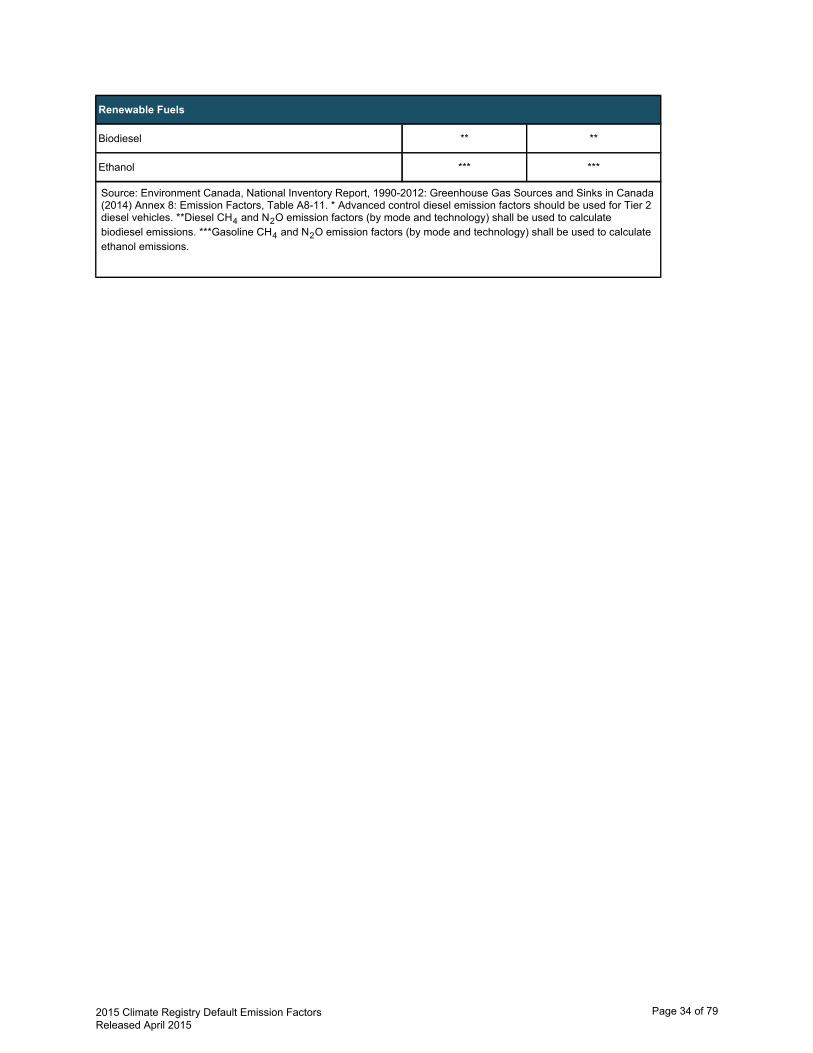
Renewable Fuels
Biodiesel ** **
Ethanol *** ***
Source: Environment Canada, National Inventory Report, 1990-2012: Greenhouse Gas Sources and Sinks in Canada(2014) Annex 8: Emission Factors, Table A8-11. * Advanced control diesel emission factors should be used for Tier 2diesel vehicles. **Diesel CH4 and N2O emission factors (by mode and technology) shall be used to calculatebiodiesel emissions. ***Gasoline CH4 and N2O emission factors (by mode and technology) shall be used to calculateethanol emissions.
2015 Climate Registry Default Emission Factors Released April 2015
Page 34 of 79

Table 13.4 Default CH4 and N2O Emission Factors for HighwayVehicles by Technology Type
Vehicle Type/Control Technology CH4 (g / mi) N2O (g / mi)
Gasoline Passenger Cars
EPA Tier 2 0.00360.0173
Low Emission Vehicles 0.0150.0105
EPA Tier 1 0.04290.0271
EPA Tier 0 0.06470.0704
Oxidation Catalyst 0.05040.1355
Non-Catalyst Control 0.01970.1696
Uncontrolled 0.01970.178
Gasoline Light Trucks (Vans, Pickup Trucks, SUVs)
EPA Tier 2 0.00660.0163
Low Emission Vehicles 0.01570.0148
EPA Tier 1 0.08710.0452
EPA Tier 0 0.10560.0776
Oxidation Catalyst 0.06390.1516
Non-Catalyst Control 0.02180.1908
Uncontrolled 0.0220.2024
Gasoline Medium and Heavy-Duty Vehicles Trucks and Busses
EPA Tier 2 0.01340.0333
Low Emission Vehicles 0.0320.0303
EPA Tier 1 0.1750.0655
EPA Tier 0 0.21350.263
2015 Climate Registry Default Emission Factors Released April 2015
Page 35 of 79

Oxidation Catalyst 0.13170.2356
Non-Catalyst Control 0.04730.4181
Uncontrolled 0.04970.4604
Diesel Passenger Cars
Advanced 0.0010.0005
Moderate 0.0010.0005
Uncontrolled 0.00120.0006
Diesel Light Trucks
Advanced 0.00150.001
Moderate 0.00140.0009
Uncontrolled 0.00170.0011
Diesel Medium and Heavy-Duty Vehicles (Trucks and Busses)
Aftertreatment 0.00480.0051
Advanced 0.00480.0051
Moderate 0.00480.0051
Uncontrolled 0.00480.0051
MotorcyclesMotorcycles
Non-Catalyst Control 0.00690.0672
Uncontrolled 0.00870.0899
Source: US Inventory of Greenhouse Gas Emissions and Sinks 1990-2012 (April 2014) Annex 3, Table A-105.
2015 Climate Registry Default Emission Factors Released April 2015
Page 36 of 79

Table 13.5 CH4 and N2O Emission Factors for Highway Vehicles byModel Year
CH4 (g / mi) N2O (g / mi)Vehicle Type and Year
Gasoline Passenger Cars
Model Years 1984-1993 0.0704 0.0647
Model Year 1994 0.0531 0.056
Model Year 1995 0.0358 0.0473
Model Year 1996 0.0272 0.0426
Model Year 1997 0.0268 0.0422
Model Year 1998 0.0249 0.0393
Model Year 1999 0.0216 0.0337
Model Year 2000 0.0178 0.0273
Model Year 2001 0.011 0.0158
Model Year 2002 0.0107 0.0153
Model Year 2003 0.0114 0.0135
Model Year 2004 0.0145 0.0083
Model Year 2005 0.0147 0.0079
Model Year 2006 0.0161 0.0057
Model Year 2007 0.017 0.0041
Model Year 2008 0.0172 0.0038
Model Year 2009 0.0173 0.0036
Model Year 2010 0.0173 0.0036
Model Year 2011 0.0173 0.0036
Model year 2012 0.0173 0.0036
2015 Climate Registry Default Emission Factors Released April 2015
Page 37 of 79
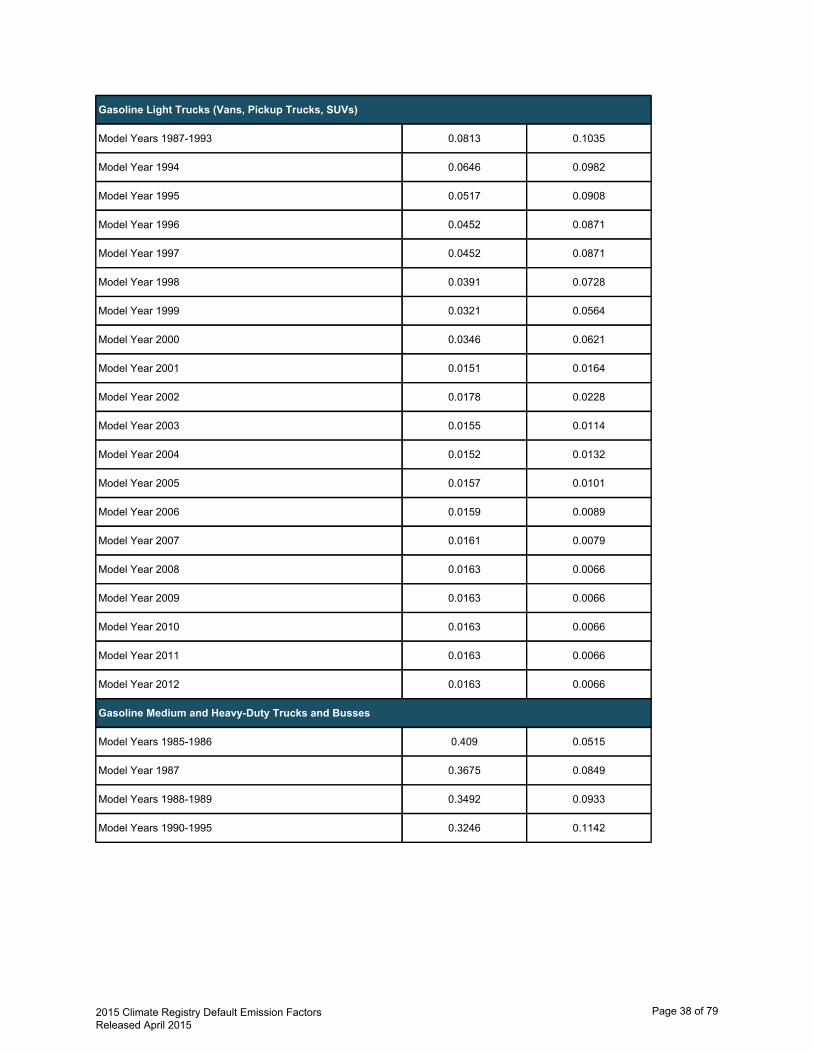
Gasoline Light Trucks (Vans, Pickup Trucks, SUVs)
Model Years 1987-1993 0.0813 0.1035
Model Year 1994 0.0646 0.0982
Model Year 1995 0.0517 0.0908
Model Year 1996 0.0452 0.0871
Model Year 1997 0.0452 0.0871
Model Year 1998 0.0391 0.0728
Model Year 1999 0.0321 0.0564
Model Year 2000 0.0346 0.0621
Model Year 2001 0.0151 0.0164
Model Year 2002 0.0178 0.0228
Model Year 2003 0.0155 0.0114
Model Year 2004 0.0152 0.0132
Model Year 2005 0.0157 0.0101
Model Year 2006 0.0159 0.0089
Model Year 2007 0.0161 0.0079
Model Year 2008 0.0163 0.0066
Model Year 2009 0.0163 0.0066
Model Year 2010 0.0163 0.0066
Model Year 2011 0.0163 0.0066
Model Year 2012 0.0163 0.0066
Gasoline Medium and Heavy-Duty Trucks and Busses
Model Years 1985-1986 0.409 0.0515
Model Year 1987 0.3675 0.0849
Model Years 1988-1989 0.3492 0.0933
Model Years 1990-1995 0.3246 0.1142
2015 Climate Registry Default Emission Factors Released April 2015
Page 38 of 79

Model Year 1996 0.1278 0.168
Model Year 1997 0.0924 0.1726
Model Year 1998 0.0641 0.1693
Model Year 1999 0.0578 0.1435
Model Year 2000 0.0493 0.1092
Model Year 2001 0.0528 0.1235
Model Year 2002 0.0526 0.1307
Model Year 2003 0.0533 0.124
Model Year 2004 0.0341 0.0285
Model Year 2005 0.0326 0.0177
Model Year 2006 0.0327 0.0171
Model Year 2007 0.033 0.0153
Model Year 2008 0.0333 0.0134
Model Year 2009 0.0333 0.0134
Model Year 2010 0.0333 0.0134
Model Year 2011 0.0333 0.0134
Model Year 2012 0.0333 0.0134
Diesel Passenger Cars
Model Years 1960-1982 0.0006 0.0012
Model Years 1983-2012 0.0005 0.001
Diesel Light Duty Trucks
Model Years 1960-1982 0.001 0.0017
Model Years 1983-1995 0.0009 0.0014
Model Years 1996-2012 0.001 0.0015
Diesel Medium and Heavy-Duty Trucks and Busses
All Model Years 1960-2012 0.0051 0.0048
2015 Climate Registry Default Emission Factors Released April 2015
Page 39 of 79

Source: US Inventory of Greenhouse Gas Emissions and Sinks 1990-2012 (April 2014) Annex 3, Tables A-101 - A-105.
2015 Climate Registry Default Emission Factors Released April 2015
Page 40 of 79
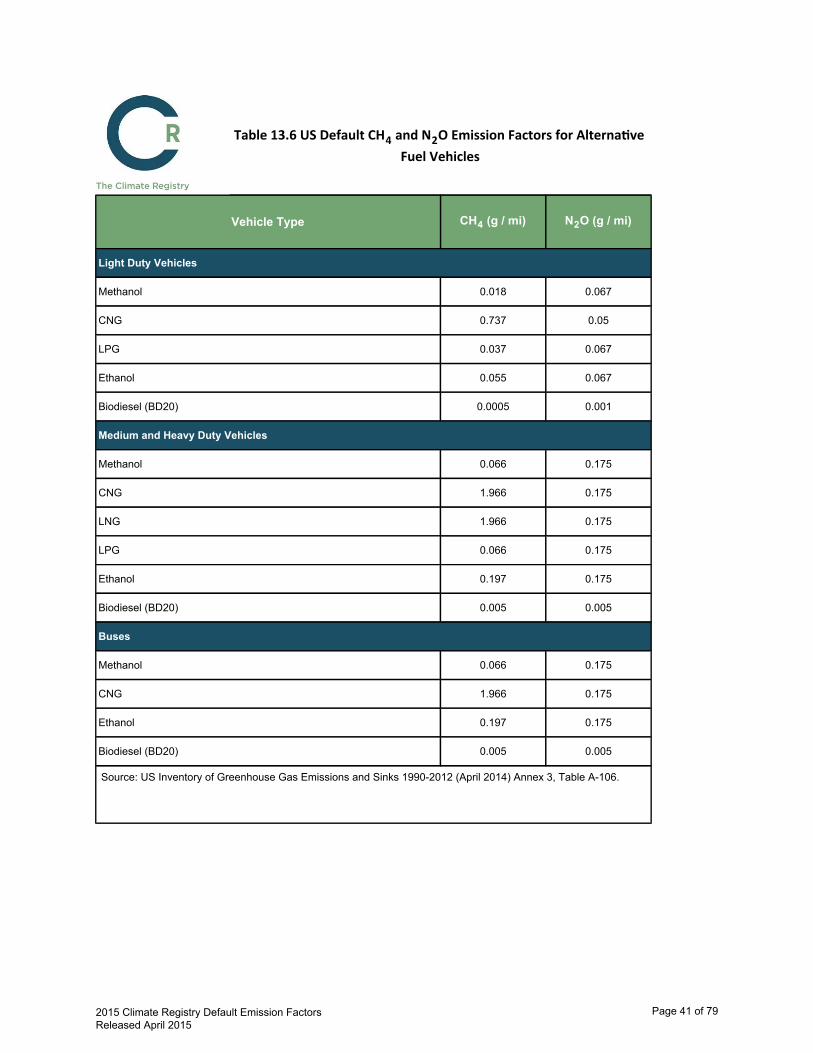
Table 13.6 US Default CH4 and N2O Emission Factors for Alterna veFuel Vehicles
CH4 (g / mi) N2O (g / mi)Vehicle Type
Light Duty Vehicles
Methanol 0.018 0.067
CNG 0.737 0.05
LPG 0.037 0.067
Ethanol 0.055 0.067
Biodiesel (BD20) 0.0005 0.001
Medium and Heavy Duty Vehicles
Methanol 0.066 0.175
CNG 1.966 0.175
LNG 1.966 0.175
LPG 0.066 0.175
Ethanol 0.197 0.175
Biodiesel (BD20) 0.005 0.005
Buses
Methanol 0.066 0.175
CNG 1.966 0.175
Ethanol 0.197 0.175
Biodiesel (BD20) 0.005 0.005
Source: US Inventory of Greenhouse Gas Emissions and Sinks 1990-2012 (April 2014) Annex 3, Table A-106.
2015 Climate Registry Default Emission Factors Released April 2015
Page 41 of 79
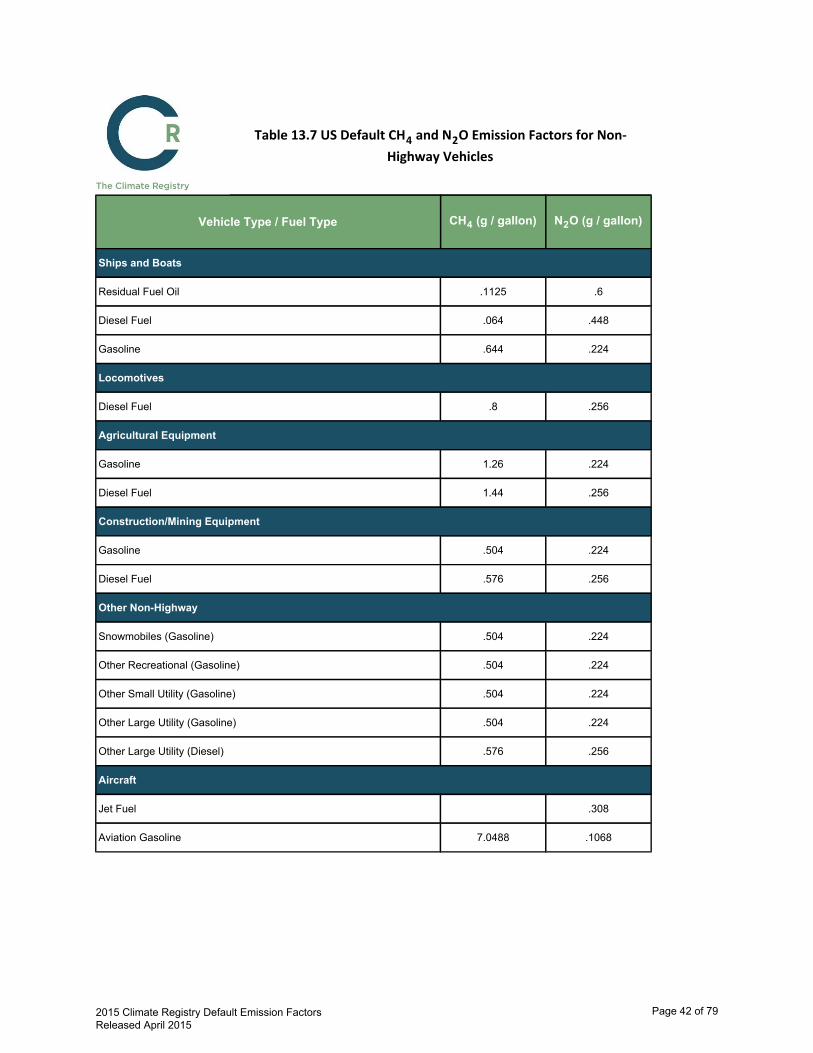
Table 13.7 US Default CH4 and N2O Emission Factors for Non-Highway Vehicles
CH4 (g / gallon) N2O (g / gallon)Vehicle Type / Fuel Type
Ships and Boats
Residual Fuel Oil .1125 .6
Diesel Fuel .064 .448
Gasoline .644 .224
Locomotives
Diesel Fuel .8 .256
Agricultural Equipment
Gasoline 1.26 .224
Diesel Fuel 1.44 .256
Construction/Mining Equipment
Gasoline .504 .224
Diesel Fuel .576 .256
Other Non-Highway
Snowmobiles (Gasoline) .504 .224
Other Recreational (Gasoline) .504 .224
Other Small Utility (Gasoline) .504 .224
Other Large Utility (Gasoline) .504 .224
Other Large Utility (Diesel) .576 .256
Aircraft
Jet Fuel .308
Aviation Gasoline 7.0488 .1068
2015 Climate Registry Default Emission Factors Released April 2015
Page 42 of 79

Source: US Inventory of Greenhouse Gas Emissions and Sinks 1990-2012 (April 2014) Annex 3, Table A-107.Original factors converted to g/gallon fuel using fuel density defaults from U.S. EPA Climate Leaders, MobileCombustion Guidance (2008) Table A-6.
2015 Climate Registry Default Emission Factors Released April 2015
Page 43 of 79
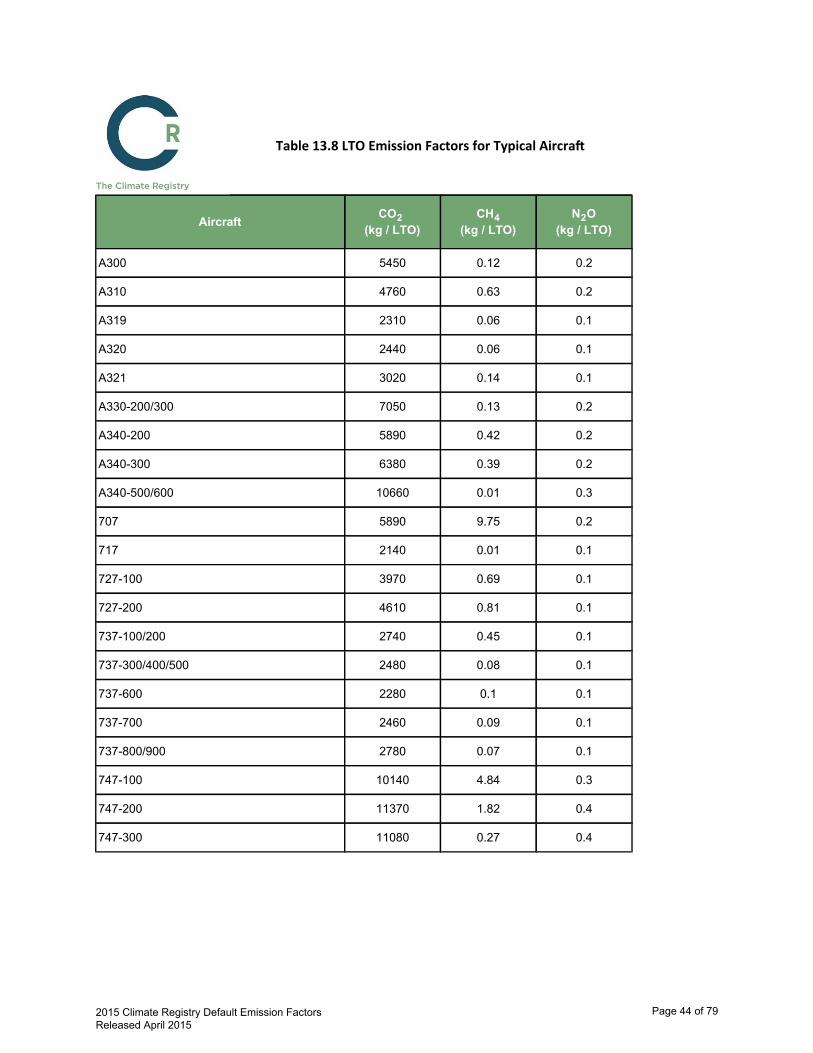
Table 13.8 LTO Emission Factors for Typical Aircra
CO2 (kg / LTO)
CH4 (kg / LTO)
N2O (kg / LTO)Aircraft
A300 5450 0.12 0.2
A310 4760 0.63 0.2
A319 2310 0.06 0.1
A320 2440 0.06 0.1
A321 3020 0.14 0.1
A330-200/300 7050 0.13 0.2
A340-200 5890 0.42 0.2
A340-300 6380 0.39 0.2
A340-500/600 10660 0.01 0.3
707 5890 9.75 0.2
717 2140 0.01 0.1
727-100 3970 0.69 0.1
727-200 4610 0.81 0.1
737-100/200 2740 0.45 0.1
737-300/400/500 2480 0.08 0.1
737-600 2280 0.1 0.1
737-700 2460 0.09 0.1
737-800/900 2780 0.07 0.1
747-100 10140 4.84 0.3
747-200 11370 1.82 0.4
747-300 11080 0.27 0.4
2015 Climate Registry Default Emission Factors Released April 2015
Page 44 of 79

747-400 10240 0.22 0.3
757-200 4320 0.02 0.1
757-300 4630 0.01 0.1
767-200 4620 0.33 0.1
767-300 5610 0.12 0.2
767-400 5520 0.1 0.2
777-200/300 8100 0.07 0.3
DC-10 7290 0.24 0.2
DC-8-50/60/70 5360 0.15 0.2
DC-9 2650 0.46 0.1
L-1011 7300 7.4 0.2
MD-11 7290 0.24 0.2
MD-80 3180 0.19 0.1
MD-90 2760 0.01 0.1
TU-134 2930 1.8 0.1
TU-154-M 5960 1.32 0.2
TU-154-B 7030 11.9 0.2
RJ-RJ85 1910 0.13 0.1
BAE 146 1800 0.14 0.1
CRJ-100ER 1060 0.06 0.03
ERJ-145 990 0.06 0.03
Fokker 100/70/28 2390 0.14 0.1
BAC111 2520 0.15 0.1
Dornier 328 Jet 870 0.06 0.03
Gulfstream IV 2160 0.14 0.1
Gulfstream V 1890 0.03 0.1
2015 Climate Registry Default Emission Factors Released April 2015
Page 45 of 79

Yak-42M 2880 0.25 0.1
Cessna 525/560 1070 0.33 0.03
Beech King Air 230 0.06 0.01
DHC8-100 640 0 0.02
ATR72-500 620 0.03 0.02
0 0 0
Source: IPCC, Guidelines for National Greenhouse Gas Inventories (2006), Volume 2: Energy, Chapter 3:Mobile Combustion, Table 3.6.9.
2015 Climate Registry Default Emission Factors Released April 2015
Page 46 of 79

Table 13.9 SEMS CH4 and N2OEmission Factors for Gasoline and
Diesel Vehicles
GHG MT GHG per MT of CO2
CH4 0.0000494
N2O 0.0000353
Source: Derived from EPA Inventory of U.S. GHG Emissions and Sinks 1990-2012 (April 2014), Table 2-15. Only includes data for passenger cars and light-duty trucks.
2015 Climate Registry Default Emission Factors Released April 2015
Page 47 of 79
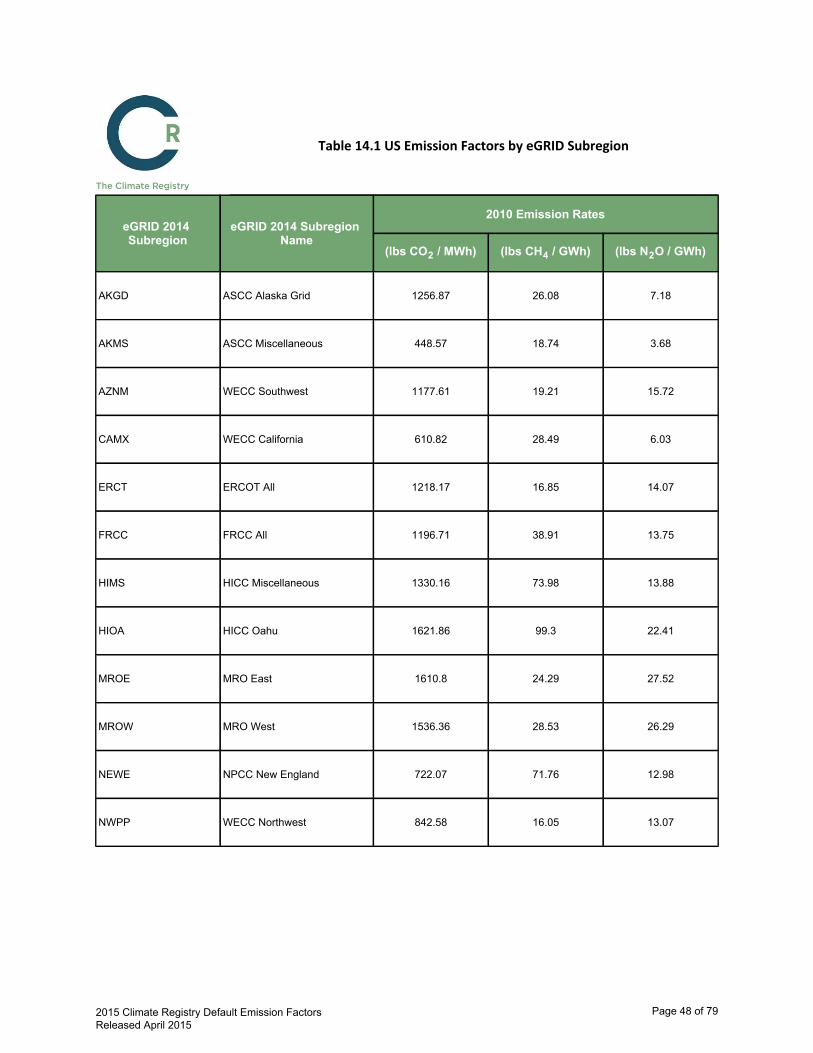
Table 14.1 US Emission Factors by eGRID Subregion
eGRID 2014Subregion
eGRID 2014 SubregionName
2010 Emission Rates
(lbs CO2 / MWh) (lbs CH4 / GWh) (lbs N2O / GWh)
AKGD ASCC Alaska Grid 1256.87 26.08 7.18
AKMS ASCC Miscellaneous 448.57 18.74 3.68
AZNM WECC Southwest 1177.61 19.21 15.72
CAMX WECC California 610.82 28.49 6.03
ERCT ERCOT All 1218.17 16.85 14.07
FRCC FRCC All 1196.71 38.91 13.75
HIMS HICC Miscellaneous 1330.16 73.98 13.88
HIOA HICC Oahu 1621.86 99.3 22.41
MROE MRO East 1610.8 24.29 27.52
MROW MRO West 1536.36 28.53 26.29
NEWE NPCC New England 722.07 71.76 12.98
NWPP WECC Northwest 842.58 16.05 13.07
2015 Climate Registry Default Emission Factors Released April 2015
Page 48 of 79
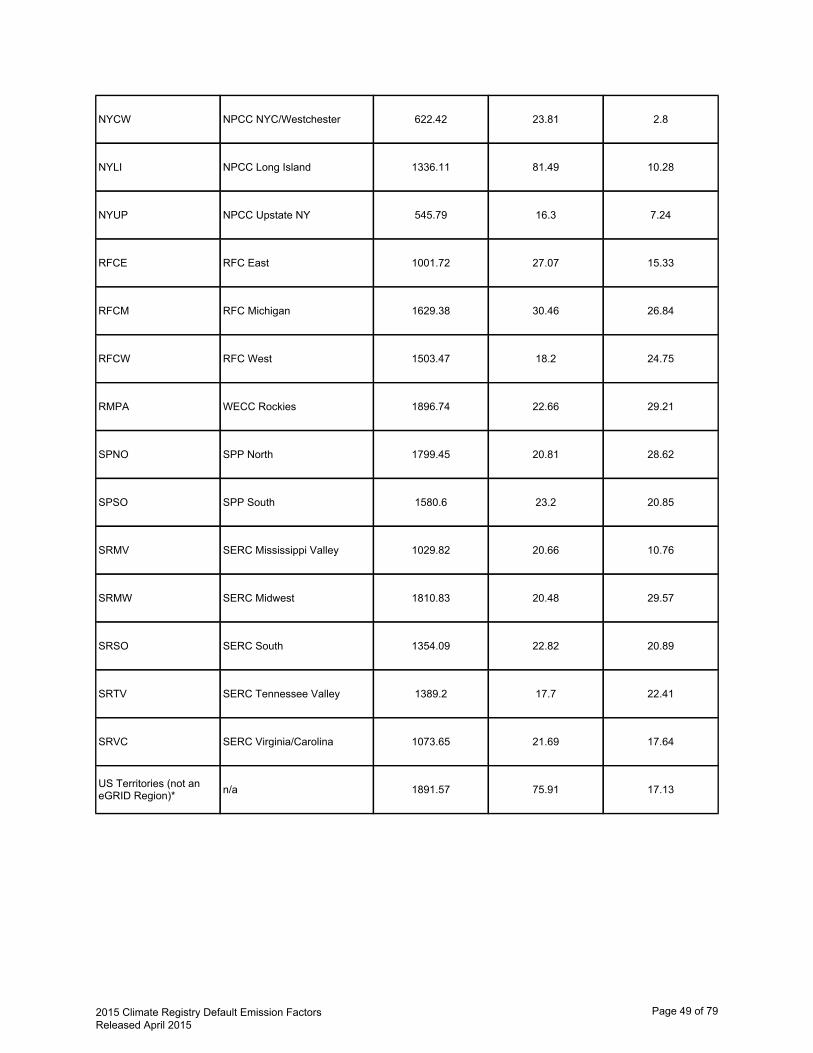
NYCW NPCC NYC/Westchester 622.42 23.81 2.8
NYLI NPCC Long Island 1336.11 81.49 10.28
NYUP NPCC Upstate NY 545.79 16.3 7.24
RFCE RFC East 1001.72 27.07 15.33
RFCM RFC Michigan 1629.38 30.46 26.84
RFCW RFC West 1503.47 18.2 24.75
RMPA WECC Rockies 1896.74 22.66 29.21
SPNO SPP North 1799.45 20.81 28.62
SPSO SPP South 1580.6 23.2 20.85
SRMV SERC Mississippi Valley 1029.82 20.66 10.76
SRMW SERC Midwest 1810.83 20.48 29.57
SRSO SERC South 1354.09 22.82 20.89
SRTV SERC Tennessee Valley 1389.2 17.7 22.41
SRVC SERC Virginia/Carolina 1073.65 21.69 17.64
US Territories (not aneGRID Region)* n/a 1891.57 75.91 17.13
2015 Climate Registry Default Emission Factors Released April 2015
Page 49 of 79

Source: U.S. EPA Year 2010 eGRID 9th edition Version 1.0 (February 2014: eGRID subregion annual CO2 total output emissionrate). Except * from Department of Energy Guidance on Voluntary Reporting of Greenhouse Gases, Form EIA-1605 (2007),Appendix F, Electricity Emission Factors, Table F-1. Factors do not include emissions from transmission and distribution losses.n/a=data not available.

Table 14.2 Canadian Emission Factors for Grid Electricity by Province
2011 Emission Rates
g CO2 / kWh g CH4 / kWh g N2O / kWhProvince
Alberta 0.03 0.01740
British Columbia 0.003 0.000413
Manitoba 0.0004 0.00013.3
New Brunswick 0.03 0.007430
Newfoundland and Labrador 0.0004 0.00121
Northwest Territories & Nunavut 0.02 0.04310
Nova Scotia 0.04 0.01740
Ontario 0.02 0.00292
Prince Edward Island 6E-05 0.00012.5
Quebec 0.0002 0.00012.2
Saskatchewan 0.03 0.02740
Yukon 0.003 0.0162
2015 Climate Registry Default Emission Factors Released April 2015
Page 51 of 79

Source: Greenhouse Gas Division, Environment Canada, National Inventory Report, 1990-2012: Greenhouse Gas Sourcesand Sinks in Canada (2014) Annex 13: Emission Factors, Table A13-2 - A13-13.
2015 Climate Registry Default Emission Factors Released April 2015
Page 52 of 79

Table 14.3 Mexican Emission Factors for Grid Electricity
Emission Rates (kg CO2e / MWh)Year
2000 604.1
2001 625
2002 600
2003 571.2
2004 549.6
2005 550.1
Source: Asociación de Técnicos y Profesionistas en Aplicación Energética (ATPAE), 2003, Metodologías para calcular elCoeficiente de Emisión Adecuado para Determinar las Reducciones de GEI Atribuibles a Proyectos de EE/ER –Justificación para la selección de la Metodología, versión final 4.1 (junio de 2003), proyecto auspiciado por la AgenciaInternacional de Estados Unidos para el Desarrollo Internacional, México, D.F., México. Note: Emission rates include emissions of CO2, CH4, and N2O. Factors are a national average of all the power plantsoperating and delivering electricity to the National Electric System and do not include transmission and distribution losses.Factors for 2002 to 2005 were not calculated with actual data but instead estimated using the Electricity Outlookspublished by Mexico’s Ministry of Energy.
2015 Climate Registry Default Emission Factors Released April 2015
Page 53 of 79

Table 14.4 Non-North American Emission Factors for Electricity Genera on
Region / Country / Economy 2010 Emission Rates g CO2 / kWh
2011 Emission Rates g CO2 / kWh
Albania 2 7
Algeria 548 556
Angola 440 390
Argentina 367 390
Armenia 92 123
Australia 841 823
Austria 188 215
Azerbaijan 439 455
Bahrain 640 601
Bangladesh 593 564
Belarus 449 441
Belgium 220 196
Benin 720 722
Bolivia 423 433
Bosnia and Herzegovina 723 794

Botswana 2517 1787
Brazil 87 68
Brunei Darussalam 717 717
Bulgaria 535 591
Cambodia 804 793
Cameroon 207 200
Chile 410 441
Chinese Taipei 624 601
Colombia 176 108
Congo 142 230
Costa Rica 56 64
Côte d'Ivoire 445 437
Croatia 236 334
Cuba 1012 955
Cyprus 697 732
Czech Republic 589 591
Dem. Rep. of Congo 3 3
Denmark 360 315
Dominican Republic 589 743

DPR of Korea 465 475
Ecuador 389 345
Egypt 450 457
El Salvador 223 243
Eritrea 646 849
Estonia 1014 1086
Ethiopia 7 7
Finland 229 191
France 79 61
FYR of Macedonia 685 811
Gabon 383 378
Georgia 69 102
Germany 461 477
Ghana 259 215
Gibraltar 762 752
Greece 718 720
Guatemala 286 286
Haiti 538 382
Honduras 332 371
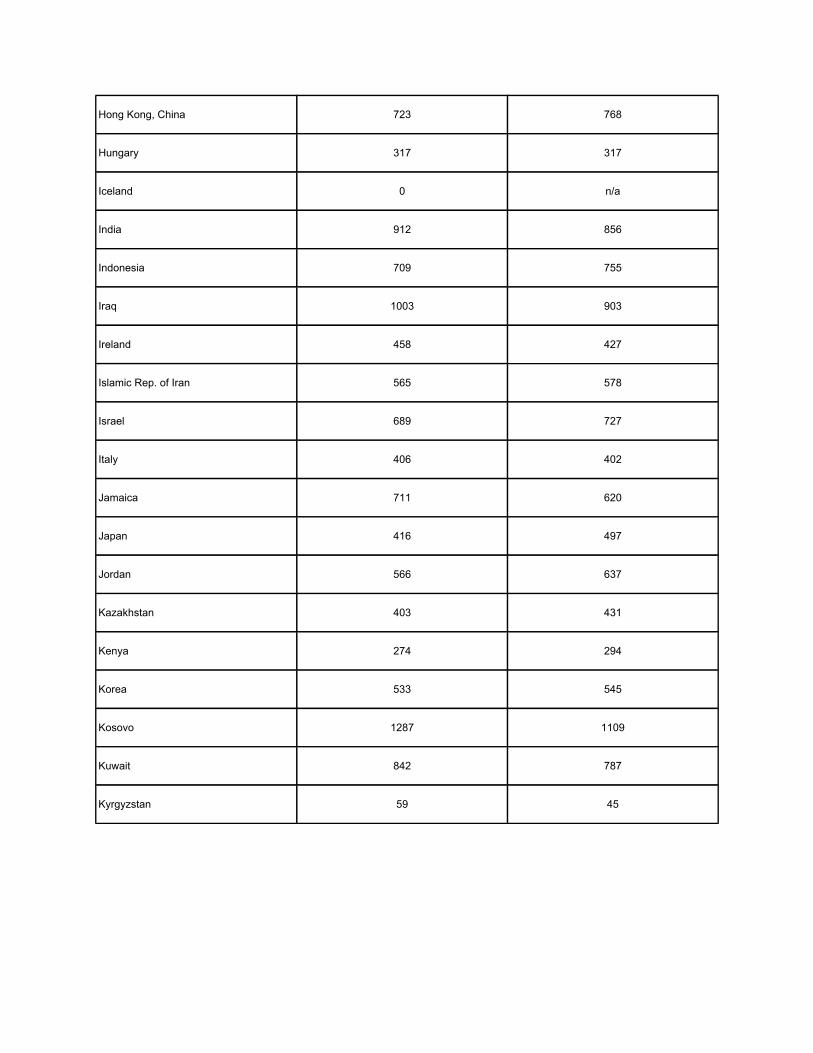
Hong Kong, China 723 768
Hungary 317 317
Iceland 0 n/a
India 912 856
Indonesia 709 755
Iraq 1003 903
Ireland 458 427
Islamic Rep. of Iran 565 578
Israel 689 727
Italy 406 402
Jamaica 711 620
Japan 416 497
Jordan 566 637
Kazakhstan 403 431
Kenya 274 294
Korea 533 545
Kosovo 1287 1109
Kuwait 842 787
Kyrgyzstan 59 45

Latvia 120 133
Lebanon 709 707
Libya 885 636
Lithuania 337 270
Luxembourg 410 387
Malaysia 727 688
Malta 872 862
Mauritius X X
Mongolia 949 837
Montenegro 405 653
Morocco 718 729
Mozambique 1 1
Myanmar 262 255
Namibia 197 24
Nepal 1 1
Netherlands 415 404
Netherlands Antilles 707 708
New Zealand 150 141
Nicaragua 460 471

Nigeria 405 433
Norway 17 13
Oman 794 741
Pakistan 425 409
Panama 298 357
Paraguay n/a n/a
People's Rep. of China 766 764
Peru 289 297
Philippines 481 492
Poland 781 780
Portugal 255 303
Qatar 494 490
Republic of Moldova 517 486
Romania 413 499
Russian Federation 384 437
Saudi Arabia 737 754
Senegal 637 689
Serbia 718 784
Singapore 499 500

Slovak Republic 197 200
Slovenia 325 338
South Africa 927 869
Spain 238 291
Sri Lanka 379 469
Sudan 344 204
Sweden 30 17
Switzerland 27 30
Syrian Arab Republic 594 602
Tajikistan 14 12
Thailand 513 522
Togo 195 206
Trinidad and Tobago 700 506
Tunisia 463 455
Turkey 460 472
Turkmenistan 954 983
Ukraine 392 450
United Arab Emirates 598 600
United Kingdom 457 441

United Rep. of Tanzania 329 288
Uruguay 81 197
Uzbekistan 550 559
Venezuela 264 234
Vietnam 432 429
Yemen 655 633
Zambia 3 3
Zimbabwe 660 358
Source: 2010 Emission Rates from CO2 Emissions from Fuel Combustion Highlights (2012 Edition © OECD/IEA), emission ratesin grams CO2 per kWh from electricity generation. 2011 Emission Rates from CO2 Emissions from Fuel Combustion Highlights(2013 Edition © OECD/IEA), emission rates in grams CO2 per kWh from electricity generation. Values were converted fromtonnes/tWh to g/kWh using 1 tonne = 1,000,000 g and 1 tWh = 1,000,000,000 kWh. n/a=data not available.

Table 14.5 Average Cost per Kilowa Hour by US State
State2013 Average Retail Price
Residential (¢/kWh)
2013 Average Retail PriceCommercial
(¢/kWh)
2013 Average Retail PriceIndustrial
(¢/kWh)
AK Total 18.12 15.58 15.83
AL Total 11.26 10.51 5.95
AR Total 9.59 8.05 6.04
AZ Total 11.71 9.85 6.66
CA Total 16.19 14.22 10.96
CO Total 11.93 9.86 7.34
CT Total 17.55 14.63 12.61
DC Total 12.57 11.94 5.54
DE Total 12.95 10.2 8.43
FL Total 11.27 9.39 7.61
GA Total 11.46 9.99 6.27
HI Total 36.98 34.05 29.87
IA Total 11.05 8.44 5.62
ID Total 9.32 7.37 6.1
IL Total 10.63 8.14 5.94
2015 Climate Registry Default Emission Factors Released April 2015
Page 62 of 79

IN Total 10.99 9.6 6.7
KS Total 11.64 9.68 7.39
KY Total 9.79 8.56 5.66
LA Total 9.43 8.96 5.92
MA Total 15.83 14.23 13.18
MD Total 13.25 10.68 8.36
ME Total 14.35 11.74 8.34
MI Total 14.59 11.06 7.72
MN Total 11.81 9.42 6.98
MO Total 10.6 8.8 6.29
MS Total 10.78 10.1 6.34
MT Total 10.33 9.54 5.43
NC Total 10.97 8.76 6.45
ND Total 9.12 8.39 7.13
NE Total 10.31 8.6 7.44
NH Total 16.33 13.52 11.4
NJ Total 15.73 12.77 10.8
NM Total 11.68 9.74 6.36
NV Total 11.89 9.01 6.52
2015 Climate Registry Default Emission Factors Released April 2015
Page 63 of 79
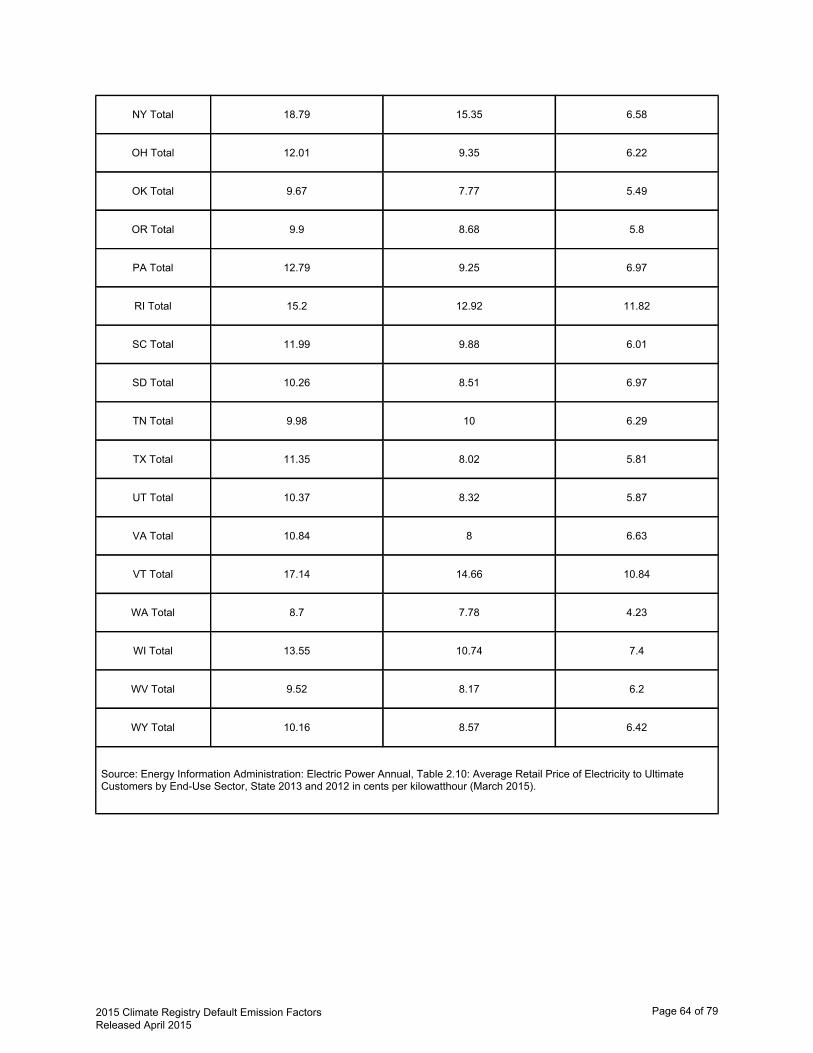
NY Total 18.79 15.35 6.58
OH Total 12.01 9.35 6.22
OK Total 9.67 7.77 5.49
OR Total 9.9 8.68 5.8
PA Total 12.79 9.25 6.97
RI Total 15.2 12.92 11.82
SC Total 11.99 9.88 6.01
SD Total 10.26 8.51 6.97
TN Total 9.98 10 6.29
TX Total 11.35 8.02 5.81
UT Total 10.37 8.32 5.87
VA Total 10.84 8 6.63
VT Total 17.14 14.66 10.84
WA Total 8.7 7.78 4.23
WI Total 13.55 10.74 7.4
WV Total 9.52 8.17 6.2
WY Total 10.16 8.57 6.42
Source: Energy Information Administration: Electric Power Annual, Table 2.10: Average Retail Price of Electricity to UltimateCustomers by End-Use Sector, State 2013 and 2012 in cents per kilowatthour (March 2015).
2015 Climate Registry Default Emission Factors Released April 2015
Page 64 of 79

Table 14.6 Canadian Electricity Intensity
Principal Building Activity AnnualElectricity Intensity GJ / m2
Commercial and institutionalaccommodation 0.53
Entertainment and recreation 0.93
Office 0.97
Food retails 1.86
Non food retails 0.52
Food service 1.34
Non food service 0.58
Shopping malls 0.72
Warehouse/wholesale 0.79
Administration 0.82
Education 0.4
Health care 0.93
Public assembly 0.55
Other 0.58
2015 Climate Registry Default Emission Factors Released April 2015
Page 65 of 79

Source: Natural Resources Canada, Commercial and Institutional Building Energy Use Survey 2000Table 11.1 Total electricity consumption and electricity intensity by building characteristics, occupancycharacteristics, energy efficiency features, heating energy sources and equipment, cooling energysources and equipment, and water heating energy sources.
2015 Climate Registry Default Emission Factors Released April 2015
Page 66 of 79

Table 14.7 US Electricity Intensity
Principal Building Activity AnnualElectricity Intensity
Electricity Intensity (kWh / ft2)
Education 11
Food Sales 49.4
Food Service 38.4
Health Care 22.9
Inpatient 27.5
Outpatient 16.1
Lodging 13.5
Retail (other than mall) 14.3
Office 17.3
Public Assembly 12.5
Public Order and Safety 15.3
Religious Worship 4.9
Service 11
Warehouse and Storage 7.6
Other 22.5
2015 Climate Registry Default Emission Factors Released April 2015
Page 67 of 79
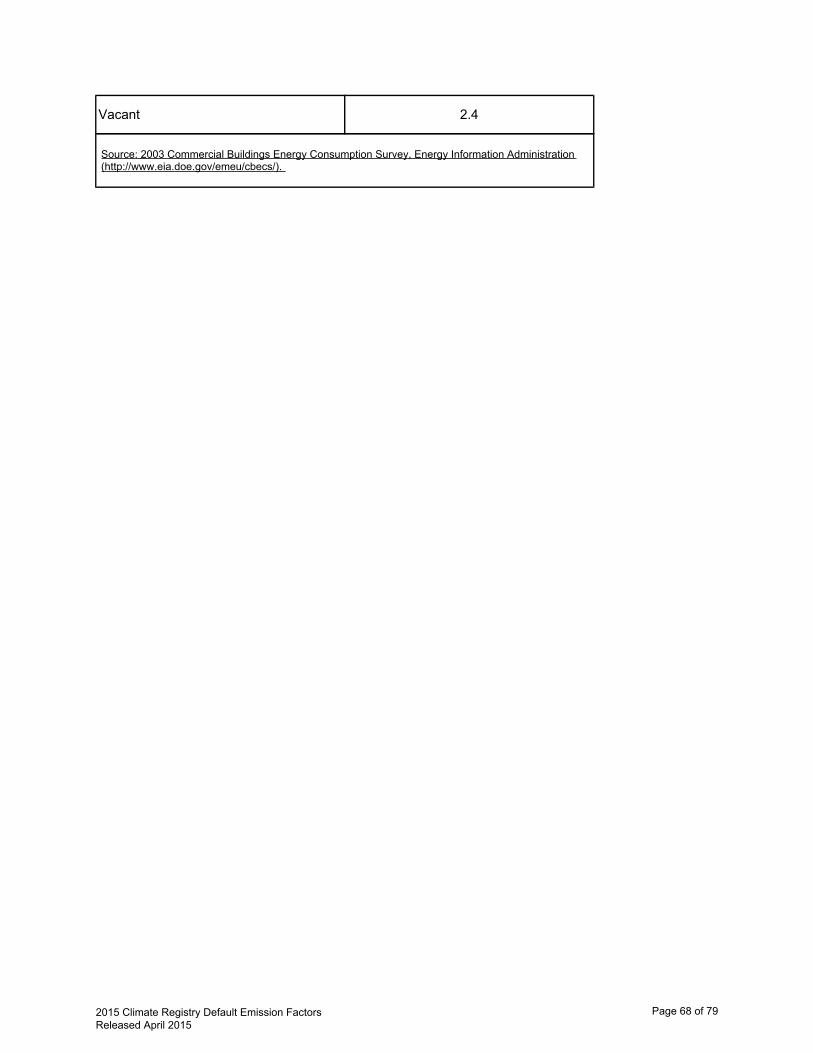
Vacant 2.4
Source: 2003 Commercial Buildings Energy Consumption Survey, Energy Information Administration(http://www.eia.doe.gov/emeu/cbecs/).
2015 Climate Registry Default Emission Factors Released April 2015
Page 68 of 79

Table 16.2 Default Emission Factors for Refrigera on/Air Condi oningEquipment
Type ofEquipment
Capacity (kg)
InstallationEmission
Factor k (% of
capacity)
OperatingEmission Factor
k (% ofcapacity/year)
RefrigerantRemaining at
Disposal y (% of
capacity)
RecoveryEfficiency
z (% ofremaining)
DomesticRefrigeration 70%80%0.50%1%0.05 - 0.5
Stand-aloneCommercialApplications
70%80%15%3%0.2 - 6
Medium & LargeCommercialRefrigeration
70%100%35%3%50 - 2,000
TransportRefrigeration 70%50%50%1%3 - 8
IndustrialRefrigerationincluding FoodProcessing and ColdStorage
90%100%25%3%10 -10,000
Chillers 95%100%15%1%10 - 2,000
Residential andCommercial A/Cincluding HeatPumps
80%80%10%1%0.5 - 100
2015 Climate Registry Default Emission Factors Released April 2015
Page 69 of 79
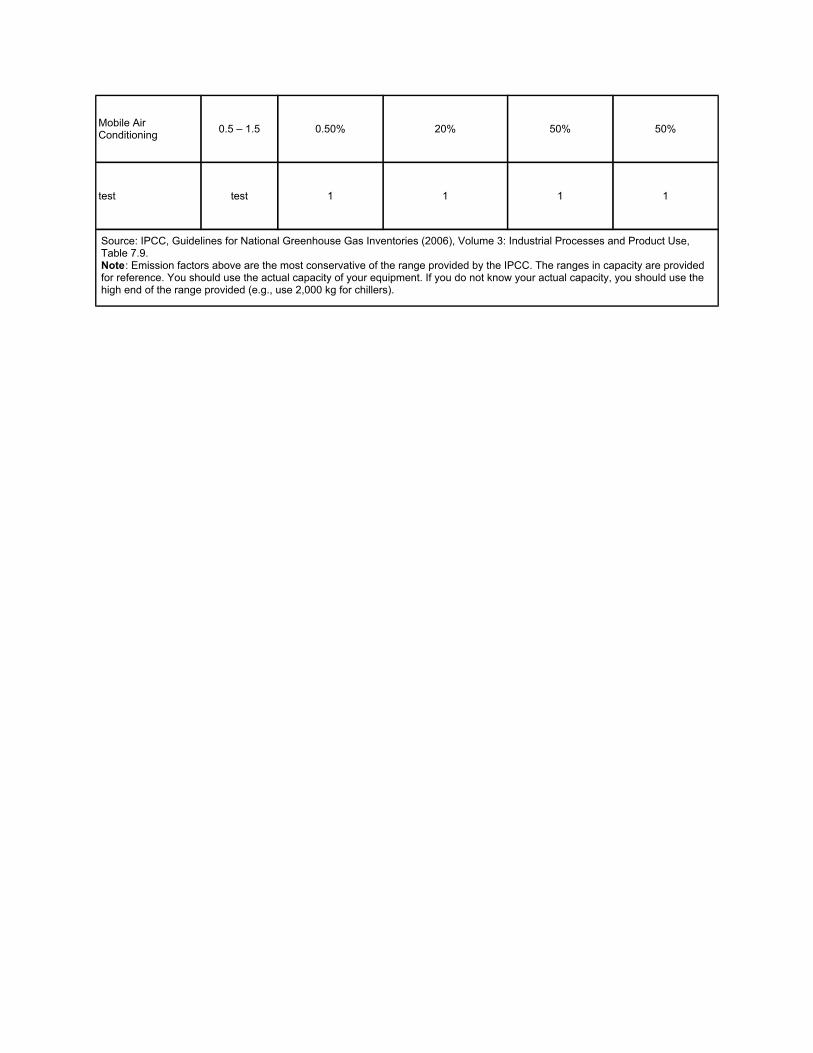
Mobile AirConditioning 50%50%20%0.50%0.5 – 1.5
test 1111test
Source: IPCC, Guidelines for National Greenhouse Gas Inventories (2006), Volume 3: Industrial Processes and Product Use,Table 7.9. Note: Emission factors above are the most conservative of the range provided by the IPCC. The ranges in capacity are providedfor reference. You should use the actual capacity of your equipment. If you do not know your actual capacity, you should use thehigh end of the range provided (e.g., use 2,000 kg for chillers).
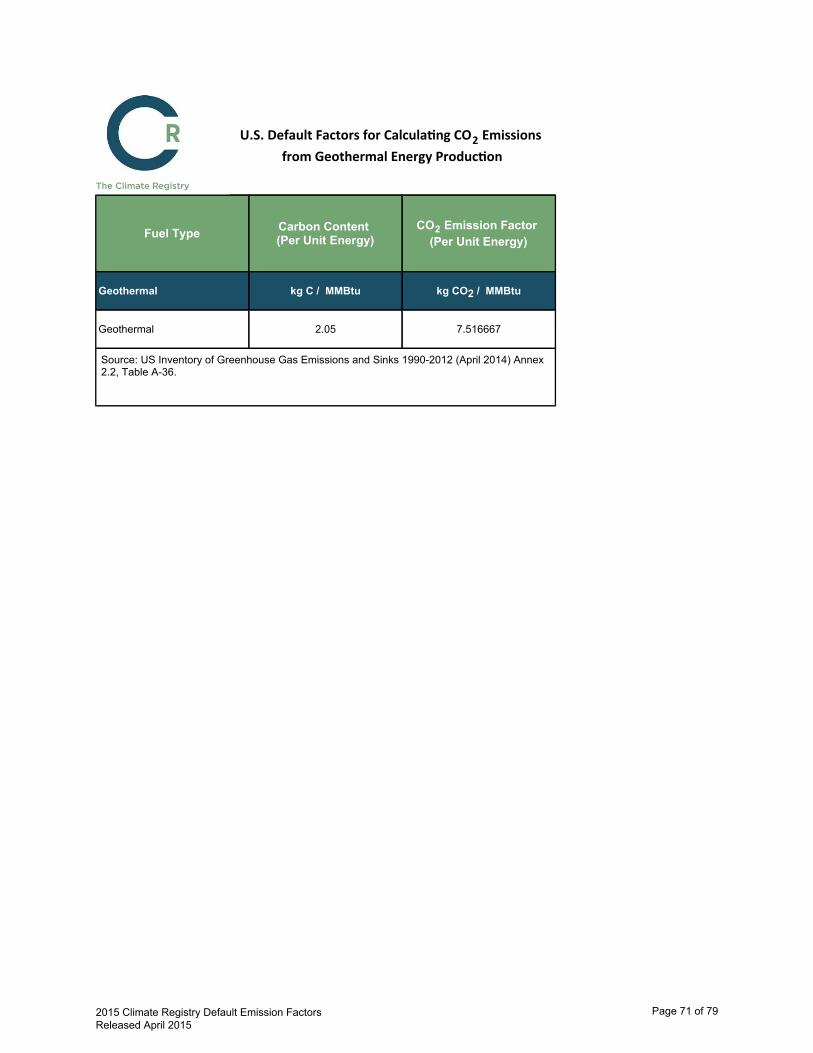
U.S. Default Factors for Calcula ng CO2 Emissionsfrom Geothermal Energy Produc on
Fuel Type Carbon Content (Per Unit Energy)
CO2 Emission Factor (Per Unit Energy)
Geothermal kg C / MMBtu kg CO2 / MMBtu
Geothermal 2.05 7.516667
Source: US Inventory of Greenhouse Gas Emissions and Sinks 1990-2012 (April 2014) Annex2.2, Table A-36.
2015 Climate Registry Default Emission Factors Released April 2015
Page 71 of 79

Table B.1. Global Warming Poten al Factors for Required Greenhouse Gases
Common Name Formula Chemical Name SAR TAR AR4 AR5
Carbon dioxide CO2 1 1 1 1
Methane CH4 21 23 25 28
Nitrous oxide N2O 310 296 298 265
Nitrogen trifluoride NF3 n/a 10,800 17,200 16,100
Sulfur hexafluoride SF6 23,900 22,200 22,800 23,500
Hydrofluorocarbons (HFCs)
HFC-23 (R-23) CHF3 trifluoromethane 11,700 12,000 14,800 12,400
HFC-32 (R-32) CH2F2 difluoromethane 650 550 675 677
HFC-41 (R-41) CH3F fluoromethane 150 97 92 116
HFC-125 (R-125) C2HF5 pentafluoroethane 2,800 3,400 3,500 3,170
HFC-134 (R-134) C2H2F41,1,2,2-tetrafluoroethane 1,000 1,100 1,100 1,120
HFC-134a (R-134a) C2H2F41,1,1,2-tetrafluoroethane 1,300 1,300 1,430 1,300
HFC-143 (R-143) C2H3F3 1,1,2-trifluoroethane 300 330 353 328
HFC-143a (R-143a) C2H3F3 1,1,1-trifluoroethane 3,800 4,300 4,470 4,800
HFC-152 (R-152) C2H4F2 1,2-difluoroethane n/a 43 53 16
2015 Climate Registry Default Emission Factors Released April 2015
Page 72 of 79
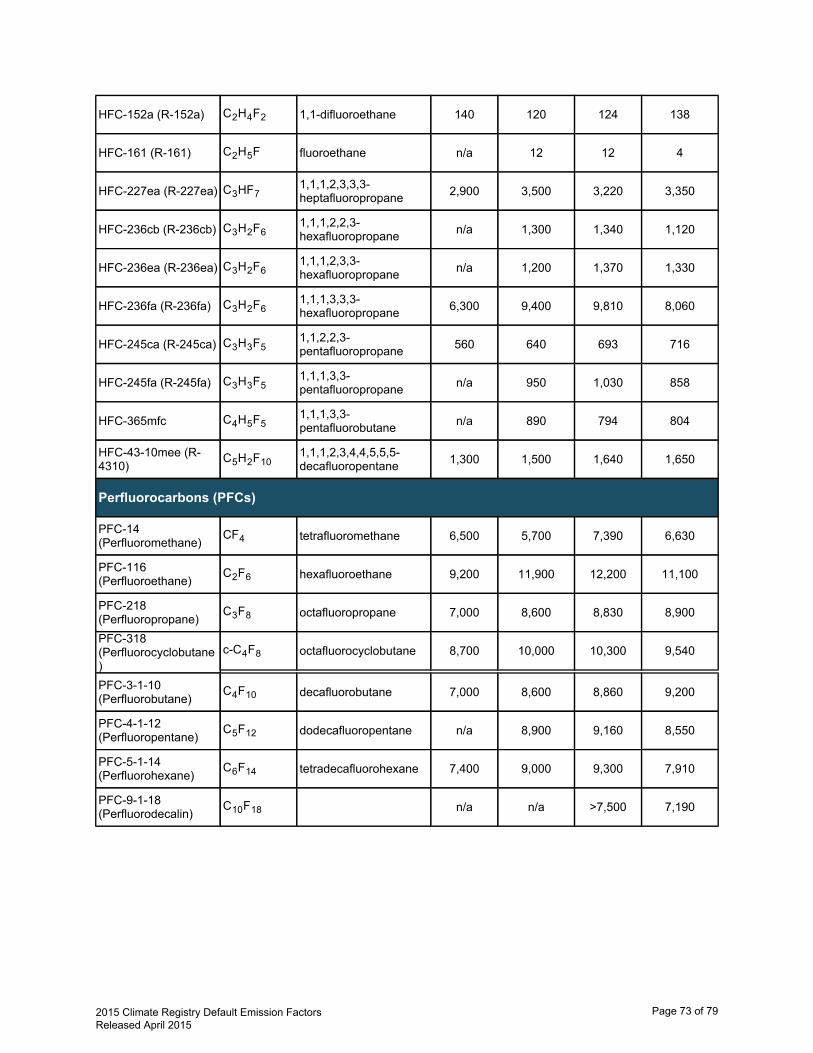
HFC-152a (R-152a) C2H4F2 1,1-difluoroethane 140 120 124 138
HFC-161 (R-161) C2H5F fluoroethane n/a 12 12 4
HFC-227ea (R-227ea) C3HF71,1,1,2,3,3,3-heptafluoropropane 2,900 3,500 3,220 3,350
HFC-236cb (R-236cb) C3H2F61,1,1,2,2,3-hexafluoropropane n/a 1,300 1,340 1,120
HFC-236ea (R-236ea) C3H2F61,1,1,2,3,3-hexafluoropropane n/a 1,200 1,370 1,330
HFC-236fa (R-236fa) C3H2F61,1,1,3,3,3-hexafluoropropane 6,300 9,400 9,810 8,060
HFC-245ca (R-245ca) C3H3F51,1,2,2,3-pentafluoropropane 560 640 693 716
HFC-245fa (R-245fa) C3H3F51,1,1,3,3-pentafluoropropane n/a 950 1,030 858
HFC-365mfc C4H5F51,1,1,3,3-pentafluorobutane n/a 890 794 804
HFC-43-10mee (R-4310)
C5H2F101,1,1,2,3,4,4,5,5,5-decafluoropentane 1,300 1,500 1,640 1,650
Perfluorocarbons (PFCs)
PFC-14(Perfluoromethane)
CF4 tetrafluoromethane 6,500 5,700 7,390 6,630
PFC-116(Perfluoroethane)
C2F6 hexafluoroethane 9,200 11,900 12,200 11,100
PFC-218(Perfluoropropane)
C3F8 octafluoropropane 7,000 8,600 8,830 8,900
PFC-318(Perfluorocyclobutane)
c-C4F8 octafluorocyclobutane 8,700 10,000 10,300 9,540
PFC-3-1-10(Perfluorobutane)
C4F10 decafluorobutane 7,000 8,600 8,860 9,200
PFC-4-1-12(Perfluoropentane)
C5F12 dodecafluoropentane n/a 8,900 9,160 8,550
PFC-5-1-14(Perfluorohexane)
C6F14 tetradecafluorohexane 7,400 9,000 9,300 7,910
PFC-9-1-18(Perfluorodecalin)
C10F18 n/a n/a >7,500 7,190
2015 Climate Registry Default Emission Factors Released April 2015
Page 73 of 79

Source: Intergovernmental Panel on Climate Change (IPCC) Second Assessment Report (SAR) published in 1995,Third Assessment Report (TAR) published in 2001, Fourth Assessment Report (AR4) published in 2007, and FifthAssessment Report published in 2013. All defaults 100-year GWP values. For any defaults provided as a range,use exact value provided for the purpose of reporting to The Registry. n/a=data not available. Note: Complete reporters must include emissions of all Kyoto-defined GHGs (including all HFCs and PFCs) ininventory reports. If HFCs or PFCs are emitted that are not listed above, complete reporters must use industry bestpractices to calculate CO2e from those gases.
2015 Climate Registry Default Emission Factors Released April 2015
Page 74 of 79

Table B.2. Global Warming Poten als of Refrigerant Blends
Gas SAR TAR AR4Refrigerant Blend AR5
R-401A HFC 18.2 15.6 16.12 17.94
R-401B HFC 15 13 14 15
R-401C HFC 21 18 18.6 20.7
R-402A HFC 1680 2040 2100 1902
R-402B HFC 1064 1292 1330 1205
R-403A PFC 1400 1720 1766 1780
R-403B PFC 2730 3354 3444 3471
R-404A HFC 3260 3784 3922 3943
R-407A HFC 1770 1990 2107 1923
R-407B HFC 2285 2695 2804 2547
R-407C HFC 1526 1653 1774 1624
R-407D HFC 1428 1503 1627 1487
R-407E HFC 1363 1428 1552 1425
R-407F HFC 1555 1705 1825 1674
R-408A HFC 1944 2216 2301 2430
R-410A HFC 1725 1975 2088 1924
2015 Climate Registry Default Emission Factors Released April 2015
Page 75 of 79

R-410B HFC 1833 2118 2229 2048
R-411A HFC 15 13 14 15
R-411B HFC 4.2 3.6 3.72 4.14
R-412A PFC 350 430 442 445
R-415A HFC 25.2 21.6 22.32 24.84
R-415B HFC 105 90 93 104
R-416A HFC 767 767 843.7 767
R-417A HFC 1955 2234 2346 2127
R-417B HFC 2450 2924 3027 2742
R-417C HFC 1570 1687 1809 1643
R-418A HFC 3.5 3 3.1 3.45
R-419A HFC 2403 2865 2967 2688
R-419B HFC 1982 2273 2384 2161
R-420A HFC 1144 1144 1258 1144
R-421A HFC 2170 2518 2631 2385
R-421B HFC 2575 3085 3190 2890
R-422A HFC 2532 3043 3143 2847
R-422B HFC 2086 2416 2526 2290
R-422C HFC 2491 2983 3085 2794
R-422D HFC 2232 2623 2729 2473
2015 Climate Registry Default Emission Factors Released April 2015
Page 76 of 79
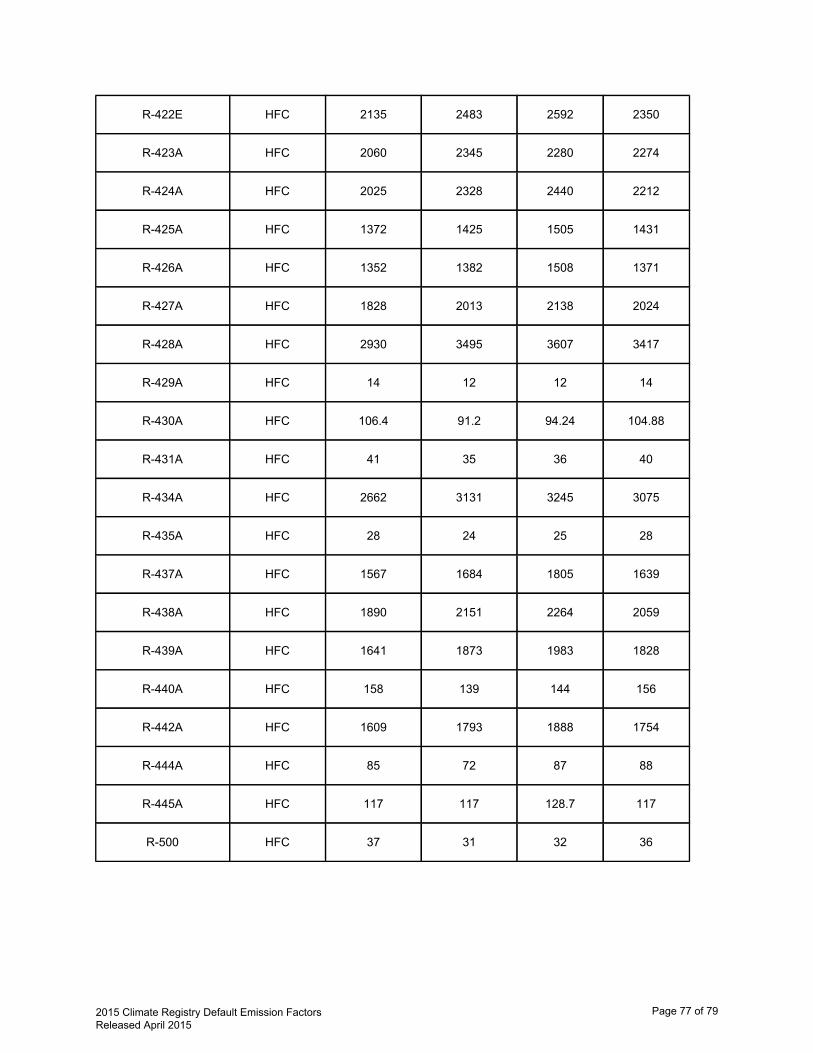
R-422E HFC 2135 2483 2592 2350
R-423A HFC 2060 2345 2280 2274
R-424A HFC 2025 2328 2440 2212
R-425A HFC 1372 1425 1505 1431
R-426A HFC 1352 1382 1508 1371
R-427A HFC 1828 2013 2138 2024
R-428A HFC 2930 3495 3607 3417
R-429A HFC 14 12 12 14
R-430A HFC 106.4 91.2 94.24 104.88
R-431A HFC 41 35 36 40
R-434A HFC 2662 3131 3245 3075
R-435A HFC 28 24 25 28
R-437A HFC 1567 1684 1805 1639
R-438A HFC 1890 2151 2264 2059
R-439A HFC 1641 1873 1983 1828
R-440A HFC 158 139 144 156
R-442A HFC 1609 1793 1888 1754
R-444A HFC 85 72 87 88
R-445A HFC 117 117 128.7 117
R-500 HFC 37 31 32 36
2015 Climate Registry Default Emission Factors Released April 2015
Page 77 of 79
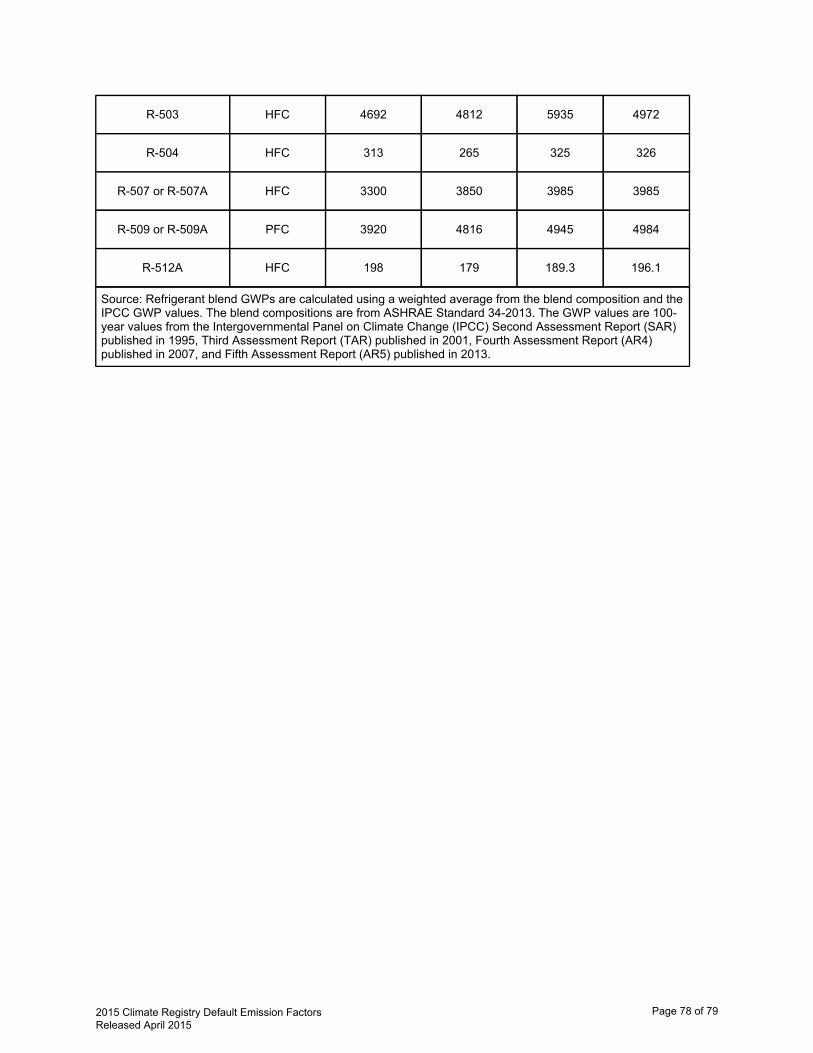
R-503 HFC 4692 4812 5935 4972
R-504 HFC 313 265 325 326
R-507 or R-507A HFC 3300 3850 3985 3985
R-509 or R-509A PFC 3920 4816 4945 4984
R-512A HFC 198 179 189.3 196.1
Source: Refrigerant blend GWPs are calculated using a weighted average from the blend composition and theIPCC GWP values. The blend compositions are from ASHRAE Standard 34-2013. The GWP values are 100-year values from the Intergovernmental Panel on Climate Change (IPCC) Second Assessment Report (SAR)published in 1995, Third Assessment Report (TAR) published in 2001, Fourth Assessment Report (AR4)published in 2007, and Fifth Assessment Report (AR5) published in 2013.
2015 Climate Registry Default Emission Factors Released April 2015
Page 78 of 79
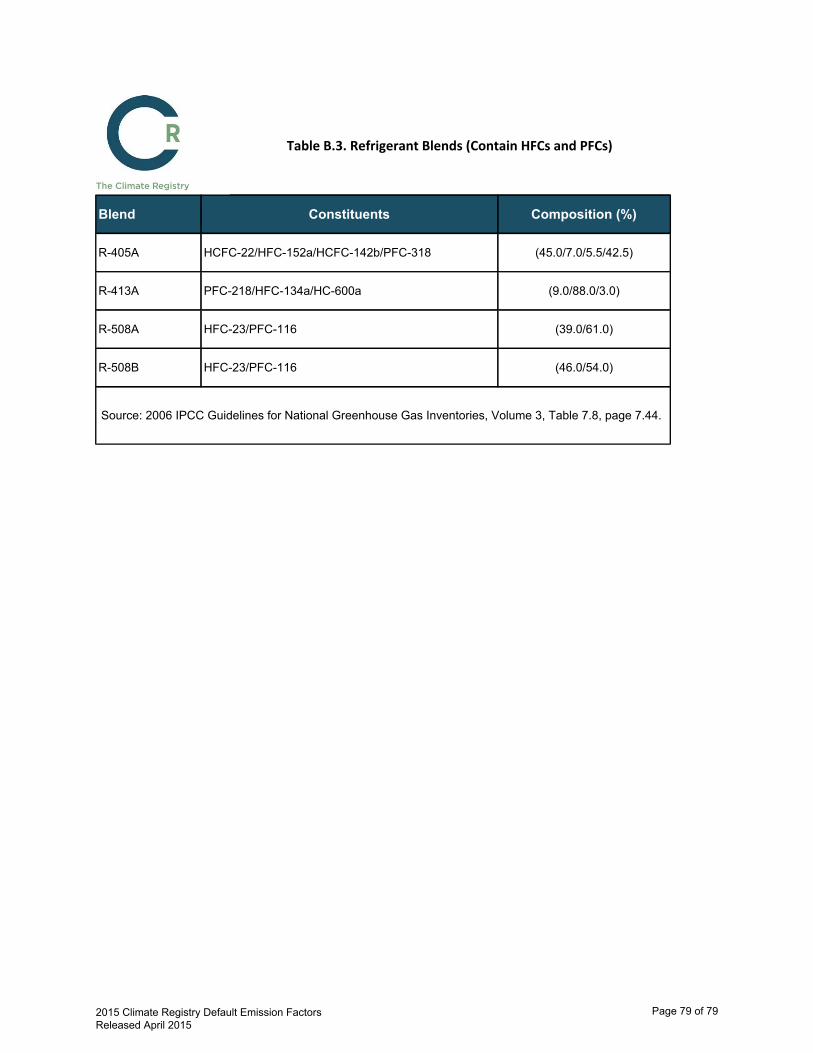
Table B.3. Refrigerant Blends (Contain HFCs and PFCs)
Blend Constituents Composition (%)
R-405A HCFC-22/HFC-152a/HCFC-142b/PFC-318 (45.0/7.0/5.5/42.5)
R-413A PFC-218/HFC-134a/HC-600a (9.0/88.0/3.0)
R-508A HFC-23/PFC-116 (39.0/61.0)
R-508B HFC-23/PFC-116 (46.0/54.0)
Source: 2006 IPCC Guidelines for National Greenhouse Gas Inventories, Volume 3, Table 7.8, page 7.44.
2015 Climate Registry Default Emission Factors Released April 2015
Page 79 of 79