table iv.2.3 farmland use and grazing sources in …iv - t - 4 table iv.2.3 farmland use and grazing...
TRANSCRIPT

IV - T - 4
Table IV.2.3 Farmland Use and Grazing Sources in Dugda Bora
No. Peasant Association Farmland(ha) TLU Grazing land, ha Grazing condition Ha/TLU 1 Kersa Gambala 1,307 1,901 469 poor,fl 0.24 2 Abene Kumuro 1,155 1,831 529 poor,fl 0.28 3 Adele Mirt Meteia 1,308 2,177 400 med,fl 0.18 4 Biliti Balewoid 1,012 2,685 575 med,fl 0.21 5 Koto Biliti 1,446 2,309 657 med,fl 0.28 6 Argo Gadilala 627 1,536 1,191 poor,fl 0.77 7 Tuchi Denbel 1,077 3,079 474 good,nl 0.15 8 Wayo Gebriel 1,179 1,793 279 poor,nl 0.15 9 Aboro Gebriel 841 2,324 625 med,nl 0.26
10 Dodoti Dembel 832 1,948 782 med,nl 0.40 11 Mukiye 1 1,942 2,986 1,160 med,fl 0.38 12 Birbirsa Guda Sabole 2,081 1,710 850 poor,fl 0.49 13 Birbirsa Gale 1,057 4,092 599 good,fl 0.15 14 Eela Gebre Daiech 864 4,874 644 good,fl 0.13 15 Menjegso Weji 951 3,165 1,044 good,fl 0.32 16 Joro Reka 952 1,476 726 poor,fl 0.49 17 Korke Adama 1,237 3,402 467 good,fl 0.13 18 Goro Korke 1,651 3,402 1,097 med,fl 0.32 19 Kiltu Ombole 1,745 3,277 792 good,fl 0.24 20 Doyo Laman 1,303 1,551 469 poor,fl 0.30 21 Tute Koremtu 1,561 3,480 855 good,fl 0.24 22 Koye Jejeba 1,284 1,906 1,068 med,fl 0.56 23 Hafe Kemale 1,066 1,806 700 poor,fl 0.38 24 Weldia Hafa 1,160 2,531 719 med,fl 0.28 25 Beyimogusa 1,200 3,261 1,088 good,fl 0.33 26 Dongorota 906 3,395 726 good,fl 0.21 27 Mukiya 2 1,002 3,069 609 med,fl 0.19 28 Hate Leman 1,256 1,633 709 poor,fl 0.43 29 Tepho Choroke 1,610 3,437 307 good,nl 0.08 30 Giraba Korke Adi 1,764 2,533 679 med,nl 0.26 31 Bekele Girisa 1,125 4,568 435 good,nl 0.09 32 Weldiyo Mekidela 1,493 2,024 67 med,nl 0.03 33 Weldiyo Kelina 1,442 2,717 812 good,nl 0.29 34 Saubi Gamo 1,437 3,805 215 good,nl 0.05 35 Tuchi Sumeyo 1,533 4,864 232 good,nl 0.04 36 Jawe Bofa 1,082 1,958 499 poor,fl 0.25 37 Oda Bokota 1,071 1,507 702 poor,fl 0.46 38 Derara Dalecha 1,529 2,310 150 med,nl 0.06 39 Burka Debrebeg 1,478 941 300 poor,nl 0.31 40 Jirme Bora 1,501 4,115 1,412 good,fl 0.34 41 Berta Sami 1,396 4,701 1,150 good,fl 0.24 42 Sori Dolesa 1,536 1,903 836 med,fl 0.43 43 Tuka Largamo 818 2,536 818 med,fl 0.32 44 Gose Korke 1,610 2,485 717 med,fl 0.28 45 Tuchi Deko 1,217 3,487 884 good,fl 0.25 46 Elen 1,027 1,962 1,147 med,fl 0.58 47 Kushe Huluko 1,080 1,638 530 poor,fl 0.32 48 Lafesa Germeji 913 2,460 699 med,fl 0.28 49 Gora Leman 534 2,065 700 med,fl 0.33 50 Dodo Wedera 1,586 2,775 694 med,fl 0.26 51 Malema Jere Bera 1,172 1,465 350 poor,fl 0.23 52 Tube Suti 1,223 2,307 724 med,fl 0.31 53 Dalota Mati 792 2,543 828 med,fl 0.32 54 Sera Wekele 1,114 1,819 510 poor,fl 0.28
Total 67,085 141,524 36,700 0.26 fl= far from lake, nl=near lake Source: Agriculture Bureau Office, Dugda Bora Woreda Office, Year 2000-2001

IV - T - 5
Table IV.2.4 Estimate of Crop Residue from 1.5 ha of Farmland
Crop Yield/
ha in kg Area
planted (ha)
% total area
planted
Portion of 1.5 ha (ha)
Yield from
portion (kg)
Ratio of residue yield to
grain yield
Total residue from grain yield (kg)
Teff 700 15,745 30.0 0.45 315 1.7:1 536
Maize 1,600 2,157 4.0 0.06 96 1.7:1 163
Wheat 2,200 15,354 29.0 0.43 946 1.7:1 1,608
Barley 1,800 251 0.5 0.01 18 0.6:1 11
Sorghum 1,200 900 1.6 0.02 29 1.7:1 49
Haricot/b 1,000 14,730 28.0 0.42 420 0.5:1 210
Pea 600 787 1.5 0.02 12 0.5:1 6
Horse/b 600 870 1.6 0.02 14 0.5:1 7
Chick pea 600 230 0.4 0.01 6 0.5:1 3
Lentil 300 180 0.3 0.01 3 0.5:1 2
Total 2,594
Table IV.2.5 Estimated Nutrient Requirement for Grazing Livestock for Dugda Bora
Livestock species
Number Estimated Live-
weight (kg)
Dry MatteIntake per
day / animal
(kg)
Total DMI
Reqire.
ME req./ animal
Total ME reqment MJ/day
DCP req./
animal
Total DCP reqment
g/day
Oxen 70,930 320 9.0 638,370 43.0 3,049,990 200 14,186,000
Cows 135,370 265 7.0 977,590 63.0 8,528,310 405 54,824,800
Sheep 28,473 35 1.5 42,709 6.7 190,769 45 1,281,285
Goats 60,772 25 1.5 91,158 6.7 407,172 45 2,734,740
Donkeys 12,164 115 8 97,312 9.0 109,476 500 6,082,000
Horses 525 140 10 5,250 10.0 5,250 550 288,750 Total req./day
1,852,389 12,287,950 79,397,575
References: ILCA (1991). Table of Livestock Population of Dugda Bora Wareda provided by Veterinary Office Annual Census Report of Dugda Bora Wareda.

IV - T - 6
Table IV. 2. 6 Daily Nutrient Supply and Nutrient Deficit from Grazing and Crop Residues
Item DM ME(MJ) DCP(g) Grazing : 56,891 ha at 2,250kg/ha = 128,004,7tons (at mean 70% DM)
89,603.3 ton
716,826,400 50177848000
Per day 245,480 kg 1,963,840 13,746,880 Residues 2.6 tons per farm x 52 farms = 135.2 tons
121,680 kg 973,440 4,867,200
Per day 333.36 2,000.16 13,334.4 Total per day 245,813 1,965,840 13,760,214 Requirement /day 1,852,389 12,287,950 79,397,575 Deficit per day 1,606,576 10,322,110 65,637,361 % Requirement met 13.27% 15.99% 17.33%
Sources: Sayoum and Zenash, 1989 ILCA, 1991
Breakdown of Estimation
Grazing capacity is probably equivalent to Natural Region 4 in Zim (semi-arid, middle veld). This amounts to grazing
capacity of 8 L.U. per ha.
L.U. on veld.: 8 ha./LU (Oliver and Topps, 1990) Livestock Population (Head) TLU/Head Total TLU
Cattle 206,300 0.70 144,410 Sheep 28,473 0.08 2,278 Goats 60,772 0.06 3,646 Donkeys 12,164 0.40 4,866 Horses 525 0.50 262 Total 122,564 155,462
Cattle 206,300 0.7 144410 Sheep 28,473 0.08 2 278 Goats 60,772 0.06 3 646 Donkeys 12,164 0.4 4 866 Horses 525 0.5 262 Total 155,462 Cattle = 0.7 LU = 0.33 ha per animal Sheep and goats = 0.044 ha per animal Donkeys = 0.2 ha per animal Horses = 0.27 ha per animal
Total number of households = 52 PA x 417 (av) households = 22516. Average number of LU per household = 5.9 (6) Typical farm has 0.45 ha of grazing land giving 4500 kg dry matter production per ha. (Bekele, 1991). However, available consumption forage produced annually from pastureland is assumed to be 50% of gross production because of cattle selectivity and trampling, use by wildlife and loss due to fire (Houerou and Hoste, 1977. Therefore, work on 2250 kg per ha. 0.33 ha for cattle = 742.5 kg dry matter/cow or ox Crop residue Tons per household of crop residue = 2.65 tons. Crop residue per TLU = 0.44 tons or 440 kg (amount per cow). 0.7 TLU= 308 kg crop residue per ox=277.2 kg dry matter Nutrient supplied: DM ME (MJ)/kg DCP (g/kg). Pasture 45 8.0 56 Residue 90 6 40

IV - T - 7
Table IV.2.7 Planned and Actual Activities of Veterinary Office in Dugda Bora (1997-1999)
Activitiy 1997 1998 1999 Vaccinations Planned 73,822 67,512 60,784 Actual 69,486 25,948 10,290 Internal parasites Planned 15,600 16,380 8,160 Actual 2,881 6,024 4,037 External parasites Planned 11,000 13,650 11,143 Actual 6,120 5,156 6,966 Infectious diseases Planned 7,200 8,190 5,070 Actual 2,220 1,817 1,911 Surgical treatment Planned 20 20 10 Actual 12 12 8 Fecal samples Planned 480 260 224 Actual 334 1467 0 Castration Planned 1,000 1367 648 Actual 728 421 305
Table IV.2.8 Frequency of Disease Outbreaks in Dugda Bora in 1996/1997
Disease No. months outbreaks
No. locations outbreaks
No. locations vaccinated
Anthrax 8 19 19
Black leg 3 6 6
Pasteurellosis 5 10 10
Sheep and goat pox 3 4 4
Lumpy skin disease 4 11 11
AHS 1 3 1

IV - T - 8
Table IV.2.9 Distribution of Cropping Land Area
Category Mean (ha) Minimum (ha) Maximum (ha)
1) GGNL
Tuchi Denbel 2.75 1.00 6.00
Bekele Givisa 2.60 1.00 12.00
Tepho Choroka 7.30 4.00 10.00
Average 4.21 3.00 9.30
2) GGFL
Gusa dongorata 2.56 1.00 6.00
Berta sami 3.20 1.00 7.00
Beyimo Gusa 4.70 1.00 10.00
Average 3.48 1.00 8.00
3) MGNL
Givabe korke adi 5.07 2.00 10.00
Aboro Gabriel 2.11 0.50 8.00
Dodoti Dembel 3.22 1.00 9.00
Average 3.46 1.50 9.00
4) MGFL
Weldia hafa 4.30 1.00 6.00
Koye Jojoba 3.20 1.00 5.00
Doyo Laman 3.80 1.00 5.00
Average 3.77 1.00 5.50
5) PGNL
Wayo Gabriel 2.90 0.50 10.00
Burka Debrebeg 1.40 0.50 2.50
Hate Leman 2.10 0.50 5.50
Average 2.11 0.50 6.00
6) PGFL
Hafe Kemale 2.90 1.00 4.50
Jawe Bofa 4.00 2.00 12.00
Birbirsa Guda Sabole 3.60 1.25 8.50
Average 3.50 1.50 8.50
Remarks : Category of grazing sources 1) Good grazing, near the lake (code GGNL) 2) Good grazing, far from the lake (code GGFL) 3) Medium grazing, near the lake (code MGNL) 4) Medium grazing, far from the lake (code MGFL) 5) Poor grazing, near the lake (code PGNL) 6) Poor grazing, far from the lake (code PGFL)

IV - T - 9
GrazingConditions Grazing Only Grazing+Supple 1 2 3 4 5
Near Lake8 Poor 25 50 65 25 10 35 90
40 Poor 50 40 20 70 10 80 909 Medium 45 40 60 25 10 35 85
30 Medium 45 55 0 15 85 100 157 Good 60 25 50 5 45 50 55
29 Good 100 0 25 25 50 75 5031 Good 30 70 5 95 0 95 100
Far from Lake23 Poor 95 0 60 30 5 35 9036 Poor 0 100 5 5 0 0 9022 Medium 100 0 15 20 40 25 3524 Medium 100 0 25 50 25 75 7525 Good 35 65 0 0 100 100 042 Good 10 90 100 0 0 0 10026 Good 50 50 0 0 100 100 0
Note:1 Near PA2 By the Lake3 By the River4 By the Lake + by the River5 PA + by the Lake
GrazingConditions Grazing Only Grazing+Supple 1 2 3 4 5
Near Lake8 Poor 40 60 80 0 0 35 0
40 Poor 35 10 95 0 0 80 09 Medium 50 50 95 0 0 35 0
30 Medium 5 50 0 0 100 100 07 Good 85 10 95 0 0 50 0
29 Good 70 30 50 0 50 75 031 Good 15 55 95 0 0 95 0
Far from Lake23 Poor 5 75 100 0 0 35 036 Poor 10 45 0 0 100 0 022 Medium 15 60 20 0 30 25 5024 Medium 10 50 25 0 75 75 025 Good 10 90 0 0 100 100 042 Good 5 45 0 0 0 0 026 Good 30 70 0 0 100 100 0
Note:1 Near PA2 By the Lake3 By the River4 By the Lake + by the River5 PA + by the Lake
Table IV.2.11 Grazing Management of Cattle in the Dry Season
PA Code Feeding in Rainy Season Grazing Pattern in Rainiy Season (%)
Table IV.2.10 Grazing Management of Cattle in the Rainy Season
PA Code Feeding in Rainy Season Grazing Pattern in Rainiy Season (%)

IV - T - 10
Table 2.12 Distribution of Cattle
GROUP MEAN (HEAD) MIN (HEAD) MAX (HEAD)
1) GGNL Tuchi Denbel 3 0 20 Bekele Givisa 10.7 1 29 Tepho Choroka 30 10 65 Average 14.5 3.6 38
2) GGFL Gusa dongorata 15.7 4 40 Berta sami 18.7 1 60 Beyimo Gusa 23 4 70 Average 19.1 3 56.6
3) MGNL Givabe korke adi 22.6 6 60 Aboro Gabriel 5.9 0 26 Dodoti Dembel 7.3 1 24 Average 11.9 2.3 36.6
4) MGFL Weldia hafa 15.4 0 40 Koye Jojoba 9.8 3 15 Doyo Laman 13.2 1 29 Average 12.8 1.3 28
5) PGNL Wayo Gabriel 4 0 30 Burka Debrebeg 6.5 0 20 Hate Leman 6 1 27 Average 5.5 0.5 25.6
6) PGFL Hafe Kemale 14.9 3 53 Jawe Bofa 10.2 3 25 Birbirsa Guda Sabole 13.1 2 40 Average 12.7 3 39.3
Remarks : Category of grazing sources 7) Good grazing, near the lake (code GGNL) 8) Good grazing, far from the lake (code GGFL) 9) Medium grazing, near the lake (code MGNL) 10) Medium grazing, far from the lake (code MGFL) 11) Poor grazing, near the lake (code PGNL) 12) Poor grazing, far from the lake (code PGFL)
IV - T - 11
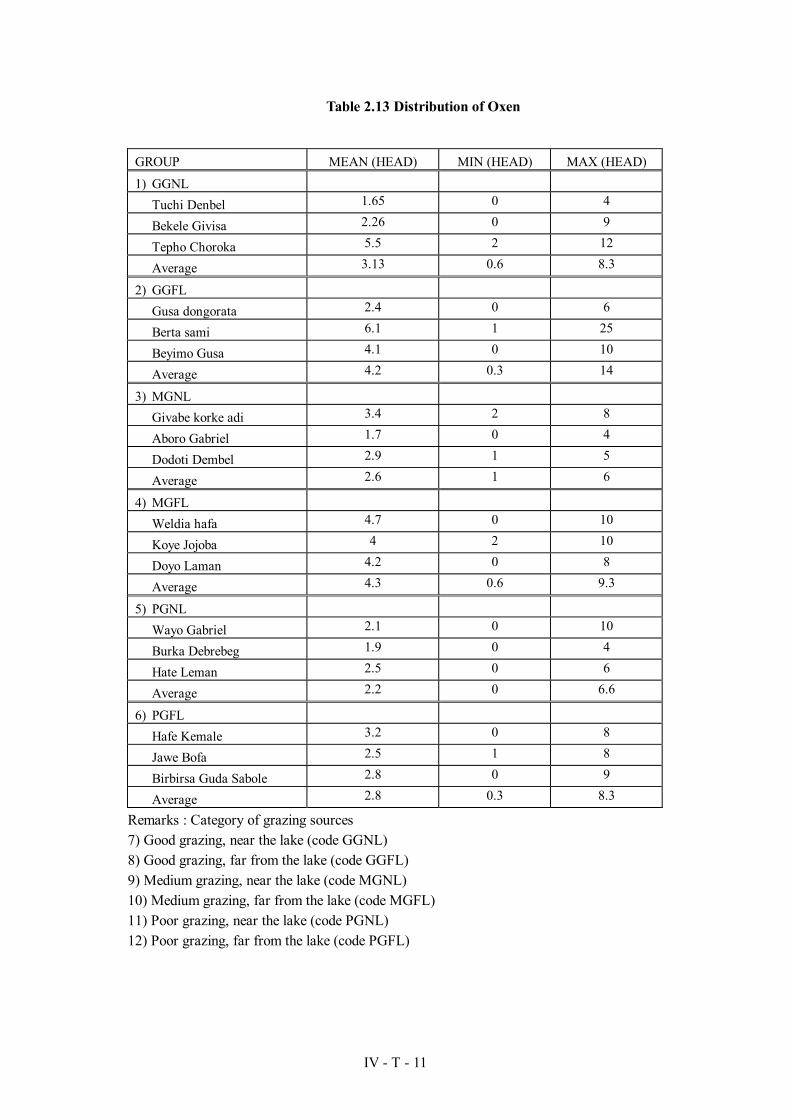
Table 2.13 Distribution of Oxen
GROUP MEAN (HEAD) MIN (HEAD) MAX (HEAD)
1) GGNL
Tuchi Denbel 1.65 0 4
Bekele Givisa 2.26 0 9
Tepho Choroka 5.5 2 12
Average 3.13 0.6 8.3
2) GGFL
Gusa dongorata 2.4 0 6
Berta sami 6.1 1 25
Beyimo Gusa 4.1 0 10
Average 4.2 0.3 14
3) MGNL
Givabe korke adi 3.4 2 8
Aboro Gabriel 1.7 0 4
Dodoti Dembel 2.9 1 5
Average 2.6 1 6
4) MGFL
Weldia hafa 4.7 0 10
Koye Jojoba 4 2 10
Doyo Laman 4.2 0 8
Average 4.3 0.6 9.3
5) PGNL
Wayo Gabriel 2.1 0 10
Burka Debrebeg 1.9 0 4
Hate Leman 2.5 0 6
Average 2.2 0 6.6
6) PGFL
Hafe Kemale 3.2 0 8
Jawe Bofa 2.5 1 8
Birbirsa Guda Sabole 2.8 0 9
Average 2.8 0.3 8.3
Remarks : Category of grazing sources 7) Good grazing, near the lake (code GGNL) 8) Good grazing, far from the lake (code GGFL) 9) Medium grazing, near the lake (code MGNL) 10) Medium grazing, far from the lake (code MGFL) 11) Poor grazing, near the lake (code PGNL) 12) Poor grazing, far from the lake (code PGFL)

IV - T - 12
Table 2.14 Distribution of Cow
GROUP MEAN (HEAD) MIN (HEAD) MAX (HEAD)
1) GGNL
Tuchi Denbel 3.7 0 10
Bekele Givisa 3.7 0 10
Tepho Choroka 6.3 1 16
Average 4.6 0.3 12
2) GGFL
Gusa dongorata 2.45 0 8
Berta sami 4.8 0 22
Beyimo Gusa 3.7 0 15
Average 3.6 0 15
3) MGNL
Givabe korke adi 4.4 1 10
Aboro Gabriel 0.95 0 4
Dodoti Dembel 2.8 1 8
Average 2.7 0.6 6.6
4) MGFL
Weldia hafa 3.47 0 7
Koye Jojoba 2.15 0 4
Doyo Laman 2.9 1 6
Average 2.84 0.3 5.6
5) PGNL
Wayo Gabriel 1.35 0 6
Burka Debrebeg 1.8 0 5
Hate Leman 1.45 0 5
Average 1.5 0 5.5
6) PGFL
Hafe Kemale 3.36 1 10
Jawe Bofa 2.9 1 6
Birbirsa Guda Sabole 2.85 1 7
Average 3 1 7.6
Remarks : Category of grazing sources 7) Good grazing, near the lake (code GGNL) 8) Good grazing, far from the lake (code GGFL) 9) Medium grazing, near the lake (code MGNL) 10) Medium grazing, far from the lake (code MGFL) 11) Poor grazing, near the lake (code PGNL) 12) Poor grazing, far from the lake (code PGFL)

APPENDIX IV ANIMAL HUSBANDRY
Figures

Lake Koka
1
2
3
4
5
6
Meki
78 9
10
11
2930
31
3332
34
35
3642
41
39
40
37
38
28
27
1312
26 25
23
22
21
192018
16
15 14
17
5444
45
43
46
48 47
4950
51
53
52
Adaa Liben Wareda
Arsi Zone
SouthernRegion
Adami Tulu Wareda
24
Nippon Koei Co., Ltd. Tokyo Japan
Meki Irrigation and Rural Development ProjectOromia Region, Ethiopia
Graizing Sources in Dugda Bora Wareda
N
0 10 km
Lake Ziway
LEGENDGraizing Sources
GoodMediumPoor
Fig. IV.2.1
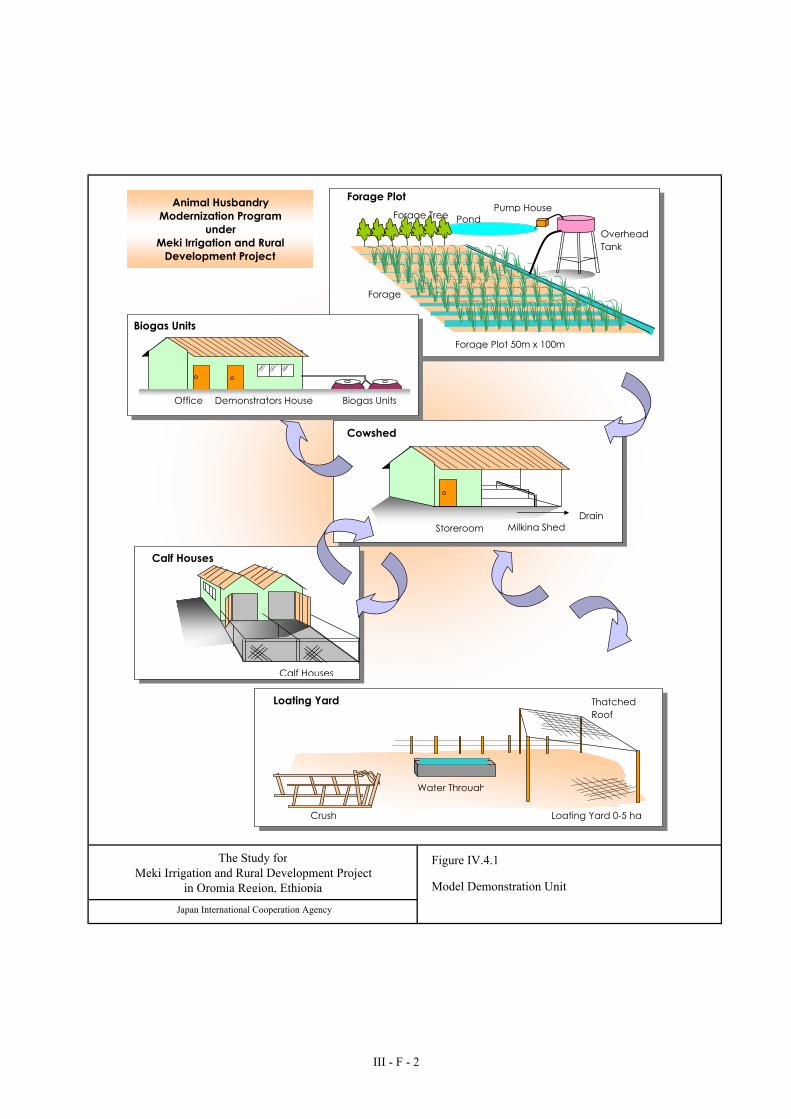
Figure IV.4.1
Japan International Cooperation Agency
The Study forMeki Irrigation and Rural Development Project
in Oromia Region, Ethiopia Model Demonstration Unit
Pump HousePond
Forage Plot 50m x 100m
Forage Tree
Forage
Forage Plot
Overhead Tank
Office Demonstrators House Biogas Units
Biogas Units
Cowshed
DrainMilking ShedStoreroom
Calf Houses
Calf Houses
Thatched Roof
Water Through
Loating Yard
Loating Yard 0-5 ha
Animal Husbandry Modernization Program
underMeki Irrigation and Rural
Development Project
Crush
III - F - 2

APPENDIX IV ANIMAL HUSBANDRY
Attachments

Attachment IV-1
IV - A - 1
MEKI IRRIGATION AND RURAL DEVELOPMENT PROJECT
LIVESTOCK DEVELOPMENT PROGRAMME
PRELIMINARY RURAL APPRAISAL ON LIVESTOCK ISSUES
GENERAL INFORMATION a. Name of Peasant Association b. Name of Development Agent c. No. of Households in your PA d. Households No. in the list e. No. of adults in the household f. No. of children in the household QUESTIONS 1. How many cattle do you own? 2. How many are oxen? 3. If you do not own any oxen, how do you plough your land? 4. If you own one ox, do you use a donkey as well to plough? 5. If you don’t use a donkey, do you pay rent for another ox for ploughing? 6. How much rent do you pay for one ox for the whole ploughing period? 7. Do you ever use a milking cow to plough? 8. How much land do you plough? 9. How long does it take to plough? 10. Do you fatten the oxen after harvesting to sell them? 11. What do you feed the oxen every day? 12. Are they very fat or a little fat when you sell them? 13. How much money will you sell them for? (approximate) 14. How much does it cost you to buy new oxen for the next season? 15. Are any of them crossbred cows? 16. If so, how many of these do you have? 17. Are they thin when you buy them? Are they strong enough for work? 18. If not, what do you feed them to make them strong? 19. How many cattle are milking cows? 20. List their lactation ages (how many calves each one has had) 21. How many cattle are young females, which are older than suckling calves? 22. How many are young males, which are older than suckling calves? 23. Do you keep all your young females for milking cows? 24. If not, do you sell any? 25. If so, how many do you sell in one year? 26. How much money can you get for a young cow? 27. Do you sell any of your milking cows? 28. If so, how many do you sell in one year? 29. Do you rear the males? 30. If you do, why? 31. If you don't, what do you do with them? 32. If you sell them, how much money can you get for a young ox or bull? 33. If you sell them, how many do you sell in one year? 34. Do you have a bull? 35. If you do not have a bull, is there a village bull? 36. If you do not use a bull, do you use AI? 37. Why do you use AI?
Attachment IV-1
IV - A - 2
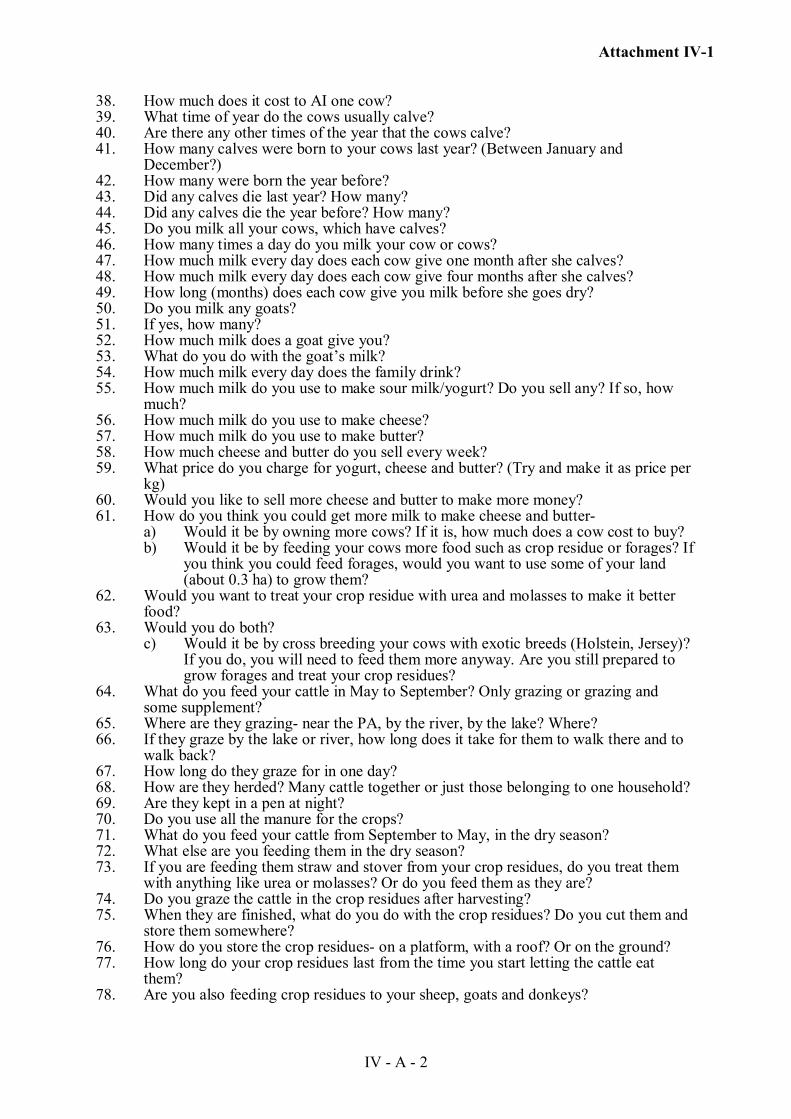
38. How much does it cost to AI one cow? 39. What time of year do the cows usually calve? 40. Are there any other times of the year that the cows calve? 41. How many calves were born to your cows last year? (Between January and
December?) 42. How many were born the year before? 43. Did any calves die last year? How many? 44. Did any calves die the year before? How many? 45. Do you milk all your cows, which have calves? 46. How many times a day do you milk your cow or cows? 47. How much milk every day does each cow give one month after she calves? 48. How much milk every day does each cow give four months after she calves? 49. How long (months) does each cow give you milk before she goes dry? 50. Do you milk any goats? 51. If yes, how many? 52. How much milk does a goat give you? 53. What do you do with the goat’s milk? 54. How much milk every day does the family drink? 55. How much milk do you use to make sour milk/yogurt? Do you sell any? If so, how
much? 56. How much milk do you use to make cheese? 57. How much milk do you use to make butter? 58. How much cheese and butter do you sell every week? 59. What price do you charge for yogurt, cheese and butter? (Try and make it as price per
kg) 60. Would you like to sell more cheese and butter to make more money? 61. How do you think you could get more milk to make cheese and butter-
a) Would it be by owning more cows? If it is, how much does a cow cost to buy? b) Would it be by feeding your cows more food such as crop residue or forages? If
you think you could feed forages, would you want to use some of your land (about 0.3 ha) to grow them?
62. Would you want to treat your crop residue with urea and molasses to make it better food?
63. Would you do both? c) Would it be by cross breeding your cows with exotic breeds (Holstein, Jersey)?
If you do, you will need to feed them more anyway. Are you still prepared to grow forages and treat your crop residues?
64. What do you feed your cattle in May to September? Only grazing or grazing and some supplement?
65. Where are they grazing- near the PA, by the river, by the lake? Where? 66. If they graze by the lake or river, how long does it take for them to walk there and to
walk back? 67. How long do they graze for in one day? 68. How are they herded? Many cattle together or just those belonging to one household? 69. Are they kept in a pen at night? 70. Do you use all the manure for the crops? 71. What do you feed your cattle from September to May, in the dry season? 72. What else are you feeding them in the dry season? 73. If you are feeding them straw and stover from your crop residues, do you treat them
with anything like urea or molasses? Or do you feed them as they are? 74. Do you graze the cattle in the crop residues after harvesting? 75. When they are finished, what do you do with the crop residues? Do you cut them and
store them somewhere? 76. How do you store the crop residues- on a platform, with a roof? Or on the ground? 77. How long do your crop residues last from the time you start letting the cattle eat
them? 78. Are you also feeding crop residues to your sheep, goats and donkeys?

Attachment IV-1
IV - A - 3
79. Where are the animals grazing- near the PA, by the river, by the lake, where? 80. Where are they getting their drinking water during the rains? 81. Where are they getting their drinking water during the dry season? 82. Are you growing leucaena trees on your land or by your house? 83. How many trees do you grow? 84. How much do you cut from your trees each day to feed the oxen or cows? 85. Do you grow any napier or elephant grass or any other forages to feed your cattle? 86. If so, how much? Which of your cattle do you feed? 87. If not, would you like to grow some if you knew it could help to get more milk or
make your oxen fatter? 88. Do you spray your cattle for ticks? 89. Which months do you spray? 90. How often do you spray your cattle in those months? 91. What do you use to spray them with? 92. Do you find it helps to keep the ticks away? 93. How much does it cost to spray your cattle at one time? 94. Do you vaccinate the cattle against any disease? Which ones? 95. When do you vaccinate? 96. Do you have a good crush to hold your animals when the vet comes or when the
livestock expert comes? 97. Do you dose your animals against worms? 98. When do you dose? 99. Do you dose the sheep or goats as well as the cattle? 100. How much does it cost to dose the animals at one time? 101. Did any of your oxen, cows or bulls die this year? 102. If so, how many? 103. Do you know why they died? 104. List the reasons. 105. Did any die last year? 106. If so, how many? 107. Do you know why they died? 108. List the reasons. 109. How many sheep do you have? 110. How many goats do you have? 111. Why do you keep sheep and goats? 112. Do you sell any? 113. If so, how many in one year? 114. How much money can you get for one sheep or one goat? 115. How many donkeys do you have? 116. Do you ever sell any donkeys? 117. How many do you sell in one year? 118. How much money can you get for one donkey? 119. Do you have any horses? 120. Do you ever sell any horses? 121. If so, how much money can you get for a horse? 122. How many chickens do you have? 123. How many eggs do you collect in one day? 124. Does the family eat any of the eggs, or are any used for cooking? 125. If so, how many eggs are eaten by the family in one day? 126. Do you sell any eggs? 127. How many do you sell every week? 128. How much money can you get for one egg? 129. Would you like to make more money out of eggs? 130. How do you think you could get more eggs to sell-
a) Buy more hens? If so, would you be able to feed them? b) Use a better breed of hen? Would they be able to resist disease? c) Feed your hens with more grain? Do you have enough grain?

Attachment IV-1
IV - A - 4
ANSWER SHEET - LIVESTOCKa. PA d. HH number in the list
b.Name of DA e. No. of adults
c. No. of HH f. No. of children
1. heads 49. months 89.2. heads 50. Yes No 90. times3. 51. heads 91.4. Yes No 52. liters 92. Yes No5. Yes No 53. 93. Birr6. Birr 54. liters 94. Yes No7. Yes No 55. liters8. ha Yes No 95. Yes No9. hrs. Birr 96. Yes No
10. Yes No 56. liters 97. Yes No11. 57. liters 98.12. Yes No 58. kg 99. Yes No13. Birr 59. Yogurt Birr per kg 100. Birr14. Birr Cheese Birr per kg 101. Yes No15. Yes No Butter Birr per kg 102. heads16. heads 60. Yes No 103. Yes No17. Yes No 61. Yes No 104.
Yes No Birr 105. Yes No18. Yes No 106. heads19. heads Yes No 107. Yes No20. heads 62. Yes No 108.21. heads 63. Yes No 109. heads22. heads Yes No 110. heads23. Yes No 64. Only Grazing Grazing+Supple 111.24. Yes No 65. River Lake ( ) 112. Yes No25. heads 66. hrs. 113. heads26. Birr 67. hrs. 114. Birr27. Yes No 68. Together Not together 115. heads28. heads 69. Yes No 116. Yes No29. Yes No 70. Yes No 117. heads30. 71. 118. Birr31. 72. 119. Yes No32. Birr 73. Yes No 120. Yes No33. heads 74. Yes No 121. Birr34. Yes No 75. 122. heads35. Yes No 123. pcs.36. Yes No 76. 124. Yes No37. 77. months 125. pcs.38. Birr 78. Yes No 126. Yes No39. 79. 127. pcs.40. Yes No 80. 128. Birr41. 81. 129. Yes No42. 82. Yes No 130. a. Yes No43. Yes No 83. trees Yes No
heads 84. b. Yes No44. Yes No 85. Yes No Yes No45. heads 86. c. Yes No46. heads Yes No47. liters 87. Yes No48. liters 88. Yes No

Attachment IV-2
IV - A - 5
QUESTIONNAIRE FOR
LIVESTOCK EXPERTS IN DUGDA BORA WAREDA.
1. Background 1.1 What is the type of climate of each of the PA’s- using the map of PA’s, shade in those
areas that are the most drought prone (poor rains), the ones that have the most rains, the ones that have medium rains. State under the map what you mean in terms of rainfall (mm per annum) for drought prone, medium, high.
1.2 What are the type of soils of each of the PA’s- Using the map of PA’s shade in the areas that are generally fertile soils, generally poor soils, waterlogged soils. State under the map what you mean by poor soils, waterlogged soils, fertile soils (e.g. clay sandy loam, black or red).
1.3 What is the vegetation of each of the PA’s. Give a list of all the PA’s, stating for each one the type of grass, shrubs and trees that are predominate there.
2. Purposes for rearing livestock. 2.1 Fill in table 1 of what you know about why people are rearing livestock in each PA-
cattle, sheep, goats, donkeys, horses. 2.2 Which PA’s have cross bred cattle? List them and as far as you know, the number of
cross bred cattle in those PA’s and the number of farmers who own them .How much milk do those cross bred cattle give? How are they being fed to give that milk?
3. Availability of feed resources. 3.1 Grazing
1) Give a list of PA’s with your opinion for each of them on what you think of the grazing good, medium and poor.
2) Give a list of PA’s that send their cattle to graze a lake (state which lake) or by a river, as well as use the grazing in their PA.
3) Give a list of PA’s that have plenty of trees and shrubs that the goats can browse. 4) How do the farmers herd their livestock for grazing? If it is done by the men, how
do they do it (in rotation, one men or several men?) When do they take the cattle out? How long do they take on their own grazing lands, and on the lake grazing lands? Do the children take the livestock out to graze? When? How ling does it take to get to the lake and back again? If there is a great variation by the PA’s on cattle herding management, list the PA’s and to the best of your knowledge, state how each one does it.
5) For each PA, state whether you think the rangelands are deteriorating and if so, Why? E.g. overgrazing (state your estimate of the stocking rate) or tree cutting?
6) For PA state where there are rules of management by the villagers. Also state if there is any attempt in that PA to conserve feed resources.
3.2 Forages. 1) How many farmers grow forage legume trees? Which ones (leucaena, sesbania?)
and how many farmers are growing them in each PA. Give a list. 2) How many farmers are growing forages such as legumes (e.g. vetch, cowpea),
elephant grass, napiers in their crop land? In their gardens?. Give a list of PA’s showing, to the best of your knowledge, the numbers farmers growing each type of forage and where they are grown in each PA.
3.3 Crop residues. 1) Fill in Table 2 what you know of how farmers feed their livestock the crop

Attachment IV-2
IV - A - 6
residues, in order of importance (e.g. do the oxen get the most residues because they are the most important? Then they would be number one. Do the cows get the same amount of residue- then they would be number 1 also, but if they get less than the oxen but more than the other livestock, then they would be number 2. If all the livestock get the same, they would all be number one).
2) Do any farmers treat their crop residues with urea or molasses to improve the nutritional quality? If there are, estimate how many you know about.
3) How long are the livestock in the field eating the leaves off the crop residue? Given an estimate.
4) What do the farmers do with the rest of the crop residue from the field? Do they store it? If so, where do they feed it to the animals
3.4 Any other feed 1) Give a list of any other feeds you know about that the farmers feed their
livestock e.g. do they cut any grass early to feed as hay? 2) Do they buy concentrates to feed for fattening or for milk or eggs? 3) Do they use any other food residues like brewery waste?
3.5 Water 1) Give an estimate of when the livestock generally get access to water in the rainy
season and in the dry season. 2) For each PA, state the main source of water and how it is managed by the
villagers. 4. Marketing
1) Fill in Table 3, giving an estimate of the number of each species livestock generally sold per farmer per year and the reasons for selling them
2) Where are the most popular marketing places for livestock and for livestock products (butter, cheese, eggs)? If there are more than one, give a list of PAs which generally favor each market place.
3) Do the farmers use middle men to market their livestock or livestock products? If so, are they happy with this arrangement or do they feel they are being cheated out of the real values of their livestock?
4) What are the major problems with livestock and livestock product marketing? 5. Livestock development
1) List any credit facilities that the farmer may use if he needs capital for development or improvement.
2) List any NGO’s working in the wareda who are assisting the farmers. If there are any, how are they assisting them?
3) What are the major problems of improvement of livestock production for the farmer?
4) Give your opinion on how you think improvement can be carried out in a feasible way.

Attachment IV-2
IV - A - 7
TABLE 1 : REASONS FOR KEEPING LIVESTOCK Put the number, which indicates the greatest importance of the reason for each species of livestock in each PA. Put in more then one number if they have equal importance. 1. Drought power 2. Milk and dairy products 3. Insurance against drought. 4. Fattening for sale 5. Manure 6. Wealth or status 7. Meat for household consumption 8. Eggs 9. Slaughtering for religious or holiday occasions.
TABLE 2 : FEEDING CROP RESIDUES Give with a number, the order of important in each PA, you estimate the class of livestock has in feeding on the crop residue that is stored for the dry season. If two classed (e.g. oxen and cows have the same important 1. Most important 2. Second in importance 3. Third in importance 4. Fourth in importance 5. Fifth in importance 6. Sixth in importance
TABLE 3 : NUMBER AND REASONS FOR SELLING LIVESTOCK In each square, provide and estimate of the number sold of each class of livestock and the reason with a letter provided below. If there are more than one reason, put in each important letter. Reasons for selling livestock. a. Cash for household requirements b. Cash for important occasions (wedding, funeral) c. Commercial transaction-part of the planned farm income d. To reduce livestock population during the dry season. e. Fear of death through disease of drought. f. To buy other animals g. To buy implements or farm inputs (fertilizer, pesticides, etc)

Attachment IV-3
IV - A - 8
FAO – Background Information
Visit : Food and Agricultural Organization
Consultant : Mr Gehre Mariam, National Program Officer
The mandate of FAO is to monitor and assist with global food security. To this end, their two major activities are:
1) To monitor the situation, collect, analyze and disseminate data on food security in a designated region logistically, this is carried out by government or parastatal employees.
2) To create fora for discussion and interaction among relevant institutions concerned with food security in a region.
FAO is thus in a good position to provide an objective assessment of the agricultural industry of a country.
Overview of the livestock industry in Ethiopia
Ethiopia is not self sufficient in food, particularly in livestock products and is a net importer of agricultural produces. The latter situation is largely due to little importance attached to livestock as a primary agricultural industry; in fact, it could be classified as a secondary industry, meeting only 30% of the country's requirements. This is exacerbated by
1) Prevalent of drought resulting in persistent loss of animals
2) Large herds or flocks kept as insurance against drought of disease yet with little input in management or nutrition and especially in conservation of grazing resources. This results in poor output per livestock unit: 7 kg choice beef compared with 50kg from a commercially produced steer, with average dressed weights of 110 and 240kg respectively. Average dressed weight of sheep only 10 kg from a 25kg mature animal compared with 20 kg from a 50kg commercially produced lamb.
3) Lack of infrastructure of transport, distribution and marketing of livestock products outside a radius of 150km around Addis Ababa There are no large commercial abattoirs, only small butcheries which buy animals on the open market and a municipal abattoirs, in Addis Ababa which handles700 animals a day when it has capacity for only 150 a day. Transport and distribution of milk is provided largely by the Dairy Development Enterprise to a small number of small-scale commercial farms which have cross bred dairy cattle and use AI. These are concentrated largely in Selale to the north of the city.
4) Little or no investment in commercialized livestock farming, while the prevalence of household supply of meat and milk in small urban and rural areas is still high There, most consumers of meat still prefer to slaughter an animal in their own back

Attachment IV-3
IV - A - 9
yard, keep their own layers and milk their own cows. There are no longer any large beef feed lots and only a few large broiler and layer enterprise. Cultural strictures have prevented any development of the pig industry.
5) Inadequate state support for upgrading of cattle in the small-holder livestock sector, Where cattle are raised mainly for draught power (cattle breeds are predominantly Zebu or Borana, neither of which are good milk producers.) Accordingly, on a national basis, veterinary and animal husbandry extension services are poor compared to that of crop and horticultural extension. National average crop yields with local varieties of seed are:
6) Wheat, 12-14qts (1qt=100kg)/ha; teff 7-8qts/ha; sorghum 14-16qts/ha; maize 14-16qts/ha. However, a two year scheme where farmers are provided with "packages" of upgraded varieties of seed and fertilizer has increased to40qts/ha.This should allow surpluses of grain over family consumption which will increase farmer income from crops. Four million farmers have joined this scheme.
7) No farm tenure and natural pastures grazed on a communal basis, hence no collective will to care foe, or improve, grazing lands, for improved productivity of animals. Most livestock owners are pastoralists to more or less degree. Land is given by Peasant Associations, under government administration, to the farmer. However, he cannot sell it or borrow capital, using land as collateral (although there are a small number of credit schemes which allow livestock as collateral or have been established among groups of women using their own funds). Generally, there are serious constraints on investment in farm improvements even if the will is there.
Nor withstanding these limitations to livestock development, local demand is high for meat and milk and livestock commodities fetch good prices on free market: -
Broiler chicken, 18Br/kg; beef, 12-25Br/kg (prices dependent on fat coverage); milk 2.50 Br/It There is also a good market for both cattle and sheep in the Middle East, with 42,600 sheep exported to Saudi Arabia so far in 2000 (before the ban)(ref. The Daily Monitor, 4th October 2000). 60% of the all exported sheep and cattle from Berbar to the Middle East comes from Ethiopia. Beef is the preferred meat over mutton or chicken in Ethiopia. In addition, hides are highly valued for thriving industries in tanneries, shoe and leather coat manufacturing. Leather is exported to Europe and Japan. Appropriate slaughtering technology is therefore being encouraged in abattoirs and butcheries in order to preserve hides. There is also a good market for milk and milk products in Addis Ababa (pop. 2.5 million) and the large towns (pop. av. 250,000) where no more than 30% of the demand is being met. (This suggests that Meki close to Ziway and Debra Zeyit has potential for meeting part of that demand)
Potential for livestock development
Feed is the major constraint to development of the livestock industry. Concentrates and hay are very expensive, yet molasses and urea, both essential ingredients in many commercial

Attachment IV-3
IV - A - 10
feeds, are cheap and readily available. Improved pastures and absence of responsibility for natural pasture part of the arable land, alley cropping with legume forage trees and uptake of low-cost conservation technology of treated crop residues and high-quality forage crops.

Attachment IV-4
IV - A - 11
Estimation of Nutrient Intake of Livestock
There is no research data for estimation of grazing capacity of the natural vegetation in the Meki area. It is assumed that the grazing capacity of the Meki area is equivalent to Natural Region 4 in Zimbabwe, which is categorized in to semi-arid climatic zone with middle veldt (African savanna), of which grazing capacity is defined to be 8 ha per TLU (Tropical Livestock Unit : 270 kg of live-weight) (Oliver and Topps, 1990).
The total land under grazing animals in the Meki area is 75,335.33 ha. The total grazing capacity amounts to 9,416.9 TLU.
On the other hand, the total TLU in the Meki area is estimated to be 155,462 on the basis of animal population and the average live-weight as summarized below.
Livestock Species Population (Heads) TLU Total TLU ha per animal
Cattle 206,300 0.70 144,410 0.33 Sheep 28,473 0.08 2,278 0.044 Goats 60,772 0.06 3,646 0.044 Donkeys 12,164 0.40 4,866 0.2 Horses 525 0.50 262 0.2 Total 155,462
Since actual grazing is 0.48 ha per TLU(75,335ha / 155,462 TLU), the stocking rate 16.5 times as much as grazing capacity (8ha / 0.48ha). The actual stocking rate for each animal is also summarized in the table.
Total number of households = 52 PA x 417 (av) households =22,516.
Average number of LU per household = 5.9 (6)
Typical farm has 0.45 ha of grazing land giving 4500 kg dry matter production per ha. (Bekele, 1991). However, available consumption forage produced annually from pastureland is assumed to be 50% of gross production because of cattle selectivity and trampling, use by wildlife and loss due to fire (Houerou and Hoste, 1977). Therefore, work on 2,250 kg per ha. 0.33 ha for cattle =742.5 kg dry matter/ cow or ox Crop residue
Tons per household of crop residue = 2.65 tons.
Crop reside per TLU= 0.44 tons of 440 kg (amount per cow).
0.7 TLU = 308 kg crop residue per ox =277.2 dry matter
Nutrient supplied: DM ME (MJ)/kg DCP (g/kg). Pasture 45 8.0 56 Residue 90 6.0 40 Treated residue 90 9.0 80

Attachment IV-4
IV - A - 12
Cross-bred cow = 1 TLU. Have to assume cow gets at least 0.5 ha of paddock (leased) At 2,250 kg per ha, this amounts to 1,125 kg DM and crop residue of 440 kg crop residue.
Nutrient intake per cow per annum:
Forage DM ME DCP Grass 1,125 9,000 63,000 Treated Residue 440 3,960 35,200 Total 1,565 12,960 98,200 Per day: 4.28 35.5 269 Need 12.0 115 948 Balance 7.7 79.5 679
Nutrients supplied by pennisetum / lablab: 32% DM, 9.5 MJ/kg DM ME, 125 g/kg DCP
Need to feed per cow: 7.7kg DM: 24 kg silage (2 bags a day)
This provides 73.15 MJ ME, and 962.5g DCP, which cover the deficit.
Nutrient intake per ox per annum:
Forage DM ME DCP Grass 742 5,940 41,580 Treated residue 277 2,493 22,160 Total 1,019 8,433 63,740 Per day 2.79 23.10 174.6 Need 7.0 63 405 Balance 4.21 39.9 230.4 12 kg silage (1 bag/day)
3.84 36.48 480
This would be adequate. So, to feed two cows and two oxen per day, need 6 bags/ day silage = 72 kg silage. This would require a total production per annum of 26.3 tons or 2,190 bags.
Under irrigation, one hectare can produce 90 tons as fresh matters. So, 0.3 ha can produce 27 tons or 27,000 kg silage (2,250 bags). This allows supplement of silage for 2.6 TLU of 60 bags or 23 bags/ TLU. This provides 0.1 kg per day for sheep and goats. Under minimal irrigation, one hectare can produce 60 tons as fresh matters. This condition would need more land, say, 0.5 ha. So, 0.5 ha can produce 30 tons or 30,000 kg (2,500 bags). This allows supplement of silage for 2.6 TLU of 310 bags or 119 bags/ TLU. This would be one bag a day per TLU for about 4 months in the dry period.
What’s left of crop residue? Two cows take 880 kg and two oxen take 554 kg, a total of 1,434 kg. Balance from 2,650 kg is 1,216 kg of treated reside. This is for 2.6 TLU (balance from 6 TLU) giving 467.6 kg /LU or 3.89 kg /day for 4 months dry period.

Attachment IV-4
IV - A - 13
Conclusion:
It is possible to milk two cross-bred cows and fatten two oxen on (i) one (1) ha of fertilized paddock to graze cows, (ii) crop residues treated with urea and molasses and (iii) 0.3 ha of full irrigation or 0.5 ha minimal irrigation for cows and oxen with a small supplement of silage for the sheep and goats.
Other notes: Veld management in Zimbabwe (Clatworthy, 1998)
Veld grass has 6.0 MJ/kg. Cow eats 1.2 –1.5 % of body mass with no supplement. Forage has protein content of 30 g/kg. In Zimbabwe communal areas: estimated that average live-weight of animals are 167 kg (0.53 TLU) for cattle and 30 kg (0.10 LU) for sheep and goats.
Average weight of Zebu ox = 295 kg (1.09 TLU)
Average weight cow = 230kg (0.85 TLU)
Sheep male = 35kg, female = 25 kg
Goats male = 30 kg, female = 25kg
Horses = 150 kg
Donkeys = 97kg
References:
1) Bekele, S. 1991. Crop-livestock interaction in the Ethiopian highlands and its effects on sustainability of mixed farming: A case study from Ada district. Unpublished Msc these is, Agricultural University of Norway, Oslo.
2) Clatworthy, 1998. veld management in Zimbabwe. 1998 Beef Handbook. Publ. Zimbabwe Cattle producers Association.
3) Houerou, Le H.N. and H.C. Hoste. 1977. Rangeland production and annual rainfall relations in the Mediterranean Basin and in the Africa Shahelo- Sudanian zone. J. Range Management 30(3): 181-189.
4) Topps, J.H. and Oliver, J.1993. Animal foods of Central Africa. Technical Handbook No. 2. Zimbabwe Agricultural Journal. Harare, Zimbabwe.

Attachment IV-5
IV - A - 14
Large Scale Dairy Farm in Mojo
Mojo dairy farm is the state farm, which supplies milk to the Dairy Development Enterprise in Addis Ababa. It is operated by one manger and his assistants with a number of workers.
General : The farm is 90 ha in size and milks 70 cows. The cows are the cross-bred of 3/4 Holstein and 1/4 Zebu. Average daily yield is 15 liters a cow, ranging from 20 liters at peak to 10 liters mid-late location. There are 215 cows in total, of which 13 are dry, 9 are pregnant heifers, 50 are over 18 months old, 30 are 6-18 months and 3 are 3-6 months. There were 7 male calves- all get sold to the butcher in Mojo - and 6 female calves. It doesn’t add up to a 12 month calving interval- should be 35 heifers under one year. Milk price 1.50 birr/liter. No premium for butterfat or protein, although milk is tested. Average butterfat percent is 4.8. No national milk recording scheme.
Feed : Feed is forage based with supplement. There is irrigation for 5 ha and this is rotates. Forages include maize, vetch and oats. Maize and oats are intercropped under irrigation and ensiled in a pit. Maize is also fed green together with vetch to cows twice a day while they are being milked. They are also fed a basal supplement of 0.5 kg meal going up to 1 kg for those giving more than 15 liters. The meal consists of wheat, bran. salt, chapped straw and crushed haricot bean. They used to get bone meal but that has become expensive and is no loner supplied. At night, after milking the cows are fed ad-lib hay (straw?) and in the morning after milking they are sent out to graze-grass appeared to be mostly paspalum. Apparently it was not considered worth planting with improve pastures- management requirements too high.
Reproductive management: Heifers are bred at 18 months- calve at 2 years. Calving interval of 12 months (rather amazing- considering the number of non- pregnant heifers). Breeding done with AI. No worry about disease resistance in pure bred Holstein- with proper nutrition and prophylaxis, they are apparently as hardy as the cross-breds. The cows looked in reasonable body condition- milkers around 2.25 BCS.
Calf rearing: Calves are fed colostrums for first nine days, then go on to milk. Incredibly, fed milk for 18 months before weaning! Calf mortality is 10%.
Milking routine: There are seven milkers- 10 cows each- and only take about 30 minutes to milk all cows. This suggests only 3 minutes per cow which is very fast (average hand milking time is 10 minutes) However, preparation minimal- udders washed with a sponge (amazing so little mastitis), no drying, and teat dipping afterwards with an iodophor. Milk is stored in cans, which are kept in a cold room (this means about 1050 liters a day, about 23 cans, must be large cold room). The cans are delivered to Mojo chilling center where every two days, they are emptied in to the tankers which comes from Addis Ababa.
General notes: Manager thinks dairying is profitable provided forage is the basal diet. Protein concentrates are too expensive, destroy viability. Pregnant heifers can sell for 3000br, while cull cows (even pregnant) sell for 2.50 br. /kg. The cows looked to be about 400 kg –this puts the price at 1000 br. The sugar factory is 25 kms from Mojo and sells molasses at 9 br. for 250 kg.

Attachment IV-6
IV - A - 15
Dairy Development Enterprise and Dairy Marketing
The factory is state owned and was built equipped fifty-three years ago. The machinery is very old and is only kept going though resourceful engineers. The farms that supply milk to this factory are also state owned and there are ten of them, situated around Addis Ababa with in a radius of 120 km. The factory thus as chilling centers within this radius, to which the farms send their milk. Trucks are provided to collect cans from the farms- one truck per 50-60km. There are three tankers, one of 12000 It and two of 5000 it capacity, which collect milk from the chilling centers and deliver to the factory every second day. The factory can take more milk- it is working under capacity- and if Meki were to become a milk producing center, milk could be delivered to the Mojo or Nazaret chilling centers (possible to install a chilling center in Meki through project) However, it is expected that the farms cool their own milk first before transporting it to the chilling center. (Use flowing irrigation water through immersion tank in which to immerse cans?)
The milk is given sensory evaluation tests as well as alcohol and lactometer tests before acceptance at the chilling center. Milk is further tested at the factory for methylene blue test, specific gravity (total solids) and butter fat. Antibiotics and water are only tested for if cheese or yogurt production has failed. Pasteurized milk and dairy products are all tested by the quality and standards Authority. BF% average 3.8-4.0. The milk is standardized to 2.8% and the cream used to make butter, cream, yogurt and cheese. Milk is pasteurized at 70’C for 15 seconds, cooled to 4’C. Cream, yoghurt and butter sold under the name of sholo products. Mostly the cheese is the local variety- Ibe cheese (made from any sour milk that is delivered. Milk is soured when the chilling centers break down) but during the fasting season, (70 days fasting season per year, also every Wednesday and Friday) When demand for dairy products is low, the milk is used to make Gouda cheese instead (8000-9000 kg/year). This is sold to supermarkets and hotels largely for consumption by the wealthy local populace and foreigners. Milk is not delivered door-to-door but is delivered to hospitals, supermarkets, hotels, other institutes. Also, there are four sales depots, including one at the factory, and five kiosks in Addis where milk and dairy products are sold. Consumer price of their milk is 3br/ liter (but 4.50br./liter in the supermarket). There is no quality premium scheme for raw milk.
The reason milk and dairy products to houses is that there are many households who still have cows which are actually kept in the houses. The owners buy concentrates from a commercial stock feed supplier and hay from farmers who bring in their hay by donkey. Some householders have two or three cross bred cows which can give up to 10 liters a day and sell their own. Milk Consumers boil the milk they buy from this source. The cross-bred cows are bought directly from private farms-quite often they are cull cows. The milk is sold for between 1.75 br./ liter up to 3 br. Per liter. This is a major constraint to development of commercial dairy processing.

Attachment IV-6
IV - A - 16
There are three farms on Selale road (100 km), one on Holator(?) road, one on Hshata road, three on Nazaet road (one near Mojo, one near Addis, one near Nazaret but the latter is not yet operational Average production per farm is 750 liters- range 600 to 1000 liters- per day. Average 90 milking cows, all crossbred Zebu x Holstein. Many are now 3/
4 Holstein. Only one farm has Jersey breed and cross breed. All hand milked-machine milking not possible due to poor supply of spare parts and tendency to mastitis.
There are also small holder dairy farms on the way to Selale and they process their own milk for sale.
Dairy farming is not viable without supply of farm-grown forage. Hay costs 6br./bale in the rains and up to 8 br/ bale in the dry season. However, only three of the farms produce silage, most of them produce hay using balers (forages, pastures-check?-especially on those farms with irrigation)
Farmer price only 1.25 br./ liter-less than half of the consumer price.
Good herd health programs on the farms. Cows and workers tested for TB and CA.
Factory and farms (all of Dairy Development Enterprise) is up for sale to the private sector. Only one business man has shown interest so far but the concern of the manager is that he has many enterprise and may not spend the time and commitment needed for sustainability of this operation.

Attachment IV-7
IV - A - 17
Site Inspection by Dr. M. Titterton-Livestock Expert, JICA Study Team Persons Contacted
Mr. Tamirat , Head for Bureau of Agriculture for Dagda Bora Wareda of Oromia
Mr. Teshoma Amare, livestock development expert.
Mr. Brehanu Gibre Medin, agronomist expert.
The experts report to the East Shewa Agricultural Office in Nazareth. They have thirty-five extension officers, called here, development agents (DA's), who live in the peasant associations (PA) and are trained by the experts.
We requested the names of five PA's deemed to be representatives of the wareda and were taken to visit one, Bekela Givisa. However, on inspection of the map of the PA's it appeared that the PA's were all grouped around Meki and did not represent the wareda as a whole.
We also met two veterinary assistants (probably equivalent to the DA's) under the Veterinary Officer, one of the experts in the Bureau of Agriculture.
These were: Messrs Kebchew Ayalew and Mengestu Feyissu.
Mr. Teshoma and Mr. Ayalew (or his superior, the vet. ) could be my counterparts as they are based at the project site and should benefit the most from training and/or interaction with the team.
The Study Area
Dugda Bora Wareda is nearly the same as the Meki study area and is therefore a useful area from which to extract data for PRA's There are 54 PA's in this wareda, each of which have an average of 400 households (ha?- check, because Bekela Givisa had 876 households) on about 1300ha. Each PA is administered by a management committee consisting of the Chairman, Secretary and five farmers. ) Is DA co-opted on to this committee?)
Visit to Bekela Givissa
There are 876 households here, with and average arable cropping area of 1.5 ha each, a total of approximately 1300ha. However, land is not equally apportioned, it depends on family size initially. The families comprise the initial two adults, five grown children (of about eight children, this number cannot get employment and are forced to stay with their parents). Of these, three may be married and have children of their own-generally there are about five young children in the family at any one time. Hence there is a total of 10 adults and five children on average per household. This has led to an over dependence on the land for food and income.
The grazing land totals 300ha. There are no grazing schemes and much of the grazing is near the lake. There is a well in the PA, from which clean well water is available at about 10 liters

Attachment IV-7
IV - A - 18
per household (apportioned by water committee, depending on size of family.) 500 liters of water costs 1br. Lake water is not used as it is apparently contaminated and has bilharzias (many of the children have bilharzia). Lake water can be boiled but firewood is valuable and scarce. The wood is taken from the Amark bofufu (local name) tree which is found by the lake. Thatching for house roofing is reed, taken from around the lake. The houses we saw were not representative of the typical housing-they were made from brick, and were apparently built by the previous government. Most houses are made from poles plastered with mud.
Livestock
Oxen : Approximately 40% of the households have two oxen, while 60% have one. Those with one ox either use a donkey to plough with the ox pay rent of 300br. to hire and ox. The total number of oxen in this PA is therefore about 1400. Some households (wasn't told the actual number) fatten their oxen on crop residues and cut leukaena (from the start of harvesting for three months) and sell them to the butcheries (price?- at a guess, around 12br./kg dressed weight, or 1300br. pre ox), buying cheaper (thinner younger?) oxen (average price 600-700br. per ox) on the market for ploughing, so making a profit of about 1400br. (Check)
Milking cows : There are an average of 6 milking cows per household giving total average of about 8 liters a day. Of this, about 0.5 of a liter (1/2 a cup each) is consumed by the children. The remainder is made into yogurt, butter and cheese (local name Ibe cheese). The milk is skimmed for butter making and the skim milk is fermented for yogurt. Most of the yogurt is consumed by the family as part of their staple diet. The butter and cheese is sold in Meki The cheese sells for 10br. a pot. One pot looked as though it contained about 750gm, so cheese must sell for about 13br.-14br./kg (price of butter?) Note: if milk price to farmers is 2.50br./liter, and it takes 10 liters to make l kg of cheese, farmer is not profiting through cheese, which is normally a value-added product. The income from butter and cheese is used to obtain salt, sugar, oil and other household necessities. Total number if milking cows: 5300 for this PA. Cows are not supplemented on summer grazing but do get come residues in the dry season (wasn't told how much-check). Some farmers have a bull, some depend on a wandering bull, some use AI (cross-breeding) One-bull costs 2000-3000br.
Sheep and Goats : Average number per household-2 sheep, 2goats. Total-approx. 3500 sheep and goats for this PA. Sold for special occasions and one slaughtered for family consumption once a year on a religious holiday but not generally eated by the family. No school fees (children schooled from 7-20 years of age), so no need to sell them for this.
Donkeys : Average number per household is 2. Total 1750 for this PA. Value: 300-350br. Used for carting, assisting with ploughing.

Attachment IV-7
IV - A - 19
Chickens : Average number per household: 6 layers. No broilers, chicken normally not eated by the family except on special occasions. Two- therr eggs a day, hence one dozen a week. Eggs are sold in Meki for about 4.50br. dozen. (How many eggs consumed by family-check)
Note 1: apparently most of the protein consumed by the family comes from yogurt, eaten with the Injira. Only 5% of the households grow vegetables. Seems a very unbalanced diet, yet the children looked strong and healthy.
Note 2: the cattle were in generally poor condition- around BCS 1.5-2.0, which was surprising to some extent considering it was just after the rains and if they were grazing by the lake, there should be a reasonable amount of vegetation (need to check this). The donkeys, sheep and goats, on the other hand, looked in good condition, around BCS 3.5-4, indicating that the grazing met their maintenance requirements, being much lower than cattle.
Cropping:
1) maize: 1200kg/ha (range 1000-1600kg/ha) Price 125 br./100kg (qt)
2) teff: 800kg/ha (range 600-1000kg/ha) Price 235br./100kg(qt)
3) wheat: 600kg/ha (range 600-2000kg/ha) 160br/100kg(qt)
4) barley 600kg/ha
5) sorghum 800kg/ha
6) haricot bean 1200kg/ha (range 1000-2000kg/ha)
All used (haricot bean) in the making of Injira - with the size of the families, not much if any, to sell. Some maize is milled to make beer, which is sold.