table of contents - jogh.org s2 provides definitions and data sources for all indicators included in...
TRANSCRIPT

1
Supplementary Data: Reduction in child mortality in Ethiopia: analysis of data from demographic and health surveys
Table of contents
A. Additional details for the methods section ................................................................................ 2
B. Mortality analysis ........................................................................................................................ 4
C. Additional details regarding the LiST analysis ............................................................................. 8
2
A. Additional details for the methods section
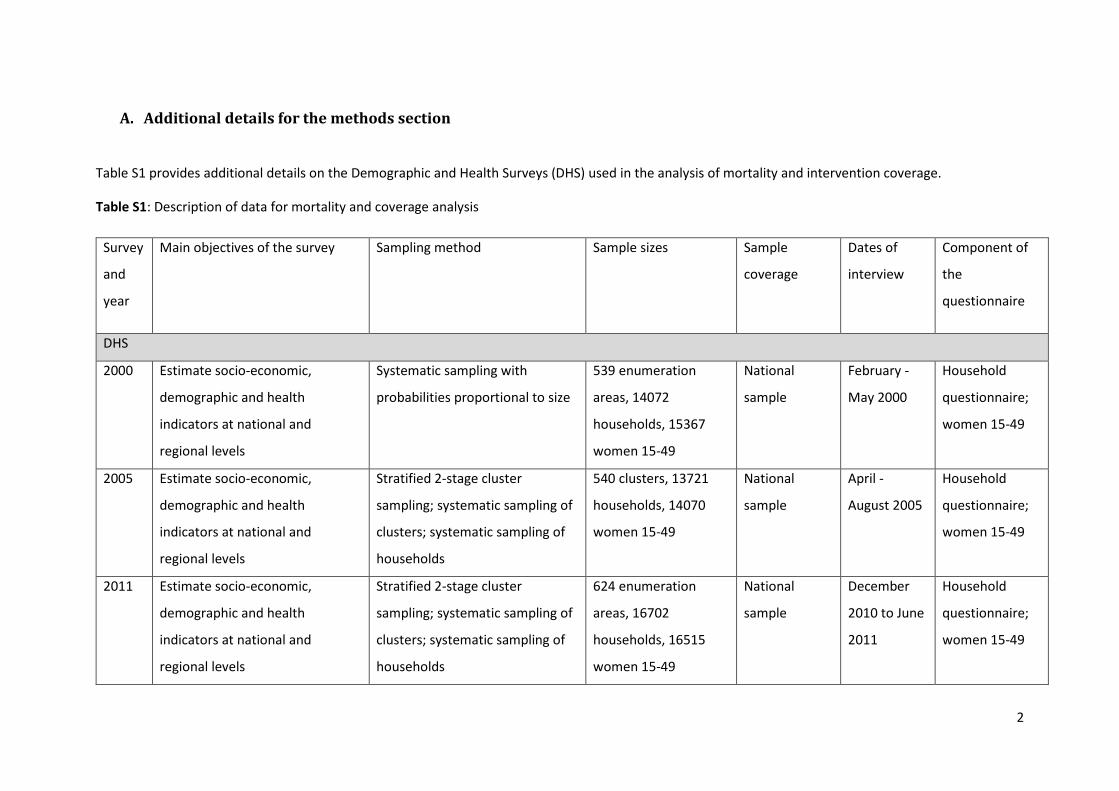
Table S1 provides additional details on the Demographic and Health Surveys (DHS) used in the analysis of mortality and intervention coverage.
Table S1: Description of data for mortality and coverage analysis
Survey
and
year
Main objectives of the survey Sampling method Sample sizes Sample
coverage
Dates of
interview
Component of
the
questionnaire
DHS
2000 Estimate socio-economic,
demographic and health
indicators at national and
regional levels
Systematic sampling with
probabilities proportional to size
539 enumeration
areas, 14072
households, 15367
women 15-49
National
sample
February -
May 2000
Household
questionnaire;
women 15-49
2005 Estimate socio-economic,
demographic and health
indicators at national and
regional levels
Stratified 2-stage cluster
sampling; systematic sampling of
clusters; systematic sampling of
households
540 clusters, 13721
households, 14070
women 15-49
National
sample
April -
August 2005
Household
questionnaire;
women 15-49
2011 Estimate socio-economic,
demographic and health
indicators at national and
regional levels
Stratified 2-stage cluster
sampling; systematic sampling of
clusters; systematic sampling of
households
624 enumeration
areas, 16702
households, 16515
women 15-49
National
sample
December
2010 to June
2011
Household
questionnaire;
women 15-49

3
Table S2 provides definitions and data sources for all indicators included in the coverage trend analysis
Table S2: Indicators included in the coverage analysis
Packages Coverage indicators Indicator definition Data source Antenatal care
Tetanus toxoid vaccination
Proportion of women with a live birth in the last 2 years who received at least 2 doses of tetanus toxoid vaccine during the last pregnancy
Ethiopia Demographic and Household Surveys
Childbirth Skilled attendant at birth
Proportion of births attended by skilled health personnel (doctor, nurse, midwife, auxiliary midwife)
Ethiopia Demographic and Household Surveys
Breastfeeding Breastfeeding initiation
Proportion of newborns put to the breast within one hour of birth Ethiopia Demographic and Household Surveys
Exclusive breastfeeding prevalence (0-5 months)
Proportion of infants aged 0-5 months of age who are exclusively breastfed Ethiopia Demographic and Household Surveys
Preventive care
Preventive postnatal care Proportion of mothers who received a postnatal care visit within two days of birth Ethiopia Demographic and Household Surveys
Vitamin A supplementation
Proportion of children 6-59 months who received at least one high dose Vitamin A supplement in the last 6 months
Ethiopia Demographic and Household Surveys
Improved water source
Proportion of the population using improved drinking water sources Ethiopia Demographic and Household Surveys
Improved sanitation facilities
Proportion of homes with access to an improved latrine or flush toilet Ethiopia Demographic and Household Surveys
ITN use
Proportion of children under 5 years of age sleeping under an insecticide treated net the previous night
Ethiopia Malaria Indicator Surveys
Vaccines DPT3
Proportion of children 12-23 months of age who received the third dose of DPT or Pentavalent vaccine
Ethiopia Demographic and Household Surveys
Measles
Proportion of children 12-23 months of age who received measles vaccine Ethiopia Demographic and Household Surveys
Curative care Diarrhoea Proportion of children under 5 years of age with diarrhoea in the last 2 weeks who received ORS
Ethiopia Demographic and Household Surveys
Suspected Pneumonia Proportion of children under 5 years of age with ARI symptoms in the last 2 weeks whose mothers/caregivers sought care
Ethiopia Demographic and Household Surveys
Malaria
Proportion of children under 5 years of age with fever in the last 2 weeks whose mothers/caregivers sought care on the same or next day
Ethiopia Malaria Indicator Surveys
Proportion of children under 5 years of age with fever in the last 2 weeks who received any antimalarial treatment
Ethiopia Malaria Indicator Surveys

4
B. Mortality analysis Method of computation of under-five mortality rates
Under-five mortality rates were computed for successive five year periods preceding the 2000, 2005
and 2011 DHS using direct methods based on complete birth histories as recommended by the DHS
statistical guide1. For each five-year period, age-specific mortality probabilities were computed for
eight age groups: 0, 1-2, 3-5, 6-11, 12-23, 24-35, 36-47, 48-59 month using a synthetic cohort concept.
This approach involves approximations of the number of children who enter an age range during a
specific period. The resulting survival probabilities of death for each age interval were chained
together to estimate the survival probability at age five, which was then converted into the under-five
mortality rate.
The death rates in this paper are calculated using the following formula:
The estimated probability of death in age-interval I in period j:
Pr(ji) = 𝒅𝒅𝒅𝒅𝒊𝒊 𝒏𝒏𝒅𝒅𝒊𝒊�
where dji is the total number of deaths in period j for age-group i in 0, 1-2, 3-5, 6-11, 12-23, 24-35,
36-47, 48-59 months and nji is the total number of at risk.
The Life Table method then calculates survival probability as the product of 1 minus the conditional
probability of death of all age-intervals as follows:
S(ji) = ∏ (𝟏𝟏 − 𝐏𝐏𝐏𝐏(𝒅𝒅𝒊𝒊)) 𝒊𝒊=𝟒𝟒𝟒𝟒−𝟔𝟔𝟔𝟔𝒊𝒊=𝟔𝟔 for all i in 0, 1-2, 3-5, 6-11, 12-23, 24-35, 36-47, 48-59 months.
Therefore Under 5 mortality rate = (1- Sj(i)) x 1000
The standard errors for the computed under-five mortality were obtained using Jackknife repeated replications procedures.2
Calculation of average annual change (AAC) in mortality
The Average Annual Change in mortality between year 1989 and 2009 was calculated on the log scale assuming linear change as per the below formula:
𝒓𝒓 = �𝒍𝒍𝒏𝒏�𝒎𝒎𝟐𝟐𝟔𝟔𝟔𝟔𝟐𝟐
𝒎𝒎𝟏𝟏𝟐𝟐𝟒𝟒𝟐𝟐�� (𝟐𝟐𝟔𝟔𝟔𝟔𝟐𝟐 − 𝟏𝟏𝟐𝟐𝟒𝟒𝟐𝟐)�

5
Tables S3a, b and c below give under-five mortality estimates for 5 year periods preceding the 2011 DHS with 95% confidence intervals for national, urban and rural areas. Data is from the Ethiopia 2011 DHS.
Table S3a: National under-five mortality rates based on 5-year periods preceding the 2011 EDHS, with the associated 95% confidence intervals.
5 year periods prior to the 2011 DHS
Estimate 95% confidence interval LL UL
1982-1986 227 187 268 1987-1991 218 183 252 1992-1996 212 176 248 1997-2001 165 147 184 2002-2006 133 119 146 2007-2011 88 78 98
Table S3b: Under-five mortality rates in urban areas based on 5-year periods preceding the 2011 EDHS, with the associated 95% confidence intervals.
5 year periods prior to the 2011 DHS
Estimate 95% confidence interval LL UL
1982-1986 102 35 169 1987-1991 144 101 186 1992-1996 145 101 188 1997-2001 111 78 144 2002-2006 97 72 123 2007-2011 69 44 93
Table S3c: Under-five mortality rates in rural areas based on 5-year periods preceding the 2011 EDHS, with the associated 95% confidence intervals.
5 year periods prior to the 2011 DHS
Estimate 95% confidence interval LL UL
1982-1986 247 195 299 1987-1991 230 200 259 1992-1996 223 191 256 1997-2001 174 159 189 2002-2006 138 125 152 2007-2011 91 81 100

6
Figure S1 below shows the trend in under-five mortality (1972-2011) in 5-year periods using data from three national household surveys.
Figure S1: Trend of under-five mortality rate based on 5-year periods preceding three national household surveys: DHS 2000, 2005 and 2011.
Dates on the x-axis represent 5-year periods preceding the surveys.
0
50
100
150
200
250
300
350
Mor
talit
y in
chi
ldre
n yo
unge
r tha
n 5
year
s (de
aths
pe
r 100
0 liv
e bi
rths
)
5 year period
DHS 2000 DHS 2005 DHS 2011

7
Table S4 below provides the under-five mortality rates for 5-year periods preceding three Ethiopia national household surveys.
Table S4: Trends in national under-five mortality rate and sample size from DHS 2000, 2005 and 2011, Ethiopia
U5MR (per 1000 live births) 5 year periods prior to the surveys
DHS 2000 DHS 2005 DHS 2011
1972-1976 235 1977-1981 241 241 324 1982-1986 232 223 227 1987-1991 216 198 218 1992-1996 211 164 212 1997-2001 166 141 165 2002-2006 123 133 2007-2011 88 Sample size (household)
14072 13721 16702
Figure S2: Under-5 mortality rates in the poorest and richest wealth quintiles, Ethiopia, 1996-2011
0
50
100
150
200
250
1996-2000 2001-2005 2007-2011
Mor
talit
y in
chi
ldre
n yo
unge
r tha
n 5
year
s (de
aths
pe
r 100
0 liv
e bi
rths
)
5 year periods preceeding the 2000, 2005 and 2011 DHS
Poorest 20% Richest 20%

8
Figure S3: Under-5 mortality rates by education level of the mother, Ethiopia, 1996-2011
*Sample size too small in 1996-2000 for stable estimate
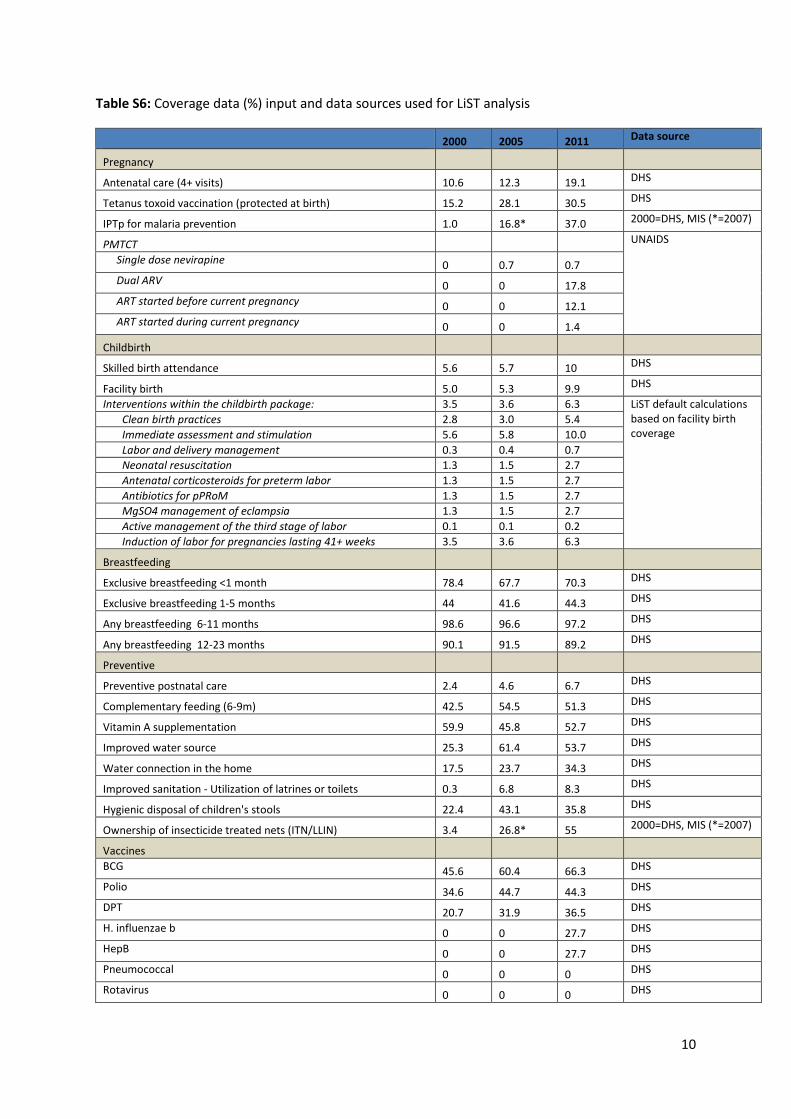
C. Additional details regarding the LiST analysis Table S5 shows the data sources used for the baseline characteristics - population, fertility, mortality rates, causes of death and nutrition – for the Ethiopia LiST analyses. Coverage data for key indicators, as well as broader health system indicators, were extracted from all of the available household surveys and other datasets for each time point available and entered into the projections. When coverage data for immunizations was not available from national surveys (e.g. for Hib, Hep B, and pneumococcal conjugate vaccine), WHO/UNICEF coverage estimates were used. Data were interpolated between surveys. Table S6 provides coverage inputs and data sources used in the LiST analysis. For interventions within the childbirth package for which coverage estimates are not available from national household surveys, LiST imputes coverage estimates based on facility birth coverage and skilled attendance at birth coverage. A formula based on facility delivery coverage is used to calculate coverage of basic and comprehensive emergency obstetric care, antenatal corticosteroids, antibiotics for preterm premature rupture of membranes, induction of labour lasting 41+ weeks, active management of the third stage of labour, immediate assessment and stimulation, and neonatal resuscitation. A formula based on home delivery coverage is used to calculate clean birth practices at home and neonatal resuscitation at home. These formulae can be found in the LiST Manual.
0
20
40
60
80
100
120
140
160
180
200
1996-2000 2001-2005 2007-2011
Mor
talit
y in
chi
ldre
n yo
unge
r tha
n 5
year
s (de
aths
pe
r 100
0 liv
e bi
rths
)
5 year periods preceeding the 2000, 2005 and 2011 DHS
No education Primary Secondary More than secondary*

9
Table S5: Additional data used to create LiST projections Indicator Source Population UN estimates* Total fertility rate Demographic and Health Surveys Stunting, wasting rates Demographic and Health Surveys Cause of death UN estimates Mortality (under-5, infant, neonatal) UN estimates*
*Source: www.childmortality.org
10
Table S6: Coverage data (%) input and data sources used for LiST analysis
2000 2005 2011 Data source
Pregnancy
Antenatal care (4+ visits) 10.6 12.3 19.1 DHS
Tetanus toxoid vaccination (protected at birth) 15.2 28.1 30.5 DHS
IPTp for malaria prevention 1.0 16.8* 37.0 2000=DHS, MIS (*=2007)
PMTCT UNAIDS
Single dose nevirapine 0 0.7 0.7 Dual ARV 0 0 17.8 ART started before current pregnancy 0 0 12.1 ART started during current pregnancy 0 0 1.4
Childbirth
Skilled birth attendance 5.6 5.7 10 DHS
Facility birth 5.0 5.3 9.9 DHS
Interventions within the childbirth package: 3.5 3.6 6.3 LiST default calculations based on facility birth coverage
Clean birth practices 2.8 3.0 5.4 Immediate assessment and stimulation 5.6 5.8 10.0 Labor and delivery management 0.3 0.4 0.7 Neonatal resuscitation 1.3 1.5 2.7 Antenatal corticosteroids for preterm labor 1.3 1.5 2.7 Antibiotics for pPRoM 1.3 1.5 2.7 MgSO4 management of eclampsia 1.3 1.5 2.7 Active management of the third stage of labor 0.1 0.1 0.2 Induction of labor for pregnancies lasting 41+ weeks 3.5 3.6 6.3
Breastfeeding
Exclusive breastfeeding <1 month 78.4 67.7 70.3 DHS
Exclusive breastfeeding 1-5 months 44 41.6 44.3 DHS
Any breastfeeding 6-11 months 98.6 96.6 97.2 DHS
Any breastfeeding 12-23 months 90.1 91.5 89.2 DHS
Preventive
Preventive postnatal care 2.4 4.6 6.7 DHS
Complementary feeding (6-9m) 42.5 54.5 51.3 DHS
Vitamin A supplementation 59.9 45.8 52.7 DHS
Improved water source 25.3 61.4 53.7 DHS
Water connection in the home 17.5 23.7 34.3 DHS
Improved sanitation - Utilization of latrines or toilets 0.3 6.8 8.3 DHS
Hygienic disposal of children's stools 22.4 43.1 35.8 DHS
Ownership of insecticide treated nets (ITN/LLIN) 3.4 26.8* 55 2000=DHS, MIS (*=2007)
Vaccines
BCG 45.6 60.4 66.3 DHS
Polio 34.6 44.7 44.3 DHS
DPT 20.7 31.9 36.5 DHS
H. influenzae b 0 0 27.7 DHS
HepB 0 0 27.7 DHS
Pneumococcal 0 0 0 DHS
Rotavirus 0 0 0 DHS

11
Measles 26.6 34.9 55.7 DHS
Curative
Case management of severe neonatal infection
2.9 3.0 3.3
LiST default calculations based on facility birth coverage
ORS - oral rehydration solution 13.1 19.9 26.3 DHS
Antibiotics - for treatment of dysentery 10.4 10.2 9.8 LiST default data
Care-seeking for pneumonia in children 15.8 18.7 27 DHS
Vitamin A - for treatment of measles
59.9 45.8 52.7
Vitamin A preventive coverage used as proxy in LiST
Antimalarials - Artemesinin compounds for malaria 0 0 27 MIS
Cotrimoxazole 0 0 25.8 UNAIDS
ART 0 0.6 18.1 UNAIDS
Household surveys considered included DHS 2000, 2005 and 2011, MIS 2007 and 2011 for malaria indicators
References
1. Rutstein S, Rojas G. Guide to DHS Statistics. Calverton: ORC Macro, 2006. 2. Pedersen J, Liu J. Child mortality estimation: appropriate time periods for child mortality
estimates from full birth histories. PLoS Med 2012; 9(8): e1001289.