table of contents message from the secretary of commerce …
TRANSCRIPT

Table of Contents
Message from the Secretary of Commerce 2
Introduction 3
Economic Progress into the 21st Century 4
Gross Domestic Product 4
Inflation 5
Economic Freedom 5
Trade 6
Travel and Tourism 6
Foreign Direct Investment 7
Strengthening National Economies and Regional Relationships 8
Education and Workforce Development 8
Innovation 10
Small Business 11
Global Supply Chain Strategies 13
Conclusion 15
References 16

U.S. Department of Commerce Competitiveness in the AmericasPage 3
Introduction
The countries of the Western Hemisphere can raise living standards, create jobs, and reduce poverty by increasing the competitiveness of domestic firms and workers while capturing the benefits of international trade and investment.
Many Western Hemisphere countries have undertaken significant reforms to promote productivity and economic growth. However, other regions are growing faster, compelling countries and companies to continue implementing strategies to compete more effectively in global markets. Current favorable economic conditions provide an opportune time to continue the reforms needed to generate positive results. This report provides background for discussions on economic performance in the Western Hemisphere.
The section on economic progress in the 21st century reviews the hemisphere’s economic status; notes key growth trends; and looks at economic freedom, trade, tourism, and foreign direct investment to provide a snapshot of current conditions.
The section on strengthening national economies and regional relationships highlights four important drivers of national competitiveness that will be discussed at the Americas Competitiveness Forum:
1. Education and workforce development: A country’s ability to advance economically depends in part on the skills of its workforce. Western Hemisphere countries can improve their competitiveness by improving access to educational and training opportunities.
2. Innovation: Invention and adoption of new technologies and processes may confer competitive advantages. Western Hemisphere countries can enhance economic prosperity by taking measures to share in the global diffusion of innovation.
3. Small business development: Small businesses employ a large share of workers in the region. Western Hemisphere countries can drive national competitiveness by creating a supportive business environment and providing the tools that allow small businesses to grow and propagate.
4. Global supply chain strategies: With the increasing integration of the global economy, companies must better manage their supply chains to facilitate the secure and efficient movement of goods. Partnering in regional and global production enhances the comparative advantages and economic prospects of all countries and firms. Western Hemisphere competitiveness can be increased by developing successful supply chain strategies and sharing best business practices.
This report is intended to encourage an ongoing dialogue about these important issues.
U.S. Department of Commerce Competitiveness in the AmericasPage 4
Economic Progress into the 21st Century
The world economy and countries in the Western Hemisphere have achieved significant economic growth in recent years. Since 1990, economic growth in the Western Hemisphere has been positive every year, and growth has been particularly strong in recent years. The Western Hemisphere’s total production amounted to $19 trillion in 2006, accounting for 29 percent of world GDP. Growth has averaged near 4 percent for the region, with higher growth rates in South America,1 Central America,2 and the Caribbean3. Inflation has decreased dramatically, with a particular improvement in South and Central America. Standards of living have been rising throughout the region for nearly all countries, though large differences remain. In short, economic prospects appear very good.
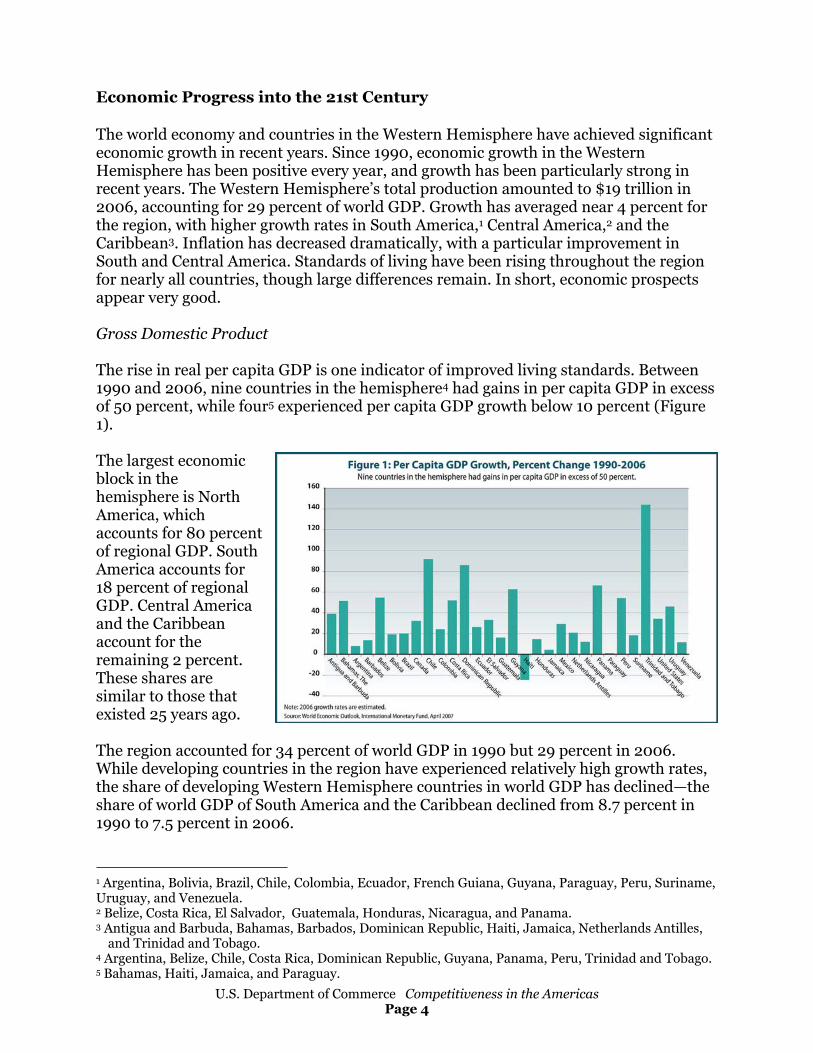
Gross Domestic Product
The rise in real per capita GDP is one indicator of improved living standards. Between 1990 and 2006, nine countries in the hemisphere4 had gains in per capita GDP in excess of 50 percent, while four5 experienced per capita GDP growth below 10 percent (Figure 1).
The largest economic block in the hemisphere is North America, which accounts for 80 percent of regional GDP. South America accounts for 18 percent of regional GDP. Central America and the Caribbean account for the remaining 2 percent. These shares are similar to those that existed 25 years ago.
The region accounted for 34 percent of world GDP in 1990 but 29 percent in 2006. While developing countries in the region have experienced relatively high growth rates, the share of developing Western Hemisphere countries in world GDP has declined—the share of world GDP of South America and the Caribbean declined from 8.7 percent in 1990 to 7.5 percent in 2006.
1 Argentina, Bolivia, Brazil, Chile, Colombia, Ecuador, French Guiana, Guyana, Paraguay, Peru, Suriname, Uruguay, and Venezuela. 2 Belize, Costa Rica, El Salvador, Guatemala, Honduras, Nicaragua, and Panama. 3 Antigua and Barbuda, Bahamas, Barbados, Dominican Republic, Haiti, Jamaica, Netherlands Antilles,
and Trinidad and Tobago. 4 Argentina, Belize, Chile, Costa Rica, Dominican Republic, Guyana, Panama, Peru, Trinidad and Tobago. 5 Bahamas, Haiti, Jamaica, and Paraguay.

U.S. Department of Commerce Competitiveness in the AmericasPage 5
Inflation
An important contributor to stability and growth has been the dramatic decline in inflationary pressures. In the early 1990s, several Western Hemisphere countries experienced inflation in excess of 1,000 percent. By 1995, the inflation rate for the entire Western Hemisphere was about 12 percent and declining rapidly (Figure 2). Since the late 1990s, inflation has averaged about 4 percent.
Economic Freedom
The Heritage Foundation and TheWall Street Journal publish an Index of Economic Freedom that assesses the business climate facing individuals and companies across the world.
Typically, higher levels of economic freedom are associated with higher levels of per capita GDP, and a country’s GDP growth rate also tends to increase with increases in its economic freedom score. The average for the Western Hemisphere compares favorably with the world average (Figure 3).6 Eleven of 29 countries had significant positive trends in their economic freedom score since 1995.
The Index of Economic Freedom uses 10 factors, including business, trade, fiscal policy, monetary policy, property rights, corruption, and labor conditions. Business freedom, property rights, and corruption produce the largest variations across the region and around the world (Figure 4). Typically, North America scores better than average in these areas and South America scores about as
6 Freedom Index 2007, Heritage Foundation and The Wall Street Journal, 2007.
U.S. Department of Commerce Competitiveness in the AmericasPage 6
well as the global average in business and property rights, but below the global average in corruption.
Trade
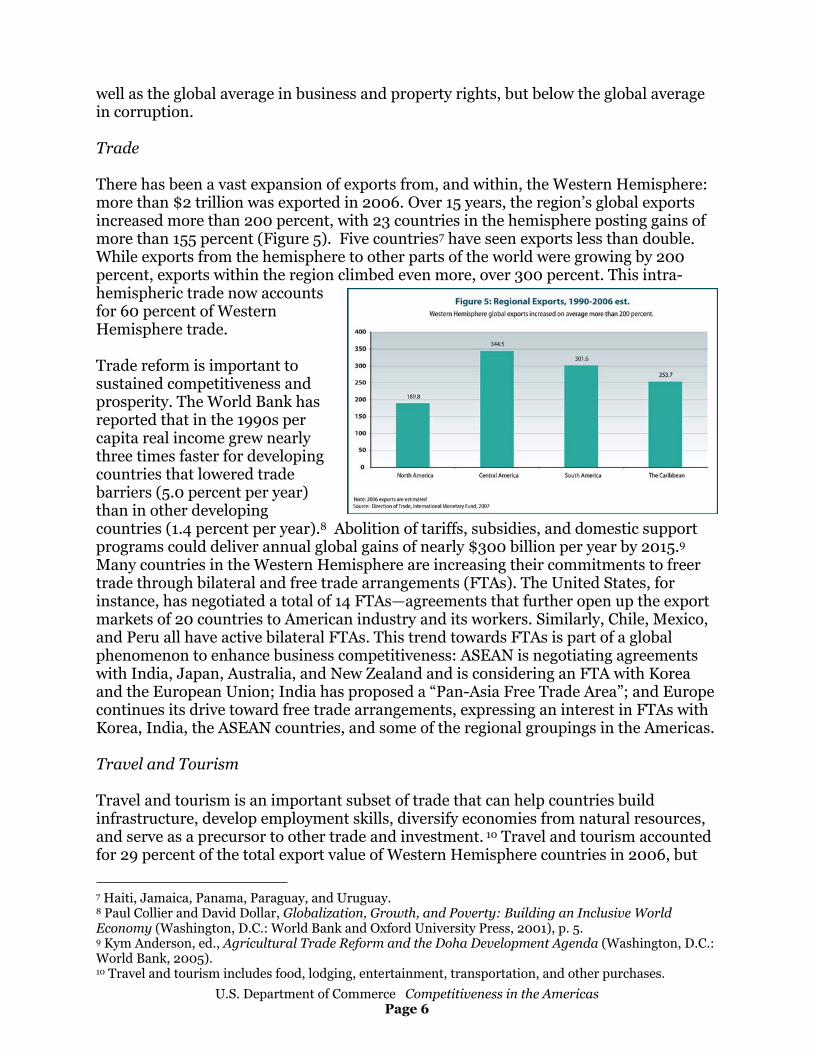
There has been a vast expansion of exports from, and within, the Western Hemisphere: more than $2 trillion was exported in 2006. Over 15 years, the region’s global exports increased more than 200 percent, with 23 countries in the hemisphere posting gains of more than 155 percent (Figure 5). Five countries7 have seen exports less than double. While exports from the hemisphere to other parts of the world were growing by 200 percent, exports within the region climbed even more, over 300 percent. This intra-hemispheric trade now accounts for 60 percent of Western Hemisphere trade.
Trade reform is important to sustained competitiveness and prosperity. The World Bank has reported that in the 1990s per capita real income grew nearly three times faster for developing countries that lowered trade barriers (5.0 percent per year) than in other developing countries (1.4 percent per year).8 Abolition of tariffs, subsidies, and domestic support programs could deliver annual global gains of nearly $300 billion per year by 2015.9
Many countries in the Western Hemisphere are increasing their commitments to freer trade through bilateral and free trade arrangements (FTAs). The United States, for instance, has negotiated a total of 14 FTAs—agreements that further open up the export markets of 20 countries to American industry and its workers. Similarly, Chile, Mexico, and Peru all have active bilateral FTAs. This trend towards FTAs is part of a global phenomenon to enhance business competitiveness: ASEAN is negotiating agreements with India, Japan, Australia, and New Zealand and is considering an FTA with Korea and the European Union; India has proposed a “Pan-Asia Free Trade Area”; and Europe continues its drive toward free trade arrangements, expressing an interest in FTAs with Korea, India, the ASEAN countries, and some of the regional groupings in the Americas.
Travel and Tourism
Travel and tourism is an important subset of trade that can help countries build infrastructure, develop employment skills, diversify economies from natural resources, and serve as a precursor to other trade and investment. 10 Travel and tourism accounted for 29 percent of the total export value of Western Hemisphere countries in 2006, but
7 Haiti, Jamaica, Panama, Paraguay, and Uruguay. 8 Paul Collier and David Dollar, Globalization, Growth, and Poverty: Building an Inclusive World Economy (Washington, D.C.: World Bank and Oxford University Press, 2001), p. 5. 9 Kym Anderson, ed., Agricultural Trade Reform and the Doha Development Agenda (Washington, D.C.: World Bank, 2005). 10 Travel and tourism includes food, lodging, entertainment, transportation, and other purchases.

U.S. Department of Commerce Competitiveness in the AmericasPage 7
half or more for one-third of these countries. Since 1980, traveler volume to Western Hemisphere countries has grown approximately 3 percent per year, slightly lower than the global growth rate of 4 percent. 11
Most travel is regional. Of nine global regions, seven are their own largest suppliers of travelers, including the Western Hemisphere. For example, 68 percent of Caribbean visitors originate from the Americas. Proportions are higher for South America (73 percent), North America (75 percent), and Central America (86 percent).
However, changes in population growth and wealth are producing changes in traveler destinations and origins. Specifically, Asian growth has shifted that region’s share of global arrivals from 13 percent in 1990 to approximately 20 percent today. 12
Consequently, market shares of the Western Hemisphere and Europe, traditionally the most popular regions, have been steadily declining since 1990. Asia’s global share is expected to continue to rise sharply in the years ahead.
Foreign Direct Investment
Foreign direct investment (FDI) strengthens international relationships, accelerates the diffusion of innovation, contributes to infrastructure, and can provide economic benefits for both the investor and the country where the investment is made. In addition, FDI develops links in the global supply chain and allows for the development of stronger international trade ties.
Worldwide, net inflows of FDI increased from an annual average $231.7 billion during 1991–1995 to $754.3 billion during 2001–2005, an annual average rate of almost 10 percent.13 Over the same period, net inflows to the Western Hemisphere countries increased 9 percent. Consequently, the Western Hemisphere’s share of world FDI has declined slightly over the 1991–2005 period, from 29 percent to 27 percent.14
The decline in the Western Hemisphere’s share of FDI may suggest a failure of regional production to integrate into global supply chains. In an increasingly interconnected world, countries and companies that do not take advantage of global supply chains may find themselves at a competitive disadvantage. To remain attractive to foreign investors, the Western Hemisphere needs to address business climate conditions. According to a 2005 United Nations report, “conditions prevailing in South America and the Caribbean in terms of financial systems, intellectual property rights, taxes, bureaucratic hurdles, commercial codes and State intervention in the economy, among other factors, place South America and the Caribbean far behind the developed countries and the Asia-Pacific region.”15
11 World Tourism Organization, World Travel Barometer. 12 World Tourism Organization, Tourism Highlights, 2006 edition. (Madrid, UNWTO, 2006) 13 U.N Economic Commission on Latin America and the Caribbean, “Foreign Investment in Latin America and the Caribbean, 2005” (May 2006). 14 Ibid. 15 Ibid, Page 22.

U.S. Department of Commerce Competitiveness in the AmericasPage 8
Strengthening National Economies and Regional Relationships
Economic progress depends on education, innovation, and the freedom, particularly for small businesses, to engage in economic activity and cross-border trade and investment. The Americas Competitiveness Forum provides an excellent opportunity to discuss and implement strategies on issues that are crucial to hemispheric prosperity: education and workforce development, innovation, small business opportunities, and global supply chain strategies.
Education and Workforce Development
Education and workplace skills help to build economic prosperity. Better-educated citizens enjoy higher wages, lower unemployment, and improved living standards. Education includes traditional institutions, vocational schools, on-the-job training, and continuing education.
Western Hemisphere countries have made advances at the primary and secondary levels of education. They have also improved educational opportunities at the college level where returns on education are the highest. Every country must focus on creating more highly skilled workforces to make the most of an increasingly global and integrated economy.
The most basic level of workforce training is literacy, which the countries of the Western Hemisphere have improved significantly. In South America, Central America, and the Caribbean, literacy rates are 96 percent for 15 to 24 year olds, not far behind developed nations and China.16
Investments in primary and secondary education provide a crucial base of knowledge and skills for the workforce. South American, Central American, and Caribbean countries compare well in primary and secondary school completion rates and net enrollment rates. The primary completion rate is above average for all developing regions and compares closely to the developed regions. Net enrollment rates for primary and secondary education in the Americas are relatively high and growing, especially in Central America.17
Even with great strides in providing quality education for all, math and science test scores of primary and secondary students in the United States have not equaled those of other advanced economies. 18 Because the United States has an innovation-driven economy, it must ensure that the highest quality education is available to remain competitive.
Many in tomorrow’s workforce will require a college education. College enrollment rates in the Western Hemisphere have quickly increased, rising from 30 percent in 1999 to 35 16 U.N. Economic Commission on Latin America and the Caribbean and UNESCO Institute for Statistics, 200717 U.N. Millennium Development Goals Indicators 18 Executive Office of the President, Council of Economic Advisors, Economic Report of the President,(Washington, D.C., 2006).
U.S. Department of Commerce Competitiveness in the AmericasPage 9
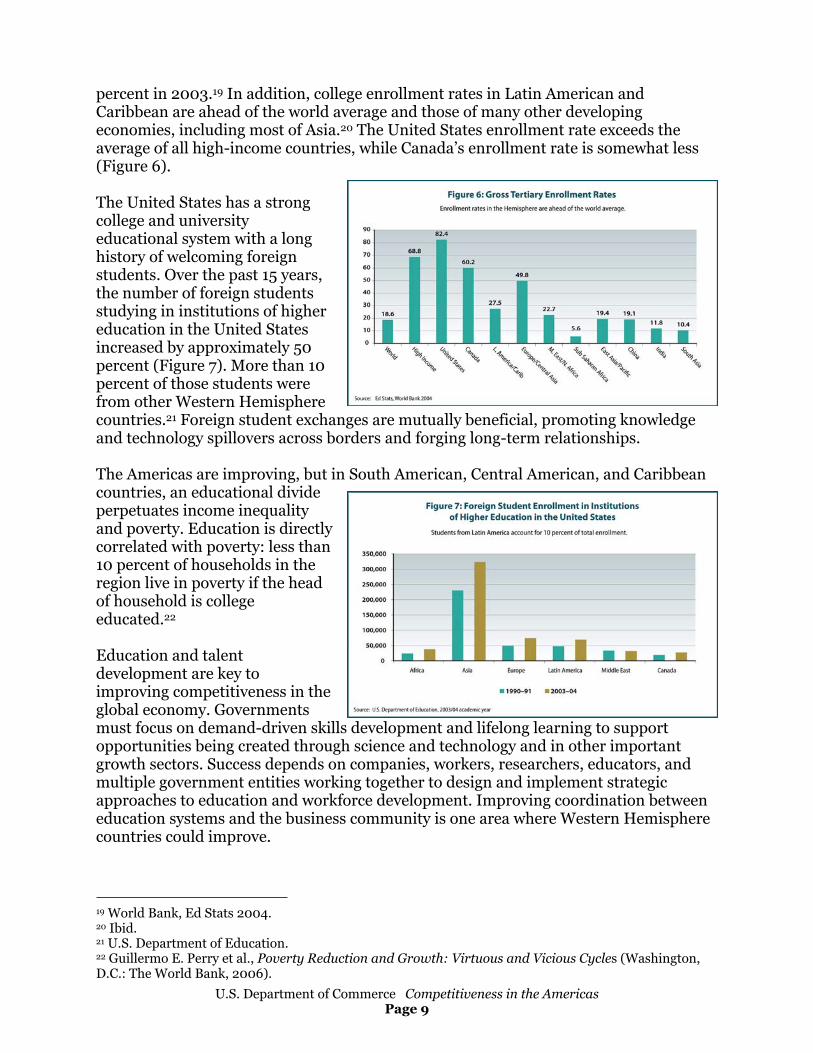
percent in 2003.19 In addition, college enrollment rates in Latin American and Caribbean are ahead of the world average and those of many other developing economies, including most of Asia.20 The United States enrollment rate exceeds the average of all high-income countries, while Canada’s enrollment rate is somewhat less (Figure 6).
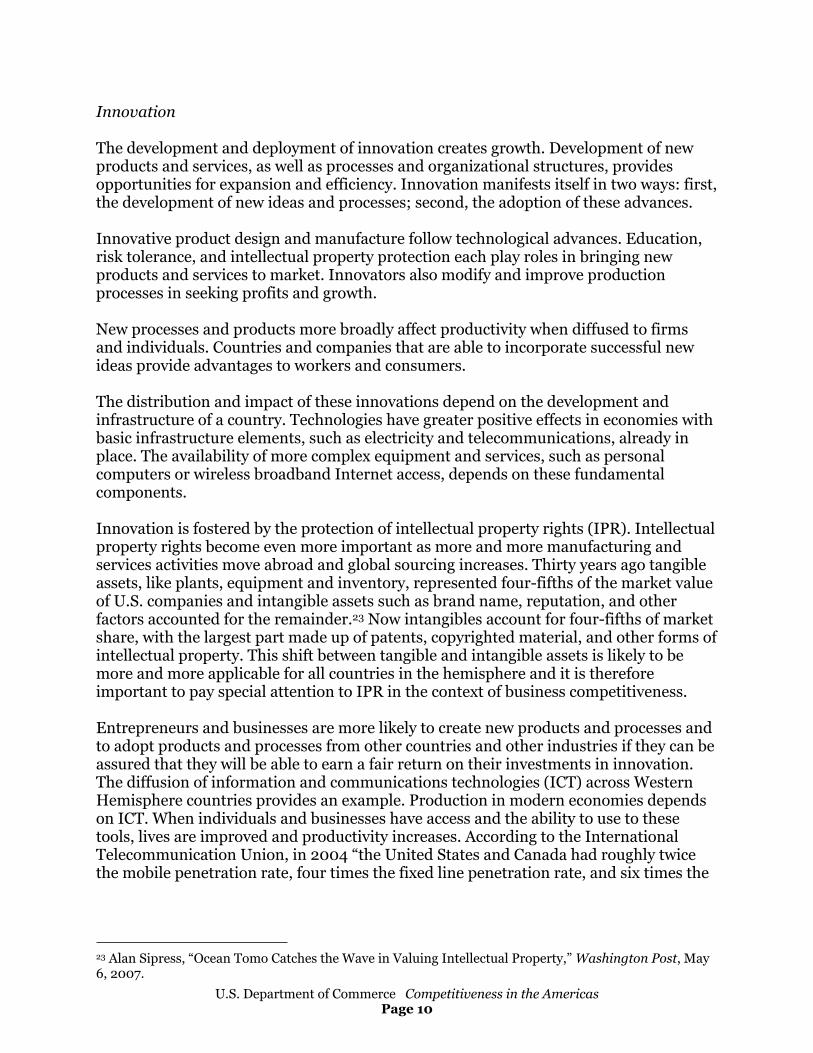
The United States has a strong college and university educational system with a long history of welcoming foreign students. Over the past 15 years, the number of foreign students studying in institutions of higher education in the United States increased by approximately 50 percent (Figure 7). More than 10 percent of those students were from other Western Hemisphere countries.21 Foreign student exchanges are mutually beneficial, promoting knowledge and technology spillovers across borders and forging long-term relationships.
The Americas are improving, but in South American, Central American, and Caribbean countries, an educational divide perpetuates income inequality and poverty. Education is directly correlated with poverty: less than 10 percent of households in the region live in poverty if the head of household is college educated.22
Education and talent development are key to improving competitiveness in the global economy. Governments must focus on demand-driven skills development and lifelong learning to support opportunities being created through science and technology and in other important growth sectors. Success depends on companies, workers, researchers, educators, and multiple government entities working together to design and implement strategic approaches to education and workforce development. Improving coordination between education systems and the business community is one area where Western Hemisphere countries could improve.
19 World Bank, Ed Stats 2004. 20 Ibid. 21 U.S. Department of Education. 22 Guillermo E. Perry et al., Poverty Reduction and Growth: Virtuous and Vicious Cycles (Washington, D.C.: The World Bank, 2006).
U.S. Department of Commerce Competitiveness in the AmericasPage 10
Innovation
The development and deployment of innovation creates growth. Development of new products and services, as well as processes and organizational structures, provides opportunities for expansion and efficiency. Innovation manifests itself in two ways: first, the development of new ideas and processes; second, the adoption of these advances.
Innovative product design and manufacture follow technological advances. Education, risk tolerance, and intellectual property protection each play roles in bringing new products and services to market. Innovators also modify and improve production processes in seeking profits and growth.
New processes and products more broadly affect productivity when diffused to firms and individuals. Countries and companies that are able to incorporate successful new ideas provide advantages to workers and consumers.
The distribution and impact of these innovations depend on the development and infrastructure of a country. Technologies have greater positive effects in economies with basic infrastructure elements, such as electricity and telecommunications, already in place. The availability of more complex equipment and services, such as personal computers or wireless broadband Internet access, depends on these fundamental components.
Innovation is fostered by the protection of intellectual property rights (IPR). Intellectual property rights become even more important as more and more manufacturing and services activities move abroad and global sourcing increases. Thirty years ago tangible assets, like plants, equipment and inventory, represented four-fifths of the market value of U.S. companies and intangible assets such as brand name, reputation, and other factors accounted for the remainder.23 Now intangibles account for four-fifths of market share, with the largest part made up of patents, copyrighted material, and other forms of intellectual property. This shift between tangible and intangible assets is likely to be more and more applicable for all countries in the hemisphere and it is therefore important to pay special attention to IPR in the context of business competitiveness.
Entrepreneurs and businesses are more likely to create new products and processes and to adopt products and processes from other countries and other industries if they can be assured that they will be able to earn a fair return on their investments in innovation. The diffusion of information and communications technologies (ICT) across Western Hemisphere countries provides an example. Production in modern economies depends on ICT. When individuals and businesses have access and the ability to use to these tools, lives are improved and productivity increases. According to the International Telecommunication Union, in 2004 “the United States and Canada had roughly twice the mobile penetration rate, four times the fixed line penetration rate, and six times the
23 Alan Sipress, “Ocean Tomo Catches the Wave in Valuing Intellectual Property,” Washington Post, May 6, 2007.

U.S. Department of Commerce Competitiveness in the AmericasPage 11
Internet penetration rate of the countries of Central and South America and the Caribbean.” 24
Patents play an important role in innovation and economic progress. One important indicator of a country’s success at innovation is the number of U.S. utility patents obtained by nationals of foreign countries. As of 2006, non-U.S. Western Hemisphere nationals accounted for 4.6 percent of U.S. utility patents granted to foreign nationals compared to 29 percent for nationals of the European Union (EU-27) and nearly 61 percent for Asian nationals (Figure 8).25 Moreover, these ratios have remained roughly the same since 1990, indicating that hemispheric countries may have difficulties in gaining competitiveness vis-à-vis Asia and Europe without additional investments in research and development (R&D). Indeed, per capita expenditure in R&D in North America and Europe were 16.1 times and 6.6 times higher than that of South America, respectively, in 2000.26
If the countries of the Western Hemisphere are to remain competitive, it is important for governments to continue promoting policies that do not inhibit innovation and support technology development and diffusion.
Small Business
The fragmentation of production worldwide provides opportunities for businesses of all sizes. While large corporations account for most of international trade, small and medium-sized enterprises (SMEs) comprise the vast majority of all exporting companies.
The ability of small businesses to prosper depends on the business climate they face at home and abroad. The World Bank and International Finance Corporation’s “Doing Business” indicators demonstrate how receptive economies are to new and small businesses. The easier it is to start a business, the more flexibly a small business can adapt to the market realities, the greater the access to foreign markets, the more easily a start-up can dissolve while protecting creditors’ interests, the more fertile an economy will be to entrepreneurial initiative and innovation.
24 International Telecommunication Union, World Telecommunication Indicators Database, “Did You Know That…” Web Page, available at http://www.itu.int/ITU-D/ict/statistics/ict/index.html. 25 U.S. Patent and Trademark Office, Patent Counts by Country/State and Year (Alexandria, Va.: USPTO, 2007) 26 National Science Board, Science and Engineering Indicators, 2006 (Arlington, Va.: National Science Foundation, 2006)

U.S. Department of Commerce Competitiveness in the AmericasPage 12
The World Bank’s “Doing Business 2007” indicators suggest that the average number of days to start a business in the Western Hemisphere is higher than that for the rest of the world (Figure 9). But, there is variation within the hemisphere, ranging from 3 days in Canada, to 152 days in Brazil, to 203 days in Haiti. However, several countries have made progress recently. For instance, between 2003 and 2006, El Salvador lowered the number of days to start a business from 115 to 26, Argentina from 68 to 32, Mexico from 58 to 27, and Jamaica from 31 to 8. 27
The World Economic Forum’s 2006 Global Competitiveness Report concludes that of the 22 South American and Caribbean countries ranked in the report, only nine countries improved their competitiveness ranking from the prior year. Both reports highlight steps that governments could take to unleash the full potential of entrepreneurs. 28
Availability of adequate financing is a necessity for small enterprises to flourish. Typically, while small businesses comprise a large portion of all businesses and economic activity in many Western Hemisphere countries, they receive a very small percentage of credit. Some banks and financing institutions have recognized the important client base that small businesses represent and are increasingly devising methods to better evaluate and mitigate the credit risks to make financing more available. But beyond this, an improved banking, financing, and regulatory environment can make developing countries more attractive to venture capital. Entrepreneurs whose ideas and companies may not fit the traditional criteria of banks and other financing institutions may find willing venture capital investors provided the risk of the regulatory and legal environment is competitive with other locations.
Reforms at the legal and regulatory level are critical aspects of business development and economic growth. These reforms decrease bureaucratic red tape, create opportunities for more citizens to participate in the formal sector, make an economy more competitive, and stimulate economic growth. Reforms can make it easier not only to start businesses, but for businesses to create more jobs.
Opportunities for small businesses to develop and grow increasingly drive economic development of a country and a region. Western Hemisphere countries must accelerate efforts to create the environment and provide the tools for business to become more competitive in the global economy. Countries should seek new ways to make financing more available for small businesses, minimize the regulatory obstacles involved in starting and operating a business, and encourage a regional spirit of entrepreneurialism.
27 World Bank, Doing Business in 2007, www.doingbusiness.org.28 World Economic Forum, www.weforum.org/pdf/Latin_America/Review.pdf.
U.S. Department of Commerce Competitiveness in the AmericasPage 13
Global Supply Chain Strategies
Supply chain management is the planning and implementation of all business activities involved in sourcing, procurement, and movement of goods. It also includes coordination and collaboration with all partners in the chain, such as suppliers, intermediaries, third-party service providers, and customers. An efficient and well-developed supply chain infrastructure facilitates the domestic and international movement of goods and underpins economic growth and competitiveness of industry.
In order to create competitive advantages in today’s global economy, firms must understand that not only do their products compete with those of other firms, but so do the supply chains that bring these goods to the marketplace. To improve their competitiveness, companies must better manage their supply chains in terms of stability, agility, connectivity, and speed of their logistics systems and networks to meet the needs of today’s demanding customers. In addition, companies must manage tradeoffs between flexibility and security. For example, just-in-time inventory systems lower operating costs, but can also reduce a company’s ability to respond to delayed delivery of critical inputs into the production process.
Barriers that slow the movement of goods between manufacturers, wholesalers, retailers, and the consuming public reduce the efficiency of supply chains and the economy in general, ultimately raising costs for consumers. One of the key issues in developing efficient and competitive global supply chains is the existence of adequate infrastructure—the ports, roads, and communications investments that allow companies to move goods, services, and ideas cheaply and easily. In addition, limited technological infrastructure can reduce the efficiency of information technology management systems and the movement of information; and over-burdensome and non-transparent regulations may negate business-planning efforts due to increased uncertainty and risk. Companies operate more efficiently in an economic environment that facilitates investment and market entry and where transparent regulatory and licensing procedures exist.
The resource needs of building supply-chain networks are vast and constantly increasing. It is difficult for either the government or the private sector alone to undertake the major projects necessary to keep up with the demand for logistical infrastructure. Furthermore, there is synergy when the government, academia, and the private sector use their respective strengths in developing and utilizing technology to address logistical challenges. There are a number of examples of successful public-private partnerships from the Western Hemisphere, including “Highway 2000” in Jamaica and “Transmilenio” in Colombia.
Nevertheless, the World Bank notes the region trails its peers. As of 2005, South America, Central America, and the Caribbean had “fallen behind China as well as the middle income country average for major categories of productive infrastructure (electricity, roads, and telephones).”29 The infrastructure gap between South America
29 Marianne Fay and Mary Morrison, Infrastructure in Latin America and the Caribbean: Recent Developments and Key Challenges. Washington, DC: (World Bank, 2005).

U.S. Department of Commerce Competitiveness in the AmericasPage 14
and seven quickly growing Asian countries30—the change in Asian infrastructure stocks per worker relative to South America’s—grew by a huge margin over 1980–1997. Comparing simple averages for each region, the growth rate in the stock of fixed phone lines was 48 percent higher in East Asian economies than that in South America. Similarly, power-generating capacity growth rates were 91 percent higher and growth rates in roads were 53 percent higher.31
Significant increases in global trade are driving the need for increased supply chain capacity. Growth in port capacity and the subsequent throughput is an important precursor to improved supply chain management in the Western Hemisphere. Between 2004 and 2005, port activity in the United States grew by 8.6 percent while that in Central and South America rose by 14.8 percent. These increases in hemispheric port throughput are lower than that for China, which grew by 17 percent (Figure 10).32 Expansion in port capacity and improvements in ancillary infrastructure in the Western Hemisphere are means of ensuring that hemispheric trade continues to expand and contributes to improved competitiveness. For Central and South America, it is worth noting that only one port in the region—Santos in Brazil—was in the top 50 most active ports in 2005.33
A dynamic and successful supply chain strategy is critical to the competitiveness of the Americas. Developing effective supply chains, addressing governmental regulations and security matters, and sharing best practices for private and public sector collaboration on infrastructure and non-infrastructure projects will improve the movement of goods.
30 The Asian economies are Hong Kong, Indonesia, Republic of Korea, Malaysia, Taiwan (China), Thailand, and Singapore. 31 Fay and Morrison. Infrastructure in Latin America.32 American Association of Port Authorities, at www.aapa-ports.org/Industry/ 33 Ibid.

U.S. Department of Commerce Competitiveness in the AmericasPage 15
Conclusion
The countries of the Western Hemisphere feature increasingly positive economic conditions. In the last few years, standards of living have generally improved, but the standard of living of several other regions of the world has improved more. To compete successfully, governments and companies in the hemisphere must develop pro-growth policies and strategies.
At the national level, leaders must encourage innovation, improve educational opportunities and workforce skills, provide reforms to improve property rights, reduce corruption, and eliminate unnecessary regulatory burdens.
In addition, facilitating international trade and investment can strengthen global and regional supply chains to further improve competitiveness. Gains from international trade, particularly infrastructure, tourism, and investment can have profound regional effects. Policies that allow companies to seek comparative advantage and capture innovation will meet the challenges of an increasingly global and integrated economy.
The countries and companies of the Western Hemisphere must reap the benefits of trade and investment to raise living standards, create jobs, and reduce poverty. Countries must continue to create the right environment to give people the opportunity to compete successfully in a global economy.

U.S. Department of Commerce Competitiveness in the AmericasPage 16
References
American Association of Port Authorities at www.aapa-ports.org/Industry/
Paul Collier and David Dollar, “Globalization, Growth, and Poverty: Building an Inclusive World Economy” (Washington, D.C.: World Bank and Oxford University Press, 2001)
Council of Economic Advisers, Economic Report of the President, February 2006.
Council of Economic Advisers, Economic Report of the President, February 2007.
Guillermo E. Perry et al., Poverty Reduction and Growth: Virtuous and Vicious Cycles (Washington, D.C.: The World Bank, 2006).
Heritage Foundation and The Wall Street Journal, Freedom Index 2007, 2007.
Marianne Fay and Mary Morrison, “Infrastructure in Latin America and The Caribbean: Recent Developments And Key Challenges,”(Washington, D.C.: The World Bank, 2005).
Inter American Development Bank, “Social Cohesion in Latin America and Caribbean: Analysis, Action and Coordination,” available at http://idbdocs.iadb.org/wsdocs/getdocument.aspx?docnum=733597.
International Monetary Fund, Direction of Trade, 2007.
International Monetary Fund, World Economic Outlook, April 2007.
International Telecommunication Union, World Telecommunication Indicators Database, “Did You Know That…” Web Page, available at http://www.itu.int/ITU-D/ict/statistics/ict/index.html.
National Science Board, Science and Engineering Indicators, 2006 (Arlington, Va.: National Science Foundation, 2006)
United Nations Economic Commission on Latin America and the Caribbean (ECLAC), “Foreign Investment in Latin America and the Caribbean, 2005,” May 2006.
Alan Sipress, “Ocean Tomo Catches the Wave in Valuing Intellectual Property,” Washington Post,May 6, 2007.
United Nations, United Nations Millennium Development Goals Indicators, available at http://mdgs.un.org/unsd/mdg/DataAvailability.aspx
United Nations Educational, Scientific, and Cultural Organization Institute for Statistics, available at http://portal.unesco.org/education/en/ev.phpURL_ID=34533&URL_DO=DO_TOPIC&URL_SECTION=201.html
United Nations World Tourism Organization, World Travel Barometer.
United Nations World Tourism Organization, Tourism Highlights 2006 Edition.
USAID, Latin America and the Caribbean: Selected Economic and Social Data, 2006, available at http://qesdb.cdie.org/lac/docdownload.html
U.S. Department of Commerce, Bureau of Economic Analysis.
U.S. Department of Education.
U.S. Patent and Trademark Office, “Patent Counts by Country/State and Year,” 2007.
World Bank, “Agricultural Trade Reform and the Doha Development Agenda” Washington, DC, November 2005.
World Bank, Doing Business in 2007.
World Bank, Educational Statistics, available at http://devdata.worldbank.org/edstats/
World Bank, “World Development Indicators,” 2007, available at http://siteresources.worldbank.org/DATASTATISTICS/Resources/WDI07backmatter.pdf
