takafulink funds report 2009 - prudential bsn takaful · takafulink funds report 2009 ... astro...
TRANSCRIPT

Takafulink Funds Report 2009
Takafulink Reports and Statements
for the year ended 31 December 2009
NurturingFruitful Futures
Prudential BSN Takaful Berhad (740651-H)
Level 8A, Menara Prudential, No. 10, Jalan Sultan Ismail, 50250 Kuala Lumpur.Tel: 03-2078 1188 Fax: 03-2072 6188
Customer Care • Tel: 03-2053 7188 Email: [email protected]
Should you encounter any difficulties in operating this CD-ROM, please contact:Customer Care • Tel: 03-2053 7188

2 CEO’s Message4 Fund Objectives5 Investment Review7 Fund Performance8 Investment Outlook
Contents
Nurturing Fruitful Futures
Choice, commitment and care are keyingredients to grow a portfolio thatdelivers what you want. With steadfastfocus, Prudential BSN Takafulcontinues to nurture fruitful futures forour clients by providing you a rightmix of Shariah-compliant investmentsand constantly upgrading our level ofservice to you. Together we plant theseed of a flourishing future thatshelters and provides for your needs...when you need it the most.

1Takafulink Funds Report 2009
10 Financial Highlights14 Statement of Assets and Liabilities17 Statement of Changes in Net Asset Value
20 Statement of Income and Expenditure26 Notes to the Accounts28 Statement by Directors29 Report of the Auditors
Dear Certificate Holders,
We have pleasure in presenting to you the PruBSN Takaful Berhad Summary andCD Rom 2009. The CD-Rom can be found on the inside back cover of this summary.The full version of the Annual Report is also available on our website atwww.prubsn.com.my.

2 Takafulink Funds Report 2009
CEO’s Message
“ During 2009 we introduced Takaful
Health, a first of its kind product in
the takaful industry that provides a
No Claim Bonus as well as
comprehensive medical cover. We
also embarked on a number of
initiatives aimed at further improving
customer service and enhancing our
distribution capabilities. ”
Dear CustomerAssalamualaikum,
It gives me great pleasure to bring to you our 2009Takafulink Report which I hope you will find useful.
As you know, 2009 proved to be an extraordinarilychallenging year as the global financial crisis continued tounfold. The crisis did not spare the Malaysian economy asshown by the contraction in the country’s GDP of 1.7% in2009. In response to weakening private demand,Governments and Central Banks including ours at homeadopted a number of fiscal stimulus measures and as aresult most economies including Malaysia’s turned thecorner during the last quarter of the year so that theoutlook is now cautiously optimistic.
For our part, Prudential BSN Takaful successfully navigatedthrough these difficult times and we are confident that weare well positioned to take advantage of the upswing inthe economy.
We also gave back to the community through our CSRprogramme, Segunung Harapan, in collaboration withAstro which aired on Oasis channel for about 10 weeks atthe end of last year. Through this programme, communitieswere able to come together to create opportunities forothers through self-help and collaboration.

3Takafulink Funds Report 2009
Looking ahead to 2010, I believe we have theright strategies in place to serve you betterwith new products and new services in thepipeline. Combined with the dynamism andinnovativeness that lie at the core of ouridentity, I believe that PruBSN will be able toconsolidate our leading market position.
Of course, none of this would have beenpossible without your support and trust in ourbusiness. So on behalf of all of the staff atPruBSN I would like to say a big Thank You toyou, our customers. We look forward toserving you better in 2010 and beyond.
Wishing you all the best for 2010!
Azim MithaniCEO, Prudential BSN Takaful Berhad

The Takafulink Dana Ekuiti Fund aims to maximise returns over medium to long term by investing in high qualitySyariah-approved shares listed on the Kuala Lumpur Stock Exchange.
The Takafulink Dana Bon fund aims to provide medium to long term accumulation of capital by investing in selectedIslamic Private Debt Securities (IPDS) and Islamic Financing Facilities (IFF)
The Takafulink Dana Urus fund seeks to maximise returns over medium to long term by investing in Shariah-approvedshares and Islamic Private Debt Securities (IPDS) and Islamic Financing Facilities (IFF) through Takafulink Dana Ekuitiand Takafulink Dana Bon and in any other such Takafulink funds that may become available in the future.
Fund Objectives
4 Takafulink Funds Report 2009

During the period under review, the FBM Emas Shariah rose 43%, underperforming the regional markets in general withthe MxAPJ rising 67% for the same period.
The local equity market started 2009 on a positive note as the market rallied on optimism over potential additionalstimulus the US President would unveil following his inauguration. However, the momentum was not sustained asconcerns over the pace of economic recovery emerged. On the domestic front, the BNM surprised the market with alarger-than-expected 75bps cut to OPR in January 2009, on the back of declining inflationary pressures in line with theglobal quantitative easing measures. A month later, BNM surprised the market yet again with an earlier-than-expected50bps cut on OPR. This came amidst political uncertainty in the state government of Perak, lower-than-expected 4Q08GDP of 0.1% and more consensus downgrades in earnings estimates for 2009. In response, the Malaysian governmentannounced its Second Stimulus Package worth RM60 billion (2009-2010) to buffer the Malaysian economy from a deeprecession, however, the local market was dragged down by the announcements of rights issue for two index heavyweights, TM International and Maybank which the market perceived as negative.
Moving into 2Q09, newsflow globally and regionally turned positive with statements coming out of US on “green shoots”,indicating signs of recovery appearing. The local equity market benefited from the return in risk appetite and excessliquidity in the market. Positive newsflow was maintained leading up to Invest Malaysia 2009 Conference held on 30thJune 2009. Policies liberalizing the services sector and certain aspects of the financial sector, boosted market sentiment.
In 3Q09, the local share market started off in a consolidation phase as investors digested the announcements fromInvest Malaysia 2009 which ended on 1st July 2009 and some investors rebalanced their portfolios to reflect thechanges in KL Composite Index to FTSE Bursa Malaysia KL Composite Index. When the Chinese equity market saw asteep correction as investors were spooked by talks of monetary tightening, local investors took the opportunity to takesome profit as new political issues resurfaced. However, market sentiment improved on the back of better-than-expected corporate earnings reports and the better-than-expected slower contraction of 2Q09 GDP announced (-3.9%YoY, consensus: -5.3%).
‘In 4Q09, the market saw investors buying stocks ahead of the 2010 Budget announcement which was on 23 October2009. On the other hand, selected telecommunication stocks were under selling pressure as fund managers raised cashfor the listing of Maxis Berhad. The fairly strong 3Q09 results season was a pleasant surprise as the number ofcompanies that beat expectations outnumbered those that disappointed consensus. The average value traded on Bursain November improved 7% mom to RM1.38bn (RM1.29bn in Oct) per day, partly boosted by the listing of Malaysiaís andAsean’s largest IPO in 2009 – Maxis Berhad. Despite concerns about Dubai’s solvency and rights issues announced byselected big-cap stocks, positive corporate newsflow and potential M&A announcements helped the FBMKLCI to close2009 at 1272.78.
Investment Review
5Takafulink Funds Report 2009

Bond MarketDomestically, Consumer Price Index (CPI) rose to 1.1% yoy in December 2009 for the first time since last May. The lowerCPI was helped by the easing in transport and food prices. On the other hand, the resume of inflation from the lowest-2.4% yoy in July and August 2009, indicating the higher base effect is gradually wearing off. The easing inflationarypressure has given Bank Negara Malaysia (BNM) rooms to implement an accommodative monetary policy to boosteconomic growth.
The local bond market started off 2009 stronger with the 75bps OPR cut and moderating inflation. However, sovereignbond supply concerns, Fitch’s placing of Malaysia’s local-currency debt rating from ‘stable’ to ‘negative’, and BNM’scomment that the OPR cut has been ‘frontloaded’ severely affected market sentiment, and despite the 50bps OPR cutin February and the revision to the MGS auction calendar, sovereign yields ended higher in the 1Q09.
Supply concerns continue to plague the sovereign bond market in 2Q09, and coupled with lower expectations of ratecuts in near future as well as Fitch Ratingís downgrade of Malaysia’s long-term local currency rating from A+ to A,sovereign yield were driven north in 2Q09.
Sovereign bonds strengthened at the beginning of 3Q09 amidst BNM Governor’s comment that more rate cuts cannotbe ruled out. However, trading in sovereign bonds turned weak on the back of lower contraction of 2Q09 GDP reportedand ahead of festive month of September 2009.
MGS yield rose at the beginning of 4Q09 despite a smaller target deficit of 5.6% for 2010 GDP announced during the2010 Budget in October 2009. The higher corporate bond issuances (Mostly AAA), sapped some interest from thesovereign bonds, also contributed to higher yield in MGS. Sovereign yields improved before profit taking activitiesemerged towards the end of the year, as supply concerns diminished post the 2010 Budget announcement.
As a result, yields were traded higher for the period under review. The 3-, 5- and 10-year sovereign bond yields rose by29bps, 83bps and 108bps and closed at 3.24%, 3.79% and 4.25% respectively.
Corporate bond yields generally moved in tandem with sovereign bond yields, albeit at a lag. Activities in the corporatebond market was supported by improving risk appetite and dominated by selected names in the AAA and AA segments,leading to a tightening in credit spreads and therefore improved returns.
Investment Review(cont.)
6 Takafulink Funds Report 2009

Takafulink Dana EkuitiAs at 31 December 2009, the Fundís Net Asset Value per unit appreciated by 36.13% to RM1.1949 as compared toRM0.8777 as at 31 December 2008.
Since inception (1st December 2006), the Fund registered a positive return of 19.49%.
Takafulink Dana BonAs at 31 December 2009, the Net Asset Value per unit of Takaful Dana Bon increased to RM1.1134 from RM1.0603 asat on 31 December 2008, recording a return of 5.01% for the period under review.
Since inception (1st December 2006), the Fund registered a positive return of 11.34%.
Takafulink Dana UrusAs at 31 December 2009, the Net Asset Value per unit of the Takafulink Dana Urus was RM1.1826 compared toRM0.9156 as at 31 December 2008, recording a return of 29.17% for the period under review.
Since inception (1st December 2006), the Fund registered a positive return of 18.26%.
7Takafulink Funds Report 2009
Fund Performance

EquityDespite the scepticism felt at the beginning of 2009, the global economy seems to have turned the corner as evidencedby improving economic data points in the second half of 2009. Indeed the major economies of the US and the Eurozonehave already begun to register positive annualised growth in the 3rd Quarter. Similarly many countries in the region havealso returned to positive growth when measured on a year-on-year basis. While the global economy is on track torecover, the pace of recovery is likely to be slow and uneven, given that the global deleveraging is still ongoing, andcountries around the globe continue to depend on government policy support for sustainable growth.
The outlook for 2010 is looking more challenging with central banks and governments likely to unwind the loosemonetary and fiscal policies in place for most of 2009. The risk of asset bubbles and their costly aftermath will ensuremore obvious tightening measures will be implemented globally by mid 2010.
Domestically, we expect the PM YAB Datuk Seri Najib Tun Razak to continue to introduce more liberalization policies,economic data released should be positive given the low base of 2009, and corporate earnings is likely to continue tostrengthen.
Some events or factors that may lend support to the local bourse include:• Improving macro fundamentals.• Positive government liberalisation policies announced.• More consumer friendly policies announced. • More M&As and corporate restructuring activities.• More IPOs in the pipeline
We continue to favour a bottom-up investment strategy moving forward, whereby tactical stock selection and assetallocation will drive fund outperformance. We will continue to look for companies with stability in earnings,demonstratable competitiveness in local or overseas markets, transparency and good corporate governance practice.
Investment Outlook
8 Takafulink Funds Report 2009

BondDomestically, the slow pace of economic recovery, and upward trending but still manageable inflationary pressure, willgive Bank Negara Malaysia (BNM) the leeway to continue its accommodative monetary policy stance to support thedomestic economic recovery. Any rate hikes in 2010 is expected to be modest given the slow pace of economic recovery.
In line with the government’s policy to unwind its fiscal expansion from 7.4% of GDP in 2009 to forecasted 5.6% of GDPin 2010, BNM recently released the 2010 sovereign bonds auction calendar, with a smaller number of auctions comparedto 2009 (19 against 28 in 2009). With this, supply concern for the sovereign bond market has somewhat diminished.
Supply and activity of corporate bonds is expected to improve in 2010 as Issuers are expected to take advantage of thelow interest rate environment and improving risk appetite of investors, to lock-in cheaper borrowing costs before anyrate hikes.
An environment of ample liquidity, low interest rates, and wide credit spreads, will continue to be supportive of the bondmarket. An economic recovery and improving financials will potentially shift risk appetites to lower investment gradebonds, leading to a tightening in credit spreads and therefore improved returns. We will continue to accumulate qualityissues with stable cash flow and look for trading opportunities.
9Takafulink Funds Report 2009

Financial HighlightsFor the financial year ended 31 December 2009
10 Takafulink Funds Report 2009
TAKAFULINKDANAEKUITI
Category 2009 2008 2007% % %
Shariah Approved SharesBuilding Materials 2.73 1.20 6.77Conglomerates 13.30 10.86 13.15Construction 7.98 8.43 8.47Consumer 2.89 2.25 1.55Finance 0.28 – –Industrial 5.58 2.39 3.66Media 0.25 1.25 3.14Motor 1.45 1.66 3.76Oil & Gas 4.76 6.21 10.24Plantation 14.67 8.44 6.57Power 10.41 8.52 7.04Property 4.77 2.07 5.30Technology 0.60 – 3.31Telecommunications 12.49 10.64 4.35Timber – – 0.41Transportation 3.07 4.24 4.37Water 0.49 1.08 2.07
85.72 69.25 84.16
Cash and Deposits 15.38 28.66 18.63Other Assets 0.75 2.35 (0.01)Total Liabilities (1.85) (0.46) (2.78)
Total 100.00 100.00 100.00

TAKAFULINKDANAEKUITI(cont.)
Category 2009 2008 2007% % %
Total Net Asset Value (RM) 93,892,359 39,816,472 22,179,240Units in Circulation 78,577,690 45,362,268 16,330,676NAV Per Unit (RM) 1.1949 0.8777 1.3581Highest NAV per unit (RM) 1.204 1.406 1.363Lowest NAV per unit (RM) 0.871 0.844 0.983Total Return- Capital Growth 36.13% -35.37% 35.81
Average Annual Return – FundPeriodOne year 36.13%Three years 5.53%
Average Annual Return – Benchmark: FTSE-Bursa Malaysia Emas Shariah Index (FBMSHA) PeriodOne year 43.03%Three years 5.10%
Financial HighlightsFor the financial year ended 31 December 2009
11Takafulink Funds Report 2009

12 Takafulink Funds Report 2009
TAKAFULINKDANABON
Category 2009 2008 2007% % %
Islamic Debts Securities 54.25 63.11 85.40Government Bonds 26.37 10.88 0.00Quasi Government Bonds 7.13 0.00 0.00
87.74 73.99 85.40
Cash and Deposits 12.40 25.35 14.16Other Assets 0.66 1.25 1.07Total Liabilities (0.80) (0.59) (0.63)
Total 100.00 100.00 100.00
Total Net Asset Value (RM) 18,742,204 15,528,062 11,704,512Units in Circulation 16,817,282 14,645,091 11,238,402NAV Per Unit (RM) 1.1134 1.0603 1.0415Highest NAV per unit (RM) 1.114 1.060 1.043Lowest NAV per unit (RM) 1.060 1.025 1.000Total Return- Capital Growth 5.01% 1.81% 4.15
Average Annual Return – FundPeriodOne year 5.01%Three years 3.44%
Average Annual Return – Benchmark: MBB 1 month Tier 2 Islamic Deposit ratePeriodOne year 2.13%Three years 2.65%
Financial HighlightsFor the financial year ended 31 December 2009

13Takafulink Funds Report 2009
TAKAFULINKDANAURUS
Category 2009 2008 2007% % %
Investment in-Takafulink Dana Ekuiti 81.33 76.83 84.84Takafulink Dana Bon 18.67 23.17 15.16Other Assets 0.00 – –
Total 100.00 100.00 100.00
Total Net Asset Value (RM) 23,037,250 9,031,083 3,047,901Units in Circulation 19,479,632 9,864,080 2,358,805NAV Per Unit (RM) 1.1826 0.9156 1.2921Highest NAV per unit(RM) 1.188 1.331 1.292Lowest NAV per unit(RM) 0.911 0.885 0.987Total Return- Capital Growth 29.17% -29.14% 29.21
Average Annual Return – FundPeriodOne year 29.17%Three years 5.26%
Average Annual Return – Benchmark: 80% FBMSHA + 20% MBB 1 month Tier 2 Islamic Deposit ratePeriodOne year 34.02%Three years 4.95%
Financial HighlightsFor the financial year ended 31 December 2009
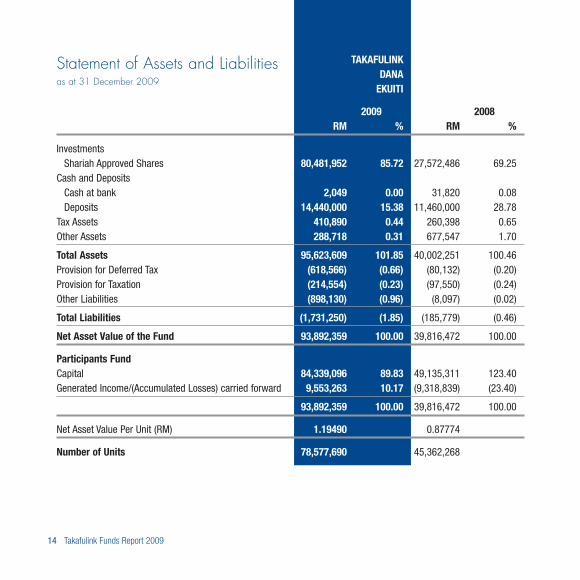
TAKAFULINKDANAEKUITI
2009 2008RM % RM %
InvestmentsShariah Approved Shares 80,481,952 85.72 27,572,486 69.25
Cash and DepositsCash at bank 2,049 0.00 31,820 0.08Deposits 14,440,000 15.38 11,460,000 28.78
Tax Assets 410,890 0.44 260,398 0.65Other Assets 288,718 0.31 677,547 1.70
Total Assets 95,623,609 101.85 40,002,251 100.46Provision for Deferred Tax (618,566) (0.66) (80,132) (0.20)Provision for Taxation (214,554) (0.23) (97,550) (0.24)Other Liabilities (898,130) (0.96) (8,097) (0.02)
Total Liabilities (1,731,250) (1.85) (185,779) (0.46)
Net Asset Value of the Fund 93,892,359 100.00 39,816,472 100.00
Participants FundCapital 84,339,096 89.83 49,135,311 123.40Generated Income/(Accumulated Losses) carried forward 9,553,263 10.17 (9,318,839) (23.40)
93,892,359 100.00 39,816,472 100.00
Net Asset Value Per Unit (RM) 1.19490 0.87774
Number of Units 78,577,690 45,362,268
Statement of Assets and Liabilitiesas at 31 December 2009
14 Takafulink Funds Report 2009

TAKAFULINKDANABON
2009 2008RM % RM %
InvestmentsIslamic Debts Securitites 16,429,142 87.74 11,489,102 73.99
Cash and DepositsCash at bank 2,206 0.01 7,543 0.05
Deposits 2,320,000 12.39 3,930,000 25.30Other Assets 123,288 0.66 193,709 1.25
Total Assets 18,874,636 100.80 15,620,354 100.59Provision for Taxation (145,032) (0.77) (90,546) (0.58)Provision for Deferred Tax (1,145) (0.01) (178) 0.00Other Liabilities (4,255) (0.02) (1,568) (0.01)
Total Liabilities (150,432) (0.80) (92,292) (0.59)
Net Asset Value of the Fund 18,724,204 100.00 15,528,062 100.00
Participants FundCapital 17,224,557 91.99 14,859,564 95.69Generated Income carried forward 1,499,647 8.01 668,498 4.31
18,724,204 100.00 15,528,062 100.00
Net Asset Value Per Unit (RM) 1.11339 1.06029
Number of Units 16,817,282 14,645,091
15Takafulink Funds Report 2009
Statement of Assets and Liabilitiesas at 31 December 2009

TAKAFULINKDANAURUS
2009 2008RM % RM %
Investments in -Takafulink Dana Ekuiti 18,737,138 81.33 6,938,410 76.83Takafulink Dana Bon 4,300,103 18.67 2,092,620 23.17Cash At Bank – – – –Other Assets 830 0.00 3 75 0.00
Total Assets 23,038,071 100.00 9,031,405 100.00Other Liabilities (821) (0.00) (322) (0.00)
Total Liabilities (821) (0.00) (322) (0.00)
Net Asset Value of the Fund 23,037,250 100.00 9,031,083 100.00
Participants FundCapital 20,908,159 90.76 10,616,085 117.55Generated Income/(Accumulated Losses) carried forward 2,129,091 9.24 (1,585,002) (17.55)
23,037,250 100.00 9,031,083 100.00
Net Asset Value Per Unit (RM) 1.18263 0.91555
Number of Units 19,479,632 9,864,080
Statement of Assets and Liabilitiesas at 31 December 2009
16 Takafulink Funds Report 2009
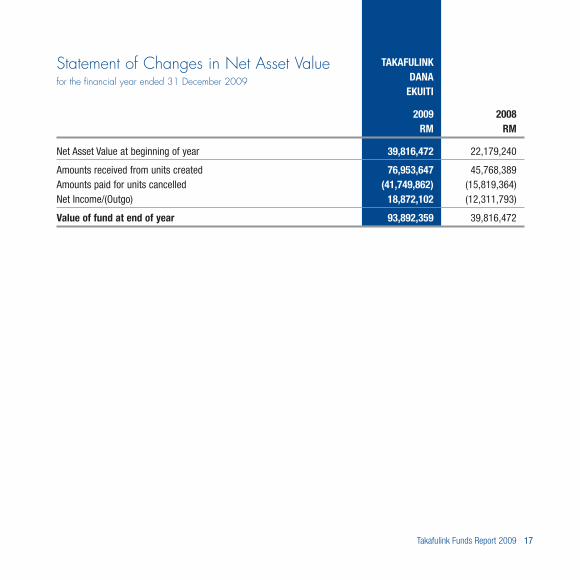
Takafulink
Dana
EkuiTi
2009 2008RM RM
Net Asset Value at beginning of year 39,816,472 22,179,240
Amounts received from units created 76,953,647 45,768,389Amounts paid for units cancelled (41,749,862) (15,819,364)Net Income/(Outgo) 18,872,102 (12,311,793)
Value of fund at end of year 93,892,359 39,816,472
Statement of Changes in Net Asset Valuefor the financial year ended 31 December 2009
17Takafulink Funds Report 2009

TAKAFULINKDANABON
2009 2008RM RM
Net Asset Value at beginning of year 15,528,062 11,704,512
Amounts received from units created 9,140,169 5,519,762Amounts paid for units cancelled (6,775,176) (1,962,448)Net Income 831,149 266,236
Value of fund at end of year 18,724,204 15,528,062
Statement of Changes in Net Asset Valuefor the financial year ended 31 December 2009
18 Takafulink Funds Report 2009

TAKAFULINKDANAURUS
2009 2008RM RM
Net Asset Value at beginning of year 9,031,083 3,047,901
Amounts received from units created 20,013,016 12,505,129Amounts paid for units cancelled (9,720,942) (4,733,391)Net Income/(Outgo) 3,714,093 (1,788,556)
Value of fund at end of year 23,037,250 9,031,083
19Takafulink Funds Report 2009
Statement of Changes in Net Asset Valuefor the financial year ended 31 December 2009

TAKAFULINKDANAEKUITI
2009 2008RM RM
Net Investment Income 1,986,007 1,464,506Profit Income 227,032 249,075Dividend income 1,758,975 1,215,431
Profits on Disposal 3,319,208 982,439Securities 3,319,208 982,439
Unrealised Capital Gain 17,959,422 –Other Income 151 567,940
Total Income 23,264,788 3,014,885
Statement of Income & ExpenditureFor the financial year ended 31 December 2009
20 Takafulink Funds Report 2009

TAKAFULINKDANAEKUITI(cont.)
2009 2008RM RM
Investment Management Fees (1,001,373) (453,357)Loss on Disposal (2,702,938) (8,508,726)
Securities (2,702,938) (8,508,726)Unrealised Capital Loss – (6,264,693)Provision for taxation (655,439) (68,814)Other Outgo (32,936) (31,088)
Total Outgo (4,392,686) (15,326,678)
Net Income/(Outgo) 18,872,102 (12,311,793)
(Accumulated Losses)/Generated Income brought forward (9,318,839) 2,992,954Amount Available for Distribution – –Generated Income/(Accumulated Losses) carried forward 9,553,263 (9,318,839)
21Takafulink Funds Report 2009

TAKAFULINKDANABON
2009 2008RM RM
Net Investment Income 681,950 604,736Profit Income 681,950 604,736
Profits on Disposal 16,327 –Securities 16,327 –Others – –
Unrealised Capital Gain 297,470 –Other Income – 17,851
Total Income 995,747 622,587
Statement of Income & ExpenditureFor the financial year ended 31 December 2009
22 Takafulink Funds Report 2009

TAKAFULINKDANABON
(cont.)
2009 2008RM RM
Investment Management Fees (85,576) (66,838)Loss on Disposal (17,200) –
Securities (17,200) –Unrealised Capital Loss – (234,724)Provision for taxation (54,552) (48,165)Other Outgo (7,270) (6,624)
Total Outgo (164,598) (356,351)
Net Income 831,149 266,236
Generated Income brought forward 668,498 402,262Amount Available for Distribution – –Generated Income carried forward 1,499,647 668,498
23Takafulink Funds Report 2009

TAKAFULINKDANAURUS
2009 2008RM RM
Net Investment Income 209,596 71,082Fee Rebate 209,596 71,082
Profits on Disposal 444,625 13,629Securities 444,625 13,629
Unrealised Capital Gain 3,469,082 –Other Income – 4,172
Total Income 4,123,303 88,883
Statement of Income & ExpenditureFor the financial year ended 31 December 2009
24 Takafulink Funds Report 2009

TAKAFULINKDANAURUS(cont.)
2009 2008RM RM
Investment Management Fees (206,276) (72,568)Loss on Disposal (202,756) (433,850)
Securities (202,756) (433,850)Unrealised Capital Loss – (1,371,021)Provision for taxation – –Other Outgo (178) –
Total Outgo (409,210) (1,877,439)
Net Income/(Outgo) 3,714,093 (1,788,556)
(Accumulated Losses)/Generated Income brought forward (1,585,002) 203,554Amount Available for Distribution – –Generated Income/(Accumulated Losses) carried forward 2,129,091 (1,585,002)
25Takafulink Funds Report 2009

1. Summary of Significant Accounting Policies
a. Basis of Accounting
The financial statements have been prepared in accordance with JPI/GPI 33 – The Guidelines on Investment-Linked business and the requirements of the certificate document, modified by the following:
(i) for the purpose of unit pricing, investments at market value are adjusted to include future cost ofacquisitions. This is to ensure equitable unit pricing for incoming, outgoing and remaining unit-holders; and
(ii) for the purpose of unit pricing, provision for deferred tax is recognized on taxable and deductible temporarydifferences using an actuarially calculated rate of 4% instead of the statutory rate of 8%. The Board ofDirectors are of the opinion that since these temporary differences will only be realized in the future, thelower tax rate of 4% has been used to ensure equitable unit pricing for incoming, outgoing and remainingunit-holders.
b. Investments
Quoted investments are valued at the closing market prices at the end of the financial year.
Unquoted loan stock/bonds are valued at the prevailing prices quoted by financial institutions.
Net unrealized gains or losses in value of investments are credited or charged to the capital account.
c. Dividend Income
Dividend income is recognized when the right to receive payment is established.
d. Profit Income
Profit income is recognized on an accrual basis.
Notes to the Accounts
26 Takafulink Funds Report 2009

e. Gains/Losses on Disposal of Investments
Gains or losses arising from the disposal on investment are credited or charged to the capital account.
f. Investment Management fees
Investment management fees are calculated in accordance with the provisions of the certificate document.
g. Fee Rebate
This relates to rebate of fees from the Fund Manager in respect of investment held in Takafulink Dana Ekuiti andTakafulink Dana Bon for the Takafulink Dana Urus.
h. Cash and cash equivalents
Cash and cash equivalents consists of cash in hand and balances with banks, excluding Islamic deposits.
2. Other Outgo comprises bank charges and custodian charges.
3. At 31 December 2009, the Funds had no contingent liabilities or commitments.
4. All amounts are stated in Ringgit Malaysia.
27Takafulink Funds Report 2009

In the opinion of the Directors, the Takafulink Funds (‘’Funds’’) financial statements set out on pages 14 to 27,comprising the statements of assets and liabilities as at 31 December 2009 and the related Statements of Income andExpenditure and Statements of Changes in Net Asset Value for the financial year ended 31 December 2009 togetherwith the notes thereto, have been drawn up in accordance with JPI/GPI 33 – The Guidelines on Investment-LinkedBusiness issued by Bank Negara Malaysia and give true and fair view of the financial position of the Funds as at 31December 2009 and their financial performance and the movements in the Statements of Changes in Net Assetsattributable to the unitholders of the Funds for year ended on that date.
Signed in accordance with a resolution of the Directors:
Adinan bin Maning
Charlie Espinola Oropeza
Kuala Lumpur31 March 2010
Statement by Directors
28 Takafulink Funds Report 2009

Report on the Financial StatementsWe have audited the financial statements of Takafulink Funds of Prudential BSN Takaful Berhad, which comprise theStatements of Assets and Liabilities as at 31 December 2009, and the related Statements of Income and Expenditure,Statements of Changes in Net Asset Value for the year then ended, and a summary of significant accounting policiesand other explanatory notes, as set out on pages 14 to 27.
Directors’ Responsibility for the Financial Statements
The Directors of the Manager are responsible for the preparation and fair presentation of these financial statements inaccordance with JPI/GPI 33 – The Guidelines on Investment-Linked Business. This responsibility includes: designing,implementing and maintaining internal control relevant to the preparation and fair presentation of financial statementsthat are free from material misstatement, whether due to fraud or error; selecting and applying appropriate accountingpolicies; and making accounting estimates that are reasonable in the circumstances.
Auditors’ Responsibility
Our responsibility is to express an opinion on these financial statements based on our audit. We conducted our audit inaccordance with approved standards on auditing in Malaysia. Those standards require that we comply with ethicalrequirements and plan and perform the audit to obtain reasonable assurance whether the financial statements are freefrom material misstatement.
An audit involves performing procedures to obtain audit evidence about the amounts and disclosures in the financialstatements. The procedures selected depend on our judgment, including the assessment of risks of materialmisstatement of the financial statements, whether due to fraud or error. In making those risk assessments, we considerinternal control relevant to the Manager’s preparation and fair presentation of the financial statements in order to designaudit procedures that are appropriate in the circumstances, but not for the purpose of expressing an opinion on theeffectiveness of the Manager’s internal control. An audit also includes evaluating the appropriateness of accountingpolicies used and the reasonableness of accounting estimates made by the Directors, as well as evaluating the overallpresentation of the financial statements.
We believe that the audit evidence we have obtained is sufficient and appropriate to provide a basis for our auditopinion.
Report of the Auditorsto the Unitholders of Takafulink Funds
29Takafulink Funds Report 2009

Opinion
In our opinion, the financial statements have been properly drawn up in accordance with the accounting policies set outin Note 1 to the financial statements and JPI/GPI 33 – The Guidelines on Investment-Linked Business so as to give a trueand fair view of the financial position of the Funds as of 31 December 2009 and of their financial performance andchanges in net assets attributable to the unitholders of the Funds for the year then ended in accordance with JPI/GPI 33.
Emphasis of Matter
Without qualifying our opinion, we wish to draw your attention to Note 1a to the financial statements. For the purposesof unit pricing, investments are adjusted to include future cost of acquisitions, and provision for deferred tax wascalculated using a rate lower than the statutory tax rate. As explained in Note 1a, the Directors are of the opinion thatthe above would be fairer to the unitholders in the pricing of units.
The potential effect of the above matter is not significant to the pricing of units in the respective Funds.
Other MattersThis report is made solely to the members of the Company, as a body, in accordance with Section 174 of the CompaniesAct, 1965 in Malaysia and for no other purpose. We do not assume responsibility to any other person for the content ofthis report.
KPMGChartered Accountants
Petaling Jaya, Selangor31 March 2010
Report of the Auditorsto the Unitholders of Takafulink Funds (cont.)
30 Takafulink Funds Report 2009