talat odman and yongtao hu, georgia tech zac adelman, mohammad omary and uma shankar, unc james...
TRANSCRIPT
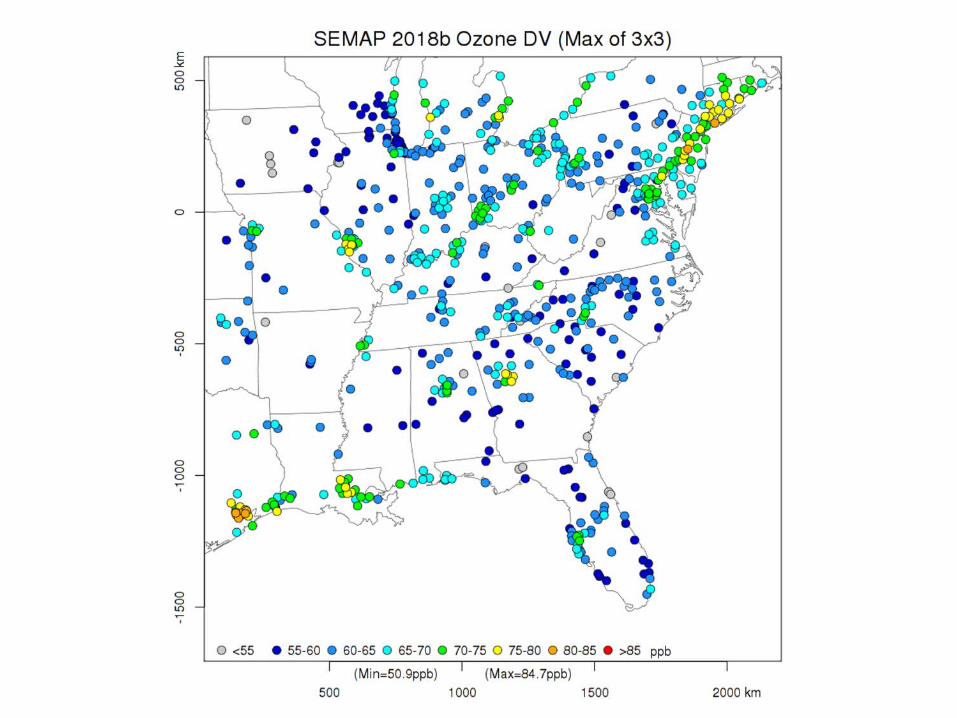
Ozone Sensitivities to NOx and VOC Emissions in Southeastern US: Projections for 2018 and a Look Back at 2009
Talat Odman and Yongtao Hu, Georgia TechZac Adelman, Mohammad Omary and Uma Shankar, UNCJames Boylan and Byeong-Uk Kim, Georgia DNR
SEMAP Project
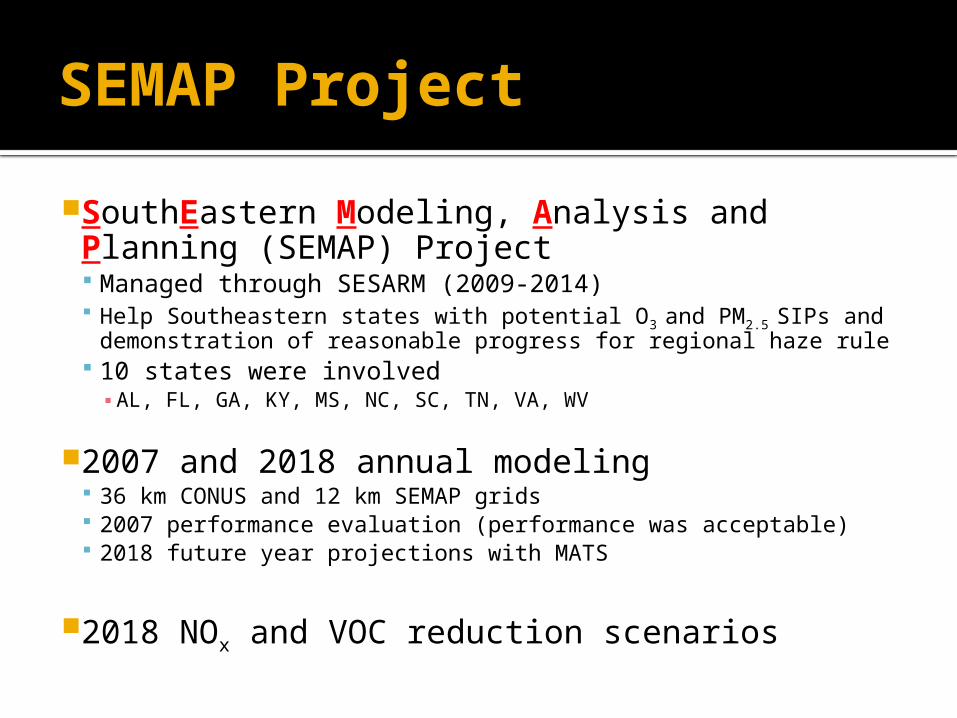
SouthEastern Modeling, Analysis and Planning (SEMAP) Project Managed through SESARM (2009-2014) Help Southeastern states with potential O3 and PM2.5 SIPs and
demonstration of reasonable progress for regional haze rule 10 states were involved▪ AL, FL, GA, KY, MS, NC, SC, TN, VA, WV
2007 and 2018 annual modeling 36 km CONUS and 12 km SEMAP grids 2007 performance evaluation (performance was acceptable) 2018 future year projections with MATS
2018 NOx and VOC reduction scenarios
3
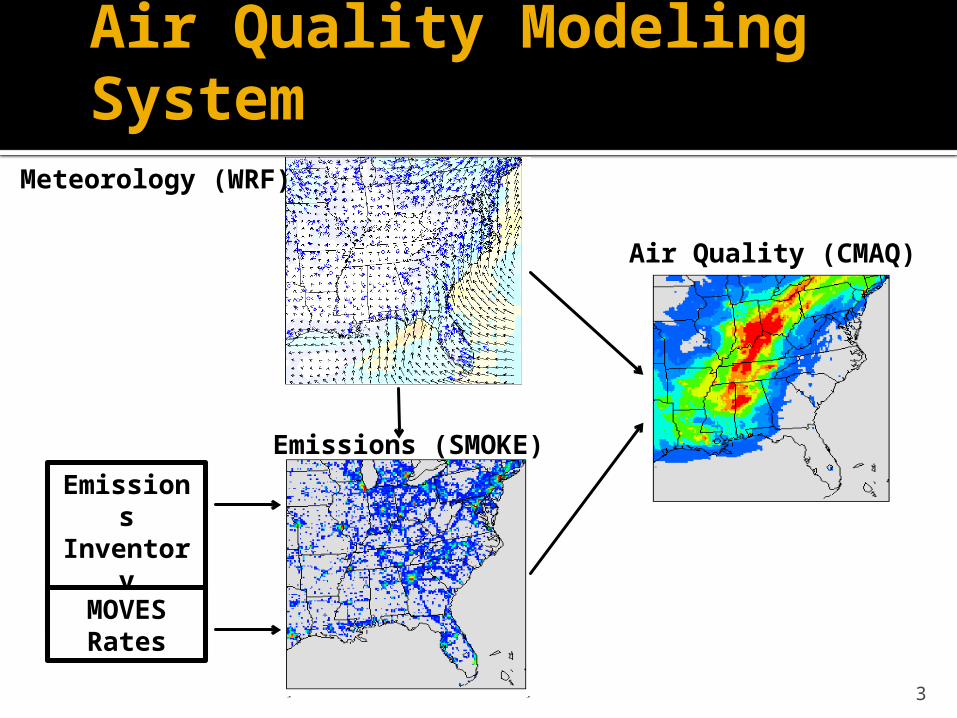
Air Quality Modeling System
Meteorology (WRF)
Air Quality (CMAQ)
Emissions (SMOKE)
Emissions
Inventory
(NIF)MOVESRates
4
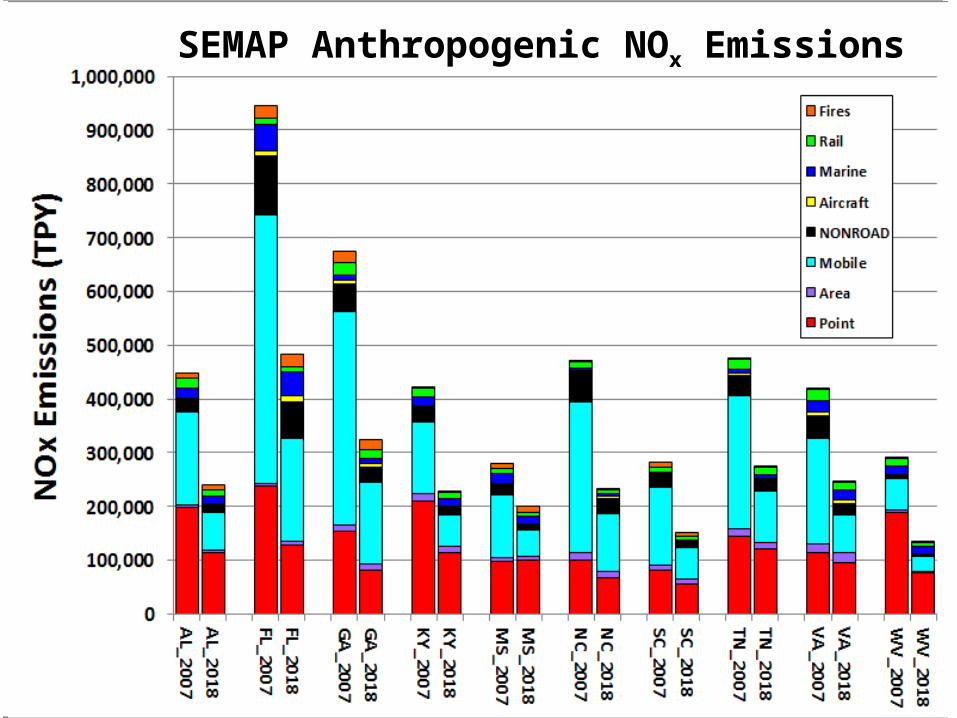
SEMAP Anthropogenic NOx Emissions
5
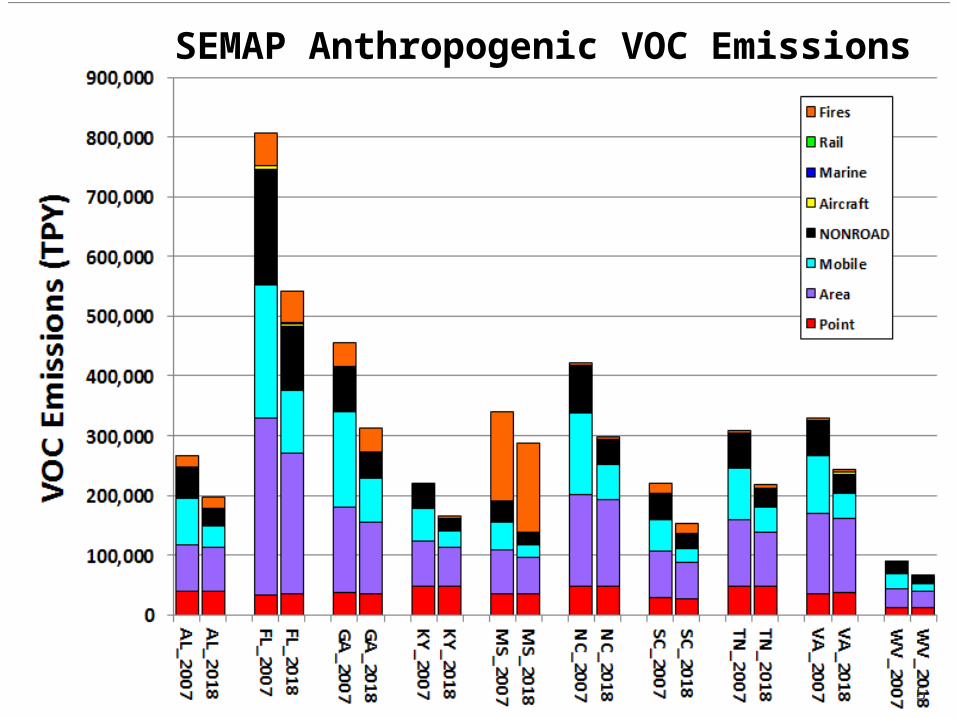
SEMAP Anthropogenic VOC Emissions
Ozone Sensitivities
Started with 2018 emissions 2018 results are the baseline.
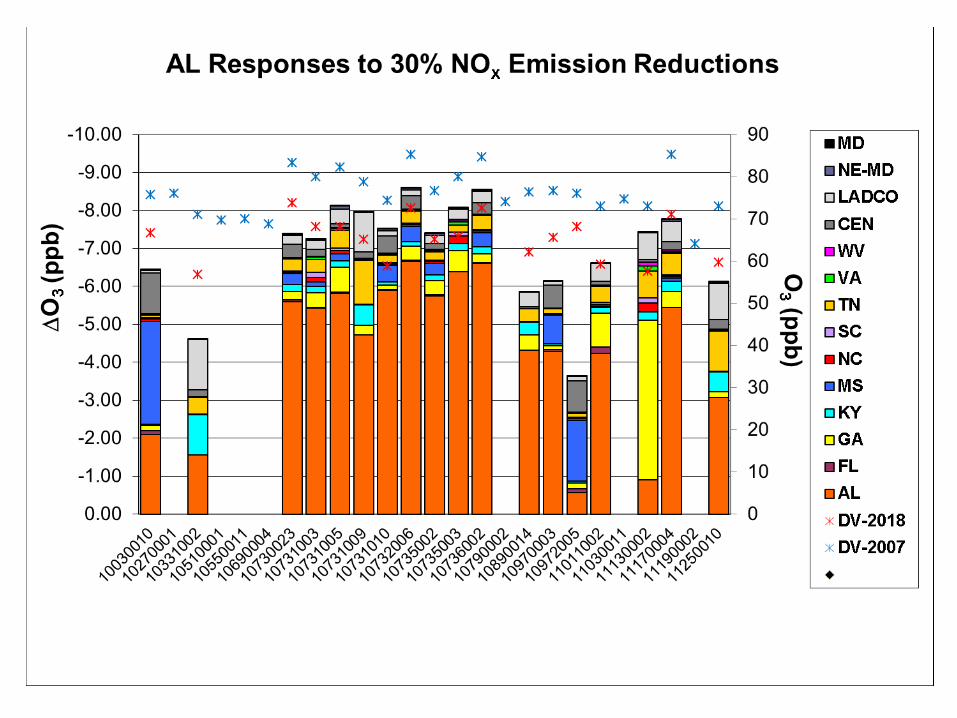
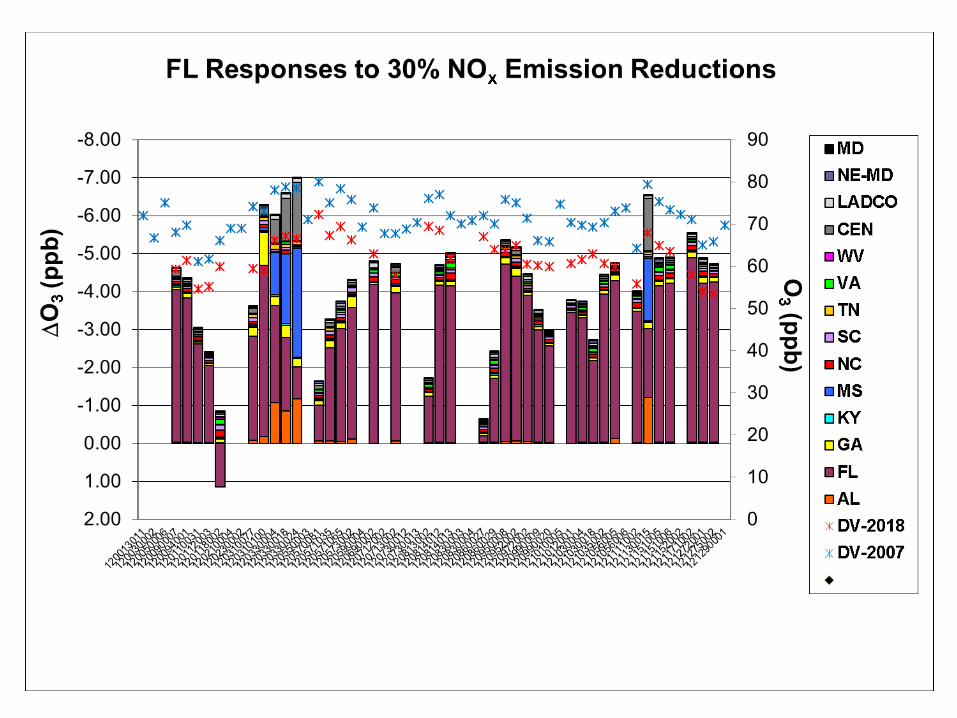
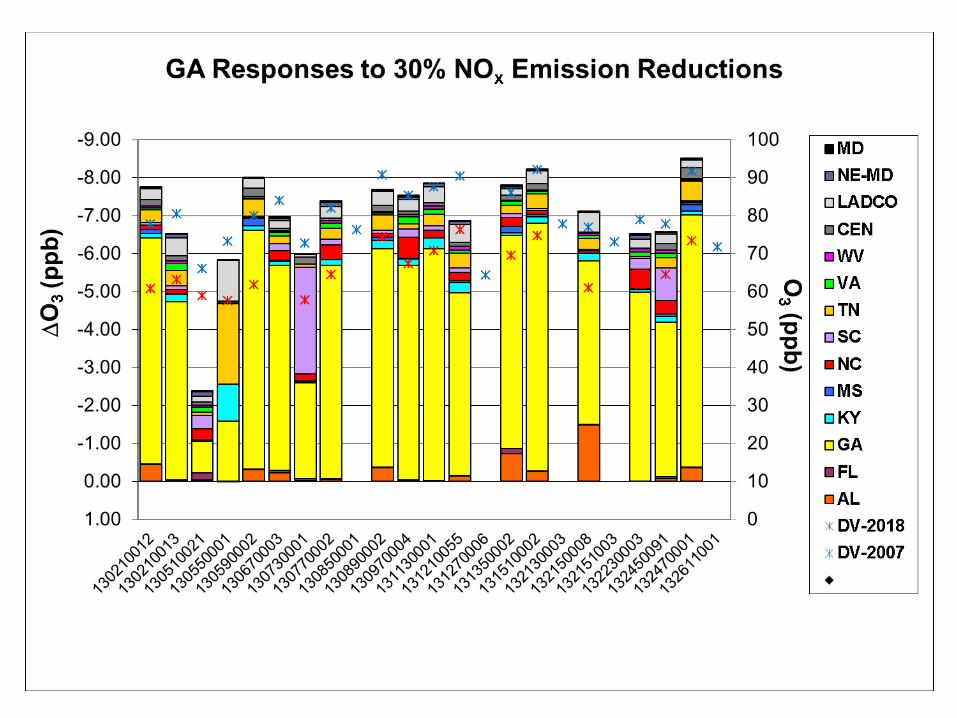
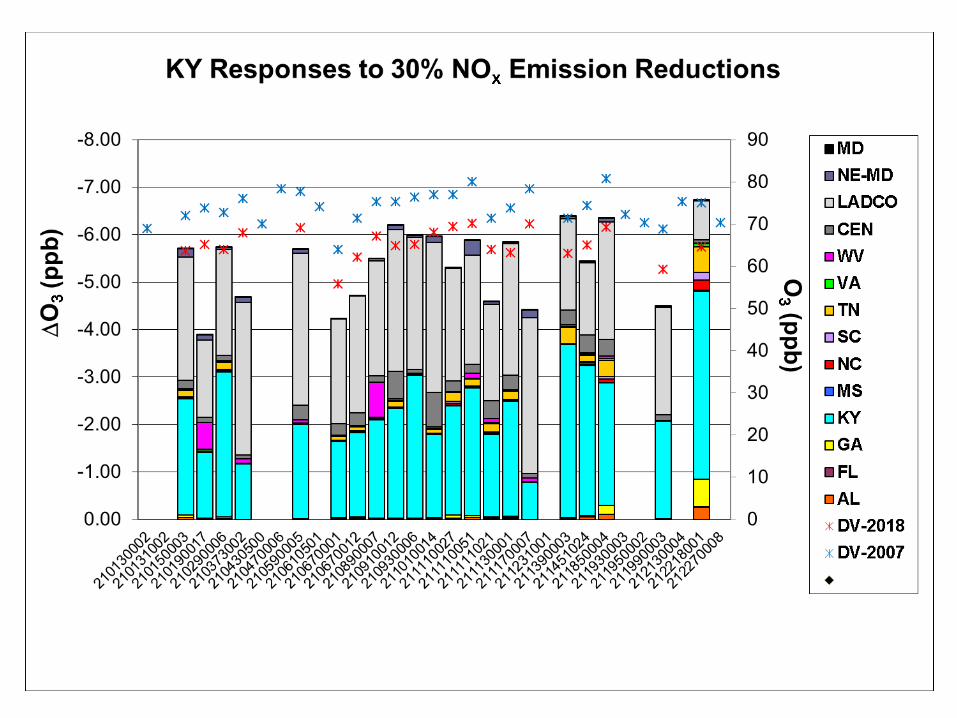
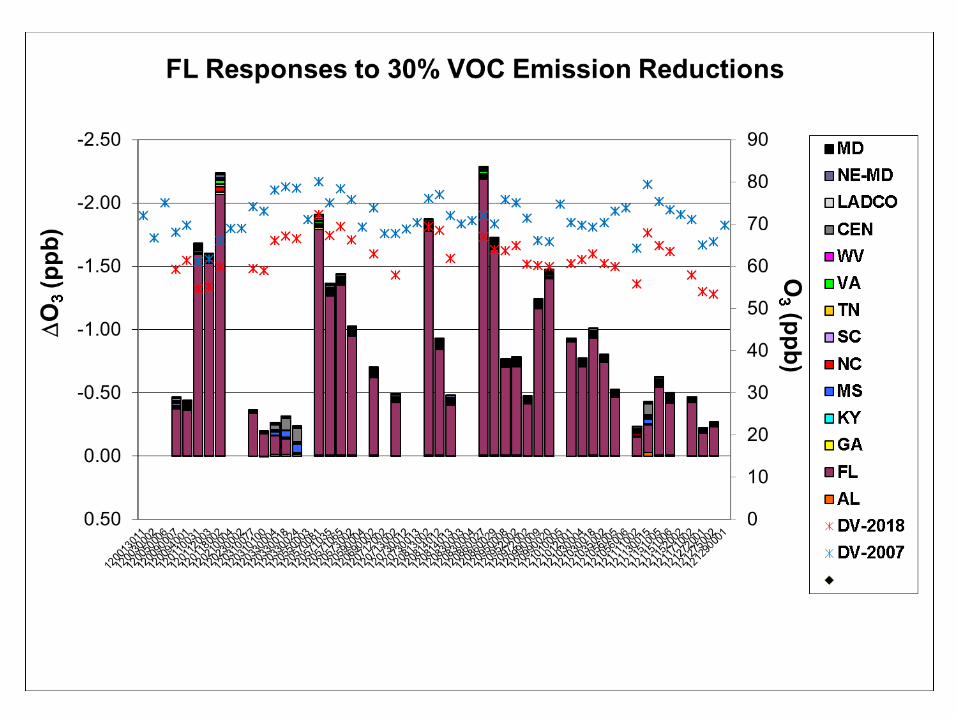
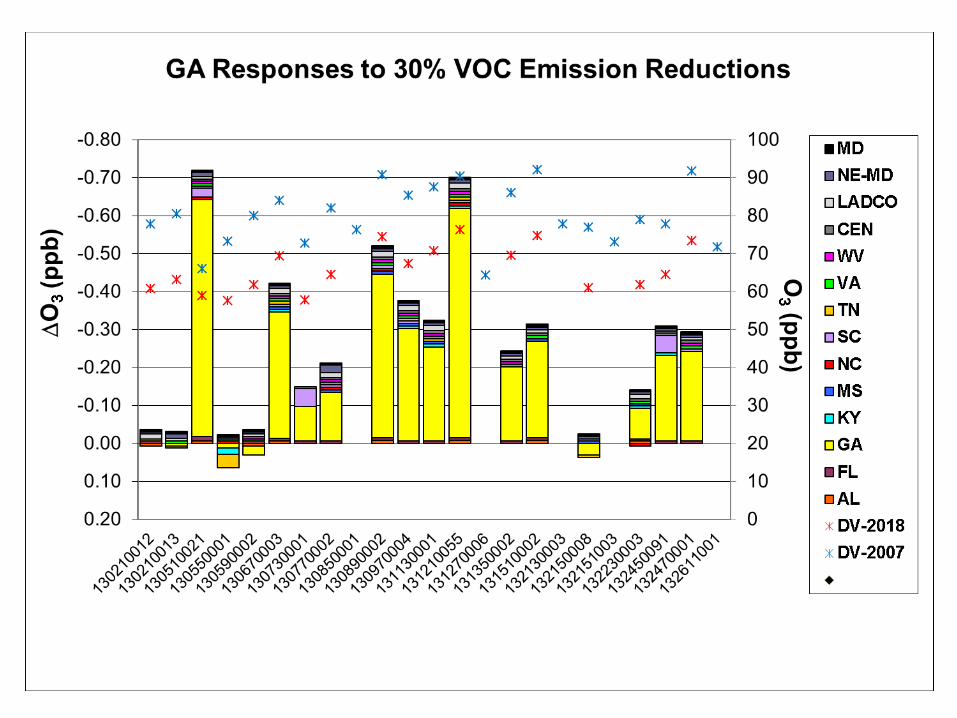
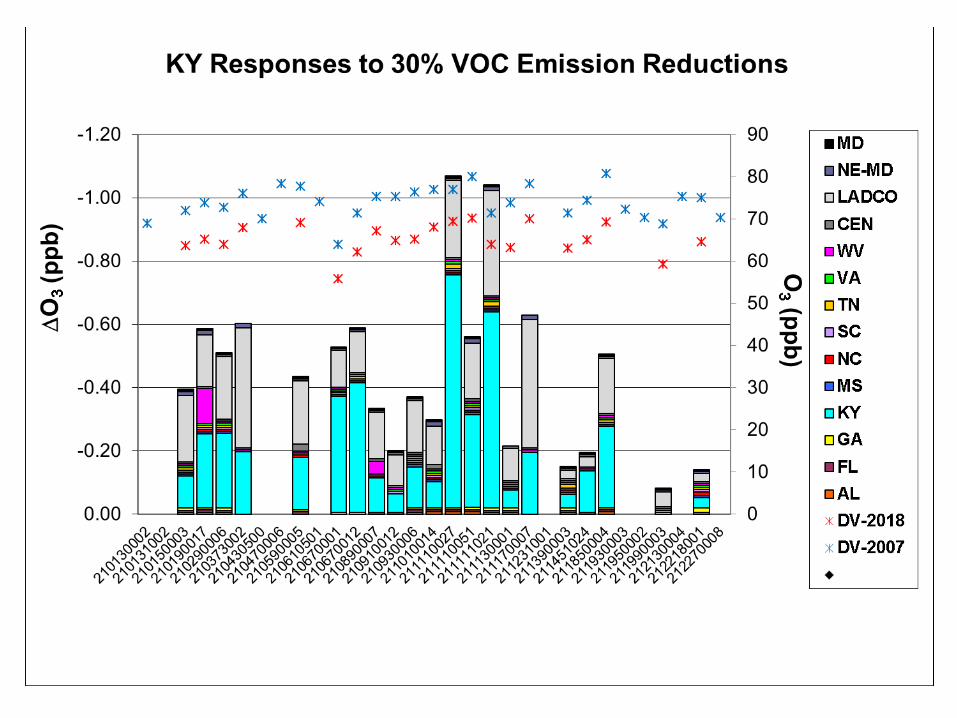
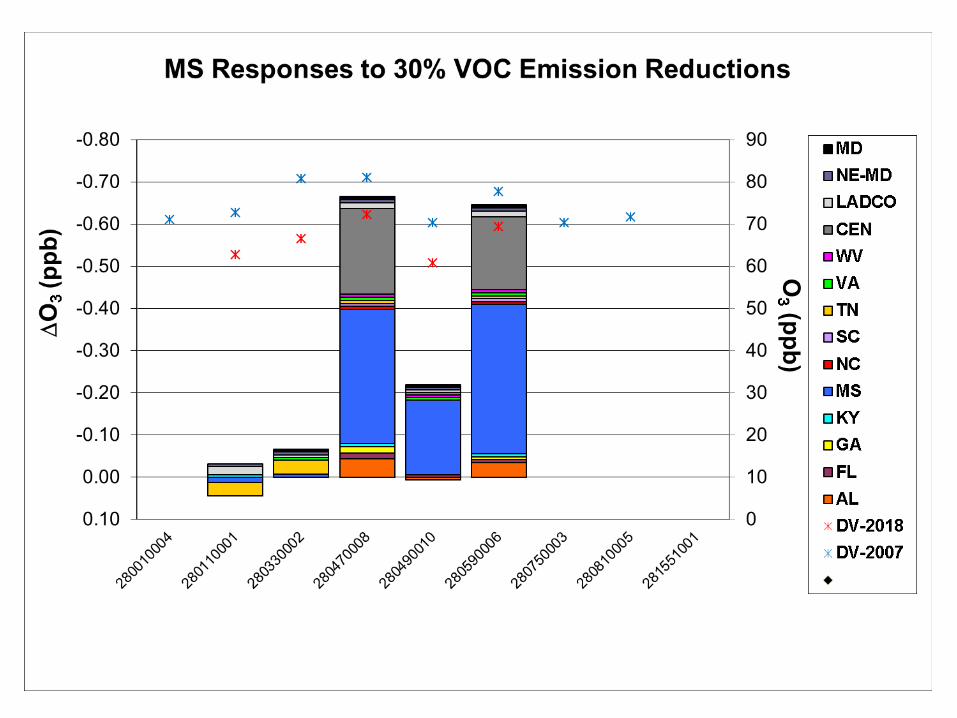
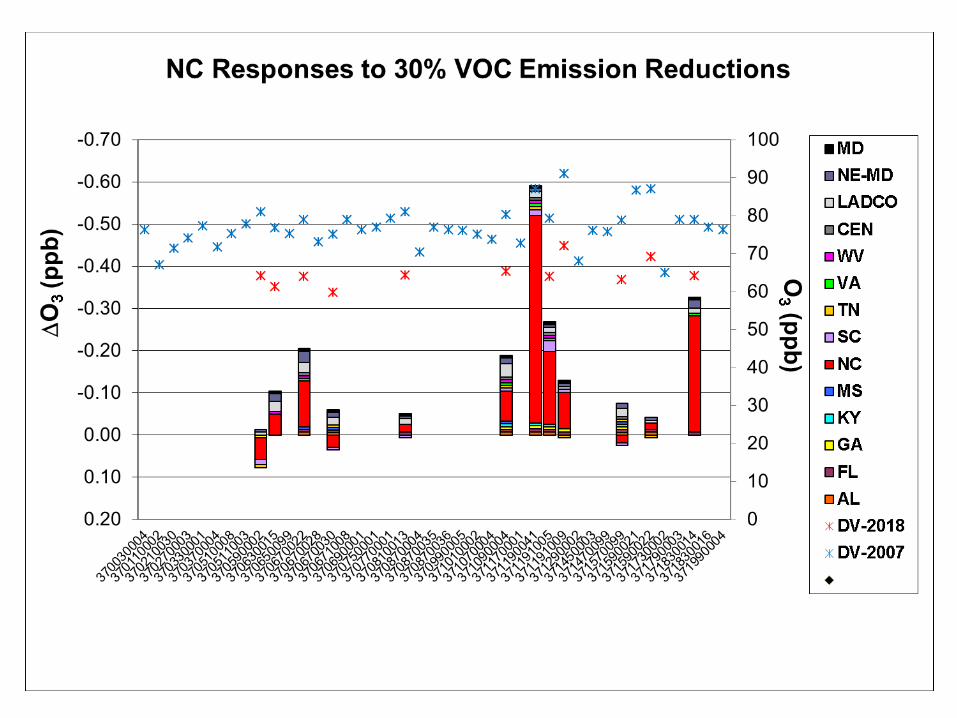
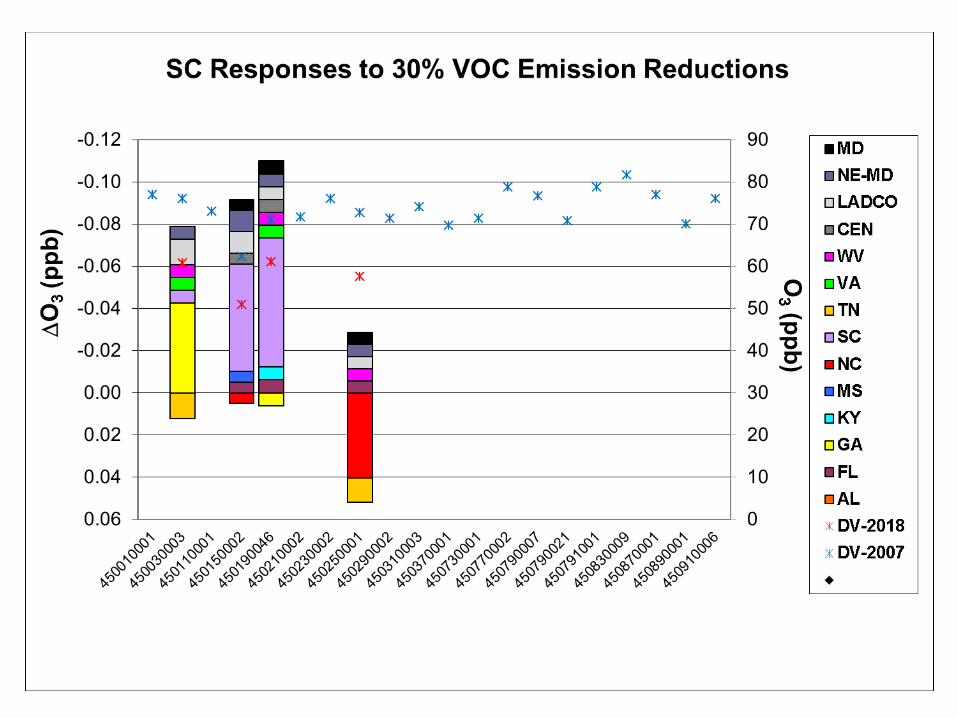
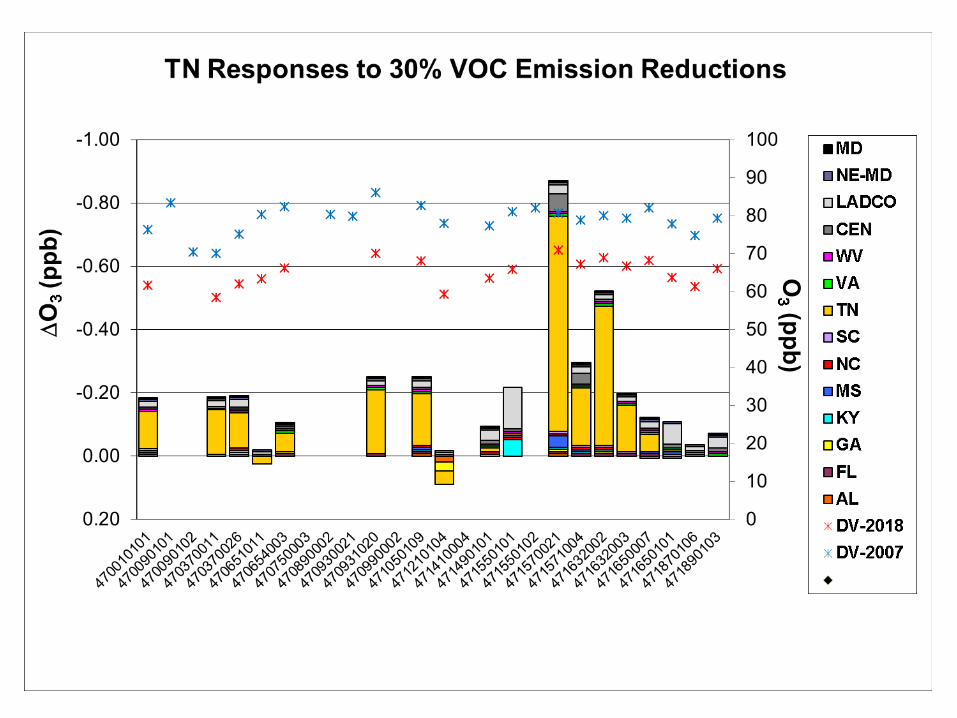
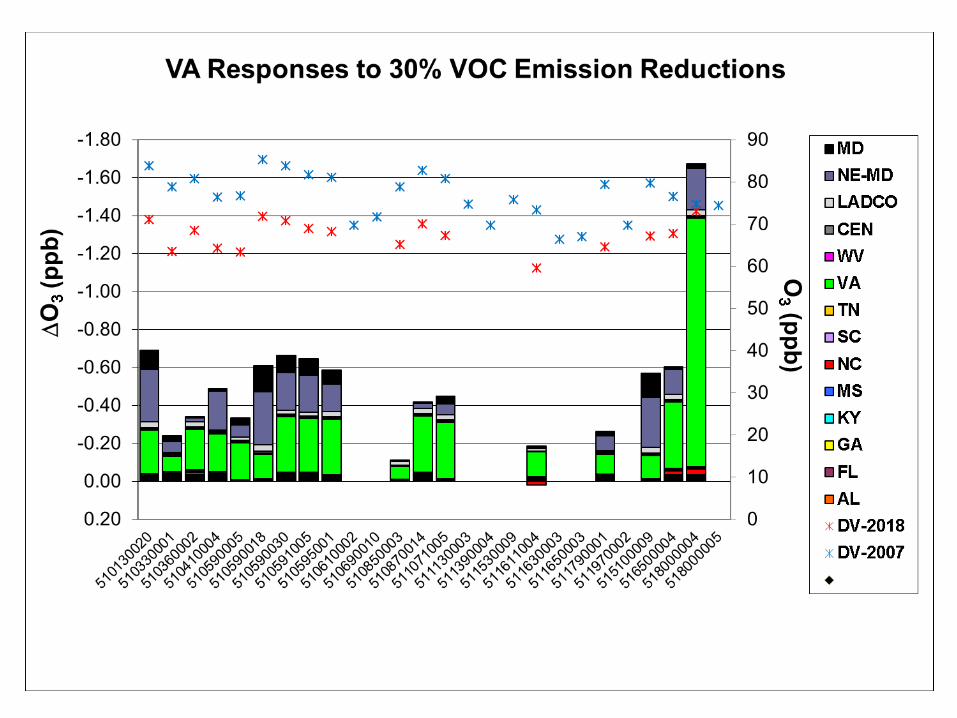
Performed emission reduction simulations Ozone season (May-) on 12-km grid Statewide 30% emission reductions▪ Separately from each SESARM state▪ NOx and VOCs individually▪ Point, area, mobile, nonroad, MAR
categories
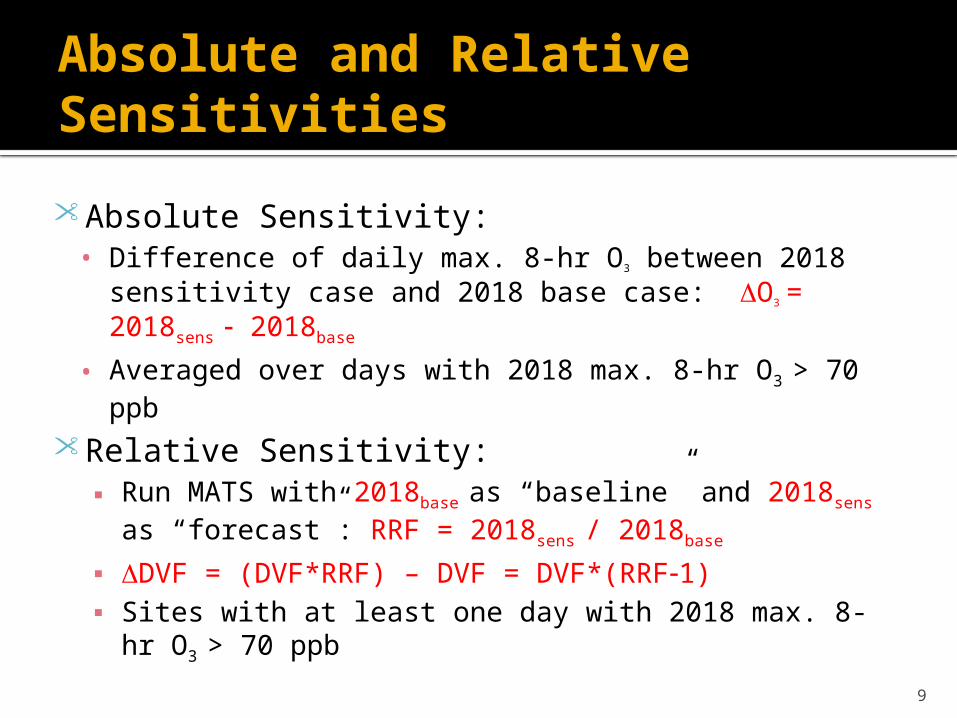
Absolute and Relative Sensitivities
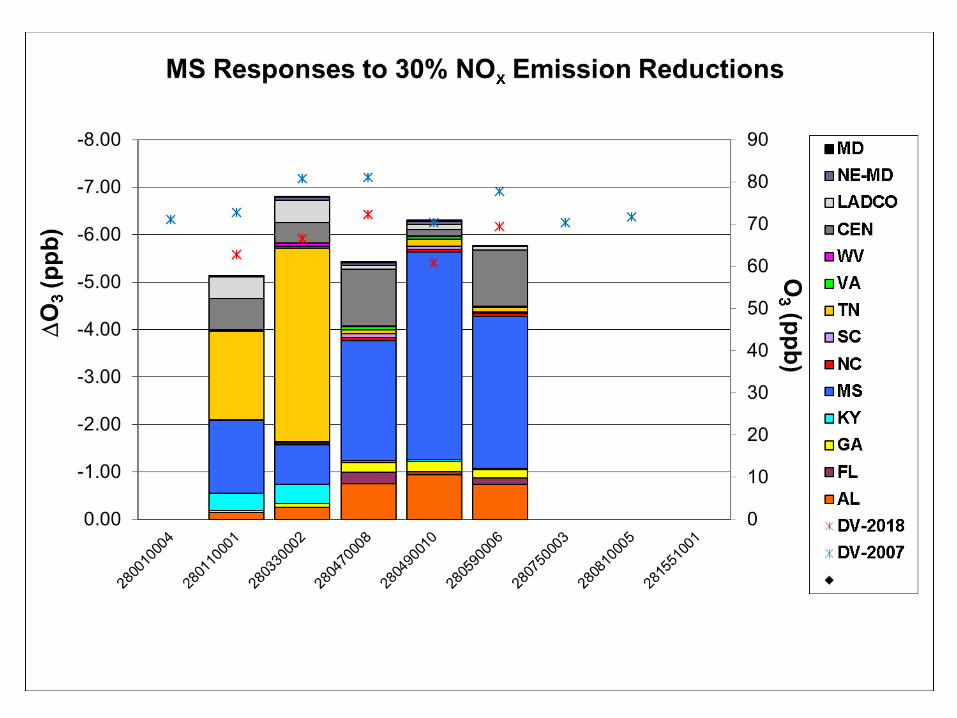
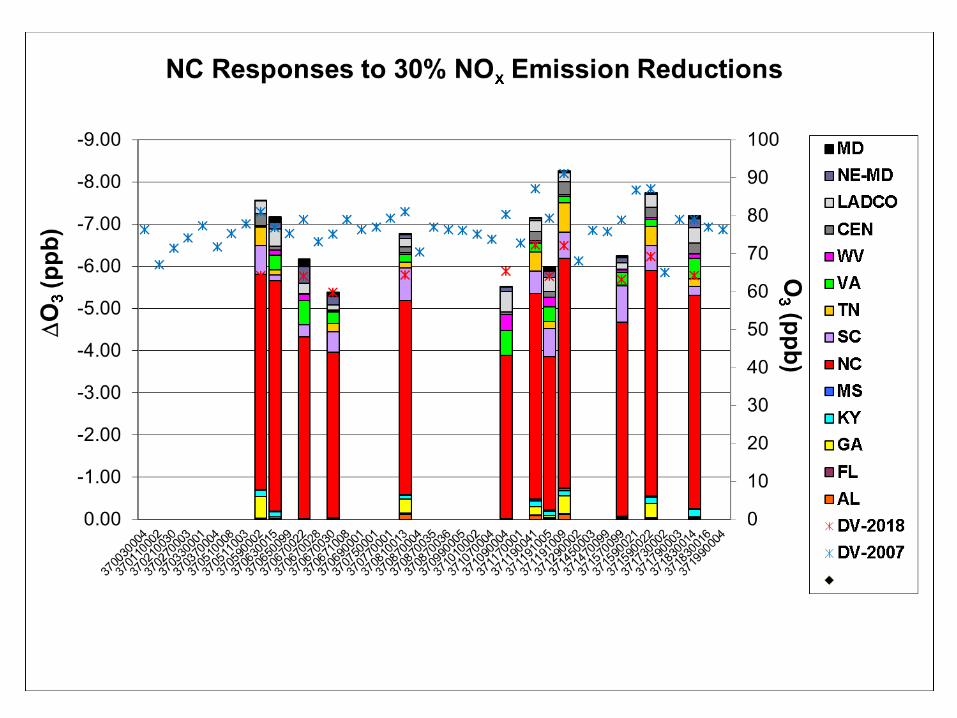
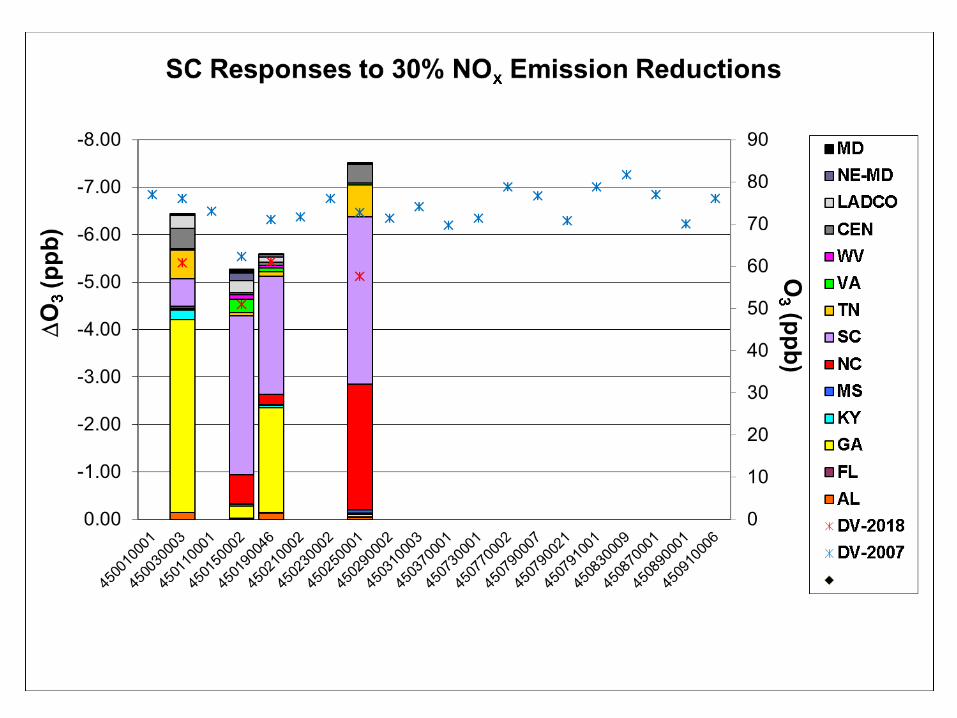
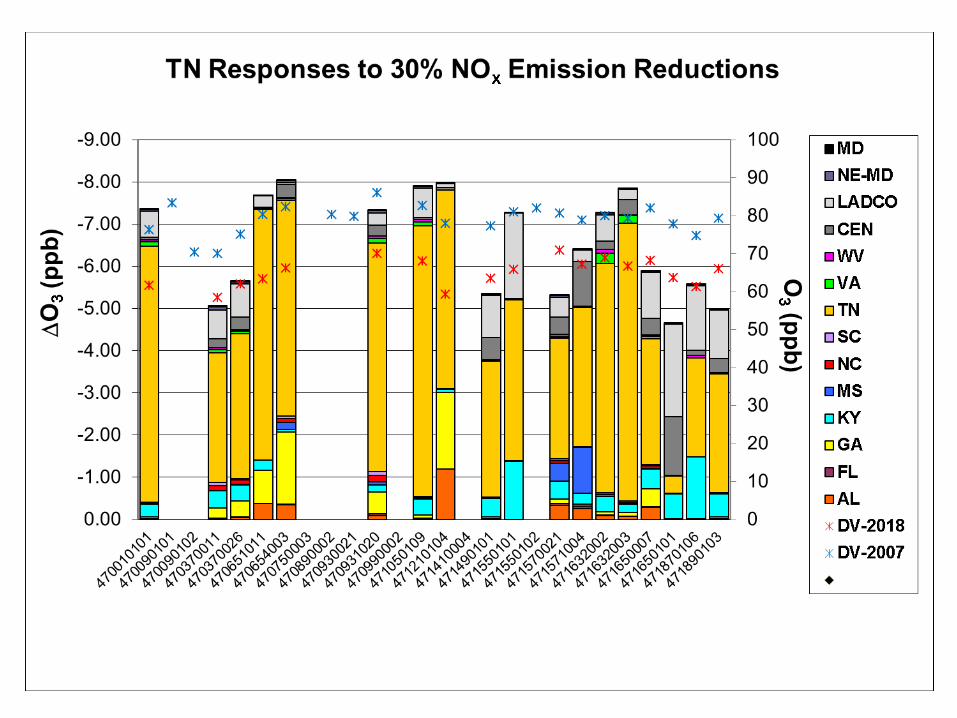
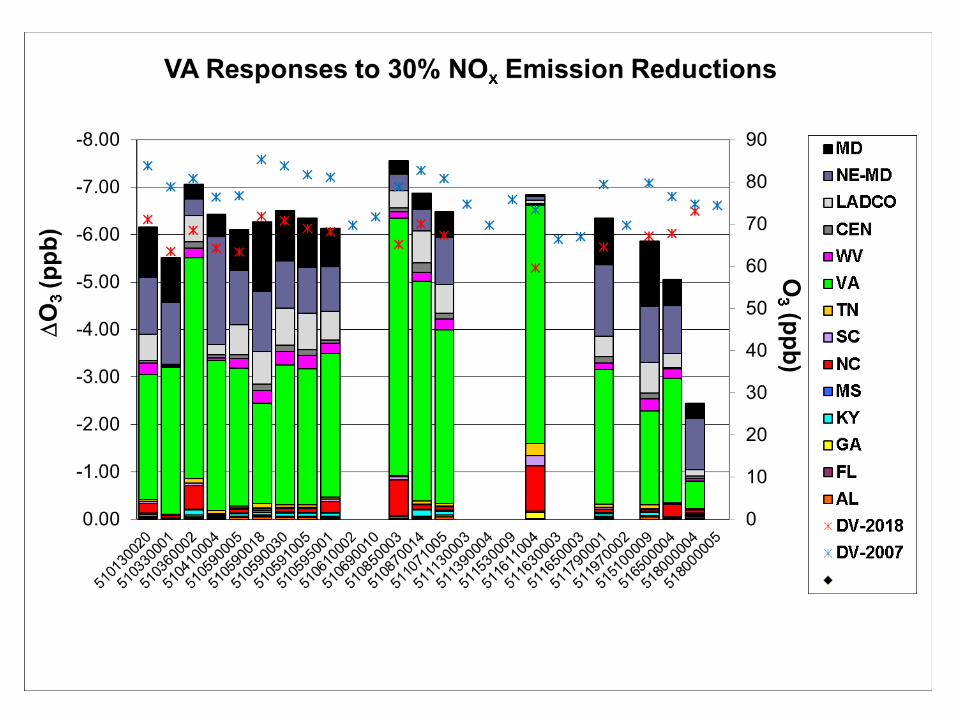
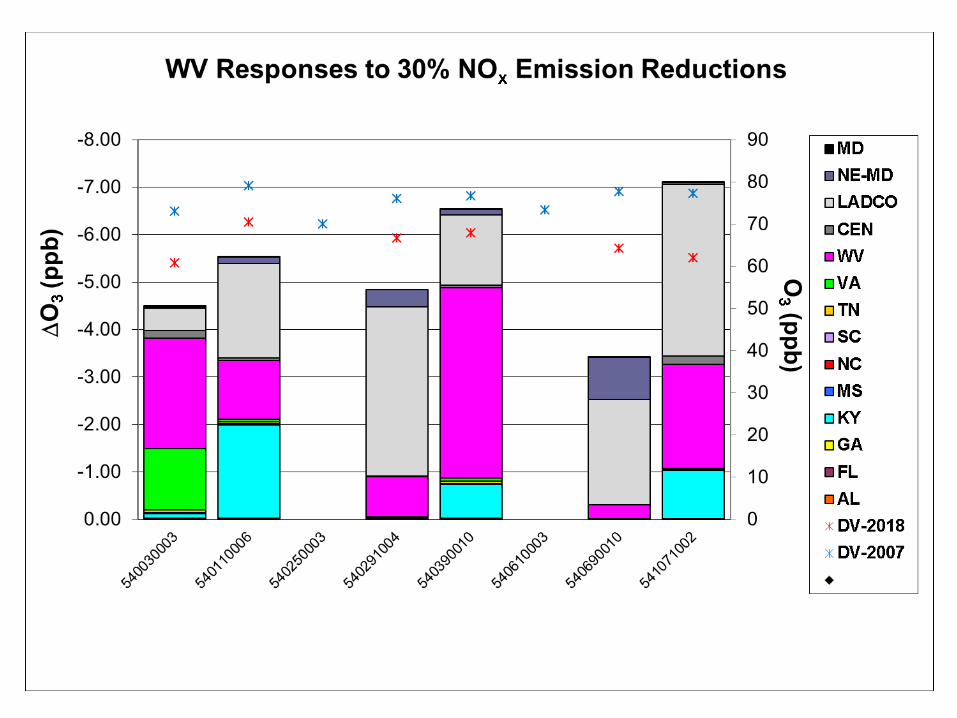
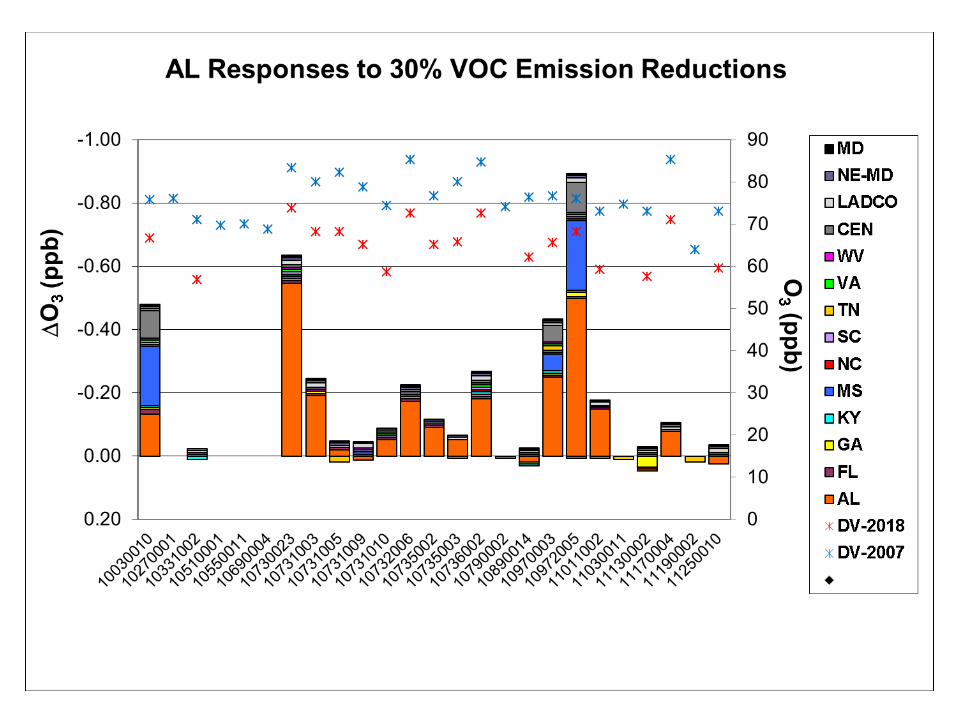
• Absolute Sensitivity:• Difference of daily max. 8-hr O3 between 2018
sensitivity case and 2018 base case: DO3 = 2018sens 2018base
• Averaged over days with 2018 max. 8-hr O3 > 70 ppb
• Relative Sensitivity:▪ Run MATS with 2018base as “baseline” and 2018sens
as “forecast”: RRF = 2018sens / 2018base
▪ DDVF = (DVF*RRF) – DVF = DVF*(RRF1)▪ Sites with at least one day with 2018 max. 8-hr O3 >
70 ppb
9
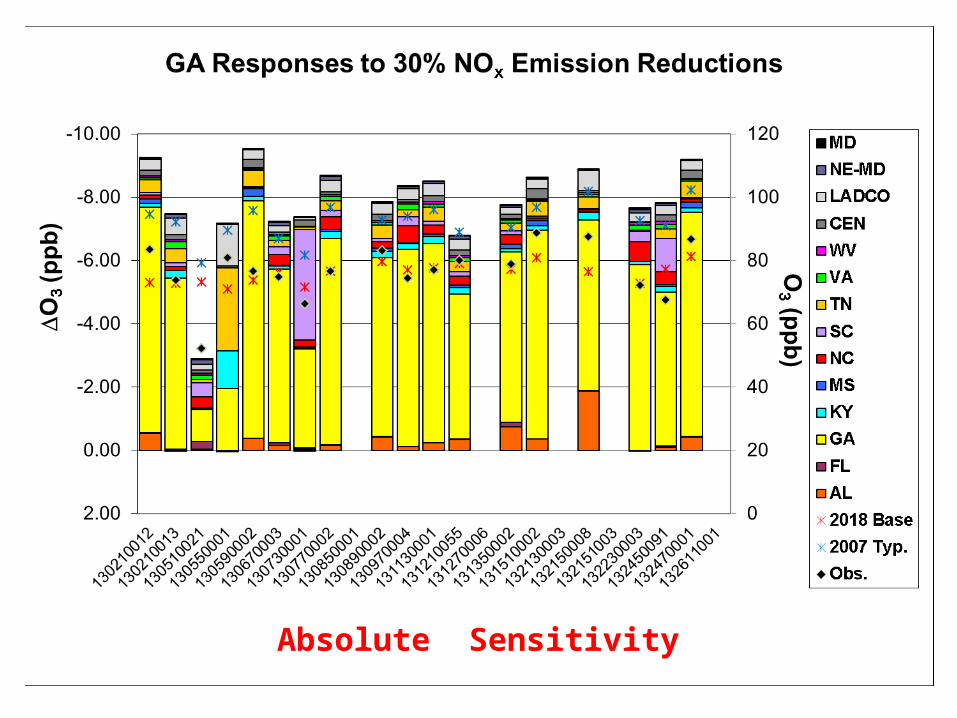
Absolute Sensitivity
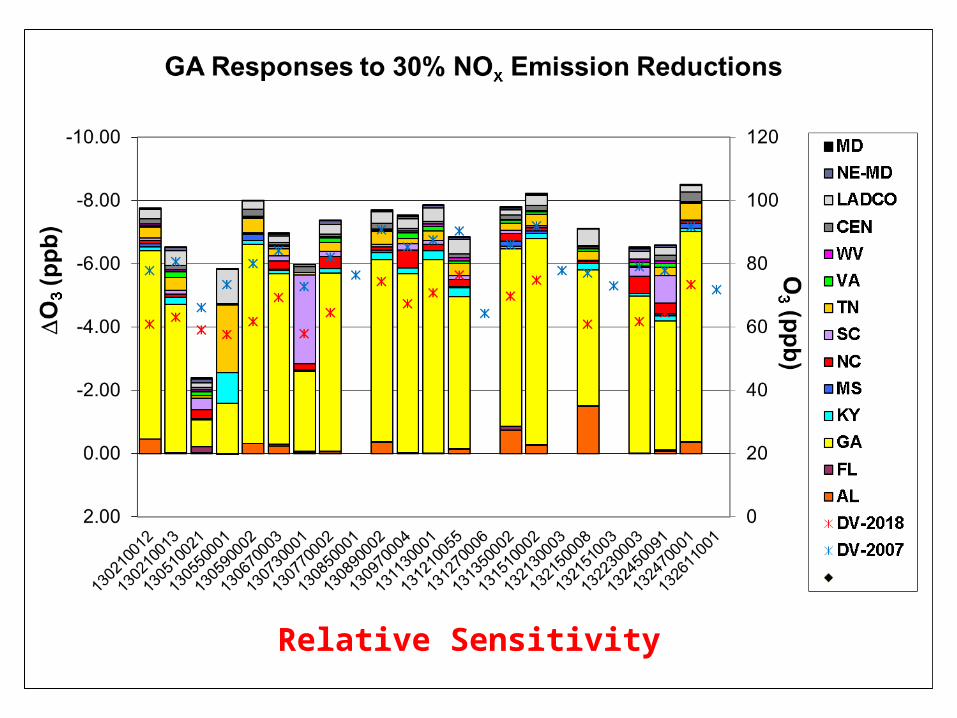
Relative Sensitivity
Relative Sensitivity
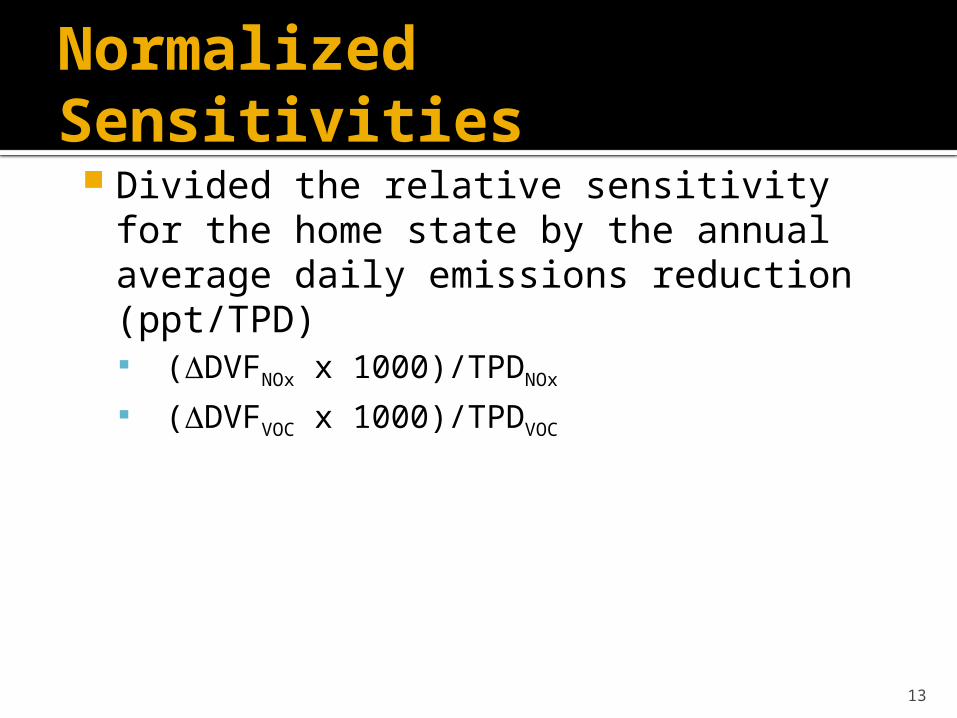
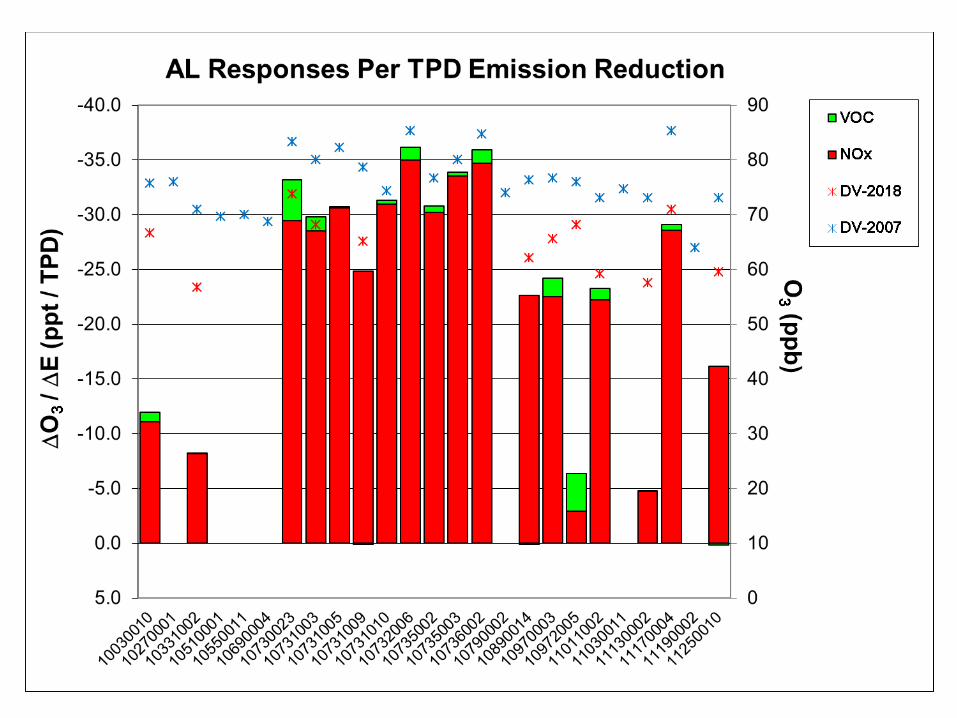
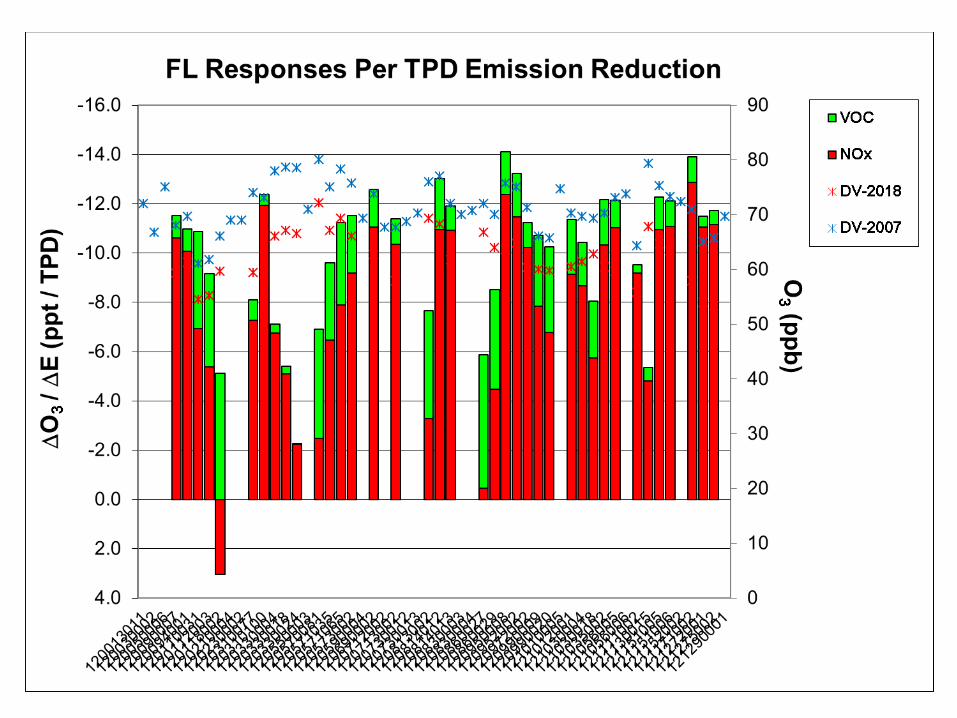
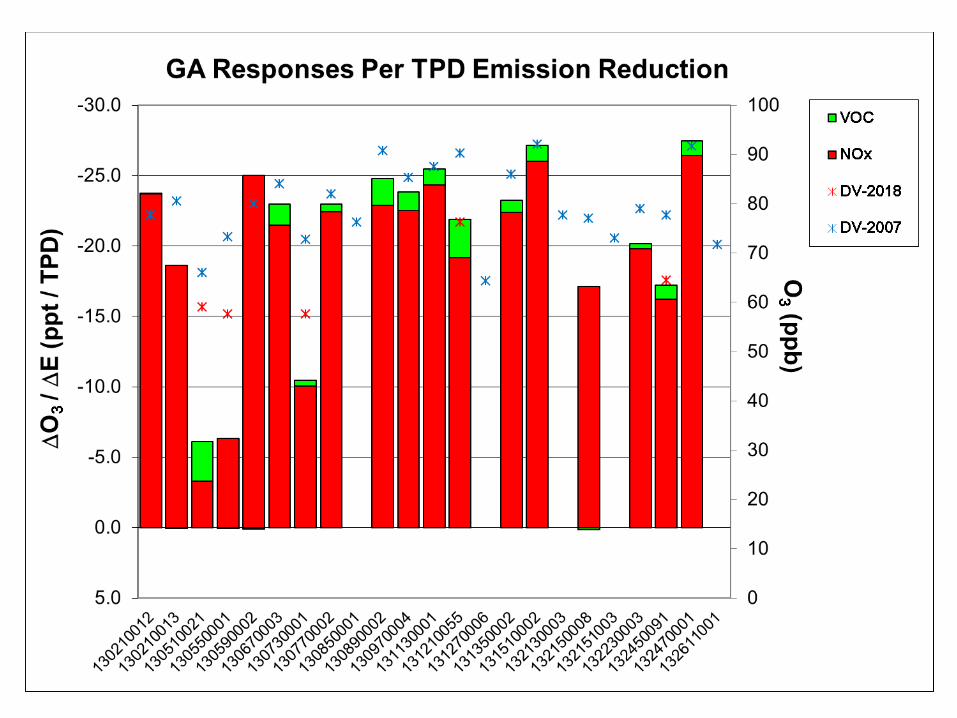
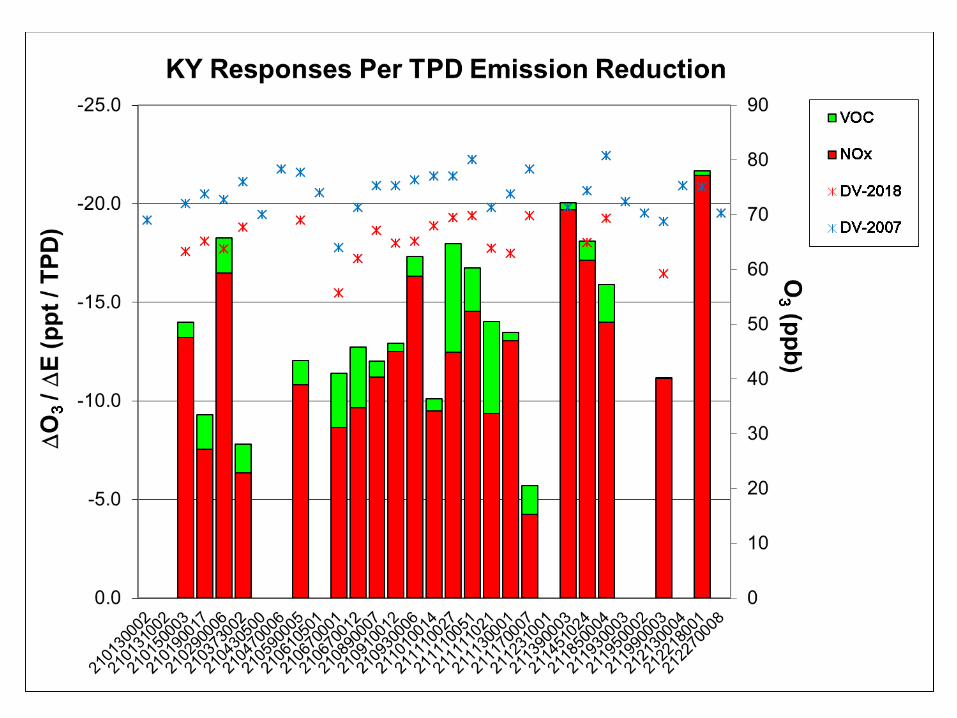
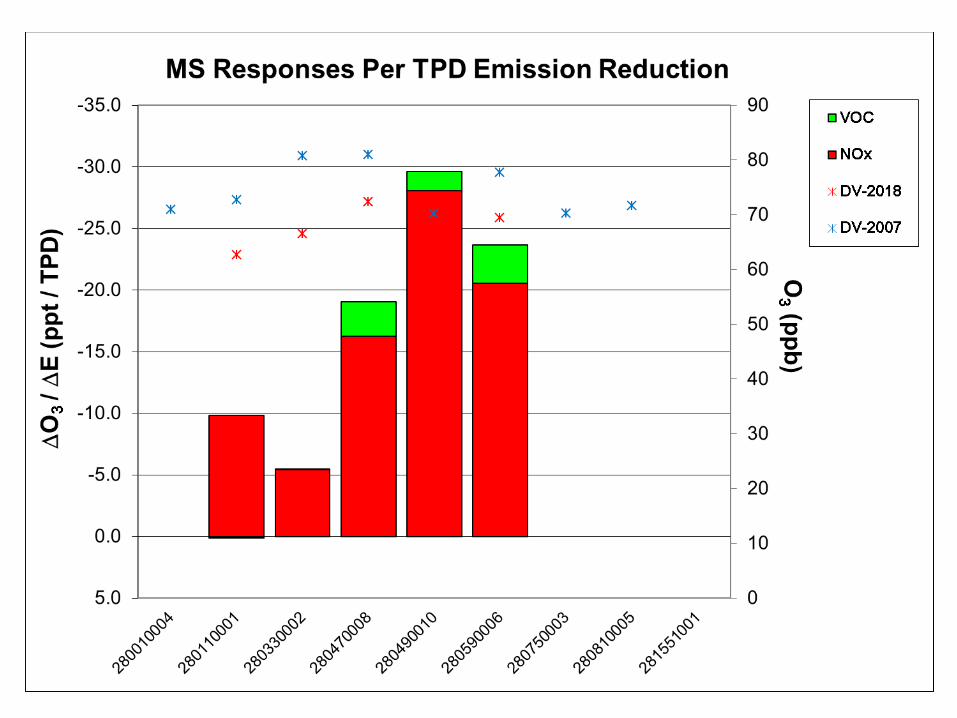
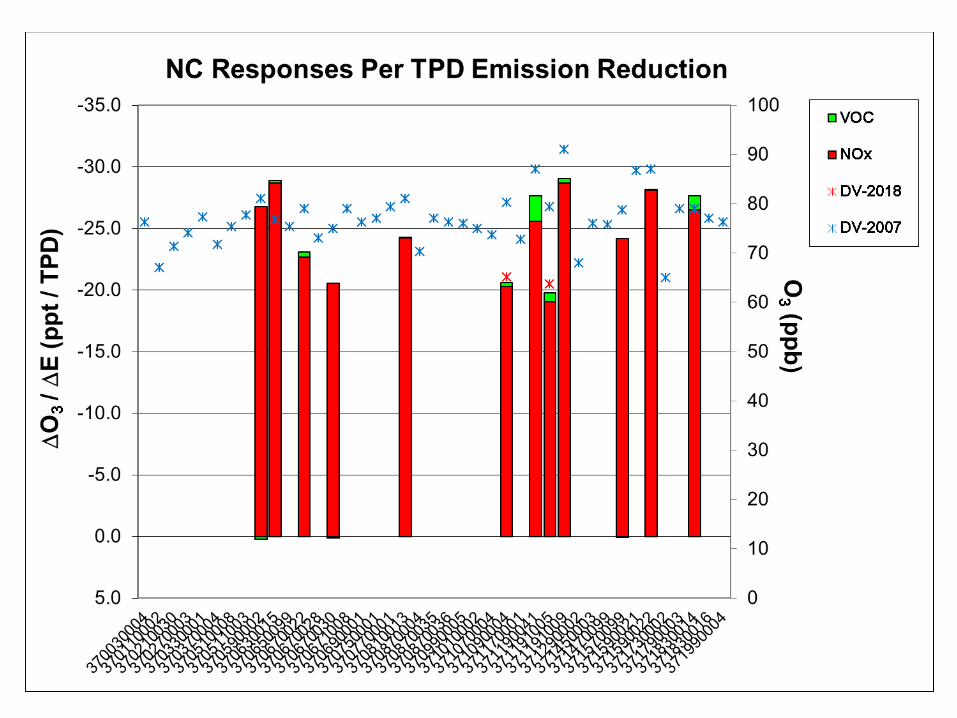
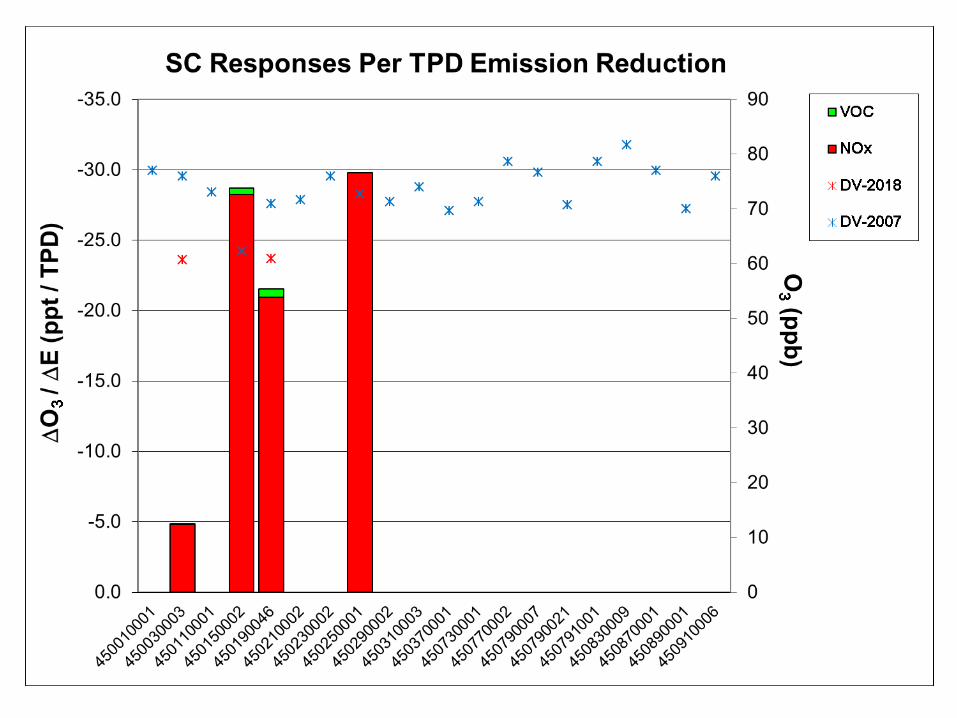
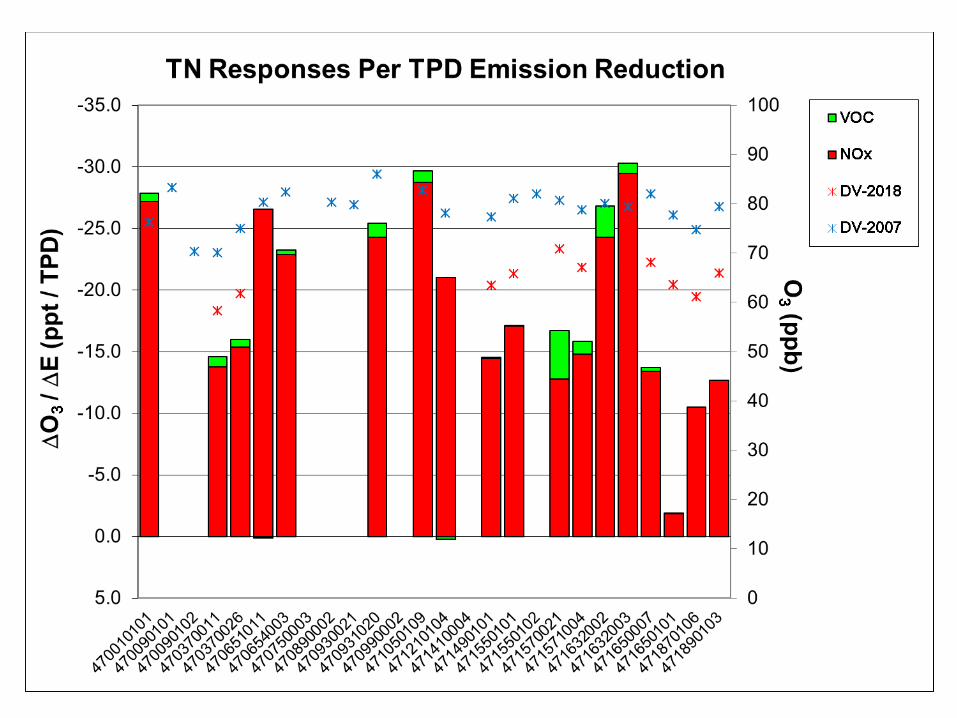
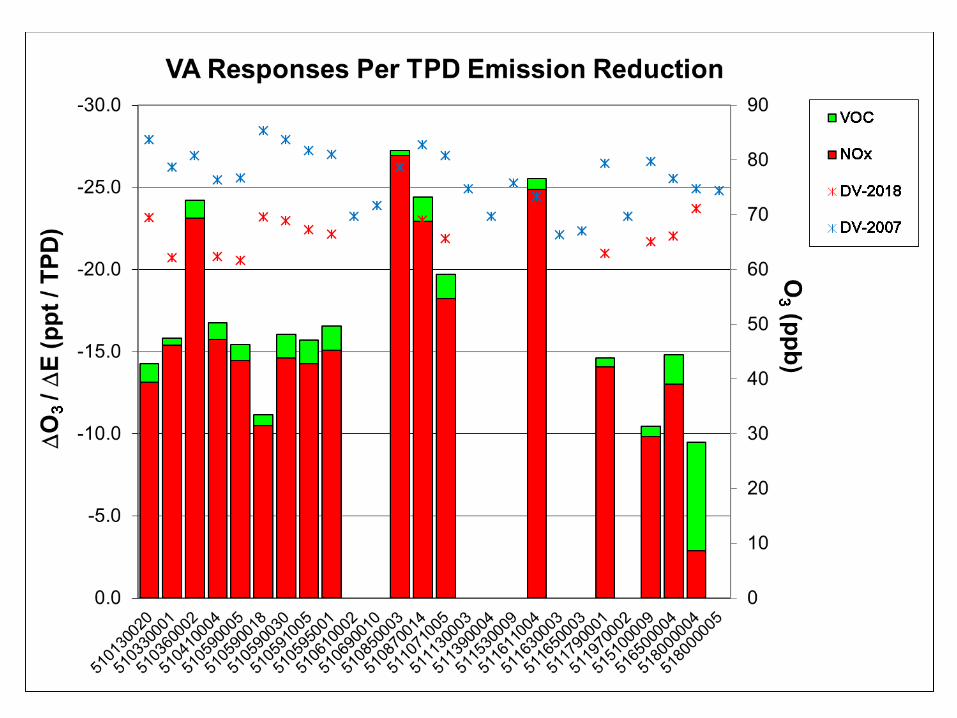
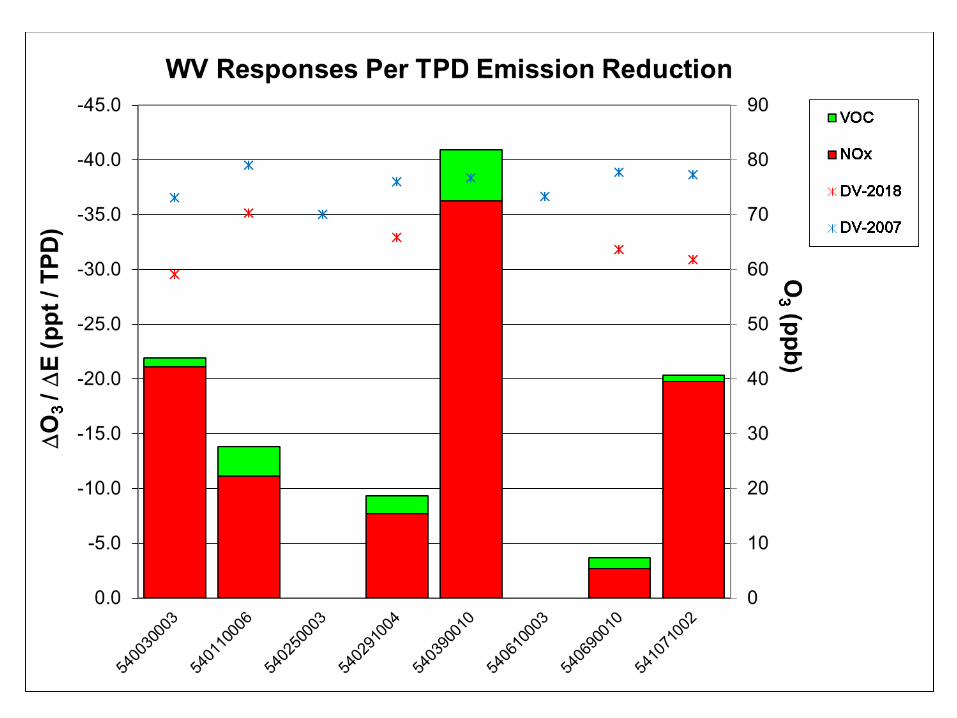
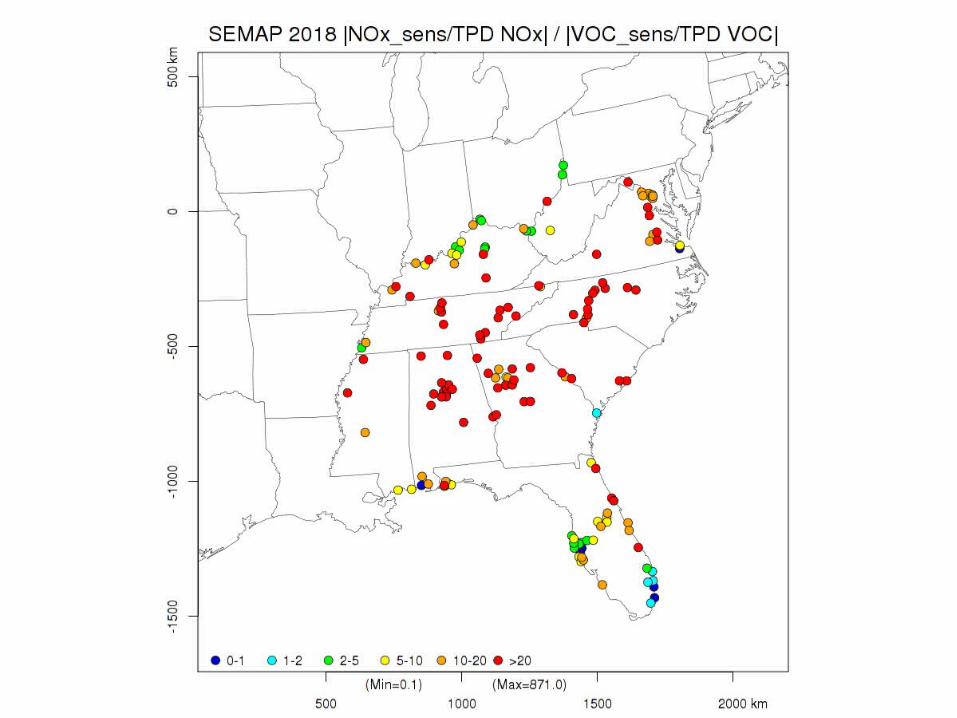
Normalized Sensitivities Divided the relative sensitivity for the
home state by the annual average daily emissions reduction (ppt/TPD) (DDVFNOx x 1000)/TPDNOx
(DDVFVOC x 1000)/TPDVOC
13
TP
D)
Comparison of two Emission Sensitivity StudiesA First Attempt to Developing Emission Sensitivity Trends
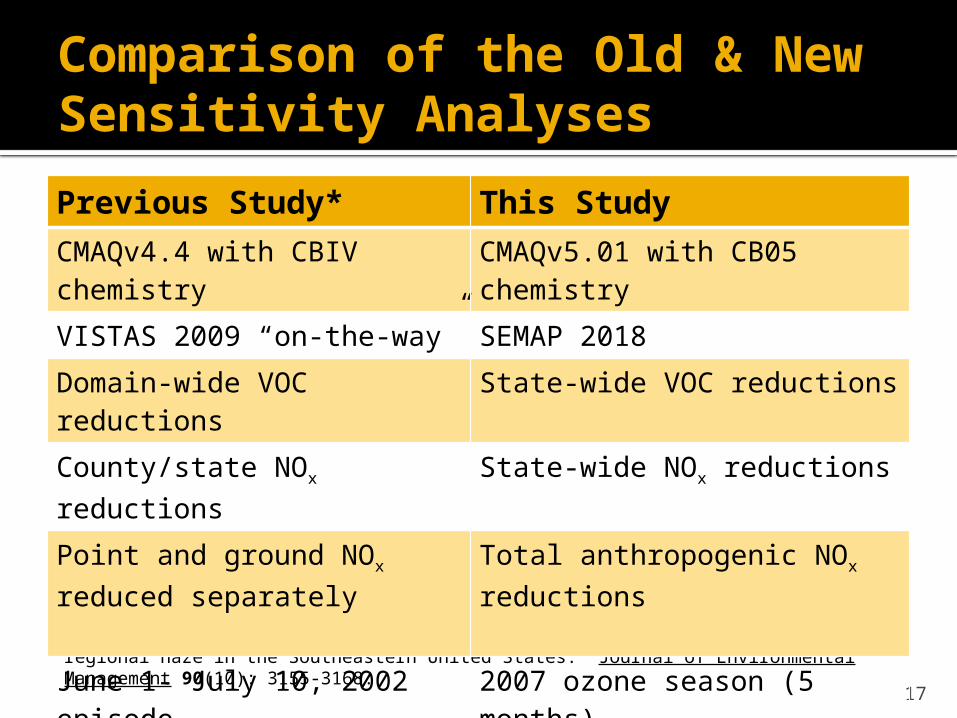
Comparison of the Old & New Sensitivity Analyses
* Odman, M. T., Y. T. Hu, A. G. Russell, A. Hanedar, J. W. Boylan and P. F. Brewer (2009). "Quantifying the sources of ozone, fine particulate matter, and regional haze in the Southeastern United States." Journal of Environmental Management 90(10): 3155-3168.
17
Previous Study* This StudyCMAQv4.4 with CBIV chemistry
CMAQv5.01 with CB05 chemistry
VISTAS 2009 “on-the-way” SEMAP 2018
Domain-wide VOC reductions
State-wide VOC reductions
County/state NOx reductions State-wide NOx reductions
Point and ground NOx reduced separately
Total anthropogenic NOx reductions
June 1- July 10, 2002 episode
2007 ozone season (5 months)
Average of all days Average of days with 2007 max. 8-hr O3 > 75 ppb
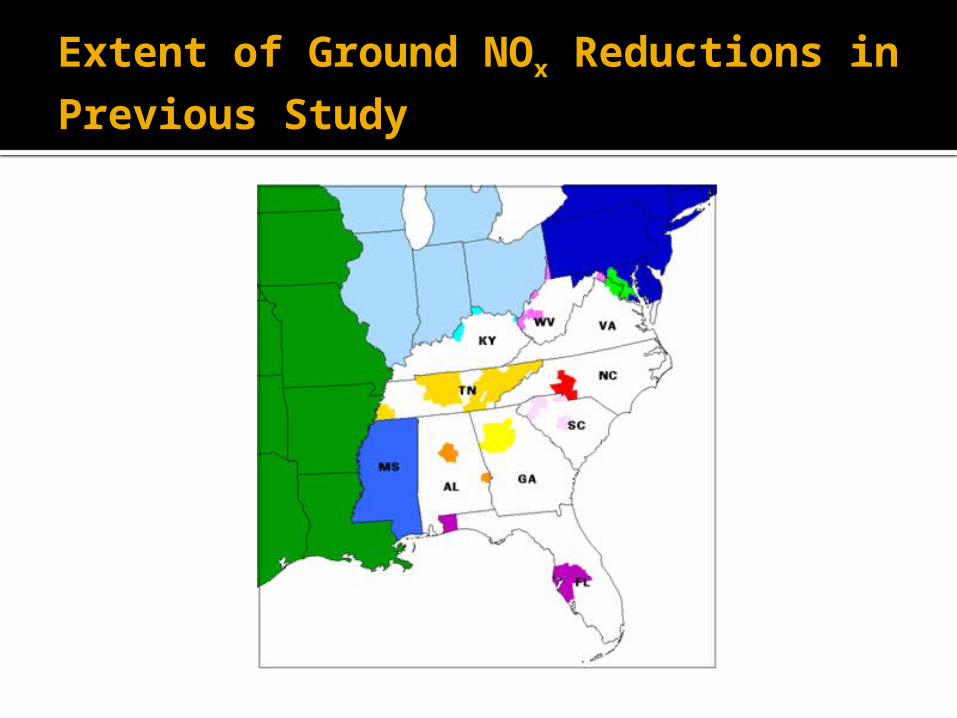
Extent of Ground NOx Reductions in Previous Study
19
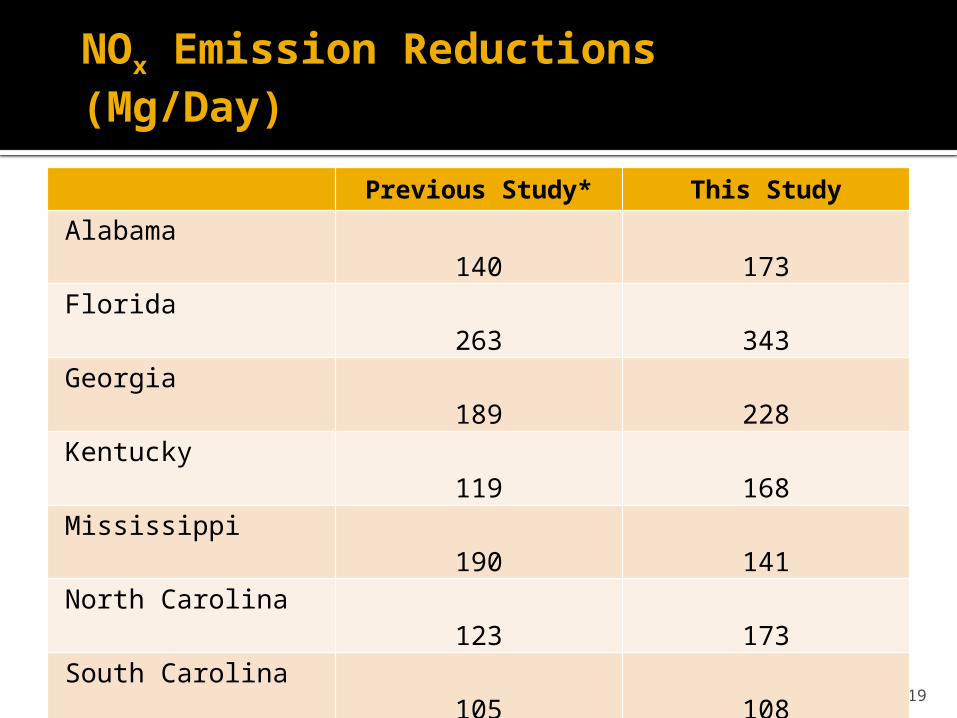
NOx Emission Reductions (Mg/Day)
Previous Study* This Study
Alabama 140 173
Florida 263 343
Georgia 189 228
Kentucky 119 168
Mississippi 190 141
North Carolina 123 173
South Carolina 105 108
Tennessee 218 203
Virginia 159 183
West Virginia 110 100
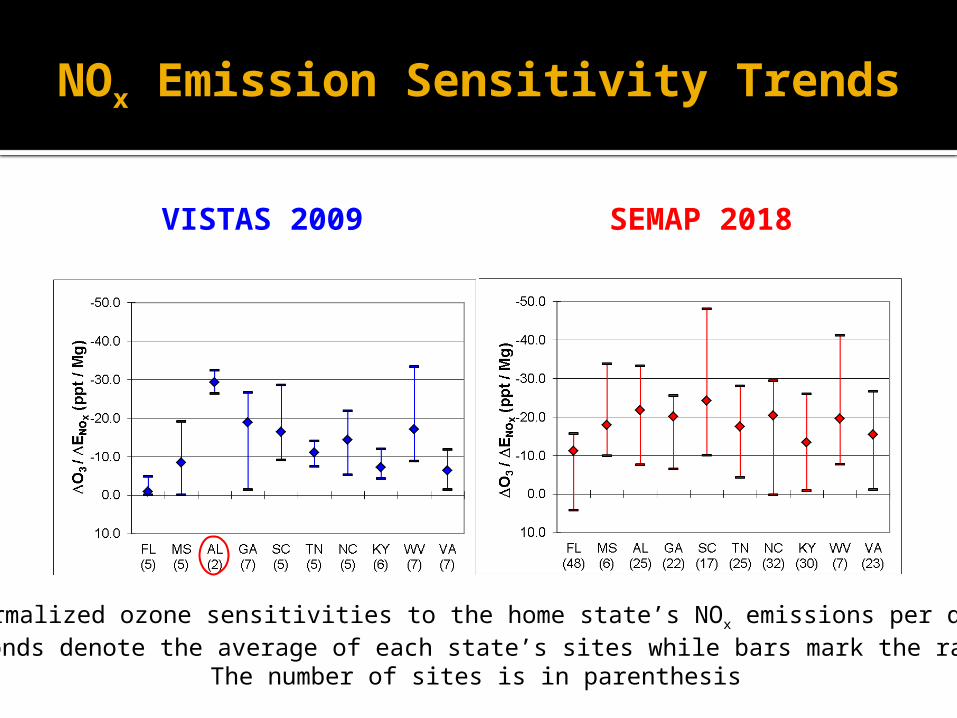
NOx Emission Sensitivity Trends
VISTAS 2009 SEMAP 2018
Normalized ozone sensitivities to the home state’s NOx emissions per dayDiamonds denote the average of each state’s sites while bars mark the range.
The number of sites is in parenthesis
Conclusions
Atlanta, GA is the only area in the SESARM states with a projected 2018 ozone DVF > 75 ppb.
Anthropogenic NOx emission reductions are much more effective at reducing ozone compared to anthropogenic VOC emission reductions in SESARM states. Some sites in Florida and some coastal sites in
other states (e.g., AL, GA, VA) show comparable benefits from VOC and NOx reductions.
Conclusions (continued)
Ozone is becoming more sensitivities to NOx emissions in Southeastern US, except for Alabama. In 2018, ozone will decrease more compared to 2009, per ton of
NOx reduced. Alabama’s 2009 sensitivity included only 2 sites (vs. 25 sites in
2018).
This is probably due to CB05 (vs CBIV) chemistry, differences in the numbers of days/sites, and/or decreasing NOx emissions
Average sensitivities of Southeastern States relative to each other remained almost the same. South Carolina passed Georgia and Alabama in terms of ozone
decrease per ton of NOx reduced.
Supplemental Slides
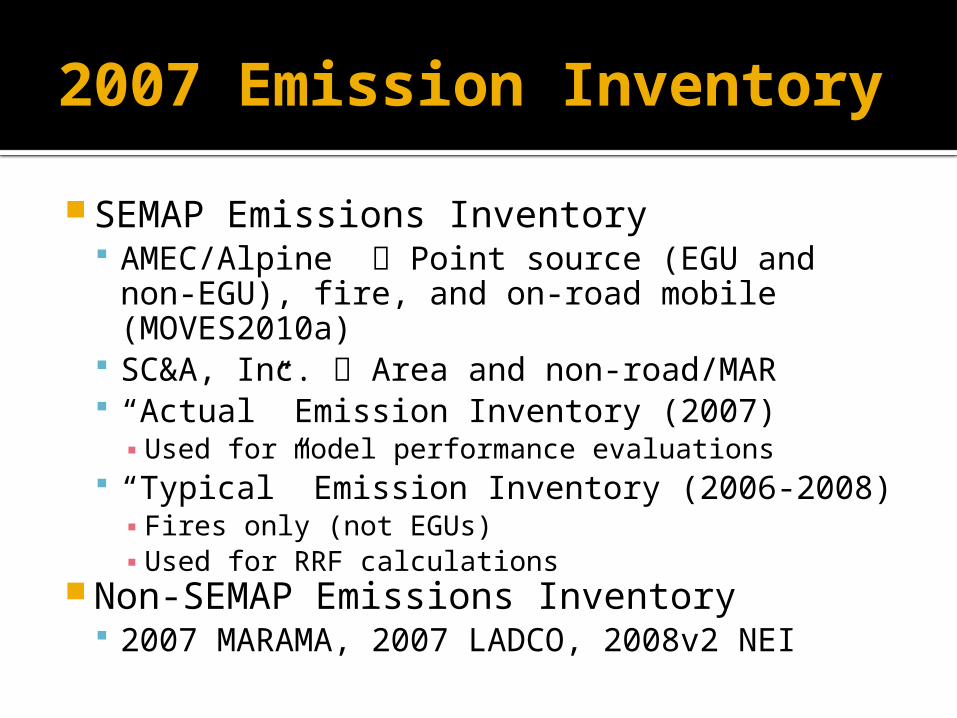
2007 Emission Inventory
SEMAP Emissions Inventory AMEC/Alpine Point source (EGU and non-
EGU), fire, and on-road mobile (MOVES2010a) SC&A, Inc. Area and non-road/MAR “Actual” Emission Inventory (2007)▪ Used for model performance evaluations
“Typical” Emission Inventory (2006-2008)▪ Fires only (not EGUs)▪ Used for RRF calculations
Non-SEMAP Emissions Inventory 2007 MARAMA, 2007 LADCO, 2008v2 NEI
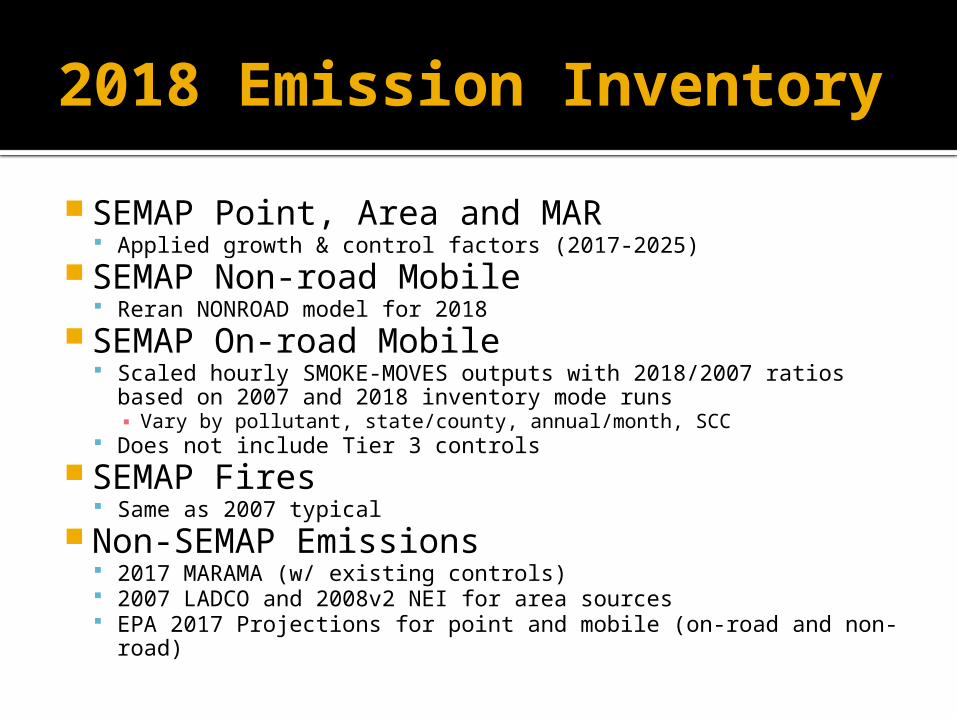
2018 Emission Inventory
SEMAP Point, Area and MAR Applied growth & control factors (2017-2025)
SEMAP Non-road Mobile Reran NONROAD model for 2018
SEMAP On-road Mobile Scaled hourly SMOKE-MOVES outputs with 2018/2007 ratios
based on 2007 and 2018 inventory mode runs▪ Vary by pollutant, state/county, annual/month, SCC
Does not include Tier 3 controls SEMAP Fires
Same as 2007 typical Non-SEMAP Emissions
2017 MARAMA (w/ existing controls) 2007 LADCO and 2008v2 NEI for area sources EPA 2017 Projections for point and mobile (on-road and non-road)
Relative Sensitivities to NOx Emissions in SESARM States
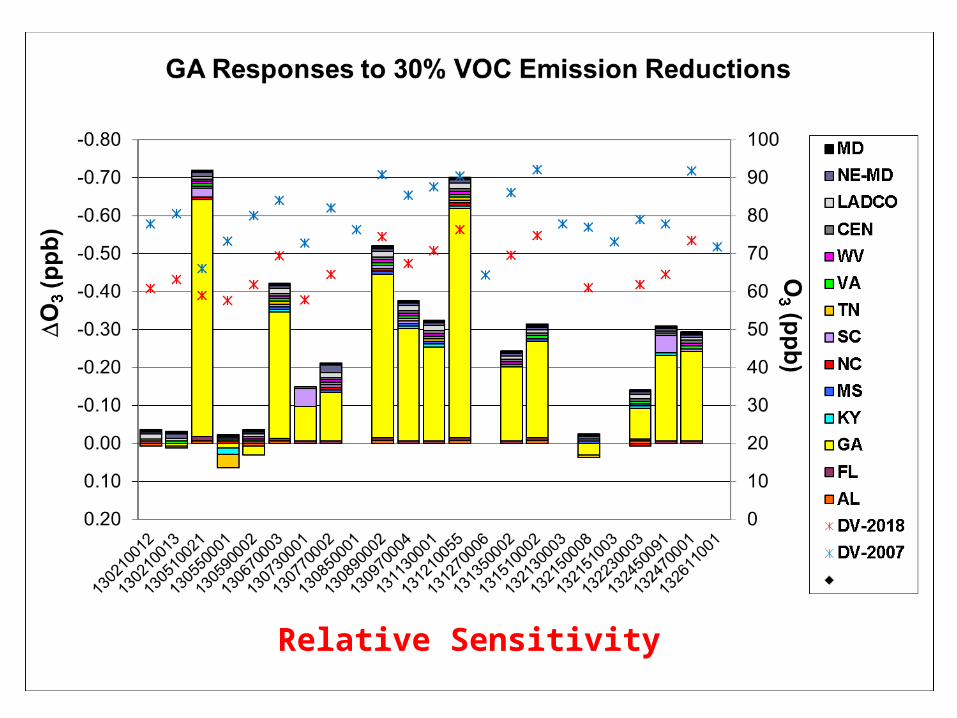
Relative Sensitivities to VOC Emissions in SESARM States
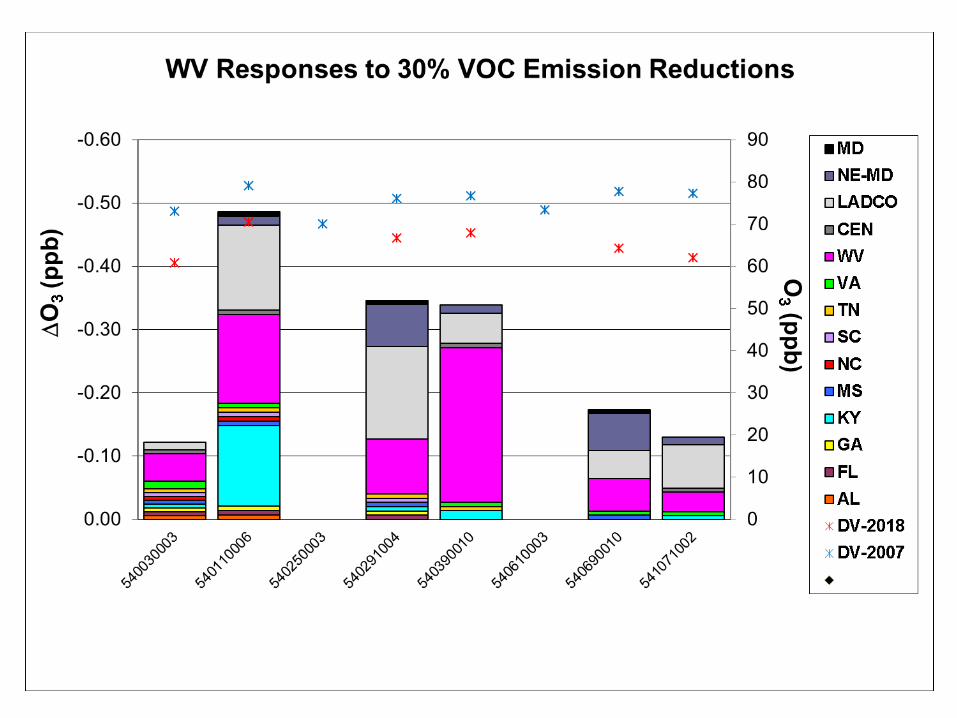
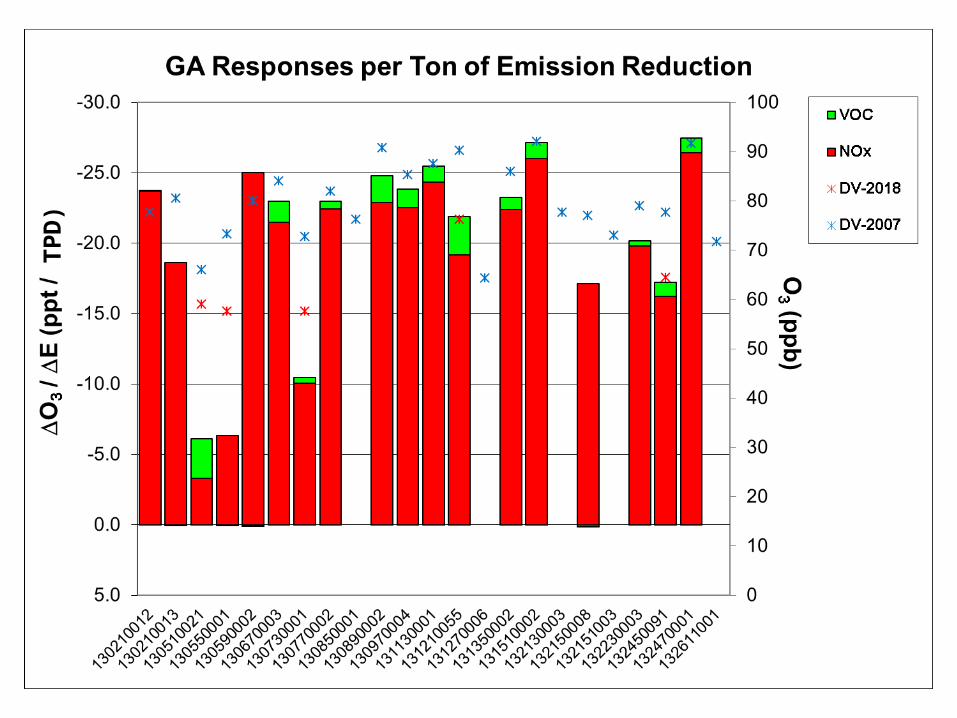
Normalized Sensitivities to NOx & VOC Emissions in SESARM States