tanzania: anti corruption survey volume 4
TRANSCRIPT

The United Republic of Tanzania
THE PREVENTION AND COMBATING OF CORRUPTION BUREAU
NATIONAL GOVERNANCE AND
CORRUPTION SURVEY
2009 REPORT
Volume 4: ENTERPRISES SURVEY
and
21st November 2009
F A C E I T
in Association with
DAR/MCC Dar Management and Computing Centre

ii
CONTENTS CONTENTS....................................................................................................................... ii LIST OF TABLES ........................................................................................................... iii LIST OF FIGURES .......................................................................................................... v PREFACE ......................................................................................................................... vi EXECUTIVE SUMMARY ............................................................................................. ix CHAPTER 1: INTRODUCTION .................................................................................... 1
1.1 BACKGROUND TO THE SURVEY .................................................................. 1 1.2 PURPOSE OF THE SURVEY ............................................................................ 1
CHAPTER 2: SURVEY METHODOLOGY ................................................................ 3 2.1 SAMPLE DESIGN .............................................................................................. 3 2.2 REVIEW AND ADAPTATION OF THE QUESTIONNAIRE .......................... 3 2.3 RECRUITMENT AND TRAINING OF FIELD TEAMS .................................. 4 2.4 FIELDWORK ...................................................................................................... 4 2.5 RESPONSE .......................................................................................................... 5 2.6 DATA PROCESSING ......................................................................................... 6
CHAPTER 3: THE FINDINGS ....................................................................................... 7 3.1 PERCEPTIONS AND EXPERIENCE OF GOVERNANCE AND CORRUPTION – EVIDENCE FROM ENTERPRISES ................................................ 7 3.2 TYPES OF CORRUPT PRACTICES PREVAILING IN TANZANIA .......... 8 3.3 PERCEPTION ABOUT CORRUPTION IN THE SOCIETY ............................ 9 3.4 EXPERIENCE OF CORRUPTION ................................................................... 11 3.5 INITIATION OF CORRUPTION ..................................................................... 13 3.6 PERCEPTION OF THE PRIVATE SECTOR ON POLICIES, ........................ 15 LAWS AND REGULATIONS ..................................................................................... 15 3.7 MAIN CAUSES OF CORRUPTION ................................................................ 20 3.8 SERIOUSNESS OF CORRUPTION IN TANZANIA ...................................... 22 3.9 PROBLEMS AFFECTING TANZANIA .......................................................... 23 3.10 ASSESSING THE POLICIES, RULES AND REGULATIONS .................. 25 3.11 ASSESSING THE JUDICIAL SYSTEM ...................................................... 32 3.12 CORRUPTION IN THE PRIVATE SECTOR .............................................. 36 3.13 EFFECTS OF CORRUPTION ....................................................................... 39 3.14 COSTS OF CORRUPTION ........................................................................... 44 3.15 PERCEPTION ABOUT FIGHT AGAINST CORRUPTION ....................... 45
CHAPTER 4: CONCLUSIONS AND RECOMMENDATIONS ............................... 50 4.1 CONCLUSIONS ................................................................................................ 50 4.2 RECOMMENDATIONS................................................................................ 51
REFERENCES ................................................................................................................ 52 Annex : Enterprises Survey Questionnaire .................................................................. 53

iii
LIST OF TABLES Table 1: Regional Coverage of the Enterprises Survey ..................................................... 5 Table 2: Percentage distribution of respondents associating corruption to various definitions ........................................................................................................................... 7 Table 3: Percentage distribution of respondents by their perception about corruption .... 10 Table 4: Percentage distribution of enterprises reporting acceptability of courses of action in hypothetical situations in public life ............................................................................. 10 Table 5: Percentage distribution of enterprises reporting their probable course of action in private life ......................................................................................................................... 11 Table 6: Percentage distribution of respondents who encountered corruption by region 12 Table 7: Percentage distribution of enterprises indicating initiators of corruption by region ................................................................................................................................ 14 Table 8: Percentage distribution of enterprises reporting problems for the operation and growth of business ............................................................................................................ 18 Table 9: Percentage distribution of respondents rating corruption in public sector as a problem by region ............................................................................................................. 19 Table 10: Percentage distribution of respondents reporting causes of corruption ............ 20 Table 11 Percentage of Respondents identifying Greed/Selfishness a Major Source of Corruption by Region ....................................................................................................... 21 Table 12: Percentage distribution respondents reporting quality of institutions in terms of transparency, honesty, clarity and simplicity in tendering ............................................... 22 Table 13: Percentage distribution of respondents reporting seriousness of various types of problems facing Tanzania ................................................................................................. 24 Table 14: Percentage of respondents who felt corruption in public service is serious by region ................................................................................................................................ 24 Table 15: Percentage distribution of respondents reporting state intervention in business operations .......................................................................................................................... 25 Table 16: Percentage distribution of public agencies by quality and efficiency .............. 26 Table 17: Percentage distribution of respondents rating the quality and efficiency of the Police Force by Region ..................................................................................................... 27 Table 18: Interaction with public institutions ................................................................... 28 Table 19: Percentage distribution of enterprises reporting the practice of corruption ..... 29 Table 20: Percentage distribution of enterprises reporting difficulty of meeting Government Requirements ............................................................................................... 29 Table 21: Percentage distribution of enterprises reporting tendering practices ................ 31 Table 22. Percentage distribution of enterprises reporting the importance of factors to win government contract .......................................................................................................... 31 Table 23: Percentage distribution of firms reporting average Percentage of contract value paid as unofficial payment by region ................................................................................ 32 Table 24: Percentage distribution of enterprises reporting the frequency of practising good qualities by the court system .................................................................................... 33 Table 25: Percentage distribution of enterprises reporting the use of various methods of dispute resolution .............................................................................................................. 33 Table 26: Percentage distribution of enterprises reporting the severity of obstacles to using courts ....................................................................................................................... 34 Table 27: Average duration of court cases by region ...................................................... 34 Table 28: Percentage of enterprises reporting business practice in private sector ........... 36

iv
Table 29 Percentage distribution of respondents who Felt Corruption in the private sector in 2009 was better Compared to 2005 by region .............................................................. 38 Table 30: Percentage distribution of respondents reporting private sector reputation on corruption .......................................................................................................................... 39 Table 31: Percentage distribution of the rating of impact of corruption by region .......... 41 Table 32: Percentage distribution of respondents showing effect of some types of corruption to business ....................................................................................................... 42 Table 33: Effectiveness of institutions in combating corruption ...................................... 46 Table 34: Effectiveness of faith based organisations in fighting corruption by region ... 47 Table 35: Effectiveness of the Police in Fighting Corruption by Region ........................ 48 Table 36: Percentage distribution of firms indicating willingness to participate in initiatives to combat corruption ........................................................................................ 49

v
LIST OF FIGURES Figure 1: Percentage distribution of enterprises reporting the seriousness of various types of corruption........................................................................................................................ 8 Figure 2: Percentage distribution enterprises indicating types of corruption occurring in vicinity ................................................................................................................................ 9 Figure 3: Percentage distribution of firms reporting forms of bribery that are practised. 12 Figure 4: Percentage distribution of enterprises indicating the initiators of bribery ........ 13 Figure 5: Percentage distribution of firms reporting the availability of rules and regulations affecting firms ................................................................................................ 15 Figure 6: Percentage distribution enterprises reporting predictability of the rules and regulations affecting firms ................................................................................................ 16 Figure 7: Percentage distribution enterprises reporting frequency of consultation between government and firms ....................................................................................................... 17 Figure 8: Percentage distribution of firms reporting income from public tenders as a percentage of total income ................................................................................................ 17 Figure 9: Percentage distribution of respondents reporting the seriousness of corruption 22 Figure 10: Percentage distribution of respondents reporting current state of corruption in public sector in Tanzania compared to 2005 .................................................................... 23 Figure 11: Percentage distribution enterprise reporting frequency of government procurement tenders being awarded in a clear and efficient manner ................................ 30 Figure 12: Percentage distribution of enterprises reporting officials receiving bribes in the judiciary ............................................................................................................................ 35 Figure 13: Percentage of enterprises reporting incidence of corruption in the private sector ................................................................................................................................. 37 Figure 14: Percentage distribution of firms comparing the state of corruption in private sector in Tanzania between today and year 2005 ............................................................. 37 Figure 15: Percentage distribution of enterprises rating the harmfulness of Petty Corruption ......................................................................................................................... 40 Figure 16 Percentage distribution of enterprises rating the harmfulness of grand corruption .......................................................................................................................... 40 Figure 17: Percentage distribution of firms showing reason for withdrawal from tender process............................................................................................................................... 43 Figure 18: Percentage distribution of enterprises showing reasons for changing mind on planned investment ........................................................................................................... 44 Figure 19: Percentage distribution of firms showing unofficial payment as percentage of company revenues ............................................................................................................. 44 Figure 20: Percentage distribution of firms estimating expected percentage change in company income if corruption were to be reduced by half .............................................. 45 Figure 21: Percentage of enterprises willing to pay to company income to fund programmes that would reduce corruption ....................................................................... 49

vi
PREFACE
The problem of corruption in our country is not new and certainly it did not start with my
Government i.e. the Fourth Phase Government of The United Republic of Tanzania. Past
Governments have dealt with it in various ways, although corruption remains a problem
in our country, as it is in the whole world, albeit in varying degrees. To tackle corruption,
the country should generally be well governed – that is to have good governance in the
country. This study, National Governance and Corruption Survey is very appropriate in
that sense.
To understand the problem of good governance in general and corruption in particular, it
is important to conduct studies, which will generate facts and indicate appropriate way
forward in the fight against the vice. Without appropriate studies, the fight against
corruption cannot be scientific. The National Governance and Corruption Survey is an
effort towards that end.
In my inaugural speech to Parliament in 2005, I said the following and I quote: we will
accelerate the war on corruption in a more scientific way and by addressing its root
courses …. But all this will not account much if the public is not cooperative. I ask the
full cooperation of citizens in the war on corruption. This report is part of implementation
of that speech, to fight corruption in a more scientific way. The public have indeed
cooperated in giving information to the consultants, who covered all the regions of
Tanzania Mainland in this study.
In 1996, a study similar to this was undertaken by the Third Phase Government. A
Presidential Commission of Inquiry Against Corruption was appointed to carry out a
study on the status of corruption in the country as part of a strategy of the government to
enhance integrity and accountability. The commission released its report one year later
and recommended a number of things as a way of tackling the vice. In 1999 the
government formulated a National Framework on Good Governance (NFGG) to facilitate
the coordination of reforms designed to foster Good Governance and improve public
service delivery. The National Anti-Corruption Strategy and Action Plan (NACSAP) was
formulated as a component of the NFGG to increase efforts in corruption prevention. In
2002, the Annual State of Corruption in Tanzania Report was published as part of the
follow-up of the 1996 report. However, this report was less detailed and hence the need

vii
for more detailed and thorough baseline report on the problem of corruption in the
country. The National Governance and Corruption Survey is broad, detailed and captures
important parameters which gives an insight into the problem of corruption in the country
to date.
The National Governance and Corruption Survey add to our understanding of the vice in
the country and offers opportunities for tackling the same. Three surveys, i.e. household,
public servants and enterprises were carried out and some of the main findings are that:
despite the efforts enumerated above, corruption is widespread and a major impediment
to development efforts; the leading cause of corruption is greed among public servants
and business people; in some sectors of public service, corruption has become a way of
life; the institutions which are central in safeguarding good governance like the police
and the judiciary are ranked highest in perpetrating corruption. The indication one gets is
that: my Government have still a long way to go in eradicating this vice and I want to
assure the public that we are equal to the task.
Some of the recommendations are that: more research be carried out on those institutions
which ranked highest and determine the root causes of corruption; the PCCB be
strengthened to be equal to the increasing tasks and increase public awareness on the vice
and elicit their support.
We will take the results of the survey seriously and implement the recommendations
therein to contain corruption in our country.
I would like to thank the Government of Denmark, for providing financial support, which
made this study possible. I would like also to commend the consultants who did a good
job in research and compilation of the report. Last but not least I would like to recognize
the contribution of the Prevention and Combating of Corruption Bureau, who on behalf
of the Government commissioned and supervised the survey.
Jakaya Mrisho Kikwete
President of the United Republic of Tanzania

viii
ACKNOWLEDGEMENTS
This report has been prepared by many individuals under the general supervision of Mr.
Enock L. Kamuzora, Chairman of FACEIT, the lead consultant, and Cletus P.B. Mkai
who led the project team. Other members of the project team were: Professor A.S.
Mawenya, D. Ntukamazina, B.S. Sreekumar, Dr. V.E. Muba, S. Ngallaba, R.
Rutabingwa, Dr. M.M.P. Bundara, M.R. Lugongo and S.J. Chavda.
The consultants benefited from contributions made by the Technical Committee
especially set up for this assignment by the Prevention and Combating of Corruption
Bureau (PCCB): Dr. Vincent Kihiyo (Chairman), Abdallah Mlangwa, Oscar Hosea,
Sabina Seja, Doto Nkonga, Stephen Ndaki, Ahmed Makbel, Mary Rusimbi, Dr. Flora
Kessy, Daniel Kobb, Tim Harris, Emily Poskett and Jack Titsworth.
During fieldwork stage, Grace Morgan, a World Bank consultant, gave valuable insights
during her visit.
Christian Karstensen, First Secretary (Governance and Political Issues) at the Royal
Danish Embassy, provided helpful comments throughout.
Dr. Edward Hoseah, the Director General of PCCB, actively participated to discuss the
draft Report during the first of the five zonal workshops staged in Dar es Salaam, thereby
generating a constructive debate moderated by FACEIT’s Vice-Chairman, E.N.
OleKambainei.
PCCB’s three counter-part staff, Sada Mzimba, Benno Shunda and Abdallah Kitwana
worked long hours throughout the assignment.
We acknowledge with thanks the involvement of the 12 field supervisors and 37 field
interviewers who were employed by FACEIT to carry out the actual fieldwork.

ix
EXECUTIVE SUMMARY The enterprises survey was carried out to study the business environment with a special emphasis on the effects of public sector governance and corruption on development of private sector firms. The survey examined the firms’ roles as users of public services and subject to regulations, contractual providers of goods and services to government, and clients for licenses and permits. The preferred survey respondent was the head of the firm (director, manager, president, etc.). The Central Registry of Establishments from the National Bureau of Statistics (NBS) was used to pick a systematic random sample of 30 establishments from each of 19 regions and the three Municipalities of Dar es Salaam region. Out of the expected 690 establishments, 627 were covered representing 90.9 percent. Among the 627 firms covered by the survey, 549 were in urban and 78 in rural areas. They included 384 sole proprietors, 141 partnerships, 12 private liability companies, four public listed companies and 149 unclassified establishments. The findings of the survey give the views of the private sector on the current state of governance and corruption in the country.
Perceptions and Experience of Governance and Corruption – Evidence from Enterprises In understanding the concept of corruption, its seriousness and types of corruption prevalent in the vicinity, the enterprises indicated “demand for unofficial payment”, “demand for sex” and “abuse of power” as the first, second and third respectively. While businessmen expected themselves to show high integrity in public life, they would accept less integrity in private life. Enterprises did not condone corruption but they were sceptical about the actions that followed once corruption was reported. The survey results show that 49.7 percent of the enterprises had faced a situation where they were required to give a bribe. Of those who were required to give a bribe, 90.9 percent gave it in the form of money. In 64.9 percent of the cases, the service provider initiated the corruption process by asking for payment. In 18.2 percent of the cases, the service recipient gave it out of his/her own accord.
Users’ Views on Public Service Environment Enterprises felt that government policies, laws, rules and regulations were between fairly easy (29.9 percent) to very easy (41.2 percent) to obtain and thus allowing them to know their rights. However, it took companies six months on average to register. The view of 78.8 percent of the enterprises is that there was some consultation between business and government. On doing business with the public sector, 24 percent of the enterprises indicated that they did business with the public sector, and 16 percent participated in government tenders. At the top of the list of problems that faced enterprises in their operations was “inflation”, “corruption in the public sector” and “access to and cost of financing” in that order.

x
Causes of Corruption Greed/selfishness was identified by 95.5 percent of the enterprises as the main cause of corruption. Similarly, lack of control and accountability of public officials was identified by 86.7 percent enterprises and poor law enforcement and inadequate punishment of the corrupt was identified by 85.6 percent. It was a general view of the private sector that corruption was a major problem in the country as classified by 92.3 percent of the respondents. Enterprises thought the private sector had a better reputation than the public sector. Among the problems facing the country, the most serious was corruption in public places (identified by 90.9 percent) followed by inflation (90.6%) and the high cost of living was the third (89.9 %).
Institutional Performance and Integrity/honesty in the Public Sector The worst performer in the public sector is the Police followed by Judiciary. TANESCO, comes third and Ministry of Lands, Housing and Human Settlement is the fourth. Tanzania Postal Corporation is the best performer followed by Parliament. It was reported that it takes 58 days to clear goods through the customs instead of the official 15 days. Enterprises reported that it was fairly difficult to very difficult to meet government requirements to operate businesses. The most difficult requirements to meet are those relating to taxation, tax holidays and reclaiming duty. As a result companies are forced to use facilitators to assist in processing documents to meet the requirements. The process also consumes time of senior management. Both of these add to company costs. From the experiences of enterprises, 18.2 percent reported public tender processes to be never fair and 50.2 percent reported the process was rarely fair because it had some malpractices. Those who participated in tendering processes reported that they had to pay 10 percent of the tender value to win the tenders. In dispute resolution, the court system was the third choice in preference by enterprises, preceded by alternative methods. The court system was judged to be too slow in determining cases where it took an average of fifteen months to determine a case. For those with cases with the longest duration, 24 percent reported that there was an indication that there was a need to offer a bribe. Of those who reported actually giving a bribe, 57.9 percent paid to judges, 21 percent paid to court clerks and 15.8 percent to prosecutors or officials in the prosecutor’s office. Performance and Integrity/Honesty in the Private Sector In assessing the private sector itself, enterprises reported that most of them demanded receipts but hardly any of them paid taxes honestly. On practising corruption, 97 percent reported that it was practised in the private sector. Out of the 33 industries listed, ten were rated to have good reputation by more than two thirds of the respondents led by “telecommunications” followed by “food and beverages”. The industry with the worst reputation was “mining and quarrying” followed by the “contractors”. Comparing the state of corruption between 2005 and now, 52.5 percent enterprises thought it was better.

xi
Understanding the Impact and Costs of Corruption in the Private Sector Both grand corruption and petty corruption were rated to be very harmful, grand corruption was rated as being harmful by about 95 percent of respondents and petty corruption was so rated by approximately 90 percent of the respondents. Corruption was seen to be an obstacle to operations and growth of business. It adds costs to business. In some cases it leads to withdrawal from tendering processes and business investment plans.
Fighting Corruption Assessing the current situation, enterprises felt that the most effective institutions in fighting corruption are “faith based organisations” followed by the “media”, third comes NGOs, followed by Development Partners and PCCB who are fourth and fifth respectively. The least effective is the Police followed by the courts. The private sector is willing to join government led initiatives to combat corruption.

1
CHAPTER 1: INTRODUCTION
1.1 BACKGROUND TO THE SURVEY
In 1999 the government of Tanzania formulated the National Framework for Good Governance (NFGG) to facilitate the coordination of reforms designed to foster good governance and improve public service delivery. The National Anti–Corruption Strategy and Action Plan (NACSAP) was also formulated in 1999 as a component of the NFGG as Government’s key management instruments, to combat corruption. Following the launch of the second National Anti – Corruption Strategy and Action Plan (NACSAP II) in 2006, the Government of Tanzania has expressed commitment to undertake a comprehensive diagnostic survey on corruption. The concept paper for NACSAP II states that:-
“A comprehensive National Governance and Corruption Survey will be launched presently, and, in the future it will be conducted every two years. It will be established as one of NACSAP’s standard instruments for identifying where corruption occurs and on what scale, conducting analytical work relating survey results to the delivery of services, communicating with the public, and helping set priorities for tackling corruption issues and strengthening corruption – prone ministries, departments, agencies and local government authorities”.
During 2006, Tanzania was ranked 93 out of 163 countries by the Transparency International with a Corruption Perception Index (CPI) score of 2.9. Thereafter, in 2007, the country’s position improved somewhat with a score of 3.2. However, as from 2007, a steady stream of shocking exposures of acts of grand corruption – previously unreported during 2000 to 2005 which is when they took place – rapidly created a perception that grand corruption was on the rise. Not surprisingly, the CPI score dropped to 2.9 in 2008 and to 2.6 in 2009. Clearly, a detailed assessment on governance issues and levels of corruption needed to be adequately collected, afresh, to inform policy and decision making state organs. Attempts that have previously been made to gather information on corruption have included the report of the Presidential Commission of Inquiry against Corruption, commonly known as The Warioba Commission Report, 1996 and the State of Corruption in Tanzania 2002 Report. However, these surveys while answering specific questions on corruption do not provide a comprehensive analysis of the state of corruption in Tanzania and do not establish a baseline that is needed for policy reform.
1.2 PURPOSE OF THE SURVEY The purpose of the National Governance and Corruption Survey (NGACS) 2009 include soliciting information from citizens and fostering public awareness about national

2
governance and corruption issues, identifying areas or issues for further research, providing an empirical and analytical basis to argue for budgetary resources for NACSAP and related reforms, and providing an empirical benchmark and basis for monitoring and evaluating the effectiveness of government’s governance and anti – corruption programmes over time. The enterprises survey was carried out to study the business environment with a special emphasis on the effects of public sector governance and corruption on development of private sector firms. The survey examined the firms’ roles as users of public services and subject to regulations, contractual providers of goods and services to government, and clients for licenses and permits. The Enterprises Survey Report is the fourth volume in the series of publications for the three surveys of the National Governance And Corruption Survey – 2009 REPORT carried out concurrently from the third week of February 2009. The other publications are Volume 2 - Households Survey, Volume 3 –Public Officials Survey and Volume 1 - Analysis of Main Findings, Conclusions and Recommendations, that synthesises the three separate survey reports.

3
CHAPTER 2: SURVEY METHODOLOGY
2.1 SAMPLE DESIGN The scope of the survey covered the 21 regions of Tanzania Mainland. The design allows estimates of the results at regional level. The sample design adopted for the enterprises survey over sampled the Dar es Salaam region, as adopted by the Tanzania National Bureau of Statistics in most of its surveys. Each of the three municipalities of Dar es Salaam was taken as a region giving 23 regions. The main reason is the heterogeneity of the characteristics of the region’s population compared to all others regions which are predominantly rural. Dar es Salaam is over 90 percent urban. The sample employed included 30 private establishments per region or municipality in Dar es Salaam. The overall sample was 690 private establishments. These respective samples were worked on in Dar es Salaam by the management team. Central Register of Establishments was used to arrive at the sample. For each region, private enterprises were listed by district census code numbers in continuous serial numbers. A systematic sample of thirty establishments was selected with a random start.
Within each domain of study (region or municipality in Dar es Salaam), selection of the 30 private establishments took into consideration the representation of urban and rural establishments, various legal forms of business organisation, various industrial sectors and different sizes of establishments. The preferred survey respondent was the head of the firm (director, manager, president, etc.). If after two attempts to hold arranged meetings with the firm, the interviewer was unable to interview the head of the firm, any other member of the senior management of the firm could be interviewed.
2.2 REVIEW AND ADAPTATION OF THE QUESTIONNAIRE
A questionnaire for the enterprise survey was adapted from the generic World Bank instrument. The initial process was to compare the generic instruments against instruments used by a few other African countries and make modifications. To secure Tanzania specific sharpening of the draft instruments, key stakeholders from inside and outside Tanzania with the assistance of FACEIT consultants developed a conceptual framework for adapting an advanced draft for initial approval by the Technical Committee. The questionnaire covered eight broad areas. They are:
1. Characteristics of the responding firms 2. Current situation about corruption in Tanzania 3. Quality of Public services

4
4. Policies, Laws, regulations and the legal system 5. Bureaucracy and state intervention 6. Corruption in the public sector 7. Corruption in the private sector and 8. Anti-corruption strategies The survey questionnaire is attached as an Annex. This version of the questionnaire was translated into Kiswahili and subjected to a pilot test by FACEIT field team in Dar es Salaam region Temeke municipality. Inputs from the pilot test were used to fine–tune, initially the English version of the questionnaires, by the project management team and then subjected them to review by the Technical Committee. A final set of both the English and Kiswahili versions of the survey instrument as well as Kiswahili version of field instructions manual was thus developed and adopted to assess the views of business enterprises on governance and corruption in Tanzania.
2.3 RECRUITMENT AND TRAINING OF FIELD TEAMS There were twelve field teams each comprising of a supervisor and three enumerators. The consultants outsourced both these categories from a pool of freelance field cadre. Supervisors had a degree or its equivalent, with wide experience in field data collection. Enumerators were secondary school leavers also with survey field experience. A set of guidelines prepared by the consultants was used to shortlist and finally pick the required number, plus some reserve to participate in the training. The training initially started with a five day session for a number equivalent to three teams to manage the pilot test. This was, among other reasons used to sharpen the training manual. Training of the whole team followed after a final version of the questionnaire was approved.
2.4 FIELDWORK Data collection for the diagnostic corruption surveys of households, public officials and business enterprises were carried out from 2nd week of February to 3rd week of June 2009. This was a difficult period because in many parts of the country it was raining making it difficult to reach rural establishments. Each of the twelve teams was assigned to two adjacent regions. For Dar es Salaam, there were two teams, one covering Ilala Municipality and the other team covering Kinondoni and Temeke Municipalities. The fieldwork was initially planned to take about two and a half months, but due to unforeseeable reasons the work was extended to cover 90 days. Apart from the ongoing rains, lack of reliable transport was another problem that slowed movement of the teams. In some cases, identification of establishments was difficult because of some changes that had taken place between the time the Central Registry of Establishments was updated by the National Bureau of Statistics and the time of the survey.

5
2.5 RESPONSE Out of the expected 690 establishments, 627 were covered representing 90.9 percent response. Among the 627 firms covered by the survey, 549 were in urban and 78 in rural areas. They included 384 sole proprietors, 141 partnerships, 12 private liability companies, four public listed companies and 149 unclassified establishments. The regional distribution of the establishments covered is shown in table 1.
Table 1: Regional Coverage of the Enterprises Survey
Code No. Region Frequency Percent
1. Dodoma 25 4.0 2. Arusha 30 4.8 3. Kilimanjaro 30 4.8 4. Tanga 30 4.8 5. Morogoro 19 3.0 6. Pwani 23 3.7 7. Dar es Salaam 81 12.9 8. Lindi 30 4.8 9. Mtwara 30 4.8 10. Ruvuma 21 3.3 11. Iringa 26 4.1 12. Mbeya 30 4.8 13. Singida 24 3.8 14. Tabora 30 4.8 15. Rukwa 30 4.8 16. Kigoma 26 4.1 17. Shinyanga 26 4.1 18. Kagera 29 4.6 19. Mwanza 30 4.8 20. Mara 27 4.3 21. Manyara 30 4.8
Total 627 100.0

6
2.6 DATA PROCESSING All questionnaires were returned to the FACEIT office in Dar es Salaam for processing. The data processing operation consisted of recording of received questionnaires, manual editing, coding, data entry and editing of errors captured by the computer programs. The data processing team recruited by FACEIT for this survey was responsible for the data processing operation. Five personal computers (PCs) and one laptop were used for processing the NGACS survey data. The NGACS data entry and editing were performed in Micro Office Access software and SPSS 16 (Statistical Package for Social Sciences) software respectively. Data processing commenced on 7th April, 2009 and was completed on 3rd July, 2009.

7
CHAPTER 3: THE FINDINGS
3.1 PERCEPTIONS AND EXPERIENCE OF GOVERNANCE AND CORRUPTION – EVIDENCE FROM ENTERPRISES
The definition of the word “corruption” varies between different societies. According to the Tanzania Prevention and Combating of Corruption Bureau (PCCB), corruption is defined as: “Corruption occurs where a person commits or does not do something to another person or group of people with an intention of acquiring personal benefits after being given or promised to be given a certain amount of money or other valuable things contrary to laid down procedures and work conditions. Normally, the recipient has certain authority or is employed in an establishment. Moreover, corruption may feature where the recipient or the provider does this for personal interests, interests of another person or a group of people contrary to established procedures;” (un-official translation from Kiswahili)
When respondents were asked to define the word corruption, their definitions were assigned to pre-coded definitions that included the description of various types of corruption. Table 2 shows the percentage of respondents that associated corruption to various definitions of the word. “Demand for unofficial payment” dominated the scene by being chosen by 94.4 percent of the respondents. It is followed by demand for sex that is chosen by 50.9 percent. Abuse of power comes third with 36.8 percent.
Table 2: Percentage distribution of respondents associating corruption to various definitions
Definition Percentage of respondents Demand for unofficial payment 94.4 Demand for sex 50.9 Abuse of power 36.8 Demand for favour 27.1 Fraud 19.9 Takrima 19.8 Embezzlement of public funds 17.2 Bakshish 12.0 Other 8.3
The same order is replicated in the ranking of the seriousness of various types of corruption as it is shown in figure 1. “Demand for unofficial payment” is ranked as the most serious type of corruption by 79.5 percent of the respondents. “Demand for sex” comes second with 6.5 percent of the respondents and “abuse of power” is third with 5.3 percent of the respondents.

8
Figure 1: Percentage distribution of enterprises reporting the seriousness of various types of corruption
The results show some doubts that respondents understand corruption as defined by the PCCB act. It seems some respondents do not consider some types of corruption, those with low percentage response rates, to be corruption.
3.2 TYPES OF CORRUPT PRACTICES PREVAILING IN TANZANIA The results of identifying types of corruption that usually occurred in their location by enterprises are as shown in figure. 2. The first three are similar to the ranking of seriousness. They are demand for official payment with 84.7 percent of respondents, demand for sex with 15.3 percent of respondents and abuse of power with 8.2 percent of respondents.

9
Figure 2: Percentage distribution enterprises indicating types of corruption occurring in vicinity
3.3 PERCEPTION ABOUT CORRUPTION IN THE SOCIETY
A range of perceptions were expressed in nine statements. Leaders of enterprises were required to indicate their degree of disagreement with the statements by choosing scores in a scale between one and four that represented the degree of disagreement where one stood for strongly agreeing and four standing for strongly disagreeing as indicated in brackets in Table 3. Average scores in the last column show that enterprises disagreed with most of the statements that condone corruption. However they were sceptical about what happened after corruption had been reported where average scores of 2.3 and 2.1 (below 2.5) for statements number 5 and 7 indicating that 67.1 percent and 71.4 percent of respondents agree with statements five and seven respectively that reporters of corruption end up suffering.

10
Table 3: Percentage distribution of respondents by their perception about corruption
S/N
Statement Strongly
agree (1)
Agree
(2)
Disagree
(3)
Strongly disagree
(4)
Av. score
1. Bribery is a practical necessity for getting things done quickly
9.7 13.3 25.8 51.2 3.2
2. Corruption is beneficial provided you are not caught
6.1 11.8 32.6 49.5 3.3
3. Corruption gives better services 16.6 27.0 24.9 31.5 2.7 4. Following laid down procedure
is too costly and time wasting 23.1 31.2 22.9 22.9 2.5
5. People who report corruption end up suffering the most
24.0 43.1 16.5 16.5 2.3
6. There is no point of reporting corruption because nothing will be done
14.4 25.1 29.6 30.9 2.8
7. Would not have received protection from possible retaliation
27.8 43.6 16.1 12.5 2.1
8. The case cannot be proved 24.2 37.7 23.0 15.2 2.3 9. Do not want to betray anyone 14.3 28.4 35.0 22.4 2.7
Considering integrity, leaders were asked to rank three hypothetical situations listed in table 4. To show the degree of unacceptability they used scores on a scale with a range between one meaning totally acceptable, to four meaning totally unacceptable. Table 4 shows that senior enterprise management gave average scores of 3.2 and above, meaning that the statements were unacceptable with more than 74 percent of respondents not accepting all the statements. The implication is that they demand high integrity in public life.
Table 4: Percentage distribution of enterprises reporting acceptability of courses of action in hypothetical situations in public life S/No.
Situation Totally acceptabl
e
(1)
Somehow acceptable
(2)
Somehow not
acceptable (3)
Totally not
acceptable
(4)
Av. scor
e
A government official uses a government car for personal business or leisure
15.4 10.5 15.8 58.4 3.5
A person is promoted thanks to a family or intimate relationship with a high ranking official
9.1 4.3 12.0
74.5 3.5

11
In order to keep the car from being towed and avoid paying a fine, an offender offers to pay the traffic police officer directly. The officer had not asked for money, but s/he accepts it.
8.0 5.6 11.6 74.8 3.2
Testing their perception in private life, leaders were asked for the probability of taking the actions shown in table 5 below. They were asked to rank the reactions in a scale between one and four where one means not probable at all, and four means highly probable. A score of 3.2 for the first two statements and the last mean that the statements indicated their probable course of action under the circumstances with more than 75 percent of respondents agreeing with them. The third statement, with a score of 1.9, means that the statement is not their probable course of action. Percentage of respondents disagreeing with it is 74.5. The implication is that they accepted lesser integrity in private life compared to their demands of high integrity in public life.
Table 5: Percentage distribution of enterprises reporting their probable course of action in private life S/No. Reaction Not
probable at all (1)
Not probable
(2)
Probable
(3)
Highly probable
(4)
Average score
1. Since this money has no owner, this lucky break can help you with your family expenses
13.3 9.7 22.4 54.6 3.2
2. You will take it home and think overnight about what to do with it.
10.9 9.1 27.9 52.0 3.2
3. Right away you look for a guard in order to report the incidence and give him the envelope with the money.
50.2 24.3 13.3 12.3 1.9
4. Knowing that whoever will be given the envelope will pocket it, better you take it
9.6 11.7 27.4 51.3 3.2
3.4 EXPERIENCE OF CORRUPTION
To find out the experiences of company executives in corruption, they were asked if they were ever faced with a situation where they were required to give a bribe, they were equally divided where 49.7 percent said yes and 50.3 said no. Figure 3 shows that of those who said yes, 91 per cent said they gave it in the form of money, and four per cent gave it in the form of property. Table 6 shows that Morogoro is the region with the

12
highest percentage of respondents who encountered corruption more frequently (90 percent) and Rukwa is the region with the lowest rate of incidence (30 percent).
Figure 3: Percentage distribution of firms reporting forms of bribery that are practised.
Table 6: Percentage distribution of respondents who encountered corruption by region
S/N Region Yes
(1) No (2)
1. Morogoro 89.5 10.5 2. Kilimanjaro 50 50 3. Dar es Salaam 67.9 32.1 4. Arusha 66.7 33.3 5. Singida 66.7 33.3 6. Manyara 63.3 36.7 7. Lindi 56.7 43.3 8. Shinyanga 53.8 46.2
9. Dodoma 52.0 48.0 10. Tabora 50.0 50.0 11. Tanga 46.7 53.3 12. Pwani 43.5 56.5 13. Mtwara 44.8 55.2 14. Kagera 41.4 58.6

13
15. Mbeya 40.0 60.0 16. Mwanza 40.0 60.0 17. Ruvuma 38.1 61.9 18. Mara 33.3 66.7 19. Iringa 30.8 69.2 20. Kigoma 30.8 69.2 21. Rukwa 30.0 70.0 National 49.7 50.3
3.5 INITIATION OF CORRUPTION Figure 4 shows that the experience of 83 per cent of the enterprises was that bribery was initiated by service providers while 11.8 per cent indicated that service recipients initiated bribery. The rest indicated it was a spontaneous activity to both. The results suggest that before serving their clients, government agents demanded bribes from their clients.
Figure 4: Percentage distribution of enterprises indicating the initiators of bribery

14
Table 7 shows that in twenty out of twenty one regions more than 70 percent of respondents reported that government agents initiated the act of corruption. Mara, Tabora and Arusha are the three top regions where government agents initiated bribery was reported by 90 percent or more of respondents. Iringa has the lowest rate of 69.2 percent.
Table 7: Percentage distribution of enterprises indicating initiators of corruption by region
S/N Region A service
provider indicates or asks for a payment
The person offers a
payment on his/her own
accord
It is known before hand how to pay
and how much to pay
1. Mara 100 0.0 0.0 2. Pwani 82.6 8.7 8.7 3. Manyara 83.3 13.3 3.3 4. Kilimanjaro 96.4 3.6 0.0 5. Rukwa 83.3 13.3 3.3 6. Kagera 72.4 6.9 20.7 7. Arusha 90.0 10.0 0.0 8. Lindi 73.3 23.4 3.3 9. Tabora 96.6 3.4 0.0 10. Kigoma 72.7 22.7 4.5 11. Shinyanga 84.6 11.5 3.8 12. Morogoro 84.2 15.8 0.0 13. Ruvuma 71.4 19.0 9.5 14. Tanga 85.7 0.0 14.3 15. Mwanza 89.7 6.9 3.4
16. Dodoma 80.0 20.0 0.0 17. Dar es Salaam 87.5 6.2 6.2 18. Mbeya 86.2 10.3 3.4 19. Singida 60.9 26.1 13.0 20. Mtwara 75.9 20.7 3.4 21. Iringa 69.2 23.1 7.7 National 83.0 11.8 5.2

15
3.6 PERCEPTION OF THE PRIVATE SECTOR ON POLICIES, LAWS AND REGULATIONS
Policies, Laws, rules and regulations prevailing in the country provided the environment under which enterprises operated. Accessibility of documents on policies, laws rules and regulations ensures transparency and enables enterprises to know their rights and obligations including the right rates of fees payable where need be. It reduces chances of corruption that takes advantage of the ignorance of the client. Fig. 5 shows how easy it was for enterprises to access their documentation. They were generally available, with 41.2 percent indicating that they were very easily available and 29.9 percent showing they were available making a total of 71.1 percent. Only two percent indicated that they were very difficult to obtain.
Figure 5: Percentage distribution of firms reporting the availability of rules and regulations affecting firms
Firms were also asked how predictable the policies, rules and regulations were. In figure 6 they show that they were generally predictable with 40.2 percent indicating that they were completely predictable and 32.3 percent indicating they were fairly predictable giving a total of 72.5 percent. Those indicating that they were completely unpredictable were 6.8 percent. Predictable policies, laws and regulations reduces uncertainty in the business operating environment making it conducive.

16
Figure 6: Percentage distribution enterprises reporting predictability of the rules and regulations affecting firms
Enterprises were asked to compare between now and 2005 on the predictability of economic and financial policies in a scale between one and four where one means completely predictable and four means completely unpredictable. Both years scored 2.3, meaning they were equally fairly predictable. In the case of changes in rules, laws and regulations, the scores were 2.3 for 2005 and 2.2 for now indicating little change, being fairly predictable. For the private sector to play a leading role in the economy there needs to be consultations between the business community and government. Fig. 7 shows that 58.5 percent of enterprises feel that government consults them sometimes and 20.3 percent said they are consulted always adding up to 78.8 percent.

17
Figure 7: Percentage distribution enterprises reporting frequency of consultation between government and firms
To find the interaction between enterprises and government, enterprises were asked to indicate whether they did business with government or not. Enterprises indicated that 24 percent of them did general business with government. On participation in public tender processes, 16 percent of firms participated. Fig. 8 shows income from public tenders as a percentage of the firms’ total income. While to 17.6 percent of enterprises public tenders contributed less than one percent of their incomes, to 12.1 percent of firms, public tenders contributed more than 25 percent of their incomes. The biggest group with 25.3 percent of firms is the one where public tenders contributed one to five percent of their incomes.
Figure 8: Percentage distribution of firms reporting income from public tenders as a percentage of total income

18
The survey sought enterprises’ assessment of the problems they faced. Ranking each of them in a scale between one and four where one means very minor, and four means very major, table 8 shows that inflation dominates as the biggest problem reported by 90.2 percent of respondents, followed by access to and costs of financing reported by 83.5 percent of respondents and corruption in public sector reported by 81.4 of respondents. Of the 18 listed problems, fourteen had a score of more than 2.5 indicating that they were notable problems. Corruption in the private sector and regulatory authorities such as TBS and TFDA caused the least problems.
Table 8: Percentage distribution of enterprises reporting problems for the operation and growth of business
S/No Problem Very
minor
(1)
Minor
(2)
Major
(3)
Very major
(4)
Av. score
1. Inflation 3.1 6.7 29.6 60.6 3.5 2. Access and financing
costs 5.6 10.7 32.4 51.1 3.3
3. Corruption in public sector
6.4 12.1 27.0 54.4 3.3
4. Unstable currency exchange rates
7.2 15.1 32.7 44.9 3.2
5. High taxes 8.6 15.2 31.5 44.7 3.1 6. Bureaucracy in
government 6.7 17.1 35.4 40.8 3.1
7. Inappropriate infrastructure
8.5 16.5 37.7 37.3 3.0
8. Availability and price of inputs
15.3 23.7 31.2 29.8 2.8
9. Other (specify) 15.8 28.9 18.4 36.8 2.8 10. Complex regulations
and policy instability 11.1 30.3 34.0 24.6 2.7
11. Ineffective courts 13.3 30.4 32.2 24.1 2.7 12. Legal procedures to
establish a business 13.0 36.6 30.0 20.3 2.6
13. Insecurity 13.8 36.6 28.4 21.2 2.6 14. Requirements to
conduct foreign trade operations
23.9 26.3 23.0 26.8 2.5
15. Political instability/uncertainty
20.0 36.8 24.6 18.6 2.4
16. Labour regulations 16.6 43.5 26.3 13.7 2.4 17. Tanzania Bureau of
Standards (TBS) 27.0 37.1 20.2 15.8 2.2
18. Tanzania Food and Drugs Agency (TFDA)
31.9 35.7 18.3 14.1 2.1
19. Corruption in private sector
13.5 34.3 28.5 23.7 2.0

19
Table 9 examines further the third major problem, corruption in public sector and its regional dimensions. Tabora and Dodoma lead as regions with high corruption in public sector with 100 percent respondents identifying it as a major problem. They are followed by Arusha, Manyara, and Lindi, with 96.7, 93.4, 90.0 percent respectively. Mara region is at the bottom of the table with 40.0 percent of respondents identifying it as a major problem. Nationally, 81.4 percent of respondents identified it as a major problem.
Table 9: Percentage distribution of respondents rating corruption in public sector as a problem by region
S/N Region Very minor
(1) Minor
(2) Major
(3) Very Major
(4) Average
score 1. Tabora 0.0 0.0 10.7 89.3 3.8 2. Lindi 3.3 6.7 26.7 63.3 3.8 3. Dar es Salaam 3.8 12.5 38.8 45.0 3.5 4. Iringa 11.5 11.5 46.2 30.8 3.3 5. Pwani 4.3 13.0 21.7 60.9 3.5 6. Singida 8.7 4.3 39.1 47.8 3.4 7. Kigoma 8.0 4.0 28.0 60.0 3.4 8. Arusha 0.0 3.3 36.7 60.0 3.5 9. Kagera 3.4 13.8 13.8 69.0 3.4 10. Ruvuma 9.5 4.8 57.1 28.6 3.2 11. Kilimanjaro 3.3 13.3 33.3 50.0 3.3 12. Mara 24.0 36.0 28.0 12.0 3.0 13. Rukwa 10.0 13.3 26.7 50.0 3.1
14. Dodoma 0.0 0.0 28.0 72.0 3.2 15. Shinyanga 8.0 16.0 36.0 40.0 3.1 16. Mtwara 3.3 23.3 26.7 46.7 2.6 17. Mwanza 3.4 13.8 34.5 48.3 3.2 18. Morogoro 12.5 0.0 43.8 43.8 2.9 19. Manyara 0.0 6.7 26.7 66.7 3.1 20. Tanga 6.7 13.3 33.3 46.7 2.8 21. Mbeya 6.9 6.9 44.8 41.4 3.0 National 6.4 12.1 27.0 54.4 3.3

20
3.7 MAIN CAUSES OF CORRUPTION Among a given list of twelve possible causes of corruption, ten were identified by more than sixty percent of respondents as major causes of corruption led by greed/selfishness that was identified by 95.5 per cent. The cause identified by the least percentage of respondents is corruption providing better services identified by 35.3 percent. Table 10 shows the ranking of the causes. The ranking uses a scale between one and two, where one means “yes” it is a cause and 2 means “no” it is not, with 1.5 being a neutral point. Since all except one of the causes listed have scores below 1.5, they are all problems of varying degrees.
Table 10: Percentage distribution of respondents reporting causes of corruption
S/No Cause Yes No Don’t
know Av.
score 1. Greed/selfishness 95.5 4.0 0.5 1.0 2. Lack of control and accountability of public
officials 86.7 11.4 1.9 1.1
3. Moral decay 84.1 13.5 2.4 1.1 4. Poor law enforcement/punishment of the
corrupt 85.6 12.7 1.8 1.1
5. High cost of living 74.3 24.6 1.1 1.2 6. Poor remuneration 75.4 23.8 0.8 1.2 7. Poor leadership 79.3 19.0 1.8 1.2 8. Lack of effective corruption reporting system 78.4 18.4 3.2 1.2 9. Lack of independent and effective judiciary 70.8 25.2 4.0 1.3 10. Poverty 61.2 37.2 1.6 1.4 11. Corruption gives better services 35.3 63.1 1.6 1.6 12. Other (specify) 17.2 3.4 79.3 1.2

21
Examination of greed/selfishness as a cause of corruption by region, table 11 shows that except for Ruvuma and Iringa regions that have 85.7 and 88.5 percent respectively, the rest of the regions have 90 percent or more identifying it as a cause of corruption, with seven regions having a percentage of 100.
Table 11 Percentage of Respondents identifying Greed/Selfishness a Major Source of Corruption by Region
S/N Region Respondents
(%) 1. Morogoro 100.0 2. Lindi 100.0 3. Tabora 100.0 4. Rukwa 100.0 5. Kigoma 100.0 6. Shinyanga 100.0 7. Mara 100.0 8. Arusha 96.7 9. Mtwara 96.7 10. Manyara 96.7 11. Dar es Salaam 96.3
12. Dodoma 96.0 13. Pwani 95.7 14. Mbeya 93.3 15. Kagera 93.1 16. Singida 91.7 17. Kilimanjaro 90.0 18. Tanga 90.0 19. Mwanza 90.0 20. Iringa 88.5 21. Ruvuma 85.7 National 96

22
3.8 SERIOUSNESS OF CORRUPTION IN TANZANIA Figure 9 shows that, corruption was considered to be a major problem by 92.3 percent of the firms while 7.2 percent considered it to be a moderate problem.
Figure 9: Percentage distribution of respondents reporting the seriousness of corruption
The problem was examined by sector, by considering the tendering process. Table 12 shows that enterprises consider their own sector, private companies, to be the first in being ranked as having good quality in terms of transparency, honesty, clarity and simplicity in tendering process.
Table 12: Percentage distribution respondents reporting quality of institutions in terms of transparency, honesty, clarity and simplicity in tendering
Sector High quality Low qualityPrivate companies 58.7 41.3 Public corporations 20.9 79.1 Government Departments 16.9 83.1

23
In comparing the state of corruption between now and 2005, the results are as indicated in Fig. 10. It is rated as much worse now by 44 percent of the firms and worse by 23.3 percent of the firms giving a total of 77.3 percent. Two percent rate it as much better.
Figure 10: Percentage distribution of respondents reporting current state of corruption in public sector in Tanzania compared to 2005
3.9 PROBLEMS AFFECTING TANZANIA Comparing corruption to other types of problems facing Tanzania, the three most serious problems were corruption in public places reported by 90.9 percent of respondents, inflation reported by 90.6 percent and high cost of living reported by 89.9 percent. Table 13 shows the ranking where 1 means very serious two means serious and 3 means a very minor problem. While problems numbers one to twelve in the list are classified as very serious by more the two thirds of the respondents, the rest are classified as serious. Lowest in the list in seriousness is violence. Identification of high cost of living and inflation as very serious problems is an indicator that family incomes are insufficient to meet costs of living.

24
Table 13: Percentage distribution of respondents reporting seriousness of various types of problems facing Tanzania
S/No. Problem Very serious
(1) Serious
(2) Very minor
(3) Av. score
1. Corruption in public places 90.9 8.3 0.8 1.1 2. Inflation 90.6 8.1 1.3 1.1 3. High cost of living 89.9 8.9 1.1 1.1 4. Unemployment 83.7 13.7 2.6 1.2 5. Cost of health services 77.1 17.6 5.3 1.3 6. Cost of education 75.4 20.2 4.3 1.3 7. Unfair judicial system 74.2 19.3 6.5 1.3 8. Lack of good leadership 71.8 19.4 8.8 1.4 9. Delinquency 70.3 22.0 7.8 1.4 10 Poor quality of roads 69.6 23.6 6.9 1.4 11 Drug trafficking 67.6 23.3 9.1 1.4 12 Access to clean water 66.3 26.3 7.4 1.4 13 Destruction of the environment 64.8 27.2 8.0 1.4 14 Police harassment 62.9 25.2 11.9 1.5 15 Corruption in private sector 56.8 28.5 14.8 1.6 16 Safety concerns/crime 55.7 34.6 9.8 1.5 17 Drug abuse 53.1 32.6 14.3 1.6 18 Food availability 52.6 32.8 14.6 1.6 19 Shortage of housing 50.9 35.3 13.8 1.6 20 Gender stereotype/bias 38.7 31.5 29.8 1.9 21 Political instability 38.0 30.7 31.3 1.9 22 Violence 31.9 35.3 32.7 2.0
Examining the first problem, corruption in public services, by region, table 14 shows that in 14 of the 21 regions, 90 or more percent of the respondents say corruption in public services is serious, with four of them having a percentage of 100.
Table 14: Percentage of respondents who felt corruption in public service is serious by region
S/N Region Percent of respondents
1. Arusha 100 2. Morogoro 100 3. Iringa 100 4. Mara 100 5. Lindi 97 6. Manyara 97
7. Dodoma 96

25
8. Rukwa 93 9. Pwani 91 10. Dar es Salaam 91 11. Kilimanjaro 90 12. Mtwara 90 13. Tabora 90 14. Mwanza 90 15. Shinyanga 88 16. Mbeya 87 17. Kigoma 85 18. Singida 83 19. Kagera 83 20. Ruvuma 76 21. Tanga 70 National 90
3.10 ASSESSING THE POLICIES, RULES AND REGULATIONS In assessing the role of government in the operations of the business community, the survey sought to find from the enterprises whether the government was interfering in their operations and they were asked to rank how frequently government interfered in various types of interference. Using a scale between one and four where one means always and 3 means never, pricing had a score of 2.4 indicating sometimes there was interference reported by 28.2 percent and there was interference always reported by 15.1 giving a total of 43.3 percent. Table 15 shows that mergers and dividends had the lowest rate of interference with a score of 2.8 which is close to never.
Table 15: Percentage distribution of respondents reporting state intervention in business operations
S/No. Intervention areas Always
(1) Sometimes
(2) Never
(3) Av. score
1. Dividends 4.3 11.6 84.2 2.8 2. Mergers 4.2 15.9 79.8 2.8 3. Investment 5.4 18.5 76.1 2.7 4. Sales 7.7 20.7 71.6 2.6 5. Employment 4.4 25.9 69.7 2.7 6. Wages 13.6 27.4 59.1 2.5 7. Prices 15.1 28.2 56.7 2.4

26
The quality and efficiency of services delivered by public agencies were ranked by enterprises using a scale between one and four where one means very good and four means very poor. Table 16 shows that the Police Force was the poorest with a score of 3.0 followed by Judiciary, TANESCO and Ministry of Lands, Housing and Human Settlement which have a score of 2.8. Looking at percentages for those performing poorly, the Police Force (73.4%) is followed by Judiciary (67.0%), TANESCO (63.0%) and Ministry of Lands, Housing and Human Settlement (60.0%), in that order. The Police Force is involved in apprehending criminal suspects including traffic offenders and detaining them before they are taken to court. There is discretion in providing bail to the suspects. There are times when this discretion is misused to harass individuals. Corruption is used either to get somebody to be harassed or to enable the suspect to get bail. The Police is also involved in investigating the criminal cases before they are sent to court. Corruption is used either to prolong or influence the investigation and mislead the courts. In the past the Prosecution Department was within the Police Force. Corruption was used to influence the prosecution process and mislead the courts. While corruption involving the harassment of individuals is petty the type corruption in court cases depends on type of case being handled. The more serious is the case the grander is the corruption. Corruption in dealing with TANESCO is mainly petty where one wants accelerated electricity connection or tempering with electricity bills. Grand corruption comes in during the procurement process of plants and supplies. Corruption in the Judiciary (Commercial Courts) and Ministry of Lands, Housing and Human Settlement (acquisition of land) affects the enterprises more and is of grand corruption nature. The best institution is Tanzania Postal Corporation that has a score of 2.0. The 14 institutions that fall below the neutral point of 2.5, have varying degrees of good quality. The six that have scores of above 2.5 have various degrees of poor quality.
Table 16: Percentage distribution of public agencies by quality and efficiency
S/No. Institution
Very good (1)
Good
(2)
Poor
(3)
Very poor (4)
Av. score
1. The Police 1.0 25.6 46.5 26.9 3.0 2. The judiciary 1.8 31.2 50.0 17.0 2.8 3. TANESCO 1.6 35.4 39.4 23.6 2.8 4. Ministry of Lands, Housing and Human
Settlement 2.2 37.9 39.9 20.1 2.8
5. Public Healthcare 2.1 39.8 45.5 12.6 2.7 6. Tanzania Ports Authority 3.0 47.5 34.5 15.0 2.6 7. Ministry of Labour, Employment and Youth
Development 1.2 52.4 37.3 9.2 2.5
8. Tanzania Revenue Authority (TRA) 4.9 51.9 32.1 11.0 2.5 9. Public Procurement and Regulatory Authority
(PPRA) 4.2 54.6 32.4 8.7 2.5
10 Immigration 3.8 51.7 34.1 10.3 2.5 11 Public Water Authority 3.6 50.0 34.7 11.7 2.5 12 Public education services 2.4 57.7 31.6 8.6 2.5 13 TANROADS 2.8 55.2 32.9 9.1 2.5 14 Central Bank 2.9 57.3 32.0 7.8 2.4 15 The Treasury 2.4 60.8 28.9 7.8 2.4 16 Tanzania Investment Centre (TIC) 4.4 62.9 23.1 9.7 2.4 17 Local Authorities 3.1 60.6 29.6 6.7 2.4 18 Tanzania Bureau of Standards (TBS) 6.0 59.2 26.1 8.7 2.4 19 Other (specify) 0.0 75.0 12.5 12.5 2.4

27
20 Business Registration and Licensing Agency (BRELA)
6.2 63.9 22.6 7.3 2.3
21 Prevention and Combating Corruption Bureau (PCCB)
8.7 64.2 20.7 6.5 2.3
22 Tanzania Food and Drug Agency 5.6 63.7 22.5 8.2 2.3 23 Social Security Funds (NSSF/PPF/LGPF/PSPF
etc.) 6.2 68.4 21.5 3.8 2.2
24 Central government 7.5 74.0 15.7 2.8 2.1 25 Parliament 9.2 75.4 13.2 2.1 2.1 26 Tanzania Telecommunications Company Ltd.
(TTCL) 12.8 70.0 10.6 6.6 2.1
27 Tanzania Postal Corporation 14.4 71.7 9.1 4.8 2.0 In assessing the performance of the Police force by region, table 17 shows that in 19 out of 21 regions, 50 percent or more of the respondents say it is poor, 8 out of 21 have percentages of 80 or more.
Table 17: Percentage distribution of respondents rating the quality and efficiency of the Police Force by Region
S/N Region Very good
(1) Good
(2) Poor (3)
Very poor (4)
Average. score
1. Arusha 0.0 0.0 48.3 51.7 3.6 2. Mara 0.0 3.7 77.8 18.5 3.1 3. Singida 0.0 9.5 52.4 38.1 3.3 4. Iringa 0.0 12.0 64.0 24.0 3.1 5. Shinyanga 0.0 16.7 33.3 50.0 3.3 6. Kigoma 0.0 19.2 46.2 34.6 3.2 7. Lindi 0.0 20.0 46.7 33.3 3.1 8. Mtwara 0.0 30.0 26.7 43.3 3.1 9. Dar es Salaam 2.5 18.5 58.0 21.0 3.0 10. Ruvuma 0.0 23.8 61.9 14.3 2.9 11. Rukwa 3.3 23.3 53.3 20.0 2.9 12. Manyara 0.0 26.7 43.3 30.0 3.0 13. Mwanza 3.3 26.7 33.3 36.7 3.0 14. Kagera 3.4 27.6 41.4 27.6 2.9 15. Morogoro 5.3 26.3 47.4 21.1 2.8
16. Dodoma 0.0 36.4 59.1 4.5 2.7 17. Mbeya 0.0 36.0 40.0 24.0 2.9

28
18. Kilimanjaro 0.0 36.7 26.7 36.7 3.0 19. Tabora 0.0 50.0 46.4 3.6 2.5 20. Pwani 0.0 52.2 30.4 17.4 2.7 21. Tanga 0.0 55.2 27.6 17.2 2.6 National 0.0 36.4 59.1 4.5 3.0
In examining the interaction between the business community and public institutions, enterprises were asked for the number of times they contacted some public institutions in the previous year not necessarily for the same issue. Table 18 shows that TANESCO is the institution most contacted with an average of 9 times, followed by TRA and public water authorities, with an average of 6. The institution to be contacted the least number of times is the Parliament. The table also shows the average number of times enterprises were asked for unofficial payments. TANESCO comes at the top again with an average number of 3 followed by TRA with an average number of 2. At the top of the average amount of money paid per episode is TRA with an average amount of Tsh. 118,685 (USD 90), followed by TANROADS with an average of Tsh. 57,326 (USD 43).
Table 18: Interaction with public institutions S/No. Institution Number of
contacts with institution
Number of unofficial payments
Average amount paid Tsh. (1
USD=Tsh 1,320) 1. Tanzania Revenue Authority
(TRA) 6.1 2.1 118,685
2. TANROADS 1.5 0.1 57,326 3. Central Government 2.6 0.2 57,078 4. TANESCO 9.1 2.7 36,184 5. Local Authorities 3.5 0.7 34,138 6. Public Water Authority 6.0 0.9 31,335 7. The Police 2.5 0.9 20,592 8. The judiciary 1.7 0.2 16,437 9. Public Health Care 5.2 0.8 9,639 10 Public Education Services 2.5 0.2 5,123 11 Immigration 1.9 0.2 4,647 12 TTCL 4.9 0.3 3,087 13 Tanzania Postal Corporation 5.8 0.2 2,023 14 Parliament 0.5 0.2 1,324 15 Central Bank 1.8 0.1 703 16 Tanzania Investment Centre 0.1 0.1 430
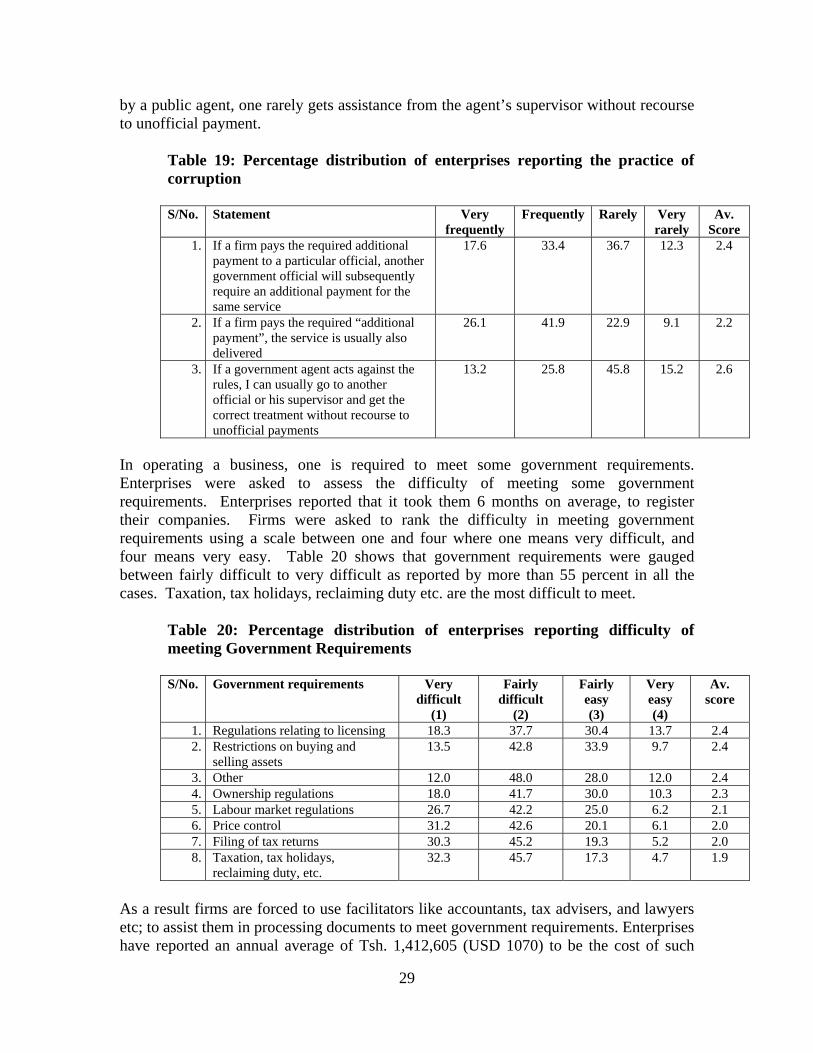
It has also been reported that it takes an average of 58 days to clear goods through customs instead of the official 15 days. Table 19 shows that frequently, once one gives unofficial payment to one official, it does not stop another official from asking additional payment. However, frequently, once one gives unofficial payment, one gets the service required. On the other end once mistreated
29
by a public agent, one rarely gets assistance from the agent’s supervisor without recourse to unofficial payment.
Table 19: Percentage distribution of enterprises reporting the practice of corruption
S/No. Statement Very
frequently Frequently Rarely Very
rarely Av.
Score 1. If a firm pays the required additional
payment to a particular official, another government official will subsequently require an additional payment for the same service
17.6 33.4 36.7 12.3 2.4
2. If a firm pays the required “additional payment”, the service is usually also delivered
26.1 41.9 22.9 9.1 2.2
3. If a government agent acts against the rules, I can usually go to another official or his supervisor and get the correct treatment without recourse to unofficial payments
13.2 25.8 45.8 15.2 2.6
In operating a business, one is required to meet some government requirements. Enterprises were asked to assess the difficulty of meeting some government requirements. Enterprises reported that it took them 6 months on average, to register their companies. Firms were asked to rank the difficulty in meeting government requirements using a scale between one and four where one means very difficult, and four means very easy. Table 20 shows that government requirements were gauged between fairly difficult to very difficult as reported by more than 55 percent in all the cases. Taxation, tax holidays, reclaiming duty etc. are the most difficult to meet.
Table 20: Percentage distribution of enterprises reporting difficulty of meeting Government Requirements
S/No. Government requirements Very
difficult (1)
Fairly difficult
(2)
Fairly easy (3)
Very easy (4)
Av. score
1. Regulations relating to licensing 18.3 37.7 30.4 13.7 2.4 2. Restrictions on buying and
selling assets 13.5 42.8 33.9 9.7 2.4
3. Other 12.0 48.0 28.0 12.0 2.4 4. Ownership regulations 18.0 41.7 30.0 10.3 2.3 5. Labour market regulations 26.7 42.2 25.0 6.2 2.1 6. Price control 31.2 42.6 20.1 6.1 2.0 7. Filing of tax returns 30.3 45.2 19.3 5.2 2.0 8. Taxation, tax holidays,
reclaiming duty, etc. 32.3 45.7 17.3 4.7 1.9
As a result firms are forced to use facilitators like accountants, tax advisers, and lawyers etc; to assist them in processing documents to meet government requirements. Enterprises have reported an annual average of Tsh. 1,412,605 (USD 1070) to be the cost of such

30
facilitators. They have also reported that it takes 12 percent of senior management’s time to process these requirements with an annual average cost of Tsh. 1,104,702 (USD 837) Considering how fairly government procurement was processed, figure 11 shows that 50.2 percent of the times it was rarely fair and 18.2 percent never fair adding up to 68.4 percent. This is a matter of concern as it is in government procurement that grand corruption is practised involving huge sums of money through deals between public officials and enterprises.
Figure 11: Percentage distribution enterprise reporting frequency of government procurement tenders being awarded in a clear and efficient manner
Using a score of one to four where one means very frequently, and four means very rarely, table 21 shows that “bids rigging” was done frequently reported by 83.3 of enterprises. “Bidders agreeing with each other on “loser’s fee”, and “collusion by suppliers to fix the minimum price” was done rarely as reported by 64 percent and 62.2 percent of respondents respectively.

31
Table 21: Percentage distribution of enterprises reporting tendering practices
S/No. Practice Very
frequently (1)
Frequently (2)
Rarely (3)
Very rarely (4)
Av. score
1. Bids rigging 25.6 57.7 12.2 4.5 2.0 2. Qualified bidder being
disqualified at pre-qualification stage due to bribery
22.1 54.6 17.4 5.9 2.1
3. Adjusting specifications in the interest of one company
19.4 49.5 24.0 7.1 2.2
4. Leakage of clients budget at a tender stage to bidders
18.0 49.5 24.4 8.1 2.2
5. Modifying the contract terms during the implementation stage
14.9 52.7 24.6 7.9 2.3
6. Tender process being corrupted by external pressure
15.4 46.1 25.7 12.8 2.4
7. Bidders agree with each other on “losers” fee
6.9 29.2 44.2 19.8 2.8
8. Collusion by suppliers to fix the minimum price
6.1 31.7 40.8 21.4 2.8
9. Unjustified complaints 10.2 42.7 34.5 12.7 2.5 Using a scale between one and three where one means very important, and three means unimportant, table 22 shows that all fell within the score of 2 meaning that the four factors listed were somewhat important in winning government tenders as reported by more than 60 percent in all the criteria. Although qualification/competitiveness is reported by 81.7 percent or firms but connections and making unofficial payments also count.
Table 22. Percentage distribution of enterprises reporting the importance of factors to win government contract
Criteria Very
important (1)
Somewhat important
(2)
Unimportant
(3)
Av. score
Qualification/competitiveness 58.0 23.7 18.3 1.6 Connections 40.9 27.7 31.4 1.9 Making unofficial payments 41.7 22.0 36.3 1.9
Respondents indicate that on average they paid 10.4 percent of contract value in unofficial payments to secure contracts. Table 23 shows the regional variation of the average. Mara region has the highest average of 25 percent and Kigoma and Rukwa regions have the lowest rate of 2 percent.

32
Table 23: Percentage distribution of firms reporting average Percentage of contract value paid as unofficial payment by region
S/N Region Average
Percent 1. Mara 25 2. Dar es Salaam 14 3. Lindi 12 4. Mbeya 10 5. Mwanza 10 6. Mtwara 8 7. Manyara 8 8. Arusha 7 9. Singida 7 10. Kagera 7 11. Morogoro 5 12. Pwani 5 13. Shinyanga 5 14. Kilimanjaro 4
15. Dodoma 3 16. Tanga 3 17. Ruvuma 3 18. Iringa 3 19. Tabora 3 20. Rukwa 2 21. Kigoma 2 National 10
3.11 ASSESSING THE JUDICIAL SYSTEM
In assessing the judicial system, the enterprises were asked to rank the frequency with which courts practised the good qualities of courts. Using a scale between one and four, where one means very frequently and four means never, Table 24 shows that the worst ranked was the speed (quickness) of dispensing court cases with a score of 3.1 as reported by 87.2 percent of respondents that it was rarely or never done. It was reported that on

33
average a case took fifteen months to settle, with the longest taking an average of nineteen months.
Table 24: Percentage distribution of enterprises reporting the frequency of practising good qualities by the court system S/No. Description Very
frequently (1)
Frequently(2)
Rarely (3)
Never (4)
Av. score
1. Fair and impartial 4.0 22.9 61.9 11.3 2.8 2. Affordable 5.8 25.6 54.0 14.6 2.8 3. Able to enforce its
decisions 3.7 24.1 56.8 15.5 2.8
4. Honest and uncorrupted
4.5 17.9 55.7 21.9 2.9
5. Consistent and reliable 3.1 21.3 61.0 14.5 2.9 6. Quick 1.9 11.1 64.6 22.6 3.1
Among the various methods of dispute resolution, table 25 shows that direct negotiation with the other party was the most preferred while the courts ranked third. However the low response in using the listed options, including other methods not listed, suggest that disputes that need formal resolution are rare.
Table 25: Percentage distribution of enterprises reporting the use of various methods of dispute resolution
S/No. Option Yes
(1) No (2)
score
1. Court 12.6 87.4 1.9 2. Negotiation through Police or AG 8.4 91.6 1.9 3. Lawyer without court process 6.0 94.0 1.9 4. Formal mediator 10.2 89.8 1.9 5. Business association 6.1 93.9 1.9 6. Direct negotiation with other party 26.4 73.6 1.7 7. Threat or use of force 1.7 98.3 2.0 8. Family/friend 16.9 83.1 1.8 9. Other (specify) 10.1 83.1 1.9
Table 26 gives the obstacles that prevented firms from using the court system. The first in severity is the excessive amount of time taken by proceedings having a score of 3.5 where four is the most severe. It was indicated that 34 percent of the cases with the longest duration were still pending. The least in severity is the judge’s little professional capacity lying at the neutral score point of 2.5. The ranking used a scale of one to four where one means no obstacle, and four means major obstacle.

34
Table 26: Percentage distribution of enterprises reporting the severity of obstacles to using courts S/No. Obstacle No
obstacle (1)
Minor obstacle
(2)
Moderate obstacle
(3)
Major obstacle
(4)
Av. sc
ore 1. The excessive amount of
time taken by proceedings 6.9 3.6 22.6 66.9 3.5
2. Difficulties in sentence enforcement
7.4 5.7 31.1 55.8 3.4
3. Complicated and tricky legislation
10.4 8.3 31.8 49.4 3.2
4. Legal costs involved in accessing justice
12.3 12.9 31.9 42.9 3.1
5. Extra costs involved in accessing justice
12.5 10.8 35.6 41.1 3.1
6. Judge’s lack of credibility 11.0 13.4 31.0 44.6 3.1 7. Access to adequate legal
counsel 13.8 13.1 29.2 43.9 3.0
8. Judge’s little professional capacity
25.0 21.0 28.2 25.7 2.5
Examination of the most severe obstacle, excessive length of duration of court cases by region, table 27 shows that Mara and Mwanza regions have the longest average duration per case of 33 months. Mbeya region has the shortest average duration of 2 months per case.
Table 27: Average duration of court cases by region
S/N Region Duration
(months)
1. Dodoma 19 2. Arusha 11 3. Kilimanjaro 5 4. Tanga 3 5. Morogoro 5 6. Pwani 16 7. Dar es Salaam 27 8. Lindi 11 9. Mtwara 9 10. Ruvuma 8

35
11. Iringa N/A 12. Mbeya 2 13. Singida N/A 14. Tabora N/A 15. Rukwa 7 16. Kigoma 6 17. Shinyanga 6 18. Kagera 28 19. Mwanza 33 20. Mara 8 21. Manyara 33
National 15 For those with cases with the longest duration, 24 percent reported that there was an indication that there was a need to offer a bribe. Of those who reported actually giving a bribe, figure 12 shows that 57.9 percent paid to judges, 21 percent paid to court clerks and 15.8 percent to prosecutors or officials in the prosecutor’s office.
Figure 12: Percentage distribution of enterprises reporting officials receiving bribes in the judiciary
Firms indicated that, out of the cases determined, in 74 percent of the cases judgement was executed.

36
When asked to compare their confidence in the legal system for upholding their contract and property rights in business disputes, confidence increased from a score of 2.7 in 2005 to 2.4 now.
3.12 CORRUPTION IN THE PRIVATE SECTOR In assessing the honesty and integrity of the private sector, firms were asked how they kept their official company records. Table 28 indicates that almost all companies always demanded receipts, and hardly any company paid taxes honestly.
Table 28: Percentage of enterprises reporting business practice in private sector
S/No. Business
practice Almost all companies
(1)
Many companies
(2)
A few companies
(3)
Hardly any company
(4)
Av. score
1. Always demand receipts
95.8 2.3 1.4 0.5 1.1
2. Always issue receipts
6.5 91.0 2.2 0.2 2.0
3. Keep one set of accounts
2.6 5.2 91.2 1.0 2.9
4. Pays taxes honestly
5.2 7.9 10.5 76.4 3.6
The response to how frequently corruption is practised in the private sector is indicated in figure 13 where 55.1 percent said it was always practised and 36.6 percent said it was practised frequently.

37
Figure 13: Percentage of enterprises reporting incidence of corruption in the private sector
In comparing incidence of corruption within the private sector between now and 2005, figure 14 shows that 43.5 percent of respondents said it was better and 9 percent said it was much better giving a total of 52.5. Those who said it was much worse were 24.2 percent.
Figure 14: Percentage distribution of firms comparing the state of corruption in private sector in Tanzania between today and year 2005

38
Table 29 shows the percentage of respondents who said corruption was better or much better by region. Tanga leads by having 80 percent and Mara has the least, 15 percent. Thirteen out of the 21 regions have a percentage of above 50.
Table 29 Percentage distribution of respondents who Felt Corruption in the private sector in 2009 was better compared to 2005 by region
S/N Percent
1. Tanga 80
2. Dodoma 75 3. Ruvuma 72 4. Mtwara 70 5. Iringa 69 6. Kilimanjaro 68 7. Kigoma 66 8. Kagera 66 9. Rukwa 65 10. Morogoro 63 11. Lindi 60 12. Tabora 59 13. Pwani 54 14. Singida 46 15. Mwanza 43 16. Shinyanga 42 17. Mbeya 41 18. Dar es Salaam 37 19. Arusha 34 20. Manyara 24 21. Mara 15 National 53
Asking the enterprises to rate themselves by industry, table 30 shows the reputation of the private sector by industry. Out of the 33 industries, ten industries were reported by more than two thirds of the respondents that they had good reputation, lead by the telecommunication industry. The high competition in the industry could be a contributing factor. The industry with the worst rating is mining and quarrying followed

39
by contractors who were rated to be good by 21.5 and 23.0 percent of respondents respectively.
Table 30: Percentage distribution of respondents reporting private sector reputation on corruption
S/No. Industry Respondents rating good
reputation % 1. Telecommunications 79.6 2. Food and beverages 77.8 3. Services (hotel) 75.1
4. Manufacturing (consumer goods) 72.4 5. Media and publishing 72.2 6. Socially-oriented institutions 71.9 7. Retailing and merchandising 71.1 8. Food and beverage production 69.4 9. Accounting and consultancy 68.4 10 Agriculture 67.9 11 Manufacturing (general) 66.3 12 Furniture 65.4 13 Education 64.0 14 Real estate 62.8 15 Banking finance and securities 60.3 16 Courier, cargo & handling 60.3 17 Services (general) 56.3 18 Industrial (general) 56.0 19 Brokerage 54.4 20 Transport 53.4 21 Insurance 51.5 22 Oil and gas 51.2 23 Medical (pharmaceutical) 51.0 24 Automobile 50.6 25 Electronic and appliances 46.9 26 Manufacturing (chemical) 45.3 27 Medical services 40.5 28 Foreign companies 39.9 29 Construction 32.1 30 Utilities (power and water) 31.4 31 Logging and lumber 26.2 32 Contractors 23.0 33 Mining and quarrying 21.5 34 None 5.9
3.13 EFFECTS OF CORRUPTION
Commenting on the effects of petty and grand corruption, figures 15 and 16 show that firms felt both were very harmful with 94.8 of respondents referring to grand corruption and 89.5 referring to petty corruption.

40
Figure 15: Percentage distribution of enterprises rating the harmfulness of Petty Corruption
Figure 16 Percentage distribution of enterprises rating the harmfulness of grand corruption

41
The regional perspective of rating the impact of corruption in table 31 shows that only Kilimanjaro and Dar es Salaam regions have less than 80 of the respondents saying Petty corruption is harmful. In all the regions except Dar es salaam and Kilimanjaro there is little variation between rating of petty and grand corruption.
Table 31: Percentage distribution of the rating of impact of corruption by region
Code Region Petty Corruption Grand Corruption Very
harmful (1)
Somehow harmful
(2)
Not harmful
(3)
Av. score
Very harmful
(1)
Somehow harmful
(2)
Not harmful
(3)
Av. Score
1. Dodoma 92.0 4.0 4.0 1.1 96.0 4.0 0.0 1.0
2. Arusha 96.7 3.3 0.0 1.0 100.0 0.0 0.0 1.0
3. Kilimanjaro 69.0 31.0 0.0 1.3 100.0 0.0 0.0 1.0
4. Tanga 72.4 27.6 0.0 1.3 93.1 6.9 0.0 1.1
5. Morogoro 94.7 5.3 0.0 1.1 94.7 5.3 0.0 1.1
6. Pwani 91.3 8.7 0.0 1.1 91.3 8.7 0.0 1.1
7. Dar es Salaam
77.5 22.5 0.0 1.2 95 5 0.0 1.1
8. Lindi 86.7 13.3 0.0 1.1 93.3 6.7 0.0 1.1
9. Mtwara 89.7 10.3 0.0 1.1 92.9 7.1 0.0 1.1
10. Ruvuma 95.2 4.8 0.0 1.0 95.2 4.8 0.0 1.0
11. Iringa 96.2 3.8 0.0 1.0 88.5 11.5 0.0 1.1
12. Mbeya 100.0 0.0 0.0 1.0 100.0 0.0 0.0 1.0
13. Singida 91.3 8.7 0.0 1.1 87.0 13.0 0.0 1.1
14. Tabora 90.0 10.0 0.0 1.1 92.6 7.4 0.0 1.1
15. Rukwa 96.7 3.3 0.0 1.0 93.3 6.7 0.0 1.1
16. Kigoma 96.0 4.0 0.0 1.0 96.0 4.0 0.0 1.0
17. Shinyanga 92.3 7.7 0.0 1.1 88.5 11.5 0.0 1.1
18. Kagera 86.2 13.8 0.0 1.1 100.0 0.0 0.0 1.0
19. Mwanza 96.7 3.3 0.0 1.0 100.0 0.0 0.0 1.0
20. Mara 100 0.0 0.0 1.0 92.6 7.4 0.0 1.1
21. Manyara 96.7 3.3 0.0 1.0 96.7 3.3 0.0 1.0
National 89.5 10.0 0.5 1.1 94.8 5.1 0.2 1.1
Some types of corruption have been indicated as obstacles to operations of business. Table 32 has ranked various types of corruption between no obstacles with a score of one, and major obstacles with a score of 4. “Bribes paid to public officials to avoid taxes and regulations” is the type that has the highest score of 3 with 25.2 percent of respondents saying it is a moderate obstacle and 45.0 percent saying it is a major obstacle giving a total of 70.2 percent.

42
Table 32: Percentage distribution of respondents showing effect of some types of corruption to business
S/No. Obstacle No
obstacle (1)
Minor obstacle
(2)
Moderate obstacle
(3)
Major obstacle
(4)
Av. score
1. Bribes paid to public officials to avoid taxes & regulations
17.9 12.0 25.2 45.0 3.0
2. Central Bank mishandling of funds
24.6 14.1 23.4 37.9 2.7
3. Patronage – public officials hiring their friends & relatives to official positions
24.5 16.5 26.8 32.2 2.7
4. Contributions by private interests to political parties & election campaigns
27.8 19.6 24.2 28.4 2.5
5. Sale of court decisions in criminal cases
33.1 16.7 23.4 26.8 2.4
6. Sale of court decisions in arbitration cases
32.2 18.5 26.4 22.8 2.4
7. Sale of presidential decrees to private interest
41.6 18.7 20.4 19.3 2.2
8. Sale of parliamentary votes on laws to private interests
44.9 17.6 20.5 17.0 2.1
Some companies may opt to terminate participation in the tendering process if corruption is involved. When asked, 13 percent of enterprises indicated that there was a time when they had terminated their participation in a tendering process. Figure 17 shows the reasons for their termination. Unofficial payment takes rank number one as reported by 38.9 percent of enterprises.

43
Figure 17: Percentage distribution of firms showing reason for withdrawal from tender process
Some investors may change their investment plans if they can find other places where they are not obliged to pay corrupt officials to be able to invest in their countries. Results of the survey show that 3 percent of investors changed their mind on investment in the three years previous to the survey. The reasons for changing their mind is given in figure 34. It is dominated by the business environment led by poor infrastructure services reported by 26.7 percent of respondents followed by labour market regulations that has 20 percent.

44
Figure 18: Percentage distribution of enterprises showing reasons for changing mind on planned investment
3.14 COSTS OF CORRUPTION Unofficial payments consume company revenue and deprive government of tax revenue. It also increases prices to consumers of the final product. Figure 19 shows unofficial payment by the private sector to other officials in the private sector as a percentage of their company incomes. While 63.4 percent indicate zero payment, 5.8 percent of companies give 10 percent of their income and above in unofficial payments.
Figure 19: Percentage distribution of firms showing unofficial payment as percentage of company revenues

45
Fig. 20 shows the savings that would accrue to firms if corruption were to be reduced by half. The majority of firms indicate significant positive change. Only 13.2 percent indicate zero change and 0.3 indicate negative change.
Figure 20: Percentage distribution of firms estimating expected percentage change in company income if corruption were to be reduced by half
3.15 PERCEPTION ABOUT FIGHT AGAINST CORRUPTION In assessing the perception about the current status of the fight against corruption the survey sought to assess the effectiveness of the various institutions in fighting corruption. Table 33 shows that the most effective are the Faith-based organisations where 48.9 percent of respondents said they are very effective and 44.9 said they are effective giving a total of 93.8 percent. The media (92.7), NGOs 86.4), Development Partners (85.4) and PCCB (84.6) are second, third, fourth and fifth respectively with their percentages in brackets. The least effective is the Police where 69.2 percent of enterprises say the force is ineffective.

46
Table 33: Effectiveness of institutions in combating corruption S/No. Institutions Very
effective (1)
Effective (2)
Ineffective (3)
Very ineffective (4)
Av. score
1. Police 2.3 28.5 39.3 29.9 3.0 2. Courts 4.7 42.6 31.5 21.1 2.7 3. Attorney General 4.8 53.3 28.3 13.6 2.5 4. Others (specify) 11.8 55.9 14.7 17.6 2.4 5. Permanent Commission of
Inquiry 9.5 55.5 27.8 7.2 2.3
6. Ministry of Justice and Constitutional Affairs
8.5 56.7 27.2 7.6 2.3
7. Ethics Commission 12.7 59.3 23.2 4.7 2.2 8. Public Accounts Committee 16.5 52.1 26.3 5.2 2.2 9. Parliament 19.8 57.3 18.3 4.6 2.1 10 Legal and Human Rights
Commission 17.3 62.5 16.5 3.7 2.1
11 Prevention and Combating Corruption Bureau (PCCB)
32.6 52.0 11.8 3.6 1.9
12 Development partners 25.6 59.8 12.6 2.0 1.9 13 Non-governmental
organisations 25.9 60.5 11.4 2.2 1.9
14 Media 43.0 49.7 5.4 1.9 1.7 15 Faith-based organisations 48.9 44.9 4.7 1.5 1.6
Examining Institutions with the best rating, the Faith Based Organisations, by region, Table 34 shows that Shinyanga has the worst rating of 3.8 meaning very ineffective and Manyara has the best rating of 1.0 meaning very effective. However except for Shinyanga, all the other regions have a rating below 2.5 meaning they are effective.
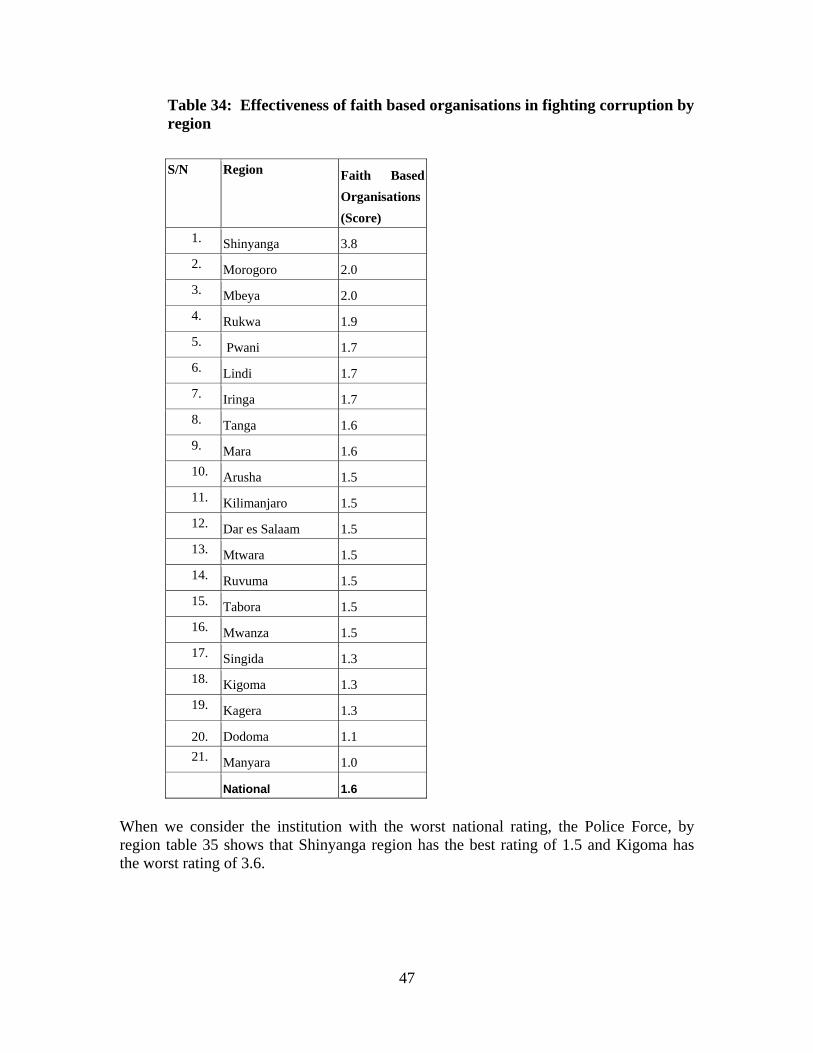
47
Table 34: Effectiveness of faith based organisations in fighting corruption by region
S/N Region Faith Based
Organisations (Score)
1. Shinyanga 3.8 2. Morogoro 2.0 3. Mbeya 2.0 4. Rukwa 1.9 5. Pwani 1.7 6. Lindi 1.7 7. Iringa 1.7 8. Tanga 1.6 9. Mara 1.6 10. Arusha 1.5 11. Kilimanjaro 1.5 12. Dar es Salaam 1.5 13. Mtwara 1.5 14. Ruvuma 1.5 15. Tabora 1.5 16. Mwanza 1.5 17. Singida 1.3 18. Kigoma 1.3 19. Kagera 1.3
20. Dodoma 1.1 21. Manyara 1.0 National 1.6
When we consider the institution with the worst national rating, the Police Force, by region table 35 shows that Shinyanga region has the best rating of 1.5 and Kigoma has the worst rating of 3.6.

48
Table 35: Effectiveness of the Police in Fighting Corruption by Region
S/N Region Police
(Score) 1. Kigoma 3.6 2. Arusha 3.5 3. Mara 3.4 4. Kilimanjaro 3.1 5. Lindi 3.1 6. Mwanza 3.1 7. Manyara 3.1 8. Mtwara 3.0 9. Mbeya 3.0
National 3.0 10. Morogoro 2.9 11. Ruvuma 2.9 12. Iringa 2.9 13. Kagera 2.9
14. Dodoma 2.8 15. Tanga 2.8 16. Rukwa 2.8 17. Dar es Salaam 2.7 18. Singida 2.5 19. Pwani 2.4 20. Tabora 2.4 21. Shinyanga 1.5 National 3.0
Companies were asked to indicate the types of initiatives they would be willing to join to fight corruption. Where a score of one means definitely interested, and four means not interested at all, Table 36 shows that they are probably interested in joining the indicated initiatives reported by more than 69 percent of respondents in all the initiatives suggested.

49
Table 36: Percentage distribution of firms indicating willingness to participate in initiatives to combat corruption
S/No. Initiative Definitely
interested (1)
Probably interested (2)
Not interested at all (3)
Av. score
1. Donating funds 42.7 33.3 24.0 1.8 2. Volunteering staff to join a
government project monitoring group on company time
34.1 35.9 30.0 2.0
3. Paying for expenses 34.0 38.9 27.1 1.9 4. Volunteering staff members
to join a government agency’s tender committee on company time
32.3 35.2 32.5 2.0
Figure 21 shows the percentage of their incomes companies are willing to pay to fund programmes to reduce corruption. Ten percent of enterprises are willing to pay 10 percent or more of their incomes to fund corruption reduction programmes.
Figure 21: Percentage of enterprises willing to pay to company income to fund programmes that would reduce corruption

50
CHAPTER 4: CONCLUSIONS AND RECOMMENDATIONS
4.1 CONCLUSIONS The enterprises survey was carried out to study the business environment with a special emphasis on the effects of public sector governance and corruption on private sector development. The survey examined the firms’ roles as users of public services and subject to regulations, contractual providers of goods and services to government, and clients for licenses and permits. The findings of the survey show that:
There is a wide general understanding of the definition of corruption as demand for unofficial payment, demand for sex and abuse of power. However few consider the other types of corruption as defined by the PCCB to be corruption.
Corruption, both grand and petty, is prevalent in Tanzania in both the public and private sectors, they are harmful and they constitute a major problem in the country.
Costs of corruption include loss of government revenue, loss of prospective investors, and increase in prices of consumer goods.
The major causes of corruption are: greed and selfishness; moral indecency and lack of control and accountability in the public sector; high cost of living and poor remuneration, poor leadership and lack of effective corruption reporting system or a system that cannot be trusted to protect the reporters of corruption.
The worst performers in the public sector are the Police Force, Judiciary, Ministry of Lands, Housing and Human Settlement and TANESCO in that order. However while Police Force and TANESCO refer to wide areas of petty corruption affecting individuals, corruption in the Judiciary and Ministry of Lands, Housing and Human Settlement refer to grand corruption involving businesses.
Malpractices in government procurement and public tendering system make them prone to corruption.
The public service is bureaucratic where routine processes such as registration of businesses and clearing of goods through customs take too long making it prone to corruption.
The general environment in government is transparent where documents are easily available and changes in policies are predictable.
There is adequate consultation between government and business and the private sector is operating with little government interference
The private sector is willing to participate in the fight against corruption.

51
4.2 RECOMMENDATIONS The survey has provided benchmark data for future surveys. It has identified some areas that are prone to corruption. It has also indicated some obstacles to the fight against corruption. To intensify the war against corruption, follow up actions are needed. Amongst the actions are:
PCCB needs to intensify the awareness campaign to enable the public to understand the various types of corruption, the reporting system and safeguards for corruption reporters.
PCCB should improve the corruption reporting system and win the confidence of the public that corruption reporters are not exposed and are protected.
In addition to accessibility of policies, laws, and regulations and transparency in public office, transparency in the processes and procedures should be improved to reduce bureaucracy in the public service and reduce corruption.
To encourage the public to report corrupt activities, sanctions against corruption culprits should be conspicuous.
Follow up and specialized surveys are needed to look into problem areas that have been identified as being prone to corruption such as the Judiciary, Ministry of Lands, Housing and Human settlement, government procurement and tendering processes, and the Police Force.

52
REFERENCES Centre for Democracy and Development: CDD – Ghana (2000); The Ghana Governance
and Corruption Survey – Evidence from Households, Enterprises and Public Officials, CDD – Ghana Accra.
FACEIT and ESRF (2002); The State of Corruption Report – Annual Report Dar es Salaam.
Government of Kenya (2007); National Corruption Perception Survey, Kenya Anti – Corruption Commission Nairobi.
Government of Malawi (2005); Governance and Corruption Baseline Survey, Millennium Consulting Group Ltd, Lilongwe.
Government of Nigeria (no year); Governance and Corruption Diagnostic Survey – Analysis of Survey Results, Households, Enterprises and Public Officials, Lagos
Government of Sierra Leone (no year); Governance and Corruption Study, CDMA/GRS i Freetown.
Government of Zambia (no year); Corruption Survey Report: Zambia National Governance Baseline Survey – Executive Summary Lusaka.
Kaufmann, D et al (2008); Governance Indicators, World Bank Washington D C. Political Economy Centre (2000); Corruption in the public Sector in Thailand,
Chulalongkorn University Bangkok. The United Republic of Tanzania (1999); The National Anti – Corruption Strategy and
Action Plan for Tanzania, President’s Office State House Dar es Salaam. The United Republic of Tanzania (2006); The National Anti – Corruption Strategy and
Sector Specific Action Plans for all Ministries, Independent Government departments and Executive Agencies Phase II 2006 – 2010, President’s Office State House Dar es Salaam
USAID, nola and PCCB (2007); Yajue Makosa ya Rushwa Yaliyoainishwa Katika Sheria ya Kuzuia na Kupambana na Rushwa Namba 11 ya 2007

53
Annex : Enterprises Survey Questionnaire UNITED REPUBLIC OF TANZANIA
NATIONAL GOVERNANCE AND CORRUPTION SURVEY
ENTERPRISES SURVEY QUESTIONNAIRE
CONFIDENTIAL
IDENTIFICATION
REGION …………………………………………………………..……….
DISTRICT …………………………………………………………………….. WARD …………………………………………………….………… Village/Street ……………………………………………….……… Name of establishment…___________________________________ Establishment number ……………………………………………………. VISIT 1 VISIT 2 VISIT 3 Date of Interview Interviewer Name Supervisor Office Editor Name Date Name Date DATA PROCESSING
Keyed in by
Name Date
----/----/2009

54
READ THE FOLLOWING TO THE RESPONDENT Good morning/afternoon. I am _______________________, an interviewer from the Front Against Corrupt Elements in Tanzania (FACEIT). FACEIT is conducting a survey on behalf of the Government of the United Republic of Tanzania. The objective of the survey is to have a better understanding of constraints that hinder the development of private business in Tanzania. Ultimately, the survey will be used to advise government on ways to improve and strengthen private enterprise growth. Your answers should reflect only your perception and experience of doing business in the country. You have been selected to be interviewed. The information obtained will be treated strictly anonymous and confidentially. Neither your name nor the name of your firm will be printed or used in any documents or used for tax purposes. STARTING TIME: ADOPT A 12 HOUR SYSTEM PART 1. CHARACTERISTICS OF RESPONDING FIRMS ______________________________________________________________________
101 INDICATE LOCATION OF FIRM (FILL IN BOX)
URBAN 1 RURAL 2
102 INDICATE THE SEX OF THE RESPONDENT (FILL IN BOX) MALE 1 FEMALE 2 103 What is your job title? (FILL IN BOX) CHIEF EXECUTIVE/DIRECTOR 1
GENERAL MANAGER 2 OWNER/PROPRIETOR 3 PARTNER 4 OTHER (SPECIFY) 5
104 How old are you? (FILL IN BOX) IN YEARS 105 What is your highest level of education attained? (FILL IN BOX)
POST GRADUATE 1 DEGREE/ADVANCED DIPLOMA 2 TRAINING AFTER SECONDARY 3 SECONDARY 4 TRAINING AFTER PRIMARY 5 PRIMARY 6 NONE 7 OTHER (SPECIFY) ____________________ 8

55
106 How many permanent and casual employees does your firm have? (INDICATE NUMBER OF EMPLOYEES IN APPROPRIATE SIZE OF THE FIRM)
COMPANY SIZE PERMANENT CASUAL TOTAL1. SMALL (5 – 50 EMPLOYEES) 2. MEDIUM (51 – 200 EMPLOYEES) 3. LARGE (MORE THAN 200 EMPLOYEES)
107 What type of industry is your firm involved in? (CIRCLE AS APPROPRIATE)
AGRICULTURE: AGRICULTURAL AND FARMING SERVICES 01 PLANTATIONS AND OTHER PLANTS 02 FISHING 03 FORESTRY 04 MINING AND QUARRYING: SALT MINING AND QUARRYING 05 ROCK, CLAY AND SAND QUARRYING 06 MINING OF MINERALS, CHEMICAL PRODUCTS AND FERTILISER 07 OTHER MINING AND QUARRYING 08 MANUFACTURING
FOOD BEVERAGE AND TOBACCO 09 TEXTILE PRODUCTS 10 WOOD AND OTHER HOUSEHOLD ITEMS 11 PAPER, PAPER PRODUCTS, PRINTING AND PUBLISHING 12 CHEMICALS 13 MACHINERY AND EQUIPMENT 14 NON-METALLIC MINING PRODUCTS 15 BASIC METALS 16 OTHER MANUFACTURING (SPECIFY) 17
TRADE, RESTAURANTS AND ACCOMMODATION WHOLESALE TRADE 18 RETAIL TRADE 19 RESTAURANTS, CAFES, BARS AND CATERING SERVICES 20 HOTELS AND GUEST HOUSES 21 TRANSPORTATION AND COMMUNICATION LAND, WATER AND AIR TRANSPORTATION 22 COMMUNICATION 23 FINANCIAL INSTITUTIONS, REAL ESTATE AND BUSINESS SERVICES 24 PROFESSIONAL PRACTICE (ACCOUNTANCY, LAW, ENGINEERING, ETC.) 25

56
ELECTRICITY, GAS, WATER 26 CONSTRUCTION 27 OTHER (SPECIFY) __________________________ 28
108 Which of the following best describes the legal status of your company? (FILL IN BOX)
Sole Proprietor 1 Partnership 2 Private Limited Liability Company 3 Public Listed Company 4 OTHER (SPECIFY) ______________________ 5
109 Which of the following best describes the type of owner that has the largest stake in your firm either directly or indirectly? (FILL IN BOX)
Individual 01 Family 02 SACCOS 03 Workers 04 Managers 05 Investment Company 06 Foreign Company 07 Bank 08 Others (SPECIFY) 09 110 Which of the following best describes the overall control of your firm/company, where
control means making major decisions concerning the enterprise’s direction?
Would you say it is controlled by: TODAY (CIRCLE
ONLY ONE CHOICE)
3 YEARS AGO (CIRCLE ONLY ONE CHOICE)
01. Individual owner (s) 01 01 02. A family member 02 02 03. Domestic company group (conglomerate) 03 03 04. Foreign company or group 04 04 05. An investment fund or mutual fund 05 05 06. An investment company 06 06 07. A bank 07 07 08. Its board of directors/supervisory board 08 08 09. Its managers 09 09 10. Government 10 10

57
11. Its workers 11 11 12. SACCOS 12 12 13. Other (SPECIFY) 13 13
111 How was your firm established? (FILL IN BOX)
STATE-OWNED FIRM 1 PRIVATIZATION OF A STATE-OWNED FIRM 2 PRIVATE SUBSIDIARY OF FORMERLY JOINT VENTURE, DOMESTIC AND FOREIGN 3 DOMESTIC PRIVATE FIRM 4 FOREIGN FIRM 5 OTHER (SPECIFY) _______________________________ 6
112 When did the company start its first operations in Tanzania? YEAR 113 Please tell me where the Company’s headquarters is located. (FILL IN BOX)
At this site 1 Elsewhere in the country 2 In another country 3
114 Does any government agency or state body have a financial stake in the ownership of your
firm? (FILL IN BOX)
YES 1 NO 2 ( SKIP TO 116) DON’T KNOW 3 (SKIP TO 116)
115 What proportion (%) does the government agency or state body have in the financial stake of ownership of your firm? (FILL IN BOX)
PERCENT 116 Does any foreign company or individual have a financial stake in the ownership of your
firm/company? (FILL IN BOX) YES 1 NO 2 (SKIP TO 118) DON’T KNOW 3 (SKIP TO 118) 117 What proportion (%) does the foreign company/individual have as the financial stake of
ownership of your firm? (FILL IN BOX) PERCENT

58
118 Please indicate, in percentage share, your main sources of finance.
Source SHARE (%)01. Internal funds/retained earnings 02. Local Commercial Banks 03. Equity, sale of stock 04. Foreign Banks 05. Leasing arrangements 06. Investment funds 07. Other state sources 08. Family/friends 09. Money lenders 10. Others (specify)
119 Is your firm involved in export business? (FILL IN BOX)
YES 1 NO 2 (SKIP TO 121) DON’T KNOW 3 (SKIP TO 121)
120 What proportion (%) of your sales do such exports represent? (FILL IN BOX) PER CENT 121 Would you, please, estimate the annual growth (%) of your company’s sales over the past
three years? (FILL IN BOX) PERCENT (per annum) RECORD IN NEGATIVE NUMBERS IF THE SALES DECLINED 122 Please, predict the annual growth (%) of your company’s sales over the next three years?
(FILL IN BOX) PERCENT (over the next three years) 123 Does your firm/company have holdings or operations in other countries (FILL IN BOX)
YES 1 NO 2 DON’T KNOW 3
124 For how long has the current General Manager of your company been in the post? (FILL
IN BOX). MONTHS

59
125 Please specify in order of ranking your company’s three leading products or services.
1.____________________________________________ 2.____________________________________________ 3. ____________________________________________
PART 2: CURRENT SITUATION ABOUT CORRUPTION IN TANZANIA 201. The word “Corruption” is sometimes difficult to define. Now I would like to ask you,
what do you understand when one mentions the word “corruption”? CIRCLE ALL MENTIONED DEMAND FOR UNOFFICIAL PAYMENT 01 TAKRIMA 02 BAKSHISH 03 DEMAND FOR FAVOUR 04 DEMAND FOR SEX 05 EMBEZZLEMENT OF PUBLIC FUNDS 06 FRAUD 07 ABUSE OF POWER 08 OTHER (SPECIFY) _________________________________ 09 DOES NOT KNOW 99
202. In your opinion, which three forms of corruption do you consider to be most serious in Tanzania?
TRANSFER CODE NUMBER OF RESPONSE MENTIONED ____________________________________________________ ____________________________________________________ ____________________________________________________
203. What types of corrupt practices do usually occur in your vicinity?
_______________________________________________ _______________________________________________
_______________________________________________ 204. In which sector do such corrupt practices occur?
_______________________________________________ _______________________________________________
_______________________________________________

60
205. In your opinion, how does each of the following corruption affect society in general?
CIRCLE AS APPROPRIATE.
VERY HARMFUL
SOMEHOW HARMFUL
NOT HARMFUL
DON’T KNOW
Petty corruption (Small) 1 2 3 9 Grand corruption (Big) 1 2 3 9
206. In your opinion, do you think corruption in Tanzania is a very serious problem when it is
compared with other problems? (FILL IN BOX)
MAJOR PROBLEM 1 MODERATE PROBLEM 2 MINOR PROBLEM 3 NOT A PROBLEM AT ALL 4 DON’T KNOW 9
207. From your personal perspective, would you consider the following to be the major causes
of corruption in Tanzania? CIRCLE AS APPROPRIATE.
CAUSE YES NO DON’T KNOW
Poverty 1 2 9 Greed/selfishness 1 2 9 High cost of living 1 2 9 Poor remuneration 1 2 9 Lack of control and accountability of public officials 1 2 9 Lack of independent and effective judiciary 1 2 9 Moral decency 1 2 9 Poor leadership 1 2 9 Lack of effective corruption reporting system 1 2 9 Poor law enforcement/punishment of the corrupt 1 2 9 Corruption gives better services 1 2 9 Other (SPECIFY) ___________________________ 1 2 9
208. In your opinion, would you strongly agree, agree, disagree or strongly disagree with the following statements? CIRCLE AS APPROPRIATE.
STATEMENT STRONGLY
AGREE AGREE DISAGREE STRONGLY
DISAGREE DON’T KNOW
Bribery is a practical necessity for getting things done quickly 1 2 3 4 9
Corruption is beneficial provided you are not caught 1 2 3 4 9
Corruption gives better services 1 2 3 4 9 Following laid down procedures is too costly and time wasting 1 2 3 4 9

61
People who report corruption end up suffering the most 1 2 3 4 9
There is no point of reporting corruption because nothing will be done about it
1 2 3 4 9
Would not have received protection from possible retaliation 1 2 3 4 9
The case can not be proved 1 2 3 4 9 Do not want to betray anyone 1 2 3 4 9
209. From the following statements, in your opinion, who usually initiates a bribe?
1. A service provider indicates or asks for a payment 1 2. The person offers a payment on his/her own accord 2 3. It is known before hand how to pay and how much to pay 3 4. Do not know 9
210. Have you ever encountered a situation where you were obliged to give something in
order that you get what you wanted?
YES 1 NO 2 GO TO 212
211. What did you give in exchange for what you wanted to get?
MONEY 1 PROPERTY 2 SEX 3 OTHER (SPECIFY) __________________________ 4
212. In the following questions, I will describe to you some situations that sometimes happen. In your opinion, how do you rate each action, would you consider it to be totally acceptable, somehow acceptable, somehow not acceptable or totally not acceptable? CIRCLE AS APPROPRIATE.
SITUATION TOTALLY ACCEPTABLE
SOMEHOW ACCEPTABLE
SOMEHOW NOT ACCEPTABLE
TOTALLY NOT ACCEPTABLE
01. In order to keep the car from being towed and avoid paying a fine, an offender offers to pay the Traffic Police Officer directly. The Officer had not asked for money, but he/she accepts it.
1 2 3 4
02. A government official uses a government car for personal business or leisure
1 2 3 4
03. A person is promoted thanks to a family or other intimate relationship with a high ranking official
1 2 3 4
213. We are going to propose a hypothetical situation. Suppose that one night, a little late in the
evening, you are walking in the parking lot of a shopping street/area/mall, the parking lot is empty, there is no security at this time and you are by yourself. Suddenly, you notice that there is an envelope on the ground. You pick it up and realize it contains 5 million shillings. How probable is it that your reaction would be as follows?

62
REACTION NOT PROBABLE AT ALL
NOT PROBABLE PROBABLE HIGHLY
PROBABLE
01. Since this money has no owner, this lucky break can help you with your family expenses. 1 2 3 4
02. You will take it home and think overnight about what to do with it. 1 2 3 4
03. Right away you look for a guard in order to report the incidence and give him the envelope with the money.
1 2 3 4
04. Knowing that whoever will be given the envelope will pocket it, better you take it.
214. I will read to you a list of problems. Please tell me how serious you consider each
problem to be. Let us use a scale from 1 to 3 where 1 means very serious problem; 2 means serious problem; and 3 means very minor problem.
PROBLEM VERY
SERIOUSSERIOUS VERY
MINOR01. High cost of living 1 2 3 02. Unemployment 1 2 3 03. Inflation 1 2 3 04. Safety concerns/crime 1 2 3 05. Drug abuse 1 2 3 06. Drug trafficking 1 2 3 07. Lack of good leadership 1 2 3 08. Corruption in public services 1 2 3 09. Corruption in private sector 1 2 3 10. Cost of Education 1 2 3 11. Cost of Health services 1 2 3 12. Access to clean water 1 2 3 13. Food availability 1 2 3 14. Poor quality of roads 1 2 3 15. Police harassment 1 2 3 16 Unfair judicial system 1 2 3 17. Destruction of the environment 1 2 3 18. Political instability 1 2 3 19. Shortage of Housing 1 2 3 20. Gender stereotype type/bias 1 2 3 21. Violence 1 2 3 22 Delinquency 1 2 3 22. Any other problem? (Specify) 1 2 3
215. In your opinion, from the aforementioned problems, what do you think are the three most
serious problems affecting Tanzania? List them in order of importance among those I have read to you?
1st in importance __________________________________________ 2nd in importance __________________________________________
3rd in importance __________________________________________

63
PART 3: QUALITYOF PUBLIC SERVICES 301 Does your firm do business with the Public sector? (FILL IN BOX) YES 1 NO 2 (SKIP TO 303) DON’T KNOW 3 (SKIP TO 303) 302 What proportion (%) of sales does it represent? (FILL IN BOX)
PER CENT 303 Please judge how problematic the following factors are for the operation
and growth of business. (CIRCLE AS APPROPPRIATE)
Problem in: Very minor
Minor Major Very major
01. Access and financing costs 1 2 3 4 02. Inappropriate infrastructure 1 2 3 4 03. Availability and price of inputs 1 2 3 4 04. Legal procedures to establish a
business 1 2 3 4
05. Requirements to conduct foreign trade operations 1 2 3 4
06. High taxes 1 2 3 4 07. Complex regulations and policy
instability 1 2 3 4
08. Political instability/uncertainty 1 2 3 4 09.Inflation 1 2 3 4 10. Unstable exchange rates 1 2 3 4 11. Ineffective courts 1 2 3 4 12. Labour regulations 1 2 3 4 13.Corruption in private sector 1 2 3 4 14. Corruption in Public sector 1 2 3 4 15. Insecurity 1 2 3 4 16. Bureaucracy in Government 1 2 3 4 17 Other (SPECIFY) 1 2 3 4
304 From the problems mentioned above, indicate in order of ranking which
ones are the three most important obstacles to your business.
1. _________________________________________ 2. _________________________________________ 3. _________________________________________

64
305 Please rate the overall quality and efficiency of services delivered by the
following Public agencies or services: (CIRCLE AS APPROPRIATE FOR EACH INSTITUTION)
Institution VERY
GOOD GOOD POOR VERY
POOR 01.Central government 1 2 3 4 02. Parliament 1 2 3 4 03. Central Bank 1 2 3 4 04. The judiciary 1 2 3 4 05. Ministry of Lands, Housing and Urban
Development 1 2 3 4
06. Ministry of Labour, Employment and Youth development 1 2 3 4
07. The Treasury 1 2 3 4 08. Tanzania Revenue Authority (TRA) 1 2 3 4 09. Social Security Funds
(NSSF/PPF/LGPF/PSPF) 1 2 3 4
10. Public Procurement and Regulatory Authority (PPRA) 1 2 3 4
11. Business Registration and Licensing Agency (BRELA) 1 2 3 4
12. Tanzania Investment Centre (TIC) 1 2 3 4 13. Prevention and Combating Corruption
Bureau (PCCB) 1 2 3 4
14. The Police 1 2 3 4 15. Immigration 1 2 3 4 16. Tanzania Telecommunications
Company LTD (TTCL) 1 2 3 4
17. Tanzania Postal Corporation 1 2 3 4 18. Public Water Authority 1 2 3 4 19. TANESCO 1 2 3 4 20. Public Health Care 1 2 3 4 21. Public Education Services 1 2 3 4 22. Local Authorities 1 2 3 4 23. TANROADS 1 2 3 4 24. Tanzania Ports Authority 1 2 3 4 25. Other (SPECIFY) _________________ 1 2 3 4

65
306 & 307 During the last year, please characterize the interactions you had
with the following agencies in each of the stated contests: Institution 306. Number of
contacts with agency or official
307. Number of unofficial payments requested & amount paid
No. of times 1. No. of times
2. Amount paid (Tsh.)
01. Central Government 02. Parliament 03. Central Bank 04. The judiciary 05. Tanzania Revenue
Authority (TRA)
06. The Police 07. Immigration 08. TTCL 09. Tanzania Postal
Corporation
10. Public Water Authority
11. TANESCO 12. Public Health Care 13. Public Education
Services
14. Local Authorities 15. TANROADS 16. Tanzania Investment
Centre (TIC)
PART 4: POLICIES, LAWS, REGULATIONS AND THE LEGAL SYSTEM 401 Generally how do you consider the availability of the rules and regulations
affecting your firm? (FILL IN BOX)
VERY EASY TO OBTAIN 1 SOMEWHAT EASY TO OBTAIN 2 NEITHER DIFFICULT NOR EASY TO OBTAIN 3 SOMEWHAT DIFFICULT TO OBTAIN 4 VERY DIFFICULT TO OBTAIN 5 402 Please describe the rules and regulations affecting your firm. (FILL IN
BOX)

66
COMPLETELY PREDICTABLE 1 FAIRLY PREDICTABLE 2 NEITHER UNPREDICTABLE NOR PREDICTABLE 3 FAIRLY UNPREDICTABLE 4 COMPLETELY UNPREDICTABLE 5 403 Please indicate the option that best describes your view about the
statement, “In case important changes in law or policies affecting my business operations, the government takes into account concerns voiced either by me or my business associations and trade unions.” (FILL IN BOX)
ALWAYS 1 SOMETIMES 2 NEVER 3
404 About the legal system, how often do you associate the following descriptions with the court system in resolving business disputes? (CIRCLE AS APPROPRIATE)
VERY
FREQUENTLY FREQUENTLY RARELY NEVER
01. Fair and impartial 1 2 3 4 02. Honest & uncorrupted 1 2 3 4 03. Quick 1 2 3 4 04. Affordable 1 2 3 4 05. Consistent & reliable 1 2 3 4 06. Able to enforce its
decisions 1 2 3 4
405 During the last three years, did your firm use the methods listed below for
dispute resolution? (CIRCLE AS APPROPRIATE)
OPTIN YES NO 01.Court 1 2 02. Negotiation through Police or AG 1 2 03. Lawyer without court process 1 2 04. Formal mediator 1 2 05. Business association 1 2 06. Direct negotiation with other party 1 2 07. Threats or use of force 1 2 08. Family/friend 1 2 09. Other (SPECIFY) 1 2
FOR ENTERPRISES THAT DID NOT USE THE COURT SKIP TO 413
406 On average, please state, in months, how long the cases took to resolve? Months 407 How long has the case with the longest duration taken? Months

67
408 Is the case with the longest duration determined or is it still pending?
DETERMINED 1 PENDING 2
409 For the case with the longest duration, did you or anyone in your firm receive any indication that you were expected to make some unofficial payment (to the judge, prosecutor, or any other public official involved in the case) in order to get a favourable decision in the case? (FILL IN BOX)
YES 1 NO 2 (SKIP TO 413) DON’T KNOW 3 (SKIP TO 413)
410 To whom did you make the unofficial payment? (FILL IN BOX)
JUDGE 1 COURT CLERKS 2 PROSECUTORS 3 OFFICIALS FROM PROSECUTOR’S OFFICE 4 OTHER (SPECIFY) 5
411 How much unofficial payment did you pay for the entire case? 412 If your firm won in court, was your firm able to enforce judgment (e.g.
collect payment)? (FILL IN BOX)
YES 1 NO 2
413 How severe are the following obstacles to using courts? (CIRCLE AS
APPROPRIATE)
Obstacle NO OBSTACLE
MINOR OBSTACLE
MODERATE OBSTACLE
MAJOR OBSTACLE
01. Legal costs involved in accessing justice
1
2
3
4
02. Extra costs involved in accessing justice
1
2
3
4
03. Access to adequate legal counsel 1 2 3 4
04. Judge’s lack of credibility 1 2 3 4 05. Judge’s little professional
capacity 1 2 3 4
06. The excessive amount of time taken by proceedings 1 2 3 4
07. Difficulties in sentence enforcement 1 2 3 4
07. Complicated and tricky legislation 1 2 3 4

68
414 Compare now with 2005, to what extent do you agree with this statement, “I am confident that the legal system will uphold my contract and property rights in business disputes.” CIRCLE AS APPROPRIATE
415 Compared to 2005,
a. How predictable are changes in the government’s economic and financial policies that materially affect your business? (CIRCLE IN THE TABLE AS APPROPRIATE)
b. How predictable are the changes in rules, laws or regulations? (CIRCLE IN THE TABLE AS APPROPRIATE)
Policy a. Economic and
financial policies b. Changes in rules, laws or regulations
2005 NOW 2005 NOW Completely predictable
1
1
1
1
Fairly predictable 2 2 2 2 Fairly unpredictable
3
3
3
3
Completely unpredictable
4
4
4
4
PART 5: BUREAUCRACY AND STATE INTERVENTION 501 When did you register your business? YEAR
IF REGISTERED BEFORE 2006, SKIP TO QUESTION 503.
502 How long did the process of registering your business take from beginning to end?
MONTHS 503 In opening your business, which government requirement(s) is the most difficult to meet
in the order of severity::
1. _____________________________________ 2. _____________________________________ 3. _____________________________________
504 Comment on the difficulty of meeting government requirements in operating your business today. (CIRCLE AS APPROPRIATE FOR EACH REQUIREMENT)
FULLY AGREE
TEND TO
AGREE
TEND TO DISAGREE
FULLY DISAGREE
DID NOT EXIST THREE YEARS
AGO Now 1 2 3 4 5 2005 1 2 3 4 5

69
GOVERNMENT REQUIREMENTS
VERY DIFFICULT
FAIRLY DIFFICULT
FAIRLY EASY
VERY EASY
1. Labour market regulations 1 2 3 42. Ownership regulations 1 2 3 43. Regulations relating to licensing 1 2 3 44. Restrictions on buying and selling of assets 1 2 3 4 5. Price control 1 2 3 46. Taxation, tax holidays, reclaiming duty, etc 1 2 3 4 7. Filing of tax returns 1 2 3 48. Other (SPECIFY) 1 2 3 4
505 Do you use any facilitators (accountant, tax advisor, lawyer, agent, etc.) to assist you with
government regulations? (FILL IN BOX)
YES 1 NO 2 (SKIP TO 507)
506 What is the annual cost of using these facilitators? Tshs _______________ 507 What percentage of senior management’s time per year is spent in dealing with
government officials about the application and interpretation of laws and regulations? ___________%
508 On average, how much do you estimate that time cost your company in the last year,
2007)? ________________Tsh. 509 At what public institution was the greatest amount spent? _______________ 510 During the last three years, did you change your mind about a planned investment in
Tanzania Mainland for reason other than finance? (FILL IN BOX)
YES 1 NO 2 (SKIP TO 513)
511 What was the reason(s)? (CIRCLE ALL MENTIONED)
LABOUR MARKET REGULATION 01 OWNERSHIP REGULATIONS 02 REGULATION RELATING TO LICENSING 03 RESTRICTIONS ON BUYING AND SELLING OF ASSETS 04 PRICE CONTROL 05 TAXATION 06 POOR INFRASTRUCTURE SERVICES 07 POOR UTILITY SERVICES 08 POLITICAL CLIMATE 09 OTHER (SPECIFY)________________________ 10

70
512 If you decided against an investment in Tanzania, could you describe the nature of the
investment? _____________________________________________________________________ _____________________________________________________________________
513 Does your firm import? (FILL IN BOX)
YES 1 NO 2 (SKIP TO 517)
514 How long does it normally take from the time your goods arrive in their point of entry (e.g. port, airport) until the time you can claim them from the customs? _______________days.
515 How long should it take officially? _____________days. 516 How much are unofficial costs that are habitually associated with importation as a
percentage of the official fees? _________% of total import official fee. 517 What percentage of total income did your firm spend on security in the year (2007)?
Tshs____________ 518 In the last three years, have security costs increased or decreased? a. no change ___________%
b. increased by ___________% c. decreased by __________%
519 In the last three years, have you participated in public tenders or contracts? (FILL IN
BOX)
YES 1 NO 2 (SKIP TO 521)
520 What percent of your income comes from public tenders and/or contracts? (FILL IN BOX)
LESS THAN 1% 1 1 – 5% 2 6 -10% 3 11 – 25% 4 26 – 50% 5 MORE THAN 50% 6 Do not know 9
521 How often are contracts relating to government procurement awarded in a clear and efficient manner? (FILL IN BOX)
ALWAYS 1 SOMETIMES 2 RARELY 3 NEVER 4
522 Has your firm ever terminated participation in a tender and/or contract in which you had initially considered? (FILL IN BOX)

71
YES 1 NO 2 (SKIP TO 524)
523 What were the reasons? (CIRCLE AS APPROPRIATE)
a. THE COMPLEXITY OF THE PROCESS DUE TO THE REQUIRED DOCUMENTATION 1 b. THE COST OF THE PROCESS (SPECIFICATIONS, ETC) 2 c. UNOFFICIAL PAYMENTS (COMMISSIONS & BRIBES) 3 d. LACK OF IMPARTIAL FRAME OF COMPETITION 4 e. POSSIBILITY TO OBTAIN CONTRACTS WITHOUT COMPETING 5 f. DID NOT HAVE DIRECT CONTACTS WITH THE RESPONSIBLE PARTIES 6
524 How do you rate the tender process in each one of the following institutions? (Rate in
terms of transparency, honesty, clarity & simplicity in process) (CIRCLE AS APPROPRIATE)
HIGH
QUALITY LOW QUALITY
a. Private companies 1 2 b. Public corporations 1 2 C. Government Departments 1 2
525 In the last three years regarding government and state corporations tendering processes,
how frequently have the following practices occurred? (CIRCLE AS APPROPRIATE FOR EACH PRACTICE)
Practice VERY FREQUENTLY
FREQUENTLY RARELY VERY RARELY
01. Bids rigging 1 2 3 4
02. Qualified bidder being disqualified at pre-qualification stage due to bribery
1 2 3 4
03. Adjusting specifications in the interest of one company
1 2 3 4
04. Leakage of clients budget at a tender stage to bidders
1 2 3 4
05. Modifying the contract terms during the implementation stage
1 2 3 4
06. Tender process being corrupted by external pressure
1 2 3 4
07. Bidders agree with each other on a “losers’ fee
1 2 3 4
08. Collusion by suppliers to fix the minimum price
1 2 3 4
09. Unjustified complaints 1 2 3 4 526 When firms in your industry do business with the government, what proportion (%) of
procurement contracts involve any unofficial payment? _______% of procurement. 527 How much of the contract value must they offer in additional or unofficial payments to
secure the contract? ________% of the contract value.

72
528 How important are the following factors for enterprises to win government procurement
contract?
CRITERIA VERY IMPORTANT
SOMEWHAT IMPORTANT
UNIMPORTANT
01. Qualification/competitiveness 1 2 3 02. Connections 1 2 3 03. Making unofficial payments 1 2 3
PART 6. CORRUPTION IN THE PUBLIC SECTOR 601 In order of ranking what are the three main causes of corruption in the public sector?
1. ______________________________________________ 2. ______________________________________________ 3. ______________________________________________
602 How common is corruption in the public sector? (FILL IN BOX)
NON EXISTENT 1 RARE 2 SOMETIMES 3 COMMON 4 EXTREMELY COMMON 5 DO NOT KNOW 6
603. To what extent do you agree with the following statements (CIRCLE AS APPROPRIATE)?
VERY FREQUENTLY
FREQUENTLY RARELY VERY RARELY
01. If a firm pays the required additional payment to a particular official, another government official will subsequently require and additional payment for the same service
1
2
3
4
02. If a firm pays the required “additional payments”, the service is usually also delivered
1
2
3
4
03. If a government agent acts against the rules I can usually go to another official or to his supervisor and get the correct treatment without recourse to unofficial payments
1
2
3
4

73
604. Please, compare the levels of corruption in 2005 with today (2008) (CIRCLE AS APPROPRIATE):
MUCH WORSE WORSE BETTER MUCH BETTER NOW 1 2 3 4
605. How many companies give bribes to win public sector contracts (CIRCLE AS APPPROPRIATE)?
ALMOST ALL COMPANIES
MOST COMPANIES
A FEW COMPANIES
NONE OF THE COMPANIES DON’T KNOW
2005 1 2 3 4 5
NOW 1
2
3
4
5
606. What occurs in the majority of cases where someone makes unofficial payments to a public official? (FILL IN BOX)
A GOVERNMENT AGENT ASKS FOR A PAYMENT 1 THE BUSINESSMAN OFFERS PAYMENT OF HIS OWN ACCORD 2 IT IS KNOWN BEFOREHAND HOW TO PAY AND HOW MUCH TO PAY, SO IT IS NOT DISCUSSED 3 THERE ARE BROKERS WHO FACILITATE THE PROCESS 4
607. To what extent have the following forms of corruption affected your business? (CIRCLE AS APPROPRIATE FOR EACH OBSTACLE)
OBSTACLE NO OBSTACLE
MINOR OBSTACLE
MODERATE OBSTACLE
MAJOR OBSTACLE
01. Sale of parliamentary votes on laws to private interests
1
2
3
4
02. Sale of presidential decrees to private interest
1
2
3
4
03. Central Bank mishandling of funds 1 2 3 4 04. Sale of court decisions in criminal cases
1
2
3
4 05. Sale of court decisions in arbitration
cases
1
2
3
4 06. Contributions paid by private interests to
political parties & election campaigns
1
2
3
4 07. Patronage – public officials hiring their
friends & relatives to official positions
1
2
3
4 08. Bribes paid to public officials to avoid
taxes & regulations.
1
2
3
4

74
608. Please indicate how frequently the state intervenes in the below stated aspects of your firm: (CIRCLE AS APPROPRIATE)
ALWAYS SOMETIMES NEVER DON’T KNOW
01. Investment 1 2 3 4 02. Employment 1 2 3 4 03. Sales 1 2 3 4 04. Prices 1 2 3 4 05. Mergers 1 2 3 4 06. Dividends 1 2 3 4 07. Wages 1 2 3 4
609. In which of the following transactions has your company been asked for a bribe by anyone in government in the past? (CIRCLE AS APPROPRIATE FOR EACH TRANSACTION)
2004 2005 2006 2007 2008 None01. Local government permits 1 2 3 4 5 6 02. Payment of taxes 1 2 3 4 5 6 03. Clearance of goods from the ports 1 2 3 4 5 6 04. Health inspection 1 2 3 4 5 6 05. Water supply 1 2 3 4 5 6 06. Power supply 1 2 3 4 5 6 07. Judicial issues 1 2 3 4 5 6 08. Passing of bills in parliament 1 2 3 4 5 6 09. Others (SPECIFY) 1 2 3 4 5 6
610. Please tell me how effective the following are in combating corruption in Tanzania (CIRCLE AS APPROPRIATE FOR EACH INSTITUTION). Institutions VERY
EFFECTIVE EFFECTIVE INEFFECTIVE VERY
INEFFECTIVE 01. Courts 1 2 3 4 02. Attorney General 1 2 3 4 03. Police 1 2 3 4 04. Media 1 2 3 4 05. Faith-Based organizations 1 2 3 4 06. Non government organizations 1 2 3 4 07. Development Partners 1 2 3 4 08. Prevention and Combating Corruption Bureau (PCCB) 1 2 3 4
09.Parliament 1 2 3 4 10. Ethics Commission 1 2 3 4 11. Legal and Human Rights Commission 1 2 3 4

75
12. Permanent Commission of Inquiry 1 2 3 4
13. Public Accounts Committee 1 2 3 4 14. Ministry of Justice and Constitutional Affairs 1 2 3 4
15. Others (SPECIFY) 1 2 3 4 PART 7. CORRUPTION IN THE PRIVATE SECTOR 701. To what extent are the following constraints of financing an obstacle to
your firm’s financing needs? (CIRCLE AS APPROPRIATE FOR EACH OBSTACLE)
Obstacle NO
OBSTACLE MINOR OBSTACLE
MODERATE OBSTACLE
MAJOR OBSTACLE
01. High interest rates 1 2 3 4 02. Lack of access to long
term loans
1
2
3
4 03. Collateral requirements 1 2 3 4 04. Bank paperwork 1 2 3 4 05. Inadequate credit
information
1
2
3
4 06. Special connections 1 2 3 4 07. Banks lack money to lend
1
2
3
4 08. Lack of access to
specialized export finance
1
2
3
4 09. Lack of access to non-
bank equity
1
2
3
4 10. Lack of access to lease
finance
1
2
3
4 11. Lack of access to foreign
banks
1
2
3
4 12. Corruption of bank
officials
1
2
3
4 702. On average, what percentage of revenues do firms like yours typically pay per annum in
unofficial payments to other officials in the private sector? (FILL IN BOX)
0% 1 LESS THAN 1% 2 1 – 1.99 % 3 2 – 9.99% 4 10 – 12% 5 13 – 25% 6 OVER 25% 7

76
703. Please, compare the levels of corruption in the private sector in 2005 with today. (CIRCLE AS APPROPRIATE):
MUCH WORSE WORSE BETTER MUCH BETTER
NOW 1 2 3 4 704. Compare 2005 with now, how many companies give bribes to win private sector
contracts? (CIRCLE AS APPROPRIATE)
2005 2008 01. Almost all companies 1 1 02. Most companies 2 2 03. A few companies 3 3 04. Hardly any company 4 4 05 None of the companies 5 5
705. In your line of business, how many companies always demand and issue receipts, keep
one set of accounts, and pay taxes honestly?
ALWAYS DEMAND RECEIPTS
ALWAYS ISSUE RECEIPTS
KEEP ONE SET OF ACCOUNTS
PAYS TAXES HONESTLY
Almost all companies 1 1 1 1 Many companies 2 2 2 2 A few companies 3 3 3 3 Hardly any company 4 4 4 4
706. Which private sector industries have: (CIRCLE AS APPROPRIATE)
a. Good reputation for not engaging in corrupt practices b. Bad reputation for engaging in corrupt practices
Industry GOOD REPUTATION BAD REPUTATION
Banking finance and securities 1 2 Food and beverage production 1 2 Electronic and appliances 1 2 Manufacturing (general) 1 2 Education 1 2 Food and beverage 1 2 Medical services 1 2 Services (general) 1 2 Socially-oriented institutions 1 2 Accounting and consultancy 1 2 Automobile 1 2 Foreign companies 1 2

77
Telecommunications 1 2 Agriculture 1 2 Medical (pharmaceutical) 1 2 Courier, cargo & handling 1 2 Media and publishing 1 2 Oil and gas 1 2 Real estate 1 2 Brokerage 1 2 Transport 1 2 Contractors 1 2 Construction 1 2 Mining and quarrying 1 2 Furniture 1 2 Industrial (general) 1 2 Insurance 1 2 Manufacturing (chemical) 1 2 Manufacturing (consumer goods) 1 2 Retailing and merchandising 1 2 Services (hotel) 1 2 Logging and lumber 1 2 Utilities (power and water) 1 2 Transportation 1 2 None 1 2
PART 8: ANTI-CORRUPTION STRATEGIES 801 If corruption in the public sector in Tanzania were to be reduced by half, what would be the expected change in your company’s net income? (FILL IN BOX)
POSITIVE UP TO 5% 1 6 – 10% 2 11 – 20% 3 21 – 30% 4 31 – 50% 5 51 +% 6 ZERO CHANGE 7 NEGATIVE CHANGE 8 DON’T KNOW 9

78
802 How much of your company’s net income would you be willing to pay to fund a Programme that would drastically reduce public sector corruption? (FILL IN BOX)
0% 1 Less than 1% 2 1 – 2.99% 3 3 – 5.99% 4 6 – 9.99% 5 10% and over 6
803 Is your company interested in the following initiatives to help combat corruption?
DEFINITELY
INTERESTED
PROBABLY
INTERESTED
NOT
INTERESTED AT
ALL
a. Donating funds 1 2 3 b. Volunteering staff to join a government project monitoring group on company time
1
2
3
c. Paying for expenses 1 2 3 d. Volunteering staff members to join a government agency’s tender committee on company time
1
2
3
804 Please state five government projects that your company would be interested to monitor:
1. _______________________________ 2. _______________________________ 3. _______________________________ 4. _______________________________ 5. _______________________________
805 Please indicate government agencies whose tender committees your company would be
interested in joining:
i. ______________________________________ ii. ______________________________________
iii. ______________________________________ iv. ______________________________________ v. ______________________________________
806 Any comments/views on the fight against corruption in Tanzania?
________________________________________________________________________________________________________________________________________________

79
________________________________________________________________________________________________________________________________________________
THANK YOU FOR YOUR COOPERATION. Finish time (adopt 12 hour system)
INTERVIEWER’S COMMENTS 1. How did you find the interview, was it positive or negative? CIRCLE AS
APPROPRIATE
VERY POSITIVE 1 SOMEHOW POSITIVE 2 NEGATIVE 3
2. How did you find the respondent? Do you think he/she was sincere or what? CIRCLE AS APPROPRIATE.
VERY SINCERE 1 SOMEHOW SINCERE 2 NOT SINCERE 3
3. Any other comments? ____________________________________________________________________________________________________________________________________________________________________________________________________________________________________________________________________________________________________________
SUPERVISOR’S COMMENTS
____________________________________________________________________________________________________________________________________________________________________________________________________________