target uncertainty mediates sensorimotor error correction
TRANSCRIPT

RESEARCH ARTICLE
Target Uncertainty Mediates SensorimotorError CorrectionLuigi Acerbi1,2¤*, Sethu Vijayakumar1, Daniel M. Wolpert3
1 Institute of Perception, Action and Behaviour, School of Informatics, University of Edinburgh, Edinburgh,United Kingdom, 2 Doctoral Training Centre in Neuroinformatics and Computational Neuroscience, School ofInformatics, University of Edinburgh, Edinburgh, United Kingdom, 3 Computational and Biological LearningLab, Department of Engineering, University of Cambridge, Cambridge, United Kingdom
¤ Current address: Center for Neural Science, New York University, New York, NY, United States of America* [email protected]
Abstract
Human movements are prone to errors that arise from inaccuracies in both our perceptual
processing and execution of motor commands. We can reduce such errors by both improv-
ing our estimates of the state of the world and through online error correction of the ongoing
action. Two prominent frameworks that explain how humans solve these problems are
Bayesian estimation and stochastic optimal feedback control. Here we examine the interac-
tion between estimation and control by asking if uncertainty in estimates affects how sub-
jects correct for errors that may arise during the movement. Unbeknownst to participants,
we randomly shifted the visual feedback of their finger position as they reached to indicate
the center of mass of an object. Even though participants were given ample time to compen-
sate for this perturbation, they only fully corrected for the induced error on trials with low
uncertainty about center of mass, with correction only partial in trials involving more uncer-
tainty. The analysis of subjects’ scores revealed that participants corrected for errors just
enough to avoid significant decrease in their overall scores, in agreement with the minimal
intervention principle of optimal feedback control. We explain this behavior with a term in the
loss function that accounts for the additional effort of adjusting one’s response. By suggest-
ing that subjects’ decision uncertainty, as reflected in their posterior distribution, is a major
factor in determining how their sensorimotor system responds to error, our findings support
theoretical models in which the decision making and control processes are fully integrated.
Introduction
Sensorimotor tasks typically involve both estimating the state of the world (e.g., target andlimb positions) and controlling actions so as to achieve goals. Two major frameworks, Bayes-ian estimation and stochastic optimal feedback control (OFC), have emerged to explain howthe sensorimotor system estimates uncertain states and controls its actions. Together theseframeworks have provided a normative account of human motor coordination which is ableto account for a range of behavioral phenomena, including how humans correct for
PLOS ONE | DOI:10.1371/journal.pone.0170466 January 27, 2017 1 / 21
a1111111111a1111111111a1111111111a1111111111a1111111111
OPENACCESS
Citation: Acerbi L, Vijayakumar S, Wolpert DM(2017) Target Uncertainty Mediates SensorimotorError Correction. PLoS ONE 12(1): e0170466.doi:10.1371/journal.pone.0170466
Editor: Gavin Buckingham, University of Exeter,UNITED KINGDOM
Received: May 4, 2016
Accepted: January 5, 2017
Published: January 27, 2017
Copyright: © 2017 Acerbi et al. This is an openaccess article distributed under the terms of theCreative Commons Attribution License, whichpermits unrestricted use, distribution, andreproduction in any medium, provided the originalauthor and source are credited.
Data Availability Statement: All relevant data arewithin the paper and its Supporting Informationfiles.
Funding: This work was supported in part bygrants EP/F500385/1 and BB/F529254/1 for theUniversity of Edinburgh School of InformaticsDoctoral Training Centre in Neuroinformatics andComputational Neuroscience from the UKEngineering and Physical Sciences ResearchCouncil (EPSRC), UK Biotechnology and BiologicalSciences Research Council (BBSRC), and the UKMedical Research Council (MRC) to L. Acerbi. Thiswork was also supported by the Wellcome Trust,

perturbations of various kind in fast directed movements. Here we will investigate the relationbetween estimation and online control.
Estimation is a nontrivial task due to sensory noise [1] and the ambiguity of the stimuli [2].Optimal estimates need to take into account the statistics of the stimuli, the currently availableinformation, and the cost associated with errors in the estimate [3, 4]. Humans have beenshown to combine prior information with sensory data in a manner broadly consistent withBayesian integration in a variety of sensorimotor tasks, such as reaching [5], interval timing [6,7], pointing to hidden targets [8–10], speed estimation [11, 12], orientation estimation [13],and motion estimation [14]. Humans are also sensitive to the reward/loss structure imposedby the task [15]. Within the framework of Bayesian Decision Theory (BDT), this means thatprobabilistic ‘posterior’ estimates are combined with a cost function so as to maximize theexpected gain [16]. Estimation performance compatible with BDT, with an explicitly imposedloss function, has been observed, for example, in visual ‘offset’ estimation [17], orientation esti-mation [18], motor planning [19], and sensorimotor timing [7]. These studies suggest thatpeople keep track of the uncertainty, and possibly build a full probabilistic representation [20],of perceptual and sensorimotor variables of interest, and use it to compute optimal estimates.
Optimal feedback control (OFC) is a prominent theory of motor control whereby optimalfeedback gains are computed by minimizing the cost of movement over the space of all possi-ble feedback control strategies [21–23]. The ability of the sensorimotor system to make onlinecorrections in OFC is crucial in the presence of errors that can arise from both the inaccuraciesin internal models that are involved in generating the commands [24, 25] and from the noiseand variability inherent in sensory inputs and motor outputs [1, 26]. The cost function in OFCtakes into account various factors, with a trade-off between task goals (accuracy) and effort(energy, movement time, computation); see, e.g., [27]. A prediction of OFC is the minimalintervention principle, according to which errors are corrected and movement variability isminimized only along task-relevant dimensions [21]. OFC also suggests how the motor systemshould react to perturbations throughout the movement. For example, for fast directed reach-ing, late perturbations afford a lesser correction gain due to a trade-off between accuracy andstability [28]. A few studies have investigated online control of movement in the presence ofuncertain targets, finding agreement with the optimal solution given by a Kalman filter, whichdescribes iterative Bayesian integration of sensory information according to its reliability [29–31]. Recent work on the interaction between uncertainty and control has also found thathuman sensorimotor behavior exhibits risk-sensitivity, that is sensitivity to the uncertainty inthe reward [32, 33], which may stem from target variability [34]. In sum, there are both theo-retical and empirical reasons to suggest that uncertainty in the estimate may interfere with theway in which humans correct online for their sensorimotor errors.
Online error correction during reaching has typically been studied by observing how sub-jects react to either mechanical perturbations or explicit or subliminal alterations of visualfeedback of the hand (e.g., [35, 36]) or of the target (see [37] for a review). Measured correctiongains have been shown to change across the movement [38] and according to task demands, inagreement with OFC [28]. Also, as mentioned before, subjects do not correct indiscriminatelyfor all perturbations, but mostly only for those along task-relevant dimensions [21]. For exam-ple, a recent study has shown that subjects used a flexible control strategy that adapted to taskdemands (target shape) according to the minimal intervention principle on a trial-by-trialbasis [39]. These studies, however, mostly examine feedback control in the presence of well-defined, visible targets and with fast movements (duration under 1 second). Here we investi-gate the relation between estimation and control, by asking if uncertainty in the estimationinfluences the process of online error correction even when sufficient time is available to fullycorrect for any errors, here represented by a late visual perturbation.
Target Uncertainty Mediates Sensorimotor Error Correction
PLOS ONE | DOI:10.1371/journal.pone.0170466 January 27, 2017 2 / 21
the Human Frontiers Science Program, and theRoyal Society Noreen Murray Professorship inNeurobiology (D. M. Wolpert). S. Vijayakumar issupported through grants from MicrosoftResearch, Royal Academy of Engineering and EUFP7 programs. The work has made use ofresources provided by the Edinburgh Compute andData Facility, which has support from the eDIKTinitiative. The funders had no role in study design,data collection and analysis, decision to publish, orpreparation of the manuscript.
Competing Interests: I have read the journal’spolicy and the authors of this manuscript have thefollowing competing interests: SV received fundingfrom Microsoft Research as Microsoft SeniorResearch Fellow in Learning Robotics. This doesnot alter our adherence to PLOS ONE policies onsharing data and materials.
In our experiment, subjects performed a center of mass estimation task in which they werepresented with a visual dumbbell (a bar with disks on each end) and were required to placetheir finger on the bar to balance the dumbbell. The task was designed so that the estimationwould have low variability on some trials (same size disks requiring a simple line bisection tobalance) or high variability (unequal sized disks). During the reaching movement to indicatethe balance point the location of the finger was occluded and on some trials, unbeknownst toparticipants, when the finger reappeared its position had been visually shifted so that we couldthen examine the extent to which subjects corrected for the shift.
We can consider three scenarios. If subjects estimate the center of mass position as a pointestimate and then simply report this with a reach, then we would expect that they should cor-rect for the entire perturbation to be as accurate as possible—or, if there is a cost of correction,they should correct just as much for the high and low uncertainty conditions. If subjects repre-sent the full posterior of the position but have no cost on corrections then we would expectthat they should correct for the entire perturbation to be as accurate as possible. However, ifsubjects represent their uncertainty in the center of mass location, as reflected in their poste-rior distribution, they may be less willing to correct in the high-uncertainty condition as thecost of correction (e.g., energy, movement time, computation) may outweigh the potentialincreases in accuracy that can be achieved through correction.
Even though participants were given enough time to compensate for the perturbation, theyonly fully corrected for the induced error on trials with low uncertainty about target locationand corrected partially in conditions with more uncertainty (where partial correction was justenough to make their performance practically indistinguishable from the unperturbed trials).Our findings suggest that subjects’ decision uncertainty, as reflected in the width of the poste-rior, is a factor in determining how their sensorimotor system responds to errors, providingnew evidence for the link between decision making and control processes.
Materials and Methods
Participants
Sixteen naïve subjects (8 male and 8 female; age range 19–27 years) participated in the study.All participants were right-handed [40], with normal or corrected-to-normal vision andreported no neurological disorder. The Cambridge Psychology Research Ethics Committeeapproved the experimental procedures and all subjects gave written informed consent.
Behavioral task
Subjects performed a center of mass estimation task, designed to probe subject’s behavior in anatural sensorimotor task. We used an Optotrak 3020 (Northern Digital Inc, Ontario, Canada)to track the tip of a subject’s right index finger at 500 Hz. The visual image from a LCD moni-tor (Apple Cinema HD, 64 cm × 40 cm, 60 Hz refresh rate) was projected into the plane of thehand via a mirror that prevented the subjects from seeing their arm (Fig 1A). The workspaceorigin, coordinates (0, 0), was*20 cm in front of the subject’s torso in the mid-sagittal plane,with positive axes towards the right (‘horizontal’ x axis) and away from the subject (‘vertical’ yaxis). The workspace showed a home position (1.5 cm radius circle) at the origin and a cursor(0.25 cm radius circle) could be displayed that tracked the finger position.
On each trial a virtual object consisting of two filled circles (disks) and a thin horizontalline (target line) connecting the centers of the two disks [41] was displayed on the screen (Fig1B). The centers of the disks were ℓ = 24 cm apart (length of the target line) and at vertical posi-tion y = 20 cm. To prevent subjects from responding to a stereotypical location in the work-space, on each trial the object was horizontally displaced with a uniformly random jitter*
Target Uncertainty Mediates Sensorimotor Error Correction
PLOS ONE | DOI:10.1371/journal.pone.0170466 January 27, 2017 3 / 21

[−3, 3] cm from the center of the screen. The radius of one of the disks was drawn from a log-normal distribution with mean log 1 cm and SD 0.1 in log space. The radius of the other diskwas chosen so that on 1/3 of the trials the disks were of equal size, making the task equivalentto a simple line bisection, and on 2/3 of the trials the ratio of the disk radii was drawn from alog-normal distribution with mean log 1.5 and SD 0.1 in log space, leading to a trimodal distri-bution of center of mass locations (Fig 1C). The bulk of the distribution over locations was far(�2 cm) from the largest disks’ edges, so as to avoid edge effects [41]. The position (left orright) of the larger disk in unequal-size trials was chosen randomly and counterbalancedwithin each experimental block. We expected that the uncertainty in the center of mass loca-tion would be low for the equal-disk trials (‘Low-uncertainty’), when the task was equivalent toline bisection, but would be high for the unequal-disk trials (‘High-uncertainty’) due to boththe spread of the experimental distribution and the nonlinear mapping between the disks’ratio and center of mass, see below.
Fig 1. Experimental setup. A: Subjects wore an Optotrak marker on the tip of their right index finger. Thevisual scene from a CRT monitor, including a virtual cursor that tracked the finger position, was projected intothe plane of the hand via a mirror. B: The screen showed a home position at the bottom (grey circle), thecursor (red circle), here at the start of a trial, and the object at top (green dumbbell). The task consisted oflocating the center of mass of the object, here indicated by the dashed line. Visual feedback of the cursor wasremoved in the region between the home position and the target line (here shaded for visualization purposes).C: The two disks were separated by 24 cm and, depending on the disks size ratio, the target (center of mass)was either exactly halfway between the two disks (p = 1/3; low uncertainty; blue distribution) or to the right(p = 1/3) or left (p = 1/3) of the midpoint (high uncertainty; red distributions), leading to a trimodal distribution ofcenter of mass.
doi:10.1371/journal.pone.0170466.g001
Target Uncertainty Mediates Sensorimotor Error Correction
PLOS ONE | DOI:10.1371/journal.pone.0170466 January 27, 2017 4 / 21

After a ‘go’ tone, participants were required to reach from the home position to the centerof mass of the disks (the target) on the target line, thereby balancing the object on their finger.Subjects were explicitly told in the instructions that the circles were to be interpreted as disksin the center of mass estimation. Importantly, during the reaching movement, visual feedbackof the cursor was removed in the region y 2 [2, 19] cm (shaded area in Fig 1B). Subjects weregiven 1.5 s to arrive in the proximity of the target line (y> 19.5 cm). After reaching the targetline, subjects were allowed 3 seconds to adjust their endpoint position to correct for any errorsthat might have arisen during the movement when the cursor was hidden. The remaining timefor adjustment was indicated by a pie-chart animation of the cursor, which gradually turnedfrom red to yellow. The cursor’s horizontal position at the end of the adjustment phase consti-tuted the subject’s response for that trial. If participants were still moving at the end of theadjustment phase (velocity of the finger greater than 0.5 cm/s), the trial was terminated withan error message. Such missed trials were presented again later during the session.
Experimental sessions
Participants performed a preliminary training session (120 trials) in which they received per-formance feedback at the end of each trial. Performance feedback consisted of displaying thecorrect location of the center of mass, an integer score and, if the error was greater than 1 cm,a tilted dumbbell in the appropriate direction. The score depended on the (horizontal) distanceof the cursor from the center of mass, Δs, according to a squared exponential formula:
ScoreÖDsÜ à Round 10 � exp � Ds2
2s2score
⇢ �✓ ◆; Ö1Ü
where σscore is the score length scale and Round(z) denotes the value of z rounded to the near-est integer. We chose the numerical constants in Eq (1) (σScore⇡ 0.41 cm) such that the scorehad a maximum of 10 and was nonzero up to 1 cm away from the center of mass. A new trialstarted 500 ms after the subject had returned to the home position.
Subjects then performed a test session (576 trials) which included standard trials (192 trials)identical to the training session, and ‘perturbation’ trials in which, unbeknownst to the sub-jects, the visual feedback of the cursor was displaced horizontally from the finger when the cur-sor reappeared at the end of the movement (y> 19 cm), near the target line. Cursordisplacement could either be small (drawn from a Gaussian distribution with mean ±0.5 cmand SD 0.2 cm; 192 trials), or large (mean ±1.5 cm and SD 0.2 cm; 192 trials). To avoid overlapbetween distinct perturbation levels, the Gaussian distributions were truncated at 2.5 SDs (0.5cm away from the mean). All trials were presented in a pseudorandom order and left and rightperturbations were counterbalanced within the session. To keep subjects motivated through-out the test session while minimizing the chances that subjects would either adapt their behav-ior or become aware of the shifts, we only provided participants with performance feedbackon unperturbed trials [5]. We also provided the sum of the scores for all trials in blocks of 36trials [17]. All participants answered a short debriefing questionnaire at the end of the session,the results of which showed that they were unaware of the perturbations or of any other differ-ence between trials with or without performance feedback (see S1 Appendix for details).
Data analysis
For all analyses the criterion for statistical significance was p< .05, and we report uncorrectedp-values. Even after applying a conservative Bonferroni correction for multiple comparisonswith m = 20 (for the about twenty different analyses we conducted) all of our main findings
Target Uncertainty Mediates Sensorimotor Error Correction
PLOS ONE | DOI:10.1371/journal.pone.0170466 January 27, 2017 5 / 21

remain statistically significant. Unless specified otherwise, summary statistics are reported inthe text as mean ± SE between subjects.
Trial response data
For each trial, we recorded the final horizontal position r of the visual cursor, the horizontalposition of the hidden cursor at the time of exiting the no visual feedback zone xexit, and theeffective adjustment time (time before the subject stopped moving during the adjustmentphase). We computed the response error Δs as the signed difference between the final positionof the visual cursor and position of the center of mass of the current stimulus.
Variation of mean residual error and SD of the error
We analyzed how the mean residual error (or ‘bias’) and SD of the error depended on the classof stimuli presented (Low-uncertainty and High-uncertainty) and on the mean perturbationlevel (−1.5, −0.5, 0, 0.5, 1.5). For the High-uncertainty trials we had counterbalanced whetherthe larger disk was on the right or left. An examination of the mean residual error and SD ofthe error with factor of side (Left, Right) and perturbation mean level showed no significantdifference and we therefore pooled data from Left trials with Right trials.
Statistical differences between conditions in these analyses were assessed using repeated-measures ANOVA (rm-ANOVA) with Greenhouse-Geisser correction of the degrees of free-dom in order to account for deviations from sphericity [42]. A logarithmic transformation wasapplied to the SDs before performing rm-ANOVA, in order to improve normality of the data(results were qualitatively similar for non-transformed data). We report effect sizes as partialeta squared, denoted with Z2
p.
Slope of the mean residual error
For each subject, we performed linear regression of the mean residual error as a function ofperturbation size (a continuous variable from −2 to 2 cm) for the Low and High uncertaintyconditions. The slope of the regression fit is a measure of the fraction of the applied perturba-tion that was not corrected for. In the plots, we remove the mean residual error for the 0 per-turbation condition from each subject’s data to allow a direct comparison between subjects;this has no effect on the estimation of the slope. The difference in slope between conditionswas assessed with a paired Student’s t-test on the individual slope coefficients.
Observer model
We built a Bayesian observer model to investigate whether our subjects’ correction biasescould be explained as the interaction of probabilistic inference and the correction cost. Inorder to account for the residual errors (lack of correction) in the perturbation condition, weintroduced a modification to the structure of the loss function that takes effort into account. Asdescribed below, subjects’ datasets were fit individually and model fits were averaged to obtainthe group prediction. To limit model complexity and avoid overfitting, some model parame-ters were either estimated from the individual training datasets or fixed to theoretically moti-vated values.
Perception stage
We assume that the observer estimates the log ratio of the radii of the two disks, whose truevalue is ρ = log(r2/r1), where ri with i = 1, 2 is the radius of the two disks (left and right) pre-sented on a trial. This logarithmic representation was chosen as it naturally embodies Weber’s
Target Uncertainty Mediates Sensorimotor Error Correction
PLOS ONE | DOI:10.1371/journal.pone.0170466 January 27, 2017 6 / 21
law. It also unifies different possible transformations of radius to weight for each disk that thesubject might use. For example if subjects use the radius to calculate the area or volume (asthough the object was a sphere) then the log ratio can be simply expressed as log Ör2
2=r21Ü à 2r
and log Ör32=r3
1Ü à 3r, respectively.
In the estimation process, the true ratio is corrupted by normally distributed noise withmagnitude σρ in log space, which yields a noisy measurement ρm. The parameter σρ representsboth log-normally distributed sensory noise in estimating the radii of the disks and additionalindependent sources of error in computing the ratio (see Discussion). The conditional mea-surement probability takes the form:
pmeasÖrmjrÜ à N Örmjr; s2rÜ; Ö2Ü
whereN Öxjm; s2Ü is a normal distribution with mean μ and variance σ2.The experimental distribution of log ratios is a mixture of three components: two Gaussians
centered at ±log 1.5⇡ ±0.405 with SD 0.1 and a delta function at ρ = 0 (Fig 1B). For simplicity,we assume the observer’s prior in log-ratios space, qprior(s), corresponds to the experimentaldistribution:
qpriorÖrÜ à1
3
X3
ià1
N rjmÖiÜprior; sÖiÜprior
2⇣ ⌘
; Ö3Ü
with μprior = (−log 1.5, 0, log 1.5) and σprior = (0.1, 0, 0.1), using the formal definitionN Öxjm; 0Ü ⌘ dÖx � mÜ.
Combining Eqs (2) and (3), after some algebraic manipulations, the posterior can beexpressed as a mixture of Gaussians [10]:
qpostÖrjrmÜ à1
Z
X3
ià1
ZÖiÜN r���mÖiÜpost; s
ÖiÜpost
2⇣ ⌘
; Ö4Ü
where the normalization factor Z, the posterior mixing weights, means, and variances have alla closed-form expression (see S1 Appendix).
The observer uses the inferred values of ρ to compute the location of the center of mass ofthe two-disk object (here measured with respect to the midpoint between the two disks). Wedenote with fD(ρ) the generally nonlinear mapping that identifies the location of the center ofmass s of two D-dimensional spheres with radii of log ratio ρ (see S1 Appendix). We assumethat the observer computes the center of mass using this mapping fD with some fixed value ofD> 0, although not necessarily the correct value D = 2 for two-dimensional disks, nor werestrict D to be an integer. Knowing the expression for fD(ρ), we can compute the posterior dis-tribution of the location of the estimated center of mass, qpost(s|ρm) (see S1 Appendix for thederivation). Due to the generally nonlinear form of fD, this posterior is a mixture of non-Gauss-ian distributions. However, we find that it is well approximated by a mixture of Gaussians:
qpostÖsjrmÜ ⇡1
Z
X3
ià1
ZÖiÜN s���mÖiÜpost; s
ÖiÜpost
2⇣ ⌘
; Ö5Ü
where mÖiÜpost and sÖiÜpost are respectively the mean and SD of the mixture components of the poste-
rior (see S1 Appendix for details).
Target Uncertainty Mediates Sensorimotor Error Correction
PLOS ONE | DOI:10.1371/journal.pone.0170466 January 27, 2017 7 / 21

Decision-making stage
According to Bayesian Decision Theory (BDT), the observer chooses the final cursor positionthat minimizes his or her expected loss [16]. The typical loss functions used in perceptual andeven sensorimotor tasks take into account only the error (distance between response and tar-get). However, although the explicit goal of our task consists of minimizing endpoint error,subjects appeared to be influenced by other considerations.
We assume that the subjects’ full loss function depends on an error-dependent cost term,LerrÖr � sÜ, which assesses the deviation of the response (r) from the target (s), and a secondadjustment cost, LadjÖr � r0Ü, which expresses the cost of moving from the perturbed endpoint
position r0 (originally planned endpoint position plus perturbation b). The rationale is thatthere is an additional cost in moving from the initially planned endpoint position, possiblydue to the effort involved in an additional unplanned movement (e.g., for replanning theaction).
In a preliminary motor planning stage, the endpoint s⇤pre is chosen by minimizing the error
loss:
s⇤preÖrmÜ à arg mins
Z ‘=2
�‘=2
qpostÖsjrmÜLerrÖs � sÜds �
à arg mins�X3
ià1
ZÖiÜN ÖsjmÖiÜpost; sÖiÜpost
2 á s2errÜ
" #
;
Ö6Ü
where we assumed for the loss function a continuous approximation of the discrete scoring
system (Eq (1)), that is a (rescaled) inverted Gaussian, LerrÖs � sÜ à � expf�Ös � sÜ2=2s2errg.
In addition to being both in agreement with the reward structure of the task and a loss thatwell describes human sensorimotor behavior [43], this loss allowed us to derive an analyticsolution for the expected loss (Eq (6)). To limit model complexity, we assumed subjects con-formed to the error length scale of the performance feedback, that is σerr = σscore (Eq (1)).
After the initial movement, subjects are allowed plenty of time to adjust their endpoint posi-tion. Due to the applied perturbation b, the (average) endpoint position after movement willbe r0 ⌘ s⇤preÖrmÜ á b. We introduce, therefore, the adjustment cost in the final loss function:
LÖr; s; r0Ü à LerrÖr � sÜ á aLadjÖr � r0Ü; Ö7Ü
where α� 0 specifies the relative weight of the adjustment loss with respect to the error term.In Eq (7), r0 represents the (average) end point before adjustment and r the endpoint afteradjustment, so that the adjustment loss is a function of the distance covered in the adjustmentphase, r − r0. The key characteristic of this loss function is that for Low-uncertainty trials thefirst term can be significantly reduced by adjustments, whereas for High-uncertainty trials thereis less to be gained through adjustments (as the location of the center of mass has high variance)and the second term can become dominant leading to partial correction, with α controlling this
trade-off. The ‘optimal’ final position s⇤ that minimizes the expected loss in Eq (7) is:
s⇤Örm; r0Ü à arg mins
aLadjÖs � r0Ü áZ ‘=2
�‘=2
qpostÖsjrmÜLerrÖs � sÜds �
: Ö8Ü
For simplicity, forLadjÖs � r0Ü we also assume the shape of an inverted Gaussian loss with length
scale σadj, a free parameter of the model representing the scale of the cost of moving away fromthe originally planned target. For the chosen loss functions, Eq (8) can be further simplified (seeS1 Appendix for details), but still only admits numerical solution. In section ‘Alternative
Target Uncertainty Mediates Sensorimotor Error Correction
PLOS ONE | DOI:10.1371/journal.pone.0170466 January 27, 2017 8 / 21

observer models’, we will see how the solution of Eq (8) changes depending on the shape of theloss functions.
Full observer model
In each trial, the decision-making process is simulated in two stages. First, the observer com-putes the preliminary endpoint position s⇤preÖrmÜ for a given internal measurement ρm (Eq (6)).
For simplicity, we assume that the endpoint position is systematically altered only by the exter-nal perturbation b, so that (on average) the arrival position is r0 à s⇤preÖrmÜ á b. In the second
step, the observer adjusts his or her endpoint position, moving to the optimal target as perEq (8). Gaussian noise with variance s2
motor is added to the final choice s⇤ to simulate any resid-
ual noise in the response.According to this model, the response probability of observing response r in a trial with per-
turbation b and disks’ ratio ρ is:
Pr Örjr; b; θÜ àZ 1
�1N Örmjr; s2
rÜN Örjs⇤Örm; x⇤preÖrmÜ á bÜ;s2motorÜdrm; Ö9Ü
where we marginalized over the internal measurement ρm which is not directly accessible inour experiment, and θ = {σρ, D, α, σadj, σmotor} is the vector of model parameters.
We estimated the model parameters for each subject via maximum-likelihood (see S1Appendix for details). To limit the possibility of overfitting, the sensory variability parameterof each subject, σρ, was estimated from a separate model fit of the training datasets. Theobserver model fit to the individual test datasets had, therefore, effectively 3 free parameters:D, α and σadj representing the dimensionality of the transformation from disk radius to weight,the trade-off between error and effort and the length-scale of the loss function for adjustments,respectively. The parameter s2
motor represents the mean square of the residuals and is not typi-
cally counted as a free parameter.
Results
Human performance
Subjects found the task natural and straightforward to perform and the debriefing question-naire at the end of the session showed that they were unaware of the perturbations on the trials.On unperturbed Low-uncertainty trials they received on average 7.36 ± 0.43 points and bal-anced the object on 97.4% of trials. In contrast on High-uncertainty trials they received onaverage 3.35 ± 0.15 points and balanced the object on 60.2% of trails. Example subject trajecto-ries and velocity profiles are shown in S1 Fig.
Mean residual error and variability
We analyzed the participants’ response (visual location of cursor at the end of the adjustmentphase) as a function of trial uncertainty (Low, High) and mean perturbation level (−1.5, −0.5,0, 0.5, 1.5). To confirm that the trials with equal-sized and unequal-sized disks correspond tolow and high-uncertainty we examined the variability (SD) of subjects’ response. As expected,we found that the variability was significantly affected only by trial uncertainty (main effect:Low, High; F(1,15) = 297, p< .001, Z2
p à 0:94) with average SD of 0.40 ± 0.06 cm and
1.02 ± 0.05 cm for the Low and High-uncertainty trials, respectively. We found no significanteffect of perturbation and no interaction(p> .40 and Z2
p < 0:04 for both). This confirms that subjects were more variable in their judg-
ments of the center of mass in ‘High-uncertainty’ trials.
Target Uncertainty Mediates Sensorimotor Error Correction
PLOS ONE | DOI:10.1371/journal.pone.0170466 January 27, 2017 9 / 21

We also examined the subjects’ mean residual error (mean difference between cursor end-point and center of mass). The mean residual error was not significantly affected by trialuncertainty (main effect: Low, High; F(1,15) = 0.69, p> .40, Z2
p à 0:04) but was significantly
affected by the perturbation level (main effect: perturbation level; F(3.88,58.1) = 25.7, ✏ = 0.969,p< .001, Z2
p à 0:63) and in particular by the interaction between the two (interaction:
perturbation × uncertainty; F(3.64,54.7) = 15.1, ✏ = 0.91, p< .001, Z2p à 0:50). This suggests that
uncertainty modulates the effect of the perturbation on subjects’ biases.To assess the proportion of the perturbation which subjects corrected for, we performed a
linear regression of their mean residual error as a function of the perturbation size for Lowand High uncertainty trials (after subtracting the baseline mean residual error from unper-turbed trials, Fig 2). A slope of zero would correspond to no residual error and hence a full cor-rection, whereas a positive slope correspond to a smaller fraction of the perturbation thatsubjects correct for, with a slope of 1 corresponding to no correction at all. The regressionslopes were small (0.03 ± 0.01) for Low uncertainty trials but large (0.16 ± 0.02) for Highuncertainty trials, both significantly different than zero (t-test Low: t(15) = 3.61, p = .003,d = 0.90; High: t(15) = 8.15, p< .001, d = 2.04) and significantly different from each other(paired t-test t(15) = 6.80, p< .001, d = 1.70). These results show that subjects corrected almostentirely for the perturbation in the Low-uncertainty condition and left sizeable errors in theHigh-uncertainty trials by only correcting on average for 84% of the perturbation.
Fig 2. Mean residual error against mean perturbation size, for Low-uncertainty (blue) and High-uncertainty (red) trials. A: Group mean residual erroragainst mean perturbation size. Error bars are SEM between subjects. Fits are are linear regressions to the mean data. B: Each panel reports the meanresidual error against mean perturbation size for a single subject, for Low-uncertainty (blue) and High-uncertainty (red) trials. Error bars are SEM betweentrials. Fits are linear regressions to the individual data. For both panels each subject’s data have been shifted so as to remove the mean residual error for the 0perturbation condition for that subject.
doi:10.1371/journal.pone.0170466.g002
Target Uncertainty Mediates Sensorimotor Error Correction
PLOS ONE | DOI:10.1371/journal.pone.0170466 January 27, 2017 10 / 21
Exit position
On each trial we also recorded the hidden cursor horizontal position when it crossed the endof the no-feedback zone (y = 19 cm), before applying visual perturbations, as exit position xexit.As a sanity check, we verified that subjects’ behavior in perturbation trials before applying theperturbation was identical to no-perturbation trials. In particular, we examined the empiricaldistribution of xexit relative to the position of the center of mass for three different levels of per-turbation (-1.5, 0, 1.5) and distinct target locations (left, center, and right). The empiricalcumulative distribution functions were well overlapping, meaning that indeed there was nosystematic difference between perturbation vs. no-perturbation trials.
Then, we examined the variability (SD) of exit position to investigate subjects’ reachingbehavior. The SD of xexit was respectively 0.89 ± 0.05 cm (Low uncertainty trials) and1.70 ± 0.07 cm (High uncertainty). We found a statistically significant correlation between thetarget position and the exit position in the High uncertainty trials (considering Left and Rightseparately), with a correlation coefficient of r = .36 ± 0.02 (t-test t(15) = 15.0, p< .001, d = 3.76).Accordingly, the variability of exit position when considered with respect to target positionwas statistically significantly lower than the variability of xexit itself, although not very differentin practice (1.64 ± 0.08 cm; paired t-test t(15) = 3.8, p = .002, d = 0.96). Also, note that the vari-ability of exit position in Low and High uncertainty trials was substantially higher than the cor-responding endpoint variability (p< .001 for both). Together, these findings suggest that thesubjects’ strategy consisted of aiming at a general area depending on the target broad location(left, center, or right), and then refined their endpoint position in the adjustment phase.
Effective adjustment time
We assessed the time subjects spent in the adjustment phase before they stopped making cor-rections as a function of trial uncertainty (Low, High) and absolute perturbation size (0, 0.5,1.5). The mean effective adjustment time (1.60 ± 0.06 s) was not affected by trial uncertaintyper se (main effect: Low, High; F(1,15) = 0.2, p = .66, Z2
p à 0:01), but was significantly influenced
by perturbation size (main effect: perturbation size; F(1.93,28.9) = 20.9, ✏ = 0.96, p< .001,Z2
p à 0:58) with no interaction (interaction: uncertainty × perturbation size; F(2,30) = 0.74, ✏⇡1, p> .40, Z2
p à 0:05). On average, there was no difference in adjustment time between base-
line and small (0.5) perturbation trials (time difference 1 ± 16 ms, p = .95, d = 0.01). However,subjects spent significantly more time adjusting their endpoint position in large (1.5) perturba-tion trials than baseline trials (time difference 93 ± 14 ms, paired t-test t(15) = 6.89, p< .001,d = 1.72). Effective adjustment times were broadly scattered in the range 0–3 s and approxi-mately symmetric around the mean (skewness 0.03 ± 0.08), with no sign of an accumulationnear 3 s. We found qualitatively similar results by defining as ‘effective ajustment time’ thefraction of time that subjects spent moving in the adjustment phase, instead of the time elapsedbefore they stopped moving. Velocity profiles during the adjustment phase show that subjectsperformed a rapid, large correction for perturbations in perturbation trials, followed by occa-sional small adjustments that become less frequent with time (panel B in S1 Fig). Together,these results suggest that subjects had ample time to make the needed corrections in both Lowand High uncertainty trials.
Analysis of performance
Overall, subjects showed significant mean absolute residual errors (Fig 3A) that depended onthe uncertainty level (Low, High) and perturbation size (0, 0.5, 1.5). To determine how thesebiases affected performance, we analyzed their mean score per trial as a function of trial
Target Uncertainty Mediates Sensorimotor Error Correction
PLOS ONE | DOI:10.1371/journal.pone.0170466 January 27, 2017 11 / 21

uncertainty and perturbation size (Fig 3B). Interestingly, the mean score was significantlyinfluenced only by trial uncertainty (Low: 7.36 ± 0.38, High: 3.32 ± 0.14; main effect: F(1,15) =177, p< .001, Z2
p à 0:92), with no significant effect of perturbation size nor interaction
(p> 0.60 and Z2p < 0:03 for both). Analogous results hold if we split the High-uncertainty tri-
als in left and right, depending on their location (having, thus, three levels of trial uncertainty:High-Left, Low-Middle, High-Right), and five levels of perturbations (−1.5, −0.5, 0, 0.5, 1.5),suggesting that differences are not hidden by the pooling procedure. These findings suggestthat subjects’ partial lack of correction did not significantly affect their performance.
We compared subjects’ average score with that of optimal Bayesian observers (see Methods)which shared the same disks’ ratio estimation noise σρ as the subjects but correctly computedthe location of the center of mass (D = 2) and fully compensated for any movement error inthe adjustment phase (α = 0). The mean score expected from the ideal observer was 9.88 ± 0.12for Low uncertainty trials and 6.03 ± 0.26 for High uncertainty ones (mean ± SD computed viabootstrap). Overall, subjects’ average score was significantly lower (paired t-test p< .001 forboth conditions), with a relative efficiency of about*0.75 and*0.55 for respectively Lowand High uncertainty trials.
Our previous analysis (‘Mean residual error and variability’) showed that subjects’ correc-tive strategy differed between the two levels of uncertainty, with an ‘almost-full’ correction forLow uncertainty trial (*3% uncorrected perturbation) and a ‘partial’ correction for Highuncertainty trials (*16% uncorrected perturbation). We estimated what would have been thescore in the perturbed Low uncertainty conditions, had the participants adopted the partialamount of correction as in the High uncertainty trials. To estimate subjects’ score in this hypo-thetical case we considered their baseline, unperturbed responses and added the mean residual
Fig 3. Participants’ mean absolute residual errors and mean scores. A: Mean absolute residual error(mean ± SE across subjects; residual errors are computed after removing the residual error for the 0perturbation condition) by perturbation size (0, ±0.5, ±1.5 cm) and trial uncertainty (Low, High). These dataare the same as in Fig 2A, here shown in absolute value and aggregated by perturbation size. B: Participants’mean scores (mean ± SE between subjects) by perturbation size and trial uncertainty. Even though theresidual errors (panel A) are significantly different from zero and significantly modulated by perturbation size(p < .001) and the interaction between the uncertainty and perturbation size (p < .001), the scores (panel B)are significantly affected only by the trial uncertainty (p < .001).
doi:10.1371/journal.pone.0170466.g003
Target Uncertainty Mediates Sensorimotor Error Correction
PLOS ONE | DOI:10.1371/journal.pone.0170466 January 27, 2017 12 / 21

error from baseline, which we had previously estimated from both Low and High uncertaintytrials (corresponding respectively to almost-full and partial correction). We simulated also thealmost-full correction strategy as a control, expecting to observe no difference with baseline.The score in each trial was recomputed through Eq (1). The original mean score in the Lowuncertainty condition, without perturbation, was 7.36 ± 0.43 (see Fig 3B). As expected, hypo-thetical mean scores under the almost-full correction strategy were not significantly differentfrom baseline (7.52 ± 0.35 and 7.40 ± 0.39, respectively for small, ±0.5, and large, ±1.5, pertur-bations; main effect: perturbation size, F(1.96,29.4) = 0.88, ✏ = 0.84, p = .41, Z2
p à 0:06). On the
contrary, hypothetical mean scores under the partial correction strategy were significantly dif-ferent from baseline (6.59 ± 0.49 and 6.41 ± 0.41; main effect: perturbation size, F(1.99,29.9) =16.1, ✏⇡ 1, p< .001, Z2
p à 0:52). These numbers mean that had the participants been equally
sloppy in their correction strategy in the Low uncertainty trials as they were in the High uncer-tainty trials, the drop in score would have been statistically significant and notable (ΔScore−0.97 ± 0.18; paired t-test t(15) = −6.31, p< .001, d = 1.58). Conversely, the data show that hadthe participants been (almost) fully correcting for perturbations in the High uncertainty trialsas they were in the Low uncertainty trials, the difference in score would have been negligible(no difference in score between perturbed and unperturbed High uncertainty trials, Fig 3B).This suggests that participants’ adjustment strategy took into account task demands, even inthe absence of performance feedback in perturbation trials.
Bayesian model fit
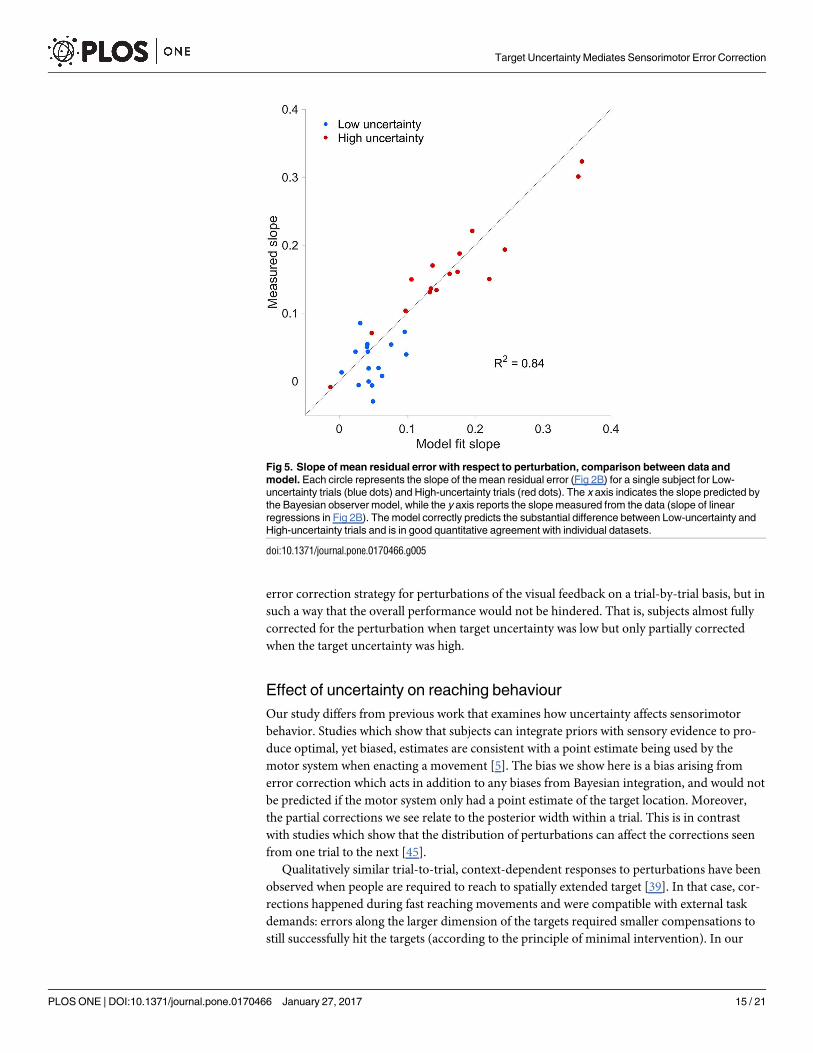
We examined subjects’ mean residual errors as a function of the actual center of mass locationrelative to the midpoint of the bar and mean perturbation level (Fig 4). Even though individualparticipants’ datasets are variable, their mean residual errors exhibited a clear nonlinear pat-tern as a function of center of mass location, partly driven by the prior over center of masslocations (Fig 1C). We fit the Bayesian observer model to the individual datasets and obtaineda good qualitative agreement with the group data (Fig 4) and quantitative agreement for theslope of mean residual error with respect to perturbation for individual subjects (R2 = 0.84; seeFig 5). Fig 4 shows that there is a separation of biases (vertical shifts) for different amount ofperturbation, indicative of the influence of target uncertainty when making corrections. More-over, we observe a regression to the means of each prior component (left and right), whichstems from the shape of the prior.
A crucial element of the model is a loss function that takes into account both a final target-ing error cost and an additional cost of moving in the adjustment phase. Due to the width ofthe posterior distribution in the High-uncertainty condition, the expected gain for an adjust-ment is smaller than in the Low-uncertainty condition and therefore subjects may be less will-ing to adjust. Our model qualitatively predicts that the lack of correction to externalperturbations should correlate with the trial uncertainty (as measured by the spread of the pos-terior distribution).
The best fit model parameters to the data were: σρ = 0.063 ± 0.004 (estimated from the train-ing session), D = 1.94 ± 0.04 (not significantly different from the correct value D = 2; t-test t(15)
= 1.51, p = .15, d = 0.38), σmotor = 0.76 ± 0.06 cm. Fits of the loss-related parameters showedthat for 3 subjects the adjustment loss was almost constant (σadj!1). For the other 13 sub-jects we found: α = 3.1 ± 0.9, σadj = 2.8 ± 0.5 cm, suggesting that the cost changed slowly, witha large length scale (at least as large as the largest perturbations of⇡ ±2 cm), and in generalthese subjects were giving a sizeable weight to the adjustment term (α> 1; t-test t(12) = 2.19,p = .049, d = 0.61). Interpreting the adjustment cost as effort, this result is in qualitative agree-ment with a previous study that found that effort had a considerabily greater relative weight in
Target Uncertainty Mediates Sensorimotor Error Correction
PLOS ONE | DOI:10.1371/journal.pone.0170466 January 27, 2017 13 / 21

the loss function than the error term (relative weight*7 for the force production taskdescribed in the study; see [44]).
Alternative observer models
We also analyzed the predictions of a number of alternative observer models: (1) a quadraticloss model for the error term in Eq (7); (2) a power-function loss model for the adjustmentloss; (3) an alternative model which explains lack of correction as a miscalibration of the per-ceived position of the cursor. Alternative models (1) and (3) are unable to account for the prin-cipal effect that we observed in the experiment, that is a modulation of the amount ofcorrection that depends on target uncertainty. We found that model (2) is empirically indistin-guishable from the inverted Gaussian adjustment loss (as previoulsy reported in another con-text [43]), meaning that the exact shape that we posited for the adjustment loss is not critical toexplain our results. In conclusion, results from these alternative observer models further vali-date our modelling choices. Detailed description and analysis of these alternative observermodels can be found in S1 Appendix.
Discussion
We used a task in which we could control the uncertainty of the location of a target (the centerof mass) and examine the extent to which subjects corrected for perturbations of their reach toindicate the target location. We found that target uncertainty significantly affected subjects’
Fig 4. Mean residual error (bias) as a function of the location of the center of mass. Data points anderror bars are mean data ± SE across subjects in the test session (binned for visualization). Colorscorrespond to different mean perturbation levels. Continuous lines are the fits of the Bayesian model to eachindividual dataset, averaged over subjects (asymmetries are due to asymmetries in the data). For both dataand model fits, distinct perturbation levels are displayed with a slight offset on the x axis for visualizationpurposes. Vertical shifts in residual error for different levels of perturbation correspond to different amounts ofaverage lack of correction (absolute residual errors shown in Fig 3A).
doi:10.1371/journal.pone.0170466.g004
Target Uncertainty Mediates Sensorimotor Error Correction
PLOS ONE | DOI:10.1371/journal.pone.0170466 January 27, 2017 14 / 21
error correction strategy for perturbations of the visual feedback on a trial-by-trial basis, but insuch a way that the overall performance would not be hindered. That is, subjects almost fullycorrected for the perturbation when target uncertainty was low but only partially correctedwhen the target uncertainty was high.
Effect of uncertainty on reaching behaviour
Our study differs from previous work that examines how uncertainty affects sensorimotorbehavior. Studies which show that subjects can integrate priors with sensory evidence to pro-duce optimal, yet biased, estimates are consistent with a point estimate being used by themotor system when enacting a movement [5]. The bias we show here is a bias arising fromerror correction which acts in addition to any biases from Bayesian integration, and would notbe predicted if the motor system only had a point estimate of the target location. Moreover,the partial corrections we see relate to the posterior width within a trial. This is in contrastwith studies which show that the distribution of perturbations can affect the corrections seenfrom one trial to the next [45].
Qualitatively similar trial-to-trial, context-dependent responses to perturbations have beenobserved when people are required to reach to spatially extended target [39]. In that case, cor-rections happened during fast reaching movements and were compatible with external taskdemands: errors along the larger dimension of the targets required smaller compensations tostill successfully hit the targets (according to the principle of minimal intervention). In our
Fig 5. Slope of mean residual error with respect to perturbation, comparison between data andmodel. Each circle represents the slope of the mean residual error (Fig 2B) for a single subject for Low-uncertainty trials (blue dots) and High-uncertainty trials (red dots). The x axis indicates the slope predicted bythe Bayesian observer model, while the y axis reports the slope measured from the data (slope of linearregressions in Fig 2B). The model correctly predicts the substantial difference between Low-uncertainty andHigh-uncertainty trials and is in good quantitative agreement with individual datasets.
doi:10.1371/journal.pone.0170466.g005
Target Uncertainty Mediates Sensorimotor Error Correction
PLOS ONE | DOI:10.1371/journal.pone.0170466 January 27, 2017 15 / 21

experiment, however, subjects were sensitive to the implicit posterior width, as opposed toexplicit visual target width. Optimal feedback control predicts that, under time constraints,subjects should fail to fully correct for errors that arise late in a movement due to additionalrequirements of endpoint stability as well as temporal limitations, even if there is no targetuncertainty [28]. However, our bias is unrelated to time constraints or requirements of stabil-ity as a 3 second adjustment time ensures that sensory delays cannot prevent corrections [29],and our data show that subjects had ample time to correct for mistakes up to their desired pre-cision. Also, note that our use of a long, fixed adjustment time window prevented decisionstrategies that are available if subjects can choose when to end the adjustment period andmove to the next trial, thereby choosing to skip the more difficult trials [46].
An interaction between target uncertainty and response bias has been previously reported inmotor planning by Grau-Moya et al. [34]. In their task subjects were required to hit a visual tar-get whose horizontal location uncertainty was manipulated. A robotic interface was used to gen-erate a resistive force that opposed motion in the outward direction with the force linearlyrelated to the horizontal location of the hand. They found that on higher uncertainty trials sub-jects chose to err on the side of the target with the lower resistive force. There are several key dif-ferences of this previous study to ours. In their study, the ‘effort’ cost is explicit and externallyimposed, hit/miss performance feedback is provided on all trials, and explicit manipulations ofthe cost are blocked by session. By contrast, here we showed an implicit, unconscious trade-offbetween accuracy and effort in online error correction during a naturalistic task. Moreover, inour study task-relevant perturbations (i.e., implicit manipulations of the cost) were unbe-knownst to the subjects and intermixed on a trial-by-trial basis, and we did not provide perfor-mance feedback on perturbed trials. Critically, their work does not address correction toongoing motor commands and shows that subjects can pre-plan a trade-off whereas we showthat the online error correction is affected by target uncertainty. Our work provides, therefore, astronger test of the interaction between uncertainty in the estimate and feedback control.
Finally, target uncertainty in our experiment emerged primarily from a complex mappingfrom stimulus to target location in a naturalistic task (calculation of the center of mass of avisual dumbbell). This type of uncertainty may differ from uncertainty arising purely fromsensory estimation noise, such as with visually blurred targets [29]. On the other hand,‘computational’ uncertainty is a common component of everyday problems the motor systemneeds to deal with, such as with object manipulation (see [47] for a review of different types ofsensorimotor uncertainty). In our modelling, for convenience we grouped all sources of noiseunder the labels of ‘sensory’ (input) and ‘motor’ (output) noise but other components maywell be present. Our analysis applies here irrespective of the exact nature of uncertainty in tar-get location.
Uncertainty and lack of correction
A somewhat surprising finding is that subjects did not fully correct for the perturbations, butin a way that did not significantly affect performance. Clearly, a null effect on score differencesmight simply be due to lack of statistical power in our analysis, but we demonstrated that hadsubjects used the same partial correction strategy in all trials, their performance would havedropped by almost one point on average. This means that subjects’ correction strategy for Lowand High uncertainty trials was well adapted to task demands.
A similar finding of partial, yet ‘optimal’, correction has been reported in a recent study byvan Dam and Ernst [48], that looked at subjects’ awareness of their own pointing errors. Par-ticipants performed a reaching movement to a one-dimensional target, and visual feedback ofboth the hand and target position was withheld after the commencement of the movement.
Target Uncertainty Mediates Sensorimotor Error Correction
PLOS ONE | DOI:10.1371/journal.pone.0170466 January 27, 2017 16 / 21

After movement termination, subjects responded in a 2AFC task whether they had landed tothe left or to the right of the target. In the condition that is most related to our work, subjectswere also allowed to correct for their natural pointing mistakes, with no time limit. Also, atthis point subjects would receive a brief visual feedback (with small or large blur) about theircurrent endpoint position. The study reports that subjects hardly corrected for their mistakes,but analysis showed that the applied correction gains were sensible (if not ‘optimal’) when tak-ing into account the information subjects had about their own pointing errors and their cur-rent endpoint position [48].
Our study differs from the work by van Dam and Ernst in several fundamental aspects.Most importantly, their work probes a form of Bayesian integration between (a) the currentknowledge of endpoint position or, equivalently, estimated distance from the target (due toproprioception and provided noisy visual feedback) and (b) the prior knowledge of the errordistribution (and target position). One of their main findings is that subjects seem to acquiremore detailed information of the endpoint position only after the end of the movement, evenfor slow reaches [48]. We showed instead that in our task the lack of correction cannot beexplained by a simple form of Bayesian integration. Even if subjects integrated visual feedbackof the cursor with (conflicting) proprioceptive information, the expected biases would notyield the observed pattern of uncertainty-dependent corrections.
The cost of effort and alternative explanations
Our data are consistent with an additional term in the loss function that can be interpreted as‘effort’ (whether energy, time or computation; see [15, 21, 44]). The exact nature of this cost isleft open, as our experiment does not allow us to pinpoint the specific cost. Our model pro-vides good fits to the subjects’ data, and, moreover, we showed that other common models ofloss used in Bayesian estimation and motor planning, which either ignore the cost of adjust-ment or use a quadratic error loss term, fail to account for the key features of our datasets.
However, our model hinges on several assumptions, and more targeted experiments maybe needed to completely rule out specific alternative explanations. For example, one assump-tion of the model is that the observer’s posterior distribution over target location is stablewithin a trial and, for instance, unaffected by the reappearance of the cursor. If subjects tookthe reappearance of the cursor as an independent piece of evidence, an incorrect belief update(e.g., via a Kalman filter [49]) might produce effects similar to those that we observe. Suchbehavior is sub-optimal and unlikely since the stimulus was always present on the screen andsubjects had plenty of time after the reappearance of the cursor to adjust their endpoint. Ourresults are also consistent with an interpetation of subjects’ behavior as a form of risk-sensitiv-ity [32, 34]. An interesting alternative hypothesis inspired by [48] is that subjects built an inter-nal expectation of their average error during the trials with performance feedback, and,therefore, were less willing to correct for large perturbations that were reputed to be unlikely.This interpretation predicts, among other things, that the length scale of the adjustment cost,σadj, should correlate with the spread of the errors made by the subject, but we did not find anyevidence for this pattern in the data.
A stronger empirical test for the interaction between effort and cost would consist of a‘Bayesian transfer’ type of task [50], in which the same observers are tested on different scoringfunctions, amounts of required effort [34], and training. In such a task, observers would notnecessarily be able to learn any arbitrary reward function, but we expect them to at least adaptto qualitative features of the provided cost, such as skewness—as found, for example, in ourprevious work on sensorimotor timing [7]. Arguably, the performance (and ‘optimal laziness’)
Target Uncertainty Mediates Sensorimotor Error Correction
PLOS ONE | DOI:10.1371/journal.pone.0170466 January 27, 2017 17 / 21

will be correlated to the amount of training and inversely related to the complexity of the pro-vided cost.
In conclusion, our results show that even for simple, naturalistic tasks such as center ofmass estimation, the inertia against additional correction can be noticeable and is significantlymodulated by trial uncertainty. At the same time, somewhat paradoxically, the effects on per-formance of this lack of correction are negligible, suggesting that subjects’ may have been ‘opti-mally lazy’ in correcting for their mistakes, according to the minimal intervention principle[21, 23], even in the absence of performance feedback. Our findings suggest that there is noclear-cut separation between the decision making and motor component of a task, since per-ceptual or cognitive uncertainty affects subsequent motor behavior beyond action initiation, asthe posterior distribution is used even in the adjustment period.
Supporting Information
S1 Fig. Trajectory and velocity profiles. Full movement trajectory (A) and velocity profiles inthe adjustment phase (B) for a representative subject, for respectively High-Left uncertanty(left), Low uncertainty (middle), and High-Right uncertainty (right) targets. Thick lines aremean trajectories and velocity profiles, thin lines are individual trials (subsampled for visuali-zation). Different colors correspond to different mean perturbation levels (we show here only-1.5, 0, and 1.5 cm). A: Full movement trajectories. For visualization, we removed from the xposition the random jitter of the dumbbell (linearly from y = 0 to y = 19 cm). B: Velocity pro-files along the x axis during the 3 s adjustment phase. Subjects quickly reacted to the perturba-tion in perturbed trials, and then performed minor adjustments.(PDF)
S1 Appendix. Additional analyses and models. Extended definitions and derivations: poste-rior over center of mass; posterior distribution of estimated center of mass; optimal target afteradjustment with inverted Gaussian loss. Model fitting. Alternative observer models: quadraticerror loss; power-law adjustment loss; miscalibrated observer model. Debriefing question-naire.(PDF)
S1 Dataset. Subjects’ datasets. MATLAB (MathWorks) file containing all sixteen subjects’datasets for training and test session.(MAT)
Acknowledgments
We thank Sae Franklin and James Ingram for technical assistance.
Author Contributions
Conceptualization: LA SV DMW.
Data curation: LA.
Formal analysis: LA.
Funding acquisition: LA SV DMW.
Investigation: LA.
Methodology: LA DMW.
Target Uncertainty Mediates Sensorimotor Error Correction
PLOS ONE | DOI:10.1371/journal.pone.0170466 January 27, 2017 18 / 21

Project administration: LA.
Resources: DMW.
Software: LA.
Supervision: SV DMW.
Validation: LA.
Visualization: LA.
Writing – original draft: LA DMW.
Writing – review & editing: LA SV DMW.
References1. Faisal AA, Selen LP, Wolpert DM. Noise in the nervous system. Nat Rev Neurosci. 2008; 9(4):292–303.
doi: 10.1038/nrn2258 PMID: 18319728
2. Kersten D, Mamassian P, Yuille A. Object perception as Bayesian inference. Annu Rev Psychol. 2004;55:271–304. doi: 10.1146/annurev.psych.55.090902.142005 PMID: 14744217
3. Simoncelli EP. Optimal estimation in sensory systems. In: Gazzaniga MS, editor. The cognitive neuro-sciences, IV edition. MIT Press; 2009. p. 525–535.
4. Ma WJ. Organizing probabilistic models of perception. Trends Cogn Sci. 2012; 16(10):511–518. doi:10.1016/j.tics.2012.08.010 PMID: 22981359
5. Kording KP, Wolpert DM. Bayesian integration in sensorimotor learning. Nature. 2004; 427(6971):244–247. doi: 10.1038/nature02169 PMID: 14724638
6. Jazayeri M, Shadlen MN. Temporal context calibrates interval timing. Nat Neurosci. 2010; 13(8):1020–1026. doi: 10.1038/nn.2590 PMID: 20581842
7. Acerbi L, Wolpert DM, Vijayakumar S. Internal representations of temporal statistics and feedback cali-brate motor-sensory interval timing. PLoS Comput Biol. 2012; 8(11):e1002771. doi: 10.1371/journal.pcbi.1002771 PMID: 23209386
8. Tassinari H, Hudson TE, Landy MS. Combining priors and noisy visual cues in a rapid pointing task. JNeurosci. 2006; 26(40):10154–10163. doi: 10.1523/JNEUROSCI.2779-06.2006 PMID: 17021171
9. Berniker M, Voss M, Kording K. Learning priors for Bayesian computations in the nervous system. PloSOne. 2010; 5(9):e12686. doi: 10.1371/journal.pone.0012686 PMID: 20844766
10. Acerbi L, Vijayakumar S, Wolpert DM. On the Origins of Suboptimality in Human Probabilistic Inference.PLoS Comput Biol. 2014; 10(6):e1003661. doi: 10.1371/journal.pcbi.1003661 PMID: 24945142
11. Weiss Y, Simoncelli EP, Adelson EH. Motion illusions as optimal percepts. Nat Neurosci. 2002; 5(6):598–604. doi: 10.1038/nn0602-858 PMID: 12021763
12. Stocker AA, Simoncelli EP. Noise characteristics and prior expectations in human visual speed percep-tion. Nat Neurosci. 2006; 9(4):578–585. doi: 10.1038/nn1669 PMID: 16547513
13. Girshick AR, Landy MS, Simoncelli EP. Cardinal rules: Visual orientation perception reflects knowledgeof environmental statistics. Nat Neurosci. 2011; 14(7):926–932. doi: 10.1038/nn.2831 PMID: 21642976
14. Chalk M, Seitz AR, Seriès P. Rapidly learned stimulus expectations alter perception of motion. J Vis.2010; 10(8):1–18. doi: 10.1167/10.8.2
15. Trommershauser J, Maloney LT, Landy MS. Statistical decision theory and the selection of rapid, goal-directed movements. J Opt Soc Am A. 2003; 20(7):1419–1433. doi: 10.1364/JOSAA.20.001419 PMID:12868646
16. Kording KP, Wolpert DM. Bayesian decision theory in sensorimotor control. Trends Cogn Sci. 2006; 10(7):319–326. doi: 10.1016/j.tics.2006.05.003 PMID: 16807063
17. Whiteley L, Sahani M. Implicit knowledge of visual uncertainty guides decisions with asymmetric out-comes. J Vis. 2008; 8(3):1–15. doi: 10.1167/8.3.2 PMID: 18484808
18. Landy MS, Goutcher R, Trommershauser J, Mamassian P. Visual estimation under risk. J Vis. 2007; 7(6):1–15. doi: 10.1167/7.6.4 PMID: 17685787
19. Seydell A, McCann BC, Trommershauser J, Knill DC. Learning stochastic reward distributions in aspeeded pointing task. J Neurosci. 2008; 28(17):4356–4367. doi: 10.1523/JNEUROSCI.0647-08.2008PMID: 18434514
Target Uncertainty Mediates Sensorimotor Error Correction
PLOS ONE | DOI:10.1371/journal.pone.0170466 January 27, 2017 19 / 21

20. Mitrovic D, Klanke S, Vijayakumar S. Adaptive optimal feedback control with learned internal dynamicsmodels. In: Sigaud O, Peters J, editors. From Motor Learning to Interaction Learning in Robots.Springer; 2010. p. 65–84.
21. Todorov E, Jordan MI. Optimal feedback control as a theory of motor coordination. Nat Neurosci. 2002;5(11):1226–1235. doi: 10.1038/nn963 PMID: 12404008
22. Scott SH. Optimal feedback control and the neural basis of volitional motor control. Nat Rev Neurosci.2004; 5(7):532–546. doi: 10.1038/nrn1427 PMID: 15208695
23. Todorov E. Optimality principles in sensorimotor control. Nat Neurosci. 2004; 7(9):907–915. doi: 10.1038/nn1309 PMID: 15332089
24. Shadmehr R, Smith MA, Krakauer JW. Error correction, sensory prediction, and adaptation in motorcontrol. Annu Rev Neurosci. 2010; 33:89–108. doi: 10.1146/annurev-neuro-060909-153135 PMID:20367317
25. Franklin DW, Wolpert DM. Computational mechanisms of sensorimotor control. Neuron. 2011; 72(3):425–442. doi: 10.1016/j.neuron.2011.10.006 PMID: 22078503
26. Mitrovic D, Klanke S, Osu R, Kawato M, Vijayakumar S. A computational model of limb impedance con-trol based on principles of internal model uncertainty. PloS One. 2010; 5(10):e13601. doi: 10.1371/journal.pone.0013601 PMID: 21049061
27. Rawlik K, Toussaint M, Vijayakumar S. On stochastic optimal control and reinforcement learning byapproximate inference. In: Rossi F, editor. Proceedings of the Twenty-Third international joint confer-ence on Artificial Intelligence. AAAI Press; 2013. p. 3052–3056.
28. Liu D, Todorov E. Evidence for the flexible sensorimotor strategies predicted by optimal feedback con-trol. J Neurosci. 2007; 27(35):9354–9368. doi: 10.1523/JNEUROSCI.1110-06.2007 PMID: 17728449
29. Izawa J, Shadmehr R. On-line processing of uncertain information in visuomotor control. J Neurosci.2008; 28(44):11360–11368. doi: 10.1523/JNEUROSCI.3063-08.2008 PMID: 18971478
30. Stevenson IH, Fernandes HL, Vilares I, Wei K, Kording KP. Bayesian integration and non-linear feed-back control in a full-body motor task. PLoS Comput Biol. 2009; 5(12):e1000629. doi: 10.1371/journal.pcbi.1000629 PMID: 20041205
31. Crevecoeur F, Scott SH. Priors engaged in long-latency responses to mechanical perturbations suggesta rapid update in state estimation. PLoS Comput Biol. 2013; 9(8):e1003177. doi: 10.1371/journal.pcbi.1003177 PMID: 23966846
32. Nagengast AJ, Braun DA, Wolpert DM. Risk-sensitive optimal feedback control accounts for sensorimo-tor behavior under uncertainty. PLoS Comput Biol. 2010; 6(7):e1000857. doi: 10.1371/journal.pcbi.1000857 PMID: 20657657
33. Braun DA, Nagengast AJ, Wolpert D. Risk-sensitivity in sensorimotor control. Front Hum Neurosci.2011; 5:1. doi: 10.3389/fnhum.2011.00001 PMID: 21283556
34. Grau-Moya J, Ortega PA, Braun DA. Risk-sensitivity in Bayesian sensorimotor integration. PLoS Com-put Biol. 2012; 8(9):e1002698. doi: 10.1371/journal.pcbi.1002698 PMID: 23028294
35. Saunders JA, Knill DC. Humans use continuous visual feedback from the hand to control fast reachingmovements. Exp Brain Res. 2003; 152(3):341–352. doi: 10.1007/s00221-003-1525-2 PMID: 12904935
36. Saunders JA, Knill DC. Visual feedback control of hand movements. J Neurosci. 2004; 24(13):3223–3234. doi: 10.1523/JNEUROSCI.4319-03.2004 PMID: 15056701
37. Sarlegna FR, Mutha PK. The influence of visual target information on the online control of movements.Vision Res. 2014;.
38. Dimitriou M, Wolpert DM, Franklin DW. The temporal evolution of feedback gains rapidly update to taskdemands. J Neurosci. 2013; 33(26):10898–10909. doi: 10.1523/JNEUROSCI.5669-12.2013 PMID:23804109
39. Knill DC, Bondada A, Chhabra M. Flexible, task-dependent use of sensory feedback to control handmovements. J Neurosci. 2011; 31(4):1219–1237. doi: 10.1523/JNEUROSCI.3522-09.2011 PMID:21273407
40. Oldfield RC. The assessment and analysis of handedness: The Edinburgh inventory. Neuropsycholo-gia. 1971; 9(1):97–113. doi: 10.1016/0028-3932(71)90067-4 PMID: 5146491
41. Friedenberg J, Liby B. Perception of two-body center of mass. Percept Psychophys. 2002; 64(4):531–539. doi: 10.3758/BF03194724 PMID: 12132756
42. Greenhouse SW, Geisser S. On methods in the analysis of profile data. Psychometrika. 1959; 24(2):95–112. doi: 10.1007/BF02289823
43. Kording KP, Wolpert DM. The loss function of sensorimotor learning. Proc Natl Acad Sci USA. 2004;101(26):9839–9842. doi: 10.1073/pnas.0308394101 PMID: 15210973
Target Uncertainty Mediates Sensorimotor Error Correction
PLOS ONE | DOI:10.1371/journal.pone.0170466 January 27, 2017 20 / 21

44. O’Sullivan I, Burdet E, Diedrichsen J. Dissociating variability and effort as determinants of coordination.PLoS Comput Biol. 2009; 5(4):e1000345. doi: 10.1371/journal.pcbi.1000345 PMID: 19360132
45. Wei K, Kording K. Uncertainty of feedback and state estimation determines the speed of motor adapta-tion. Front Comput Neurosci. 2010; 4. doi: 10.3389/fncom.2010.00011 PMID: 20485466
46. Drugowitsch J, Moreno-Bote R, Churchland AK, Shadlen MN, Pouget A. The cost of accumulating evi-dence in perceptual decision making. J Neurosci. 2012; 32(11):3612–3628. doi: 10.1523/JNEUROSCI.4010-11.2012 PMID: 22423085
47. Orban G, Wolpert DM. Representations of uncertainty in sensorimotor control. Current Opinion in Neu-robiology. 2011; 21(4):629–635. doi: 10.1016/j.conb.2011.05.026 PMID: 21689923
48. van Dam LC, Ernst MO. Knowing Each Random Error of Our Ways, but Hardly Correcting for It: AnInstance of Optimal Performance. PloS One. 2013; 8(10):e78757. doi: 10.1371/journal.pone.0078757PMID: 24205308
49. Burge J, Ernst MO, Banks MS. The statistical determinants of adaptation rate in human reaching. Jour-nal of Vision. 2008; 8(4):1–19. doi: 10.1167/8.4.20 PMID: 18484859
50. Maloney LT, Mamassian P. Bayesian decision theory as a model of human visual perception: TestingBayesian transfer. Visual Neuroscience. 2009; 26(1):147–155. doi: 10.1017/S0952523808080905PMID: 19193251
Target Uncertainty Mediates Sensorimotor Error Correction
PLOS ONE | DOI:10.1371/journal.pone.0170466 January 27, 2017 21 / 21