targeting of intervention areas to reduce reservoir ... · 2 j.e. hunink et al. flood control and...
TRANSCRIPT
1Hydrological Sciences Journal – Journal des Sciences Hydrologiques, 00 (00) 2013http://dx.doi.org/10.1080/02626667.2013.774090
Targeting of intervention areas to reduce reservoir sedimentation in theTana catchment (Kenya) using SWAT
J.E. Hunink1, I.A. Niadas2, P. Antonaropoulos2, P. Droogers3 and J. de Vente4
1FutureWater, Paseo Alfonso XIII 48, Cartagena, [email protected]&A-P Antonaropoulos and Associates SA, 57 Souidias Street, GR-10676 Athens, Greece3FutureWater, Costerweg 1V, NL-6702 AA Wageningen, The Netherlands4Centro de Edafología y Biología Aplicada del Segura (CEBAS-CSIC), E-30100 Murcia, Spain
Received 17 February 2012; accepted 8 October 2012; open for discussion until 1 October 2013
Editor Z.W. Kundzewicz; Associate editor G. Mahé
Citation Hunink, J.E., Niadas, I.A., Antonaropoulos, P., Droogers, P., and de Vente, J., 2013. Targeting of intervention areas to reducereservoir sedimentation in the Tana catchment (Kenya) using SWAT. Hydrological Sciences Journal, 58 (3), 1–15.
Abstract A measurement campaign was carried out in the Upper Tana basin (Kenya) to quantify soil erosion andreservoir sedimentation rates, including a bathymetric reservoir survey and sediment load sampling during oneyear. Then, distributed soil erosion modelling was performed to study sediment budgets throughout the basin andto evaluate the potential of upstream erosion control through vegetated contour strips and check dams. Finally, theareas where these measures would be most effective were identified and local stakeholder associations to imple-ment them were prioritized. The influence of the scale of implementation was evaluated by using the model toconsider three adoption scenarios. This study illustrates the relevance of distributed erosion models to target ero-sion control measures when sufficient information on the eroding areas is available from field surveys. Bathymetricsurveys were fundamental to validate the long-term model response, while point measurements were valuable toverify the spatial variability of model predictions.
Key words soil erosion; sediment yield; sedimentation rate; distributed model; SWAT; Kenya; erosion control; soilconservation; watershed management
Détermination des zones d’intervention pour la réduction de la sédimentation des réservoirs dubassin du Tana (Kenya) en utilisant SWATRésumé Une campagne de mesures a été réalisée dans le bassin du Haut Tana (Kenya) afin de quantifier l’érosiondes sols et les taux de sédimentation dans le réservoir, comprenant une étude bathymétrique du réservoir etl’échantillonnage des sédiments déposés pendant un an. Une modélisation distribuée de l’érosion des sols a ensuiteété réalisée pour étudier le bilan des sédiments dans le bassin et évaluer le potentiel de contrôle de l’érosion enamont, par des bandes de végétation suivant les courbes de niveau et des barrages de retenue. Nous avons enfinidentifié les zones où ces mesures seraient les plus efficaces, de même que les associations d’intervenants locauxsusceptibles de les mettre en œuvre. L’influence de la mise en œuvre a été évaluée en utilisant le modèle selon troisscénarios. Cette étude illustre la pertinence des modèles d’érosion distribués pour concevoir des mesures de luttecontre l’érosion lorsque suffisamment d’informations sur les zones érodées, provenant d’enquêtes sur le terrain,sont disponibles. Les levés bathymétriques ont été fondamentaux pour valider la réponse du modèle à long terme,tandis que les mesures ponctuelles ont été utiles pour vérifier la variabilité spatiale des prévisions du modèle.
Mots clefs érosion des sols; production de sédiments; vitesse de sédimentation; modèle distribué; SWAT, Kenya; lutte contrel’érosion; conservation des sols; gestion des bassins versants
INTRODUCTION
In many countries, sustainable use of reservoirsis seriously threatened by their declining storage
capacity due to the trapping of sediments. Thisprocess reduces and eventually eliminates the stor-age capacity required for hydropower generation,
© 2013 IAHS Press
Dow
nloa
ded
by [
Uni
vers
idad
Pol
itécn
ica
de C
arta
gena
], [
Joha
nnes
Hun
ink]
at 0
6:56
05
Mar
ch 2
013

2 J.E. Hunink et al.
flood control and water supply (Einsele and Hinderer1997, Syvitski et al. 2005, Verstraeten et al. 2006,Vanmaercke et al. 2011), yet the dependence on waterstorage in reservoirs has increased over the yearsin many basins due to population growth, socio-economic and hydrological changes and increasedirrigated agriculture (e.g. Wisser et al. 2010).
In Africa, often harsh environmental conditionsand poor land management causes substantial ero-sion rates and losses in reservoir capacity, as hasbeen observed in, or estimated for, several countries(Walling 1984, Shahin 1993, Haregeweyn et al. 2006,Boardman and Foster 2011). Agriculture in many ofthese areas strongly depends on irrigation water fromreservoirs, and several countries, including Kenya,strongly rely on hydropower for their energy supply.Therefore, land managers and policy makers look foreffective and efficient solutions to reduce reservoirsedimentation.
Former studies in the Upper Tana basin (Kenya)of erosion (Ongwenyi et al. 1993, Brown et al. 1996)and reservoir sedimentation (Wooldridge 1984) indi-cated that the reservoirs could have lost between10% and 30% of capacity in 30 years, and that the ser-vices that rely on these water storages may be threat-ened in the near future. In addition, some studies pointout that this particular part of Kenya may suffer seri-ous consequences due to climate change and that rain-fall variability will be greater in the future (Herreroet al. 2010). As these changes may further affectwater storage capacity and requirements for irriga-tion and drinking water, a study was required by thegovernment of Kenya to assess erosion and reservoirsedimentation of the Upper Tana basin under presentand possible future land-use and management condi-tions. Reduction of reservoir sedimentation requiresreduction of upstream erosion through the promo-tion of soil conservation practices and implementa-tion of hydrological control works like check damsand reforestation (e.g. Trimble 1981). However, ero-sion control measures are often poorly conceived andimplemented (Gebremedhin 2004, Oñate and Peco2005, Liniger and Critchley 2007, Boix-Fayos et al.2008), and fail to achieve the desired reductions insediment yield. One of the reasons for the low suc-cess rates is the fact that farmers, being those thathave to actually execute and maintain the adoptedmeasure, get hardly any short-term benefits from theadopted measures, and often conservation measuresare not well-adapted to local socio-economic and cul-tural conditions (Gebremedhin 2004, Oñate and Peco2005). Given the often precarious economic situation
of African land users, the long-term benefit of pre-serving soil fertility and reservoir storage capac-ity, and thus saving money for fertilizers and waterprovision, is generally not convincing enough (e.g.Ervin and Ervin 1982, Shiferaw and Holden 1998).Support to farmers to implement certain practicesshould therefore be well targeted so as to dedicatethe resources exactly to the areas where most profitcan be expected. Moreover, decisions over which mea-sures to implement where are far more effective whentaken in a well-designed participatory process withthe involvement of all relevant stakeholders (Reed2008, Schwilch et al. 2009).
For a higher success rate in the implementation oferosion control measures, information is required onwhere to optimally intervene to best dedicate effortsand resources. For this purpose, monitoring of soilerosion status and field surveys are crucial compo-nents to targeting interventions. To make assessmentsof large catchments and test the impacts of variousconservation strategies, distributed erosion modellingis needed to obtain a complete picture of the sedimentbudgets. Calibration and validation of erosion modelsrequires experimental field data and spatially dis-tributed databases of soil, topography and climateparameters with sufficiently high quality and resolu-tion (de Vente et al. 2009). Most evaluations of theimpacts of conservation measures (e.g. Bewket andSterk 2003, Van Noordwijk et al. 2004, Hengsdijket al. 2005) have focused on plot-scale effects on veg-etation, runoff, soil and nutrient loss. Much less isknown about the regional impact on the sediment bud-gets. Several studies have assessed actual sedimentbudgets at the catchment scale, stressing the impor-tance of distributed approaches (e.g. Lenhart et al.2005, Haregeweyn et al. 2013), but only a few studieson the regional impact of soil conservation measureshave been made (Bellin et al. 2009, Lesschen et al.2009, White and Arnold 2009, Nyssen et al. 2010,Tuppad et al. 2010).
Most spatially-distributed hydrological and ero-sion models require a large number of detailedspatially-distributed data on climate, soil, topogra-phy, land-use and land-cover variables. The absenceor low quality of available data often impedes the suc-cessful application of such models at the catchmentscale (Merritt et al. 2003, de Vente and Poesen 2005),although the use of satellite imagery and remote sens-ing techniques has been reported to be successfulin some cases (de Jong 1994, de Jong et al. 1999,de Vente et al. 2009). For large catchments, rela-tively simple regression models or semi-quantitative
Dow
nloa
ded
by [
Uni
vers
idad
Pol
itécn
ica
de C
arta
gena
], [
Joha
nnes
Hun
ink]
at 0
6:56
05
Mar
ch 2
013
Targeting intervention areas to reduce reservoir sedimentation using SWAT 3
expert-based models often give better results forprediction of sediment yield than more complexphysically-based models (Van Rompaey and Govers2002, Jetten et al. 2003, de Vente et al. 2008).However, many of those models do not give predic-tions of spatial patterns of soil erosion, or stronglydepend on calibration procedures, making them lesssuited for application in scenario studies (Cerdàet al. 2013).
Process-based models provide a good alternativeto explore the impacts of changes in land use andmanagement in scenario studies. While application ofmany of these models is limited by their high datarequirements, SWAT (Soil and Water AssessmentTool) is a process-based model that was successfullyapplied for large catchments, and also in data-poorregions of the world (e.g. Immerzeel and Droogers2008, Schuol et al. 2008, Betrie et al. 2011). Aftercalibration, the model can be applied at differentspatial resolutions and levels of detail, and providessemi-spatially distributed output of sources and sinksof sediment. This gives the model strong potential foruse in scenario studies of changing land-use and man-agement conditions (e.g. Tripathi et al. 2003, Mishraet al. 2007, Parajuli et al. 2008, Rostamian et al. 2008,Hunink et al. 2013).
The main objective of this paper is to demon-strate how distributed erosion modelling, togetherwith field surveys, can be an effective tool for evaluat-ing the impacts of land-use and management scenar-ios on soil and water resources, and selecting priorityareas for implementation of soil conservation mea-sures. The paper presents an assessment of the spatialpatterns of soil erosion by water and the potential oferosion control measures to reduce sedimentation ofthe reservoirs in the Upper Tana basin (Kenya) basedon a wide range of data sets and field measurements,together with the application of the SWAT model.
METHODS
Study area
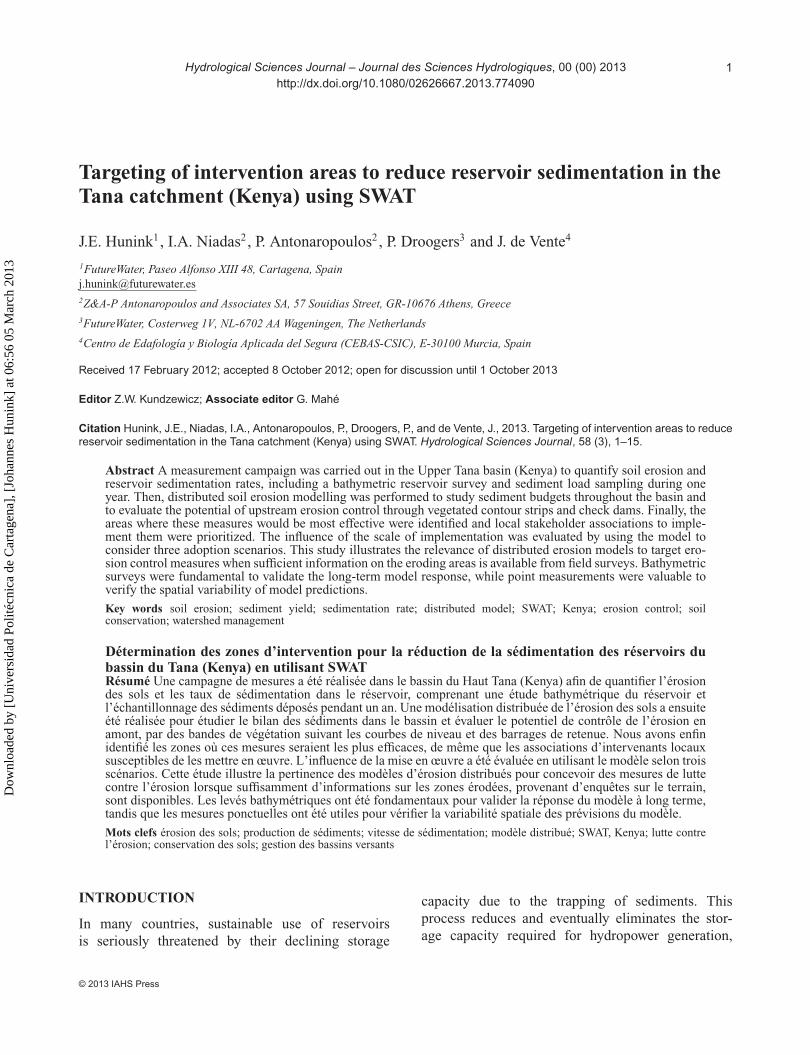
The Upper Tana basin (9500 km2) (Fig. 1) is arelatively humid basin with average annual rainfallamounts of about 2000 mm at higher altitudes, drierconditions (about 500 mm year-1) at lower eleva-tions, and annual potential evapotranspiration ratesof around 1000 mm (Jaetzold et al. 2006). Thereare two wet seasons and two dry seasons as a resultof the monsoon. Approximately half of the annualrainfall in the basin falls from mid-March to June,
Fig. 1 Location of the Upper Tana catchment.
known as the long rains. The so-called short rainsare between October and December when the areareceives approximately a third of its annual rainfall.The Upper Tana can be divided into two main geo-logical structures: volcanic rocks of the Cenozoic Eraare found in the higher mountain areas, while in thelower areas the bedrock consists mainly of metamor-phic rocks of the Mozambique belt (Veldkamp et al.2011). The soils in the mountain areas are dominatedby volcanic ash soils, while at lower elevations soilsare derived from metamorphic rocks, mainly gneiss,banded gneiss and schists, resulting in fertile claysoils as well as poorer leached clay soils (Dijkshoornet al. 2010). The lower slopes of the mountains aremainly cultivated and forested, and are highly dis-sected with steep-sided V-shaped valleys. The highermountain areas are characterized by moorland, withU-shaped and shallower valleys created by glaciations(Veldkamp et al. 2011).
During recent decades, the population in thehigher mountain areas has increased, and formerlynon-cultivated areas have been converted to agri-cultural lands. Rainfed subsistence agriculture nowconstitutes over 60% of the land use. The main rainfedcrops are maize, coffee and tea, principally cultivatedin the higher and wetter areas of the basin where croprotation is common (Muriuki and Macharia 2011).At lower altitudes, irrigated crops (flowers, fruit andvegetables) are also produced for the internationalmarket (Jaetzold et al. 2006).
Five major reservoirs were built between theyears 1968 and 1987 for hydropower, storage for irri-gation and drinking water supply, and flow regulation.
Dow
nloa
ded
by [
Uni
vers
idad
Pol
itécn
ica
de C
arta
gena
], [
Joha
nnes
Hun
ink]
at 0
6:56
05
Mar
ch 2
013
4 J.E. Hunink et al.
Two additional smaller upstream reservoirs are usedfor water supply to Nairobi city. The reservoirs guar-antee about half of the national energy production(Droogers et al. 2011). Recent severe droughts in2005, 2006 and 2009, resulting in low water vol-umes, made it necessary to ration water and electricitythroughout the country.
Field data
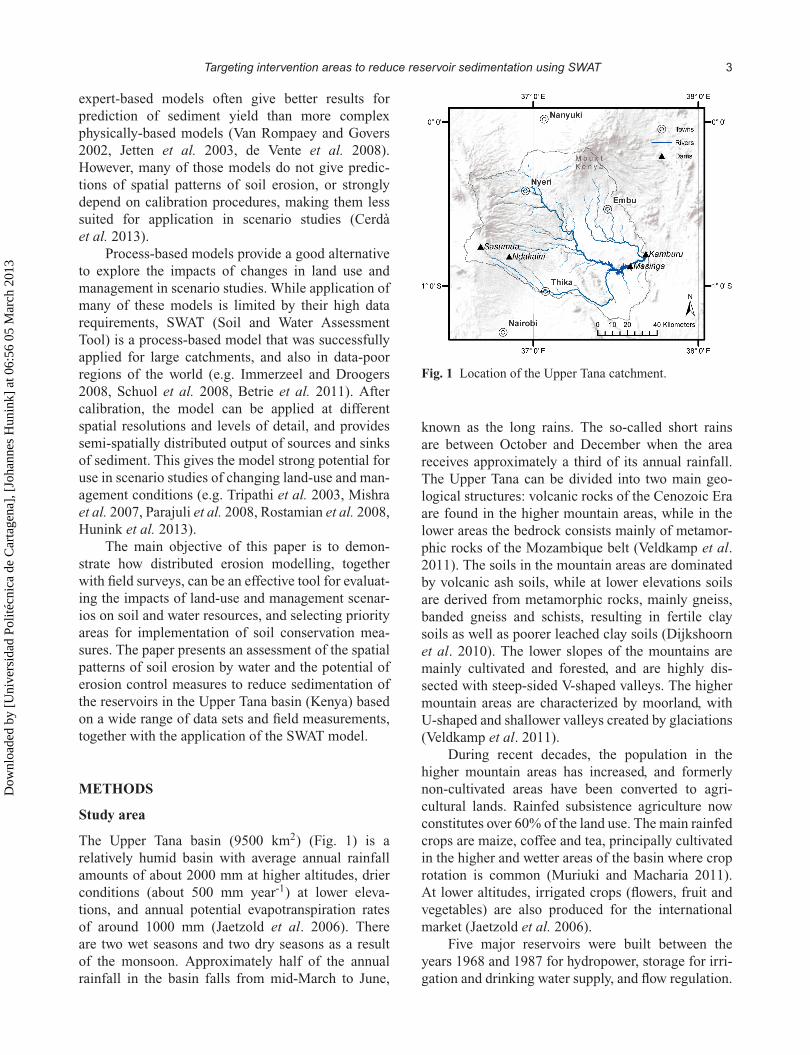
A total of 14 monitoring points for river dischargeand suspended sediment were selected across thecatchment (Fig. 2), among which preference wasgiven to gauging stations that were used previouslyused by the local water authority. Other selectioncriteria were the accessibility (roads, bridges) andthe presence of a steady flow regime. Measurementsof flow and suspended sediment sampling were car-ried out between March 2010 and February 2011.Measurements of discharge and sediment samplingtook place on a bimonthly basis resulting in a totalof 24 measurements for each point.
To derive the long-term sedimentation rate sinceconstruction of the reservoirs, bathymetric surveyswere conducted on four reservoirs in the Upper Tanabasin, the Masinga, Kamburu, Ndakaini (Thika) andSasumua dam reservoirs. The surveys were conductedusing state-of-the-art differential GPS positioning
and a conventional single beam echo sounder tomeasure water depth and measurement location.Measurements were performed under very favourableconditions with three out of four reservoirs near theirfull-supply level during the survey, which means thatonly limited extrapolation of the obtained profiles wasnecessary using available aerial imagery.
To further estimate the sediment budgets of thereservoirs, the sediment bulk density was estimatedfrom sediment texture, reservoir operation and reser-voir age using the empirical formula proposed byMiller (1953). The trap efficiency of the reservoirswas calculated with the analytical method describedby Julien (1995).
Data on daily discharge measured from1980 until the present at various stations throughoutthe basin were available for the study and providedby the national water authority. A quality assessmentof these data was done based on visual inspection ofthe time series and a selection was made from thegauges available, giving a total of 10 stations. Theselected gauges are located both at upstream and atdownstream points in the river network (Fig. 2).
Modelling approach
The Soil and Water Assessment Tool (SWAT) (Arnoldet al. 1998) was used for prediction of discharge,
Fig. 2 Land use in the catchment and the different measurement locations.
Dow
nloa
ded
by [
Uni
vers
idad
Pol
itécn
ica
de C
arta
gena
], [
Joha
nnes
Hun
ink]
at 0
6:56
05
Mar
ch 2
013
Targeting intervention areas to reduce reservoir sedimentation using SWAT 5
soil erosion and sediment yield. The SWAT modelallows the simulation of erosion processes based onsoil type, topography, land-use and climate data, witha relatively high level of spatial detail necessary fordecision support. For spatial discretization of thecatchment, SWAT uses the concept of hydrologicalresponse units (HRU) (Neitsch et al. 2002): por-tions of a sub-basin that possess unique land-use,management and soil attributes.
Surface runoff volume was calculated in SWATfor each HRU using the SCS (Soil ConservationService) curve number procedure (USDA-SCS 1972),aggregated for each delineated sub-basin and routedthrough the stream network using a variation of thekinematic wave model. Runoff peak rate is calcu-lated with the rational method slightly modified forthe HRU concept (Neitsch et al. 2002).
The Universal Soil Loss Equation (USLE) is themethod most commonly used to estimate long-termerosion rates from field or farm sites that are sub-ject to different management practices. Wischmeierand Smith (1965) developed the method based ondata from many experimental plots in the USA, butthe method has been applied and argued about, glob-ally (e.g. Wischmeier 1976, Sonneveld and Nearing2003).
The SWAT model estimates erosion and sedimentyield with the Modified Universal Soil Loss Equation(MUSLE) (Williams 1975). While the USLE usesrainfall as an indicator of erosive energy, MUSLEuses the amount of runoff to simulate erosion andsediment yield. This modification is reported toincrease the prediction accuracy of the model, theneed for a delivery ratio is eliminated, and singlestorm estimates of sediment yields can be calculated(Wang et al. 2009). The MUSLE equation as used inSWAT is as follows:
Qs = 11.8(Qr · qpeak · AHRU)0.56
· K · C · P · LS · CFRG(1)
where Qs is the sediment yield (t/d); Qr is the surfacerunoff volume (mm/ha); qpeak is the peak runoff rate(m3/s); AHRU is the area of the HRU (km2); K is theUSLE soil erodibility factor; C is the USLE cover andmanagement factor; P is the USLE support practicefactor; LS is the USLE topographic factor; and CFRGis the coarse fragment factor. The crop managementfactor of the USLE equation is recalculated every daythat runoff occurs and is a function of above-groundbiomass, residue on the soil surface, and the minimum
C factor for the plant. The other factors of the erosionequation are evaluated as described by Wischmeierand Smith (1978).
The sediment yields of each HRU are routedto the channel of the corresponding sub-basin. Thetransport of sediment in the channel is controlled bythe simultaneous operation of two processes, depo-sition and degradation. SWAT uses Williams (1980)simplified version of Bagnold’s (1977) definition ofstream power to develop a method for determiningchannel degradation as a function of channel slopeand velocity. The maximum amount of sediment thatcan be transported from a channel segment is sim-ulated as a function of the peak flow rate and iscomputed as follows:
Smax = csp(qs
Ach)sp (2)
where Smax is the maximum concentration ofsediment that can be transported or the channel carry-ing capacity (103 kg/m3); csp is an empirical coeffi-cient which needs to be calibrated; qs is the peak flowrate (m3/s); Ach is the cross-sectional area of flow inthe channel; and sp is an exponent defined by the user.
Spatial model input
Daily climate data from the period 1980–2010 weregathered from three stations (Fig. 2). The originof these data was the Global Summary of theDay (GSOD) database archived by the US NationalClimatic Data Center (NCDC) (http://www.ncdc.noaa.gov/). The variables used were precipitationand those needed for the calculation of potentialevapotranspiration by the Penman-Monteith method,i.e. temperature, solar radiation, wind speed and airhumidity.
The importance of orographic rainfall in thehigher parts of the basin where no data were avail-able required the use of a second data source toaccount for the high spatial variability of rainfall.Many satellite rainfall products are available today,all of them with different characteristics, spatial andtemporal resolutions, and coverage (e.g. PERSIANN,TRMM, CMORPH, TAMSAT). A good-quality prod-uct focused on the African continent is preparedoperationally at the Climate Prediction Center (CPC)for the US Agency for International Development(USAID). They provide daily estimates of pre-cipitation that are used for the Famine EarlyWarning System (FEWS) network. The latest product
Dow
nloa
ded
by [
Uni
vers
idad
Pol
itécn
ica
de C
arta
gena
], [
Joha
nnes
Hun
ink]
at 0
6:56
05
Mar
ch 2
013
6 J.E. Hunink et al.
(RFE2) is available from October 2000 on a 0.1-degree spatial resolution. This data set was foundto outperform other satellite products in this part ofAfrica (Asadullah et al. 2008) when compared withground measurements.
For this particular study, the CPC data set doesnot provide a time series long enough to cover theentire simulation period (1980–2010). Therefore, aGIS procedure was carried out to generate daily grid-ded rainfall maps for the entire period, by combiningthe daily time series of the three point locations withmonthly gridded averages of the 10-year data set fromRFE2. Funk and Verdin (2010) used a similar methodto derive improved gridded climatologies with satel-lite rainfall averages as a basis. This methodologybenefits from the ability of satellite rainfall estimatesto capture spatial gradients in rainfall and the relativeaccuracy of rainfall gauges (Hunink et al. 2011).
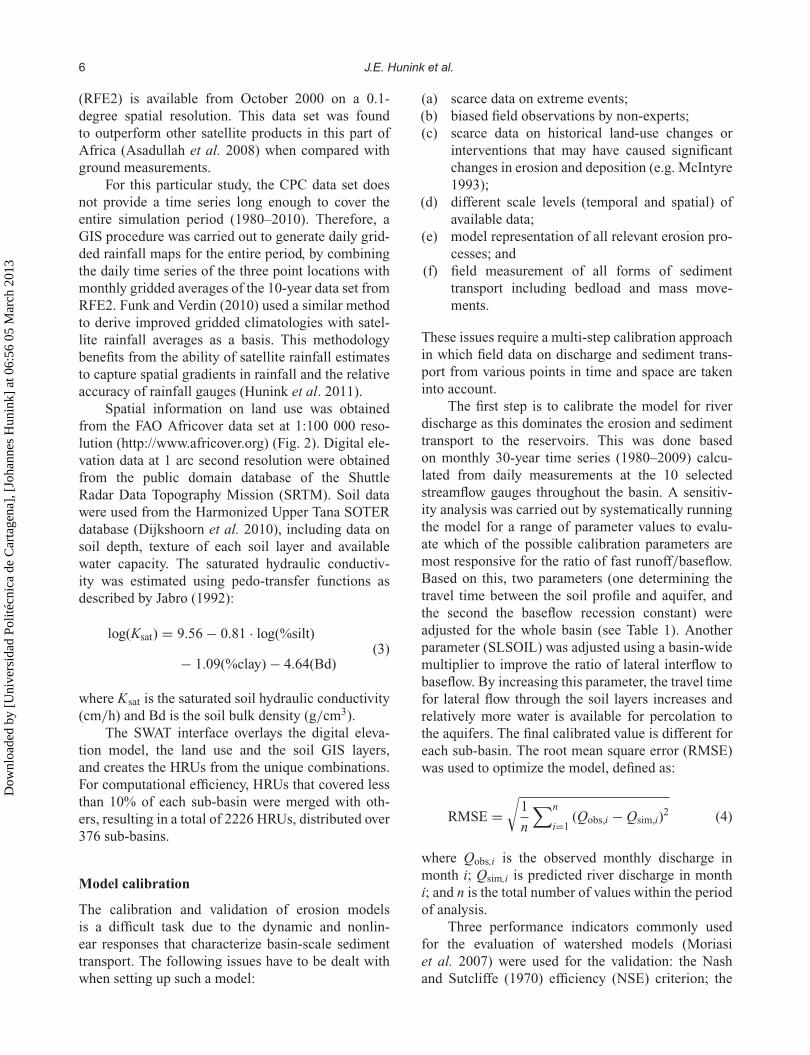
Spatial information on land use was obtainedfrom the FAO Africover data set at 1:100 000 reso-lution (http://www.africover.org) (Fig. 2). Digital ele-vation data at 1 arc second resolution were obtainedfrom the public domain database of the ShuttleRadar Data Topography Mission (SRTM). Soil datawere used from the Harmonized Upper Tana SOTERdatabase (Dijkshoorn et al. 2010), including data onsoil depth, texture of each soil layer and availablewater capacity. The saturated hydraulic conductiv-ity was estimated using pedo-transfer functions asdescribed by Jabro (1992):
log(Ksat) = 9.56 − 0.81 · log(%silt)
− 1.09(%clay) − 4.64(Bd)(3)
where Ksat is the saturated soil hydraulic conductivity(cm/h) and Bd is the soil bulk density (g/cm3).
The SWAT interface overlays the digital eleva-tion model, the land use and the soil GIS layers,and creates the HRUs from the unique combinations.For computational efficiency, HRUs that covered lessthan 10% of each sub-basin were merged with oth-ers, resulting in a total of 2226 HRUs, distributed over376 sub-basins.
Model calibration
The calibration and validation of erosion modelsis a difficult task due to the dynamic and nonlin-ear responses that characterize basin-scale sedimenttransport. The following issues have to be dealt withwhen setting up such a model:
(a) scarce data on extreme events;(b) biased field observations by non-experts;(c) scarce data on historical land-use changes or
interventions that may have caused significantchanges in erosion and deposition (e.g. McIntyre1993);
(d) different scale levels (temporal and spatial) ofavailable data;
(e) model representation of all relevant erosion pro-cesses; and
(f) field measurement of all forms of sedimenttransport including bedload and mass move-ments.
These issues require a multi-step calibration approachin which field data on discharge and sediment trans-port from various points in time and space are takeninto account.
The first step is to calibrate the model for riverdischarge as this dominates the erosion and sedimenttransport to the reservoirs. This was done basedon monthly 30-year time series (1980–2009) calcu-lated from daily measurements at the 10 selectedstreamflow gauges throughout the basin. A sensitiv-ity analysis was carried out by systematically runningthe model for a range of parameter values to evalu-ate which of the possible calibration parameters aremost responsive for the ratio of fast runoff/baseflow.Based on this, two parameters (one determining thetravel time between the soil profile and aquifer, andthe second the baseflow recession constant) wereadjusted for the whole basin (see Table 1). Anotherparameter (SLSOIL) was adjusted using a basin-widemultiplier to improve the ratio of lateral interflow tobaseflow. By increasing this parameter, the travel timefor lateral flow through the soil layers increases andrelatively more water is available for percolation tothe aquifers. The final calibrated value is different foreach sub-basin. The root mean square error (RMSE)was used to optimize the model, defined as:
RMSE =√
1
n
∑n
i=1(Qobs,i − Qsim,i)
2 (4)
where Qobs,i is the observed monthly discharge inmonth i; Qsim,i is predicted river discharge in monthi; and n is the total number of values within the periodof analysis.
Three performance indicators commonly usedfor the evaluation of watershed models (Moriasiet al. 2007) were used for the validation: the Nashand Sutcliffe (1970) efficiency (NSE) criterion; the
Dow
nloa
ded
by [
Uni
vers
idad
Pol
itécn
ica
de C
arta
gena
], [
Joha
nnes
Hun
ink]
at 0
6:56
05
Mar
ch 2
013

Targeting intervention areas to reduce reservoir sedimentation using SWAT 7
Table 1 SWAT parameters used for calibration, the range used for calibration and the value used for the analysis.
SWAT parameter Unit Description Range used for calibration Calibrated value
ALPHA_BF d-1 Baseflow recession constant 0.01−0.1 0.015GW_DELAY d Groundwater delay time 15−60 50SLSOIL m Slope length for lateral subsurface flow 10−2000 90−1200∗csp − User defined coefficient determining channel
carrying capacity0.0001−0.01 0.003
sp − Exponent parameter for calculating sedimentre-entrained in channel sediment routing
1.0−2.0 1.5
Note: ∗Different for each HRU, calibrated with a multiplier.
RMSE-observations standard deviation ratio (RSR),which is calculated as the ratio of the RMSE andstandard deviation of measured streamflow (Singhet al. 2004); and the percent bias (PBIAS), whichmeasures the average tendency of the simulated datato be larger or smaller than their observed counter-parts (Gupta et al. 1999). The NSE ranges between−∞ and 1.0, with NSE = 1.0 being the optimalvalue. The RSR varies from the optimal value of 0,which indicates zero RMSE, or residual variation andtherefore perfect model simulation, to a large pos-itive value. Generally, values <0.70 are consideredacceptable (Moriasi et al. 2007). For PBIAS, valuesof 10–20% can be considered acceptable, dependingon the desired level of accuracy.
Calibration of the sediment module requirescalibration of the two empirical parameters related tothe Bagnold stream power equation (equation (2)):Csp and sp need to be calibrated for the basin asa whole. The calibration of both coefficients wasbased on the comparison of the mean annual reser-voir sediment inflow that was simulated by the modeland the mean annual sediment inflow calculated fromthe bathymetric surveys (Table 2). This comparisonwas done for the period from the year in which eachreservoir became operational to the month in whichthe survey was made. Calibration was done using oneof the major downstream reservoirs (Masinga) andvalidation was done with the downstream Kamburureservoir
Table 2 Simulated sediment inflow into the reservoirs ver-sus sediment inflow derived from the bathymetric surveys(observed).
Reservoir Simulatedsediment inflow(Mt year-1)
Observedsediment inflow(Mt year-1)
Simulated as% ofobserved (%)
Sasumua 0.0 0.0 N/ANdakaini 0.0 0.0 N/AMasinga 6.6 8.0 83Kamburu 0.9 1.1 80
Scenario analysis
The erosion control measures to be studied were dis-cussed with the local authorities in two meetings(May and July 2010) attended by staff from the waterauthority and a few representatives of farmers. It wasagreed to assess the potential of implementing veg-etated contour strips on hillslopes and check damsin permanent gullies in order to reduce the erosionand sediment yields in the basin. Vegetated contourstrips are narrow buffer strips about 1 metre widethat have grass or other permanent vegetation to helptrap runoff, sediment and nutrients and reduce slopelength, sheet and rill erosion in a contoured field.For this scenario, it was assumed that the steep gullyareas were protected with check dams in order toreduce flow velocities and gully erosion. The parame-ter changes that were applied in the model to simulatethis scenario are summarized in Table 3 together withthe references they were based on.
RESULTS
Model calibration and validation
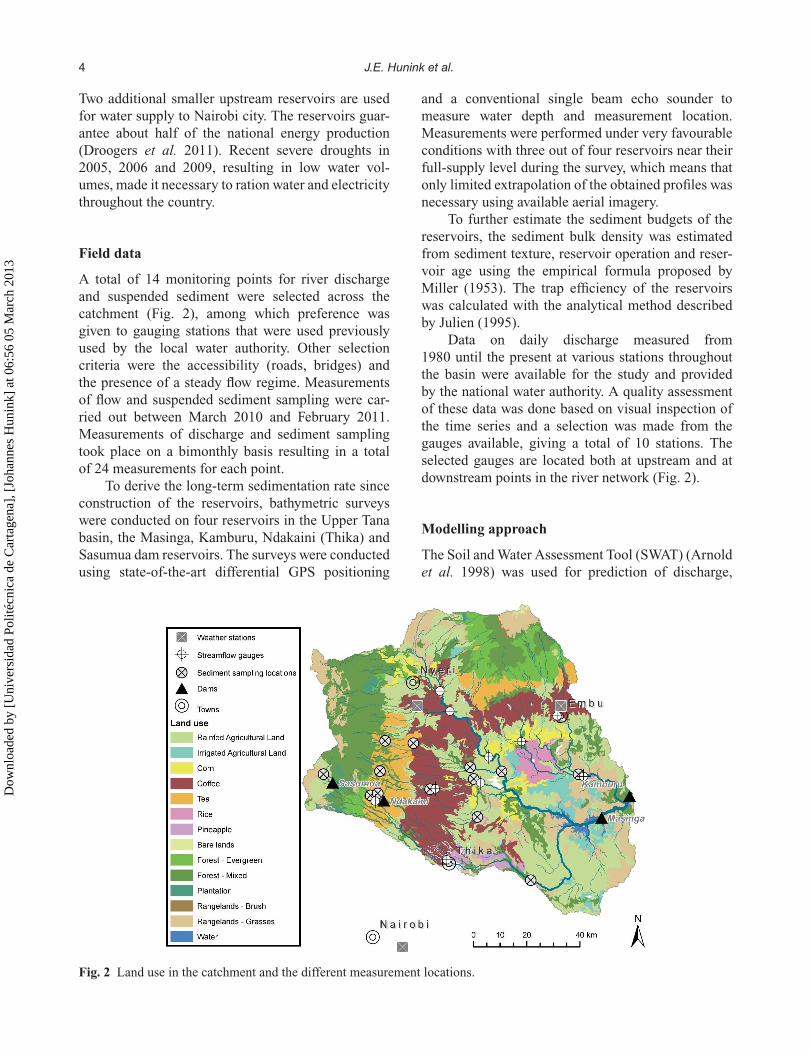
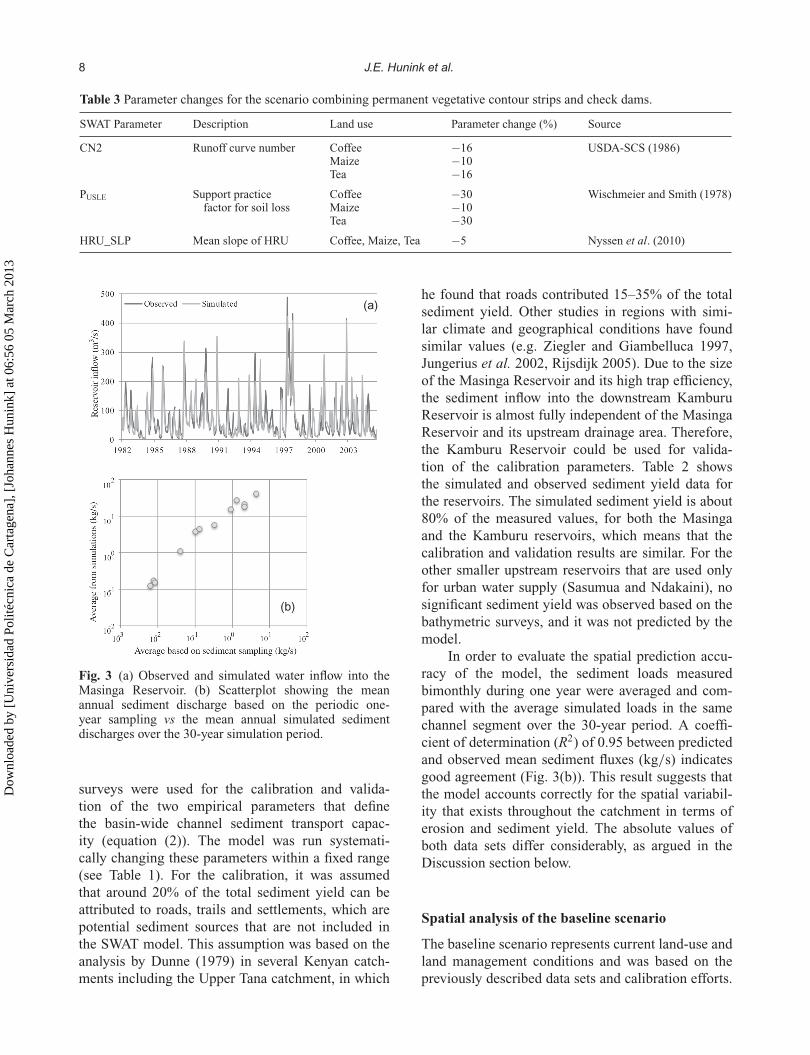
Model calibration was performed with the 30-yeartime series of daily discharges from the 10 selectedlocations. Afterwards, the model was validated withdata on the monthly water inflow into the largestdownstream reservoir (Masinga). This data set wasderived from the recorded water stages of thereservoir and the measured reservoir water outflow(Fig. 3(a)) and was available for 1982–2006. The val-ues obtained for the three performance indicatorsare: NSE = 0.75, RSR = 0.50, PBIAS = –9%.The NSE was slightly higher (0.76) for high flows(>75th percentile). This indicates relatively good val-idation results with a slight systematic overestimationof discharge.
The long-term mean annual reservoir sedimentinflow rates that were calculated from the bathymetric
Dow
nloa
ded
by [
Uni
vers
idad
Pol
itécn
ica
de C
arta
gena
], [
Joha
nnes
Hun
ink]
at 0
6:56
05
Mar
ch 2
013
8 J.E. Hunink et al.
Table 3 Parameter changes for the scenario combining permanent vegetative contour strips and check dams.
SWAT Parameter Description Land use Parameter change (%) Source
CN2 Runoff curve number Coffee −16 USDA-SCS (1986)Maize −10Tea −16
PUSLE Support practicefactor for soil loss
Coffee −30 Wischmeier and Smith (1978)Maize −10Tea −30
HRU_SLP Mean slope of HRU Coffee, Maize, Tea −5 Nyssen et al. (2010)
(a)
(b)
Fig. 3 (a) Observed and simulated water inflow into theMasinga Reservoir. (b) Scatterplot showing the meanannual sediment discharge based on the periodic one-year sampling vs the mean annual simulated sedimentdischarges over the 30-year simulation period.
surveys were used for the calibration and valida-tion of the two empirical parameters that definethe basin-wide channel sediment transport capac-ity (equation (2)). The model was run systemati-cally changing these parameters within a fixed range(see Table 1). For the calibration, it was assumedthat around 20% of the total sediment yield can beattributed to roads, trails and settlements, which arepotential sediment sources that are not included inthe SWAT model. This assumption was based on theanalysis by Dunne (1979) in several Kenyan catch-ments including the Upper Tana catchment, in which
he found that roads contributed 15–35% of the totalsediment yield. Other studies in regions with simi-lar climate and geographical conditions have foundsimilar values (e.g. Ziegler and Giambelluca 1997,Jungerius et al. 2002, Rijsdijk 2005). Due to the sizeof the Masinga Reservoir and its high trap efficiency,the sediment inflow into the downstream KamburuReservoir is almost fully independent of the MasingaReservoir and its upstream drainage area. Therefore,the Kamburu Reservoir could be used for valida-tion of the calibration parameters. Table 2 showsthe simulated and observed sediment yield data forthe reservoirs. The simulated sediment yield is about80% of the measured values, for both the Masingaand the Kamburu reservoirs, which means that thecalibration and validation results are similar. For theother smaller upstream reservoirs that are used onlyfor urban water supply (Sasumua and Ndakaini), nosignificant sediment yield was observed based on thebathymetric surveys, and it was not predicted by themodel.
In order to evaluate the spatial prediction accu-racy of the model, the sediment loads measuredbimonthly during one year were averaged and com-pared with the average simulated loads in the samechannel segment over the 30-year period. A coeffi-cient of determination (R2) of 0.95 between predictedand observed mean sediment fluxes (kg/s) indicatesgood agreement (Fig. 3(b)). This result suggests thatthe model accounts correctly for the spatial variabil-ity that exists throughout the catchment in terms oferosion and sediment yield. The absolute values ofboth data sets differ considerably, as argued in theDiscussion section below.
Spatial analysis of the baseline scenario
The baseline scenario represents current land-use andland management conditions and was based on thepreviously described data sets and calibration efforts.
Dow
nloa
ded
by [
Uni
vers
idad
Pol
itécn
ica
de C
arta
gena
], [
Joha
nnes
Hun
ink]
at 0
6:56
05
Mar
ch 2
013

Targeting intervention areas to reduce reservoir sedimentation using SWAT 9
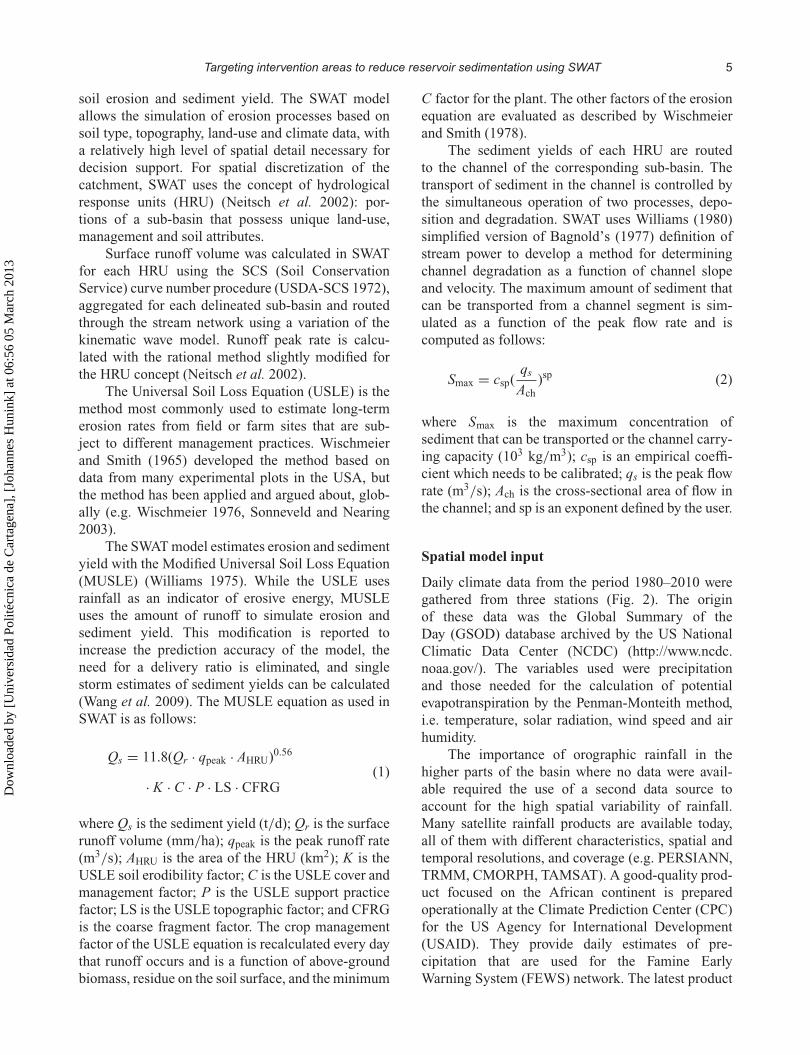
Fig. 4 Mean annual sediment yield at the river confluences and erosion rates of the baseline scenario based on the 30-yearsimulation period (1981–2010).
The baseline sediment budget is calculated from the30-year model output (1981–2010). A map was pro-duced (Fig. 4) representing the erosion rate through-out the basin for each HRU. Included in this map isthe mean annual sediment yield that was predicted ateach river confluence included in the model (377 intotal), represented with dots of different size.
The erosion rates were classified according to thefollowing scheme (adapted from Singh et al. 1992):
• slight (0–2 t ha-1 year-1)• moderate (2–5 t ha-1 year-1)• high (5–10 t ha-1 year-1)• very high (10– 20 t ha-1 year-1)• severe (20–50 t ha-1 year-1) and• very severe (>50 t ha-1 year-1)
As can be seen, large spatial differences exist interms of the erosion rates. Natural areas in the highermountain areas hardly contribute any sediment (3%of total basin sediment yield) while cultivated andgrazed areas contribute the rest. The main sedimentproducing areas are located on steep slopes. Clearly,
the main erosive areas are those where coffee is pro-duced, with an average erosion rate of 50 t ha-1 year-1,but also the areas where maize is cultivated togetherwith other subsistence crops show high erosion rates,on average 10 t ha-1 year-1. Tea, in spite of being char-acterized by a dense canopy cover, is cultivated onlyon the steeper slopes and shows similar erosion ratesto the subsistence crops. Similar trends and valueswere found in an earlier study on erosion in this regionby Archer (1996).
Scenario analysis and targeting
The potential of the proposed conservation strategy,consisting of a joint implementation of vegetated con-tour strips and check dams to reduce erosion andreservoir sedimentation, was assessed by incorporat-ing the corresponding parameter changes into themodel (Table 3). The output was compared with thebaseline scenario to assess the effectiveness of thesemeasures on reducing sediment export to reservoirs.Figure 5 shows the mean annual erosion reductionsthat were simulated in each HRU for the studied
Dow
nloa
ded
by [
Uni
vers
idad
Pol
itécn
ica
de C
arta
gena
], [
Joha
nnes
Hun
ink]
at 0
6:56
05
Mar
ch 2
013
10 J.E. Hunink et al.
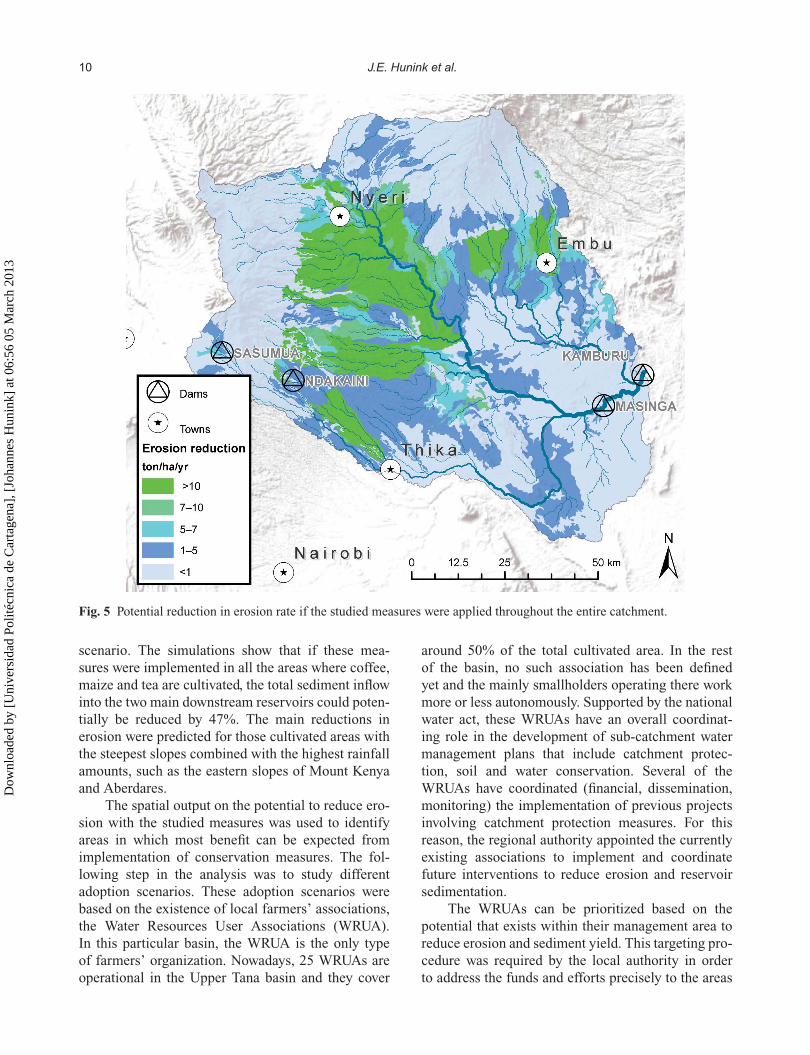
Fig. 5 Potential reduction in erosion rate if the studied measures were applied throughout the entire catchment.
scenario. The simulations show that if these mea-sures were implemented in all the areas where coffee,maize and tea are cultivated, the total sediment inflowinto the two main downstream reservoirs could poten-tially be reduced by 47%. The main reductions inerosion were predicted for those cultivated areas withthe steepest slopes combined with the highest rainfallamounts, such as the eastern slopes of Mount Kenyaand Aberdares.
The spatial output on the potential to reduce ero-sion with the studied measures was used to identifyareas in which most benefit can be expected fromimplementation of conservation measures. The fol-lowing step in the analysis was to study differentadoption scenarios. These adoption scenarios werebased on the existence of local farmers’ associations,the Water Resources User Associations (WRUA).In this particular basin, the WRUA is the only typeof farmers’ organization. Nowadays, 25 WRUAs areoperational in the Upper Tana basin and they cover
around 50% of the total cultivated area. In the restof the basin, no such association has been definedyet and the mainly smallholders operating there workmore or less autonomously. Supported by the nationalwater act, these WRUAs have an overall coordinat-ing role in the development of sub-catchment watermanagement plans that include catchment protec-tion, soil and water conservation. Several of theWRUAs have coordinated (financial, dissemination,monitoring) the implementation of previous projectsinvolving catchment protection measures. For thisreason, the regional authority appointed the currentlyexisting associations to implement and coordinatefuture interventions to reduce erosion and reservoirsedimentation.
The WRUAs can be prioritized based on thepotential that exists within their management area toreduce erosion and sediment yield. This targeting pro-cedure was required by the local authority in orderto address the funds and efforts precisely to the areas
Dow
nloa
ded
by [
Uni
vers
idad
Pol
itécn
ica
de C
arta
gena
], [
Joha
nnes
Hun
ink]
at 0
6:56
05
Mar
ch 2
013

Targeting intervention areas to reduce reservoir sedimentation using SWAT 11
where the highest benefits can be expected. To thisaim, the potential reductions of all the HRUs belong-ing to the territory of each WRUA were averaged.Based on this aggregation, an assessment was madeof the potential effect of implementing conservationmeasures in each WRUA; all WRUAs were classifiedand given a priority level according to their potentialimpact on reducing erosion. These priority levels wereassigned according to the following scheme, similarto the legend classification in Fig. 5:
• Priority I: reductions in erosion rate of more than10 t ha-1 year-1
• Priority II: reductions in erosion rate of 7–10 t ha-1
year-1
• Priority III: reductions in erosion rate of 5–7 t ha-1
year-1
Consequently, to obtain insight to the relation betweenthe level of implementation and its impact on thereduction in reservoir sedimentation, three adoptionscenarios were simulated. These adoption scenarioswere based on the priority levels assigned, as shownin Table 4. The model predicts that sediment inflow tothe reservoirs can be reduced in total by around 7%when the measures are implemented only in WRUAswith Priority I (Table 5), which cover around 8%of the total cultivated area. If the WRUAs with theassigned priority level II are added to the analysis(implementation area covers 20% of cultivated area)a total sediment yield reduction of 13% is predicted.Further reductions can be achieved when Priority III
Table 4 The adoption levels, the corresponding prior-ity levels, the implementation area compared to the totalcultivated area, and the number of WRUAs involved.
Adoptionlevel
Prioritylevel
% of cultivatedarea
Number ofWRUAs
1 I 8 52 I and II 20 113 I, II and III 35 15
areas are included, reducing sediment input into theMasinga Reservoir by about 16%, while sedimentinflow to the Kamburu Reservoir can potentially bereduced by 27% (total reduction 17%).
DISCUSSION
The principal objective of this research was to iden-tify priority intervention areas where erosion controlmeasures are likely to generate the highest reductionsin downstream sediment inflow into reservoirs. Thisrequires an appropriate distributed approach and suit-able data to calibrate and validate the model. Thebaseline scenario of this study was the 30-year periodused for calibration. It is obvious that land use inthis catchment has changed considerably during thisperiod. However, no reliable data could be obtainedto quantify and locate changes. These non-stationaryconditions are likely to affect the outcome of thecalibration and validation of the model. For this rea-son, a multi-site and a multi-variable (discharge anderosion) validation approach was used, instead of thesplit-sample test, which is another common way ofvalidating watershed models (Refsgaard 1997). Theerosion model was calibrated and validated based onthree data sources, each with different spatial andtemporal resolution: (a) streamflow data from dailymeasurements over 30 years at 10 points through-out the catchment; (b) long-term sediment inflowsinto the main reservoirs derived from the bathymetricsurveys; and (c) bi-monthly sampling of sedimentconcentration at 12 points during one year. Giventhe fair agreement between observed and simulatedstreamflow, and between the observed and simulatedsediment yields, the model was assumed to be fit forfurther scenario analysis. Also, the fact that uncer-tainty related to the predicted relative changes ofscenario outcomes can be assumed to be considerablysmaller than the prediction uncertainty of absolutemodel outcomes was taken into consideration (Arabiet al. 2007, Droogers et al. 2008).
Table 5 The erosion rate reduction for the key crops and the sediment reduction for the entire basin and the downstreamreservoirs for each of the adoption levels studied (% in parentheses is change relative to baseline).
Erosion rate (t ha-1 year-1) Sediment yields (Mt year-1)
Coffee Maize Tea Basin Masinga Kamburu
Baseline 27 18 14 10.1 6.3 0.93Adoption level 1 25 (−8%) 17 (−5%) 13 (−5%) 9.5 (−6%) 5.8 (−8%) 0.89 (−5%)Adoption level 2 23 (−17%) 16 (−7%) 13 (−6%) 9.1 (−10%) 5.6 (−11%) 0.71 (−24%)Adoption level 3 22 (−19%) 16 (−10%) 12 (−12%) 8.8 (−13%) 5.3 (−16%) 0.68 (−27%)
Dow
nloa
ded
by [
Uni
vers
idad
Pol
itécn
ica
de C
arta
gena
], [
Joha
nnes
Hun
ink]
at 0
6:56
05
Mar
ch 2
013

12 J.E. Hunink et al.
The data on discharge and erosion gathered andmeasured for this study form a unique data set fora reservoir sedimentation modelling study in a largeAfrican catchment. However, not enough data havebecome available to establish reliable relationshipsbetween discharge and sediment, due to the extremelynonlinear nature of the sediment discharge–streamdischarge relationship. Dunne (1979) showed that forKenyan basins the highest 10% of flows carry anaverage of 80% of the mean annual yield and thehighest 1% carries an average of 41% of the yield.This implies that it is much more essential to pre-dict accurately the relationship for high dischargesthan for low ones. During this one-year measure-ment campaign, no peak flood events were capturedso no information was obtained on sediment loadsduring the periods when the sediment yield is mostsignificant. Calibration of the model based on thefixed-interval sampling scheme was not useful forthis reason, as the measurements did not includeenough information to build reliable sediment rat-ing curves to compare measurements with simulatedpeak sediment discharges. Similar to the proposalsof Dickinson (1981) and Walling et al. (1992), forthis catchment it is recommended to design a sam-pling scheme with a higher frequency, even withwithin-day intervals. Nevertheless, the sediment loadmeasurements obtained during one single year couldbe used to validate the spatial variability in sedimentyields predicted by the model, by comparing the meanannual simulated loads with the measured ones.
The principal uncertainties in the estimation ofthe sediment yields in this study are related to theimportance of roads, trails and settlements, beingpotential sediment sources that are not included in theSWAT model, but have been estimated by other stud-ies as mentioned above. Based on the ranges foundin the literature for similar basins, a realistic valueof 20% was taken for this study. Another sedimentsource that was neglected in this assessment is bedload. Few studies of bed load transport have beenundertaken for African rivers, but some suggest that itmay account for approximately 10% of the total load(e.g. Walling 1984).
CONCLUSION
To adequately and effectively target and imple-ment erosion control measures to reduce reservoirsedimentation, distributed erosion modelling can beused to support the decision making. However, the
availability of sufficient data to calibrate and vali-date streamflow and sediment dynamics is crucialfor successful application of such models. The studyconducted in the Upper Tana basin, Kenya, includedbathymetric surveys of the main reservoirs and pointmeasurements of suspended sediment loads, while alarge data set of historic streamflow measurementswas also available. Calibration and validation resultsfor SWAT showed that these multiple sources of dataprovided relatively good results allowing its use forscenario analysis.
Evaluation of the impacts of scenarios withimplementation of erosion control measures is essen-tial as successful implementation in Africa has oftenbeen poor. It is a cost-effective way to provide deci-sion makers and other stakeholders with compre-hensive information on the effectiveness of certainmeasures before implementation, potentially lead-ing to higher success rates and social acceptance.The applied methodology allows the identificationof priority sites based on the predicted effective-ness of the measures. Successful implementation alsorequires institutional support to coordinate the cor-rect implementation and maintenance of measures.Therefore, as an additional selection criteria the exis-tence of local institutional arrangements in the formof WRUAs was used. Based on these two criteria,quantitative insight was provided in priority areas ofimplementation and as to how the scale of implemen-tation influences the reduction of sediment yield.
With the methodology applied it was shown thaterosion rates are highest in the coffee zones and areaswhere maize and other cereals are cultivated on steepslopes. Based on the scenario analysis, erosion controlpriority levels were given to the areas that correspondto the currently existing WRUAs in the basin. Theanalysis showed that if WRUAs could be success-fully involved in the implementation and maintenanceof the erosion control measures, the sediment yieldto reservoirs could be reduced significantly by upto around 25%, depending on the level of adoption.Consequently, the reservoir life expectancy wouldincrease by the same amount.
The presented methodology and results indicatethat distributed erosion and sediment yield mod-elling with SWAT, supported by sufficient data ondischarge and sediment yields of different points intime and space, can provide quantitative insight tothe effectiveness of erosion control measures and itsdownstream impact on reservoir sedimentation andother off-site effects. The distributed approach alsoallows taking into account of certain factors that may
Dow
nloa
ded
by [
Uni
vers
idad
Pol
itécn
ica
de C
arta
gena
], [
Joha
nnes
Hun
ink]
at 0
6:56
05
Mar
ch 2
013

Targeting intervention areas to reduce reservoir sedimentation using SWAT 13
be crucial for the successful implementation, andareas can be prioritized based on simulated adoptionscenarios.
Acknowledgements This work was undertakenwithin the consultancy project “PhysiographicalBaseline Survey for the Upper Tana CatchmentArea” awarded by the Water Resources ManagementAuthority of Kenya to the Joint Venture “Z&A-P Antonaropoulos and Associates S.A. – G.Karavokyris and Partners Consulting EngineersS.A.” of Athens, Greece, led by Z&A S.A. (con-tract no. EOI/WRMA/NRM/I/2008-2009). TheGovernment of Kenya received financial credit fromthe International Development Association (IDA)for the implementation of the Natural ResourceManagement (NRM) Project, including this assign-ment. The authors would like to thank JosephKinyua, Technical Manager of the Kenyan WaterResources Management Authority (WRMA) andProject Manager for the aforementioned projectand Boniface Mwaniki, General Manager of theWRMA Regional Office at Embu for their supportin data collection and liaising with critical stake-holders in the project area. The authors would alsolike to thank the following KenGen (Kenyan PowerCompany) personnel for their assistance in organizingthe bathymetric surveys and facilitating data collec-tion: Joel Ngugi, Operations Manager of the SevenForks Power Stations and Stephen Gumo, Engineer.The discharge and sediment load monitoring pro-gramme was executed with the support of JamesKibe Waititu, Engineering Hydrologist, Felix DamboSangale, Hydrologist and John Kinyua Rimberia,Water Quality expert. Joris de Vente acknowledges a‘Juan de la Cierva’ (JCI-2011-08941) research grantprovided by the Spanish Ministry of Science andInnovation.
REFERENCES
Arabi, M., Govindaraju, R.S., and Hantush, M.M., 2007. A proba-bilistic approach for analysis of uncertainty in the evaluationof watershed management practices. Journal of Hydrology, 333(2–4), 459–471.
Archer, D., 1996. Suspended sediment yields in the Nairobi area ofKenya and environmental controls. In: D.E. Walling and B.W.Webb, eds. Erosion and sediment yield: global and regionalperspectives. Proceedings of the Exeter Symposium, July 1996.Wallingford: IAHS Press, IAHS Publ. 236, 37–48.
Arnold, J.G., et al., 1998. Large area hydrologic modelling and assess-ment part I: model development. Journal of the American WaterResources Association, 34 (1), 73–89.
Asadullah, A., McIntyre, N., and Kigobe, M., 2008. Evaluation offive satellite products for estimation of rainfall over Uganda.Hydrological Sciences Journal, 53 (6), 1137–1150.
Bagnold, R.A., 1977. Bedload transport in natural rivers. WaterResources Research, 13 (2), 303–312.
Bellin, N., et al., 2009. Abandonment of soil and water conserva-tion structures in Mediterranean ecosystems: a case study fromsouth east Spain. CATENA, 76 (2), 114–121.
Betrie, G.D., et al., 2011. Sediment management modelling in theBlue Nile Basin using SWAT model. Hydrology and EarthSystem Sciences, 15 (3), 807–818.
Bewket, W. and Sterk, G., 2003. Assessment of soil erosion in culti-vated fields using a survey methodology for rills in the Chemogawatershed, Ethiopia. Agriculture, Ecosystems and Environment,97 (1–3), 81–93.
Boardman, J. and Foster, I., 2011. The potential significance of thebreaching of small farm dams in the Sneeuberg region, SouthAfrica. Journal of Soils and Sediments, 11 (8), 1456–1465.
Boix-Fayos, C., et al., 2008. The impact of land use change and check-dams on catchment sediment yield. Hydrological Processes, 22(25), 4922–4935.
Brown, T., Schneider, H., and Harper, D., 1996. Multi-scale estimatesof erosion and sediment yields in the Upper Tana basin, Kenya.In: D.E. Walling and B.W. Webb, eds. Erosion and sedimentyield: global and regional perspectives. Proceedings of theExeter Symposium, July 1996. Wallingford: IAHS Press, IAHSPubl. 236, 49–54.
Cerdà, A., et al., 2013. Scales and erosion. CATENA, 102, 1–2.de Jong, S.M., 1994. Derivation of vegetative variables from a
Landsat TM image for modeling soil-erosion. Earth SurfaceProcesses and Landforms, 19 (2), 165–178.
de Jong, S.M., et al., 1999. Regional assessment of soil erosion usingthe distributed model SEMMED and remotely sensed data.CATENA, 37 (3–4), 291–308.
de Vente, J. and Poesen, J., 2005. Predicting soil erosion and sedimentyield at the basin scale: scale issues and semi-quantitativemodels. Earth-Science Reviews, 71 (1–2), 95–125.
de Vente, J., et al., 2008. Spatially distributed modelling of soil ero-sion and sediment yield at regional scales in Spain. Global andPlanetary Change, 60 (3–4), 393–415.
de Vente, J., et al., 2009. The implications of data selection forregional erosion and sediment yield modelling. Earth SurfaceProcesses and Landforms, 34 (15), 1994–2007.
Dickinson, W.T., 1981. Accuracy and precision of suspendedsediment loads. In: Erosion and sediment transportmeasurement. Proceedings of the florence symposium,June 1981). Wallingford: IAHS Press, IAHS Publ. 133,195–202.
Dijkshoorn, J.A., et al., 2010. Soil and terrain database for the UpperTana, Kenya. Wageningen: ISRIC – World Soil Information,Green Water Credits Report 11.
Droogers, P., et al., 2011. Water use and demand in the Upper Tanacatchment, Kenya—a cost-benefit analysis using the Water andEvaluation and Planning tool (WEAP). Wageningen: ISRIC –World Soil Information, Green Water Credits Report 14.
Droogers, P., Van Loon, A., and Immerzeel, W., 2008. Quantifying theimpact of model inaccuracy in climate change impact assess-ment studies using an agro-hydrological model. Hydrology andEarth System Sciences, 12, 1–10.
Dunne, T., 1979. Sediment yield and land use in tropical catchments.Journal of Hydrology, 42 (3–4), 281–300.
Einsele, G. and Hinderer, M., 1997. Terrestrial sediment yield andthe lifetimes of reservoir lakes and larger basins. GeologischeRundschau, 86, 288 – 310.
Ervin, C.A. and Ervin, D.E., 1982. Factors affecting the use ofsoil conservation practices: hypotheses, evidence and policyimplications. Land Economics, 58, 277–291.
Dow
nloa
ded
by [
Uni
vers
idad
Pol
itécn
ica
de C
arta
gena
], [
Joha
nnes
Hun
ink]
at 0
6:56
05
Mar
ch 2
013
14 J.E. Hunink et al.
Funk, C. and Verdin, J., 2010. Real-time decision support systems:the famine early warning system network. In: M. Gebremichaeland F. Hossain, eds. Satellite rainfall applications for surfacehydrology. New York: Springer-Verlag.
Gebremedhin, B., 2004. Economic incentives for soil conservation inthe east African countries. In: S.R. Raine, et al., eds. Conservingsoil and water for society: sharing solutions. 3th internationalsoil conservation organisation conference, July 2004. Brisbane:ASSSI/IECA, Paper 249.
Gupta, H.V., Sorooshian, S., and Yapo, P.O., 1999. Status of automaticcalibration for hydrologic models: comparison with multilevelexpert calibration. Journal of Hydrologic Engineering, 4 (2),135–143.
Haregeweyn, N., et al., 2006. Reservoirs in Tigray (northernEthiopia): characteristics and sediment deposition problems.Land Degradation and Development, 17 (2), 211–230.
Haregeweyn, N., et al., 2013. Assessing the performance of a spa-tially distributed soil erosion and sediment delivery model(WATEM/SEDEM) in northern Ethiopia. Land Degradationand Development. doi: 10.1002/ldr.1121.
Hengsdijk, H., Meijerink, G.W., and Mosugu, M.E., 2005. Modelingthe effect of three soil and water conservation practices inTigray, Ethiopia. Agriculture, Ecosystems and Environment,105 (1–2), 29–40.
Herrero, M., et al., 2010. Climate variability and climate change andtheir impacts on Kenya’s agricultural sector. Nairobi: ILRI,ILRI Research report 22.
Hunink, J.E., et al., 2011. Impacts of land management options inthe Upper Tana, Kenya, using the Soil and Water AssessmentTool—SWAT. Wageningen: ISRIC – World Soil Information,Green Water Credits Report 10.
Hunink, J.E., et al., 2013. Quantitative simulation tools to analyzeup- and downstream interactions of soil and water conservationmeasures: supporting policy making in the Green Water Creditsprogram of Kenya. Journal of Environmental Management,111, 187–194, doi:10.1016/j.jenvman.2012.07.022.
Immerzeel, W.W. and Droogers, P., 2008. Calibration of a dis-tributed hydrological model based on satellite evapotranspira-tion. Journal of Hydrology, 349 (3–4), 411–424.
Jabro, J.D., 1992. Estimation of saturated hydraulic conductivityof soils from particle distribution and bulk density data.Transactions of the American Society of Agricultural Engineers,35 (2), 557–560.
Jaetzold, R., et al., 2006. Farm management handbook of Kenya.Volume II. Natural conditions and farm management informa-tion, 2nd ed. Nairobi: Ministry of Agriculture in cooperationwith the German Agency for Technical Cooperation (GTZ).
Jetten, V., Govers, G., and Hessel, R., 2003. Erosion models: qualityof spatial predictions. Hydrological Processes, 17 (5), 887–900.
Julien, P.Y., 1995. Erosion and sedimentation. Cambridge: CambridgeUniversity Press.
Jungerius, P.D., Matundura, J., and van de Ancker, J.A.M., 2002. Roadconstruction and gully erosion in west Pokot, Kenya. EarthSurface Processes and Landforms, 27, 1237–1247.
Lenhart, T., et al., 2005. Considering spatial distribution and depo-sition of sediment in lumped and semi-distributed models.Hydrological Processes, 19 (3), 785–794.
Lesschen, J.P., Schoorl, J.M., and Cammeraat, L.H., 2009. Modellingrunoff and erosion for a semi-arid catchment using a multi-scaleapproach based on hydrological connectivity. Geomorphology,109 (3–4), 174–183.
Liniger, H. and Critchley, W., 2007. Where the land is greener. Casestudies and analysis of soil and water conservation initiativesworldwide. Bern: WOCAT, CTA, UNEP, CDE.
McIntyre, S.C., 1993. Reservoir sedimentation rates linked to long-term changes in agricultural land use. Water Resources Bulletin,29, 487–495.
Merritt, W.S., Letcher, R.A., and Jakeman, A.J., 2003. A reviewof erosion and sediment transport models. EnvironmentalModelling and Software, 18 (8–9), 761–799.
Miller, C.R., 1953. Determination of the unit weight of sediment foruse in sediment volume computations. Denver, CO: US Bureauof Reclamation, Department of the Interior Memorandum.
Mishra, A., Kar, S., and Singh, V.P., 2007. Prioritizing structuralmanagement by quantifying the effect of land use and landcover on watershed runoff and sediment yield. Water ResourcesManagement, 21 (11), 1899–1913.
Moriasi, D.N., et al., 2007. Model evaluation guidelines for sys-tematic quantification of accuracy in watershed simulations.Transactions of the American Society of Agricultural andBiological Engineers, 50 (3), 885–900.
Muriuki, J.P. and Macharia, P.N., 2011. Inventory and analysis ofexisting soil and water conservation practices in Upper Tana,Kenya. Wageningen: ISRIC – World Soil Information, GreenWater Credits Report 12.
Nash, J.E., and Sutcliffe, J.V., 1970. Riverflow forecasting throughconceptual models. 1. A discussion of principles. Journal ofHydrology, 10 (3), 282–290.
Neitsch, S.L., et al., 2002. Soil and Water Assessment Tool (SWAT).Theoretical documentation, version 2000. College Station:Texas Water Resources Institute.
Nyssen, J., et al., 2010. Impact of soil and water conservation mea-sures on catchment hydrological response—a case in northEthiopia. Hydrological Processes, 24 (13), 1880–1895.
Oñate, J.J. and Peco, B., 2005. Policy impact on desertification: stake-holders’ perceptions in southeast Spain. Land Use Policy, 22(2), 103–114.
Ongwenyi, G.S., Kithiia, S.M., and Denga, F.O., 1993. An overviewof the soil erosion and sedimentation problems in Kenya.In: Sediment problems: strategies for monitoring, predic-tion and control. Wallingford: IAHS Press, IAHS Publ. 217,217–224.
Parajuli, P.B., Mankin, K.R., and Barnes, P.L., 2008. Applicabilityof targeting vegetative filter strips to abate fecal bacteria andsediment yield using SWAT. Agricultural Water Management,95 (10), 1189–1200.
Reed, M.S., 2008. Stakeholder participation for environmental man-agement: a literature review. Biological Conservation, 141 (10),2417–2431.
Refsgaard, J.C., 1997. Parameterisation, calibration, and validation ofdistributed hydrological models. Journal of Hydrology, 198 (1),69–97.
Rijsdijk, A., 2005. Evaluating sediment sources and delivery in a trop-ical volcanic watershed. In: D.E. Walling and A.J. Horowitz,eds. Proceedings of the symposium in Foz do Iguaçu, April2005, Brazil. Wallingford: IAHS Press, IAHS Publ. 292,16–23.
Rostamian, R., et al., 2008. Application of a SWAT model for estimat-ing runoff and sediment in two mountain basins. HydrologicalSciences Journal, 53 (5), 977–988.
Schuol, J., et al., 2008. Estimation of freshwater availability in theWest African sub-continent using the SWAT hydrologic model.Journal of Hydrology, 352 (1–2), 30–49.
Schwilch, G., Bachmann, F., and Liniger, H.P., 2009. Appraising andselecting conservation measures to mitigate desertification andland degradation based on stakeholder participation and globalbest practices. Land Degradation and Development, 20 (3),308–326.
Shahin, M., 1993. An overview of reservoir sedimentation in someAfrican river basins. In: R.F. Haldey and T. Mizuyama, eds.Sediment problems: strategies for monitoring, prediction andcontrol. Wallingford: IAHS Press, IAHS Publ. 217, 93–100.
Shiferaw, B. and Holden, S., 1998. Resource degradation andadoption of land conservation technologies in the Ethiopian
Dow
nloa
ded
by [
Uni
vers
idad
Pol
itécn
ica
de C
arta
gena
], [
Joha
nnes
Hun
ink]
at 0
6:56
05
Mar
ch 2
013

Targeting intervention areas to reduce reservoir sedimentation using SWAT 15
Highlands: a case study in Andit Tid, North Shewa. AgriculturalEconomics, 18 (3), 233–247.
Singh, G., et al., 1992. Soil erosion rate in India. Journal of Soil andWater Conservation, 47 (1), 97–99
Singh, J., Knapp, H.V., and Demissie, M., 2004. Hydrologic modelingof the Iroquois River watershed using HSPF and SWAT .Champaign: Illinois Department of Natural Resources, IllinoisState Water Survey Contract Report 2004–08.
Sonneveld, B.G.J.S. and Nearing, M.A., 2003. A nonparametric/parametric analysis of the Universal Soil Loss Equation.CATENA, 52 (1), 9–21.
Syvitski, J.P.M., et al., 2005. Impact of humans on the flux of terres-trial sediment to the global coastal ocean. Science, 308 (5720),376–380.
Trimble, S.W., 1981. Changes in sediment storage in Coon CreekBasin, Driftless Area, Wisconsin, 1853–1975. Science, 214(4517), 181–183.
Tripathi, M.P., Panda, R.K., and Raghuwanshi, N.S., 2003.Identification and prioritisation of critical sub-watershedsfor soil conservation management using the SWAT model.Biosystems Engineering, 85 (3), 365–379.
Tuppad, P., et al., 2010. Simulation of agricultural manage-ment alternatives for watershed protection. Water ResourcesManagement, 24 (12), 3115–3144.
USDA-SCS, 1972. National engineering handbook. Section 4:Hydrology. Washington, DC: US Department of Agriculture –Soil Conservation Service.
USDA-SCS, 1986. Urban hydrology for small watersheds.Washington, DC: US Department of Agriculture, SoilConservation Service.
Van Noordwijk, M., Poulsen, J., and Ericksen, P., 2004. Quantifyingoffsite effects of land use change: filters, flows and fallacies.Agriculture, Ecosystems and Environment, 104 (1), 19–34.
Van Rompaey, A. and Govers, G., 2002. Data quality and model com-plexity for regional scale soil erosion prediction. InternationalJournal of Geographical Information Science, 16 (7), 663–680.
Vanmaercke, M., et al., 2011. Sediment yield in Europe: spatialpatterns and scale dependency. Geomorphology, 130 (3–4),142–161.
Veldkamp, A., et al., 2011. Mount Kenya volcanic activity andthe Late Cenozoic landscape reorganisation in the upper Tanafluvial system. Geomorphology, 145–146, 19–31.
Verstraeten, G., et al., 2006. Reservoir and pond sedimentation inEurope. In: J. Boardman and J. Poesen, eds. Soil erosion inEurope. Chichester: John Wiley and Sons, 759–774.
Walling, D.E., 1984. The sediment yields of African rivers. In:D.E. Walling, S.S.D. Foster, and P. Wurzel, eds. Challengesin African hydrology and water resources. Wallingford: IAHSPress, IAHS publ. 144, 265–283.
Walling, D.E., Webb, B.W., and Woodward, J.C., 1992. Somesampling considerations in the design of effective strategiesfor monitoring sediment-associated transport. In: Bogen, J.,Walling, D.E., and Day, T.J., eds. Erosion and sediment trans-port monitoring programmes in river basins. Wallingford:IAHS Press, IAHS Publ. 210, 279–288.
Wang, G.Q., Hapuarachchi, H., and Ishidaira, H., 2009. Estimationof soil erosion and sediment yield during individual rain-storms at catchment scale. Water Resources Management, 23(8), 1447–1465.
White, M.J. and Arnold, J.G., 2009. Development of a simplistic veg-etative filter strip model for sediment and nutrient retention atthe field scale. Hydrological Processes, 23 (11), 1602–1616.
Williams, J.R., 1975. Sediment routing for agricultural watersheds.Water Resources Bulletin, 11 (5), 965–974.
Williams, J.R.., 1980. SPNM, a model for predicting sediment, phos-phorus, and nitrogen yields from agricultural basins. WaterResources Bulletin, 16, 843–848.
Wischmeier, W. and Smith, D., 1965. Predicting rainfall-erosionlosses from cropland east of the Rocky Mountains. In: Guidefor selection of practices for soil and water conservation.Washington, DC: US Department of Agriculture AgricultureHandbook 282.
Wischmeier, W.H., 1976. Use and misuse of Universal SoilLoss Equation. Journal of Soil and Water Conservation, 39,105–107.
Wischmeier, W.H. and Smith, D., 1978. Predicting rainfall erosionlosses: a guide to conservation planning. Washington, DC: USDepartment of Agriculture, Agriculture Handbook 537.
Wisser, D., et al., 2010. The significance of local water resourcescaptured in small reservoirs for crop production – Aglobal-scale analysis. Journal of Hydrology, 384 (3–4),264–275.
Wooldridge, R., 1984. Sedimentation in reservoirs: Tana River basin,Kenya. III – Analysis of hydrographic surveys of three reservoirsin June/July 1983. Wallingford: Hydraulics Research, Reportno. 61.
Ziegler, A.D. and Giambelluca, T.W., 1997. Importance of ruralroads as source areas for runoff in mountainous areasof northern Thailand. Journal of Hydrology 196 (1–4),204–229.
Dow
nloa
ded
by [
Uni
vers
idad
Pol
itécn
ica
de C
arta
gena
], [
Joha
nnes
Hun
ink]
at 0
6:56
05
Mar
ch 2
013