task-execution scheduling schemes for network measurement and
TRANSCRIPT
Computer Communications 33 (2010) 124–135
Contents lists available at ScienceDirect
Computer Communications
journal homepage: www.elsevier .com/ locate/comcom
Task-execution scheduling schemes for network measurement and monitoring
Zhen Qin, Roberto Rojas-Cessa, Nirwan Ansari *
Department of Electrical and Computer Engineering, New Jersey Institute of Technology, University Heights, Newark, NJ 07102, United States
a r t i c l e i n f o
Article history:Available online 12 November 2009
Keywords:SchedulingNetwork measurementActive measurementGraph coloringClique
0140-3664/$ - see front matter � 2009 Elsevier B.V. Adoi:10.1016/j.comcom.2009.11.005
* Corresponding author.E-mail addresses: [email protected] (Z. Qin), rojas@njit
njit.edu, [email protected] (N. Ansari).
a b s t r a c t
Measurement is a required process in high performance networks for efficient quality-of-service (QoS)provisioning and service verification. Active measurement is an attractive approach because the mea-surement traffic injected into the network can be controlled and the measurement tasks can be distrib-uted throughout the network. However, the execution of measurement tasks in common parts of anetwork may face contention for resources, such as computational power, memory, and link bandwidth.This contention could jeopardize measurement accuracy and affect network services. This contention forlimited resources defines a conflict between measurement tasks. Furthermore, we consider two sets ofmeasurement tasks, those used to monitor network state periodically, called periodic tasks, and thosefor casual measurements issued as needed, called on-demand measurement tasks. In this paper, we pro-pose a novel scheduling scheme to resolve contention for resources of both periodic and on-demand mea-surement tasks from graph coloring perspective, called ascending order of the sum of clique number anddegree of tasks. The scheme selects tasks according to the ascending order of the sum of clique numberand conflict task degree in a conflict graph and allows concurrent execution of multiple measurementtasks for high resource utilization. The scheme decreases the average waiting time of all tasks in periodicmeasurement tasks scheduling. For on-demand measurement tasks, the proposed scheme minimizes thewaiting time of inserted on-demand tasks while keeping time space utilization high. In other words, thetotal time spent on finishing all the tasks is shortened. We evaluate our proposed schemes under differentmeasurement task assignment scenarios through computer simulations, and compare the performance ofthis scheme with others that also allow concurrent task execution. The simulation results show that theproposed scheme produces effective contention resolution and low execution delays.
� 2009 Elsevier B.V. All rights reserved.
1. Introduction
Some applications, such as voice over IP (VoIP), streaming videoand online gaming have stringent requirements for Quality-of-Ser-vice (QoS) provisioning, which further requires accurate and up-to-date information of the network performance, through measuringand monitoring tools to estimate and collect those data. Therefore,network measurement becomes an important subject driven byInternet Service Providers (ISPs) to quantify network status, mon-itor existing traffic, and service verification on service agreementcompliance for applications with QoS requirements.
Measurement techniques can be coarsely divided into passiveand active approaches. Passive measurement uses traversing traf-fic, whether carrying users’ data or network control packets, todetermine the network state. The accuracy of passive measure-ment is a function of the amount of existing traffic. On the otherhand, active measurement has controllable properties that areindependent of the absence of user traffic, thus making it an attrac-
ll rights reserved.
.edu (R. Rojas-Cessa), ansari@
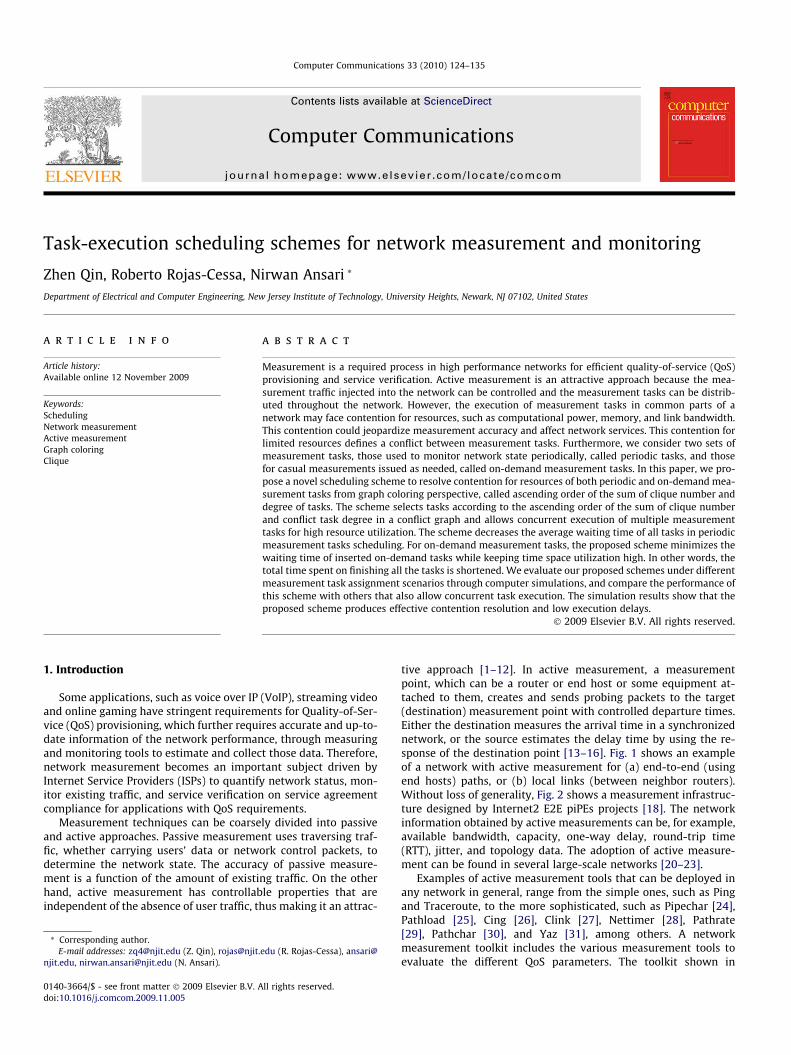
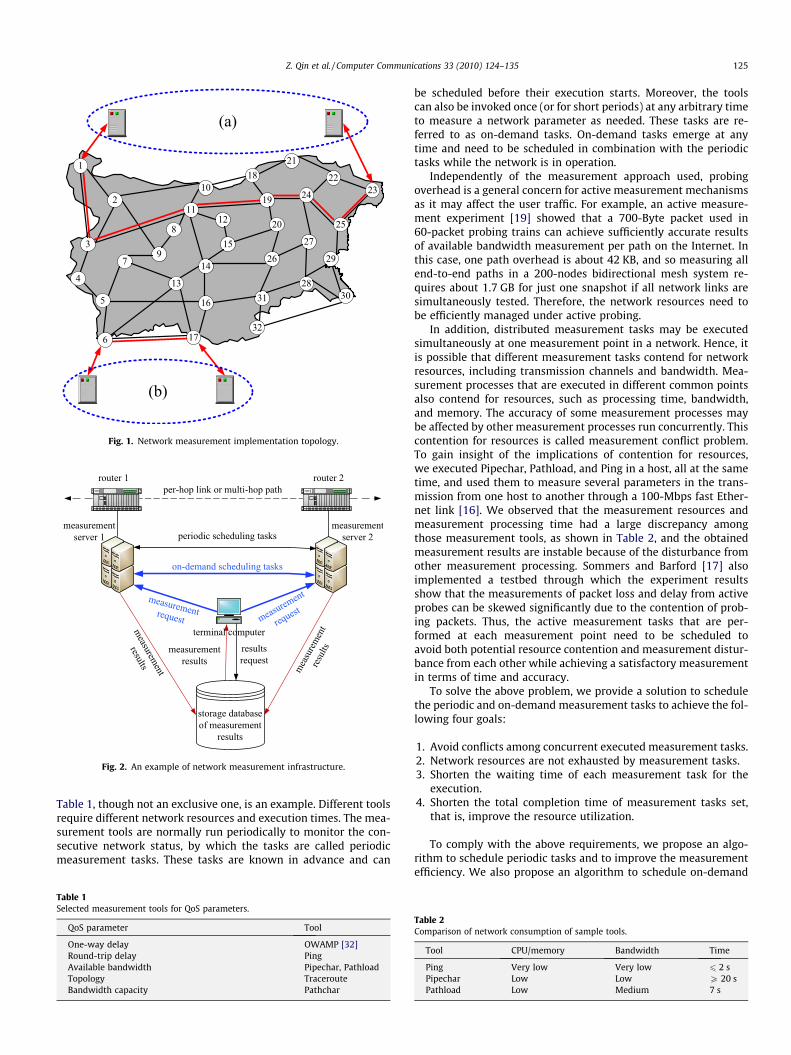
tive approach [1–12]. In active measurement, a measurementpoint, which can be a router or end host or some equipment at-tached to them, creates and sends probing packets to the target(destination) measurement point with controlled departure times.Either the destination measures the arrival time in a synchronizednetwork, or the source estimates the delay time by using the re-sponse of the destination point [13–16]. Fig. 1 shows an exampleof a network with active measurement for (a) end-to-end (usingend hosts) paths, or (b) local links (between neighbor routers).Without loss of generality, Fig. 2 shows a measurement infrastruc-ture designed by Internet2 E2E piPEs projects [18]. The networkinformation obtained by active measurements can be, for example,available bandwidth, capacity, one-way delay, round-trip time(RTT), jitter, and topology data. The adoption of active measure-ment can be found in several large-scale networks [20–23].
Examples of active measurement tools that can be deployed inany network in general, range from the simple ones, such as Pingand Traceroute, to the more sophisticated, such as Pipechar [24],Pathload [25], Cing [26], Clink [27], Nettimer [28], Pathrate[29], Pathchar [30], and Yaz [31], among others. A networkmeasurement toolkit includes the various measurement tools toevaluate the different QoS parameters. The toolkit shown in
2322
2118
10
5
4
3
2
283031
13
32
79
16
17
20
15
1426
27
25
29
1119
128
1
24
6
Fig. 1. Network measurement implementation topology.
Fig. 2. An example of network measurement infrastructure.
Z. Qin et al. / Computer Communications 33 (2010) 124–135 125
Table 1, though not an exclusive one, is an example. Different toolsrequire different network resources and execution times. The mea-surement tools are normally run periodically to monitor the con-secutive network status, by which the tasks are called periodicmeasurement tasks. These tasks are known in advance and can
Table 1Selected measurement tools for QoS parameters.
QoS parameter Tool
One-way delay OWAMP [32]Round-trip delay PingAvailable bandwidth Pipechar, PathloadTopology TracerouteBandwidth capacity Pathchar
be scheduled before their execution starts. Moreover, the toolscan also be invoked once (or for short periods) at any arbitrary timeto measure a network parameter as needed. These tasks are re-ferred to as on-demand tasks. On-demand tasks emerge at anytime and need to be scheduled in combination with the periodictasks while the network is in operation.
Independently of the measurement approach used, probingoverhead is a general concern for active measurement mechanismsas it may affect the user traffic. For example, an active measure-ment experiment [19] showed that a 700-Byte packet used in60-packet probing trains can achieve sufficiently accurate resultsof available bandwidth measurement per path on the Internet. Inthis case, one path overhead is about 42 KB, and so measuring allend-to-end paths in a 200-nodes bidirectional mesh system re-quires about 1.7 GB for just one snapshot if all network links aresimultaneously tested. Therefore, the network resources need tobe efficiently managed under active probing.
In addition, distributed measurement tasks may be executedsimultaneously at one measurement point in a network. Hence, itis possible that different measurement tasks contend for networkresources, including transmission channels and bandwidth. Mea-surement processes that are executed in different common pointsalso contend for resources, such as processing time, bandwidth,and memory. The accuracy of some measurement processes maybe affected by other measurement processes run concurrently. Thiscontention for resources is called measurement conflict problem.To gain insight of the implications of contention for resources,we executed Pipechar, Pathload, and Ping in a host, all at the sametime, and used them to measure several parameters in the trans-mission from one host to another through a 100-Mbps fast Ether-net link [16]. We observed that the measurement resources andmeasurement processing time had a large discrepancy amongthose measurement tools, as shown in Table 2, and the obtainedmeasurement results are instable because of the disturbance fromother measurement processing. Sommers and Barford [17] alsoimplemented a testbed through which the experiment resultsshow that the measurements of packet loss and delay from activeprobes can be skewed significantly due to the contention of prob-ing packets. Thus, the active measurement tasks that are per-formed at each measurement point need to be scheduled toavoid both potential resource contention and measurement distur-bance from each other while achieving a satisfactory measurementin terms of time and accuracy.
To solve the above problem, we provide a solution to schedulethe periodic and on-demand measurement tasks to achieve the fol-lowing four goals:
1. Avoid conflicts among concurrent executed measurement tasks.2. Network resources are not exhausted by measurement tasks.3. Shorten the waiting time of each measurement task for the
execution.4. Shorten the total completion time of measurement tasks set,
that is, improve the resource utilization.
To comply with the above requirements, we propose an algo-rithm to schedule periodic tasks and to improve the measurementefficiency. We also propose an algorithm to schedule on-demand
Table 2Comparison of network consumption of sample tools.
Tool CPU/memory Bandwidth Time
Ping Very low Very low 6 2 sPipechar Low Low P 20 sPathload Low Medium 7 s
126 Z. Qin et al. / Computer Communications 33 (2010) 124–135
measurement tasks that minimize the delay of both periodic tasksand the incoming on-demand tasks. Both algorithms are based ongraph coloring theory, where each measurement task is treated asa vertex in a graph, and the contention/conflict by two tasks is rep-resented as an edge connecting those two vertices.
The remainder of this paper is organized as follows. Section 2analyzes the contention problem of distributed network measure-ment tasks. Section 3 introduces related scheduling algorithms fornetwork measurement. Section 4 describes the modeling of mea-surement tasks for scheduling by using a coloring approach. Sec-tion 5 introduces our proposed scheduling schemes for periodicand on-demand measurement tasks, respectively. Section 6 showsthe performance evaluation obtained by computer evaluation, andanalysis of the proposed schemes and other comparable schemes.Section 7 presents our conclusions.
2. Problem analysis
According to the classification approach of scheduling intro-duced by Graham et al. [33], the task scheduling problem is definedin terms of a three-tuple classifications ½a; b; c�, where a defines themachine (processor) environment, b specifies the job’s characteris-tics, and c denotes the optimality criterion. Following this classifi-cation method, the measurement scheduling problem can bedescribed as ½P; frec; rig;
PCi�. Here, P is the number of identical
parallel processors to perform the required jobs. However, differ-ent from that approach [33], P is a variable instead. The value ofP depends on the number of measurement tasks run simulta-neously. Considering that n tasks need to be processed, the follow-ing relationship exists:
P 6 n ð1Þ
rec refers to the constraints on the resources used by the executionof measurement tasks. In order to minimize or to avoid the impactof probing packets on the performance of regular data traffic, a net-work resource constraint, such as the maximum bandwidth, is set ateach measurement point. This is called measurement resource con-straint (MRC) in this paper. Scheduling measurement tasks need toensure that the total amount of resources consumed by the mea-surement tasks are within this constraint rec. Measurement task iis denoted as si in the remainder of this paper. The parameter ri de-notes the release time of a measurement task si, upon which one in-stance of the task si becomes available for processing or execution.P
Ci indicates that the optimal criterion chosen is to minimize thetotal completion time on P parallel processors, where Ci denotes thecompletion time of the measurement task si. This optimal criterionreflects the fourth goal listed in Section 1. It is easy to see that thethird goal listed in Section 1 is the sufficient and necessary condi-tion of the fourth goal, as described by Lemma 1. Therefore,
PCi
can cover both the third and fourth goals.
Lemma 1. Minimizing the total completion time of a set of measure-ment tasks is equivalent to minimizing the average waiting time of themeasurement tasks in this set.
Proof. For a measurement tasks set, the completion time of task si
is:
Ci ¼ ei þwi ð2Þ
where ei is the execution time of measurement task si and wi is thewaiting time of task si. Hence, the total completion time of the mea-surement tasks set is:X
Ci ¼X
ei þX
wi ¼X
ei þm�wavg ð3Þ
where m is the number of measurement tasks in the set and wavg isthe average waiting time of the tasks. Since the execution time of
each measurement task is a constant, the sum of the execution timePei is a constant too. According to Eq. (3), minimizing
PCi is equal
to minimizing m�wavg , and thus is equal to minimizing wavg . �
A scheduling algorithm can be further classified as preemptiveor non-preemptive. In preemptive scheduling, the execution of atask can be interrupted prior to completion and resumed later.On the other hand, in non-preemptive scheduling, a task must beexecuted to completion once execution has started. In general,measurement task scheduling is regarded as non-preemptivescheduling as the measurement results are expected at completionand the measurement results may be time sensitive. Another issuewith this problem that differentiates it from the others is the po-tential conflict that measurement tasks have with each other. Thischaracteristic increases the complexity of the scheduling schemebecause the tasks cannot be just sorted according to one parameter(e.g., deadline or execution time of the task), but also the conflictwith scheduled tasks has to be considered.
3. Related work
Round robin is one of the simplest scheduling schemes[22,34,35] where the tasks are executed by a fixed order in uni-processor systems and only one task is executed at a time. Thisscheme requires the longest processing time for measurementtasks as it does not admit concurrent execution.
Network Weather Service (NWS), a well-known network mea-surement infrastructure, adapts a token passing scheme [36] to en-sure mutual exclusion between measurement tasks. In thisscheme, the measurement point that receives a token is entitledto execute a measurement task. Afterwards, the measurementpoint releases the token to a successor. However, this method doesnot allow concurrent execution of measurements.
Deadline driven scheduling (DSS), also known in the literatureas the Earliest Deadline First (EDF) scheduling scheme [37], selectstasks based on their deadlines, and was originally defined for uni-processor execution.
It is shown that the problem of determining whether a givenperiodic task system is non-preemptively feasible on either a singleprocessor or multiprocessors is NP-hard in a strong sense [38,39].To provide network measurement scheduling, a scheduling algo-rithm based on EDF that allows multiple concurrent executions, re-ferred to as EDF-CE [40], was recently proposed. This approachinitializes a queue that stacks all pending tasks to be processedin an EDF order, where the deadline is defined as the time beforethe task must be executed again. Whenever a task is ready to bereleased or a task finishes execution, the available tasks in thequeue are scheduled. This method introduces the possibility ofoverlapping multiple tasks in some time slots, but it does not con-sider the utilization ratio; in other words, sorting the tasks in thepending queue with their deadlines ignores the fact that the con-current execution of multiple tasks greatly depends on the existingconflicts between the tasks as much as on the tasks’ deadlines.
4. Modeling of network measurement scheduling schemes
4.1. Definitions
Let s ¼ fs1; s2; . . . ; sng represent the measurement tasks setwith up to n measurement tasks to be executed in the network.Here, si is characterized by a three-tuple of parameters:
� aðsiÞ: the time the measurement task is released, which is thetask’s arrival time.
� eðsiÞ: the execution time required by a measurement task tocomplete the measurement.
Z. Qin et al. / Computer Communications 33 (2010) 124–135 127
� pðsiÞ: the period of the measurement task, or the time to executetask si after the previous instance. This parameter describes howoften a measurement task is executed.
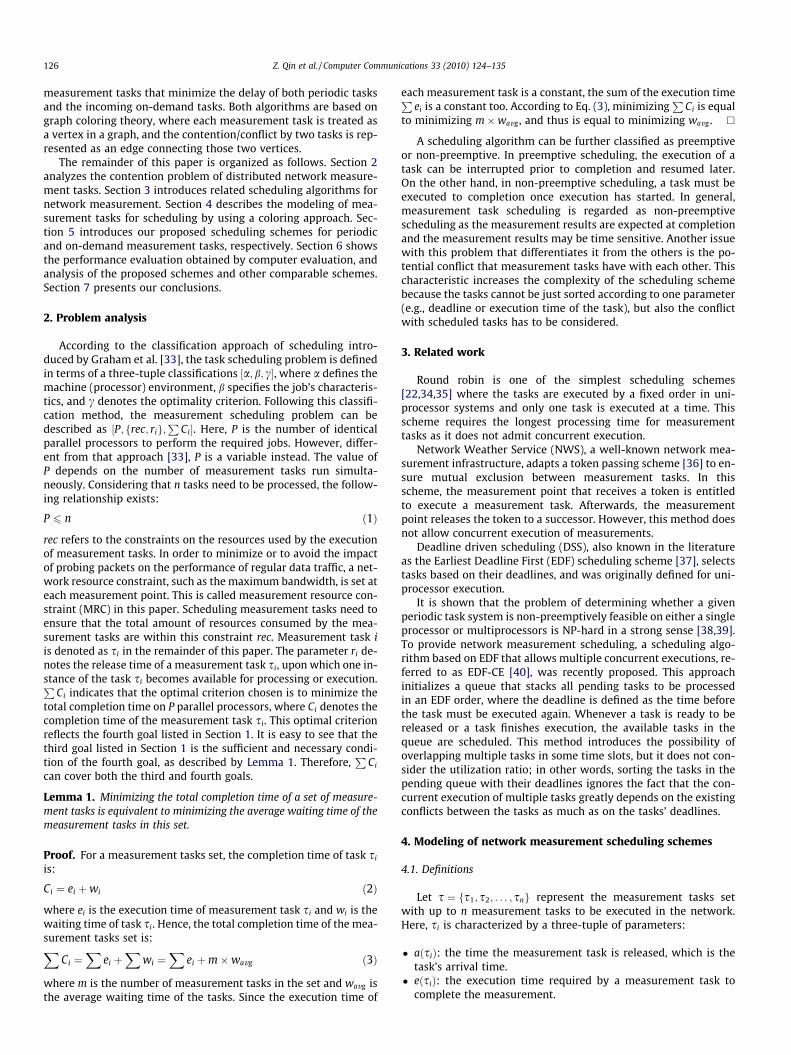
A timetable of periodic measurements is constructed by se-quences of tasks, each of which is executed again in pðsiÞ units oftime, and each task requires execution of eðsiÞ time units. The jth
job (or repetition) of measurement task si is denoted as sij. Thus,the first job, si1, of measurement task si occurs at time aðsiÞ; con-secutive jobs generated by si occur exactly pðsiÞ time units apart.Fig. 3 illustrates an example delineating the terms defined above.
In a set of periodic tasks where the tasks (and the number ofthem) do not change and where each task can have any particularperiod, the combination of tasks’ release times is finite. This is,after a long period of time, because of the task periodicity, the com-bination of release times repeats again. Therefore, for the measure-ment set s, we define the term hyperperiod ph to be the period oftime where all tasks in the set occur at different times and withoutreplication of the combination of release times. That is, all periodictasks in one hyperperiod are able to follow the same schedule asused in the previous hyperperiod. The hyperperiod is defined asthe least common multiple of the periods of all measurement tasksin s.
ph ¼ lcm pðs1Þ;pðs2Þ; . . . ;pðsnÞð Þ ð4Þ
Without loss of generality, we define the execution time eðsiÞ,initial available time aðsiÞ, and the period pðsiÞ as integer multiplesof a time unit which is referred to as a time slot. The deadline ofeach job dðsijÞ coincides with the period, that is, the job sij shouldbe completed before the next job siðjþ1Þ is available to be executed.According to this definition, Lemma 2 can be readily obtained:
Lemma 2. Given a measurement tasks set s ¼ fs1; s2; . . . ; sng, at anytime instance, there is at most one job available to be executed for anymeasurement task si 2 s.
Proof. At any time instance, there must be a job available for exe-cution at the beginning of that period. If there are some jobs gen-erated from previous periods still pending for execution, thosepostponed jobs passed their own deadlines and they are consid-ered as missed jobs. Hence, there is at most one job for each mea-surement task at any time instance. �
Fig. 3. Illustration of network measurement tasks.
4.2. Modeling of measurement scheduling
Our scheduling algorithms are based on graph theory. In the lit-erature, there are some articles using graph coloring to solve timeslots assignment problem [41–43], but most of them are designedfor single processing, which are not fit for multi-task processingsuch as the network measurement scenario.
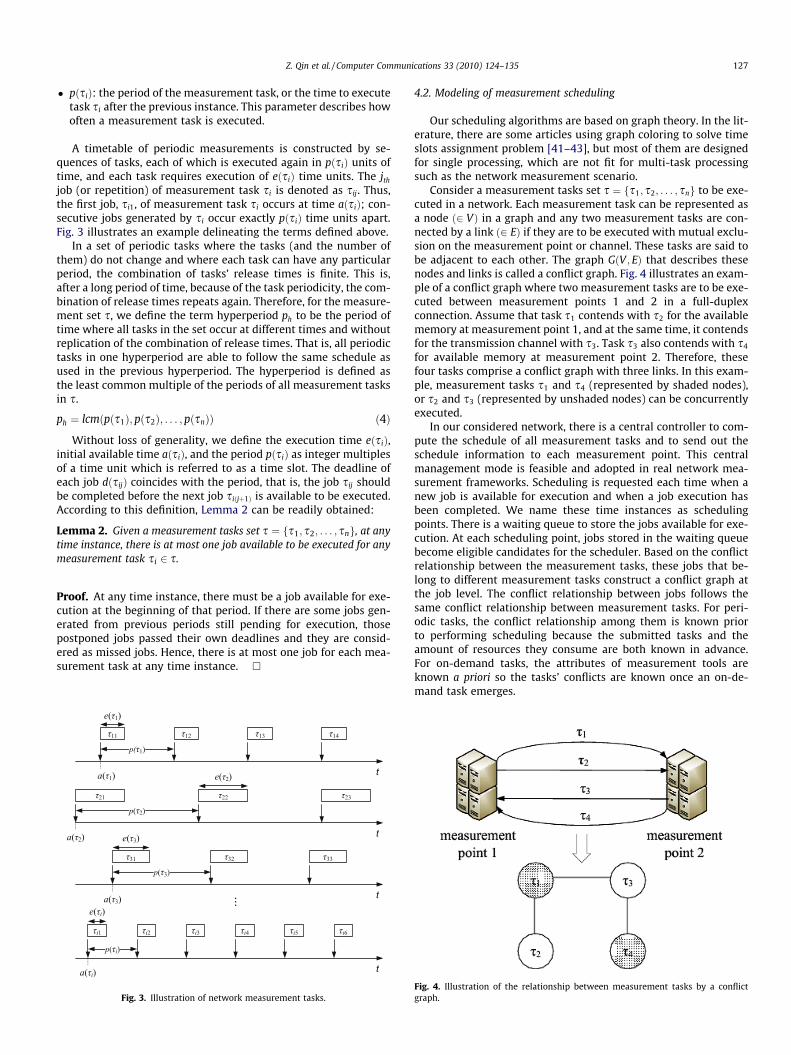
Consider a measurement tasks set s ¼ fs1; s2; . . . ; sng to be exe-cuted in a network. Each measurement task can be represented asa node ð2 VÞ in a graph and any two measurement tasks are con-nected by a link ð2 EÞ if they are to be executed with mutual exclu-sion on the measurement point or channel. These tasks are said tobe adjacent to each other. The graph GðV ; EÞ that describes thesenodes and links is called a conflict graph. Fig. 4 illustrates an exam-ple of a conflict graph where two measurement tasks are to be exe-cuted between measurement points 1 and 2 in a full-duplexconnection. Assume that task s1 contends with s2 for the availablememory at measurement point 1, and at the same time, it contendsfor the transmission channel with s3. Task s3 also contends with s4
for available memory at measurement point 2. Therefore, thesefour tasks comprise a conflict graph with three links. In this exam-ple, measurement tasks s1 and s4 (represented by shaded nodes),or s2 and s3 (represented by unshaded nodes) can be concurrentlyexecuted.
In our considered network, there is a central controller to com-pute the schedule of all measurement tasks and to send out theschedule information to each measurement point. This centralmanagement mode is feasible and adopted in real network mea-surement frameworks. Scheduling is requested each time when anew job is available for execution and when a job execution hasbeen completed. We name these time instances as schedulingpoints. There is a waiting queue to store the jobs available for exe-cution. At each scheduling point, jobs stored in the waiting queuebecome eligible candidates for the scheduler. Based on the conflictrelationship between the measurement tasks, these jobs that be-long to different measurement tasks construct a conflict graph atthe job level. The conflict relationship between jobs follows thesame conflict relationship between measurement tasks. For peri-odic tasks, the conflict relationship among them is known priorto performing scheduling because the submitted tasks and theamount of resources they consume are both known in advance.For on-demand tasks, the attributes of measurement tools areknown a priori so the tasks’ conflicts are known once an on-de-mand task emerges.
Fig. 4. Illustration of the relationship between measurement tasks by a conflictgraph.
128 Z. Qin et al. / Computer Communications 33 (2010) 124–135
As the measurement results obtained by earlier periodic mea-surement tasks are used to describe the current network perfor-mance, it is desired that the measurement tasks can becompleted as soon as possible after a task is available for execu-tion. Therefore, the scheduling problem is converted into a processto schedule the available jobs at each scheduling point so as tominimize the job waiting time for execution. At the same time,the scheduling of measurement jobs at one scheduling point isenunciated as the arrangement of the vertices of graph G at thejob level such that none of the nodes connected with each otherare scheduled for simultaneous execution. This process can be de-scribed as a vertex coloring problem as follows.
Scheduling of measurement tasks: Given a conflict graphGðV ; EÞ with vertices V ¼ VðGÞ, assign each vertex a color out ofthe range ½1;2; . . . ; k� such that no two adjacent vertices have thesame color.
Here, each color maps to one time slot. The color set to be usedby a vertex v ij in the conflict graph is mapped to the time range½tc; dðsijÞ� as described by Eq. (5), where tc is the current schedulingpoint and dðsijÞ is the deadline of the job mapped by vertex v ij. Thatis, the scheduler only considers the time slots prior to a job’sdeadline.
½1;2; . . . ; k� ! ½tc; dðsijÞ� ð5Þ
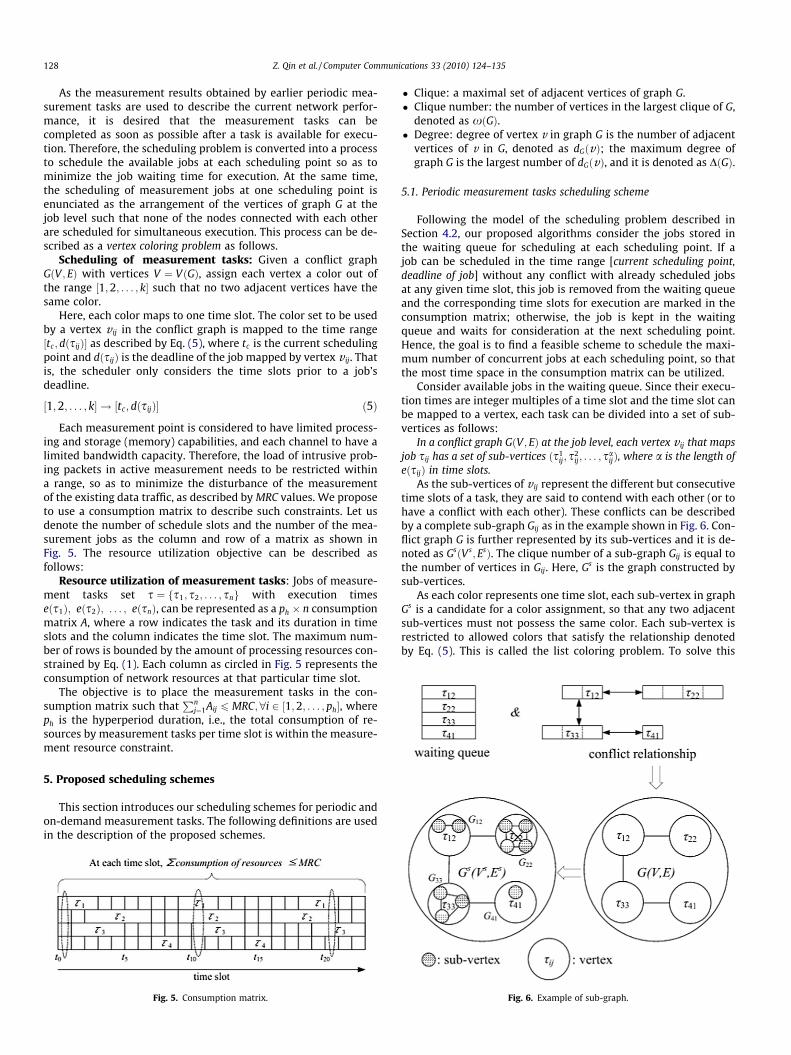
Each measurement point is considered to have limited process-ing and storage (memory) capabilities, and each channel to have alimited bandwidth capacity. Therefore, the load of intrusive prob-ing packets in active measurement needs to be restricted withina range, so as to minimize the disturbance of the measurementof the existing data traffic, as described by MRC values. We proposeto use a consumption matrix to describe such constraints. Let usdenote the number of schedule slots and the number of the mea-surement jobs as the column and row of a matrix as shown inFig. 5. The resource utilization objective can be described asfollows:
Resource utilization of measurement tasks: Jobs of measure-ment tasks set s ¼ fs1; s2; . . . ; sng with execution timeseðs1Þ; eðs2Þ; . . . ; eðsnÞ, can be represented as a ph � n consumptionmatrix A, where a row indicates the task and its duration in timeslots and the column indicates the time slot. The maximum num-ber of rows is bounded by the amount of processing resources con-strained by Eq. (1). Each column as circled in Fig. 5 represents theconsumption of network resources at that particular time slot.
The objective is to place the measurement tasks in the con-sumption matrix such that
Pnj¼1Aij 6 MRC;8i 2 ½1;2; . . . ; ph�, where
ph is the hyperperiod duration, i.e., the total consumption of re-sources by measurement tasks per time slot is within the measure-ment resource constraint.
5. Proposed scheduling schemes
This section introduces our scheduling schemes for periodic andon-demand measurement tasks. The following definitions are usedin the description of the proposed schemes.
Fig. 5. Consumption matrix.
� Clique: a maximal set of adjacent vertices of graph G.� Clique number: the number of vertices in the largest clique of G,
denoted as xðGÞ.� Degree: degree of vertex v in graph G is the number of adjacent
vertices of v in G, denoted as dGðvÞ; the maximum degree ofgraph G is the largest number of dGðvÞ, and it is denoted as DðGÞ.
5.1. Periodic measurement tasks scheduling scheme
Following the model of the scheduling problem described inSection 4.2, our proposed algorithms consider the jobs stored inthe waiting queue for scheduling at each scheduling point. If ajob can be scheduled in the time range [current scheduling point,deadline of job] without any conflict with already scheduled jobsat any given time slot, this job is removed from the waiting queueand the corresponding time slots for execution are marked in theconsumption matrix; otherwise, the job is kept in the waitingqueue and waits for consideration at the next scheduling point.Hence, the goal is to find a feasible scheme to schedule the maxi-mum number of concurrent jobs at each scheduling point, so thatthe most time space in the consumption matrix can be utilized.
Consider available jobs in the waiting queue. Since their execu-tion times are integer multiples of a time slot and the time slot canbe mapped to a vertex, each task can be divided into a set of sub-vertices as follows:
In a conflict graph GðV ; EÞ at the job level, each vertex v ij that mapsjob sij has a set of sub-vertices ðs1
ij; s2ij; . . . ; sa
ijÞ, where a is the length ofeðsijÞ in time slots.
As the sub-vertices of v ij represent the different but consecutivetime slots of a task, they are said to contend with each other (or tohave a conflict with each other). These conflicts can be describedby a complete sub-graph Gij as in the example shown in Fig. 6. Con-flict graph G is further represented by its sub-vertices and it is de-noted as GsðVs; EsÞ. The clique number of a sub-graph Gij is equal tothe number of vertices in Gij. Here, Gs is the graph constructed bysub-vertices.
As each color represents one time slot, each sub-vertex in graphGs is a candidate for a color assignment, so that any two adjacentsub-vertices must not possess the same color. Each sub-vertex isrestricted to allowed colors that satisfy the relationship denotedby Eq. (5). This is called the list coloring problem. To solve this
Fig. 6. Example of sub-graph.
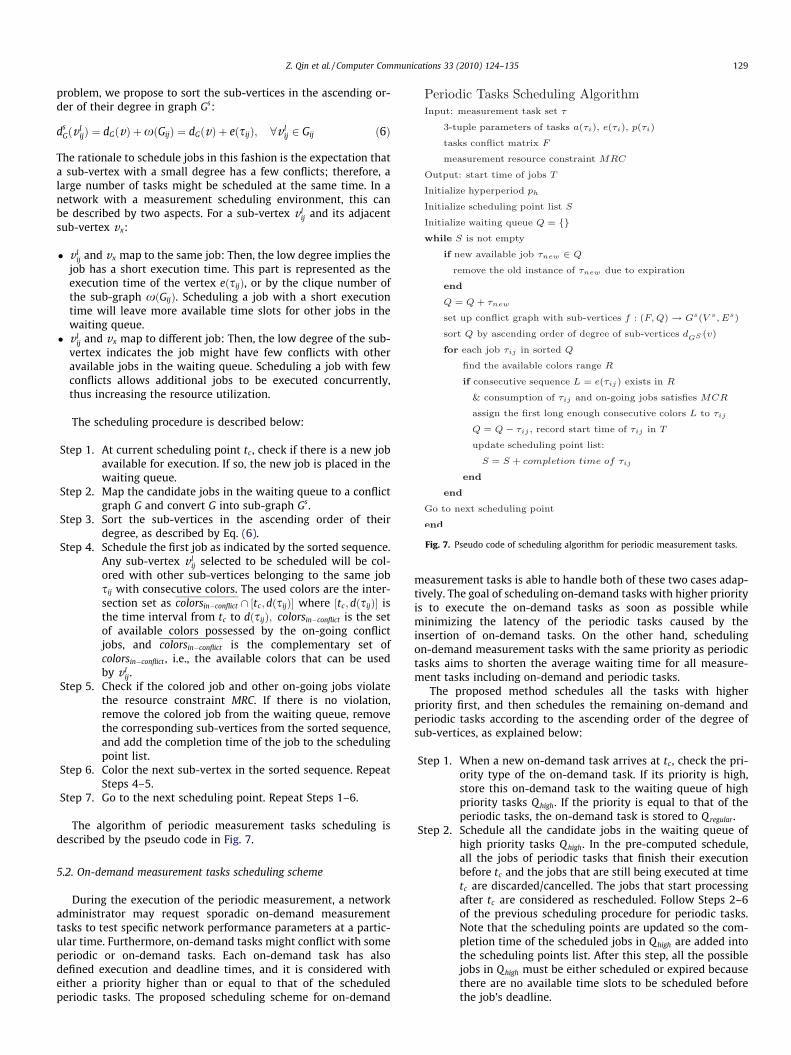
Fig. 7. Pseudo code of scheduling algorithm for periodic measurement tasks.
Z. Qin et al. / Computer Communications 33 (2010) 124–135 129
problem, we propose to sort the sub-vertices in the ascending or-der of their degree in graph Gs:
dsGðv l
ijÞ ¼ dGðvÞ þxðGijÞ ¼ dGðvÞ þ eðsijÞ; 8v lij 2 Gij ð6Þ
The rationale to schedule jobs in this fashion is the expectation thata sub-vertex with a small degree has a few conflicts; therefore, alarge number of tasks might be scheduled at the same time. In anetwork with a measurement scheduling environment, this canbe described by two aspects. For a sub-vertex v l
ij and its adjacentsub-vertex vx:
� v lij and vx map to the same job: Then, the low degree implies the
job has a short execution time. This part is represented as theexecution time of the vertex eðsijÞ, or by the clique number ofthe sub-graph xðGijÞ. Scheduling a job with a short executiontime will leave more available time slots for other jobs in thewaiting queue.
� v lij and vx map to different job: Then, the low degree of the sub-
vertex indicates the job might have few conflicts with otheravailable jobs in the waiting queue. Scheduling a job with fewconflicts allows additional jobs to be executed concurrently,thus increasing the resource utilization.
The scheduling procedure is described below:
Step 1. At current scheduling point tc , check if there is a new jobavailable for execution. If so, the new job is placed in thewaiting queue.
Step 2. Map the candidate jobs in the waiting queue to a conflictgraph G and convert G into sub-graph Gs.
Step 3. Sort the sub-vertices in the ascending order of theirdegree, as described by Eq. (6).
Step 4. Schedule the first job as indicated by the sorted sequence.Any sub-vertex v l
ij selected to be scheduled will be col-ored with other sub-vertices belonging to the same jobsij with consecutive colors. The used colors are the inter-section set as colorsin�conflict \ ½tc; dðsijÞ� where ½tc; dðsijÞ� isthe time interval from tc to dðsijÞ; colorsin�conflict is the setof available colors possessed by the on-going conflictjobs, and colorsin�conflict is the complementary set ofcolorsin�conflict , i.e., the available colors that can be usedby v l
ij.Step 5. Check if the colored job and other on-going jobs violate
the resource constraint MRC. If there is no violation,remove the colored job from the waiting queue, removethe corresponding sub-vertices from the sorted sequence,and add the completion time of the job to the schedulingpoint list.
Step 6. Color the next sub-vertex in the sorted sequence. RepeatSteps 4–5.
Step 7. Go to the next scheduling point. Repeat Steps 1–6.
The algorithm of periodic measurement tasks scheduling isdescribed by the pseudo code in Fig. 7.
5.2. On-demand measurement tasks scheduling scheme
During the execution of the periodic measurement, a networkadministrator may request sporadic on-demand measurementtasks to test specific network performance parameters at a partic-ular time. Furthermore, on-demand tasks might conflict with someperiodic or on-demand tasks. Each on-demand task has alsodefined execution and deadline times, and it is considered witheither a priority higher than or equal to that of the scheduledperiodic tasks. The proposed scheduling scheme for on-demand
measurement tasks is able to handle both of these two cases adap-tively. The goal of scheduling on-demand tasks with higher priorityis to execute the on-demand tasks as soon as possible whileminimizing the latency of the periodic tasks caused by theinsertion of on-demand tasks. On the other hand, schedulingon-demand measurement tasks with the same priority as periodictasks aims to shorten the average waiting time for all measure-ment tasks including on-demand and periodic tasks.
The proposed method schedules all the tasks with higherpriority first, and then schedules the remaining on-demand andperiodic tasks according to the ascending order of the degree ofsub-vertices, as explained below:
Step 1. When a new on-demand task arrives at tc , check the pri-ority type of the on-demand task. If its priority is high,store this on-demand task to the waiting queue of highpriority tasks Q high. If the priority is equal to that of theperiodic tasks, the on-demand task is stored to Q regular .
Step 2. Schedule all the candidate jobs in the waiting queue ofhigh priority tasks Q high. In the pre-computed schedule,all the jobs of periodic tasks that finish their executionbefore tc and the jobs that are still being executed at timetc are discarded/cancelled. The jobs that start processingafter tc are considered as rescheduled. Follow Steps 2–6of the previous scheduling procedure for periodic tasks.Note that the scheduling points are updated so the com-pletion time of the scheduled jobs in Qhigh are added intothe scheduling points list. After this step, all the possiblejobs in Qhigh must be either scheduled or expired becausethere are no available time slots to be scheduled beforethe job’s deadline.
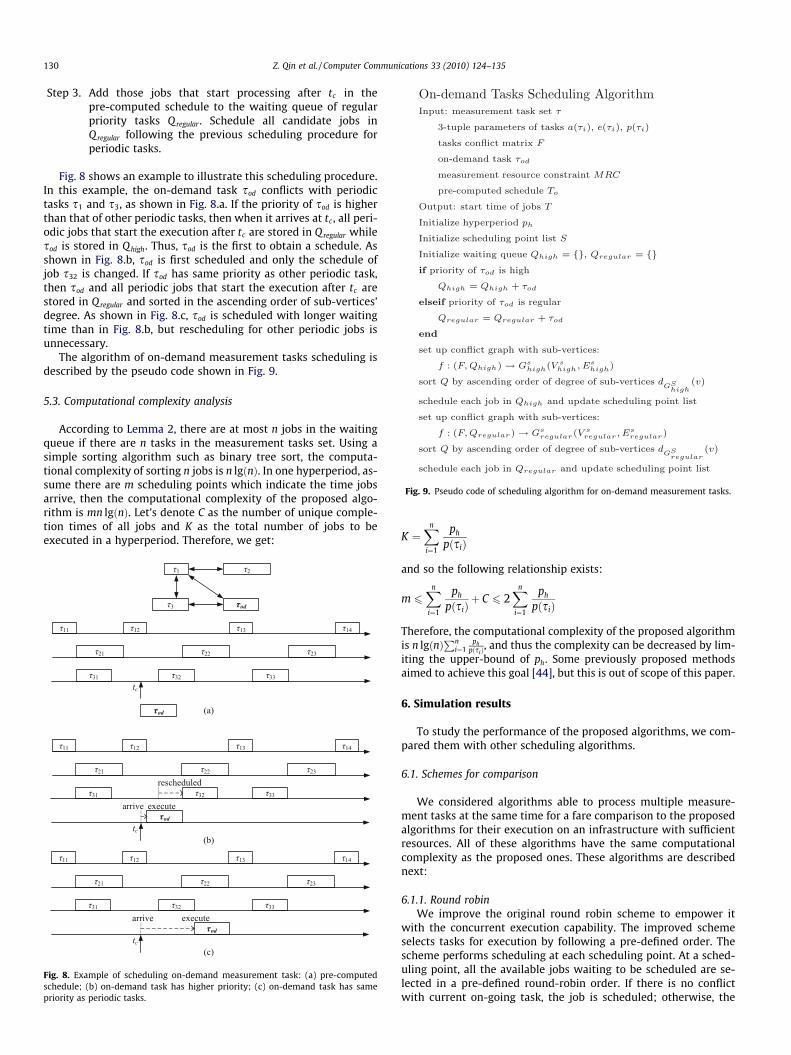
Fig. 9. Pseudo code of scheduling algorithm for on-demand measurement tasks.
130 Z. Qin et al. / Computer Communications 33 (2010) 124–135
Step 3. Add those jobs that start processing after tc in thepre-computed schedule to the waiting queue of regularpriority tasks Q regular . Schedule all candidate jobs inQregular following the previous scheduling procedure forperiodic tasks.
Fig. 8 shows an example to illustrate this scheduling procedure.In this example, the on-demand task sod conflicts with periodictasks s1 and s3, as shown in Fig. 8.a. If the priority of sod is higherthan that of other periodic tasks, then when it arrives at tc , all peri-odic jobs that start the execution after tc are stored in Qregular whilesod is stored in Qhigh. Thus, sod is the first to obtain a schedule. Asshown in Fig. 8.b, sod is first scheduled and only the schedule ofjob s32 is changed. If sod has same priority as other periodic task,then sod and all periodic jobs that start the execution after tc arestored in Qregular and sorted in the ascending order of sub-vertices’degree. As shown in Fig. 8.c, sod is scheduled with longer waitingtime than in Fig. 8.b, but rescheduling for other periodic jobs isunnecessary.
The algorithm of on-demand measurement tasks scheduling isdescribed by the pseudo code shown in Fig. 9.
5.3. Computational complexity analysis
According to Lemma 2, there are at most n jobs in the waitingqueue if there are n tasks in the measurement tasks set. Using asimple sorting algorithm such as binary tree sort, the computa-tional complexity of sorting n jobs is n lgðnÞ. In one hyperperiod, as-sume there are m scheduling points which indicate the time jobsarrive, then the computational complexity of the proposed algo-rithm is mn lgðnÞ. Let’s denote C as the number of unique comple-tion times of all jobs and K as the total number of jobs to beexecuted in a hyperperiod. Therefore, we get:
Fig. 8. Example of scheduling on-demand measurement task: (a) pre-computedschedule; (b) on-demand task has higher priority; (c) on-demand task has samepriority as periodic tasks.
K ¼Xn
i¼1
ph
pðsiÞ
and so the following relationship exists:
m 6Xn
i¼1
ph
pðsiÞþ C 6 2
Xn
i¼1
ph
pðsiÞ
Therefore, the computational complexity of the proposed algorithmis n lgðnÞ
Pni¼1
phpðsiÞ
, and thus the complexity can be decreased by lim-iting the upper-bound of ph. Some previously proposed methodsaimed to achieve this goal [44], but this is out of scope of this paper.
6. Simulation results
To study the performance of the proposed algorithms, we com-pared them with other scheduling algorithms.
6.1. Schemes for comparison
We considered algorithms able to process multiple measure-ment tasks at the same time for a fare comparison to the proposedalgorithms for their execution on an infrastructure with sufficientresources. All of these algorithms have the same computationalcomplexity as the proposed ones. These algorithms are describednext:
6.1.1. Round robinWe improve the original round robin scheme to empower it
with the concurrent execution capability. The improved schemeselects tasks for execution by following a pre-defined order. Thescheme performs scheduling at each scheduling point. At a sched-uling point, all the available jobs waiting to be scheduled are se-lected in a pre-defined round-robin order. If there is no conflictwith current on-going task, the job is scheduled; otherwise, the
Z. Qin et al. / Computer Communications 33 (2010) 124–135 131
job is kept in the queue to be considered/scheduled at the nextscheduling point. This algorithm is described in Fig. 10.
6.1.2. Descending order of sub-vertices’ degree (DOSD)This scheme, also introduced here for comparison purposes, fol-
lows a similar procedure as described in Section 5.1 for the ascend-ing order version, except that this scheme sorts the jobs in thewaiting queue in the descending order of the degree of the sub-vertices mapped to the jobs, in Step 3.
6.2. Evaluation method
The algorithms are compared in terms of the average normal-ized waiting time of all jobs in one hyperperiod that is defined asbelow:
Avg: normalized waiting time ¼ avgXwðsijÞ
pðsijÞ
� �
where wðsijÞ is the waiting time of the job sij. wðsijÞ is formallydefined as the difference between the time that the job starts exe-cution and the beginning time the job is available to be executed. Inthe worst case, some measurement jobs may be missed due to timeexpiration (i.e., the waiting time exceeds the task period). We definethe waiting time of the missed job equal to its period time.
As the network performance is monitored by periodic measure-ment requests, the measurement jobs are expected to be scheduledat desired sampling times that the interval time between any twoconsecutive samplings is a constant. However, because of the con-flict of the network measurement tasks, the measurement jobs arescheduled at the time deviated from the desired sampling times.
Fig. 10. Illustration of the improved round robin scheduling algorithm.
The average normalized waiting time is used to reflect how severesuch deviation impacts the acceptance of the measurement sam-pling results. For example, if a measurement task with period equalto 20 min waits for 1.5 min to start execution, the measurementresult is still acceptable to be used as periodic samples. However,if a measurement task with period 2 min waits for 1.5 min for exe-cution, the measurement sample obtained is far from the expectedmeasurement sampling time.
Another evaluation parameter is the execution success ratio ofjobs to be executed, which is defined as:
Execution success ratio¼number of executed jobs in one hyperperiodnumber of total jobs in one hyperperiod
6.3. Simulation results of periodic tasks scheduling
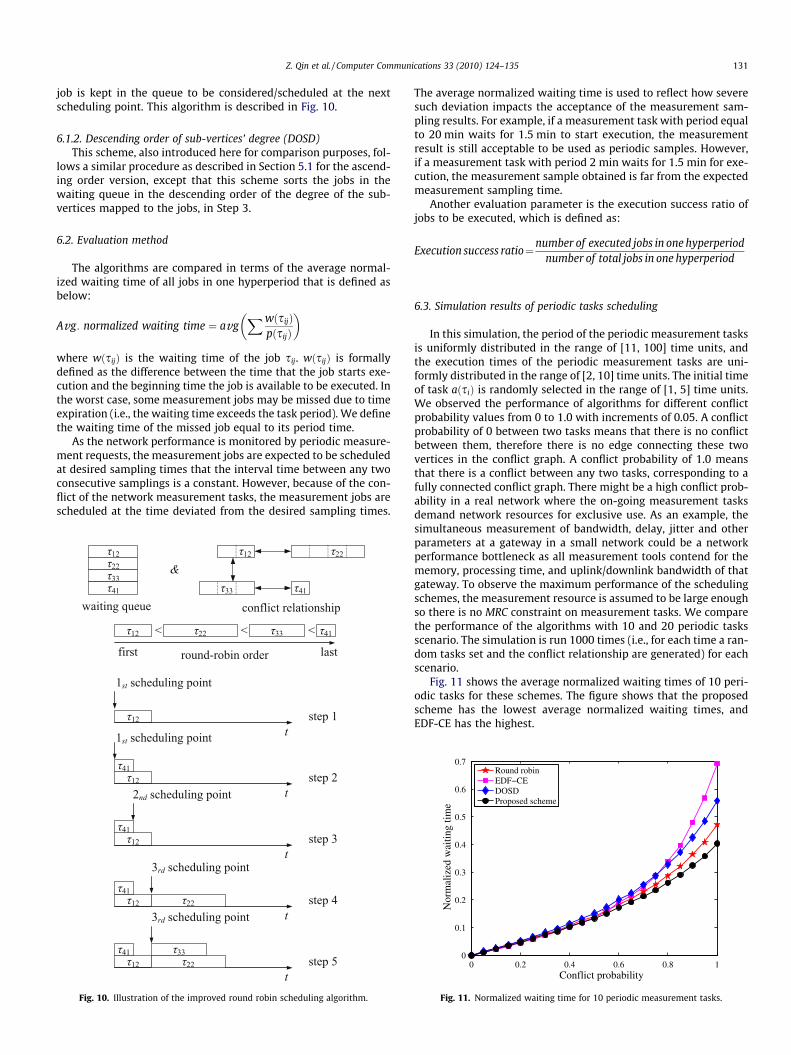
In this simulation, the period of the periodic measurement tasksis uniformly distributed in the range of [11, 100] time units, andthe execution times of the periodic measurement tasks are uni-formly distributed in the range of [2, 10] time units. The initial timeof task aðsiÞ is randomly selected in the range of [1, 5] time units.We observed the performance of algorithms for different conflictprobability values from 0 to 1.0 with increments of 0.05. A conflictprobability of 0 between two tasks means that there is no conflictbetween them, therefore there is no edge connecting these twovertices in the conflict graph. A conflict probability of 1.0 meansthat there is a conflict between any two tasks, corresponding to afully connected conflict graph. There might be a high conflict prob-ability in a real network where the on-going measurement tasksdemand network resources for exclusive use. As an example, thesimultaneous measurement of bandwidth, delay, jitter and otherparameters at a gateway in a small network could be a networkperformance bottleneck as all measurement tools contend for thememory, processing time, and uplink/downlink bandwidth of thatgateway. To observe the maximum performance of the schedulingschemes, the measurement resource is assumed to be large enoughso there is no MRC constraint on measurement tasks. We comparethe performance of the algorithms with 10 and 20 periodic tasksscenario. The simulation is run 1000 times (i.e., for each time a ran-dom tasks set and the conflict relationship are generated) for eachscenario.
Fig. 11 shows the average normalized waiting times of 10 peri-odic tasks for these schemes. The figure shows that the proposedscheme has the lowest average normalized waiting times, andEDF-CE has the highest.
0 0.2 0.4 0.6 0.8 10
0.1
0.2
0.3
0.4
0.5
0.6
0.7
Conflict probability
Nor
mal
ized
wai
ting
time
Round robinEDF−CEDOSDProposed scheme
Fig. 11. Normalized waiting time for 10 periodic measurement tasks.

0 0.2 0.4 0.6 0.8 10.2
0.3
0.4
0.5
0.6
0.7
0.8
0.9
1
Conflict probability
Exe
cutio
n su
cces
s ra
tio
Round robinEDF−CEDOSDProposed scheme
Fig. 14. Execution success ratio for 20 periodic measurement tasks.
132 Z. Qin et al. / Computer Communications 33 (2010) 124–135
Fig. 12 shows the success ratio of 10 periodic tasks of the com-pared schemes. The figure shows that as the conflict probability in-creases, the success ratio of the schemes decreases. Here, thesuccess ratio of the proposed scheme is the highest among otherschemes as this scheme misses scheduling the fewest number oftasks as compared to the other schemes, while DOSD, which sortsthe task in the opposite order, has the lowest success ratio. Thecombination that increases the success ratio seems to be the selec-tion of a small task and with a small number of conflicts.
Fig. 13 shows the normalized waiting times of these schemeswith 20 tasks. The outcome for 20 tasks is similar to the case with10 tasks, where the proposed scheme achieves the lowest waitingtime. The advantage of using the proposed scheme is more pro-nounced for scenarios with a larger number of tasks.
Fig. 14 shows that the proposed scheduling scheme and the EDF-CE scheme provide similar execution success ratio, which is thehighest success ratio as compared to round robin and DOSDschemes. We can see that when the conflict probability is lowerthan 0.5, the performance of all algorithms is similar, but as the con-flict probability increases, the performance differences of theschemes become more pronounced. As an interesting observation,when the conflict probability is 1, where no more than one jobcan be executed at a time by any of the schemes, the waiting timeand success ratio of the schemes show differences. The low successprobability of DOSD is expected as it selects jobs with long execu-tion time first, and the remaining time will then be left to a large
0 0.2 0.4 0.6 0.8 10.55
0.6
0.65
0.7
0.75
0.8
0.85
0.9
0.95
1
Conflict probability
Exe
cutio
n su
cces
s ra
tio
Round robinEDF−CEDOSDProposed scheme
Fig. 12. Execution success ratio for 10 periodic measurement tasks.
0 0.2 0.4 0.6 0.8 10
0.1
0.2
0.3
0.4
0.5
0.6
0.7
0.8
0.9
Conflict probability
Nor
mal
ized
wai
ting
time
Round robinEDF−CEDOSDProposed scheme
Fig. 13. Normalized waiting time for 20 periodic measurement tasks.
number of tasks that may be delayed close to or beyond the endof their periods; therefore, a large number of jobs are missed. Inthe proposed scheduling algorithm, the degree of a sub-vertex isdecided by the length of the execution time of the job, so thatscheduling by the ascending order of the degree means that thejob with the shortest execution time is scheduled first. This selec-tion can potentially save a larger number of time slots for the sub-sequent jobs in the waiting queue. Therefore, the performance ofthis algorithm is also the highest with the conflict probability of 1.0.
We also simulated a scenario where the execution times of peri-odic measurement tasks are non-uniformly distributed. The peri-odic measurement task set is composed of 10 measurementtasks. The execution time of 5 measurement tasks are uniformlydistributed in the range of [2, 10] time units while the executiontime of the rest of 5 tasks are randomly selected in the range of[8, 10] time units. The period of the tasks is uniformly distributedin the range of [11, 100] time units. The initial available time of atask is randomly selected in the range of [1, 5] time units. The sim-ulation is run 1000 times.
Fig. 15 shows the average normalized waiting times under non-uniform distribution in the execution time of the 10 tasks. Thelarge number of tasks with long execution times is not beneficialto the proposed scheme, but the proposed scheme still achievesthe lowest normalized waiting time among all compared schemes.The round-robin scheme achieves similar normalized waiting
0 0.2 0.4 0.6 0.8 10
0.1
0.2
0.3
0.4
0.5
0.6
0.7
0.8
Conflict probability
Nor
mal
ized
wai
ting
time
Round robinEDF−CEDOSDProposed scheme
Fig. 15. Normalized waiting time for 10 periodic measurement tasks withnon-uniformly distributed execution times.
0 0.2 0.4 0.6 0.8 10
10
20
30
40
50
60
Conflict probability
Ave
rage
wai
ting
time
of o
n−de
man
d ta
sks
(tim
e un
its)
Round robinEDF−CEDOSDProposed scheme
Z. Qin et al. / Computer Communications 33 (2010) 124–135 133
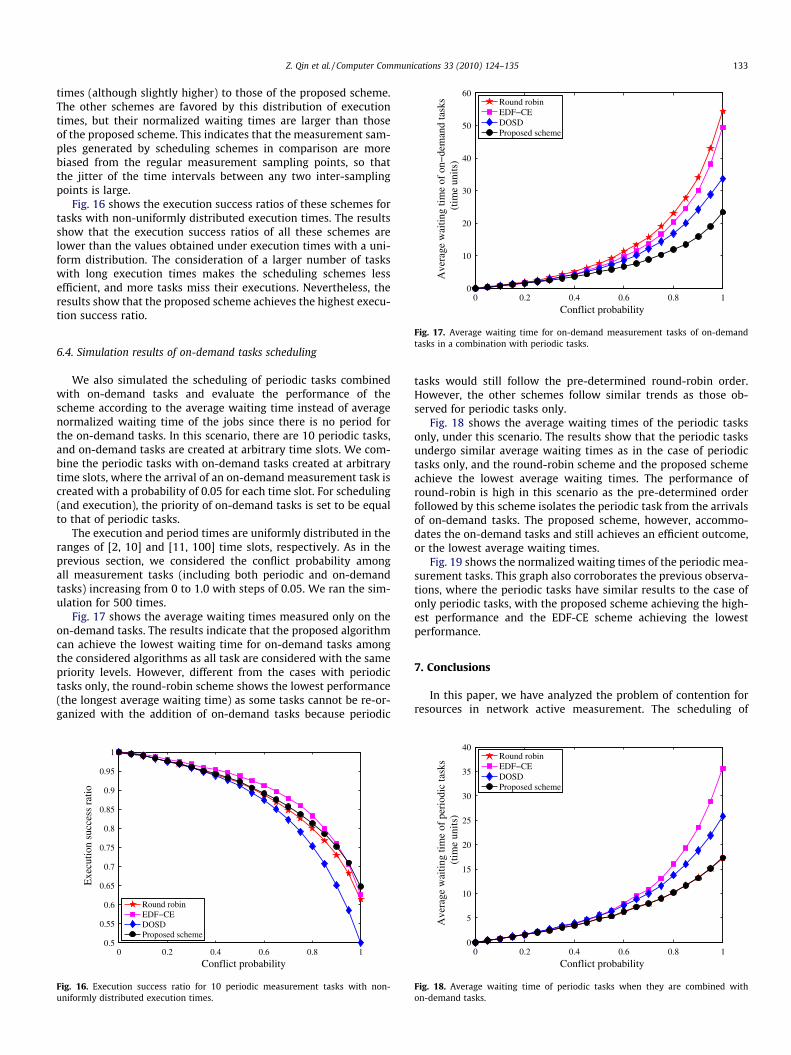
times (although slightly higher) to those of the proposed scheme.The other schemes are favored by this distribution of executiontimes, but their normalized waiting times are larger than thoseof the proposed scheme. This indicates that the measurement sam-ples generated by scheduling schemes in comparison are morebiased from the regular measurement sampling points, so thatthe jitter of the time intervals between any two inter-samplingpoints is large.
Fig. 16 shows the execution success ratios of these schemes fortasks with non-uniformly distributed execution times. The resultsshow that the execution success ratios of all these schemes arelower than the values obtained under execution times with a uni-form distribution. The consideration of a larger number of taskswith long execution times makes the scheduling schemes lessefficient, and more tasks miss their executions. Nevertheless, theresults show that the proposed scheme achieves the highest execu-tion success ratio.
Fig. 17. Average waiting time for on-demand measurement tasks of on-demandtasks in a combination with periodic tasks.
6.4. Simulation results of on-demand tasks scheduling
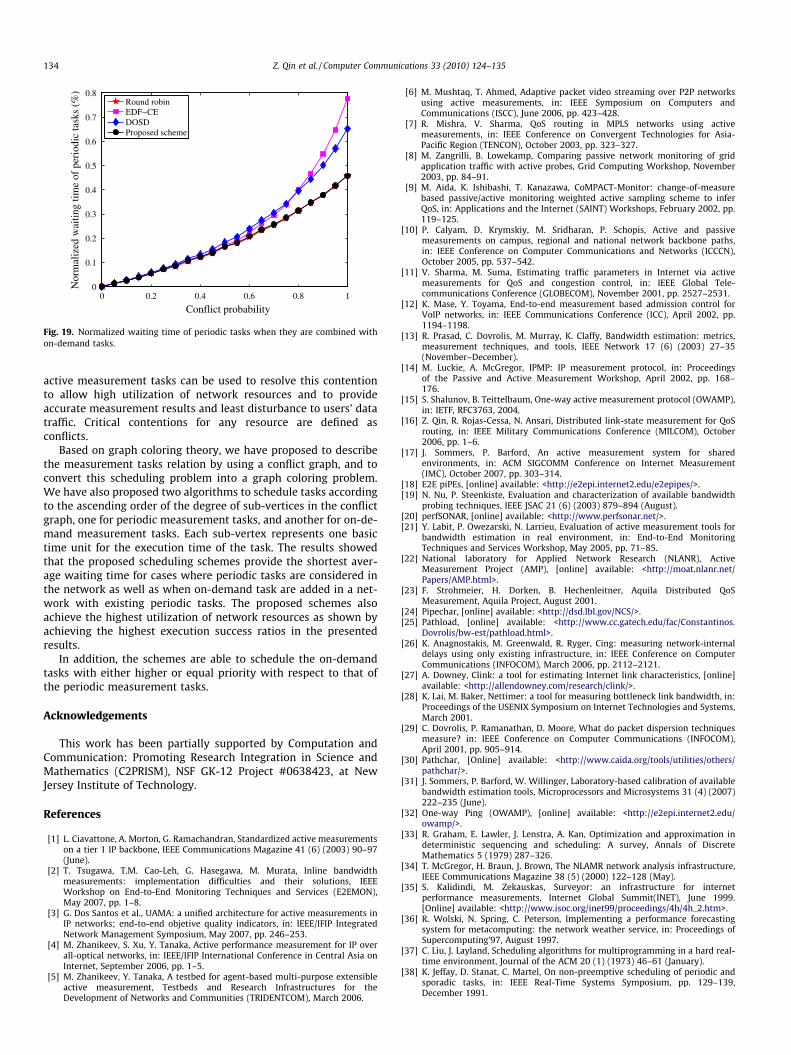
We also simulated the scheduling of periodic tasks combinedwith on-demand tasks and evaluate the performance of thescheme according to the average waiting time instead of averagenormalized waiting time of the jobs since there is no period forthe on-demand tasks. In this scenario, there are 10 periodic tasks,and on-demand tasks are created at arbitrary time slots. We com-bine the periodic tasks with on-demand tasks created at arbitrarytime slots, where the arrival of an on-demand measurement task iscreated with a probability of 0.05 for each time slot. For scheduling(and execution), the priority of on-demand tasks is set to be equalto that of periodic tasks.
The execution and period times are uniformly distributed in theranges of [2, 10] and [11, 100] time slots, respectively. As in theprevious section, we considered the conflict probability amongall measurement tasks (including both periodic and on-demandtasks) increasing from 0 to 1.0 with steps of 0.05. We ran the sim-ulation for 500 times.
Fig. 17 shows the average waiting times measured only on theon-demand tasks. The results indicate that the proposed algorithmcan achieve the lowest waiting time for on-demand tasks amongthe considered algorithms as all task are considered with the samepriority levels. However, different from the cases with periodictasks only, the round-robin scheme shows the lowest performance(the longest average waiting time) as some tasks cannot be re-or-ganized with the addition of on-demand tasks because periodic
0 0.2 0.4 0.6 0.8 10.5
0.55
0.6
0.65
0.7
0.75
0.8
0.85
0.9
0.95
1
Conflict probability
Exe
cutio
n su
cces
s ra
tio
Round robinEDF−CEDOSDProposed scheme
Fig. 16. Execution success ratio for 10 periodic measurement tasks with non-uniformly distributed execution times.
tasks would still follow the pre-determined round-robin order.However, the other schemes follow similar trends as those ob-served for periodic tasks only.
Fig. 18 shows the average waiting times of the periodic tasksonly, under this scenario. The results show that the periodic tasksundergo similar average waiting times as in the case of periodictasks only, and the round-robin scheme and the proposed schemeachieve the lowest average waiting times. The performance ofround-robin is high in this scenario as the pre-determined orderfollowed by this scheme isolates the periodic task from the arrivalsof on-demand tasks. The proposed scheme, however, accommo-dates the on-demand tasks and still achieves an efficient outcome,or the lowest average waiting times.
Fig. 19 shows the normalized waiting times of the periodic mea-surement tasks. This graph also corroborates the previous observa-tions, where the periodic tasks have similar results to the case ofonly periodic tasks, with the proposed scheme achieving the high-est performance and the EDF-CE scheme achieving the lowestperformance.
7. Conclusions
In this paper, we have analyzed the problem of contention forresources in network active measurement. The scheduling of
0 0.2 0.4 0.6 0.8 10
5
10
15
20
25
30
35
40
Conflict probability
Ave
rage
wai
ting
time
of p
erio
dic
task
s
(tim
e un
its)
Round robinEDF−CEDOSDProposed scheme
Fig. 18. Average waiting time of periodic tasks when they are combined withon-demand tasks.
0 0.2 0.4 0.6 0.8 10
0.1
0.2
0.3
0.4
0.5
0.6
0.7
0.8
Conflict probability
Nor
mal
ized
wai
ting
time
of p
erio
dic
task
s (%
)
Round robinEDF−CEDOSDProposed scheme
Fig. 19. Normalized waiting time of periodic tasks when they are combined withon-demand tasks.
134 Z. Qin et al. / Computer Communications 33 (2010) 124–135
active measurement tasks can be used to resolve this contentionto allow high utilization of network resources and to provideaccurate measurement results and least disturbance to users’ datatraffic. Critical contentions for any resource are defined asconflicts.
Based on graph coloring theory, we have proposed to describethe measurement tasks relation by using a conflict graph, and toconvert this scheduling problem into a graph coloring problem.We have also proposed two algorithms to schedule tasks accordingto the ascending order of the degree of sub-vertices in the conflictgraph, one for periodic measurement tasks, and another for on-de-mand measurement tasks. Each sub-vertex represents one basictime unit for the execution time of the task. The results showedthat the proposed scheduling schemes provide the shortest aver-age waiting time for cases where periodic tasks are considered inthe network as well as when on-demand task are added in a net-work with existing periodic tasks. The proposed schemes alsoachieve the highest utilization of network resources as shown byachieving the highest execution success ratios in the presentedresults.
In addition, the schemes are able to schedule the on-demandtasks with either higher or equal priority with respect to that ofthe periodic measurement tasks.
Acknowledgements
This work has been partially supported by Computation andCommunication: Promoting Research Integration in Science andMathematics (C2PRISM), NSF GK-12 Project #0638423, at NewJersey Institute of Technology.
References
[1] L. Ciavattone, A. Morton, G. Ramachandran, Standardized active measurementson a tier 1 IP backbone, IEEE Communications Magazine 41 (6) (2003) 90–97(June).
[2] T. Tsugawa, T.M. Cao-Leh, G. Hasegawa, M. Murata, Inline bandwidthmeasurements: implementation difficulties and their solutions, IEEEWorkshop on End-to-End Monitoring Techniques and Services (E2EMON),May 2007, pp. 1–8.
[3] G. Dos Santos et al., UAMA: a unified architecture for active measurements inIP networks; end-to-end objetive quality indicators, in: IEEE/IFIP IntegratedNetwork Management Symposium, May 2007, pp. 246–253.
[4] M. Zhanikeev, S. Xu, Y. Tanaka, Active performance measurement for IP overall-optical networks, in: IEEE/IFIP International Conference in Central Asia onInternet, September 2006, pp. 1–5.
[5] M. Zhanikeev, Y. Tanaka, A testbed for agent-based multi-purpose extensibleactive measurement, Testbeds and Research Infrastructures for theDevelopment of Networks and Communities (TRIDENTCOM), March 2006.
[6] M. Mushtaq, T. Ahmed, Adaptive packet video streaming over P2P networksusing active measurements, in: IEEE Symposium on Computers andCommunications (ISCC), June 2006, pp. 423–428.
[7] R. Mishra, V. Sharma, QoS routing in MPLS networks using activemeasurements, in: IEEE Conference on Convergent Technologies for Asia-Pacific Region (TENCON), October 2003, pp. 323–327.
[8] M. Zangrilli, B. Lowekamp, Comparing passive network monitoring of gridapplication traffic with active probes, Grid Computing Workshop, November2003, pp. 84–91.
[9] M. Aida, K. Ishibashi, T. Kanazawa, CoMPACT-Monitor: change-of-measurebased passive/active monitoring weighted active sampling scheme to inferQoS, in: Applications and the Internet (SAINT) Workshops, February 2002, pp.119–125.
[10] P. Calyam, D. Krymskiy, M. Sridharan, P. Schopis, Active and passivemeasurements on campus, regional and national network backbone paths,in: IEEE Conference on Computer Communications and Networks (ICCCN),October 2005, pp. 537–542.
[11] V. Sharma, M. Suma, Estimating traffic parameters in Internet via activemeasurements for QoS and congestion control, in: IEEE Global Tele-communications Conference (GLOBECOM), November 2001, pp. 2527–2531.
[12] K. Mase, Y. Toyama, End-to-end measurement based admission control forVoIP networks, in: IEEE Communications Conference (ICC), April 2002, pp.1194–1198.
[13] R. Prasad, C. Dovrolis, M. Murray, K. Claffy, Bandwidth estimation: metrics,measurement techniques, and tools, IEEE Network 17 (6) (2003) 27–35(November–December).
[14] M. Luckie, A. McGregor, IPMP: IP measurement protocol, in: Proceedingsof the Passive and Active Measurement Workshop, April 2002, pp. 168–176.
[15] S. Shalunov, B. Teittelbaum, One-way active measurement protocol (OWAMP),in: IETF, RFC3763, 2004.
[16] Z. Qin, R. Rojas-Cessa, N. Ansari, Distributed link-state measurement for QoSrouting, in: IEEE Military Communications Conference (MILCOM), October2006, pp. 1–6.
[17] J. Sommers, P. Barford, An active measurement system for sharedenvironments, in: ACM SIGCOMM Conference on Internet Measurement(IMC), October 2007, pp. 303–314.
[18] E2E piPEs, [online] available: <http://e2epi.internet2.edu/e2epipes/>.[19] N. Nu, P. Steenkiste, Evaluation and characterization of available bandwidth
probing techniques, IEEE JSAC 21 (6) (2003) 879–894 (August).[20] perfSONAR, [online] available: <http://www.perfsonar.net/>.[21] Y. Labit, P. Owezarski, N. Larrieu, Evaluation of active measurement tools for
bandwidth estimation in real environment, in: End-to-End MonitoringTechniques and Services Workshop, May 2005, pp. 71–85.
[22] National laboratory for Applied Network Research (NLANR), ActiveMeasurement Project (AMP), [online] available: <http://moat.nlanr.net/Papers/AMP.html>.
[23] F. Strohmeier, H. Dorken, B. Hechenleitner, Aquila Distributed QoSMeasurement, Aquila Project, August 2001.
[24] Pipechar, [online] available: <http://dsd.lbl.gov/NCS/>.[25] Pathload, [online] available: <http://www.cc.gatech.edu/fac/Constantinos.
Dovrolis/bw-est/pathload.html>.[26] K. Anagnostakis, M. Greenwald, R. Ryger, Cing: measuring network-internal
delays using only existing infrastructure, in: IEEE Conference on ComputerCommunications (INFOCOM), March 2006, pp. 2112–2121.
[27] A. Downey, Clink: a tool for estimating Internet link characteristics, [online]available: <http://allendowney.com/research/clink/>.
[28] K. Lai, M. Baker, Nettimer: a tool for measuring bottleneck link bandwidth, in:Proceedings of the USENIX Symposium on Internet Technologies and Systems,March 2001.
[29] C. Dovrolis, P. Ramanathan, D. Moore, What do packet dispersion techniquesmeasure? in: IEEE Conference on Computer Communications (INFOCOM),April 2001, pp. 905–914.
[30] Pathchar, [Online] available: <http://www.caida.org/tools/utilities/others/pathchar/>.
[31] J. Sommers, P. Barford, W. Willinger, Laboratory-based calibration of availablebandwidth estimation tools, Microprocessors and Microsystems 31 (4) (2007)222–235 (June).
[32] One-way Ping (OWAMP), [online] available: <http://e2epi.internet2.edu/owamp/>.
[33] R. Graham, E. Lawler, J. Lenstra, A. Kan, Optimization and approximation indeterministic sequencing and scheduling: A survey, Annals of DiscreteMathematics 5 (1979) 287–326.
[34] T. McGregor, H. Braun, J. Brown, The NLAMR network analysis infrastructure,IEEE Communications Magazine 38 (5) (2000) 122–128 (May).
[35] S. Kalidindi, M. Zekauskas, Surveyor: an infrastructure for internetperformance measurements, Internet Global Summit(INET), June 1999.[Online] available: <http://www.isoc.org/inet99/proceedings/4h/4h_2.htm>.
[36] R. Wolski, N. Spring, C. Peterson, Implementing a performance forecastingsystem for metacomputing: the network weather service, in: Proceedings ofSupercomputing’97, August 1997.
[37] C. Liu, J. Layland, Scheduling algorithms for multiprogramming in a hard real-time environment, Journal of the ACM 20 (1) (1973) 46–61 (January).
[38] K. Jeffay, D. Stanat, C. Martel, On non-preemptive scheduling of periodic andsporadic tasks, in: IEEE Real-Time Systems Symposium, pp. 129–139,December 1991.

Z. Qin et al. / Computer Communications 33 (2010) 124–135 135
[39] Y. Cai, M. Kong, Nonpreemptive scheduling of periodic tasks in uni- andmultiprocessor systems, Algorithmica 15 (6) (1996) 572–599 (June).
[40] P. Calyam, C. Lee, P. Arava, D. Krymskiy, Enhanced EDF scheduling algorithmsfor orchestrating network-wide active measurements, IEEE Real-Time SystemsSymposium (RTSS), December 2005, p. 10.
[41] I. Gopal, M. Bonuccelli, C. Wong, Scheduling in multibeam satellites withinterfering zones, IEEE Transactions on Communications 31 (8) (1983) 941–951 (August).
[42] W. Chen, P. Sheu, J. Yu, Time slot assignment in TDM multicast switchingsystems, in: IEEE Conference on Computer Communications (INFOCOM), April1991, pp. 1296–1305.
[43] A. Bagchi, S. Hakimi, Data transfers in broadcast networks, IEEE Transactionson Computers 41 (7) (1992) 842–847 (July).
[44] J. Goossens, C. Macq, Limitation of the hyperperiod in real-time periodic taskset generation, in: Proceedings of the RTS Embedded System (RTS’01), 2001,pp. 133–147.