tata invt ar 10 investment... · seventy-fourth annual report 2010-2011 contents ... balance sheet...
TRANSCRIPT


1
C M Y K
Seventy-Fourth annual report 2010-2011
CONTENTS
Page(s)
Board of Directors ........................................................ 1
Notice ................................................................................ 2-3
Directors’ Report ........................................................... 4-8
Report on Corporate Governance ......................... 9-16
Auditors’ Report ............................................................ 17
Annexure to Auditors’ Report ................................. 18-19
Balance Sheet ................................................................ 20
Profit and Loss Account ............................................. 21
Cash Flow Statement .................................................. 22
Schedules forming part of the Balance
Sheet including List of investments ................ 23-31
Schedules forming part of the Profit and
Loss Account ............................................................. 32-35
Notes to the Accounts ............................................... 36-42
Balance Sheet abstract and Company’s
general business profile ....................................... 43
Schedule as per NBFC Prudential Norms
(RBI) Directions......................................................... 44-45
Financial Statistics ........................................................ 46
Summary of Investments –
Distribution among different Industries
and classes of Securities ...................................... 46
INVESTMENT CORPORATION LIMITED
Annual General Meeting on Friday, 8th July, 2011 at Walchand Hirachand Hall, IMC Building,Churchgate, Mumbai - 400020 at 3.30 p.m.
BOARD OF DIRECTORS :(as on 31st March, 2011)
Noel N. Tata (Chairman)Mr. F.N. Subedar (Vice-Chairman)Mr. A.B.K. DubashMr. M.J. Kotwal (Executive Director & Secretary)Mr. K.A. ChaukarMr. H.N. SinorMr. P.P. ShahMr. A.N. Dalal (Executive Director-Investments)Mr. Z. DubashMr. A. Chandra
Registered Office :Elphinstone Building,10, Veer Nariman Road,Mumbai - 400 001.(Tel: 66658282 – Fax: 66657917)e-mail:[email protected]
Principal Bankers :Catholic Syrian Bank Ltd.HDFC Bank Ltd.
Auditors :Deloitte Haskins and SellsChartered Accountants.
Solicitors :Mulla & Mulla and Craigie, Blunt & Caroe
Registrars & Share Transfer Agents :TSR Darashaw Limited6-10, Haji Moosa Patrawala Industrial Estate20, Dr. E. Moses Road, Mahalaxmi, Mumbai - 400 011.(Tel.: 022-6656 8484 Fax: 022-6656 8494)e-mail: [email protected]: www.tsrdarashaw.com
No hand bags/parcels of any kind will be allowed inside the Hall. The same will have to bedeposited outside the Hall on the counter provided, at the visitor’s own risk.

INVESTMENT
Seventy-fourth annual report 2010-2011 Tata Investment Corporation Limited
2
C M Y K
TATA INVESTMENT CORPORATION LIMITED
N O T I C E
THE SEVENTY-FOURTH ANNUAL GENERAL MEETING OF TATA INVESTMENT CORPORATION LIMITED willbe held at Walchand Hirachand Hall, IMC Building, Churchgate, Mumbai 400 020, on Friday, the 8th day ofJuly, 2011, at 3.30 p.m. to transact the following business :-
1. To receive and adopt the Directors’ Report, the Audited Profit and Loss Account and the Cash Flowstatement for the year ended 31st March, 2011, and the Balance Sheet as at that date.
2. To consider and, if thought fit, to pass with or without modification, the following resolution as anOrdinary Resolution :-
“RESOLVED that Mr. F. N. Subedar, who retires by rotation as a Director pursuant to the provisions ofSection 256 of the Companies Act, be and is hereby re-appointed a Director of the Company.”
3. To consider and, if thought fit, to pass with or without modification, the following resolution as anOrdinary Resolution :-
“RESOLVED that Mr. A.B.K. Dubash, who retires by rotation as a Director pursuant to the provisionsof Section 256 of the Companies Act, be and is hereby re-appointed a Director of the Company.”
4. To consider and, if thought fit, to pass with or without modification, the following resolution as anOrdinary Resolution :-
“RESOLVED that Mr. H.N. Sinor, who retires by rotation as a Director pursuant to the provisions ofSection 256 of the Companies Act, be and is hereby re-appointed a Director of the Company.”
5. To appoint Auditors and to fix their remuneration.
NOTES :
a) A MEMBER ENTITLED TO ATTEND AND VOTE IS ENTITLED TO APPOINT A PROXY OR PROXIES TOATTEND AND VOTE INSTEAD OF HIMSELF AND THE PROXY NEED NOT BE A MEMBER.
b) The Register of Members and the Transfer Books of the Company will remain closed from Friday, 1stJuly, 2011 to Friday, 8th July, 2011, both days inclusive.
c) Pursuant to Section 205A of the Companies Act, 1956, all unclaimed/unpaid dividends upto the financialyear ended 31st March, 1998 have been transferred to the General Revenue Account of the CentralGovernment. Shareholders, who have not yet encashed their dividend warrants for the said period, arerequested to forward their claims in the prescribed Form No.II to the Registrar of Companies, CentralGovernment Office Bldg., ‘A’ Wing, 2nd floor, Next to Reserve Bank of India, CBD Belapur 400 614.
Pursuant to Section 205C of the Companies Act, 1956, the amount of dividend remaining unpaid orunclaimed for a period of seven years from the date of its transfer to the Unpaid Dividend Account ofthe Company shall be transferred to the Investor Education and Protection Fund (the Fund) set up bythe Government of India and no payments shall be made in respect of any such claims by the Fund.Members who have not yet encashed their dividend warrant(s) for the financial year ended 31st March,2005 onwards, are requested to make their claims to the Company accordingly, without any delay.
By Order of the Board of Directors,TATA INVESTMENT CORPORATION LIMITED
M.J. KOTWALExecutive Director & Secretary.
Mumbai, 10th May, 2011
Registered Office :
Elphinstone Building10 Veer Nariman RoadMumbai 400 001.

3
C M Y K
Details of the directors seeking re-appointment at theforthcoming Annual General Meeting -
Clause 49 of the Listing Agreement
Name of the Director
Date of Birth
Date of Appointment
Expertise in specificfunctional areas
Qualifications
No. of Shares held inthe Company (as on31.3.2011)
Directorships held inother companies(excluding private andforeign cos.) (as on31.3.2011)
Position held inmandatorycommitteesof other companies
Mr. F.N. Subedar
24.09.1955
11.03.2005
Taxation, Accounts andFinance
B.Com, A.C.A., A.C.S.
1,961 Ordinary Shares
Tata Services Ltd.Ewart Investments Ltd.Pantone Finvest Ltd.Tata Consulting
Engineers Ltd.Tata Petrodyne Ltd.Tata Sky Ltd.Tata AIG General
Insurance Co. Ltd.TS Investments Ltd.Tata Capital Ltd.Tata Capital Financial
Services Ltd.
Tata Services Ltd.(Chairman: AuditCommittee)
Tata ConsultingEngineers Ltd.(Chairman: AuditCommittee)
Tata Capital Ltd.(Member: AuditCommittee)
Ewart Investments Ltd.(Chairman: AuditCommittee)
Tata Petrodyne Ltd.(Member: AuditCommittee)
Tata Sky Ltd.(Chairman : AuditCommittee)(Member: ShareTransfer & AllotmentCommittee)
Mr. A.B.K. Dubash
22.09.1943
28.08.1984
Business & Industry
Businessman
2,172 Ordinary Shares
Mr. H.N. Sinor
05.12.1944
01.04.2005
Banking, Finance andInvestments
B.Com., LL.B.
Nil
3i Infotech Ltd.ICICI Venture Funds
Management Co. Ltd.ICICI Lombard General
Insurance Co. Ltd.CRISIL Ltd.Sahara India Financial
Corporation Ltd.Themis Medicare Ltd.Tata Capital Ltd.Tata Motors Finance Ltd.Zoroastrian Co- operative
Bank Ltd.Tata Capital Financial
Services Ltd.
ICICI Venture FundsManagement Co. Ltd.)(Member: AuditCommittee)
ICICI Lombard GeneralInsurance Co. Ltd.(Member: AuditCommittee)
CRISIL Ltd.(Chairman:Audit Committee)
Sahara India FinancialCorporation Ltd.(Member: AuditCommittee)
Themis Medicare Ltd.(Member: AuditCommittee)
Tata Capital Ltd.(Member: AuditCommittee)
Tata Motors Finance Ltd.(Chairman: AuditCommittee)
Zoroastrian Co-operativeBank Ltd.(Chairman:Audit Committee)

INVESTMENT
Seventy-fourth annual report 2010-2011 Tata Investment Corporation Limited
4
C M Y K
DIRECTORS’ REPORT
TO
THE MEMBERS,
The Directors present their Seventy-fourth Annual Report with the Audited Statement of Accounts forthe year ended 31st March, 2011.
2. FINANCIAL RESULTS : Previous YearRupees Rupees
(in crores) (in crores)
Total Income ......................................................................................... 247.28 232.62
Profit before tax .................................................................................. 234.47 222.81
Less: Provision for tax ....................................................................... 35.88 28.89
Profit after tax ...................................................................................... 198.59 193.92
Balance brought forward from the previous year ............... 194.22 131.86
Amount available for appropriation .......................................... 392.81 325.78
The Directors have made the following appropriations -
Interim Dividend on Ordinary Shares ....................................... 77.18 62.02
Tax on Dividend .................................................................................. 12.82 10.54
Reserve Fund ....................................................................................... 40.00 39.00
General Reserve .................................................................................. 20.00 20.00
150.00 131.56
leaving a balance to be carried forward of ............................. 242.81 194.22
3. OPERATIONS :
The total income of the Company during the year was Rs.247.28 crores against Rs.232.62 crores inthe previous financial year. The increase in total income was mainly due to increase in dividendsreceived on investments, interest income and other miscellaneous income. The total expenditureduring the year increased mainly due to increase in staff costs and other miscellaneous expensesduring the year.
The profit before tax for the year under review was higher at Rs.234.47 crores against Rs.222.81crores in the previous year. The profit after tax for the year under review was marginally higher atRs.198.59 crores compared to Rs.193.92 crores in the previous year. There was a higher provision fortaxation of about Rs.35.88 crores as compared to Rs.28.89 crores in the previous year, commensuratewith the increase in the rate of Minimum Alternate Tax from 17% to 20% approximately, applicableprimarily to profit on sale of long term investments.
The basic and diluted earnings per share (EPS) computed in accordance with the Accounting Standard20 issued by the Institute of Chartered Accountants of India was Rs.41.17 per share and Rs.39.65 pershare respectively as against Rs.49.64 and Rs.39.35 per share respectively, for the previous year.

5
C M Y K
4. DIVIDEND :
An interim dividend of Rs.16.00 per share (previous year: Rs.15.00 per share) was paid towards theend of the financial year in February, 2011 on the Company’s paid-up Ordinary Share Capital ofRs.48.24 crores to those shareholders whose names stood on the Register of Members on the recorddate i.e. 8th February, 2011. Accordingly, the Directors have decided not to recommend any finaldividend for the year 2010-2011.
5. INVESTMENT PORTFOLIO :A summarised position of the Company’s portfolio of investments is given below :-
As on31.03.2011 31.03.2010
Rupees Rupees(in crores) (in crores)
QUOTED INVESTMENTS (Long Term and Current) -
Net Book value ................................................................................................... 931.06 761.63
Market value ........................................................................................................ 3304.29 2823.46
UNQUOTED INVESTMENTS(including Mutual Funds and application money)-
Net Book value ................................................................................................... 359.82 543.89
Estimated value (please see para below) ................................................ 754.24 814.61
TOTAL BOOK VALUE
Net Book value of all investments ............................................................. 1290.88 1305.52
TOTAL MARKET VALUE
Total market value of quoted investments and estimatedvalue of unquoted investments (subject to tax as applicable) ..... 4058.53 3638.07
BANK DEPOSITS AND INTERCORPORATE DEPOSITS .................... 330.50 217.00
TOTAL NUMBER OF COMPANIES (excluding mutual funds) ........ 205 197
The Net Asset Value (NAV) of the Company’s equity share, as computed by the management, wasRs.910 before tax (Rs.795 after tax) per share as on 31st March, 2011. The NAV is computed on thebasis of the market value of quoted investments, NAVs of unquoted mutual funds, most of the otherequity investments in unlisted companies taken on the basis of the last available independentvaluations based on the balance sheets available as at 31st March, 2010, and the relatively smallbalance of unquoted investments taken at respective book values.
A provision for diminution in value of investments of Rs.1.32 crores, no longer required, has beenwritten back to the Securities Premium Account. Members attention is invited to Note 2 to the Notesto Accounts.
The Directors confirm that all the investments held by the Company, except those held as ‘CurrentInvestments’, are long term investments and would normally be held for more than one year fromthe date of acquisition, unless otherwise decided in specific cases. Investment in the category of‘Current Investments’ which, for accounting and other purposes, is so classified at the time of makingthe investment and is indicated separately in the list of investments shown in the relevant schedulein the Balance Sheet.
The Company continues to invest in Tata and non-Tata companies, both in the listed and unlistedcategories, though investments in Tata companies generally constitute a larger proportion and are ofa longer term and strategic nature .

INVESTMENT
Seventy-fourth annual report 2010-2011 Tata Investment Corporation Limited
6
C M Y K
6. MANAGEMENT DISCUSSION & ANALYSIS :
The Indian economy registered a healthy growth of 8.60% in 2010-11 vis-à-vis 8.00% in 2009-10.Higher growth was achieved despite a slight slow-down witnessed during the second half of theyear, particularly in the industrial sector. Credit growth not supported by commensurate depositgrowth created considerable liquidity pressures in the Banking system in the second half of the year,with one year Bank FD rates crossing 10.00% in March 2011.
In spite of a fragile global economic recovery and rupee appreciation (of about 4% against thedollar), exports grew by 37.50%, exceeding USD 245 Billion - especially in value-added exports-whichaided the performance of the economy. Conversely, imports grew by 21.60% thus easing the pressureon Current Account Deficit.
The Reserve Bank of India (RBI) has now pegged the base-line GDP growth for this fiscal at 8.00%,considerably lower than that suggested during the budget announcements which were close to9.00%.
Doing away with its calibrated baby steps approach, RBI increased the repo rate by 50 basis points torein in inflation, which at 9.00% is far higher than the RBI’s comfort zone of 6.00%. Though the centralbank expects inflation to remain at the elevated level of 9.00% during the first half of the currentfiscal, its objective is to bring it down to 6.00% by March 2012.
It is not clear how the inflation rate will come down since the factors igniting inflation are supplyside factors which can only be corrected with investments enhancing productivity, both in agricultureand infrastructure. Nevertheless, a key outcome of liquidity tightening measures by the RBI has beena firming up of interest rates. The RBI in its policy statement on 3rd May 2011 has clearly indicatedthat inflation control in the current environment takes precedence over growth.
Higher international crude prices, rising interest rates, unabated domestic inflation and possibleslippages in the fiscal deficit forecasts pose substantial down-side risks for equity investors. Themarkets were surprisingly resilient, till the end of April 2011, given the negative news both on theeconomic and political platform. Post the RBI policy announcement the market has begun the processof discounting the impact of the factors which will have a negative impact on earnings growth in FY2011-12. Analyst forecasts of earnings growth for FY 2011-12 have yet to start bearing downwardrevisions.
Poor allocation of domestic savings towards equities remains an area of concern. The net outflowsfrom equity mutual fund schemes in FY 2009-10 was Rs.10,235 crores which increased to Rs.20,181crores in FY 2010-11, mainly due to redemptions. Investments through traditional life insuranceproducts, especially from LIC, is the major source of allocation for domestic equity savings. FII inflowsare the major source of capital for equities. In FY 2009-10 FII inflows into the Indian equity marketswas USD 25 billion which increased to USD 32.2 billion in FY 2010-11.
The Company functions as an investment company with a primary objective of long term appreciationin the value of its portfolio. The Company has been disclosing the net asset value of its share (NAV)based on the realisable value of its portfolio on a quarterly basis since September, 2008.
The profits of the Company are derived from a mix of dividend and interest income, supplementedto a large extent by profit on sale of investments. The Board of Directors, after due deliberations,propose to reduce the dependence on sums generated from realisation from sale of investments,thereby providing an opportunity to further increase the period of holding and thereby benefit froma possible higher valuation of its investments. It is envisaged that the above modification in theinvestment strategy of the Company is likely to alter the attributes of the investment portfolio byelongating its investment horizon and enabling the Management to take a much longer terminvestment view, with the objective to further enhance the NAV.

7
C M Y K
Consequently, there could be a relative change in the composition of the income of the Company,resulting in lower profits from sale of investments, which may have an impact on the overall profitsof the Company. The Company would, however, strive to ensure that this would not adversely affectthe dividends that may be declared by the Company, from time to time.
7. CONVERSION OF WARRANTS INTO ORDINARY SHARES :
In accordance with the terms of the Issue of the Zero Coupon Convertible Bonds (with warrants),a Warrant holder was entitled to exercise his right to apply for one Ordinary Share of Rs.10/- eachat the warrant exercise price of Rs.400/- for each warrant held, during the exercise period 1st April,2011 to 30th April, 2011. Accordingly 1,400 warrant holders holding 68,58,222 warrants exercisedtheir entitlement resulting in the paid-up capital of the Company increasing from Rs.48.24 croreson 31st March, 2011 to Rs.55.10 crores as on the date of the Report.
8. DIRECTORS’ RESPONSIBILITY STATEMENT :
Pursuant to Section 217(2AA) of the Companies Act, 1956, the Directors, based on the representationsreceived from the Operating Management, confirm that, to the best of their knowledge –
(i) in the preparation of the annual accounts, the applicable accounting standards have beenfollowed and that there are no material departures;
(ii) they have, in the selection of the accounting policies consulted the statutory auditors and haveapplied them consistently and made judgements and estimates that are reasonable and prudentso as to give a true and fair view of the state of affairs of the Company at the end of the financialyear and of the profit & loss of the Company for the period;
(iii) they have taken proper and sufficient care, to the best of their knowledge and ability, for themaintenance of adequate accounting records in accordance with the provisions of the Act, forsafeguarding the assets of the Company and for preventing and detecting fraud and otherirregularities;
(iv) they have prepared the annual accounts on a going concern basis.
9. INTERNAL CONTROL SYSTEMS :
The Company’s auditors have confirmed that the Company has proper and adequate internal controlsystems commensurate with its size and nature of operations to provide reasonable assurance thatall assets are safeguarded, transactions are authorised, recorded and reported properly and that allapplicable statutes and corporate policies are duly complied with.
The Company has appointed an independent firm of Chartered Accountants, as Internal Auditors,which continuously reviews the adequacy and efficacy of the internal controls. The Internal Auditorssubmit an Internal Audit Report periodically which is placed before and reviewed by the AuditCommittee.
10. DIRECTORS :
Mr. N.A. Soonawala and Mr. K.N. Suntook retired from the Board of Directors on 24th June, 2010, upontheir reaching the stipulated retirement age adopted by the Board.
Consequent upon the resignation of Mr. N.A. Soonawala as the Chairman of the Company, the Boardunanimously appointed Mr. Noel N. Tata and Mr. F. N. Subedar as Chairman and Vice Chairman of theCompany respectively with effect from 24th June, 2010.
Pursuant to the provisions of the Companies Act, 1956, and the Company’s Articles of Association,Mr. F.N. Subedar, Mr. A.B.K. Dubash and Mr. H.N. Sinor retire by rotation but are eligible for re-appointment.
The Board commends their re-appointment as Directors of the Company.
INVESTMENT
Seventy-fourth annual report 2010-2011 Tata Investment Corporation Limited
8
C M Y K
11. AUDITORS :
Deloitte Haskins & Sells, Chartered Accountants, who are the statutory auditors of the Company, holdoffice in accordance with the provisions of the Act upto the conclusion of the forthcoming AnnualGeneral Meeting and are eligible for re-appointment.
12. GENERAL :
Being an investment company, the provisions regarding conservation of energy and technologyabsorption are not applicable to the Company.
There were no foreign exchange earnings and outgo other than those mentioned in Notes 4 to 6 tothe Accounts.
A statement giving particulars of employees as required under Section 217(2A) the Companies Act,1956 read with the Companies (Particulars of Employees) Rules, 1975, forms part of this Report.However, pursuant to the provisions of Section 219(1)(b)(iv) of the Act, the Report and Accounts arebeing sent to the Members excluding the aforesaid statement. Any Member interested in obtaining acopy of the said statement may write to the Company Secretary at the Registered Office of theCompany.
A report on Corporate Governance, in accordance with Clause 49 of the Listing Agreement with theStock Exchanges is set out separately for the information of the shareholders.
On behalf of the Board of Directors,
NOEL N. TATAChairman.
Mumbai, 10th May, 2011.

9
C M Y K
REPORT ON CORPORATE GOVERNANCE
The Company seeks to adopt good corporate governance practices and to ensure compliance with allrelevant laws and regulations. The Company conducts its activities in a manner that is fair and transparentand also perceived to be such by others.
Board of Directors :
As on 31st March, 2011, the Board of Directors of the Company comprised ten members, of whom eightare Non-Executive Directors. Mr. N.A. Soonawala and Mr. K.N. Suntook who had reached the stipulatedretirement age adopted by the Board, had intimated their intention not to offer themselves for re-appointment and accordingly, retired from the Board of Directors at the end of the Annual GeneralMeeting on 23rd June, 2010. Mr. Noel N. Tata and Mr. F.N. Subedar were appointed as Chairman and ViceChairman respectively with effect from 24th June, 2010. Mr. Zubin Dubash and Mr. Amit Chandra whofunctioned as Additional Directors earlier, were appointed as Directors at the aforesaid Annual GeneralMeeting. In accordance with the provisions of the Companies Act, 1956, and the Company’s Articles ofAssociation, Mr. F.N. Subedar, Mr. A.B.K. Dubash and Mr. H.N. Sinor retire by rotation but are eligible for re-appointment. Profile of Directors seeking re-appointment, pursuant to Clause 49 of the Listing Agreementhave been given along with the Notice of the Annual General Meeting.
Board Meetings :
18 Board/Committee Meetings were held at Mumbai during the year under review comprising 5 BoardMeetings and 13 various Committee Meetings. The Board Meetings were held on 17th May, 2010, 22ndJune, 2010, 29th July, 2010, 26th October, 2010, and 27th January, 2011. The category of each Director,together with his attendance at Board Meetings, the number of his Directorships and memberships ofthe SEBI-designated Board Committees of other companies as well as his holding in the Company, as on31st March, 2011, are given below :
Name of Directors Category Board No. of Membership of No. of Ordinaryof Meetings Directorships mandatory Board Shares held
Director attended of other Indian Committees of other as onduring Companies as on companies as on 31st March, 2011
2010-2011 31st March, 2011 31st March, 2011
Director Chairman Member Ordinary Shares
Mr. N.N. Tata Non Independent 5 8 1 2 16,551
Mr. F.N. Subedar Non Independent 5 9 4 6 1,961
Mr. A.B.K. Dubash Independent 4 - - - 1,500
Mr. M.J. Kotwal Executive Director 5 3 - - 3,999
Mr. K.A. Chaukar Non Independent 5 12 1 4 -
Mr. H.N. Sinor Independent 4 10 3 5 -
Mr. P.P. Shah Independent 3 14 2 3 -
Mr. A.N. Dalal Executive Director 5 5 - 2 -
Mr. Z. Dubash Independent 3 1 - 1 -
Mr. A. Chandra Independent 4 2 - 1 -
Mr. N.A. Soonawala* Non Independent 2 - - - 8,000
Mr. K.N. Suntook* Independent 2 - - - 840
* Retired 24th June, 2010
All the Directors, except Mr. A.B.K. Dubash and Mr. P.P. Shah, who were out of Mumbai on that day, hadattended the last Annual General Meeting held on 23rd June, 2010.
Committee of Directors :
Upon the retirement of Mr. N.A. Soonawala and Mr. K.N. Suntook on 23rd June, 2010 from the Board ofDirectors of our Company (and consequently as Directors on various Committees of the Board), the

INVESTMENT
Seventy-fourth annual report 2010-2011 Tata Investment Corporation Limited
10
C M Y K
Committees of the Board have been reconstituted on 22nd June, 2010 except the Investment Committeewhich was re-constituted on 10th August, 2010. Details of the various Committees of the Board of Direc-tors of the Company as on 31st March, 2011 and the meetings attended by each Director, during the year2010-2011 shown within brackets, are as under :
Name of the Director
Audit Committee : Mr. H.N. Sinor – Chairman (3),(4 meetings held during the year) Mr. A.B. K. Dubash (4), Mr. F.N. Subedar (4),
Mr. P.P. Shah (2), Mr. K.N.Suntook (1)
Remuneration Committee : Mr. Z. Dubash – Chairman (-) (Apptd. 22.06.2010)(2 meetings held during the year) Mr. N.N. Tata (2), Mr. F.N. Subedar (2)
Mr. N.A. Soonawala (2), Mr. K.N.Suntook (2)
Share Transfer & Investors’ Mr. F.N. Subedar – Chairman (1)Grievance Committee : Mr. M.J. Kotwal (1), Mr. A.N. Dalal (1)(1 meeting held during the year) Mr. N.A. Soonawala (-)
Investment Committee : Mr. N.N. Tata – Chairman (4)(4 meetings held during the year) Mr. F.N. Subedar (4), Mr. A.B.K. Dubash (1),
Mr. K.A. Chaukar (4), Mr. P.P. Shah (2),Mr. Z. Dubash (4),
Asset Liability ManagementCommittee : Mr. H.N. Sinor – Chairman (1)(2 meetings held during the year) Mr. M.J. Kotwal (2), Mr. K.A. Chaukar (2)
Mr. A.N. Dalal (2)
Nomination Committee : Mr. N.N. Tata – Chairman(No meeting was held during the year) Mr. H.N. Sinor, Mr. K.A. Chaukar,
Mr. N.A. Soonawala
Audit Committee :
The Audit Committee has been constituted in compliance with (i) Section 292A of the Companies Act,1956 (ii) the listing guidelines on Corporate Governance, as mandated by the Stock Exchanges and (iii)the Non-Banking Financial Companies Prudential Norms (Reserve Bank) Directions 2008. All the Direc-tors, except Mr. F.N. Subedar are independent Directors.
The functions of the Audit Committee include :-
a) Overseeing of the Company’s financial reporting process and the disclosure of its financial informa-tion.
b) Recommending the appointment/removal of external auditor, fixation of audit fee and also approvalfor payment for any other services.
c) Reviewing with the management the quarterly and annual financial statements before submissionto the Board.
d) Reviewing with the Management, the statement of uses/applications of funds raised through anIssue (public issue/rights issue/preferential issue), the statement of funds utilised for purposes otherthan those stated in the Offer Document / Prospectus and making appropriate recommendations tothe Board to take steps in this matter.
e) Reviewing the Company’s financial and risk management policies.
f ) Reviewing the adequacy of internal audit functions.
g) Discussion with internal and external auditors about their findings and follow up thereon.
The Audit Committee reports its findings to the Board at the subsequent meeting and its recommenda-tions are implemented by the management.
Remuneration Committee :
The Committee has been authorized to determine the remuneration package for the Executive Directorsas well as to recommend the remuneration payable to the Non-Executive Directors from year to year.

11
C M Y K
Remuneration of Directors :
The Directors are paid sitting fees and Commission in accordance with Section 309 and 310 of theCompanies Act, 1956. A total remuneration of Rs.80 lacs was paid to the Non-Executive Directors duringthe year ended 31st March, 2011. The remuneration paid to each Non-Executive Director is given below :
Name of the Director Sitting fees paid during Commission for 2009-20102010-2011 paid in 2010-2011
(Rs. In lacs )
Mr. N.N. Tata 2.00 6.00Mr. F.N. Subedar 2.90 10.00Mr. A.B.K. Dubash 1.80 6.00Mr. K.A. Chaukar 2.00 5.00Mr. H.N. Sinor 1.50 6.50Mr. P.P. Shah 1.40 3.00Mr. A.N. Dalal # - 3.00Mr. Z. Dubash 1.40 0.50Mr. A. Chandra 0.80 -Mr. N.A. Soonawala ^ 0.60 15.00Mr. K.N. Suntook ^ 0.60 10.00
TOTAL 15.00 65.00
# Non-executive Director upto 31.12.2009^ Retired w.e.f. 24th June, 2010.
The commission to the non-executive Directors is based on the net profits of the Company for the year,the number of meetings of the Board and/or Committees attended by the concerned Directors and theircontribution to the Company in terms of deliberations at the Board/Committee Meetings as well as inthe over-all functioning of the Company. At present, the Company does not have a scheme for grant ofstock-options to the Executive Directors, non-executive directors or employees of the Company.
The members had, at the Annual General Meeting held on 20th July, 2007 approved of the re-appointmentand the terms of remuneration of Mr. M.J. Kotwal, the Executive Director of the Company for the periodfrom 4th September, 2007 to 27th May, 2012. The Members had, at the Annual General Meeting held on23rd June, 2010 appointed Mr. A.N. Dalal as the Executive Director of the Company for a period of fiveyears with effect from 1st January, 2010. The appointments can be terminated by either party giving tothe other party six months notice or the Company paying six months remuneration in lieu of the notice.
The Company pays remuneration by way of salary, perquisites and allowances (fixed component) andcommission (variable component) to its Executive Directors. Annual increments effective 1st April eachyear, as recommended by the Remuneration Committee, are approved by the Board. Salary and perquisitesare paid within the range approved by the shareholders. Commission payable to the Executive Director iscalculated with reference to the net profits of the Company in a particular financial year and is determinedby the Board of Directors at the end of the financial year based on the recommendation of theRemuneration Committee within the limits fixed by the Board and subject to overall ceilings stipulated inSection 198 and 309 of the Companies Act, 1956. The specific amount payable to each Executive Directoris based on certain performance criteria and is payable after the Annual Accounts have been approvedby the Board of Directors and adopted by the members. The remuneration paid to the Executive Directorsduring the year 2010-2011 is given below :-
Name Salary Perquisites Provident/ PerformanceSuperannuation Bonus for
Fund 2009-2010paid in 2010-2011
Rs. in lacs Rs. in lacs Rs. in lacs Rs. in lacs
Mr. M.J. Kotwal 55.50 4.94 5.99 30.00
Mr. A.N. Dalal 138.24 - 6.91 10.00*
* From 1. 1.2010 to 31.3.2010

INVESTMENT
Seventy-fourth annual report 2010-2011 Tata Investment Corporation Limited
12
C M Y K
Share Transfer & Investors’ Grievance Committee :
The Committee under the Chairmanship of Mr. F.N. Subedar, approves and monitors transfers, transmis-sions, consolidation etc. of shares as well as redressal of complaints from shareholders by the ShareRegistrars. Mr. M.J. Kotwal, Executive Director & Secretary is also the Compliance Officer.
The Registrars had received correspondence on 472 matters in the aggregate during the year. There were327 queries regarding dividend warrants including changes on live warrants or issue of fresh chequesagainst time barred instruments, 88 requests for registration of change of address, Bank details, ECS,nomination, document registration, transmission of shares, loss of securities etc. and 57 correspondencefor other miscellaneous matters. There were 11 queries pending as on 31st March, 2011.
Investment Committee :
The Investment Committee comprising Mr. Noel N. Tata, Mr. F.N. Subedar, Mr. A.B.K. Dubash, Mr. K.A. Chaukar,Mr. Z. Dubash and Mr. P.P.Shah, has been constituted pursuant to Section 292 of the Companies Act, 1956.The investment policy and specific recommendations form an important part of the discussions at theInvestment Committee meetings. Specific investment decisions, based on detailed analysis andrecommendations of the Investment Executives, are taken by investment committee circulars with fulldisclosure and subsequent review at Board / Committee Meetings.
Asset Liability Management Committee :
In accordance with the Reserve Bank of India guidelines, an Asset Liability Management (ALM) Committeeof the Board comprising Mr. H.N. Sinor, Mr. M.J. Kotwal, Mr. K.A. Chaukar and Mr. A.N. Dalal, has beenconstituted for implementation of the ALM system and to review its functions periodically. The Committeealso reviews the Risk Management Policy of the Company from time to time.
Nomination Committee :
The Nomination Committee as on 31st March, 2011 comprises three Directors viz. Mr. N.N. Tata (Chairman),Mr. K.A. Chaukar and Mr. H.N. Sinor.
General Body Meetings :
The Annual General Meeting of the Company will be held on Friday, 8th July, 2011 at 3-30 p.m. atWalchand Hirachand Hall, Indian Merchants Chamber Building, Churchgate, Mumbai 400 020. The lastAnnual General Meeting was held on 23rd June, 2010 at 3.30 p.m. at Walchand Hirachand Hall, IndianMerchants Chamber Building, Churchgate, Mumbai 400 020. Two previous Annual General Meetings wereheld on 8th July, 2009 at Homi J. Talyerkhan Memorial Hall, Red Cross Office, 141, Shahid Bhagat SinghRoad, Mumbai 400 001 and 15th July, 2008 at 3-30 p.m. at the Bombay House Auditorium, Homi ModyStreet, Mumbai 400 001. Special Resolutions under Sections 31 & 309 of the Companies Act, 1956 werepassed with the requisite majority at the Annual General Meetings held on 15th July, 2008 and 23rd June,2010 respectively.
Disclosures :
i. The particulars of transactions between the Company and its related parties in accordance withAccounting Standard 18 are set out in Note No.8 to the Accounts. These transactions are in theordinary course and are not likely to have any conflict with the interest of the Company.
ii. There were no material pecuniary relationships or transactions of the non-executive directors vis-à-vis the Company, other than payment of Board fees/commission and investments (if any) in shares /securities of the Company.
iii. There were no material transactions of the Company with its promoters, directors, management ortheir relatives that may have potential conflict with the interest of the Company at large.
iv. There were no penalties or strictures imposed on the Company by the Stock Exchanges or SEBI orany statutory authority on any matter related to capital markets at any time during the last 3 years.
v. In accordance with the High Court Orders dated 27th September, 2002, 30th January, 2009 and 25th
September, 2009 and the Accounting Practice adopted earlier, provision for diminution in the valueof investments amounting to Rs.1.32 crores has been credited to the Securities Premium Account

13
C M Y K
instead of the Profit & Loss Account as prescribed under Accounting Standard (AS) on ‘Accountingfor Investments’, being write-back of provision for diminution in value of certain investments nolonger required, which had been debited to such account in earlier years.
vi. The Company has complied to the extent applicable with all mandatory requirements mentioned inAnnexure IC of Clause 49 of the Listing Agreement in respect of Corporate Governance. As regardsthe non-mandatory requirements mentioned in Annexure ID thereto, the Company has beencomplying with requirements as regards Remuneration Committee. Further, the Company has alsoadopted the Whistle Blower Policy as mentioned in this Report.
CEO/CFO certification :
The Executive Directors and the Chief Financial Officer have certified to the Board that :
(a) They have reviewed financial statements and the cash flow statement for the year and that to thebest of their knowledge and belief:
(i) these statements do not contain any materially untrue statement or omit any material fact orcontain statements that might be misleading;
(ii) these statements together present a true and fair view of the Company’s affairs as on 31st March,2011 and are in compliance with existing accounting standards, applicable laws and regulations.
(b) There are, to the best of their knowledge and belief, no transactions entered into by the Companyduring the year which are fraudulent, illegal or violative of the Company’s Code of Conduct.
(c) They accept responsibility for establishing and maintaining internal controls for financial reportingand that they have evaluated the effectiveness of the internal control systems of the Company andhave reported to the auditors and the Audit Committee that they are not aware of any deficiencies inthe design or operation of internal controls. In the event such deficiencies do arise, the same shall bereported to the auditors and the Audit Committee forthwith.
(d) They have indicated to the auditors and the Audit Committee that there have been -
(i) no changes in internal control during the year;
(ii) no changes in accounting policies during the year, other than those mentioned in the Notes toAccount,
(iii) no instances of fraud of which they have become aware and / or the involvement therein of anyof the management or any employee of the Company.
The Executive Director & Secretary has given a Declaration to the effect that all Board Members andSenior Management Personnel have confirmed compliance with the Code of Conduct during the yearended 31st March, 2011.
Means of Communication :
The unaudited quarterly results and audited results for the year are published in one English newspaper(Business Standard/Financial Express) and atleast one vernacular newspaper (Loksatta/Sakaal) shortlyafter its submission to the Stock Exchanges.
The Company’s website www.tatainvestment.com contains relevant information including matterspertaining to Investor Relations, shareholder benefits, as well as Quarterly/Annual Financial Results. Thesedetails are also available on the Tata website, www.tata.com
Share Transfer System :
TSR Darashaw Ltd. (TSRDL) are the Registrars and Transfer Agents of the Company. TSRDL has a networkof Investor Relation Centres (IRCs) at Mumbai, Delhi, Bengaluru, Kolkata and Jamshedpur to accept thedocuments/bankers requests/queries/correspondence from the investors/shareholders of the Company.
Shares lodged for transfer at the Registrars’ address are normally processed within 30 days from the dateof lodgement, and requests for dematerialisation of shares are processed and the confirmation is givento the depositories within 15 days from the date of lodgement, if the documents are clear in all respects.The Executive Director & Secretary who is also the Compliance Officer verifies the Transfer Register sent

INVESTMENT
Seventy-fourth annual report 2010-2011 Tata Investment Corporation Limited
14
C M Y K
by the Registrars. The Share Transfer and Investors’ Grievance Committee approves the transfer of sharesand debentures.
TSRDL has an Investor Interface Cell which handles all queries/correspondence/requests received acrossthe counter/walk in investors, over the phone and by e-mail. Written communication received from theInvestors is segregated into different categories on the basis of the nature of the query received. Theconcerned workgroup takes the required action in respect of the same by accessing the currentshareholder information resident on TSRDL database. The details are verified and responded throughcustomised and fully automated systems for handling such correspondence. Copies of the responses forcomplaints/letters received through statutory bodies, wherever required, are forwarded to the Companyfor their reference and records.
The endeavour is to attend to shareholder requests and redress their queries speedily and to theirsatisfaction, keeping in mind the statutory/regulatory time frame of 30 days. Investors’ grievances, if any,are resolved by the Compliance Officer, failing which, they would be referred to the Investors’ GrievanceCommittee.
Whistle Blower Policy :
The model Whistle Blower Policy suggested for Tata companies has been adopted by the Board ofDirectors. The policy provides for adequate safeguards against victimisation of employees and also providesfor access to the Audit Committee. The policy has been appropriately communicated within the Company.It is affirmed that no personnel has been denied access to the Audit Committee.
Management Discussion and Analysis forms part of the Directors’ Report.
General Shareholder Information :
Registered Office Elphinstone Building, 10, Veer Nariman Road, Mumbai 400 001.(Address for correspondence) Tel. No.6665 8282 Fax : 6665 7917
Annual General Meeting Friday, 8th July, 2011 at 3-30 p.m.(Date, time and venue) Walchand Hirachand Hall, IMC Building, Churchgate, Mumbai 400 020.
Financial Year The Financial Year of the Company ends on 31st March each year.
Book Closure Date Friday, 1st July, 2011 to Friday, 8th July, 2011.
Dividend Payment An interim dividend of Rs.16 per share (160%) was paid on 22ndFebruary, 2011 on the then existing Ordinary Share Capital of Rs.48.24crores was paid to those Members whose names appeared on theRegister of Members on 8th February, 2011,as per details furnishedby National Securities Depository Ltd. and Central Depository Services(India) Ltd.
Listing on Stock Exchanges 1. Bombay Stock Exchange Ltd.P. J. Towers, Dalal Street, Mumbai 400 001.
2. The National Stock Exchange of India Ltd.Bandra-Kurla Complex, Mumbai 400 051.
Listing fees have been paid upto the year ending 31st March, 2012 toeach of the Stock Exchanges.
Stock Code BSE : 501301 NSE : TATAINVEST
ISIN INE672A01018
Demat of Shares Available on National Securities Depository Ltd. (NSDL) and CentralDepository Services (India) Ltd. (CDSL).98.06% of the Company’sshares are in dematerialised mode.Annual Custodial charges havebeen paid to both Depositories upto 31st March, 2012.

15
C M Y K
Market Price Data BSE NSE
Month High Low High LowRs. Rs. Rs. Rs.
April 2010 527.00 493.00 529.90 489.00May 2010 534.00 439.00 534.90 456.20June 2010 493.00 462.00 494.00 450.10July 2010 514.90 467.00 516.20 465.10August 2010 584.95 483.50 582.30 477.10September 2010 628.80 518.20 640.00 515.10October 2010 669.90 575.10 619.00 575.00November 2010 623.00 525.00 623.80 528.00December 2010 575.05 515.00 576.00 513.00January 2011 582.00 517.05 581.95 513.30February 2011 555.00 473.00 555.00 473.00March 2011 525.00 494.10 580.05 490.15
Registrars & Share Transfer Agents :
REGISTERED OFFICE TSR DARASHAW LIMITED6-10, Haji Moosa Patrawala Industrial Estate20, Dr. E. Moses Road, Mahalaxmi, Mumbai 400 011.Tel. : 022-66568484 Fax : 022-66568494e-mail : csg-unit@ tsrdarashaw.com website : www.tsrdarashaw.com
BRANCH OFFICES :Bengaluru 503, Barton Centre, 84, M.G. Road, Bengaluru 560 001.
Tel. : 080-25320321 Fax : 080-25580019E-mail : [email protected]
Jamshedpur Bungalow No.1, ‘E’ Road, Northern Town,Bistupur, Jamshedpur 831 001.Tel. : 0657-2426616 Fax : 0657-2426937E-mail : [email protected]
Kolkata Tata Centre, 1st floor, 43, Jawaharlal Nehru Road, Kolkata 700 071.Tel. : 033-22883087 Fax : 033-22883062E-mail : [email protected]
New Delhi 2/42, Sant Vihar, Ansari Road, Daryaganj, New Delhi 110 002.Tel. : 011-23271805 Fax : 011-23271802E-mail : [email protected]
Agents Shah Consultancy Services Ltd.3, Sumatinath Complex, 2nd Dhal, Pritam Nagar,Ellis Bridge Ahmedabad – 380 006.Telefax: 079 – 26576038E-mail: [email protected]
Sh
are
Pri
ce o
n B
SE
BS
E 2
00
17000172501750017750180001825018500187501900019250195001975020000202502050020750210002125021500
TICL month end close BSE Sensex month end close
0
50
100
150
200
250
300
350
400
450
500
550
600
650
700
750
Mar-11Feb-11Jan-11Dec-10Nov-10Oct-10Sep-10Aug-10Jul-10Jun-10May-10Apr-10
Stock Performance of the Company vis-a-vis BSE SENSEX

16
C M Y K
Distribution of Shareholding as on 31.3.2011
No. of shares %
Promoter Company and other Tata companies ............................. 3,37,57,404 69.98Directors & their Relatives ....................................................................... 38,713 0.08Public Financial Institutions / Nationalised Banks /
Insurance companies & State Governments ........................... 11,52,936 2.39Non-residents / FIIs .................................................................................... 10,76,238 2.23Other Bodies Corporate & Other Banks ............................................. 14,66,557 3.04Mutual Funds ................................................................................................ 15,87,696 3.29Others .............................................................................................................. 91,57,530 18.99
4,82,37,074 100.00
Distribution Schedule as on 31.3.2011
Sr.No. No. of shares Holdings Amount % of No. of % to(Rs.) total Holders total
Capital Holders
1. 1 to 500 1874516 18745160 3.89 20975 88.762. 501 to 1000 858073 8580730 1.78 1129 4.783. 1001 to 2000 994836 9948360 2.06 682 2.894. 2001 to 3000 710860 7108600 1.47 284 1.205. 3001 to 4000 478555 4785550 0.99 136 0.576. 4001 to 5000 435170 4351700 0.90 96 0.417. 5001 to 10000 1295856 12958560 2.69 182 0.778. Greater than 10000 41589208 415892080 86.22 147 0.62
Total 48237074 482370740 100.00 23631 100.00
AUDITORS’ CERTIFICATE ON CORPORATE GOVERNANCE
To The Members ofTata Investment Corporation Limited1. We have examined the compliance of conditions of Corporate Governance by Tata Investment Cor-
poration Limited (‘the Company’), for the year ended 31st March, 2011, as stipulated in Clause 49 ofthe Listing Agreement of the said Company with the stock exchange(s).
2. The compliance of conditions of Corporate Governance is the responsibility of the Management. Ourexamination was limited to procedures and implementation thereof, adopted by the Company forensuring the compliance of the conditions of Corporate Governance. It is neither an audit nor anexpression of opinion on the financial statements of the Company.
3. In our opinion and to the best of our information and according to the explanations given to us andbased on the representations made by the Directors and Management, we certify that the Companyhas complied in all material respects with the conditions of Corporate Governance as stipulated inthe abovementioned Listing Agreement.
4. We further state that such compliance is neither an assurance as to the future viability of the Com-pany nor the efficiency or effectiveness with which the Management has conducted the affairs ofthe Company.
For DELOITTE HASKINS & SELLSChartered Accountants
(ICAI Reg. No. 117365W)
H. L. ShahPartner
Mumbai , 10th May, 2011. Membership No.33590

17
C M Y K
AUDITORS’ REPORT TO THE MEMBERS OFTATA INVESTMENT CORPORATION LIMITED
1. We have audited the attached Balance Sheet of TATA INVESTMENT CORPORATION LIMITED (“the Com-pany”) as at 31st March, 2011, the Profit and Loss Account and the Cash Flow Statement of theCompany for the year ended on that date, both annexed thereto. These financial statements are theresponsibility of the Company’s Management. Our responsibility is to express an opinion on thesefinancial statements based on our audit.
2. We conducted our audit in accordance with the auditing standards generally accepted in India. ThoseStandards require that we plan and perform the audit to obtain reasonable assurance about whether thefinancial statements are free of material misstatements. An audit includes examining, on a test basis,evidence supporting the amounts and the disclosures in the financial statements. An audit also includesassessing the accounting principles used and the significant estimates made by the Management, as wellas evaluating the overall financial statement presentation. We believe that our audit provides a reason-able basis for our opinion.
3. As required by the Companies (Auditor’s Report) Order, 2003 (CARO) issued by the Central Government interms of Section 227(4A) of the Companies Act, 1956, we give in the Annexure a statement on the mattersspecified in paragraphs 4 and 5 of the said Order.
4. Further to our comments in the Annexure referred to in paragraph 3 above, we report that:
i. we have obtained all the information and explanations, which to the best of our knowledge andbelief were necessary for the purposes of our audit;
ii. in our opinion, proper books of account as required by law have been kept by the Company, so far asit appears from our examination of those books;
iii. the Balance Sheet, the Profit and Loss Account and the Cash Flow Statement dealt with by thisreport are in agreement with the books of account;
iv. in our opinion, the Balance Sheet, the Profit and Loss Account and the Cash Flow Statement dealtwith by this report are in compliance with the Accounting Standards referred to in Section 211(3C) ofthe Companies Act, 1956;
v. in our opinion and to the best of our information and according to the explanations given to us, thesaid accounts give the information required by the Companies Act, 1956, in the manner so requiredand give a true and fair view in conformity with the accounting principles generally accepted inIndia:(a) in the case of the Balance Sheet, of the state of affairs of the Company as at 31st March, 2011;(b) in the case of the Profit and Loss Account, of the profit of the Company for the year ended on
that date; and(c) in the case of the Cash Flow Statement, of the cash flows of the Company for the year ended on
that date.5. On the basis of the written representations from the directors as on 31st March, 2011 taken on record by
the Board of Directors, we report that none of the directors is disqualified as on 31st March, 2011 frombeing appointed as a director in terms of Section 274(1)(g) of the Companies Act, 1956.
For DELOITTE HASKINS & SELLSChartered Accountants
(Registration No. 117365W)
H. L. ShahPartner
Mumbai , 10th May, 2011. Membership No.33590
INVESTMENT
Seventy-fourth annual report 2010-2011 Tata Investment Corporation Limited
18
C M Y K
ANNEXURE TO THE AUDITORS’ REPORT
(Referred to in paragraph 3 of our report of even date)
(i) Having regard to the nature of the Company’s business/activities/result, clauses (ii), (viii), (x), (xi), (xii),(xiii), (xv), (xvi), (xviii), (xix) and (xx) of CARO are not applicable to the company.
(ii) In respect of its fixed assets:
(a) The Company has maintained proper records showing full particulars, including quantitativedetails and situation of the fixed assets.
(b) The fixed assets were physically verified during the year by the Management in accordance witha regular programme of verification which, in our opinion, provides for physical verification of allthe fixed assets at reasonable intervals. According to the information and explanation given tous, no material discrepancies were noticed on such verification.
(c) The fixed assets disposed off during the year, in our opinion, do not constitute a substantial partof the fixed assets of the Company and such disposal has, in our opinion, not affected the goingconcern status of the Company.
(iii) The Company has not taken any loans, secured or unsecured, from companies, firms or other partieslisted in the Register maintained under Section 301 of the Companies Act, 1956.
In respect of loans, secured or unsecured, granted by the Company to companies, firms or otherparties covered in the Register under Section 301 of the Companies Act, 1956, according to theinformation and explanations given to us:
(a) The Company has granted loans aggregating Rs.8,700 lakhs to six parties during the year. At theyear-end, the outstanding balances of such loans aggregated Rs.3,200 lakhs (number ofparties – 3) and the maximum amount involved during the year was Rs.6,700 lakhs(number of parties – 7).
(b) The rate of interest and other terms and conditions of such loans are, in our opinion, prima facienot prejudicial to the interests of the Company.
(c) The receipts of principal amounts and interest have been regular/as per stipulations.
(d) There is no overdue amounts remaining outstanding as at the year-end.
(iv) In our opinion and according to the information and explanations given to us, there is an adequateinternal control system commensurate with the size of the Company and the nature of its businesswith regard to purchases of fixed assets. During the course of our audit, we have not observed anymajor weakness in such internal control system.
(v) In respect of contracts or arrangements entered in the Register maintained in pursuance of Section301 of the Companies Act, 1956, to the best of our knowledge and belief and according to theinformation and explanations given to us:
(a) The particulars of contracts or arrangements referred to Section 301 that needed to be enteredin the Register maintained under the said Section have been so entered.
(b) Where each of such transaction is in excess of Rs.5 lakhs in respect of any party, the transactionshave been made at prices which are prima facie reasonable having regard to the prevailingmarket prices at the relevant time.
(vi) According to the information and explanations given to us, the Company has not accepted anydeposit from the public during the year. In respect of unclaimed deposits, the Company has compliedwith the provisions of Sections 58A & 58AA or any other relevant provisions of the Companies Act,1956

19
C M Y K
(vii) In our opinion, the internal audit functions carried out during the year by a firm of CharteredAccountants appointed by the Mangement have been commensurate with the size of the Companyand the nature of its business.
(viii) According to the information and explanations given to us in respect of statutory dues:
(a) The Company has generally been regular in depositing undisputed dues, including ProvidentFund, Investor Education and Protection Fund, Employees’ State Insurance, Income-tax, SalesTax, Wealth Tax, Service Tax, Custom Duty, Excise Duty, Cess and other material statutory duesapplicable to it with the appropriate authorities.
(b) There were no undisputed amounts payable in respect of Income-tax, Wealth Tax, CustomDuty, Excise Duty, Cess and other material statutory dues in arrears as at 31st March, 2011 for aperiod of more than six months from the date they became payable.
(c) There were no dues of Income-tax, Sales-tax, Wealth Tax, Service Tax, Customs duty, Excise dutyand cess, to the extent applicable, which have not been deposited on account of any dispute.
(ix) Based on our examination of the records and evaluations of the related internal controls in respectof current investments, the Company has maintained proper records of the transactions andcontracts in respect of its dealing in shares, securities, debentures and other investments asapplicable and timely entries have been made therein. The aforesaid securities have been held bythe Company in its own name.
(x) In our opinion and according to the information and explanations given to us and on an overallexamination of the Balance Sheet, we report that funds raised on short-term basis have not beenused during the year for long- term investment.
(xi) To the best of our knowledge and according to the information and explanations given to us, nofraud by the Company and no fraud on the Company has been noticed or reported during theyear.
For DELOITTE HASKINS & SELLSChartered Accountants
(Registration No.117365W)
H. L. ShahPartner
Mumbai, 10th May, 2011. (Membership No. 33590)

INVESTMENT
Seventy-fourth annual report 2010-2011 Tata Investment Corporation Limited
20
CMYK
BALANCE SHEET AS AT 31ST MARCH, 2011
As at31-3-2010
Schedule Rupees Rupees Rupees Rupees(in lacs) (in lacs) (in lacs) (in lacs)
FUNDS EMPLOYED:
1. SHARE CAPITAL .................................................................................................... A 4823.71 4823.71
2. RESERVES AND SURPLUS ................................................................................. B 159144.91 148153.89
3. TOTAL SHAREHOLDERS’ FUNDS .................................................................... 163968.62 152977.60
4. TOTAL FUNDS EMPLOYED ............................................................................... 163968.62 152977.60
APPLICATION OF FUNDS:
5. FIXED ASSETS ....................................................................................................... C
Gross Block ............................................................................................................ 254.00 156.83
Less: Depreciation ............................................................................................... 181.20 122.78
Net Block ................................................................................................................ 72.80 34.05
Add: Capital work in progress/Advances on Capital Account ......... - 70.55
72.80 104.60
6. INVESTMENTS [including debt mutual funds `9143.02 lacs(Previous Year ` 27299.52 lacs)] ................................................................... D 129088.44 130552.19
7. CURRENT ASSETS, LOANS AND ADVANCES ............................................. E
(a) Sundry Debtors ........................................................................................ 653.83 -
(b) Cash and Bank balances ....................................................................... 20949.17 11468.27
(c) Other Current Assets .............................................................................. 484.56 659.27
(d) Loans and Advances ............................................................................... 13646.93 11023.63
35734.49 23151.17
8. Less: CURRENT LIABILITIES AND PROVISIONS ........................................ F
(a) Current Liabilities ..................................................................................... 691.91 575.54
(b) Provisions .................................................................................................... 235.20 254.82
927.11 830.36
NET CURRENT ASSETS ....................................................................................... 34807.38 22320.81
9. TOTAL ASSETS (NET) .......................................................................................... 163968.62 152977.60
Notes to the Accounts ................................................................................................. K
In terms of our report attached,
For DELOITTE HASKINS & SELLS For and on behalf of the Board,Chartered Accountants N. N. TATA Chairman
F. N. SUBEDAR Vice ChairmanH. L. Shah M. J. KOTWAL A. N. DALALPartner Executive Director & Executive Director - A. B. K. DUBASH
Secretary Investments K. A. CHAUKARH.N.SINOR DirectorsZ. DUBASH
Mumbai, 10th May, 2011 A. CHANDRA}
21
CMYK
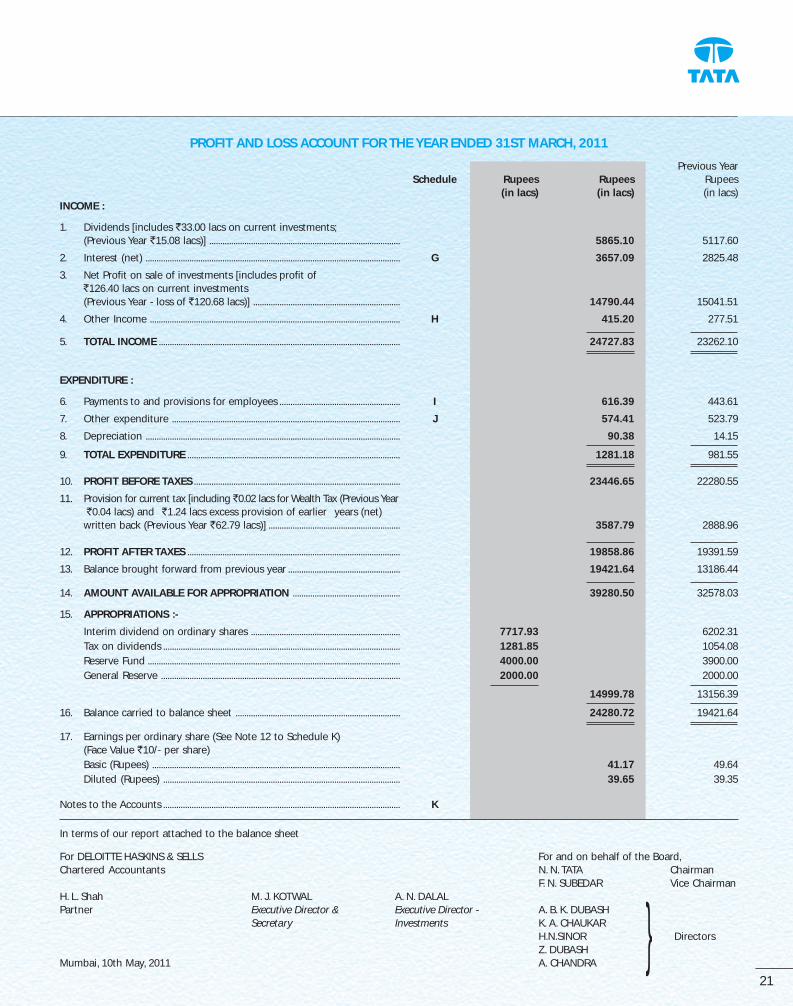
PROFIT AND LOSS ACCOUNT FOR THE YEAR ENDED 31ST MARCH, 2011
Previous YearSchedule Rupees Rupees Rupees
(in lacs) (in lacs) (in lacs)INCOME :
1. Dividends [includes `33.00 lacs on current investments;(Previous Year `15.08 lacs)] ....................................................................................... 5865.10 5117.60
2. Interest (net) .................................................................................................................... G 3657.09 2825.48
3. Net Profit on sale of investments [includes profit of`126.40 lacs on current investments(Previous Year - loss of `120.68 lacs)] ................................................................... 14790.44 15041.51
4. Other Income .................................................................................................................. H 415.20 277.51
5. TOTAL INCOME .............................................................................................................. 24727.83 23262.10
EXPENDITURE :
6. Payments to and provisions for employees ....................................................... I 616.39 443.61
7. Other expenditure ........................................................................................................ J 574.41 523.79
8. Depreciation .................................................................................................................... 90.38 14.15
9. TOTAL EXPENDITURE ................................................................................................. 1281.18 981.55
10. PROFIT BEFORE TAXES .............................................................................................. 23446.65 22280.55
11. Provision for current tax [including `0.02 lacs for Wealth Tax (Previous Year `0.04 lacs) and `1.24 lacs excess provision of earlier years (net)written back (Previous Year `62.79 lacs)] ............................................................ 3587.79 2888.96
12. PROFIT AFTER TAXES ................................................................................................. 19858.86 19391.59
13. Balance brought forward from previous year ................................................... 19421.64 13186.44
14. AMOUNT AVAILABLE FOR APPROPRIATION ................................................. 39280.50 32578.03
15. APPROPRIATIONS :-
Interim dividend on ordinary shares .................................................................... 7717.93 6202.31
Tax on dividends ............................................................................................................ 1281.85 1054.08
Reserve Fund ................................................................................................................... 4000.00 3900.00
General Reserve ............................................................................................................. 2000.00 2000.00
14999.78 13156.39
16. Balance carried to balance sheet ........................................................................... 24280.72 19421.64
17. Earnings per ordinary share (See Note 12 to Schedule K)(Face Value `10/- per share)
Basic (Rupees) ................................................................................................................. 41.17 49.64
Diluted (Rupees) ............................................................................................................ 39.65 39.35
Notes to the Accounts ............................................................................................................ K
In terms of our report attached to the balance sheet
For DELOITTE HASKINS & SELLS For and on behalf of the Board,Chartered Accountants N. N. TATA Chairman
F. N. SUBEDAR Vice ChairmanH. L. Shah M. J. KOTWAL A. N. DALALPartner Executive Director & Executive Director - A. B. K. DUBASH
Secretary Investments K. A. CHAUKARH.N.SINOR DirectorsZ. DUBASH
Mumbai, 10th May, 2011 A. CHANDRA}
INVESTMENT
Seventy-fourth annual report 2010-2011 Tata Investment Corporation Limited
22
CMYK
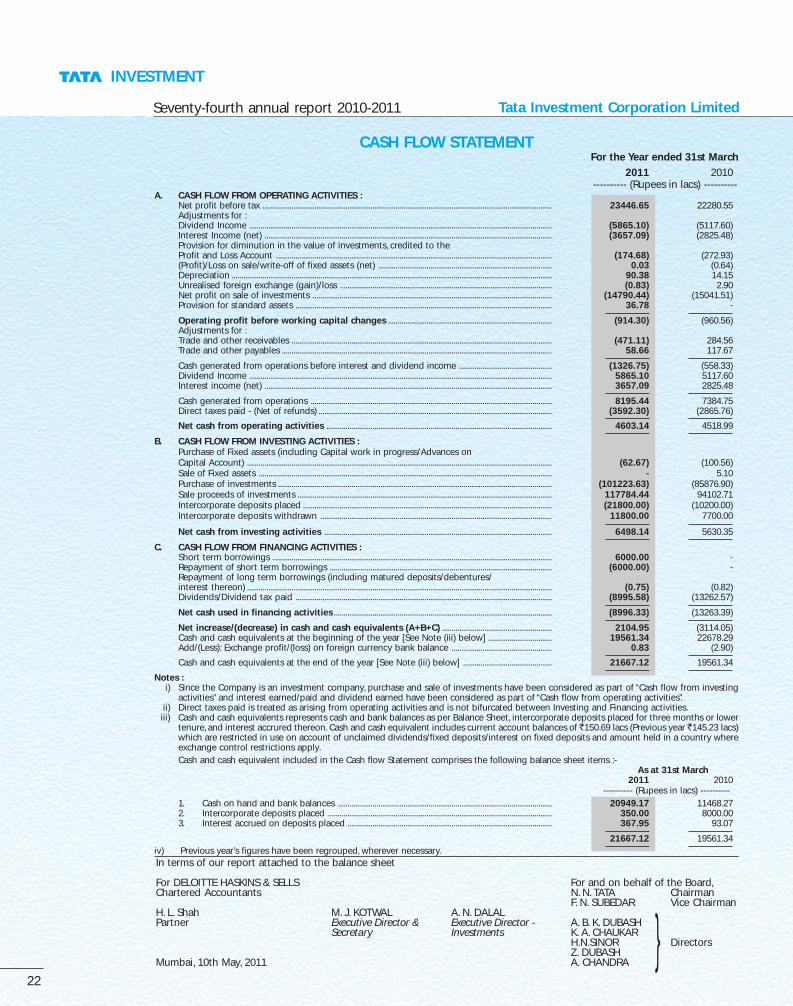
CASH FLOW STATEMENTFor the Year ended 31st March
2011 2010---------- (Rupees in lacs) ----------
A. CASH FLOW FROM OPERATING ACTIVITIES :Net profit before tax ...................................................................................................................................................... 23446.65 22280.55Adjustments for :Dividend Income ............................................................................................................................................................. (5865.10) (5117.60)Interest Income (net) ..................................................................................................................................................... (3657.09) (2825.48)Provision for diminution in the value of investments, credited to theProfit and Loss Account ............................................................................................................................................... (174.68) (272.93)(Profit)/Loss on sale/write-off of fixed assets (net) .......................................................................................... 0.03 (0.64)Depreciation ...................................................................................................................................................................... 90.38 14.15Unrealised foreign exchange (gain)/loss .............................................................................................................. (0.83) 2.90Net profit on sale of investments ............................................................................................................................ (14790.44) (15041.51)Provision for standard assets ..................................................................................................................................... 36.78 -
Operating profit before working capital changes ..................................................................................... (914.30) (960.56)Adjustments for :Trade and other receivables ....................................................................................................................................... (471.11) 284.56Trade and other payables ............................................................................................................................................ 58.66 117.67
Cash generated from operations before interest and dividend income ................................................ (1326.75) (558.33)Dividend Income ............................................................................................................................................................. 5865.10 5117.60Interest income (net) ..................................................................................................................................................... 3657.09 2825.48
Cash generated from operations ............................................................................................................................. 8195.44 7384.75Direct taxes paid - (Net of refunds) ......................................................................................................................... (3592.30) (2865.76)
Net cash from operating activities ..................................................................................................................... 4603.14 4518.99
B. CASH FLOW FROM INVESTING ACTIVITIES :Purchase of Fixed assets (including Capital work in progress/Advances onCapital Account) .............................................................................................................................................................. (62.67) (100.56)Sale of Fixed assets ........................................................................................................................................................ - 5.10Purchase of investments .............................................................................................................................................. (101223.63) (85876.90)Sale proceeds of investments .................................................................................................................................... 117784.44 94102.71Intercorporate deposits placed ................................................................................................................................. (21800.00) (10200.00)Intercorporate deposits withdrawn ........................................................................................................................ 11800.00 7700.00
Net cash from investing activities ...................................................................................................................... 6498.14 5630.35
C. CASH FLOW FROM FINANCING ACTIVITIES :Short term borrowings ................................................................................................................................................. 6000.00 -Repayment of short term borrowings ................................................................................................................... (6000.00) -Repayment of long term borrowings (including matured deposits/debentures/interest thereon) .............................................................................................................................................................. (0.75) (0.82)Dividends/Dividend tax paid ..................................................................................................................................... (8995.58) (13262.57)
Net cash used in financing activities ................................................................................................................. (8996.33) (13263.39)
Net increase/(decrease) in cash and cash equivalents (A+B+C) ......................................................... 2104.95 (3114.05)Cash and cash equivalents at the beginning of the year [See Note (iii) below] ................................. 19561.34 22678.29Add/(Less): Exchange profit/(loss) on foreign currency bank balance .................................................... 0.83 (2.90)
Cash and cash equivalents at the end of the year [See Note (iii) below] .............................................. 21667.12 19561.34
Notes :i) Since the Company is an investment company, purchase and sale of investments have been considered as part of “Cash flow from investing
activities” and interest earned/paid and dividend earned have been considered as part of “Cash flow from operating activities”.ii) Direct taxes paid is treated as arising from operating activities and is not bifurcated between Investing and Financing activities.
iii) Cash and cash equivalents represents cash and bank balances as per Balance Sheet, intercorporate deposits placed for three months or lowertenure, and interest accrured thereon. Cash and cash equivalent includes current account balances of `150.69 lacs (Previous year `145.23 lacs)which are restricted in use on account of unclaimed dividends/fixed deposits/interest on fixed deposits and amount held in a country whereexchange control restrictions apply.
Cash and cash equivalent included in the Cash flow Statement comprises the following balance sheet items :-As at 31st March
2011 2010 ---------- (Rupees in lacs) ----------
1. Cash on hand and bank balances ............................................................................................................... 20949.17 11468.272. Intercorporate deposits placed .................................................................................................................... 350.00 8000.003. Interest accrued on deposits placed .......................................................................................................... 367.95 93.07
21667.12 19561.34iv) Previous year’s figures have been regrouped, wherever necessary.In terms of our report attached to the balance sheet
For DELOITTE HASKINS & SELLS For and on behalf of the Board,Chartered Accountants N. N. TATA Chairman
F. N. SUBEDAR Vice ChairmanH. L. Shah M. J. KOTWAL A. N. DALALPartner Executive Director & Executive Director - A. B. K. DUBASH
Secretary Investments K. A. CHAUKARH.N.SINOR DirectorsZ. DUBASH
Mumbai, 10th May, 2011 A. CHANDRA}
23
CMYK
SCHEDULES FORMING PART OF THE BALANCE SHEET
SCHEDULE ‘A’ SHARE CAPITALAs at
31-3-2010Rupees Rupees
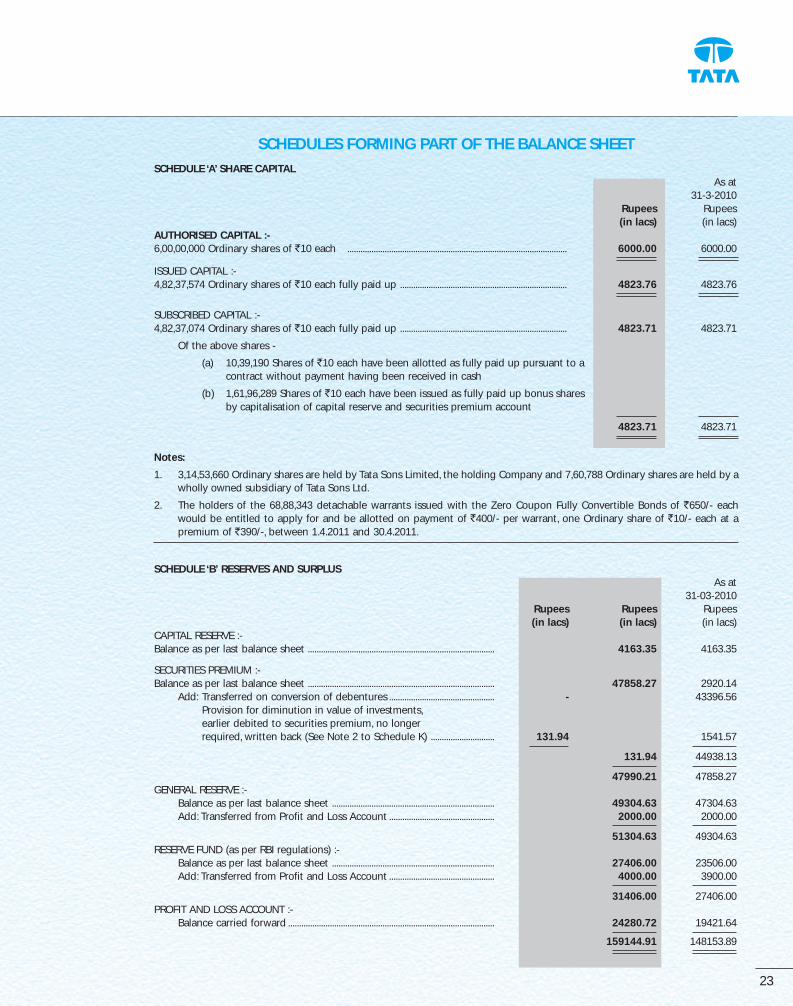
(in lacs) (in lacs)AUTHORISED CAPITAL :-6,00,00,000 Ordinary shares of `10 each .................................................................................................... 6000.00 6000.00
ISSUED CAPITAL :-4,82,37,574 Ordinary shares of `10 each fully paid up ............................................................................ 4823.76 4823.76
SUBSCRIBED CAPITAL :-4,82,37,074 Ordinary shares of `10 each fully paid up ............................................................................ 4823.71 4823.71
Of the above shares -
(a) 10,39,190 Shares of `10 each have been allotted as fully paid up pursuant to acontract without payment having been received in cash
(b) 1,61,96,289 Shares of `10 each have been issued as fully paid up bonus sharesby capitalisation of capital reserve and securities premium account
4823.71 4823.71
Notes:
1. 3,14,53,660 Ordinary shares are held by Tata Sons Limited, the holding Company and 7,60,788 Ordinary shares are held by awholly owned subsidiary of Tata Sons Ltd.
2. The holders of the 68,88,343 detachable warrants issued with the Zero Coupon Fully Convertible Bonds of `650/- eachwould be entitled to apply for and be allotted on payment of `400/- per warrant, one Ordinary share of `10/- each at apremium of `390/-, between 1.4.2011 and 30.4.2011.
SCHEDULE ‘B’ RESERVES AND SURPLUSAs at
31-03-2010Rupees Rupees Rupees
(in lacs) (in lacs) (in lacs)CAPITAL RESERVE :-Balance as per last balance sheet ..................................................................................... 4163.35 4163.35
SECURITIES PREMIUM :-Balance as per last balance sheet ..................................................................................... 47858.27 2920.14
Add: Transferred on conversion of debentures ................................................ - 43396.56Provision for diminution in value of investments,earlier debited to securities premium, no longerrequired, written back (See Note 2 to Schedule K) ............................. 131.94 1541.57
131.94 44938.13
47990.21 47858.27GENERAL RESERVE :-
Balance as per last balance sheet .......................................................................... 49304.63 47304.63Add: Transferred from Profit and Loss Account ................................................ 2000.00 2000.00
51304.63 49304.63RESERVE FUND (as per RBI regulations) :-
Balance as per last balance sheet .......................................................................... 27406.00 23506.00Add: Transferred from Profit and Loss Account ................................................ 4000.00 3900.00
31406.00 27406.00PROFIT AND LOSS ACCOUNT :-
Balance carried forward .............................................................................................. 24280.72 19421.64
159144.91 148153.89

INVESTMENT
Seventy-fourth annual report 2010-2011 Tata Investment Corporation Limited
24
CMYK
SCHEDULE ‘C’ FIXED ASSETS
Cost as at Addi- Deduc- Cost as Depre- Accumulated Net book Net book1st April, tions tions/ at 31st ciation Depreciation value as value as
2010 Adjust- March, for the as at 31st at 31st at 31stments 2011 year March, 2011 March, 2011 March, 2010
---------------------------------------------------------- Rupees in lacs -------------------------------------------------Buildings ................................. 1.30 - - 1.30 0.01 1.09 0.21 0.22Furniture, fixtures andequipment ............................. 38.63 59.22 27.48 70.37 59.22 70.37 - -Motor cars .............................. 64.45 - - 64.45 6.93 44.70 19.75 26.68
Plant and Machinery ......... 52.45 24.35 4.50 72.30 12.82 53.64 18.66 7.15
Leasehold Improvements - 45.58 - 45.58 11.40 11.40 34.18 -
156.83 129.15 31.98 254.00 90.38 181.20 72.80
Previous year ........................ 149.84 34.06 27.07 156.83 14.15 122.78 34.05
Capital work in progress .............................................................................................................................................................. - 56.95
Advances on Capital Account .................................................................................................................................................... - 13.60
72.80 104.60
SCHEDULES FORMING PART OF THE BALANCE SHEET
SCHEDULE ‘D’ INVESTMENTSAs at 31-03-2011 As at 31-03-2010
Fully paid Partly paid Book Value Book Value Fully paid Partly paid Book Value Book ValueRupees Rupees Rupees Rupees Rupees Rupees Rupees Rupees(in lacs) (in lacs) (in lacs) (in lacs) (in lacs) (in lacs) (in lacs) (in lacs)
I LONG TERM (AT OR BELOW COST)QUOTED :- (LIST 1)Equity shares ................................. 75863.16 - 62603.14 -Mutual funds ................................. 1018.50 - 1610.53 -Debentures/Bonds ...................... 9393.58 - 10439.39 -Preference shares ........................ 2457.66 - - -Tradeable Warrants ..................... - - - -(Market Value `325756.26 lacs;Previous year `280396.57 lacs)
88732.90 - 88732.90 74653.06 - 74653.06
UNQUOTED :- (LIST 2)Equity shares ................................. 17830.80 - 17520.97 -Mutual funds ................................. 9643.02 - 28499.52 -Venture Capital funds ................ 2534.95 - 2664.82 -Preference shares ........................ 6500.00 - 6500.00 -
36508.77 - 36508.77 55185.31 - 55185.31
Application money onsecurities not allotted ............... - 100.00
125241.67 129938.37Less : Provision for diminutionin value of Long Term Investments 825.65 1181.98
124416.02 128756.39II CURRENT INVESTMENTS
(LOWER OF COST AND FAIR VALUE)Quoted Equity Shares ( List 3 )(at cost) ............................................ 4722.13 1795.80Less : Provision for diminution 49.71 -
At fair value. ................................... 4672.42 1795.80(Market Value `4672.42 lacs;Previous year `1949.57 lacs)
129088.44 130552.19
Aggregate Investments( net of diminution )Quoted .............................................. 93106.39 76163.31(Market Value `330428.68 lacs;Previous year `282346.14 lacs)Unquoted ........................................ 35982.05 54388.88
129088.44 130552.19

25
CMYK
LIST OF INVESTMENTSAs at 31st March, 2011 As at 31st March, 2010
Particulars Face value Holding Book value Holding Book valueRupees Rupees Rupees
(in lacs) (in lacs)LIST 1: QUOTED:-
EQUITY SHARES FULLY PAID:-
1 BANKS
Andhra Bank. ........................................... 10 - - 450000 355.41Axis Bank Ltd. .......................................... 10 330000 131.64 330000 131.64Bank of Baroda. ....................................... 10 - - 30000 76.75Central Bank of India. ........................... 10 300000 470.01 140000 163.20Corporation Bank. .................................. 10 75000 354.12 60012 272.85Dena Bank. ................................................ 10 60000 49.00 - -Development Credit Bank Ltd. ........ 10 800000 635.17 400000 420.00HDFC Bank Ltd. ....................................... 10 123000 345.25 123000 345.25ICICI Bank Ltd. ......................................... 10 90000 851.16 17500 150.33IDBI Bank Ltd. .......................................... 10 420000 529.21 300000 358.72Indian Bank. .............................................. 10 400000 615.10 250000 281.94Karnataka Bank Ltd. .............................. 10 - - 95000 112.33Punjab National Bank. ......................... 10 62500 419.19 75000 503.03State Bank of India. ............................... 10 144000 872.90 150000 909.27Syndicate Bank. ...................................... 10 - - 400000 299.85United Bank of India. ........................... 10 300000 231.99 - -
5504.74 4380.57
Market Value 16441.22 12823.67
2 CEMENT
ACC Ltd. ..................................................... 10 - - 150000 213.17Ambuja Cements Ltd. .......................... 2 1320000 24.29 2200400 40.49HeidelbergCement India Ltd. ........... 10 350000 148.72 - -Madras Cements Ltd. ........................... 1 400000 416.26 - -Mangalam Cements Ltd. .................... 10 342500 539.60 275000 451.07Ultratech Cement Ltd. ......................... 10 130000 1212.34 - -
2341.21 704.73
Market Value 4359.02 4537.92
3 CHEMICALS & FERTILIZERS
Clariant Chemicals India Ltd. ............ 10 50000 139.17 50000 139.17Gujarat Alkalies & Chemicals Ltd. ... 10 - - 100000 128.61Gujarat Narmada Valley Fertilizers
Co. Ltd. .................................................. 10 - - 200000 187.45Nagarjuna Agrichem Ltd. ................... 10 42342 124.62 30000 85.33Rallis India Ltd. ........................................ 10 7500 1.26 10000 2.51Tata Chemicals Ltd. ............................... 10 15753500 4552.76 15753500 4552.76United Phosphorus Ltd. ...................... 2 115000 188.83 115000 188.83
5006.64 5284.66
Market Value 53967.47 52487.63
4 ELECTRICITY & TRANSMISSION
Areva T & D India Ltd. .......................... 2 75000 213.33 75000 213.33NHPC Ltd. .................................................. 10 600000 160.60 200000 67.68NTPC Ltd. ................................................... 10 1215000 1556.73 1215000 1556.73Power Grid Corporation of India Ltd. 10 600000 590.19 500000 481.21PTC India Ltd. .......................................... 10 300000 334.93 200000 221.69Suzlon Energy Ltd. ................................ 2 200000 149.20 150000 111.49Tata Power Co. Ltd. ................................ 10 600000 225.84 600000 225.84
3230.82 2877.97
Market Value 11615.00 11907.68
5 ELECTRICALS & ELECTRONICS
Bharat Electronics Ltd. ......................... 10 119000 360.38 119000 360.38Blue Star Ltd. ........................................... 2 80000 289.53 65000 237.04Cummins India Ltd. ............................... 2 102100 0.46 102100 0.46Honda Siel Power Products Ltd. ...... 10 - - 100000 215.47Siemens Ltd. ............................................. 2 185000 26.12 300000 42.36Thermax Ltd. ............................................ 2 20000 118.16 17500 5.81Voltamp Transformers Ltd. ................. 10 - - 25000 214.35Voltas Ltd. ................................................. 1 9460000 355.70 9540000 358.71
1150.35 1434.58
Market Value 21928.87 23186.33

INVESTMENT
Seventy-fourth annual report 2010-2011 Tata Investment Corporation Limited
26
CMYK
6 ENGINEERING &INFRASTRUCTUREBharat Earth Movers Ltd. .................... 10 65000 619.38 - -Bharat Heavy Electricals Ltd. ............. 10 100000 680.03 100000 680.03Crompton Greaves Ltd. ....................... 2 125000 280.49 78750 145.32Engineers India Ltd.(Previous Year Face Value `10) ......... 5 166350 183.17 28000 138.08Godrej Industries Ltd. .......................... 1 150000 290.68 - -Greaves Cotton Ltd. .............................. 2 300000 280.66 - -Kalindee Rail Nirman (Engineers) Ltd. 10 52774 94.87 52774 94.87KSB Pumps Ltd. ....................................... 10 72000 64.55 72000 64.55Larsen & Toubro Ltd. ............................ 2 190000 92.36 190000 92.36Patel Engineering Ltd. ......................... 1 85000 345.99 20000 89.78Punj Lloyd Ltd. ........................................ 2 300000 676.51 220000 577.76Sanghvi Movers Ltd. ............................. 2 60000 122.40 - -
3731.09 1882.75
Market Value 7892.22 7179.197 FAST MOVING CONSUMER
GOODSAsian Paints (India) Ltd. ....................... 10 53694 21.88 53694 21.88Godrej Consumer Products Ltd. ...... 1 55000 151.65 45000 117.52Hindustan Unilever Ltd. ...................... 1 152500 410.05 60000 160.23ITC Ltd. ........................................................ 1 739020 12.72 369510 12.72Mount Everest Mineral Water Ltd. .. 10 60000 91.05 60000 91.05Nestle India Ltd. ..................................... 10 62000 368.01 62000 368.01Pidilite Industries Ltd. .......................... 1 1204000 136.17 1340000 151.59Tata Global Beverages Ltd.(formerly Tata Tea Ltd.)(Previous Year Face Value `10) ......... 1 27500000 740.02 2750000 740.02Titan Industries Ltd. .............................. 10 861282 1710.87 861282 1710.87
3642.42 3373.89
Market Value 67155.60 48367.198 FINANCE & INVESTMENTS
GIC Housing Finance Ltd. ................... 10 1000000 348.30 1000000 348.30Housing Development Finance
Corporation Ltd.(Previous Year Face Value `10) ......... 2 350000 4.65 70000 4.65IL & FS Investment Managers Ltd. .. 2 775000 173.62 700000 134.84Infrastructure Development
Finance Company Ltd. ................... 10 260000 373.98 - -LIC Housing Finance Co. Ltd.(Previous Year Face Value `10) ......... 2 825000 173.51 200000 210.32Motilal Oswal Financial Services Ltd. 1 105000 175.45 105000 175.45Rural Electrification Corporation Ltd. 10 85000 133.75 85000 133.75Sundaram Finance Ltd. ....................... 10 - - 40000 134.52
1383.26 1141.83
Market Value 6332.49 5321.799 HEALTHCARE
Apollo Hospital Enterprises Ltd.(Previous Year Face Value `10) ......... 5 35000 96.60 17500 96.60Biocon Ltd. ................................................ 5 80000 259.97 - -Cadila Healthcare Ltd. .......................... 5 26000 201.35 - -Cipla Ltd. .................................................... 2 150000 496.46 - -FDC Ltd. ..................................................... 1 400000 359.38 177952 141.35Glaxo Smithkline Pharmaceuticals Ltd. 10 80000 67.70 90000 76.16Glenmark Pharmaceuticals Ltd. ....... 1 222000 24.33 370000 40.53Hikal Ltd. .................................................... 10 60000 225.97 60000 225.97Indraprastha Medical Corporation Ltd. 10 920000 439.90 - -Merck Ltd. ................................................. 10 70000 256.00 70000 256.00Opto Circuits India Ltd. ....................... 10 100000 208.40 100000 208.40Piramal Healthcare Ltd. ....................... 2 11152 55.07 - -Ranbaxy Laboratories Ltd. ................. 5 110000 418.89 85000 310.22Sun Pharmaceutical Industries Ltd.(Previous Year Face Value ` 5) .......... 1 750000 34.34 150000 34.34Torrent Pharmaceuticals Ltd. ............ 5 100000 470.16 50000 182.65
3614.52 1572.22
Market Value 9446.99 7092.28
LIST OF INVESTMENTSAs at 31st March, 2011 As at 31st March, 2010
Particulars Face value Holding Book value Holding Book valueRupees Rupees Rupees
(in lacs) (in lacs)

27
CMYK
10 HOTELSEIH Ltd. ....................................................... 2 153216 173.06 - -Hotel Leelaventure Ltd. ....................... 2 600000 194.25 600000 194.25Indian Hotels Co. Ltd. ........................... 1 9894060 5806.82 10014060 5877.25Oriental Hotels Ltd.(Previous Year Face Value `10) ......... 1 1076000 39.03 107600 39.03Royal Orchid Hotels Ltd. ..................... 10 - - 135000 108.46TAJGVK Hotels & Resorts Ltd. ........... 2 68300 8.19 68300 8.19
6221.35 6227.18
Market Value 9062.69 11091.77
11 INFORMATION TECHNOLOGY3i Infotech Ltd. ........................................ 10 400000 357.70 400000 357.70Financial Technologies (India) Ltd. . 2 20000 231.12 - -HCL Infosystems Ltd. ............................ 2 160000 166.37 - -ICSA India Ltd. ......................................... 2 150000 258.45 110000 205.35Infosys Technologies Ltd. ................... 5 31987 223.99 31987 223.99Infotech Enterprises Ltd. ..................... 5 200000 354.84 15118 53.20KPIT Cummins Infosystems Ltd. ...... 2 255000 295.73 - -NIIT Technologies Ltd. ......................... 10 105000 203.13 - -Nucleus Software Exports Ltd. ......... 10 150000 220.33 - -Oracle Financial Services Software Ltd. 5 - - 6000 99.70Satyam Computer Services Ltd. ...... 2 450000 376.69 - -Tata Consultancy Services Ltd. ........ 1 510452 1621.26 510452 1621.26Tata Elxsi Ltd. ........................................... 10 900000 1753.15 725000 1258.57Wipro Ltd. .................................................. 2 135000 589.81 27500 165.39
6652.57 3985.16
Market Value 12059.69 7983.79
12 MEDIAJagran Prakashan Ltd. .......................... 2 310000 264.74 260000 207.69
264.74 207.69
Market Value 398.66 305.76
13 METALS & MININGCoal India Ltd. ......................................... 10 45009 110.27 - -Graphite India Ltd. ................................ 2 - - 200000 110.52Gujarat Mineral Development
Corporation Ltd. ................................ 2 400000 553.10 - -Hindalco Industries Ltd. ...................... 1 525000 260.93 575000 285.78Indian Metals & Ferro Alloys Ltd. .... 10 27200 103.90 42000 160.43Jindal Steel & Power Ltd. .................... 1 32500 231.79 32500 231.79Neyveli Lignite Corporation Ltd. ..... 10 - - 200000 108.20NMDC Ltd. ................................................. 1 50000 150.00 50000 150.00Sarda Energy & Minerals Ltd. ........... 10 93000 153.85 130000 215.07Steel Authority of India Ltd. .............. 10 285000 362.01 285000 362.01Tata Sponge Iron Ltd. ........................... 10 65622 137.18 100000 209.05Tata Steel Ltd. .......................................... 10 3385000 6147.16 3400000 6174.40The Tinplate Company of India Ltd. 10 600000 325.58 600000 325.58
8535.77 8332.83
Market Value 24607.34 25520.86
14 MOTOR VEHICLES & ANCILLARIESApollo Tyres Ltd. ..................................... 1 125000 61.72 250000 123.46Bosch Ltd. .................................................. 10 30000 4.59 30000 4.59Exide Industries Ltd. ............................. 1 250000 266.36 170000 163.75Mahindra & Mahindra Ltd. ................. 5 440000 60.98 440000 60.98Maruti Suzuki India Ltd. ...................... 5 100000 1186.48 49000 545.88SKF India Ltd. ........................................... 10 200000 32.66 200000 32.66Sundram Fasteners Ltd. ...................... 1 300000 2.07 700000 4.80Tata Motors Ltd. ...................................... 10 2425000 5855.65 2575000 6217.85Tata Motors Ltd. ‘A’ Ordinary Shares. 10 526000 2724.79 250000 963.39
10195.30 8117.36
Market Value 42000.35 26566.26
LIST OF INVESTMENTSAs at 31st March, 2011 As at 31st March, 2010
Particulars Face value Holding Book value Holding Book valueRupees Rupees Rupees
(in lacs) (in lacs)

INVESTMENT
Seventy-fourth annual report 2010-2011 Tata Investment Corporation Limited
28
CMYK
15 OIL & NATURAL RESOURCESCairn India Ltd. ........................................ 10 478000 757.01 530000 839.34Castrol India Ltd. .................................... 10 100000 156.31 50000 156.31Gail (India) Ltd. ........................................ 10 425000 355.30 507500 424.25Gujarat State Petronet Ltd. ................ 10 225000 200.74 200000 178.37Hindustan Oil Exploration Ltd. ......... 10 - - 70000 67.38Hindustan Petroleum Corp. Ltd. ...... 10 185000 575.05 125000 362.25Indian Oil Corporation Ltd. ................ 10 145000 215.06 145000 215.06Indraprastha Gas Ltd. ........................... 10 105000 180.35 105000 180.35MOIL Ltd. ................................................... 10 4731 17.74 - -Oil & Natural Gas Corporation Ltd.(Previous year Face Value `10) ........ 5 368000 822.24 75000 646.65Oil India Ltd. ............................................. 10 25000 285.97 - -Petronet LNG Ltd. .................................. 10 - - 700000 183.91Reliance Industries Ltd. ....................... 10 252430 1090.58 252430 1090.58
4656.35 4344.45
Market Value 9837.93 9503.68
16 PAPER , PRINTING & PACKAGINGBallarpur Industries Ltd. ...................... 2 50000 12.11 750000 181.73J.K.Paper Ltd. ............................................ 10 - - 550000 203.99West Coast Paper Mills Ltd. ............... 2 375000 183.75 375000 183.75
195.86 569.47
Market Value 338.96 705.85
17 RETAILAgre Developers Ltd. ........................... 10 725 - - -Pantaloon Retail (India) Ltd-B-DVR 2 14514 33.11 13514 30.49Trent Ltd. ................................................... 10 732714 4151.98 732714 4151.98
4185.09 4182.47
Market Value 7226.47 5924.01
18 TELECOMMUNICATIONSBharti Airtel Ltd. ..................................... 5 - - 345000 448.19Idea Cellular Ltd. .................................... 10 600000 382.85 335000 240.94Mahanagar Telephone Nigam Ltd. . 10 300000 267.93 300000 267.93
650.78 957.06
Market Value 541.35 1514.91
19 TEXTILESCentury Textiles & Industries Ltd. ... 10 225000 554.80 140000 133.60Gokak Textiles Ltd. ................................ 10 - - 44334 57.98Siyaram Silk Mills Ltd. .......................... 10 - - 18080 27.05SRF Ltd. ...................................................... 10 10000 29.07 - -
583.87 218.63
Market Value 819.47 765.59
20 TRANSPORTATION & LOGISTICSBharati Shipyard Ltd. ............................ 10 70000 188.53 - -Container Corporation of India Ltd. 10 120000 468.38 120000 468.38Gateway Distriparks Ltd. ..................... 10 260000 312.75 260000 312.75Great Eastern Shipping Co.Ltd. ........ 10 260000 289.56 300000 334.11SpiceJet Ltd. ............................................. 10 - - 300000 158.07Transport Corporation of India Ltd. 2 220000 233.24 90000 86.84Varun Shipping Co. Ltd. ....................... 10 650000 357.02 650000 357.02
1849.48 1717.17
Market Value 2941.18 3355.56
LIST OF INVESTMENTSAs at 31st March, 2011 As at 31st March, 2010
Particulars Face value Holding Book value Holding Book valueRupees Rupees Rupees
(in lacs) (in lacs)

29
CMYK
21 MISCELLANEOUS & DIVERSIFIEDAditya Birla Nuvo Ltd. .......................... 10 150000 797.61 70000 174.33Bajaj Hindusthan Ltd. ........................... 1 160000 280.70 120000 235.67Forbes & Company Ltd. ....................... 10 - - 19000 19.38Greenply Industries Ltd. ..................... 5 19936 28.31 55000 75.90Kesoram Industries Ltd. ...................... 10 75000 258.45 60000 211.98PVR Ltd. ...................................................... 10 400000 480.14 140000 167.29Supreme Industries Ltd.(Previous Year Face Value `10) ......... 2 36630 35.82 5000 23.84The Phoenix Mills Ltd. ......................... 2 185171 385.92 100000 182.08
2266.95 1090.47
- Market Value 2345.66 1660.01
Total of Listed Equity Shares - Book Value 75863.16 62603.14
- Market Value 311318.63 267801.71
MUTUAL FUNDS FULLY PAID :-Benchmark Mutual Fund Gold Bees. 100 14000 223.28 14000 223.28Benchmark Mutual Fund Nifty Bees. 10 10000 44.85 202500 903.93Benchmark Mutual Fund Nifty Junior. 1.25 - - 525000 483.32Kotak Nifty ETF ....................................... 10 130000 750.37 - -
1018.50 1610.53DEBENTURES/BONDS FULLY PAID :-Deccan Chronicle Holdings Ltd
2011 12.50% Bonds. ........................ 10000000 5 525.03 5 525.03Export Import Bank of India
2010 11.50% (8th Series) Bonds. 1000 - - 3000 29.49Government of India
8.13% 2022 Bonds. .......................... 100 1500000 1504.45 - -Indian Hotels Co.Ltd
2010 9.86% Debentures. ............... 1000000 - - 50 505.72Mahindra & Mahindra Ltd
2011 9.15% Debentures. ............... 1000000 - - 50 502.06Power Finance Corp. Ltd
2018 9.68% Debentures. .............. 1000000 50 519.50 50 519.50Rural Electrification Corp. Ltd
2015 8.45% Debentures. ............... 1000000 100 1000.10 100 1000.10Rural Electrification Corp. Ltd
2019 8.65% Bonds. .......................... 1000000 - - 50 500.00Rural Electrification Corp. Ltd
2018 9.07% Bonds. .......................... 1000000 50 513.36 50 513.36State Bank of India
2023 8.90% Bonds. .......................... 1000000 - - 50 512.77Tata Chemicals Ltd
2019 10.00% Debentures. ............ 1000000 40 400.00 40 400.00Tata Communications Ltd
2014 9.50% Debentures. ............... 1000000 50 500.05 50 500.05Tata Motors Ltd
2020 9.95% Debentures. ............... 1000000 100 1000.00 100 1000.00Tata Sons Ltd
2014 10.30% Debentures. ............ 1000000 50 510.12 50 510.12Tata Steel Ltd
2011 9.80% Debentures. ............... 1000000 100 976.47 100 976.47Tata Steel Ltd
2015 10.20% Debentures. ............ 1000000 100 943.65 100 943.65Tata Steel Ltd
2019 10.40% Debentures. ............ 1000000 100 1000.85 100 1000.85Tata Tea Ltd
2010 9.40% Debentures. ............... 1000000 - - 50 500.22
9393.58 10439.39PREFERENCE SHARES FULLY PAID :-Trent Ltd - 0.1% CCPS - Series A ..... 10 212008 1228.83 - -Trent Ltd - 0.1% CCPS - Series B ..... 10 212008 1228.83 - -
2457.66 -TRADEABLE WARRANTS :-Greenply Industries Ltd. ..................... - - 19936 -
88732.90 74653.06
LIST OF INVESTMENTSAs at 31st March, 2011 As at 31st March, 2010
Particulars Face value Holding Book value Holding Book valueRupees Rupees Rupees
(in lacs) (in lacs)
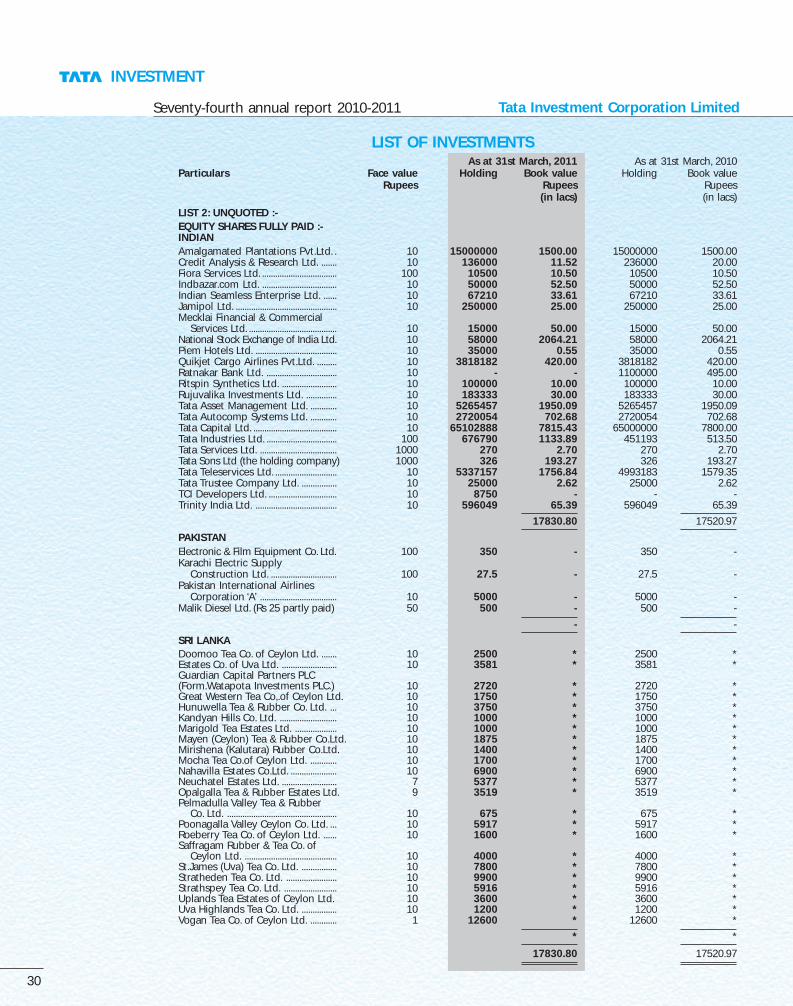
INVESTMENT
Seventy-fourth annual report 2010-2011 Tata Investment Corporation Limited
30
CMYK
LIST 2: UNQUOTED :-EQUITY SHARES FULLY PAID :-INDIANAmalgamated Plantations Pvt.Ltd. . 10 15000000 1500.00 15000000 1500.00Credit Analysis & Research Ltd. ....... 10 136000 11.52 236000 20.00Fiora Services Ltd. .................................. 100 10500 10.50 10500 10.50Indbazar.com Ltd. .................................. 10 50000 52.50 50000 52.50Indian Seamless Enterprise Ltd. ...... 10 67210 33.61 67210 33.61Jamipol Ltd. .............................................. 10 250000 25.00 250000 25.00Mecklai Financial & Commercial
Services Ltd. ........................................ 10 15000 50.00 15000 50.00National Stock Exchange of India Ltd. 10 58000 2064.21 58000 2064.21Piem Hotels Ltd. ..................................... 10 35000 0.55 35000 0.55Quikjet Cargo Airlines Pvt.Ltd. ......... 10 3818182 420.00 3818182 420.00Ratnakar Bank Ltd. ................................ 10 - - 1100000 495.00Ritspin Synthetics Ltd. ......................... 10 100000 10.00 100000 10.00Rujuvalika Investments Ltd. .............. 10 183333 30.00 183333 30.00Tata Asset Management Ltd. ............ 10 5265457 1950.09 5265457 1950.09Tata Autocomp Systems Ltd. ............ 10 2720054 702.68 2720054 702.68Tata Capital Ltd. ...................................... 10 65102888 7815.43 65000000 7800.00Tata Industries Ltd. ................................ 100 676790 1133.89 451193 513.50Tata Services Ltd. ................................... 1000 270 2.70 270 2.70Tata Sons Ltd (the holding company) 1000 326 193.27 326 193.27Tata Teleservices Ltd. ............................ 10 5337157 1756.84 4993183 1579.35Tata Trustee Company Ltd. ................ 10 25000 2.62 25000 2.62TCI Developers Ltd. ............................... 10 8750 - - -Trinity India Ltd. ..................................... 10 596049 65.39 596049 65.39
17830.80 17520.97
PAKISTANElectronic & Film Equipment Co. Ltd. 100 350 - 350 -Karachi Electric Supply
Construction Ltd. .............................. 100 27.5 - 27.5 -Pakistan International Airlines
Corporation ‘A’ ................................... 10 5000 - 5000 -Malik Diesel Ltd. (Rs 25 partly paid) 50 500 - 500 -
- -
SRI LANKADoomoo Tea Co. of Ceylon Ltd. ....... 10 2500 * 2500 *Estates Co. of Uva Ltd. ......................... 10 3581 * 3581 *Guardian Capital Partners PLC(Form.Watapota Investments PLC.) 10 2720 * 2720 *Great Western Tea Co,.of Ceylon Ltd. 10 1750 * 1750 *Hunuwella Tea & Rubber Co. Ltd. ... 10 3750 * 3750 *Kandyan Hills Co. Ltd. .......................... 10 1000 * 1000 *Marigold Tea Estates Ltd. ................... 10 1000 * 1000 *Mayen (Ceylon) Tea & Rubber Co.Ltd. 10 1875 * 1875 *Mirishena (Kalutara) Rubber Co.Ltd. 10 1400 * 1400 *Mocha Tea Co.of Ceylon Ltd. ............ 10 1700 * 1700 *Nahavilla Estates Co.Ltd. ..................... 10 6900 * 6900 *Neuchatel Estates Ltd. ......................... 7 5377 * 5377 *Opalgalla Tea & Rubber Estates Ltd. 9 3519 * 3519 *Pelmadulla Valley Tea & Rubber
Co. Ltd. .................................................. 10 675 * 675 *Poonagalla Valley Ceylon Co. Ltd. ... 10 5917 * 5917 *Roeberry Tea Co. of Ceylon Ltd. ...... 10 1600 * 1600 *Saffragam Rubber & Tea Co. of
Ceylon Ltd. .......................................... 10 4000 * 4000 *St.James (Uva) Tea Co. Ltd. ................ 10 7800 * 7800 *Stratheden Tea Co. Ltd. ....................... 10 9900 * 9900 *Strathspey Tea Co. Ltd. ........................ 10 5916 * 5916 *Uplands Tea Estates of Ceylon Ltd. 10 3600 * 3600 *Uva Highlands Tea Co. Ltd. ................ 10 1200 * 1200 *Vogan Tea Co. of Ceylon Ltd. ............ 1 12600 * 12600 *
* *
17830.80 17520.97
LIST OF INVESTMENTSAs at 31st March, 2011 As at 31st March, 2010
Particulars Face value Holding Book value Holding Book valueRupees Rupees Rupees
(in lacs) (in lacs)

31
CMYK
LIST OF INVESTMENTSAs at 31st March, 2011 As at 31st March, 2010
Particulars Face value Holding Book value Holding Book valueRupees Rupees Rupees
(in lacs) (in lacs)MUTUAL FUNDS FULLY PAID :-(a) Debt Mutual Funds
Birla Sun Life Cash PlusInstitutional Plan.(Growth) 10 14488870 2254.66 - -
Birla Sun Life Savings FundInstitutional Plan.(Growth) 10 - - 13595519 2241.33
HDFC Cash ManagementFund-Treasury AdvantagePlan.(Growth) ........................... 10 - - 29632783 5700.00
HDFC Liquid Fund - PremiumPlus Plan (Growth) ................ 10 12044233 2350.00 - -
ICICI Prudential Blended Plan-Option A-Growth ................... 10 - - 9574946 1300.00
ICICI Prudential FlexibleIncome Plan-Growth. ........... 100 - - 617060 1011.20
ICICI Prudential Liquid SIP -Growth. ...................................... 100 1541650 2200.00 - -
IDFC Money Manager Fund-TP-SIP (Growth) ...................... 10 - - 24118740 2511.42
Kotak Floater-Long Term.(Growth) 10 - - 25596980 3550.00LIC MF Income Plus Fund (Growth) 10 - - 8915256 1100.00Principal Money Manager Fund -
Institutional Plan (Growth) 10 - - 9526078 1000.00SBI HF Ultra Short Term Fund -
Institutional Plan (Growth) 10 - - 25067887 2900.00Tata Floater Fund.(Growth) ..... 10 - - 42837898 5785.57Tata Liquid Super High
Investment Fund.(Growth) 1000 130140 2338.36 11776 200.00
9143.02 27299.52(b) Equity Mutual Funds
HDFC Arbritage Fund-Institutional Plan (Growth) 10 - - 10657194 1200.00
HDFC Top 200 Fund (Growth) 10 233806 500.00 - -
500.00 1200.00
Mutual Funds Fully Paid 9643.02 28499.52
VENTURE CAPITAL FUNDS FULLYPAID :-India Advantage Fund Series 3 ........ 100 150000 150.00 50000 50.00Indiareit Fund. ......................................... 100000 366 365.81 415 414.82Milestone Real Estate Fund. .............. 1000 161914 1619.14 200000 2000.00Multiples Private Equity Fund Scheme. 100000 50 50.00 - -TVS Shriram Private Equity Fund. ... 1000 35000 350.00 20000 200.00
2534.95 2664.82PREFERENCE SHARES FULLY PAID :-Roots Corporation Ltd.5% Cum.
Convt.Pref.Shares. ............................. 100 2000000 2000.00 2000000 2000.00Tata Autocomp Systems Ltd.
8% Cum.Red.(Red.30/09/2012) ... 10 10000000 1000.00 10000000 1000.00Tata Autocomp Systems Ltd.
8% Cum.Red.(Red.31/10/2012) ... 10 5000000 500.00 5000000 500.00Tata Sons Ltd (the holding company)
7% Cum.(Red.30/12/2011) ............ 1000 100000 1000.00 100000 1000.00Tata Sons Ltd (the holding company)
7% Cum.(Red.31/12/2012) ............ 1000 200000 2000.00 200000 2000.00
6500.00 6500.00
36508.77 55185.31
LIST 3 : CURRENT INVESTMENTS :-QUOTED EQUITY SHARES FULLYPAID :-ACC Ltd. ..................................................... 10 - - 12500 91.76Axis Bank Ltd. .......................................... 10 30000 390.83 - -Bharat Electronics Ltd. ......................... 10 25000 440.21 - -Bharat Heavy Electricals Ltd. ............. 10 25000 594.16 8000 179.24ITC Ltd. ........................................................ 1 - - 100000 192.52NTPC Ltd. ................................................... 10 120000 237.39 120000 237.39Reliance Industries Ltd. ....................... 10 204000 2149.54 105000 1094.89State Bank of India. ............................... 10 15000 414.40 - -Tata Consultancy Services Ltd. ........ 1 45000 495.60 - -
4722.13 1795.80
* Denotes amount less than `500

INVESTMENT
Seventy-fourth annual report 2010-2011 Tata Investment Corporation Limited
32
CMYK
SCHEDULE ‘E’ CURRENT ASSETS, LOANS AND ADVANCESAs at
31-03-2010
Rupees Rupees Rupees Rupees
(in lacs) (in lacs) (in lacs) (in lacs)
(a) Sundry Debtors:-(Unsecured and considered good, less than six months) .......... 653.83 -
(b) Cash and Bank balances:-With scheduled banks:
1. On current accounts* ...................................................................... 721.72 242.83
2. On deposit accounts ....................................................................... 20200.00 11200.00
20921.72 11442.83
With other banks, viz. Hatton National Bank Ltd., Colombo
(Realisability of these balances are subject to exchange
control restrictions in Sri Lanka) :-
1. On current account -
Maximum balance during the year `1.56 lacs
(Previous Year `0.39 lacs) .............................................................. 1.42 0.24
2. On deposit account -
Maximum balance during the year `26.30 lacs
(Previous Year `28.08 lacs) ............................................................ 26.03 25.20
27.45 25.44
20949.17 11468.27
*includes `2.23 lacs (Previous Year `2.68 lacs) held in escrow
account towards matured deposits and interest thereon.
(c) Other Current Assets:-i) Dividends declared but not received ...................................... 0.75 42.00
ii) Interest accrued but not due ...................................................... 483.81 617.27
484.56 659.27
(d) Loans and Advances:-(Unsecured and considered good)
(i) Loan to employees ........................................................................... 14.74 14.93
(ii) Intercorporate deposits .................................................................. 12850.00 10500.00
(iii) Interest accrued on loans and deposits ................................. 392.32 125.43
(iv) Advances recoverable in cash or in kind or for value
to be received [includes `Nil (Previous Year `0.98 lacs)
receivable from the Holding Company] ................................. 320.06 319.88
(v) Advance taxes (net of provisions) ............................................. 69.81 63.39
13646.93 11023.63
35734.49 23151.17
SCHEDULE FORMING PART OF THE BALANCE SHEET

33
CMYK
SCHEDULE ‘F’ CURRENT LIABILITIES AND PROVISIONSAs at
31-03-2010
Rupees Rupees Rupees Rupees
(in lacs) (in lacs) (in lacs) (in lacs)
(a) Current Liabilities:-
(i) Sundry creditors (other than micro and
small enterprises) [See Notes 1 and 2 below] ..................... 555.90 444.73
(ii) Investor Education and Protection Fund shall be
credited by the following [See Notes 3 and 4 below] :-
a) Unpaid dividends .................................................................. 121.01 116.81
b) Unpaid matured deposits .................................................. 1.82 2.13
c) Unpaid matured debentures
(including premium of redemption) ............................. - 0.30
d) Interest accrued on (a) to (c) above .............................. 0.41 0.55
123.24 119.79
(iii) Other liabilities .................................................................................. 12.77 11.02
691.91 575.54
(b) Provisions:-
(i) Employee benefits liability ........................................................... 153.35 211.66
(ii) Contingent provision against standard assets
(as per RBI regulations) .................................................................. 36.78 -
(iii) Provision for taxation (net of advance taxes) ....................... 40.37 40.36
(iv) Provision for fringe benefit tax (net of advance taxes) .... 4.70 2.80
235.20 254.82
927.11 830.36
Notes:
1. None of the creditors have declared themselves under the Micro, Small and Medium Enterprises Development Act, 2006.
The above information has been determined to the extent such parties have been identified on the basis of information
available with the Company. This has been relied upon by the auditors.
2. Sundry Creditors includes `Nil (Previous Year `4.05 lacs) in respect of capital expenditure.
3. The actual amount to be transferred to the Investor Education and Protection Fund in respect of items (ii) (a) to (d) shall be
determined on the due dates.
4. Cheques had been issued by the Company in respect of items (ii) (a) to (d) which have not been encashed by the respective parties.
SCHEDULE FORMING PART OF THE BALANCE SHEET

INVESTMENT
Seventy-fourth annual report 2010-2011 Tata Investment Corporation Limited
34
CMYK
SCHEDULES FORMING PART OF THE PROFIT AND LOSS ACCOUNT
SCHEDULE ‘G’ INTERESTPrevious Year
Rupees Rupees(in lacs) (in lacs)
Interest Received :-
(i) On Investments [Tax deducted at source `9.71 lacs(Previous Year `.4.99 lacs) and includes `175.55 lacson current investments (Previous Year `Nil)] ............................................. 1151.95 1319.21
(ii) On Loans and Advances [Tax deducted at source `275.31 lacs(Previous Year `215.74 lacs)] .............................................................................. 2587.02 1506.27
3738.97 2825.48
Less: Interest paid on Fixed Loans ............................................................................. 81.88 -
3657.09 2825.48
SCHEDULE ‘H’ OTHER INCOMEPrevious Year
Rupees Rupees(in lacs) (in lacs)
(1) Net profit on sale of fixed assets ..................................................................... - 0.64
(2) Provision for diminution in value of investments, no longer required,written back (net) [including `Nil for current investments(Previous Year `116.49 lacs)] .............................................................................. 174.68 272.93
(3) Compensation on waiver of certain obligations of promoters of aninvestee company 209.53 -
(4) Miscellaneous - Gross [includes profit on foreign exchange `0.83 lacs(Previous Year `Nil)] 30.99 3.94
415.20 277.51
SCHEDULE ‘I’PAYMENTS TO AND PROVISIONS FOR EMPLOYEES
Previous YearRupees Rupees
(in lacs) (in lacs)
(1) Salaries ........................................................................................................................ 495.69 366.35
(2) Contributions to provident and other funds .............................................. 44.33 29.52
(3) Employees’ welfare ................................................................................................. 46.97 46.41
(4) Retiring gratuities including contribution to gratuity fund ................. 29.40 1.33
616.39 443.61

35
CMYK
SCHEDULE ‘J’ OTHER EXPENDITUREPrevious
YearRupees Rupees Rupees
(in lacs) (in lacs) (in lacs)(1) Miscellaneous [includes loss on foreign exchange `Nil
(Previous Year `2.90 lacs) and loss on write off offixed assets `0.03 lacs (Previous Year `Nil)] .................................................... 220.28 252.64
(2) Donations ....................................................................................................................... 120.25 119.60
(3) Insurance ........................................................................................................................ 1.45 1.03
(4) Rent ................................................................................................................................. 53.20 26.98
(5) Commission/Sitting fees to non-whole time directors (See Note 10to Schedule K) .............................................................................................................. 95.00 88.40
(6) Repairs and Maintenance :
a) Plant and Machinery ...................................................................................... 14.56 3.14
b) Buildings .............................................................................................................. 0.78 0.81
c) Others ................................................................................................................... 4.77 4.03
20.11 7.98(7) Auditors’ Remuneration :
(i) Statutory Auditors*
a) Audit fees ...................................................................................................... 9.00 9.00
b) Tax audit fees ............................................................................................... 2.20 2.20
c) Other services .............................................................................................. 9.45 9.40
d) Service tax ..................................................................................................... 2.14 2.12
e) Out-of-pocket expenses .......................................................................... 0.14 0.03
22.93 22.75(ii) Fees paid to Internal Auditors .................................................................... 4.41 4.41
27.34 27.16(8) Contingent provision against standard assets of NBFCs’
(as per RBI regulations) ............................................................................................ 36.78 -
574.41 523.79
* includes payment made to a firm in which some of the partners of audit firm are partners.
SCHEDULE FORMING PART OF THE PROFIT AND LOSS ACCOUNT

INVESTMENT
Seventy-fourth annual report 2010-2011 Tata Investment Corporation Limited
36
C M Y K
SCHEDULE ‘K’
NOTES TO THE ACCOUNTS FOR THE YEAR ENDED 31ST MARCH, 2011
1. Significant Accounting Policies:
(i) Basis of Preparation of Financial Statements.
The financial statements have been prepared on the historical cost convention, on an accrual basis and comply in allmaterial respect with the Accounting Standards notified by Companies (Accounting Standard) Rules, 2006 and therelevant provisions of the Companies Act, 1956.
(ii) The preparation of the financial statements requires the management to make estimates and assumptions consideredin the reported amounts of assets and liabilities (including the contingent liabilities) and the reported income andexpenses during the reporting period. The management believes that the estimates used in the preparation of thefinancial statements are prudent and reasonable. The differences between the actual results and the estimates arerecognised in the periods in which the results are known / materialise.
(iii) Fixed assets are stated at cost less accumulated depreciation provided on the written down value method at thefollowing rates :-
(% p.a.)
(a) Building .......................................................................................................................... 5
(b) Furniture, Fixtures and Equipment ..................................................................... 100
(c) Motor Cars .................................................................................................................... 26
(d) Plant and Machinery ................................................................................................ 40
(e) Leasehold assets are amortised equitably over the remaining period of the lease.
(iv) Income from Dividend is accounted as and when such dividend has been declared and the Company’s right to receivepayment is established.
Interest income is recognised on a time proportion basis, taking into account the amount outstanding and the rateapplicable.
(v) a) Short-term employee benefits are recognised as an expense at the undiscounted amount in the profit and lossaccount of the period in which the related service is rendered.
b) Contributions under Defined Contribution Plans are recognised in the Profit and Loss Account in the period inwhich the employee has rendered the service.
c) Company’s liability towards Defined Benefit Plans / Long term compensated absences is determined by an inde-pendent actuary using the projected unit credit method. Past services are recognised on a straight line basis overthe average period until the benefits become vested. Actuarial gains and losses are recognised immediately inthe statement of Profit and Loss Account as income or expense. Obligation is measured at the present value ofestimated future cash flows using a discounted rate that is determined by reference to the market yields at theBalance Sheet date on Government Bonds where the currency and terms of the Government Bonds are consistentwith the currency and estimated terms of the defined benefit obligation.
(vi) a) Long Term investments are stated at average cost except where there is a diminution other than temporary, forwhich provision is made.
b) Current investments are stated at the lower of cost and fair value, considered category wise.
(vii) Income tax expense comprises current tax and deferred tax charge or credit. The current tax is determined as theamount of tax payable in respect of the estimated taxable income for the period. The deferred tax charge or credit isrecognised using prevailing enacted or substantively enacted tax rates. Where there is unabsorbed depreciation orcarry forward losses, deferred tax assets are recognised only if there is virtual certainty of realisation of such assets.Other deferred tax assets are recognised only to the extent there is a reasonable certainty of realisation in future.Deferred tax assets/liabilities are reviewed at each balance sheet date based on developments during the year andavailable case laws to reassess realisation/liabilities.

37
C M Y K
2. In accordance with the High Court Orders dated 27th September, 2002, 30th January, 2009 and 25th September, 2009 and the AccountingPractice adopted earlier, provision for diminution in the value of investments (Long Term and Current) are adjusted to the securities premiumaccount instead of Profit and Loss Account as prescribed under Accounting Standard (AS) 13 on ‘Accounting for Investments’.
As a consequence, an amount of Rs.131.94 lacs (Previous Year Rs.1541.57 lacs) has been credited to the securities premium account being writeback of provision for diminution in value of certain investments no longer required, which had been debited to such account in earlier years.
Previous Year
Rupees Rupees(in lacs) (in lacs)
3. (i) Contingent Liabilities -
a) Uncalled liability on partly paid shares ........................................................................................................ 0.13 0.13
b) Income tax matters decided in the Company’s favour by appellate
authorities, where the department is in further appeal ..................................................................... 37.62 37.62
c) Claims against the Company not acknowledged as debts in respect of
income tax matters .............................................................................................................................................. 558.20 558.20
(ii) Commitments -
Uncalled liability on investments in Venture Capital Funds .......................................................................... 950.00 750.00
4. Expenditure in foreign currency -
a) For professional fees ....................................................................................................................................................... 0.13 0.13
b) For bank charges ............................................................................................................................................................. — 0.01
c) For purchase of investments ....................................................................................................................................... — 7800.00
5. Earnings in foreign currency -
a) Interest received on deposits ...................................................................................................................................... 1.62 2.77
b) Dividend received (kept in Suspense, pending receipt in India) ................................................................. 1.32 0.18
6. Foreign exchange currency exposures not covered with regard to the (non-repatriable) deposit placed with Hatton National Bank, Colombo, of SriLankan Rs.64.25 lacs Previous Year Sri Lankan Rs.64.25 lacs (Equivalent Indian `26.03 lacs; Previous Year equivalent Indian `25.20 lacs).
7. As the Company has no activities other than those of an investment company, the segment reporting under Accounting Standard 17 – “SegmentReporting” is not applicable. The Company does not have any reportable geographical segment.
8. Related Parties Disclosures
a) List of Related Parties and Relationship
Promoter and holding company
Tata Sons Ltd.
Associates
1. Tata Asset Management Ltd.
2. Tata Trustee Company Pvt. Ltd.
3. Amalgamated Plantations Pvt. Ltd. (w.e.f. 29.4.2009)
Key Management Person (KMP)
1. Mr. M. J. Kotwal
2. Mr. A.N. Dalal (w.e.f 1.1.2010)

INVESTMENT
Seventy-fourth annual report 2010-2011 Tata Investment Corporation Limited
38
C M Y K
Other subsidiaries of Promoter :- (with whom the Company has transactions)
1. Ewart Investments Limited 2. Infiniti Retail Limited
3. Panatone Finvest Ltd. 4. Tata Autocomp Systems Ltd. (w.e.f. 1.9.2010)
5. Tata Capital Limited 6. Tata Consultancy Services Limited
7. Tata Consulting Engineers Limited 8. Tata Housing Development Co. Limited
9. Tata Industries Limited (w.e.f. 1.9.2010) 10. Tata Realty and Infrastructure Limited
11. Tata Securities Limited 12. Tata Sky Ltd.
13. Tata Teleservices Ltd. 14. Tata Teleservices (Maharashtra) Ltd.
15. TC Travel & Services Limited
b) Related Party Transactions Rupees (in lacs)
2010-11 2009-10
Promoter Associates Other KMP Promoter Associates Other KMPSubsidiaries Subsidiariesof Promoter of
Promoter
1. Subscription to equity shares .............. — — 797.88 — — 2.00 — —
2. Interest on debentures ........................... 51.50 — — — 48.40 — — —
3. Dividends received .................................... 232.82 574.91 334.17 — 232.82 432.25 43.39 —
4. Dividends Paid ............................................ 5032.59 — 121.73 0.98 6666.12 — 179.33 1.02
5. Fees paid for professional services ... — — — — 5.52 — — —
6. Deposits placed .......................................... — — 11200.00 — — — 19800.00 —
7. Deposits withdrawn ................................. — — 13200.00 — 5000.00 — 19000.00 —
8. Interest on deposit placed .................... — — 452.80 — 27.33 — 700.31 —
9. Purchase of investments ........................ 15.43 — — — — — — —
10. Purchase of fixed assets ......................... — — 2.35 — — — 1.35 —
11. Brand equity subscription expense .. 67.11 — — — 63.38 — — —
12. Rent Reimbursement / Paid .................. 0.26 — 52.94 — 0.51 — 26.47 —
13. Brokerage paid ............................................ — — 6.10 — — — 6.71 —
14. Telephone call charges ............................ — — 2.53 — — — 1.17 —
15. Other expenses ........................................... 22.25 — 0.86 — 44.49 — — —
16. Remuneration paid ................................... — — — 296.58 — — — 129.33
Debit balance outstanding at year end -outstanding receivables ...................................... 548.40 — 3327.08 — 549.38 — 5361.93 —Credit balance outstanding at year end -outstanding payables .......................................... 211.58 — 0.16 85.00 203.80 — — 41.60

39
C M Y K
c) Details of material related party transactions included in (b) aboveRupees (in lacs)
2010-2011 2009-2010
Associates Other KMP Associates Other KMPsubsidiaries subsidiariesof Promoter of Promoter
Subscription to equity sharesTata Trustee Co. Pvt. Ltd. .............................................. — — — 2.00 — —Tata Industries Ltd. ......................................................... — 620.39 — — — —Tata Teleservices Ltd. ..................................................... — 177.49 — — — —Dividends receivedTata Asset Management Ltd. ..................................... 394.91 — — 342.25 — —Amalgamated Plantations Pvt. Ltd. ......................... 180.00 — — 90.00 — —Tata Autocomp Systems Ltd. ..................................... — 232.08 — — — —Deposits placedTata Autocomp Systems Ltd. ..................................... — 2500.00 — — — —Infiniti Retail Ltd. ............................................................. — 2500.00 — — 4500.00 —Tata Realty and Infrastructure Ltd. ......................... — — — — 5000.00 —Tata Sky Ltd. ...................................................................... — 1500.00 — — 5000.00 —Tata Consulting Engineers Ltd. ................................. — 1500.00 — — 2500.00 —Tata Housing Development Co. Ltd. ....................... — — — — 2500.00 —Tata Capital Ltd. ............................................................... — 2500.00 — — — —Deposits withdrawnTata Consulting Engineers Ltd. ................................. — 2500.00 — — — —Infiniti Retail Ltd. ............................................................. — 2500.00 — — 6500.00 —Tata Realty and Infrastructure Ltd. ......................... — — — — 5000.00 —Tata Sky Ltd. ...................................................................... — 2500.00 — — 4000.00 —Tata Housing Development Co. Ltd. ....................... — — — — 2500.00 —Tata Capital Ltd. ............................................................... — 2500.00 — — — —Tata Realty and Infrastructure Ltd. ......................... — 2500.00 — — — —Interest on deposit placedInfiniti Retail Ltd. ............................................................. — 93.36 — — 180.85 —Tata Realty & Infrastructure Ltd. .............................. — 55.68 — — 233.46 —Tata Sky Ltd. ...................................................................... — 27.95 — — 200.34 —Tata Consulting Engineers Ltd. ................................. — 109.23 — — — —Tata Capital Ltd. ............................................................... — 52.67 — — — —Purchase of Fixed AssetsInfiniti Retail Ltd. ............................................................. — 2.35 — — 1.35 —Rent PaidEwart Investments Ltd. ................................................. — 52.94 — — 26.47 —Brokerage paidTata Securities Ltd. ......................................................... — 6.10 — — 6.71 —Telephone call chargesTata Teleservices (Maharashtra) Ltd. ...................... — 2.53 — — 1.17 —Remuneration PaidMr. M. J. Kotwal ................................................................. — — 101.43 — — 83.04Mr. A.N. Dalal ..................................................................... — — 195.15 — — 46.29
9. Deferred Tax Assets have not been recognised, as there is no reasonable certainty for setting off the same, considering the present taxstatus of the Company.
10. Managerial Remuneration :
(a) Computation of net profits Under Section 309(5) read with Section 349 of the Companies Act, 1956
Previous YearRupees (in lacs) Rupees (in lacs)
Profit before taxes per Profit and Loss Account ......................................................................................... 23446.65 22280.55Add: Non-whole time Directors’ remuneration [including sitting fees of Rs.15.00 lacs
(Previous Year Rs.18.40 lacs) and net of excess provision of previous year ofRs.5.00 lacs (Previous Year Rs.Nil)] ........................................................................................................ 95.00 88.40Whole time Directors’ remuneration .................................................................................................. 296.58 129.33Loss on write off of fixed assets ........................................................................................................... 0.03 —Contingent provision against standard assets ............................................................................... 36.78 —
23875.04 22498.28Less: Net Profit on sale of investments ......................................................................................................... 14790.44 15041.51
Net Profit on sale of fixed assets .......................................................................................................... — 0.64Provision for diminution in value of investments, no longer required, written back .... 174.68 272.93
8909.92 7183.20
1% of above ............................................................................................................................................................... 89.09 71.83
Commission to the Non-Whole time Directors ..................................................................................... 85.00 70.00

INVESTMENT
Seventy-fourth annual report 2010-2011 Tata Investment Corporation Limited
40
C M Y K
(b) Remuneration, commission, perquisites and contribution to Provident and Superannuation Funds in respect of the Whole timeDirectors (excluding gratuity, leave salary provision and group insurance premium) included in the Profit and Loss Account isRs.296.58 lacs (Previous Year Rs.129.33 lacs), as per details given below :
Previous YearRupees (in lacs) Rupees(in lacs)
Remuneration .............................................................................................................................................................. 193.74 77.81
Commission .................................................................................................................................................................. 85.00 40.00
Perquisites ..................................................................................................................................................................... 4.94 4.61
Contribution to Provident and Superannuation Funds ............................................................................ 12.90 6.91
296.58 129.33
11. Employee benefits :
Defined benefit plans – As per actuarial valuation as at 31st March, 2011
Previous Year
Gratuity(Funded) Gratuity(Funded)Rupees (In lacs) Rupees (In lacs)
A Expenses recognised in the statement of Profit and Loss Account for the year
1. Current service cost 8.69 7.562. Interest cost 12.89 10.743. Expected return on plan assets (12.56) (10.71)4. Net actuarial (gain)/loss recognised during the year 20.38 (6.26)5. Expenses / (Income) recognised in the Profit and Loss Account (Schedule ‘I’) 29.40 1.33
B Actual return on plan assets for the year1. Expected return on plan assets 12.56 10.712. Actuarial gain / (loss) on plan assets 0.07 —3. Actual return on plan assets 12.63 10.71
C Net Asset/(Liability) recognised in the Balance Sheet at the end of the year1. Present value of the Defined Benefit obligation 196.16 152.402. Fair value of plan assets 196.16 152.403. Net Asset/(Liability) recognised in the Balance Sheet — —
D Changes in Defined benefit obligation during the year1. Present value of the Defined benefit obligation at the beginning of the year 152.40 143.192. Current service cost 8.69 7.563. Interest cost 12.89 10.744. Benefits paid — (2.83)5. Actuarial (gain)/loss on obligation 20.45 (6.26)6. Liabilities assumed on acquisition 1.73 —7. Present value of obligation as at the end of the year 196.16 152.40
E Changes in Fair Value of plan assets during the year1. Fair value of plan assets at the beginning of the year 152.40 143.192. Expected return on plan assets 12.56 10.713. Contributions made 29.40 1.334. Benefits paid — (2.83)5. Actuarial gain/(loss) on plan assets 0.07 —6. Assets acquired on acquisition 1.73 —7. Fair value of plan assets at the end of the year 196.16 152.40
F Major Categories of plan assets as a percentage of total plan assets1. Central Government Securities 21.88% 28.16%2. State Government Securities 3.84% —3. Public Sector Bonds 58.19% 67.87%4. Cash at Bank 16.09% 3.97%
G Actuarial assumptions1. Discount rate 8.10% 8.00%2. Expected rate of return on plan assets 8.25% 8.24%

41
C M Y K
H Experience adjustments
1. On Plan liabilities 21.48 (6.26)
2. On Plan assets 0.07 —
I Other long term benefits
The defined benefit obligations which are provided for but not funded are as under :-
1. Long Service Award 23.30 39.19
2. Compensated Absences 130.05 172.47
Notes :
a) Gratuity is administered through a trust fund recognised by the Income Tax Act, 1961.
b) Future salary increases considered in actuarial valuation take into account inflation, seniority, promotion and other retirement factors.
c) The expected rate of return on plan assets is based on expectation of the average long term rate of return on investments of the Fund during theestimated term of the obligations.
d) The above information is certified by the actuary and relied upon by statutory auditors.
e) The Company has recognised the following amounts in the Profit and Loss Account. (Details in Schedule ‘I’)
Previous Year(Rs. in lacs) (Rs. In lacs)
Compensated absences and long service awards (included under salaries) .................................. (41.41) 7.62
Retiring gratuities including contribution to gratuity fund .................................................................... 29.40 1.33
Contributions to provident and other funds include
- Provident Fund ................................................................................................................................................ 23.35 14.72
- Superannuation Fund ................................................................................................................................... 17.97 14.60
- Employees’ State Insurance Scheme ...................................................................................................... 3.01 0.20
As at 31.3.2011 As at 31.3.201012. Details of Earnings per share :-
i) Profit computation for both basic and diluted earnings per share of Rs.10/-Net Profit as per Profit and Loss Account available for Ordinary shareholdersRupees (in lacs) ........................................................................................................................................................... 19858.86 19391.59
ii) Weighted average number of Ordinary shares for computing –
a) Basic earnings per share .............................................................................................................................. 4,82,37,074 3,90,65,198b) Diluted earnings per share ......................................................................................................................... 5,00,88,974 4,92,75,568
iii) Earnings per Ordinary share (Weighted average)(As per Accounting Standard 20 – Earnings Per Share)
Basic (Rupees) ............................................................................................................................................................. 41.17 49.64Diluted (Rupees) ......................................................................................................................................................... 39.65 39.35
13. All Investments disclosed under Schedule ‘D’ are Trade Investments.
Previous Year
Gratuity (Funded) Gratuity (Funded)Rupees (In lacs) Rupees (In lacs)

INVESTMENT
Seventy-fourth annual report 2010-2011 Tata Investment Corporation Limited
42
C M Y K
14. The following additional information (other than what is already disclosed elsewhere) is disclosed in terms of RBI Circular(Ref. No.DBNS.200/CGM CPR-2008) dated 1st August, 2008.
(a) Capital to Risk Assets Ratio (CRAR) -
Items Current Year* Previous Year
i) CRAR (%) 115.01 107.04
ii) CRAR – Tier I capital (%) 114.98 107.04
iii) CRAR – Tier II capital (%) 0.03 -
*NBS-7 return yet to be filed.
(b) Exposure to Real Estate Sector -
Category Current Year Previous Year
( Rs. In lacs )
a) Direct exposure
i) Residential Mortgages -
Lending fully secured by mortgages on residential property that is or will beoccupied by the borrower or that is rented; — —
(ii) Commercial Real Estate -Lending secured by mortgages on commercial real estates Exposure wouldalso include non-fund based (NFB) limits; — —
(iii) Investments in Mortgage Backed Securities (MBS) and other securitisedexposures -
a. Residential — —
b. Commercial Real Estate — —
b) Indirect Exposure
Fund based and non-fund based exposures on National Housing Bank (NHB)and Housing Finance Companies (HFCs) # 2885.39 2978.09
# represents investments in equity shares/venture capital funds.
(c) Asset Liability Management -
Maturity pattern of certain items of assets and liabilities as on 31.3.2011
(Rs. in crores)
1 day Over one Over 2 Over 3 Over 6 Over 1 Over 3 Over Totalto one month to months to months to months to year to years to 5 yearsmonth 2 months 3 months 6 months 1 year 3 years 5 years
Liabilities
Borrowings from banks — — — — — — — — —Market Borrowings — — — — — — — — —
Assets
Advances 8.69 — 25.05 70.00 25.00 — — — 128.74
Investments @ 91.43 — 9.76 — 61.97 45.10 24.44 74.73 307.43
@ Equity shares and fully convertible preference shares amounting to Rs.983.45 crores, are not included above, sincethere is no set maturity pattern for the same.
In compiling the information in the above note, certain assumptions have been made by the Company and the samehave been relied upon by the Auditors.
15. Previous year’s figures have been regrouped wherever necessary.

43
C M Y K
BALANCE SHEET ABSTRACT AND COMPANY’S GENERAL BUSINESS PROFILE
I. Registration Details
Registration No.2622 State Code 11Maharashtra
Balance Sheet Date: 31.3.2011
II. Capital raised during the year (Rupees in lacs) Nil
III. Position of Mobilisation and Deployment of Funds (Rupees in lacs)
Total Liabilities Total Assets(Excludes Current Assets) (Net of Current Liabilities)
163968.62 163968.62
Sources of Funds Application of Funds
Paid up capital Net Fixed Assets4823.71 72.80
Reserves & Surplus Investments159144.91 129088.44
Net Current Assets34807.38
Secured Loans Miscellaneous ExpenditureNil Nil
Unsecured Loans Accumulated LossesNil Nil
IV. Performance of Company (Rupees in lacs)Turnover
viz. Total Income24727.83
Total Expenditure1281.18
Profit before tax23446.65
Profit after tax19858.86
Basic Earnings per share in Rs.41.17
Dividend Rate %160
V. Generic Names of Three Principal Products/Services of Company (as per monetary terms)Not applicable

INVESTMENT
Seventy-fourth annual report 2010-2011 Tata Investment Corporation Limited
44
C M Y K
Schedule appended to the Balance Sheet of a non-deposit taking non-banking financial company[as required in terms of Paragraph 13 of Non-Banking Financial (Non-Deposit Accepting or Holding) Companies Prudential Norms
(Reserve Bank) Directions, 2007]
Rupees in lacs Previous Year
Particulars
Liabilities Side :
(1) Loans and advances availed by the NBFCs Amount Amount Amount AmountInclusive of interest accrued thereon but not paid : outstanding overdue outstanding overdue
(a) Debentures : Secured ............................................................... — — 0.30+ —
: Unsecured ......................................................... — — — —(other than falling within the meaningof public deposits)
(b) Deferred Credits ......................................................................... — — — —
(c) Term Loans .................................................................................. — — — —
(d) Inter-corporate loans and borrowing ............................... — — — —
(e) Commercial Paper ..................................................................... — — — —
(f ) Public Deposits ........................................................................... 2.23* — 2.68* —
(g) Other Loans (Overdraft from a bank) ............................... — — — —
+including unclaimed principal Rs. Nil, Previous Year Rs.0.30 lacs.
*entire amount is on account of unclaimed deposits/interest.
Previous Year
Assets Side : Amount outstanding Amount outstanding
(2) Break-up of Loans and Advances including billsreceivables [other than those included in (3) below] :
(a) Secured .......................................................................................... — —
(b) Unsecured ..................................................................................... 13646.93 11023.63
(3) Break up of Leased Assets and stock on hire andhypothecation loans counting towards AFC activities
(i) Lease assets including lease rentals under sundry debtors :
(a) Financial lease .................................................................. — —
(b) Operating lease ............................................................... — —
(ii) Stock on hire including hire charges under sundry debtors :
(a) Assets on hire ................................................................... — —
(b) Repossessed Assets ........................................................ — —
(iii) Other loans counting towards AFC activities
(a) Loans where assets have been repossessed ...... — —
(b) Loans other than (a) above ........................................ — —
(4) Break-up of Investments : (net of provision for diminution)
Current Investments :
1. Quoted :
(i) Shares : (a) Equity .................................................. 4672.42 1795.80
(b) Preference ......................................... — —
(ii) Debentures and Bonds ................................................. — —
(iii) Units of mutual funds ................................................... — —
(iv) Government Securities ................................................. — —
(v) Others .................................................................................. — —
2. Unquoted :
(i) Shares : (a) Equity .................................................. — —
(b) Preference ......................................... — —
(ii) Debentures and Bonds ................................................. — —
(iii) Units of mutual funds ................................................... — —
(iv) Government Securities ................................................. — —
(v) Others .................................................................................. — —

45
C M Y K
Long Term investments :1. Quoted :
(i) Shares: (a) Equity .................................................. 75564.24 62317.59(b) Preference ......................................... 2457.66 —
(ii) Debentures/Bonds ......................................................... 7889.13 10439.39(iii) Units of mutual funds ................................................... 1018.50 1610.53(iv) Government Securities ................................................. 1504.45 —(v) Others .................................................................................. — —
2. Unquoted :(i) Shares : (a) Equity .................................................. 17304.07 16624.54
(b) Preference ......................................... 6500.00 6500.00(ii) Debentures and Bonds ................................................. — —(iii) Units of mutual funds ................................................... 9643.02 28499.52(iv) Government Securities ................................................. — —(v) Others : (a) Application Money ........................ — 100.00
(b) Units of venture capital fund .... 2534.95 2664.82
TOTAL 129088.44 130552.19
(5) Borrower group-wise classification of all leased assets, stock-on-hire and loans and advances (including other CurrentAssets)
Previous Year Secured Unsecured Total Secured Unsecured Total
1. Related Partiesa) Subsidiaries ...................................... — — — — — —b) Companies in the same group — 3327.08 3327.08 — 5361.93 5361.93c) Other related parties .................... — 48.40 48.40 — 39.26 39.26
2 Other than related parties .................... — 32359.01 32359.01 — 17749.98 17749.98
TOTAL — 35734.49 35734.49 — 23151.17 23151.17
(6) Investor group-wise classification of allinvestments (current and long term) in shares and securities (both quotedand unquoted) :
Previous Year Category Market Value/Break up Book Value Market Value/Break up Book Value
or fair value or NAV (Net of Provisions) or fair value or NAV (Net of Provisions)
1. Related Partiesa) Subsidiaries .......................................... — — — —b) Companies in the same group .... 49530.29 18731.56 33133.37 14211.90c) Other related parties ........................ 12378.20 3703.39 9951.07 3703.39
2. Other than related parties 343944.61 106653.49 320722.44 112636.90
TOTAL 405853.10 129088.44 363806.88 130552.19
(7) Other Information Previous Year(i) Gross Non-Performing Assets
(a) Related parties ................................................................. — —(b) Other than related parties .......................................... — —
(ii) Net Non-Performing Assets(a) Related parties ................................................................. — —(b) Other than related parties .......................................... — —
(iii) Assets acquired in satisfaction of debt ............................ — —
Rupees in lacs
Previous YearAmount outstanding Amount outstanding
Signatures to Schedules A to K, Lists 1 to 3, For and on behalf of the Board,Balance Sheet Abstract and Company’s GeneralBusiness Profile and NBFC (Non-Deposit N.N.TATA ChairmanAccepting or Holding) Companies Prudential F.N.SUBEDAR Vice ChairmanNorms (RBI) Directions, 2007.
A. B. K. DUBASHM. J. KOTWAL A.N.DALAL K. A. CHAUKARExecutive Dorector & Executive Director - H.N.SINOR Directors
Mumbai, 10th May, 2011. Secretary. Investments Z.DUBASHA.CHANDRA
}

INVESTMENT
Seventy-fourth annual report 2010-2011 Tata Investment Corporation Limited
46
C M Y K
F I N A N C I A L S TAT I S T I C S(For the last 20 years)
(Rupees in lacs)
Year Paid up Reserves Total Invest- Net Total Total Profit Profit Dividend/ Dividend Realisable Debt/ Number ofCapital and Borro- ments (at Fixed, Income Expenses before after Dividend on value of Equity companies
Surplus wings or below Net (including (Including Tax Tax Tax Ordinary invest- ratio invested incost) Current and net net Shares ments (excluding
Deferred tax interest) interest) (%) mutual fundAssets units)
1991-92 534.14 4130.07 2519.12 5266.72 1916.61 1826.30 173.66 1652.64 1490.75 160.24 30 59397 0.54:1 3131992-93 641.65 5070.11 3171.37 8284.86 598.27 1161.52 172.55 988.97 769.45 205.76 35 32535 0.56:1 3181993-94 749.16 6411.55 3009.50 9479.26 690.95 1959.70 438.56 1521.14 1241.57 278.16 40 57618 0.42:1 3331994-95 1223.74 10392.59 1258.00 11208.45 1665.88 2474.53 291.00 2183.53 1692.27 406.45 35 55210 0.11:1 3951995-96 1223.74 11742.45 2274.15 12744.09 2496.25 2541.06 205.69 2335.37 1778.17 428.31 35 53056 0.18:1 419
1996-97 1223.74 13118.45 2087.91 13591.59 2838.51 2835.32 401.93 2433.39 1981.73 605.75 45 42691 0.15:1 4101997-98 1243.13 15413.49 2778.84 17084.43 2351.03 2716.28 563.98 2152.30 2005.98 615.35 45 44749 0.17:1 4411998-99 1243.13 16991.09 2144.40 18847.74 1530.88 2832.33 398.45 2433.88 2267.54 689.94 50 41707 0.12:1 4291999-00 1641.01 21331.23 3490.66 26881.99 (419.09) 4672.76 710.50 3962.26 3720.98 1507.41 60 72170 0.15:1 4092000-01 1641.01 24416.19 1421.72 27322.59 156.33 4480.76 398.16 4082.60 4112.72 1085.03 60 46401 0.05:1 353
2001-02 1969.18 28619.95 3193.73 30003.04 3779.82 5032.73 521.01 4511.72 4396.73 1085.03 60 49982 0.10:1 3082002-03 2297.36 32516.38 1019.94 31693.13 4140.55 5280.11 341.21 4938.90 4582.38 1181.51 60 54511 0.03:1 2532003-04 2297.36 37946.15 3875.18 45501.06 (1382.37) 9036.69 486.62 8550.07 8055.68 2617.62 101 118476 0.10:1 2382004-05 2297.36 46357.29 633.70 51652.21 (2363.86) 11918.47 528.63 11389.84 11237.53 3148.25 120 149005 0.01:1 2372005-06 3446.04 56807.47 417.89 62462.40 (1791.00) 17087.84 628.56 16459.28 16314.07 4715.21 120 243807 0.01:1 231
2006-07 3446.04 68635.94 53.31 75358.83 (3223.54) 20413.52 639.93 19773.59 18164.87 6047.54 150 221000 0.01:1 2292007-08 3446.04 81066.83 - 88819.05 (4306.18) 21007.65 776.24 20231.41 18585.20 6047.54 150 306572 0.00:1 1842008-09 3446.04 91080.56 44774.23 121921.98 17378.85 21344.33 997.00 20347.33 18629.02 6047.54 150 216627 0.00:1* 1782009-10 4823.71 148153.89 - 130552.19 22425.41 23262.10 981.55 22280.55 19391.59 7256.39 150 363807 0.00:1 1972010-11 4823.71 159144.91 - 129088.44 34880.18 24727.83 1281.18 23446.65 19858.86 8999.78 160 405853** 0.00:1 205
Note: Previous years’ figures have been re-grouped wherever necessary.* Zero coupon fully convertible bonds not considered as debt.** Please see Para 5 of the Directors’ Report.
SUMMARY OF INVESTMENTSDISTRIBUTION AMONG DIFFERENT INDUSTRIES AND CLASSES OF SECURITIES
(Quoted and Unquoted Investments)As at As at
31-03-2011 31-03-2010
I. Distribution among different industries as a percentage to the book value - (%) (%)Banks .................................................................................................................................................... 4.86 3.70Cement ................................................................................................................................................ 1.80 0.60Chemicals and Fertilizers ............................................................................................................. 3.87 4.03Electricity and Transmission ....................................................................................................... 2.67 2.36Electricals and Electronics ........................................................................................................... 1.22 1.09Engineering & Infrastructure ..................................................................................................... 3.33 1.57Fast Moving Consumer Goods .................................................................................................. 2.81 2.72Finance and Investments ............................................................................................................ 11.93 11.11Healthcare .......................................................................................................................................... 2.78 1.19Hotels ................................................................................................................................................... 4.79 4.73Information Technology ............................................................................................................... 5.58 3.10Media ................................................................................................................................................... 0.20 0.16Metals & Mining .............................................................................................................................. 6.59 6.35Motor Vehicles and Ancillaries .................................................................................................. 9.59 7.88Oil and Natural Resources ........................................................................................................... 5.24 4.13Paper,Printing & Packaging ........................................................................................................ 0.15 0.43Retail .................................................................................................................................................... 5.11 3.17Telecommunications ..................................................................................................................... 1.85 1.93Textiles ................................................................................................................................................. 0.46 0.17Transportation and Logistics ..................................................................................................... 1.75 1.62Miscellaneous and Diversified .................................................................................................. 6.04 5.07Debentures/Bonds ......................................................................................................................... 7.23 7.93Mutual Funds/Venture Capital Funds .................................................................................... 10.15 24.96
100.00 100.00
II. Distribution among classes of securities as a percentage to the book value -Debentures/Bonds ......................................................................................................................... 7.23 7.93Equity Shares .................................................................................................................................... 75.73 62.18Mutual Funds/Venture Capital Funds .................................................................................... 10.15 24.96Preference Shares ........................................................................................................................... 6.89 4.93
100.00 100.00

47
C M Y K
*in favour of
* against
TATA INVESTMENT CORPORATION LIMITEDRegd. Office : Elphinstone Building, 10, Veer Nariman Road, Mumbai - 400 001.
Attendance Slip
I hereby record my presence at the SEVENTY-FOURTH ANNUAL GENERAL MEETING of the Company atWalchand Hirachand Hall, IMC Building, Churchgate, Mumbai - 400020 at 3.30 p.m. on Friday, 8th July, 2011.
SIGNATURE OF THE ATTENDING MEMBER/PROXY
NOTES : 1. Shareholder/Proxyholder wishing to attend the meeting must bring this Attendance Slip to the meetingand hand it over at the entrance duly signed.
2. Shareholder/Proxyholder desiring to attend the meeting should bring his copy of the Annual Report forreference at the meeting.
TATA INVESTMENT CORPORATION LIMITEDRegd. Office : Elphinstone Building, 10, Veer Nariman Road, Mumbai - 400 001.
ProxyI/We .......................................................................................................................................................................................................................
of ............................................................................................. in the district of ................................................................................ ......
being a Member/Members of the above named Company, hereby appoint ...........................................................................
.................................................... of in the district of .................................................................................................... or failing him
.................................................... of ............................................................................................................................... in the district of
................................................................................................ as my/our Proxy to attend and vote for me/us and on my/our
behalf at the Seventy-Fourth Annual General Meeting of the Company, to be held on Friday, 8th July, 2011
and at any adjournment thereof.
Signed this ................................... day of ................................................ 2011.
Folio No. : ............................................# DP ID No. ...................................................... #Client ID NO. .....................................................
No. of Shares : ...............................................
This form is to be used the resolution. Unless otherwise instructed, the
Proxy will act as he thinks fit.
*Strike out whichever is not desired.
#Applicable for shares held in electronic form.
NOTE : The Proxy must be returned so as to reach the Registered Office of the Company at ElphinstoneBuilding, 10, Veer Nariman Road, Mumbai 400 001, not less than FORTY-EIGHT HOURS before thetime for holding the aforesaid meeting.
✁
Signature
RupeeOne
revenuestamp
