tax coordination, tax competition, and revenue mobilization - imf
TRANSCRIPT

Tax Coordination, Tax Competition, and Revenue Mobilization in the West African
Economic and Monetary Union
Mario Mansour and Grégoire Rota-Graziosi
WP/13/163

© 2013 International Monetary Fund WP/13/163
IMF Working Paper
Fiscal Affairs Department
Tax Coordination, Tax Competition, and Revenue Mobilization in the West African Economic and Monetary Union
Prepared by Mario Mansour and Grégoire-Rota Graziosi*
Authorized for distribution by Victoria Perry
July 2013
Abstract
We review the current state of the West African Economic and Monetary Union’s tax coordination framework, against the main objectives of the WAEMU Treaty of 1994: reduce distortions to intra-community trade, and mobilize domestic tax revenue. The process of tax coordination in WAEMU is one of the most advanced in the world—de jure at least—, but remains in many areas ineffective de facto. Nevertheless, the framework has, to some extent, succeeded in converging tax systems, particularly statutory tax rates, and may have contributed to improving revenue mobilisation. Important lessons can be drawn from the WAEMU experience, particularly in terms of whether coordination should take the form of harmonization through a top-down approach, or a softer approach of sharing best practice and limiting certain types of tax competition.
JEL Classification Numbers: O1; H2; H7.
Keywords: tax coordination; tax harmonization; tax competition.
Author’s E-Mail Address: [email protected]; [email protected]
* Both authors are with the Fiscal Affairs Department, International Monetary Fund. We thank Michael Keen for guidance, and Emilie Caldeira for suggesting and undertaking the econometric analysis for the Chow test in Section V. We also acknowledge helpful comments from our colleagues in the IMF African Department. Views and errors are our own, and should not be attributed to the IMF, its executive board, or its management.
This Working Paper should not be reported as representing the views of the IMF. The views expressed in this Working Paper are those of the author(s) and do not necessarily represent those of the IMF or IMF policy. Working Papers describe research in progress by the author(s) and are published to elicit comments and to further debate.

2
Contents Page
Abstract ......................................................................................................................................2
I. Introduction ............................................................................................................................3
II. Evolution of the Tax Coordination Framework ....................................................................4
III. Application of the Framework in Member States ..............................................................21
IV. Special Tax Regimes: The Achilles’ Heel of Tax Coordination .......................................26
V. Experience with Revenue Mobilization ..............................................................................30
VI. Lessons learned and Concluding Remarks ........................................................................36 Tables 1. Rates under the WAEMU Directive on Excise Taxes .........................................................13 2. WAEMU Directive on Taxation of Investment Income ......................................................18 3. Main Features of WAEMU Multilateral Tax Treaty ...........................................................20 4. Excise Tax Rates in Six WAEMU States ............................................................................23 5. Tax Rates on Profits and Minimum Taxes in WAEMU States; 2011 .................................25 6. Summary of Tax Incentives Provided by WAEMU States’ Investment Codes ..................29 Figures 1. WAEMU Trade in Goods; 1990, 2000, and 2010 .................................................................9 2. Structure of Tax Revenues in WAEMU; 1980–2010 ..........................................................31 3. Corporate Tax Rates and Revenue in WAEMU; 1980–2010 ..............................................32 4. Structure of Tax Revenues in WAEMU States; 1980–2010 ...............................................34 5. Change in Tax Revenues in Selected SSA Groups; 2000 and 2010 ....................................35 Boxes 1. Tax Coordination, Tax Cooperation, and Tax Harmonization ..............................................7 Appendixes I. Tax Revenues in Selected SSA Groups; 2000 and 2010 ......................................................38 References ................................................................................................................................39

3
I. INTRODUCTION
The West African Economic and Monetary Union (WAEMU) is one of few regions in the developing world where member countries share a single currency (the CFA Franc, Franc de la Communauté Financière Africaine), form a customs union, and have had over a decade of tax coordination/harmonization experience in domestic taxation.2 Today, over 80 percent of member countries’ tax (including tariff) revenues are derived from taxes that are subject to regional directives or regulations.3 This economic integration was in no small part due to the fiscal problems of the late 1980s and early 1990s, and the subsequent devaluation of the CFA Franc in 1994.4 Following this devaluation, member states signed the WAEMU Treaty on January 10, 1994 in Dakar; by August 1 of that year, they had all ratified it. The formation of the customs union with a common external tariff (CET) was completed by 2000; directives on value-added tax (VAT) and excises were introduced in 1998; and, by 2009, the region completed a set of directives in relation to capital income taxation.5 The study of the tax coordination/harmonization framework of the WAEMU should therefore be of interest to policymakers in other regions in Sub-Saharan Africa (SSA)—e.g., the Economic Community of West African States (ECOWAS) and the East African Community (EAC)—and elsewhere around the world. Our main objective in this paper is to: describe tax coordination de jure through a critical analysis of WAEMU’s legal texts (directives and regulations), appreciate its implementation in member states, and assess its effectiveness by studying the evolution of member states’ revenue performance. Section II presents the general coordination framework whose approach was broadly based on the European Union (EU) model of coordination, but differs from it in many regards, including the limited powers and resources of regional institutions. Section III provides a broad overview of the main areas of divergence between national tax laws and the various regional directives and regulations. In recent years, tensions between the directives and their
2 By way of example and for a comparison with the level of coordination in other regions, see Cnossen (2011) on the Southern African Development Community and Cnossen (2013) on the Association of South East Asian Nations. Both of these regions are much less advanced in their integration process than WAEMU.
3 The original member countries were Benin, Burkina Faso, Côte d’Ivoire, Mali, Niger, Senegal, and Togo. Guinea-Bissau became the 8th member of the Union on May 2, 1997. The Central African Economic and Monetary Union is another region similar to WAEMU, but with less experience in domestic tax coordination.
4 For an account of the devaluation and its implications for fiscal policy harmonization in the region, see Rosenberg (1995), and Clément et. al (1996).
5 The WAEMU Treaty defines four types of regional acts (Article 43): a “directive” is binding but gives some flexibility to member states in the design of their national laws (e.g., VAT directive); a “regulation” is binding and must be enacted as is by member states (e.g., Mining Code); a “decision” is legally binding in relation to a specific issue, and not necessarily on all member states; “recommendations” and “opinions” are not binding.

4
application by member states have increased due to the use of taxation to cushion the impact of rising commodity prices, particularly food and energy. This leads into Section IV, which describes how special tax regimes, in particular investment codes (ICs), weaken tax coordination. Given the emphasis of the WAEMU Treaty on revenue mobilization and convergence of fiscal outcomes, Section V looks at the evolution of revenue levels and structures. This is done through a unique tax revenue database for SSA countries, which is an extension and update of Keen and Mansour (2010a). Section VI concludes with some lessons from the WAEMU experience in tax coordination.
II. EVOLUTION OF THE TAX COORDINATION FRAMEWORK
The EU is seen in many parts of the world as the benchmark for economic integration, and consequently as an example of tax coordination among sovereign states. The WAEMU has borrowed significantly from the EU in many areas, including general principles of policy making,6 macroeconomic convergence, and more specifically tax coordination and harmonization. For example, like the EU Treaty, the WAEMU Convergence Pact7 prescribes limits to main macro-fiscal aggregates: primary budget balances should not exceed zero percent of GDP; debt-to-GDP ratios should not exceed 70 percent; and inflation should not exceed 3 percent.8 In tax policy, however, the WAEMU Treaty goes farther than the EU; in addition to coordinating the setting of tax rates and bases for the major taxes through regional directives, it mandates the convergence of the tax revenue-to-GDP ratio to at least 17 percent, and the convergence of tax revenue structures.9 The latter is part of the so-called “transition fiscale” (tax transition), under which WAEMU countries must adopt tax and tariff policies that, over time, enable them to shift their revenue structure from trade to domestic taxes. However, the WAEMU differs from the EU in several ways. As a result of history, the WAEMU was already a monetary union before becoming a customs union and establishing a single market. This characteristic, shared with the CEMAC, is unusual with respect to the classical view of the economic integration process (Balassa, 1961).10
6 As in the EU, the WAEMU Commission draft directives and regulations, that are agreed by the Council of Ministers and then put into practice in national legislations.
7 Additional Act No. 4/99 and subsequent changes.
8 Like in the EU, inflation is measured as changes in the Consumer Price Index (CPI). The Treaty on the Functioning of the EU requires that inflation in a member state should not be higher than 1.5 points that in the three best performing states.
9 The EU convergence criteria are often defined in terms of tax policy design (e.g., minimum excise tax rates), and not in terms of revenue results.
10 According to this view, the sequence of the integration process is as follows: (1) a preferential trade area (reduced customs tariffs between countries); (2) a free trade area; (3) a customs union (a common external
(continued…)

5
Beyond the sequencing in the integration process, there are other significant differences between the EU and the WAEMU, most notably in relation to the role and financing sources of regional institutions, which have a non-negligible impact on the functioning of tax coordination. Like in the EU, the WAEMU Treaty (Articles 54 and 55) had envisaged that the Commission and other organs of the Union would be financed by a share of the CET, and a levy on a harmonized VAT base—the idea, among other things, is to facilitate the application of the CET and the removal of fiscal borders within the union by blunting the impact of CET revenue on national budgets. Unlike the EU,11 however, laws to put this in practice have never been agreed by member states. Instead, the Union’s major own source of financing is limited to the Prélèvement Communautaire de Solidarité (PCS), a tariff levied at a rate of one percent on imports, which applies in addition to the CET. Between 1996 and 2010, this source financed primarily a compensation scheme for member states for the tariff revenue loss resulting from the formation of the customs union, and the Union’s operational budget; the other uses, which were directed to the agricultural sector and regional integration initiatives, amounted to about 25 percent of the PCS. For the rest of its activities, the WAEMU still relies on grants and loans from international and regional organizations (38 percent of its 2010 budget). Finally, it is worth noting that in relation to GDP, the WAEMU total budget is less than half the EU (0.47 vs. 1.1 percent of GDP), which does not allow it to play a significant role in the development of the region. The evolution of the legal framework for tax coordination in the WAEMU has reflected a clear objective of ensuring that national policies (particularly trade and tax policies) do not distort the functioning of the internal market, and a number of broad and potentially conflicting objectives of harmonizing tax legislations and converging fiscal outcomes (levels and structures of tax revenues). These objectives are covered by Article 4 of the WAEMU Treaty.12 From a tax coordination perspective, paragraph e) of Article 4 is perhaps the
tariffs and a common trade policy); (4) a common market (common product regulations and free movement of goods, capital, labor and services); (5) economic and monetary union (a single market with a single currency and monetary policy); and (6) a complete economic integration (harmonized economic and fiscal policies).
11 The main components of EU own sources of finance include: 75 percent of the tariff on imports from non-EU states, with member states retaining 25 percent as collection costs (10 percent before 2001); a levy on a common VAT base (the base is capped at 50 percent of Gross National Income (GNI) to cushion the impact on countries whose final consumption accounts for a large share of GNI); and a levy on GNI of EU states to pay for budget gaps after revenues from other sources.
12 The 1994 Treaty was modified in January 2003. The modifications clarified a number of areas, in particular: the roles and responsibilities of the institutions of the Union (the Commission; the Court of Justice and the Court of Audit; the meetings of Heads of States and the Council of Ministers); the financing of the Union; the free mobility of individuals and moral persons across the members of the Union; and the participation of other African member states to the activities of the Union. These modifications do not directly affect the objectives of the Union, as stated in Article 4 of the 1994 Treaty. In this paper, references to the WAEMU Treaty, unless otherwise specified, are to the modified Treaty of 2003.

6
clearest, and most relevant. It calls for the harmonization of member states’ tax legislation to the extent that it is necessary for the good functioning of the common market.13 The use of the word “harmonization” conveys the idea that tax rates and bases should be equalized. Although this may have been the intention of policymakers in the early years of the WAEMU Treaty, the current framework is a mix primarily one of partial harmonization and coordination. In recent years, member countries have pushed for more flexibility in setting their tax bases and rates, especially in the area of indirect taxation. Box 1 summarizes the meaning of the terms “coordination”, “cooperation”, and “harmonization” in the theoretical literature, which are not always consistent with their use in practice. The other paragraphs of Article 4 allow for various, and possibly conflicting, interpretations of the role of tax coordination. For example, Paragraph A states that one objective of the Treaty is to reinforce the economic competitiveness of member countries, but does not clarify whether this objective is to make the region competitive vis-à-vis the rest of the world (ROW), or to give individual countries latitude in providing their own tax incentives—which implies some degree of competition among them as well as with the ROW. The former case is compatible with coordinating the taxation of capital within the region; the second may not be. This lack of clarity is probably the main reason behind the failure to harmonize investment codes (ICs); member states tend to see the competition game as one played as much among them as with the ROW.14 An initiative to agree on a regional IC has been ongoing for over a decade, but has not yielded any tangible results. As will be explained later, the tax content of ICs in WAEMU greatly weakens the coordination of capital income taxation. Another example is Paragraph D, which calls for the implementation of common policies in a number of economic sectors, including mining, even though there is little trade among member countries in minerals. Paragraph d) is partly at the origin of the 2001 regional mining regulation, which contains tax provisions for mining activities (e.g., tax holidays, and minimum free equity participation of the state). After the formation of the customs union and the adoption of the CET in the late 1990s, one would have expected coordination of capital income taxes to take priority, since capital tax competition in a customs union with fiscal borders is arguably more mutually damaging than commodity tax competition. But this was not the case. It took a decade after the introduction of the VAT and excise tax directives in the late 1990s to partially harmonize the corporate tax base and introduce a range of tax rates; moreover, the provision of tax incentives through ICs and other sectoral codes has yet to be resolved. This sequencing of tax coordination in the WAEMU, which seems to have copied the EU approach even though it proved to be
13 Again, this seems to be broader in its implications for tax coordination than the narrower Article 113 of the Treaty on the Functioning of the EU.
14 National investment codes are the most common tool of providing tax incentives in Sub-Saharan Africa. Their use has significantly increased since the early 1980s (see Keen and Mansour, 2010b).
7
ineffective, raises a number of difficult political economy issues, including the lack of commitment on behalf of member states to coordinate their tax policies effectively.
Box 1. Tax Coordination, Tax Cooperation, and Tax Harmonization Tax competition is presented in the academic literature as a game between two (or more) countries that choose simultaneously and non-cooperatively their tax policy, usually their tax rate, on an internationally mobile tax base, usually capital. This mobility induces some international spillovers in the design of national tax policy. The pioneer works on tax competition are Zodrow and Mieszkowski (1986), Wilson (1986), Wildasin (1988), and Kanbur and Keen (1993).
Tax competition models usually share two crucial properties: positive spillovers, which is equivalent to plain complementarity (Eaton, 2004), and strategic complementarity of tax rates (Bulow, Geanakloplos and Klemperer, 1985).
Plain complementarity: An increase in the corporate tax rate of one country causes a flow of capital to other countries, thus increasing their tax base and revenue, and consequently their welfare. Plain complementarity results from the tax base effect; other effects, including non-tax, may compensate or cancel it.
Strategic complementarity: An increase in the corporate tax rate of one country induces the other countries to increase their tax rates.
Games with strategic complementarity may display multiple equilibriums, thus raising a coordination problem. Coordination refers to the rule or set of rules that will move countries to a Pareto dominant equilibrium (if it exists). By contrast, games with strategic substitutes are often associated with a suboptimal equilibrium, as in the prisoner’s dilemma: the unique Nash equilibrium is dominated by an outcome which is not an equilibrium; reaching that outcome is solving a cooperation problem.
We use the term tax coordination when the set of countries which may coordinate is given, and tax cooperation when this set is endogenously determined—e.g., extending WAEMU coordination to ECOWAS. Partial tax coordination therefore means that the coordination concerns only some tax policy instruments, while partial tax cooperation designates situations where only some countries cooperate.
The term harmonization is not well established in game theory since its aim is to eliminate interactions between countries. Its origin in tax competition may be traced to international trade theory, where customs unions set up a common external tariff applied to import values measured using common rules. Three elements describe tax harmonization: an equalization of tax rates, a common definition of national tax bases, and a uniform application of agreed rules. The latter is particularly important since tax competition can take the form of lax application of tax rules, such as low audit rates (see, for instance, Cremer and Gahvari, 2000).
In order to better appreciate the intricacies of the tax coordination framework, we now turn to a descriptive analysis of its various parts, separating them in two sections: coordination of tariffs and indirect taxes (namely the VAT and excises), and coordination of direct taxes (capital income taxation, which includes the taxation of business profits, portfolio income, and the multilateral tax treaty (MTT)).

8
Coordination of tariffs and indirect taxes Customs tariffs In 1996, member states put in place a transitional trade regime for most intra-community trade in anticipation of agreement on a CET.15 The regime lifted quantitative restrictions (on extra- and intra-regional trade), instituted common rules of origin, and reduced both internal and external tariffs significantly. In 1997, a CET with four rates was agreed:16 0 percent on essential or so-called “social goods”, 5 percent on primary goods, 10 percent on capital and intermediate goods, and 20 percent on final consumption goods.17 The top rate became effective January 1, 2000—it was set at 30 percent during July 1 to December 31, 1998, and 25 percent during 1999. A 10-digit tariff classification was drafted in 1998, 18 based on the ECOWAS classification; it was later changed to the 2002 Harmonized System (HS) classification of the World Customs Organization (WCO) in 2002, and to the 2007 HS classification in 2008. Shortly after the HS classification was agreed, the Council of Ministers issued regulations detailing the procedure and conditions by which member states can request derogations from the application of the CET—i.e., safeguard measures.19 Requests for such measures must be made by a member state to the Commission, and justified on the basis of dire difficulties that the member state faces or could face in one or more economic sectors as a result of the application of the CET. After study of the request, the Commission gives an opinion within 30 days, valid originally for six months, and renewable.20 Even though the Council of Ministers can dispute the decision of the Commission, Regulation 14/1998 gave, for the first time since the WAEMU Treaty was signed in 1994, operational authority to the Commission by asking for its technical opinion on requests for safeguard measures. This was further enhanced with regulation 04/1999/CM/UEMOA, which gave the Commission authority to establish “reference values” for imports—
15 Act 04/1996.
16 Regulation 02/1997/CM/UEMOA.
17 This is according to the broad economic classification of the tariff; the classification at the HS 10-digit level is less clear cut.
18 Regulation 05/1998/CM/UEMOA.
19 Regulation 14/1998/CM/UEMOA, which applies Article 86 of the WAEMU treaty on safeguard measures.
20 Regulation 14/1998 does not specify whether the request for extension is time bound; in principle, safeguard measures should be time bound under WTO rules.

9
i.e., minimum values specified for a list of goods where the Commission, after consulting with member states, had reasons to believe that importers aggressively underreport values. The speed with which the customs union and the CET were formed is remarkable, and can be partly explained by the fact that the monetary union already existed. However, in terms of impact on intra-community trade, progress is hard to detect, and is certainly far less than policymakers had expected. The share of intra-community trade (relative to total WAEMU trade) has not increased since the early 1990s (Figure 1), but trade patterns have changed. In particular, exports of Senegal and Togo to the rest of the community have increased, at the expense of those of Côte d’Ivoire, as have imports from the rest of the community to Burkina Faso and Guinea-Bissau. Egoume and Nayo (2011) attribute these shifts in trade patterns largely to two factors: the relative size of Côte d’Ivoire and the high intra-WAEMU transportation costs relative to international costs. These two factors tended to reinforce one another during the Ivoirian crisis.
Figure 1. WAEMU Trade in Goods; 1990, 2000, and 2010
Source: Direction of Trade Statistics, IMF.
Total trade in relation to GDP has however increased significantly, from less than 4 percent in 1990 to 6 percent in 2010. Most of this increase took place before the customs union was completed in 2000, and can be attributed to the devaluation of the CFA franc.
0
2
4
6
8
10
12
Intra-WAEMU Trade (% of total trade) Total Trade (% of GDP)
1990 2000 2010

10
But some problems of the customs union are much deeper, and relate to trade policy and its implementation, rather than to exogenous factors. Physical borders and control of intra-community trade remain to a large extent as they were before the establishment of the CET.21 More importantly, tariff revenue, unlike in the EU, accrues to the country of final destination, which remains ultimately responsible for collecting its own revenue from the application of the CET. This provides opportunities for member states to protect their markets and for customs officials to seek rent through the enforcement of the CET.22 For example, Goretti and Weisfeld (2008) cite administrative delays, roadblocks, and racketeering—most of which is arguably illegal. Coupled with poor transportation and other trade support services, which quality and cost may vary significantly across member states, these factors have undermined progress in increasing intra-community trade, but, perhaps not surprisingly, seem to have had little impact on trade with the ROW.23 Value-added tax The VAT directive was introduced in 1998. Its main purpose was to (1) harmonize the rules relating to the base and constrain the rates to an interval, (2) regulate the treatment of intra-WAEMU trade when fiscal borders are abolished, and (3) provide a source of financing to the Union. Member states could not agree on 2 and 3 in 1998, and therefore postponed drafting of the necessary rules until fiscal borders were removed. One primary objective of the VAT directive was to assist countries in compensating the revenue loss induced by the reduction of tariff rates with a more efficient tax than cascading sales taxes—which pre-dated the VATs in several WAEMU countries. The experience of Benin, which after enacting a single-rate VAT with limited exemptions in 1991 saw its VAT revenue increase from less than 2 percent of GDP in 1990 to 5 percent in 1994,24 played an important role in the design of the 1998 directive. The directive’s main features are:
21 For a brief historical overview of the WAEMU CET and the problems related to its applications by member states, see Geourjon and Mansour (2013).
22 Despite a CET, customs have some discretion in the value assessment of imported goods. Several WAEMU countries have pre-shipment inspection programs, which consist in delegating part of the value assessment to a private firm. Often, these programs do not provide the right incentives for customs agencies to modernize (see Decquiet et al., 2012).
23 See also The Improved Road Transport Governance Initiative, which surveys the number of controls on six major corridors in the WAEMU (available at http://www.watradehub.com/competitive-environment/transport/new-road-governance-map-shows-measured-decline-key-indicators): Abidjan-Ouagadougou; Bamako-Abidjan; Bamako-Ouagadougou (via Hérémakono); Bamako-Ouagadougou (via Koury); Bamako- Dakar; Lomé-Ouagadougou. The 18th survey shows that on some corridors (especially from Senegal and Abidjan ports to Bamako and Ouagadougou, both inland cities) the number of controls frequently exceeds two per 100 Km, and is rarely below 1.5.
24 For a more detailed discussion of the history of VATs in some WAEMU states, see Ebrill et al. (2001), in particular chapters 5 and 7.
11
A registration threshold between CFAF 30 and 50 million for the supply of goods,
and 15 to 25 million for the supply of services.
A single positive tax rate that member states can set between 15 and 20 percent.
Common rules for the calculation of the tax base (i.e., taxable transactions).
A list of mandatory exemptions, including: health services and medications;25 education services, books, newspapers, magazines, and other periodicals; banking, insurance and re-insurance services if they are subject to a specific tax; social tranches for household consumption of water and electricity; raw (unaltered) foods; real estate (both residential and commercial) if it is subject to registration fees or other specific taxes; and residential rent.
Exports are also exempt from VAT; but VAT registrants can claim a credit/refund for VAT on inputs into exported supplies only where such supplies are taxable in the domestic market.26
Member states can tax agricultural supplies or treat them as out of scope of VAT.27
VAT on inputs is generally deductible from VAT on taxable outputs, except for: meals and entertainment expenses, motor vehicles (except for leasing companies) and fuel expenses. Importantly, member states can extend these exclusions to other inputs; the directive does not impose any limits on such exclusions.
Excess VAT credits are generally refundable, except for certain retail supplies (goods that are resold unaltered.)
The food and energy price crisis of 2006–08 lead to pressure to narrow the base of VAT to respond to social unrests in the region. In 2009, the WAEMU Council of Ministers approved directive 02/2009/CM/UEMOA, which accomplished this narrowing in three ways. First, the upper bound of the registration threshold was increased to CFAF 100 million for goods, and to 50 million for services. Second, a lower positive VAT rate—which countries can set
25 Exempt medications are listed in annex to directive 06/2002/CM/UEMOA; they include a broad category of prescription and non-prescription drugs, prosthetics, and medical and dentistry equipment.
26 This is different from zero-rating, where the VAT is neutral on the price of an exported supply irrespective of its domestic treatment.
27 This means that suppliers cannot register for VAT even if their turnover exceeds the registration threshold. And, in case of mixed supplies, they do not have to report agricultural supplies on their tax returns. Out of scope is similar to exemptions in terms of its impact on prices since input VAT is not deductible from output VAT.

12
between 5 and 10 percent—is now permitted for a limited list of items, which include: bottled and powder milk, sugar, all types of pasta, flour, rice, wheat, and other grains; chicks; agricultural equipment (including rental and maintenance services); food for livestock and poultry; computers; solar energy equipment; and tourism-related services, including restaurants. Third, natural gas for domestic use was added to the list of exempt items. Another change to the VAT directive was made in the directive on the taxation of portfolio income, introduced in 2010 (02/2010/CM/UEMOA). This directive deemed as exports all services related to financial markets in the WAEMU, including: financial advisory services; title issuance; funds transfers; and all accounting services related to such activities. With these changes, the VAT directive is today more distant from a modern VAT.28 Even before these changes, the narrow tax base in the directive, and the limitations it imposed on the deductibility and refundability of VAT on inputs arguably reduced potential efficiency gains.29 Despite the relatively good revenue performance of VATs in member states,30 their negative impact on investment is a recurrent complaint from investors. Indeed, it is precisely due to these limitations on deductibility/refundability that member states’ investment codes offer VAT tax holidays—under these holidays, the input of an investment project is often exempted from VAT, typically during the investment development phase and future significant expansions. Excise taxes The excise tax directive was also introduced in 1998.31 It mandated ad-valorem taxation of alcoholic beverages and tobacco products, and permitted the taxation of a list of other goods. Table 1 provides the list of excisable items along with minimum and maximum rates. Article 3 of the directive defines the scope and timing of taxation: excises should apply to imports and domestic production, at the time of the first sale or when goods are made available for consumption.
28 According to the term coined by Ebrill et. al (2000).
29 Efficiency and revenue productivity were major objectives of reforming indirect tax systems away from cascading sales taxes. See for example an account of experiences, including in some WAEMU members, provided in Chapter 6 of Ebrill et. al (2000). Chapter 18 of the same book had already predicted the efficiency consequences of widespread exemptions.
30 In 2010, VAT revenue productivity, the yield of one point of the VAT rate expressed in percentage of GDP, was 0.2 in Côte d’Ivoire, around 0.3 in Burkina Faso, Mali and Niger, 0.35 in Togo, and around 0.4 in Benin and Senegal. The low rate in Côte d’Ivoire is partly due to its high export share in GDP (oil, Cocoa and coffee).
31 Directive 03/1998/CM/UEMOA.

13
The directive is unclear about how exports should be treated: whether they are taxable, in which case the excise becomes a production tax; or whether they are free of the excise, in which case the excise acts as a destination-based consumption tax, much like the VAT. Three amendments were made to the directive in 2009:32 minimum and maximum rates on alcohol and tobacco were increased by 5 percentage points; five items were added to the optional list; and member states were limited to excise only six items from the optional list.
Table 1. Rates under the WAEMU Directive on Excise Taxes
Source: WAEMU directives 03/1998/CM/UEMOA and 03/2009/CM/UEMOA. 1/ Minimum and maximum were increased in 2009 from 10 to 15 and 45 to 50 respectively. 2/ Minimum and maximum were increased in 2009 from 10 to 15 and 40 to 45 respectively. 3/ In addition to the mandatory list. 4/ Item added to the optional excise list in 2009. 5/ Applies only to vehicles with engines exceeding certain capacity.
In addition to the standard revenue and externality policy concerns, some of the items on the optional list suggest that the excise tax framework serves a trade policy objective. These include: coffee, cola, wheat flour, oil and other edible fats, tea, marble, gold and precious metals. Given the production of these items by some WAEMU states, the excise could play the role of an export tax (coffee, cola, gold bullion, marble, which are mainly exported).33 Or,
32 Directive 03/2009/CM/UEMOA.
33 Recall that the directive does not mandate that excise taxes on exports be refunded.
Minimum Maximum
Mandatory taxation
Alcoholic beverages 1/ 15 50
Tobacco products 2/ 15 45
Non-alcoholic beverages (except water) 0 20
Optional taxation (countries can choose six items) 3/
Coffee 1 12
Cola 10 30
Wheat flour 1 5
Oil and other edible fats 1 15
Tea 1 12
Arms and ammunitions 15 40
Perfumes and other cosmetics 5 15
Plastic bags 4/ 5 10
Marble 4/ 5 10
Gold bullion 4/ 3 15
Precious stones 4/ 3 15
Passenger vehicles 4/, 5/ 5 10
(Percent)

14
it could favor consumption of local production over imports (flour, edible oils)—given that the excise is ad-valorem, its absolute value on domestically produced goods is lower than that on imported substitutes that command higher prices; moreover, imports bear a tariff which is included in the base for calculating the excise. The main argument in favor of coordinating the setting of excise taxes in a common market with fiscal borders is to minimize intra-community cross-border shopping. In the absence of fiscal borders (such as in the EU), the primary issue is legal cross-border shopping. In both cases, cross-border shopping and smuggling from countries outside of the community pose difficult policy and enforcement issues. In this regard, while there is a good case to coordinate excise tax setting in the WAEMU, its geography poses difficult challenges; the region is surrounded by large countries with very porous borders—neighboring Mauritania, Nigeria, and Ghana are particularly problematic—and, in some cases, applying relatively low excise taxes.34 This could explain why minimum rates in the WAEMU excise directive were set at a low level. The broad ranges of excise rates can also be seen as reflecting a lack of political commitment, and sheds some light on the political process of tax coordination. Petroleum products A separate directive issued in 2001 covers excises on petroleum products.35 It mandated a specific excise (per liter or kilo) but did not impose any constraint on the tax rate: it set the lower bound at zero percent, and imposed no upper bound. However, it prohibited subsidies (either directly or indirectly through differential taxation of petroleum products), and mandated that by the end of 2006 member states should impose the same tax rate on gasoline and diesel, and that the rate differential among other products should not exceed CFAF 100. In 2007, directive 01/2007/CM/UEMOA was introduced extending the deadline for implementing these rules to December 2008. The petroleum excise directive also prevents member states from imposing any other specific taxes on petroleum products—except for the tariff and the VAT. The petroleum excise directive did not address directly tax coordination issues, like those on alcohol and tobacco for example. Its main purpose was first and foremost the elimination of subsidies, which weighed heavily on member states’ fiscal performance, and the consolidation of a plethora of specific taxes—which were typically earmarked—into a single excise paid into the government’s general fund.
34 For example: in Nigeria, a country rich in natural resources, excise rates on alcoholic beverages and tobacco are 20 percent; until recently, Mauritania, which borders Senegal, did not impose any excises on tobacco products.
35 Directive 06/2001/CM/UEMOA.

15
Coordination of direct taxes The coordination of direct taxes can be usefully separated, for presentational purposes, in three parts: taxes on business profits of moral persons (which we refer to as the corporate income tax (CIT)); taxes on portfolio income (e.g., interest, dividends, and capital gains); and the multilateral tax treaty (MTT) for preventing double taxation among member states. There are of course linkages between these parts, which we will highlight whenever relevant from a tax coordination perspective. Corporate income tax The coordination of the CIT is one of the most interesting since, in some respect, the WAEMU went beyond the EU model. Two 2008 directives covers CIT coordination: directive 01/2008/CM/UEMOA defines a common corporate tax base;36 and directive 08/2008/CM/UEMOA specifies the range for a single rate—25 to 30 percent. The first directive defines a standard CIT base where all business expenses undertaken for the purpose of earning taxable profits are deductible; the following elements are worth noting: A number of expenses can be capped, including: overhead expenses, wage expenses,
royalties and technical services, taxes, and contributions to non-profit organizations. Financing costs are deductible to the extent that the interest rate does not exceed the Central Bank’s (BCEAO) interest rate plus three percentage points; there are no limits however on how much companies can borrow from related parties. The objective of caps is to deny unreasonable deductions; note, however, that the directive does not define or describe situations of this nature or the meaning of “unreasonable”.
A general transfer pricing rule states that pricing of intra-company goods and services where one party does not reside in the member state should be arm’s-length—otherwise, it is not entirely deductible; but it leaves it to member states to define how to put this in practice.
Penalties and fines of any nature are not deductible from the CIT base.
Loss carry forward is allowed for a minimum of three years.
36 Article 1 notes that the directive applies to “industrial and commercial” profits. In a classical schedular system, this generally excludes profits from professional and artisanal activities, even if the profit is earned by a corporation. But Article 3 clarifies that irrespective of the source or type of income, the directive concerns income taxes that a member state applies to the profit of a moral person. This suggests that the directive establishes a true CIT separate from other schedular taxes.

16
Depreciation is generally straight-line; declining-balance depreciation is allowed, with rates fixed as multiples of the straight-line rates. Accelerated depreciation (in the first year of use and subject to a maximum of twice the standard straight-line depreciation rate) is allowed only for new equipments used in the following sectors: manufacturing, maintenance services, hotels, transportation, telecommunication, and agriculture.
Specific provisions are allowed. Banks and other financial institutions can deduct their provisions for prudential purposes.37
Member states should exempt from the tax base the following income sources: capital gains on business assets if the taxpayer intends, within three years, to reinvest the total proceeds from selling the assets in a WAEMU member state; and inter-corporate dividends to the extent that the holding company has a controlling interest (defined as at least 10 percent of the shares) in the payer company, and that both companies are WAEMU residents—in all other cases, at least 40 percent of inter-corporate dividends should be taxable. A holding company regime was introduced in 2011 exempting from CIT the profits of such companies, their dividends distribution (from tax at the individual level), and capital gains realized on the sale of their shares.38 The regime is targeted to venture capital companies. Finally, a mining regulation was introduced in 2003. It provides that firms are subject to the general tax laws of member states, and to a royalty, whose base and rates will be determined later by application rules.39 The regulation also provided for stability of the tax regime—presumably, both for taxes imposed at the national level and the royalty that was to be fixed regionally—during the life of the investment; the stability is asymmetric, insuring against increases in taxes but allowing taxpayers to benefit from reductions. In terms of tax incentives, the regulation provided for the exemption of virtually all taxes and fees during the exploration phase. The main incentives provided during the production phase are accelerated depreciation, and a three-year tax holiday from profit and payroll taxes; the modalities for the coverage and calculation of accelerated depreciation have not been issued. The CIT directive provides flexibility for countries to compete through the statutory tax rate as well as the tax base. The most important elements of tax base competition include: flexibility in setting tax depreciation rules; and flexibility in designing transfer pricing and
37 This is the subject of a separate directive (05/2008/CM/UEMOA), which simply states that banks’ provisioning is to follow the BCEAO rules.
38 Directive 02/2011/CM/UEMOA. To qualify, a holding must hold at least 50 percent of its assets in shares of non-listed companies.
39 Since these application rules have not been issued, we will not discuss any further the mining regulation.

17
thin capitalization rules,40 which can be particularly important to foreign investors. But the most important source of tax competition among WAEMU countries remain the derogatory regimes provided in non-tax legislations, such as ICs, Free Zone Codes, and other sectoral codes, which are explicitly permitted under Article 8 of the CIT directive. There are two possible explanations why the directive allowed this: (1) politically, a weak directive may have been viewed as a better outcome than no directive at all; (2) since the coordination framework was to be extended to cover all sectoral laws, member states may have postponed the resolution of this issue. Although both explanations are possible, it seems unlikely today that member states will agree on a common framework for the provision of tax incentives in sectoral laws. Thus, the directive may have had the unintended effect of encouraging further the fragmentation of the tax policy framework by endorsing a long standing practice in member states.41 This, in turn, has repercussions for the effectiveness of tax administration, which in such cases has to be exercised by multiple government agencies. Portfolio income Directive 02/2010/CM/UEMOA specifies the types and tax rate intervals that member countries should apply to various portfolio incomes; Table 2 provides a summary. Income distributed by passive investment funds approved by the Conseil Régional de l’Epargne Publique et des Marchés Financiers (CREPMF) is exempt from tax.42 The directive also specifies that the tax is final when withheld at source in the state where the investment is made—the residence country cannot apply any residual taxation on such income. This is at odds, as we will see later in this section, with the MTT. The rate structure given in Table 2 is paradoxical. While one objective of the WAEMU Treaty, and the various directives, is to promote investment in the region, dividends are taxed at higher rates than interest, and interest income on corporate bonds is taxed at higher rates than interest income on government bonds.
40 The directive does not prescribe a specific thin capitalization rule. Arguably though, countries can enact such rules under the general restriction on deductible expenses.
41 Senegal, a country where this practice has flourished over the years, recently consolidated all tax incentives in the general tax code, except those contained in a 2007 law creating a special economic zone. The implications of this for the provision of tax preferences are, however, unclear: presumably, the general tax code has no more precedence over other codes than it did before this consolidation. The consolidation is, however, an innovation in the region, and it will be interesting to watch whether it will instill more discipline and transparency in the conduct of tax policy.
42 The CREPMF is a WAEMU body created in 1996 and tasked with regulating the issuance of public (listed or not) financial securities in the WAEMU.

18
Table 2. WAEMU Directive on Taxation of Investment Income
Source: Directive 02/2010/CM/UEMOA 1/ Some WAEMU countries still apply a schedular tax system whereby different types of income are subject individually to a schedular (single rate) tax, and globally (with other incomes) to a progressive tax.
Multilateral tax treaty The multilateral tax treaty (MTT) was adopted by regulation 08/2008/CM/UEMOA; application rules were issued in 2010 (005/COM/2010/UEMOA).43 It distributes the taxing rights of WAEMU states in respect of intra-community investment. The MTT covers taxes on income and inheritance, and registration fees and stamp duties, including those collected by the central governments on behalf of sub-central governments. Table 3 describes the main features of the MTT. The distribution of taxing rights under the MTT is generally as follow: Income from a business or a profession is taxed on a residence basis, except in the
case of a permanent establishment (PE) deriving business income in a member state, in which case the income is taxed only to the extent it is attributable to the PE. Capital gains realized from selling business property are considered business income.
43 A thorough discussion of the MTT and its application rules is outside the scope of this paper. We limit ourselves to issues of consistency with other directives, especially regarding the distribution of taxing rights among member states.
Rates (Percent) Notes
DividendsGeneral 10 to 15 Member states can opt to make this a final tax;
taxpayers do not have to add dividends to their income for purposes of the general income tax. 1/
Distributed by companies listed on a WAEMU stock exchange
2 to 7 Companies must be certified by the CREPMF. No consultation with national tax authorities is needed.
Interest
General 6
Maturity >= 5 years 0 to 6 If debt is used to invest in sectors key to economic development.
Government issued with maturity between 5 and 10 years
3 Government includes both central and local, and any government entity.
Government issued with maturity exceeding 10 years
0 Government includes both central and local, and any government entity.
Capital gains
On disposition of equity securities 0 to 7
On disposition of debt securities 0 to 5

19
Portfolio income (i.e., interest, dividends, royalties and capital gains from movable property) is taxed by both the residence and source states; the MTT limits the latter’s taxing rights by capping the withholding tax rate it can impose on income of non-residents (15 percent on interest and royalties; 10 percent on dividends), except for capital gains, which remains taxable at the schedular tax rate of the source country.
Non-recurrent taxes on real property (mainly registration fees and stamp duties) and
capital gains tax on real property are due in the state where the property is located. In the case of taxation by both residence and source states, the residence state should relieve the taxpayer from double taxation primarily by providing a tax credit for taxes paid to the source state; the tax credit should not exceed the residence country’s tax on the same income. The MTT also covers issues of information exchange and mutual assistance in tax collection; it has a non-discrimination clause, and provides for a dispute resolution mechanism. One of the main differences between the MTT and model tax conventions of the OECD and the UN is that it covers a number of non-recurrent taxes on immovable property. This is appropriate given the importance of these taxes in the region, but unlikely to have any meaningful impact since the MTT simply affirms current country practice, without any restrictions on tax rates or rules for the calculation of the tax base. The residence principle in the MTT is inconsistent with the directive on the taxation of portfolio income discussed earlier, which makes final withholding taxes on such income by the source country—i.e., the residence country cannot levy additional taxes. It is not clear which takes precedence, but the two have different consequences on tax interaction between member states. For example, the standard tax competition model suggests that under source-based taxation, tax competition for mobile capital will drive tax rates to zero—and portfolio income is by far the most mobile form of income. If the source principle were to hold, we can expect tax competition among member states to drive rates to the minimum allowed by the directive.

20
Table 3. Main Features of WAEMU Multilateral Tax Treaty
Source: Regulation 08/2008/CM/UEMOA.
Tax Type Definition of Tax Base Treatment under the Multilateral Tax Treaty
Tax on business income Profits defined by the residence state, or the source state in case of a permanent establishment, or other fixed place of business.
Taxation by the residence state; source state has the right to tax profits of a permanent establishment.
Tax on rental income from real (immobile) assets
Rent and similar payments defined by the source state (where the assets are located).
Taxation by the source state.
Tax on income from sea and air transporations
Profits from these activities as defined by the residence sate.
Taxabtion by the residence state (where the headquarters of the enterprise are located), or the state of effective place of management.
Tax on pension income Pension income defined by the residence state. Taxation by the residence state.
Tax on dividends, interest and royalties
Income defined in the MTT, and includes any income deemed as dividends by the state where the payer company resides.
Withholding tax by the source state (max of 10% on dividends and 15% on interest and royalties); residual taxation by the residence state of the beneficiary.
Capital gains on real (immobile) property
Capital gains on real property as defined by the source state (where property is located).
Taxation by the source state; residence state has the right to tax in certain situation, where income is passive.
Inheritence tax All types of inheritence at death, including business participation and assets, as defined by the state where such assets are located. Liabilites inherited are netted out.
Generally by the state where the assets or goods inherited are located.
Registration fees Defined by state where property is located or document is issued. Fees can be specific or ad-valorem (% of transaction value).
Taxation by state where real property is located. For all other legal documents, state where documents are presented to the authorities has a right to tax, with a credit for fees paid in the state where the document was issued.
Stamp duties Defined by state where transaction takes place. Taxed by state where transaction takes place.

21
III. APPLICATION OF THE FRAMEWORK IN MEMBER STATES
This section describes in broad terms how WAEMU member states follow (or not) the directives just discussed, and analyzes the implications for the effectiveness of tax coordination in the region.44 The purpose is not to present a comprehensive audit of the coherence of national tax laws with the directives. This is beyond the scope of this paper, and would be, in any case, a difficult undertaking given that several issues regarding the interpretation of the directives remain unresolved, either because their application rules have not been issued, or because the issues have not been brought before the regional Court of Justice—to our knowledge, the WAEMU Court of Justice has never heard a tax case. In general, member countries seem to follow the most visible parameters of the WAEMU directives: tax rates. Other aspects, however, are more difficult to apprehend; these include: rules regarding the calculation of certain tax bases; exemptions, especially from the VAT; and tax regimes in sectoral or special laws, such as investment codes and free zone laws. Indirect taxes The VAT WAEMU member states, except Guinea Bissau,45 introduced their VATs well before the 1998 directive: 1960 in Côte d’Ivoire, 1980 in Senegal, 1986 in Niger, 1991 in Benin and Mali, 1993 in Burkina Faso, and 1995 in Togo. Originally, some of these VATs had multiple rates, and some did not apply to all stages of the production-consumption chain. For example, in Côte d’Ivoire the VAT applied originally to goods only; services were brought into the base toward the end of the 1980s, and only partially. By the time the WAEMU directive had been introduced, all WAEMU VATs had moved closer to a modern VAT: a single positive rate (18 percent, except Côte d’Ivoire which experimented with 20 percent for a short period in the early 2000s); exemptions limited to a relatively short list of final consumption items and hard-to-tax transactions, such as financial intermediation; and a registration threshold between CFAF 15 and CFAF 50 million, with the former being rather low given the administrative capacities of most member states. In fact, the directive was drafted in such a way to allow member state’s VATs to fall within its parameters, including most of the exemptions. This situation, however, did not last too long. In the early and mid-2000s, a number of member states broadened their VAT exemptions in two ways: some consumption goods and
44 The WAEMU Commission does not undertake regular analytical work on member states’ tax practices. Its quarterly report on multilateral surveillance concerns primarily the analysis of macro-fiscal developments.
45 It is only recently that this country has started work on the design of a VAT.

22
services were added (e.g., public transport; partially processed food items, such as frozen meat, poultry and fish; certain energy products, such as gas; and computer equipment, including software and printing machines); and some states started exempting inputs used in the production of exempt goods (e.g., building equipment used in certain sectors, such as construction; various types of pesticides, insecticides and animal feeds used in farming).46 Moreover, some member states argued that lower positive rates should be allowed by the directive in order to compete with North African countries in the tourism sector, and to alleviate the impact of the VAT on the price of certain processed food items which are basic necessities for low-income households (e.g., powder milk). The changes to the 1998 VAT directive in 2009 were largely a response to these concerns. As we will explore in more detail in this section, this “accommodating behavior” is symptomatic of tax coordination in the WAEMU in general, and is not limited to the VAT case. Member states have not yet moved to align their VATs with the 2009 directive. For example, some still exempt certain items (not mandated by the directive) instead of applying the new lower VAT rate allowed for a limited list; and many exempt certain intermediate and capital inputs used in the production of exempt supplies to mimic a lower VAT rate. It is difficult to estimate the impact of these changes on VAT revenue; member states do not usually undertake a thorough evaluation of the revenue loss attributed to policy changes, and micro-data is scarce or inexistent.47 Although it is somewhat reassuring that between 2005 and 2010 the average VAT revenue-to-GDP varied within a narrow range—5.5 to 6 percent—the narrowing of the tax base casts some doubts, at least in the medium term, on whether the VATs in WAEMU can be a source of additional revenue mobilization. Excise taxes Generally, member countries observe the rates imposed by the directive as well as the list of items excised. This is no surprise since the excise directive poses virtually no constraints on tax rates (minimum rates are very low or zero, as is the case of petroleum products), and the extension of the list of excisable items in 2009 brought some countries back into conformity with the directive. Table 4 shows the rates that currently apply on tobacco, and alcoholic and non-alcoholic drinks. In addition to these, most countries apply excises on a number of other
46 The WAEMU experience in this regard, especially in the agriculture sector, is an example of the so-called exemption-creep phenomenon whereby an exempt good (or service) brings about pressures from lobbyists to exempt the inputs used to produce it, yielding, in fine, a zero tax rate on the good.
47 There is a growing concern among policy advisors to developing countries, including the IMF, that these capacity limitations in the analytical aspects relating to the conduct of tax policy frequently lead to poor policy outcomes.

23
items allowed under the directive. The available information we have (not reported here) shows that rates are generally near the minimum mandated by the directive, suggesting that the consequences to either revenue or distortions to the common market are minimal. There are, however, a few exceptions, including cars and gold bullions; both are important in terms of values and hence would be expected to contribute significantly to revenue. There are two main practices at the country level that diverge from the directive: (1) additional excise taxes on the same list of items allowed by the directive; (2) and rules for calculating the excise tax base. An example of the first is the application by Senegal of additional specific excises on tobacco, which may also increase the overall excise rate (ad-valorem plus specific) above the maximum allowed by the directive.48 However, the most common form of additional excises is earmarked taxes on petroleum products; almost all countries have them, although they tend to be imposed at very low rates.
Table 4. Excise Tax Rates in Six WAEMU States
Sources: Tax laws of member states. 1/ Multiple rates apply according to alcohol content; the higher the content, the higher the rate. 2/ Multiple rates apply according to price categories, with lowest rate imposed on cheap cigarettes. 3/ An additional tax of 2.5 to 10 percent applies according to the price category. 4/ Rates are respectively for fruit juices and mineral water. 5/ Additional specific taxes apply.
The second practice is more common, and is often used to provide through the excise an additional layer of protection to domestic production, over and above the CET. In principle, the directive mandates valuation of goods for purposes of the excise at the CIF (cost,
48 Although this may be viewed as an indication that the maximum rate allowed is low; in reality, it amounts to increasing the effective protection provided to low-price cigarettes produced in Senegal.
Non-alcoholic Beverages
Tobacco 2/
Beer Other 1/
Benin 5 15 35, 40 40Burkina Faso 10 25 27.5 22Côte d'Ivoire 12 13 25, 30, 35, 45 23, 33, 35 3/Mali 10 45 45 15, 20, 25Niger 12, 15 4/ 25 45 40Senegal 2.75 40 5/ 40 5/ 20, 45Togo 2 15 35 40
WAEMU Directive
Min 0 15 15 15Max 20 50 50 45
Alcoholic Beverages

24
insurance and freight) value for imports, and at the ex-factory price for domestic production—including the tariff and other indirect levies, but excluding the VAT. Rules for calculating the CIF value are the same as those for purposes of the CET, and so in principle are harmonized.49 However, the excise directive does not define the “ex-factory” price in the case of domestic production; it does not specify, for example, that the price should be arm’s length. Both taxpayers and countries can use this to lower the effective excise tax rate on items that are mandatory to excise and subject to a positive minimum rate—primarily tobacco and alcoholic beverages.50 For taxpayers, the benefit is obvious: paying less tax. For governments, the benefit resides mainly in the ability to tax compete beyond what is allowed by the directive using the base rather than the rate. For example, Côte d’Ivoire defines the ex-factory price as the cost of production, excluding the manufacturing margin. Direct taxes The corporate income tax The common accounting heritage of WAEMU states explains much of the convergence of their national tax laws in relation to the determination of taxable profits. Directive 01/2008/CM/UEMOA, defining the base of the CIT, endorses this heritage while recognizing the need to modernize the CIT by taxing all incomes earned by corporations at a single rate. But since most WAEMU states still rely on schedular income taxes, corporations can deduct from their business profits rental and portfolio incomes that are taxed at their respective schedules—e.g., Mali and Côte d’Ivoire. These countries are therefore not consistent with directive 01/2008/CM/UEMOA. Burkina Faso and Senegal are notable exceptions; they introduced in 2010 and 2012, respectively, a CIT applicable to all corporate income, irrespective of its type. All member states have reduced their rates on corporate profits to the 25–30 percent interval allowed under directive 08/2008/CM/UEMOA (Table 5). Countries that have a schedular tax apply the new rate only to commercial and industrial profits, but not to other incomes earned by corporations. There are other sources of divergence between state’s laws and the CIT directives. For example, in some countries, the tax rate varies according to economic activity: Niger and Benin apply 40 and 45 percent respectively on corporate profits from upstream petroleum
49 Even though, some countries alter the CIF value through administrative practices. For example, Côte d’Ivoire adds 25 percent to the CIF value of tobacco products for purposes of computing the excise tax liability.
50 For example, in countries that produce low-price tobacco (e.g., Senegal) and beer (e.g., Côte d’Ivoire), and tax them at the mandated minimum excise rates, this can be used to reduce the effective rate below the minimum.

25
activities; Guinea-Bissau taxes domestic sales of minerals at a lower rate than exports. Also, all countries have a minimum tax that is typically proportional to turnover, and subject to a minimum fixed amount (Table 5). This tax, which is not envisaged in the directive (and hence arguably illegal when applied to corporations) represents in some cases a non-negligible part of CIT revenue, and could be very distortionary. Portfolio income The directive on portfolio income, like that on excises, seems to have been written to enclose most current practices in member states. It therefore reflects the diverse treatment of portfolio income within and across countries. This diversity is mostly present in the treatment of interest income, where rates vary according to the issuer (government vs. private entities), and maturity (short vs. long-term). For example, in Senegal, rates vary between 6 and 20 percent.
Table 5. Tax Rates on Profits and Minimum Taxes in WAEMU States; 2011
Sources: Tax laws of member states. Note: TO: turnover; K: thousands; M: millions; B: billions. 1/ The minimum is 2 percent for persons subject to the simplified profit tax, and 5% for non-commercial profits. 2/ Senegal increased its rate to 30 percent in January 2013.
By trying to accommodate country practices, the directive raises a number of issues, not least is the potential to worsen distortions to capital income taxation rather than reduce them, and weaken revenue mobilization rather than strengthen it.51 The main reason for this is that the
51 Taxes on portfolio income rarely account for more than 3 percent of total tax revenue in WAEMU states.
Individual Corporate
Benin 25 30 0.75% of TO or CFAF 200 KIndustry 25
Upstream petroleum 35 to 45
Burkina Faso 27.5 27.5 0.5% of TO or CFAF 500 K
Côte d'Ivoire 1/ 20 25 0.5% of TO
Banks and insurance 0.15% of TO; max of CFAF 60 M
Energy, water, upstream petroleum 0.1% of TO
Guinea Bissau 25 25 0.5% of TO
Minerals, domestic sales 22
Minerals, exports 30 to 45
Mali 30 30 0.75% of TO or CFA 610.8 K
Niger 30 30 0.1% of TO
Senegal 2/ 25 25 CFAF 0.5 M if TO<CFA 250 M CFAF 0.75 M if 250 M<TO<500 MCFAF 1 M if TO>500 M
Togo 30
Industry 27
Tax rate (%)Minimum tax
CFAF 50 K if TO<5 M … CFAF 200 M if TO>30 B

26
rate gap in the taxation of various capital income sources will increase for some countries. For example, Benin, which imposes a 3 percent tax rate on all government bonds, is now in violation of the directive which calls for a rate differential of 3 percentage points according to whether the bond has a maturity between five and 10 years (in which case the tax rate is 3 percent), or a maturity exceeding 10 years (in which case the tax rate is 0 percent). Similarly, Senegal imposes at 6 percent to all bonds with maturity of five years or more.
IV. SPECIAL TAX REGIMES: THE ACHILLES’ HEEL OF TAX COORDINATION
This section describes how non-tax laws, primarily investment codes (ICs), are used in WAEMU states to circumvent the constraints imposed by regional tax directives. This behavior is sometimes allowed by the same directives that are supposed to harmonize or coordinate national tax policies. Special tax regimes raise the issue of credibility of tax coordination and the role of regional institutions, in particular the WAEMU Commission and the Court of Justice. There are no directives or regulations at the regional level dealing with the provision of special tax regimes in member states. 52 Generally, each directive provides for exemptions or rate reductions that are either compulsory or optional. An example is the VAT directive, under which member states must exempt a list of items from their VATs, and may apply a reduced rate between 5 and 10 percent on a limited list of items. Another example is the directive on portfolio income, under which member countries must exempt or apply a reduced rate on income from certain holdings. Yet another example is the list of exemptions from the CIT defined in Article 9 of the CIT base directive (01/2008/CM/UEMOA). These incentives can provide a tax advantage to WAEMU states relative to the ROW, but they do not provide any advantage to one member state relative to another. One exception is Article 8 of the directive defining the CIT base. Simply put, it states that countries cannot provide tax reductions other than those in Article 9 of the directive, except those provided in ICs or other particular laws, such as mining and petroleum laws. In other words, Article 8 seems to endorse the special tax regimes provided under ICs and other particular laws that were present when the CIT base directive was introduced. Since it does not state that any future changes to these laws would be consistent with the directive, it may have been written with the purpose of a compromise: including then existing country CIT incentives, but disallowing any future changes. However, Article 8 is clear that the tax reductions that it refers to are those related to the CIT only.
52 Interestingly though, the WAEMU Commission issued a directive on free zones in 2008 (Directive 14/2008/CM/UEMOA), but it contained no special tax regimes. On the contrary, free zone laws at the national level may contain important preferential regimes; for example, Senegal provides income tax holidays up to 50 years in its 2007 free zone law.

27
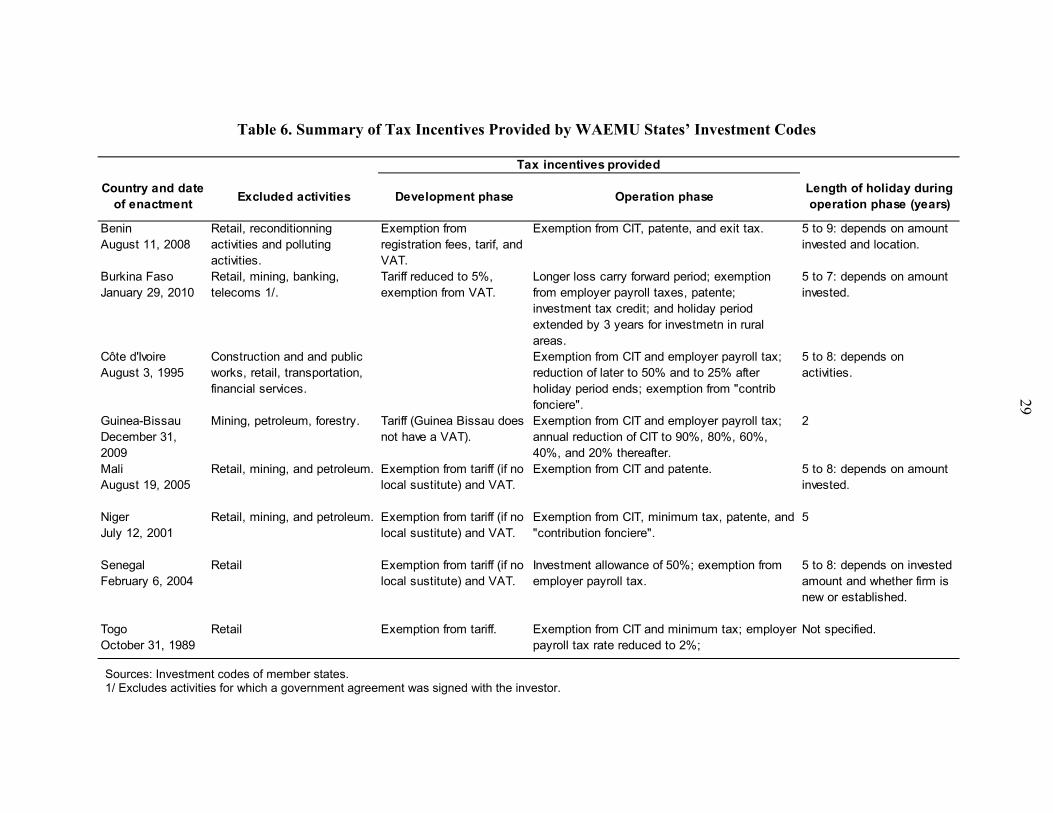
The question whether the directive intended simply to grandfather existing incentives, disallowing any future changes remains open. Today, all WAEMU states provide special tax regimes that depart from the tax treatment under their general tax laws, and some are more recent than the CIT directive. These special regimes can be found in sectoral laws (e.g., investment laws; mining and petroleum laws; free zone laws; etc.), or they can be discretionary—provided by presidential or ministerial decrees, and generally without Parliament’s consent. Often, they involve a contractual agreement or written understanding between the state and the taxpayer. Whether grounded in a law or a contractual agreement, these regimes usually refer to existing tax laws as a starting point, modifying them to arrive at a certain tax package. Table 6 summarizes the main types of tax incentives provided under existing ICs—note that three are more recent than the CIT directive: Benin, Burkina Faso, and Guinea-Bissau. Some commonalities can be observed: Most ICs exclude the retail sector, and some other service sectors, from eligibility for
tax incentives. Countries thus view manufacturing activities as more worthy of tax subsidies than the service sector.
Mining and petroleum activities are also excluded—in countries where such activities
are important. One possible reason for this is institutional: the upstream energy sector in WAEMU is typically under the responsibility of an independent ministry, separate from that in charge of the economy. Tax rules for the sector, including tax incentives, are often drafted in the sectoral law, borrowing where necessary from the tax laws.
The standard tax incentive takes invariably the form of a temporary exemption or reduction from various taxes during the two phases of an investment: (1) during the development phase, exemptions are given from indirect taxes—mainly tariff and VAT; (2) during the operation phase, exemptions or reductions are given from taxes on profits, patentes (a fixed or proportional-to-turnover tax), minimum taxes, and employer’s payroll taxes. The incentives during the operation phase are perhaps the only area of ICs where differences across member states may occur, and hence may create a tax distortion across countries. For example, the tax holiday period in many states depends on the amount invested—the greater the amount the longer the holiday. This can be seen as reflecting the relative negotiating powers of investors and governments, and can be a source of tax competition among member states. This relation is confirmed empirically in Klemm and Van Parys (2012), who show that tax exemptions result in part from strategic interactions between member states. Van Parys and James (2010) establish empirically that this tax competition behavior is not very effective in attracting foreign investment.
28
A positive aspect of ICs, at least in principle, is to substitute rules for total discretion, hence improving transparency and governance in the provision of tax incentives. The idea is that tax incentives would still be provided upon request and subject to review and approval by committees (typically at the ministerial level), but the rules would be laid out clearly in the IC. In practice, however, experience suggests that this has not worked as well as expected. Two reasons can be given for this. First, the eligibility rules are lengthy and complex, allowing review committees to exercise discretion in the choice of eligible investment. Second, these rules are based on investors’ intentions, not actions; they can almost always be met, especially by big investors, despite their complexity. Moreover, governments seem to have lacked credibility in reversing their decisions once the investment is sunken and not all conditions are met (e.g., minimum local value-added, minimum monetary amount invested, project development period, etc). This raises doubt about the usefulness of such complexity, relative to, for example, providing incentives automatically as part of filing a tax return and subject to general audit rules. This may seem counterintuitive since enforcing the rules should, in principle, strengthen government credibility, not weaken it; the explanation perhaps lies in the opaque nature and governance of the process of administering ICs. In summary, the differences in ICs among member states are essentially limited to the length of income tax holidays during the operation phase of an investment. They are not large enough to have any significant impact on companies’ choice of country location within the WAEMU region.
29
Table 6. Summary of Tax Incentives Provided by WAEMU States’ Investment Codes
Sources: Investment codes of member states. 1/ Excludes activities for which a government agreement was signed with the investor.
Country and date of enactment
Excluded activities Development phase Operation phaseLength of holiday during operation phase (years)
BeninAugust 11, 2008
Retail, reconditionning activities and polluting activities.
Exemption from registration fees, tarif, and VAT.
Exemption from CIT, patente, and exit tax. 5 to 9: depends on amount invested and location.
Burkina FasoJanuary 29, 2010
Retail, mining, banking, telecoms 1/.
Tariff reduced to 5%, exemption from VAT.
Longer loss carry forward period; exemption from employer payroll taxes, patente; investment tax credit; and holiday period extended by 3 years for investmetn in rural areas.
5 to 7: depends on amount invested.
Côte d'IvoireAugust 3, 1995
Construction and and public works, retail, transportation, financial services.
Exemption from CIT and employer payroll tax; reduction of later to 50% and to 25% after holiday period ends; exemption from "contrib fonciere".
5 to 8: depends on activities.
Guinea-BissauDecember 31, 2009
Mining, petroleum, forestry. Tariff (Guinea Bissau does not have a VAT).
Exemption from CIT and employer payroll tax; annual reduction of CIT to 90%, 80%, 60%, 40%, and 20% thereafter.
2
MaliAugust 19, 2005
Retail, mining, and petroleum. Exemption from tariff (if no local sustitute) and VAT.
Exemption from CIT and patente. 5 to 8: depends on amount invested.
NigerJuly 12, 2001
Retail, mining, and petroleum. Exemption from tariff (if no local sustitute) and VAT.
Exemption from CIT, minimum tax, patente, and "contribution fonciere".
5
SenegalFebruary 6, 2004
Retail Exemption from tariff (if no local sustitute) and VAT.
Investment allowance of 50%; exemption from employer payroll tax.
5 to 8: depends on invested amount and whether firm is new or established.
TogoOctober 31, 1989
Retail Exemption from tariff. Exemption from CIT and minimum tax; employer payroll tax rate reduced to 2%;
Not specified.
Tax incentives provided
30
V. EXPERIENCE WITH REVENUE MOBILIZATION
The previous two sections have shown that coordination has brought about some convergence of national tax policies, but that distortions to the internal market have not been eliminated. Moreover, any progress in furthering integration in the current coordination framework seems highly unlikely. This section deals with the second most important objective of tax coordination as stated in the WAEMU treaty: mobilizing domestic tax revenue. In this regard, tax coordination is seen as key to increasing tax revenue to the Convergence Pact level of 17 percent of GDP, and beyond in the long run. A closely related objective is the tax transition (transition fiscale), which was spelt out in a 2006 decision;53 it seeks to shift the tax revenue structure of member states from taxes on international trade to domestic taxes. This shift implies a reduction in tariff rates in the long run, and this is indeed the intention of the Economic Partnership Agreements (EPAs) with the EU. But recent developments in the region, and particularly the enlargement of the CET to the Economic Community of West African States (ECOWAS), suggest that tariff rates in WAEMU would actually increase in the near future on some categories of imports.54 In this section, we explore the revenue performance of WAEMU states, and see how the level and composition of revenue has evolved, particularly since the start of the WAEMU Treaty in 1994 and the implementation of the CET in 2000. The purpose is to explore whether tax coordination could have played a role in furthering the two Treaty objectives just noted. The database used in this section (see Mansour, 2013) is an update of the SSA database in Keen and Mansour (2010a). This update covers 41 SSA countries over the period 1980–2010. It distinguishes between tariffs and domestic revenues, with the latter split between indirect tax revenues (essentially VAT and excises), CIT revenue, PIT revenue, and other tax revenues. This representation of revenues allows for the study of the various tax sources that are subject to regional coordination. As is the case in Keen and Mansour (2010a), we kept and improved the distinction between resource and non-resource revenues, with the former comprising resource royalties and the CIT from upstream mining and oil and gas.
53 See Decision 10/2006/CM/UEMOA, Decision 34/2009/CM/UEMOA, and Decision 35/2009/CM/UEMOA. Decision 10/2006 reaffirmed the objective of intra-Community free trade, and called for the removal of non-tariff barriers and all tariff measures inconsistent with the CET, and the VAT and excise tax directives; it also called for the removal of all measures that create distortions to intra-community trade and capital mobility (i.e., special tax regimes); and it signaled the need to harmonize direct taxes, which was accomplished a few years later with the introduction of the directives on capital income taxation, and the MTT.
54 See on this Geourjon and Mansour (2013).

31
Experience at the regional level Figure 2 depicts the composition of tax revenue in WAEMU. The drastic deterioration of the overall tax-to-GDP ratio in the 1980s and early 1990s was followed by some improvement in the second half of the 1990s, and a steep increase in the first half of the 2000s. Econometric analysis lends support to the hypothesis that tariff and tax coordination may have improved revenue mobilization; a Chow test suggests that there is a structural break in the tax-to-GDP ratio in 2000, the year the CET was fully phased in and less than two years after the VAT and excise directives.55
Figure 2. Structure of Tax Revenues in WAEMU; 1980–2010
Source: Mansour (2013).
In terms of changes to the revenue structure, Figure 2 shows the now familiar impact of trade liberalization on tariff revenue,56 which in WAEMU caused a loss of about 4 percentage points of GDP, most of which occurring in the 1980s. These were recouped by indirect taxes, mainly the VAT, starting only in the early 1990s. The CET, which was completed in 2000, may have therefore helped to stabilize the revenue from this source by limiting tariff competition among member countries. Also interesting is the fact that the increase in indirect tax revenues since 1998 (date of introduction of the VAT and excise directives) is modest (about two percentage points of GDP). 55 The econometric analysis, not reported here, consists in applying the Chow test to the following regression (variables in log form): ∝ where i=1,…,n denotes the country, t=1,…,T time, α and are unknown parameters, X is a vector of independent variables (which include GDP, openness, urbanization, etc.), and εit is a random error.
56 See IMF (2011) and Baunsgaard and Keen (2010) for developing countries in general, and Keen and Mansour (2010a) for SSA.
0
2
4
6
8
10
12
14
16
18
1980 1984 1988 1992 1996 2000 2004 2008
(% of GDP)
Total taxes Non-resource taxes TariffsIndirect taxes Income taxes

32
The evolution of income taxes is unimpressive, with their yield stable around 4 percent of GDP over the period. A closer look at the corporate tax, however, reveals some interesting developments (Figure 3). After losing half of its yield in the 1980s and early 1990s, the CIT recovered quickly in the mid-1990s, and has remained relatively stable since, around 1.4 percent of GDP (excluding the contribution of upstream mining and oil and gas activities). Figure 3 also shows the relative importance of Côte d’Ivoire to the regional CIT yield, where the contribution of agricultural exports such as cocoa and coffee are significant.
Figure 3. Corporate Tax Rates and Revenue in WAEMU; 1980–2010
Source: Mansour (2013). Note: CIT Revenue excludes the contribution of upstream oil and gas and mining.
Development in the CIT rate shows a slow decline over 1990–2005, and then a steep one that coincided with the introduction of the CIT rate and base directives in 2008. It is interesting that the CIT interval prescribed by the rate directive imposed a minimum rate of 25 percent, 10 points below the rates practiced by WAEMU countries in 2008. It is possible that one of the main aims of the directive was to preempt some countries from lowering their rate below 25 percent. But the imposition of a maximum of 30 percent forced some countries, where the CIT acts as a rent tax on upstream resource activities, to compensate for the revenue loss with more distortionary taxes—e.g., Mali reduced its CIT rate from 35 to 30 percent to abide by the CIT rate directive, and introduced instead an export tax of 3 percent on gold production (which essentially acts as additional royalty). Although there is no clear indication that CIT rate reductions in WAEMU since the early 1990s contributed, on average, to a revenue loss, the recent decline in rates suggests that the
0
5
10
15
20
25
30
35
40
45
0.0
0.2
0.4
0.6
0.8
1.0
1.2
1.4
1.6
1.8
1980 1985 1990 1995 2000 2005 2010
(%)(% of GDP)
CIT Revenue CIT Revenue (excl. Côte d'Ivoire)CIT Rate (Right axis)

33
future of the CIT as a revenue source in the non-resource sector is uncertain. Downward pressure on the CIT rate is likely to continue in SSA, and unless the tax base is broadened by scaling back tax incentives, revenue will ultimately suffer. The recent speed at which SSA countries have reduced their CIT rates suggests that this outcome may not be too distant a possibility. In 2005, only five SSA countries had a standard CIT rate lower than 30 percent; the number increased to 13 in 2010, and 15 in 2012; all WAEMU countries now have a CIT rate between 25 and 30 percent. Experience at the country level Experience at the country level varies significantly among WAEMU states, and suggests that both the structure and the level of tax revenues have not progressed significantly towards the objectives set by the Treaty (Figure 3). This is not surprising given the flexibility in base setting provided by the various directives, ongoing tax competition through special tax regimes, and the differences in the evolution of the composition of GDP across member states. In terms of tax levels Burkina Faso, Guinea-Bissau and Togo are well below the convergence criteria of 17 percent of GDP; their revenue effort improved only marginally since 2000. Mali and Niger have mobilized significant revenue since 1995, but mostly from the mining sector. The revenue increase in Niger is especially impressive over 2005–10, a period of significant increase in commodity prices. Benin has capitalized on its strategic geographical location with respect to Nigeria to improve its tariff revenue through re-exports. It is the only country where this source of revenue increased significantly since 1995 in tandem with an increase in VAT revenue; in other countries, VAT revenue has substituted for tariff revenue. Senegal’s revenue performance is impressive and almost entirely linked to the VAT and excises, which account for over 50 percent of tax revenue. Senegal, and to a lesser extent Burkina Faso, seem to have progressed best in transiting from tariff to domestic tax revenue.

34
Figure 4. Structure of Tax Revenues in WAEMU States; 1980–2010
Source: Mansour (2013).
0
5
10
15
20
1980 1985 1990 1995 2000 2005 2010
Benin
Total Tariffs Indirect Direct
0
5
10
15
1980 1985 1990 1995 2000 2005 2010
Burkina Faso
Total Tariffs
Indirect Direct
0
5
10
15
20
25
1980 1985 1990 1995 2000 2005 2010
Côte d'Ivoire
Total TariffsIndirect Direct
0
5
10
1980 1985 1990 1995 2000 2005 2010
Guinea-Bissau
Total TariffsIndirect Direct
0
5
10
15
20
1980 1985 1990 1995 2000 2005 2010
Mali
Total Tariffs Indirect Direct
0
5
10
15
20
1980 1985 1990 1995 2000 2005 2010
Niger
Total Tariffs Indirect Direct
0
5
10
15
20
1980 1985 1990 1995 2000 2005 2010
Senegal
Total Tariffs Indirect Direct
0
5
10
15
20
25
30
35
1980 1990 2000 2010
Togo
Total Tariffs Indirect Direct

35
Comparisons with selected regional trade groups We argued earlier that trade and tax coordination in WAEMU may have helped to improve revenue mobilization; we did this based on a structural break test in 2000 in total non-resource tax revenue. An important and related question is the revenue performance in WAEMU relative to other trading groups in SSA that do not coordinate to the same extent their tariff and tax policies. Figure 5 shows the change in the (non-resource) tax-to-GDP ratio for five such groups between 2000 and 2010.57 WAEMU has performed better than SACU and CEMAC, but not as well as the EAC. This lends some support to the hypothesis that WAEMU did relatively rather well since it started tariff and tax coordination. The WAEMU also compares favorably to the other selected regions in term of current tax-to-GDP levels (see Annex I); only SACU outperforms it.
Figure 5. Change in Tax Revenues in Selected SSA Groups; 2000 and 2010
Source: Mansour (2013).
57 These groups coordinate their trade policies to various extents, but less than WAEMU, and they do not coordinate their domestic tax policies—with the exception of CEMAC, which has VAT and excise directives similar in design to those in WAEMU. Therefore, they constitute good comparators.
-12
-10
-8
-6
-4
-2
0
2
4
6
8
WAEMU ECOWAS (non-WAEMU)
CEMAC EAC SACU
(Percentage points of GDP)
Total tax revenue Resource tax revenue Non-resource tax revenue
36
VI. LESSONS LEARNED AND CONCLUDING REMARKS
The speed with which the WAEMU has built a tariff and tax coordination framework is remarkable. In 15 years, the region succeeded in forming a customs union and coordinating the setting of main domestic taxes through a partial harmonization approach. This paper has provided a detailed description of this process, and assessed its strength, weaknesses, and potential impact on intra-WAEMU distortions to trade, investment, and revenue mobilization. In doing this, we have attempted to draw some lessons for other regions that are contemplating the coordination of their tax policies. Some of these lessons are general in nature, and relate to the process of economic integration and tax coordination; others are more specific and apply to certain areas of tax coordination, in particular the CIT and the related topic of investment tax incentives. The first important lesson that we draw from this paper is that political leaders in the WAEMU underestimated the difficulties and challenges of tariff and tax coordination. This is most obviously clear in the gaps that exist between the objectives of economic integration as set out in the WAEMU Treaty of 1994, and the effectiveness of the tax directives and regulations that were produced in order to meet these objectives. Second, policymakers did not take sufficiently into account the implementation and enforcement implications at the regional level, particularly the need for effective surveillance. This partly explains the gaps between the de jure and de facto coordination. Third and somewhat related to the first two lessons, the credibility of the coordination framework depends in large part on the credibility of its regional institutions. It is ironic that, having borrowed extensively from the EU model of economic integration and tax coordination, the WAEMU has yet to provide its regional institutions with the necessary resources to undertake effective surveillance. The fact that neither the WAEMU Commission nor member states have called upon the regional Court of Justice in cases of non-compliance with the tax directives, has undermined the credibility of the coordination framework and its institutions. One result of this has been that the WAEMU Commission recently changed some of its directives to allow non-compliant countries to become compliant—e.g., VAT and excise directives. This accommodating approach is likely to further erode the coordination framework and the credibility of the Commission. Fourth, the tax coordination framework may have had the unintended effect of contributing to the fragmentation of policy making at the national level by providing countries with the incentive to enact special tax regimes outside their tax laws. This is particularly the case of investment incentives, where the framework allows unfettered tax competition as long as it is done outside countries’ main tax laws. This, in turn, has made tax systems opaque, increased their complexity, and contributed to a culture of “tax negotiation”.

37
Fifth, and on a more positive note, the coordination framework has allowed some convergence of countries’ tax systems (notably statutory tax rates), which in turn may have contributed to the positive revenue performance observed in WAEMU member states since 2000. This is particularly the case of VAT and excises on tobacco products and alcoholic beverages. However, the future of the CIT (other than on resource activities) is uncertain in the region, as there is little evidence that the 2008 CIT directives have had any impact on corporate tax competition. In conclusion, the future of the tax coordination framework in WAEMU is uncertain. Although it must evolve to respond to the objectives of economic integration, the current approach of coordination has shown its limits in certain areas. Two options may be envisaged. The first would deepen harmonization through stronger political commitment, and authority and resources to regional institutions to effectively monitor compliance and impose sanctions. This option is consistent with the objectives of the 1994 Treaty but its conditions are very hard to achieve, particularly political commitment. The second option would take the lack of commitment as given, and put more emphasis on a negative approach to tax coordination. 58 For instance, instead of trying to establish a common investment code, the WAEMU Commission could establish a list of taxes that may not be reduced or exempted at the national level. Beyond these two approaches, a more flexible way to coordinate would be based on soft laws, such as best practices, information sharing, and on self-enforcing commitments. It is less ambitious in legal terms, but it may improve the effectiveness of tax coordination by preserving the objectives of integration while providing countries with more flexibility in setting their national tax policies. The WAEMU tariff and tax coordination framework is likely to evolve with a mixed approach combining partial or full harmonization, negative coordination, and sharing of information and best practices. The difficulty resides in identifying at various milestones of the integration process, which approach works best and for what tax—a task where improvement in the leadership and analytical competencies of the WAEMU Commission can make an important contribution to the integration process.
58 Positive and negative integration is a conventional dichotomy in the integration literature since Tinbergen (1954): The first one refers to the definition of common policies among countries, which determine conditions under which markets operate, while the second one corresponds to the elimination of some national restrictions, which affect market competition.

38
Appendix I. Tax Revenues in Selected SSA Groups; 2000 and 2010 (Percent of GDP)
Source: Mansour (2013). Note: Weighted averages are shown in bold. "n.a." means not available.
Total tax revenue
Resource tax revenue
Non-resource tax
revenue
Total tax revenue
Resource tax revenue
Non-resource tax
revenue
WAEMU 13.6 0.2 13.4 16.3 0.7 15.6
Benin 14.1 0.0 14.1 16.3 0.0 16.3
Burkina Faso 10.8 0.0 10.8 12.7 0.0 12.7
Côte d'Ivoi re 14.7 0.2 14.5 18.4 1.1 17.4
Guinea-Bissau 6.8 0.0 6.8 8.3 0.0 8.3
Mal i 12.3 0.8 11.5 14.8 2.5 12.4
Niger 8.7 0.0 8.7 12.8 0.5 12.3
Senega l 16.1 0.0 16.1 18.1 0.0 18.1
Togo 11.3 0.2 11.1 15.7 0.0 15.7
ECOWAS (non WAEMU) 35.0 27.7 7.3 26.4 16.8 9.6
Cape Verde 18.2 0.0 18.2 19.1 0.0 19.1
Gambia 11.2 0.0 11.2 12.0 0.0 12.0
Ghana 11.0 0.0 11.0 13.2 0.0 13.2
Guinea 9.9 2.7 7.3 14.9 3.9 11.0
Liberia n.a . n.a . n.a . n.a . n.a . n.a .
Nigeria 41.3 34.9 6.4 29.1 20.2 8.9
Sierra Leone 10.8 0.0 10.8 11.7 0.0 11.7
CEMAC 20.6 11.3 9.2 25.0 16.3 8.8
Cameroon 15.7 4.9 10.8 16.0 4.5 11.5
Centra l African Republ ic 8.2 0.0 8.2 8.4 0.3 8.1
Chad 6.9 0.0 6.9 25.7 16.0 9.7
Congo, Republ ic of 26.2 20.3 5.9 37.1 29.6 7.5
Equatoria l Guinea 18.3 15.1 3.3 28.7 26.9 1.8
Gabon 33.2 22.6 10.7 27.6 15.2 12.3
EAC 12.3 0.0 12.3 15.7 0.0 15.7
Burundi 18.3 0.0 18.3 18.0 0.0 18.0
Kenya 16.2 0.0 16.2 18.3 0.0 18.3
Rwanda 9.7 0.0 9.7 12.0 0.0 12.0
Tanzania 9.1 0.0 9.1 15.8 0.0 15.8
Uganda 9.9 0.0 9.9 11.8 0.0 11.8
SACU 21.8 1.2 20.6 22.9 0.9 21.9
Botswana 34.6 23.3 11.3 27.2 9.0 18.2
Lesotho 34.1 0.0 34.1 36.8 0.0 36.8
Namibia 28.7 1.5 27.2 26.5 1.3 25.1
South Africa 21.0 0.3 20.7 22.5 0.6 21.9
Swazi land 22.5 0.0 22.5 24.4 0.0 24.4
2000 2010

39
References Balassa, Bela, 1961, The Theory of Economic Integration, London: Allew and Unwin. Baunsgaard, Thomas and Michael Keen, 2010, “Tax Revenue and (or?) Trade Liberalization,” Journal of Public Economics, 94(9-10): 563–577. Bulow, Jeremy, John Geanakoplos, and Paul Klemperer, 1985, “Multimarket Oligopoly: Strategic Substitutes and Complements,” Journal of Political Economy, 93(3): 488–511. Clément, Jean A. P., Johannes Mueller, Stéphane Cossé, and Jean Le Dem, 1996, Aftermath of the CFA Franc Devaluation, Occasional Paper 138 (International Monetary Fund: Washington D.C.). Cnossen, Sijbren, 2013, “Coordination of Indirect Taxes in the ASEAN Free Trade Area,” Tax Notes International, 69(6): 589–612. Cnossen, Sijbren, 2011, “Coordination of Indirect Taxes in the Southern African Development Community,” Tax Notes International, 61(12): 943–969. Cremer, Helmuth and Firouz Gahvari, 2000, "Tax evasion, fiscal competition and economic integration," European Economic Review, 44(9), 1633–1657. Eaton, C., 2004, “The Elementary Economics of Social Dilemmas,” Canadian Journal of Economics, 37(4): 805–829. Ebril, Liam, Michael Keen, Jean-Paul Bodin, and Victoria Summers, 2001, The Modern VAT, (Washington: International Monetary Fund). Egoume, Philippe, and Ankouvi Nayo, 2011, Feeling the Elephant’s Weight: The Impact of Côte d’Ivoire’s Crisis on WAEMU Trade, Working Paper WP/11/80 (Washington: International Monetary Fund). Geourjon, Anne-Marie, and Mario Mansour, 2013, Les défis de la coordination des politiques tarifaires et fiscales en UEMOA/CEDEAO, www.ferdi.fr. Goretti, Manuela, and Hans Weisfeld, 2008, Trade in the WAEMU: Developments and Reform Opportunites, Working Paper WP/08/68 (Washington: International Monetary Fund). International Monetary Fund, 2011, Revenue Mobilization in Developing Countries (Washington: International Monetary Fund).

40
Kanbur, R., and Michael Keen, 1993, “Jeux sans Frontieres: Tax Competition and Tax Coordination when Countries Differ in Size,” American Economic Review, 83 (4): 877–892. Keen, Michael, 2008, “Tax Competition,” The New Palgrave Dictionary of Economics; Eds. Steven N. Durlauf and Lawrence E. Blume, Palgrave Macmillan. Online version at www.dictionaryofeconomics.com/dictionary Keen, Michael, and Mario Mansour, 2010a, “Revenue Mobilization in Sub-Saharan Africa: Challenges from Globalization I – Trade Reform,” Development Policy Review, 28(5): 553–571. Keen, Michael, and Mario Mansour, 2010b, “Revenue Mobilization in Sub-Saharan Africa: Challenges from Globalization II – Corporate Taxation,” Development Policy Review, 28(5): 573–596. Klemm, Alexander, and Stefan Van Parys, 2012, “Empirical Evidence on the Effects of Tax Incentives,” International Tax and Public Finance, 19:393–423. Mansour, Mario, 2013, A New Tax Revenue Database for Sub-Saharan Africa, forthcoming. Rosenberg, Christoph, 1995, Fiscal Policy Coordination in the WAEMU After the Devaluation, Working Paper WP/95/25 (Washington: International Monetary Fund). Van Parys, Stefan, and Sebastian James, 2010, “The effectiveness of tax incentives in attracting investment: panel data evidence from the CFA Franc zone,” International Tax and Public Finance, 17: 400–429. Wildasin, David E., 1988, “Nash Equilibria in Models of Fiscal Competition,” Journal of Public Economics, 35 (2): 229–240. Wilson, John Douglas, 1986, “A Theory of Interregional Tax Competition,” Journal of Urban Economics 19 (3): 296–315. Zodrow, G.R. and P. Mieszkowski, 1986, “Pigou, Tiebout, Property Taxation, and the Underprovision of Local Public Goods,” Journal of Urban Economics, 19 (3): 356–370.