tax evasion, informality and the business environment...
TRANSCRIPT

TAX EVASION, INFORMALITY AND THE BUSINESS ENVIRONMENT IN UGANDA
JOSEPH MAWEJJE
December 2013
RESEARCH SERIES No. 113


TAX EVASION, INFORMALITY AND THE BUSINESS ENVIRONMENT IN UGANDA
RESEARCH SERIES No. 113
JOSEPH MAWEJJE
DECEMBER 2013

Copyright © Economic Policy Research Centre (EPRC)
The Economic Policy Research Centre (EPRC) is an autonomous not-for-profit organization established in 1993 with a mission to foster sustainable growth and development in Uganda through advancement of research –based knowledge and policy analysis. Since its inception, the EPRC has made significant contributions to national and regional policy formulation and implementation in the Republic of Uganda and throughout East Africa. The Centre has also contributed to national and international development processes through intellectual policy discourse and capacity strengthening for policy analysis, design and management. The EPRC envisions itself as a Centre of excellence that is capable of maintaining a competitive edge in providing national leadership in intellectual economic policy discourse, through timely research-based contribution to policy processes.
Disclaimer: The views expressed in this publication are those of the authors and do not necessarily represent the views of the Economic Policy Research Centre (EPRC) or its management.
Any enquiries can be addressed in writing to the Executive Director on the following address:
Economic Policy Research CentrePlot 51, Pool Road, Makerere University CampusP.O. Box 7841, Kampala, UgandaTel: +256-414-541023/4Fax: +256-414-541022Email: [email protected]: www.eprc.or.ug

iECONOMIC POLICY RESEARCH CENTRE - EPRC
Tax Evasion, Informality and The Business Environment In Uganda
ABSTRACT
Uganda has recorded impressive economic growth rates over the last two decades. How-ever despite the sustained period of growth, the tax effort measured by the tax-to-GDP ratio has stagnated between 10-13 percent of GDP over the same period. Non-empirical evidence has identified the pervasiveness of the informal sector, tax evasion, narrow tax base, and tax breaks variously given out by the government as some of the factors that might explain the inelastic tax system in Uganda. While the informal sector has implications for tax effort, there is limited research on the microeconomic level determinants of informality and tax evasion in Uganda.
This paper provides some empirical evidence on how a poor business environment causes tax evasion. In particular, the paper examines specific components of the business environ-ment that include the efficiency of the legal systems, bureaucratic bribery and the provision of public capital such as adequate provision of electricity and transport infrastructure which is complementary to firm performance and how they relate to tax evasion. I construct an instrument for bureaucratic bribery as the interaction between a firm’s ability to pay and corruption as a business constraint. I compute an individual firm’s ability to pay bribes as the total cost of labour, including wages, salaries, bonuses and social payments adjusted for the level of annual sales. I use instrumental variable OLS and Tobit estimation procedures separately and find that the extent of tax evasion is determined by the quality and efficiency of the legal systems, bureaucratic bribery and inadequate provision of public capital. In addi-tion I find that the business environment has implications for tax evasion. These results sug-gest that ameliorating the business environment, strengthening the legal system, adequate provision of public capital such as transport and electricity infrastructure as well as reigning in on bureaucratic bribery will reduce tax evasion and ultimately lead to increasing Govern-ment revenue collections.
Key words: Tax evasion, informality, business environment, Uganda

ii ECONOMIC POLICY RESEARCH CENTRE - EPRC
Tax Evasion, Informality and The Business Environment In Uganda
TABLE OF CONTENTS
ABSTRACT I
1. INTRODUCTION 1
2. THE BUSINESS ENVIRONMENT AND INFORMALITY IN UGANDA 2 2.1 The nature of the business environment in Uganda 2 2.2 The extent of informality in Uganda 33. LITERATURE AND ANALYTICAL FRAMEWORK 4 3.1 Literature review 44. DATA AND ESTIMATION STRATEGY 7 4.1 The data 7 4.2 The estimation strategy 95. RESULTS AND DISCUSSION 10
6. CONCLUSIONS AND POLICY RECOMMENDATION 19
REFERENCES 19Appendix 1: First stage regressions – Ordinary Least Square (OLS) estimates 22Appendix 2: First stage regressions –Tobit estimates 23Appendix 3: Scatter plot – log of informal sales and log of bribery 24Appendix 4: Scatter plot – log of informal sales and log number of electricity outages in a month 24Appendix 5: The biggest obstacles in doing business 25Appendix 6: Description of data variables 26
EPRC RESEARCH SERIES 27

1ECONOMIC POLICY RESEARCH CENTRE - EPRC
Tax Evasion, Informality and The Business Environment In Uganda
1. INTRODUCTION
The tendency of firms to operate informal-ly and evade taxes is widespread in many developing countries. Schneider (2006) estimated the size of Uganda’s informal economy at 45.4 percent of gross national income in 2003. More recent studies such as Schneider et al (2010) and Buehn & Schnei-der (2012) estimated the size of Uganda’s shadow economy to be 45.8 percent and 40.3 percent of gross national income, re-spectively. At the same time Governments, especially in the developing world, are in-creasingly finding difficulties in mobilising domestic revenue due to an inelastic tax system characterised by a narrow tax base and widespread informality in the business sector. For these reasons, issues of tax eva-sion, informality, and widening of the tax base have now received renewed attention in policy debates.
Uganda has recorded impressive econom-ic growth rates over the last two decades. However despite the sustained period of growth, the tax collected as measured by the tax-to-GDP ratio has stagnated between 10-13 percent of GDP over the same period (AfDb 2010; Matovu 2011). Non-empiri-cal evidence has identified the pervasive-ness of the informal sector and narrow tax base (AfDB 2010; Matovu 2010; Ssenoga et al 2009), and the effect of the tax breaks variously given out by the government (Gauthiera and Reinikka 2006; Tax Justice Network-Africa & Action Aid International (2012) as some of the factors that might explain the inelastic tax system in Uganda. Moreover, Uganda’s tax compliance attitude estimated at 32 percent is lower than that of its regional neighbours, Kenya (54 percent)
and Tanzania (46 percent), as shown by Ali et al (2013).
Consequently, Uganda has continued to struggle with inadequate funds to finance its budget. Recent events where the donors who contributed as much as 25% of the na-tional budget decided to withhold some of their support due to allegations of corrup-tion in various government departments have left the Ugandan economy affected, with major implications on service delivery and business growth (Mawejje 2012). In turn, the Uganda Revenue Authority (URA), Uganda’s autonomous body responsible for tax revenue collections, has had its tax col-lection targets elevated to close the financ-ing deficit. However, the biggest challenge has been ensuring tax compliance, especial-ly considering the size of the informal sector in the country.
While the informal sector has implications for tax effort, there is limited research on the microeconomic level determinants of informality and tax evasion in Uganda.
Central to the studies of the drivers of in-formality and tax evasion is the role of the environment in which businesses operate. A conducive business environment has been shown to enhance business performance. Inshengoma and Kappel (2011) examined the trends of some factors in the Uganda business environment between 1994 and 2010 and concluded that the business cli-mate has deteriorated. The central ques-tion to this study is whether the various constraints in the business environment are some of the drivers of tax evasion. In other words, does an adverse business environ-ment encourage Ugandan firms to operate

2 ECONOMIC POLICY RESEARCH CENTRE - EPRC
Tax Evasion, Informality and The Business Environment In Uganda
informally and evade taxes?
This paper follows the work of de Soto (1989), Loayza (1996) and Dabla-Norris et al (2008) who modelled informality as the failure by economic agents to fully comply with Government determined regulations and taxes. According to this framework, in-formality arises from excessive regulation, taxation and bureaucratic red tape by a Government that lacks the capacity to fully enforce compliance (Loayza 1996).
Using a 2006 World Bank dataset of a cross-section of Ugandan firms, I make a contri-bution to the empirical literature about the drivers of informality and tax evasion. In par-ticular, I investigate if firm managers’ per-ceptions about the business environment in-fluence their decisions to operate informally and avoid taxes. I model a firm’s decision to operate informally as a profit maximisation problem that depends on Government’s provision of a conducive business environ-ment and efficient legal systems that ensure enforceability of set regulations.
I show that inadequate Government provi-sion of public capital, bureaucratic bribery, an inefficient legal environment and an ad-verse business environment are all associ-ated with increasing informality and tax evasion. In addition, I show that firm, mana-gerial as well as industry specific character-istics are important correlates of informality and tax evasion.
The rest of the paper is organised as fol-lows: section two discusses the nature of the business environment in Uganda and in-formality. The literature survey and analyti-cal framework are discussed in section three
while data and estimation strategy are pre-sented in section four. Section five presents the findings and lastly the conclusions are presented in section 6.
2. THE BUSINESS ENVIRONMENT AND INFORMALITY IN UGANDA
2.1 The nature of the business environment in Uganda
According to Ishengoma and Kappel (2011) Uganda’s business environment has been deteriorating over time. In addition, Uganda is still classified as a factor driven economy, implying that the key pillars for competitive-ness are still the basic requirements such as adequacy of infrastructure, institutions, macroeconomic environment, health and primary education (World Bank 2013). Ac-cording to the World Bank (2013), Uganda’s competitiveness is largely driven by labour market efficiencies, developments in the macroeconomic environment and financial markets. Uganda’s competitiveness rank-ing deteriorated to 123 in 2013 from 108 in 2009. This is largely due to insufficient prog-ress made in addressing the education and skills challenges coupled with a poor work ethic, institutional weaknesses, infrastruc-tural bottlenecks, lack of innovation and in-adequacy of technology readiness.
The most pressing constraints to business development in Uganda are legal, regulatory and infrastructural challenges in addition to challenges in identifying, attracting and re-taining an appropriately skilled labour force (PSFU 2012). Other challenges include non-

3ECONOMIC POLICY RESEARCH CENTRE - EPRC
Tax Evasion, Informality and The Business Environment In Uganda
tariff barriers to trade, the tax burden and constrained credit market access (Mawejje 2012).
The World Bank (2013) highlights the reg-ulatory burden of doing business in 183 economies. It aims at investigating the regu-lations that enhance business activity and those that constrain it. It looks at the impact of regulation on businesses at ten stages of a typical business’s life cycle: starting a business, dealing with construction permits, employing workers, registering property, getting credit, protecting investors, pay-ing taxes, trading across borders, enforcing contracts and closing a business. Uganda currently ranks 123rd out of the 183 econo-mies measured by the Doing Business 2013 report on the overall ease of doing business. This ranking is worse that 2012 when the country was ranked 121st and 2011 when the country ranked 118th. The current rank-ing indicates that the business environment in Uganda has been deteriorating. The de-terioration of the Uganda business environ-ment has been occasioned by the persis-tence of constraints as detailed in table 1) below:
2.2 The extent of informality in Uganda
Uganda’s Business Sector is dominated by Micro, Small and Medium Scale Enterprises (MSMEs) which comprise about 1,100,000 enterprises and employ approximately 2.5 Million people - equivalent to 90% of to-tal non- farm private sector workers (PSFU 2012). Majority of these businesses operate in the informal sector. The Uganda informal sector is not only large but it is expanding too. For example Schneider’s (2006) esti-mates shows that the informal sector in Uganda, as a percentage of GDP, increased from 43.1 in 2000 to 45.4 in 2003. A study by Muwonge et al (2007) estimates that 87 percent of all business establishments in Uganda; 80 percent of Uganda’s economic total active labour force and 88 percent of women workers are all categorised within the informal sector. More recent estima-tions by Schneider et al (2010) and Buehn & Schneider (2012) indicate that the size of the informal sector or “the shadow econ-omy” expressed as a percentage of gross national income is large and stands at 45.8 percent and 40.3 percent respectively. This evidence points to the ubiquitous nature of informality in Uganda.
Table 1: Constraints to Business Development in Uganda
Constraints Years2008/9 2009/10 2010/11 2011/12 2012/13
Corruption 17.0 17.8 21.9 20.2 18.4Access to financing 22.9 19.3 15.3 17.6 16.7Inadequate Infrastructure 11.4 13.0 13.0 10.3 12.8Tax Rates 9.9 8.6 8.9 11.0 9.6Poor work ethic in labour force 9.6 7.2 7.1 5.4 4.2Government Bureaucracy 8.6 7.1 6.7 7.3 4.2Inflation 4.6 7.3 6.3 13.3 16.3Inadequately educated work force 3.4 3.7 5.0 2.8 3.3Tax Regulations 4.3 3.9 4.4 2.5 1.1Crime and theft 0.9 3.0 3.1 1.3 2.6
Source: Global Competitiveness Report (2013): The World Bank

4 ECONOMIC POLICY RESEARCH CENTRE - EPRC
Tax Evasion, Informality and The Business Environment In Uganda
3. LITERATURE AND ANALYTICAL FRAMEWORK
3.1 Literature review
Faced with growing development financing needs, reducing donor aid and an inelastic tax system many countries in the developing world started to think of ways of collecting more domestic revenue. The major bottle-necks were the large un-taxed informal sec-tor and corruption in tax administration. The first steps towards improving tax systems were to institute reforms in tax administra-tion. In the case of Uganda, the creation of the semi-autonomous tax body, the Uganda Revenue Authority (URA) was the first step towards instituting tax reforms aimed at in-creasing tax yield (Fjeldstad 2005).
At the same time, in a bid to understand the sheer size of the informal sector, many scholars set out to estimate the size of the informal or underground economy. This was intended to understand tax evasion and initiate debate on how the informal sector can be taxed to reduce revenue losses (see for example, Chipeta 2002; Schneider 2002; Schneider et al 2010; Buehn & Schneider 2012). While such studies helped to under-stand the extent of tax evasion in the econo-my, they cannot explain the reasons behind the firms’ decisions to operate informally. This led to the popularity of firm level re-search into the determinants of informality.The importance of a good business cli-mate for firm performance has been well researched in the literature. Reinikka and Svensson (2002) provided early insights into the implications of inadequately supplied public goods (such as transport infrastruc-ture and electricity provision) that forms
part of the business environment in which firms operate. They show that firms signifi-cantly reduce investments in productive capacity when faced with poor provision of complementary public capital. Subsequent research has shown investment climate has implications for firm level productivity (Dol-lar et al 2002; Ingram et al 2007) and growth (Dollar et al 2003).
Dabla-Norris and Gradstein (2008) devel-oped a general equilibrium model where the strength of the legal and regulatory sys-tem serves to hinder operations in the infor-mal economy. They show that the quality of the legal and regulatory environment is the most important determinant of the level of activities in the informal sector, even more important than the prevailing tax policy and financial constraints.
By constructing a hostility business envi-ronment index, Sebigunda (2013) explored the link between the business climate and firm efficiency in the Democratic Repub-lic of Congo. They paradoxically show that business environment hostility significantly improves the efficiency of firms in the con-text of a war setting. This finding is consis-tent with the finding in the same paper that corruption improves firm efficiency in a post conflict setting.
The literature identifies corruption and brib-ery of government officials, as one of the im-portant determinants of firm performance and growth. The motives for corruption and bribery have now received much attention in the literature, with inconclusive evidence on the implications for firm performance. Employing Ugandan firm level data, Fisman and Svensson (2007) were able to show that corruption, captured as the propensity to
5ECONOMIC POLICY RESEARCH CENTRE - EPRC
Tax Evasion, Informality and The Business Environment In Uganda
pay bribes is negatively associated with firm growth. However, this finding is contrasted by Kasuga (2013) who shows that paying bribes and corruption generally reduces the bureaucratic red tape and improves produc-tivity. This implies that firms pay bribes to circumvent the adverse business environ-ment.
Intuitively, if the business environment is ameliorated, firms would invest more into productive capital. Therefore, it can easily be seen that corruption would reduce firm productivity to the extent that it crowds out productive investments. Indeed Dabla-Norris and Gradstein (2008) show that cor-ruption has a large effect on the tendency to operate informally for both small and large firms.
Benjamin and Mbaye (2010) used firm-level data from 900 formal and informal busi-nesses in three Western African countries of Benin, Burkina Faso and Senegal. They show that the emergence of the informal sector is aided by a lack of robust enforcement mechanisms. In addition they document significant productivity differences between the informal and formal sectors.
Ali et al (2013) examined the correlates of tax-compliance tendencies between four Af-rican countries of Kenya, Tanzania, Uganda and South Africa. Using binary logit models they showed that tax compliance tenden-cies are influenced by the strength of the le-gal system that is deterrent enough to make evasion unattractive. Moreover, compliance is also influenced by the citizen’s level of satisfaction with public service provision by the state. In addition ethnic sectarianism and the availability of information regard-ing taxation are all shown to be important
determinants of tax compliance behaviour.3.2 Analytical Framework
The analytical framework used in this paper is adopted from Dabla-Norris et al (2008) and is in the realm of a profit-maximising firm that uses labour, private capital and public capital in its production function as expressed below
( )GKLfay ii ,,= 1)
Such that 0' >f and 0" <f
Where L is the amount of labour employed, K is the private capital investment, G is pub-lic capital, and ia is the firm’s productivity from other sources. Labour earns a wage w and private investment earns a return r.
Firms expect Government to invest in the provision of a conducive business environ-ment or public capital that is complemen-tary to private capital. Such public capital may be in the form of provision of adequate supply of electricity or quality transport in-frastructure and is expected to reduce the cost of doing business and thus enable pri-vate firms to thrive.
I assume that governments can only provide the public good by imposing a taxation rate t on the firm’s output and labour. The total amount that Governments collect is equal to T such that for efficient provision of complimentary public capital G must equal to T or TG = . For simplicity, I assume that governments do not run deficits and there-fore G cannot exceed T. In reality however, Governments borrow and run deficits. Firms observe government’s commitment to pro-vide public good in period i and make a de-cision to operate formally or informally or

6 ECONOMIC POLICY RESEARCH CENTRE - EPRC
Tax Evasion, Informality and The Business Environment In Uganda
evade tax in the next period 1+i .
Specifically, firms choose to operate for-mally in period 1+i if their perceptions of government’s commitment to providing complementary capital are positive. Oth-erwise, firms will operate informally or will be unwilling to reveal their actual output. In this case, real output will be hidden so as to avoid a proportion of the taxes. Employees in the informal sector earn a wage w that is not taxed. Employees in the formal sector on the other hand earn a wage fw and pay a tax ft such that their net wage is ff tw − . This implies that employees choose to en-gage in formal employment if , that is if it makes economic sense to do so.
Likewise, firms engage in the formal sec-tor if they expect government to provide public complementary capital to at least a minimum level fg , otherwise firms operate informally or avoid paying taxes. However, operating formally is also costly since it in-volves a cost τ that is associated with meet-ing government regulatory requirements. If firms perceive the regulatory requirements as unnecessarily high, they will choose to operate informally.
Firms that operate in the formal sector earn a profit , while those that operate in the infor-mal sector earn a profit equivalent to
. The costs of meeting the regulatory requirements that may include filing tax returns can be a sig-nificant factor in ensuring that firms choose to operate in the informal sector as shown by Djankov et al (2002).
Until now, I have assumed that there are no risks or penalties to operating informally. In
reality, if firms hide output or under declare their tax obligations they face a probability,p , of being caught and punished (Galian and
Weinschelbaum, 2012; Dabla-Norris et al, 2008). For simplicity, I assume that if caught, firms are fined their full profits and workers do not receive their wages. It, therefore, fol-lows that the profits for firms operating in the informal sector can be expressed as:
, with probability p−1 2)
, with probability p 3)
Expressions 2) and 3) above imply that ex-pected profits for a firm operating informal-ly are given as:
4)
In reality however, firms may only partially operate informally and hide only a fraction of their output and labour demand. For many developing countries, especially in Sub Saharan Africa, it has been shown that many firms operate two or more books of accounts for tax evasion purposes (Benja-min and Mbaye 2012). If this is true, then the analytical framework and basic model will be extended, following Dabla-Norris et al (2008), to reflect situations where firms operate only partly informally.
Let the firm’s share of output that is report-ed for tax purposes be iγ such that the level of informal activity is iγ−1 . Let the cost of regulation in the formal sector be denoted τ as before and is positively related to the fraction of output the firm declares for tax purposes or the level of formality, , and the probability of detecting informal activity in firm i is related to its share )1( ip γ− . Firmi ’s expected profits are then expressed as:

7ECONOMIC POLICY RESEARCH CENTRE - EPRC
Tax Evasion, Informality and The Business Environment In Uganda
5)
Denoting the first expression of the right hand part of equation 5) above as a and the second part as b such that , then it is becomes clear that the decision to operate informally depends on whether
ba > , that is , must strictly be non-neg-ative. Each firm i chooses its desired level of informality iγ−1 after assessing the level of the strength of the legal environment that determines the probability that it will be caught or not.
Following the above analytical framework, I test the proposition that the efficiency of the legal environment is an important de-terminant of tax evasion. In addition, I test the proposition that firms that are con-strained by the inadequate complementary public capital are more likely to operate with a higher level of tax evasion than firms for whom complementary public capital is not perceived as a major constraint. . In this study, I look at public capital in terms of efficient access to electricity and the gen-eral business environment. This preposition is akin to the observation of Etzion (2012) who indicated that when a government fails to deliver the complimentary public capital that it should, it loses the legitimacy and this in turn may diminish the firms’ willingness to pay taxes. I extend the model to include bribery and both firm and industry level characteristics.
4. DATA AND ESTIMATION STRATEGY
4.1 The data
The study uses data from the 2006 World Bank Enterprise Surveys for Uganda. The data was collected in five districts namely; Kampala, Jinja, Mbale, Mbarara and Lira and involved 563 firms. The data contains infor-mation on Ugandan firms’ perceptions of the quality of Government provision of pub-lic services, the strength of the legal frame-work, bureaucratic red tape, corruption and bribery as well as other constraints in do-ing business. Most importantly, the survey has information on the tendency to operate informally. Specifically the survey question-naires have the following question that I use as a proxy for tax evasion: “What percent-age of total annual sales would you estimate a typical establishment in your sector of ac-tivity reports for tax purposes?”
Of equal importance, the survey asked ques-tions about the specific components of the business environment and on a scale of 1 -5 where 1 represents no obstacle and 5 rep-resents very severe obstacle, the business managers were required to indicate wheth-er the stated factors presented any obsta-cles to the operations of the establishment. The evaluated factors included: functioning of the courts; practices of competitors in the informal sector; corruption; macroeconom-ic instability; access to finance; inadequately educated workforce; tax administration; tax rates; transportation and electricity. The empirical analysis laid special emphasis on the effects of bribery, adequate provision of electricity and the functioning of the courts.

8 ECONOMIC POLICY RESEARCH CENTRE - EPRC
Tax Evasion, Informality and The Business Environment In Uganda
Table 2: Summary statistics of variables to be used in estimation
Variable names N Mean Standard deviation
Min Max
Firm evades some taxes (yes=1) 563 0.730 0.444 0 1Percentage of sales hidden for tax purposes (log)
547 2.912 1.889 0 4.615
Number of electricity outages in month (log) 533 2.403 0.435 1.098 3.433Monthly outages exceed mean level (yes=1) 563 0.515 0.500 0 1Courts are fair and impartial 559 2.308 0.913 1 4Courts are quick 562 2.076 0.861 1 4Courts are affordable 562 2.341 0.866 1 4Courts can enforce decisions 553 2.763 0.961 1 4Firm age (logarithm) 554 2.379 0.637 0.693 4.382Firm size (log number of employees) 563 2.696 1.001 1.099 8.294Manufacturing (yes=1) 563 0.545 0.498 0 1Retail and wholesale trade (yes=1) 563 0.216 0.412 1 1Level of domestic ownership (log) 563 3.938 1.583 0 4.615Presence of female owners 563 1.692 0. 618 1 2Manager’s education level in years 556 6.680 1.909 1 12Manager’s experience in years (log) 558 2.228 0.622 0.693 3.829Percentage level of exports (log) 563 0.245 0.882 0 4.615Exports - Dummy 563 0.080 0.271 0 1Business location – Kampala 563 0.801 0.399 0 1Business location – Jinja 563 0.053 0.225 0 1Business location – Mbale 563 0.043 0.202 0 1Business location – Mbarara 563 0.062 0.242 0 1Shares of informal payments intotal sales (log)
488 0.911 1.093 0 3.892
General constraint – electricity 563 4.440 0.979 1 5General constraint – transport 563 2.446 1.320 1 5General constraint - tax rates 563 3.597 1.202 1 5General constraint - tax administration 563 2.417 1.241 1 5General constraint– courts 563 1.355 0.763 1 5General constraint - skills 563 1.872 1.022 1 5General constraint – finance 563 3.310 1.376 1 5General constraint - macroeconomic factors 563 2.218 1.327 1 5General constraint – corruption 563 2.266 1.356 1 5General constraint - competition from informal businesses
563 2.827 1.411876 1 5
Source: Author calculations based on the 2006 World Bank Enterprise Surveys for Uganda

9ECONOMIC POLICY RESEARCH CENTRE - EPRC
Tax Evasion, Informality and The Business Environment In Uganda
Table 2 contains descriptive statistics of the variables of interest to this paper. It includes a measure of tax evasion – the proportion of sales kept off the books for tax purposes; the constraints in doing business including measures for bureaucratic corruption and bribery; as well as various firm level charac-teristics. The data indicates that more than 73 percent of all firms are engaged in some degree of tax evasion. The average firm ex-periences about 11 power outages in a typi-cal month.
In terms of the general business environ-ment constraints that firms face, on aver-age firms report that electricity availability and cost (37 percent), tax rates (16 percent), access to finance (12 percent), practices of competitors in the informal sector (7 per-cent) and transport infrastructure (5 per-cent) are the major obstacles. Other con-straints are reported with varying degrees of intensity as shown in appendix 4.
4.2 The estimation strategy
To estimate the determinants of tax evasion and informality among Ugandan firms, I es-timate equation 6 below:
6)
Where Evasion is the level of tax evasion for a particular firm measured as percentage of sales not reported for tax purposes. Courts is a measure of efficiency of the legal system, categorised as “fair and impartial”, “quick”, “affordable”, and “can enforce decisions”. Each of these four categories is measured on a scale of 1-4 where 1 represents strong-ly disagree and 4 represents strongly agree. The variable outage is a measure of the extent of electricity availability in a typical month and is treated as a dummy variable
in which a firm reports yes if it experienced electricity outages in excess of the monthly average. Bribery is the extent to which a firm makes informal payments to “have things done” and is measured as a share of infor-mal payments in total sales. V is a vector of firm level characteristics, W is a vector of in-dustry level characteristics, and Z is a vector of general constraints that firms face. iε is the stochastic error term that is assumed to be independently and identically distributed with zero mean and constant variance.
The dependent variable is the proportion of sales not reported for tax purposes. Other independent variables of interest included in the base equation include the strength and efficiency of the legal system as cap-tured by the functioning of the courts of law. The efficiency of the court system is captured by four variables that include the extent to which courts are fair, quick, af-fordable, and can enforce decisions. Gov-ernment public capital provision is captured by a dummy variable that equals 1 if the number of outages experienced by a firm in a typical month exceeds the mean value of number of outages reported in a month and zero otherwise. Another important variable is bureaucratic bribery. This is included be-cause bribes are in themselves taxes to the firm and therefore are likely to discourage official tax payments.
Other control variables are added to the base model separately and they include: the various firm characteristics that include firm age and size in terms of number of employees; firm manager/owner charac-teristics that include level of education and years of experience and the extent to which a business is owned by nationals (domestic ownership). The models include the square
10 ECONOMIC POLICY RESEARCH CENTRE - EPRC
Tax Evasion, Informality and The Business Environment In Uganda
terms of age and size to control for any non-linear relationships that may exist between informality, size and age.
I construct two dummy variables for manu-facturing and retail sectors to control for in-dustry effects and interpret these in relation to firms engaged in the rest of the sectors. In addition I control for geographical effects by constructing location dummy variables for Kampala, Jinja, Mbale and Mbarara and interpret them in relation to the one that was left out (Lira).
I employ two different methods of param-eter estimation that include Ordinary Least Squares (OLS); and maximum likelihood To-bit methods. The OLS estimations assume a linear relationship between tax evasion and the independent variables. I include the Tobit methods because the adopted mea-sure of tax evasion is censored at zero. Data shows that 28 percent of all the firms have a zero score for tax evasion. I believe this may cause bias in the OLS estimations, and this justifies my choice of the Tobit model. The OLS models are estimated with heteroske-dasticity robust standard errors. The models are later re-estimated using instrumental variable methods because I have sufficient reason to suspect that one of our key inde-pendent variables, bribery, is endogenous.
5. RESULTS AND DISCUSSION
In this section I present the estimated re-sults. I begin by presenting the results from the Ordinary Least Square estimations in table 3.
Model (1) represents the base equation. It includes measures of a quality legal envi-
ronment that is measured by four variables that include the extent to which: i) courts are fair; ii) courts act quickly; iii) courts can enforce decisions, and iv) courts are afford-able. I included a variable that controls for state public capital provision – a dummy variable for electricity outages. Whereas a variable that would represent the number of days reported each month that firms did not have electricity is a suitable indicator for electricity outages, it has a major limit that it would be bounded at 30 or 31 for firms that spent an entire month without electric-ity. This would lead to serious interpreta-tion problems. To circumvent this problem, I constructed a dummy variable that equals one if electricity outages exceed the mean monthly value and zero otherwise. In addi-tion, I include a variable that captures the extent of bureaucratic bribery. All regres-sions include location specific dummy vari-ables (not shown in results).
Results from the base model (1) largely confirm the analytical framework. Two of the four variables that capture the quality and efficiency of the legal framework are significant with the expected signs. These variables are: i) the extent to which courts are quick in resolving disputes and ii) the extent to which courts are affordable. This shows that the efficiency of the legal sys-tem is highly correlated to tax evasion and informality. In addition, results indicate that firms choose to operate informally in re-sponse to deficient public capital provision and bureaucratic bribery. According to mod-el 1) the biggest effect on tax evasion is due to bribery followed by the extent to which courts are perceived to be quick in resolving disputes.
Model (2) extends the base model by add-
11ECONOMIC POLICY RESEARCH CENTRE - EPRC
Tax Evasion, Informality and The Business Environment In Uganda
ing two dummy variables for manufacturing and retail and wholesale trade. These dum-mies were constructed in relation to the rest of the businesses. Results from this model show that Ugandan firms that are retail in nature tend towards informality than their counterparts that are not. The coefficient for retail and wholesale trade is positive and significant implying that firms engaged in this trade tend to be more informal and evade more taxes.
Model (3) includes two more firm level vari-ables that include age and size. Age is the number of years a firm has been in existence and size is the total number of employees. Results from this model suggest that while informality is positively associated with firm age, larger firms are less likely to operate in-formally.
Model (4) includes two variables that cap-ture the firm manager’s characteristics in-cluding education and years of experience. The model also includes a variable that cap-tures the extent of domestic ownership. Re-sults show that of three additional variables, only manager’s level of experience matters for tax evasion and informality. Surprisingly more experience is associated with bigger levels of firm-level tax evasion.
Models (5) and (6) include some business environment constraints of relevance to Ugandan firms. These include transport, tax administration, skills, finance, macroeco-nomic, and competition constraints. The business environment constraints are mea-sured on the scale 1–5 with 5 representing a very severe obstacle and 1 representing no obstacle. In addition, model (6) tests the existence of non-linear relationships be-tween tax evasion, firm age and firm size.
Results show that transport constraints, in-adequately skilled workforce, as well as con-straints in the macroeconomic environment are positively associated with higher levels of informality and tax evasion. In addition, competition from the informal sectors and tax administration obstacles are negatively associated with tax evasion and informality. The existence of non-linear relationships in firm age and size was tested by the inclusion of their respective square terms in model (6). The square of age is not statistically sig-nificant but the square of firm size is signifi-cant, albeit weakly at the 10 percent level, indicating the possible existence of a non-linear relationship between firm size and tax evasion. The full results for all the models are expressed in table (3) below:
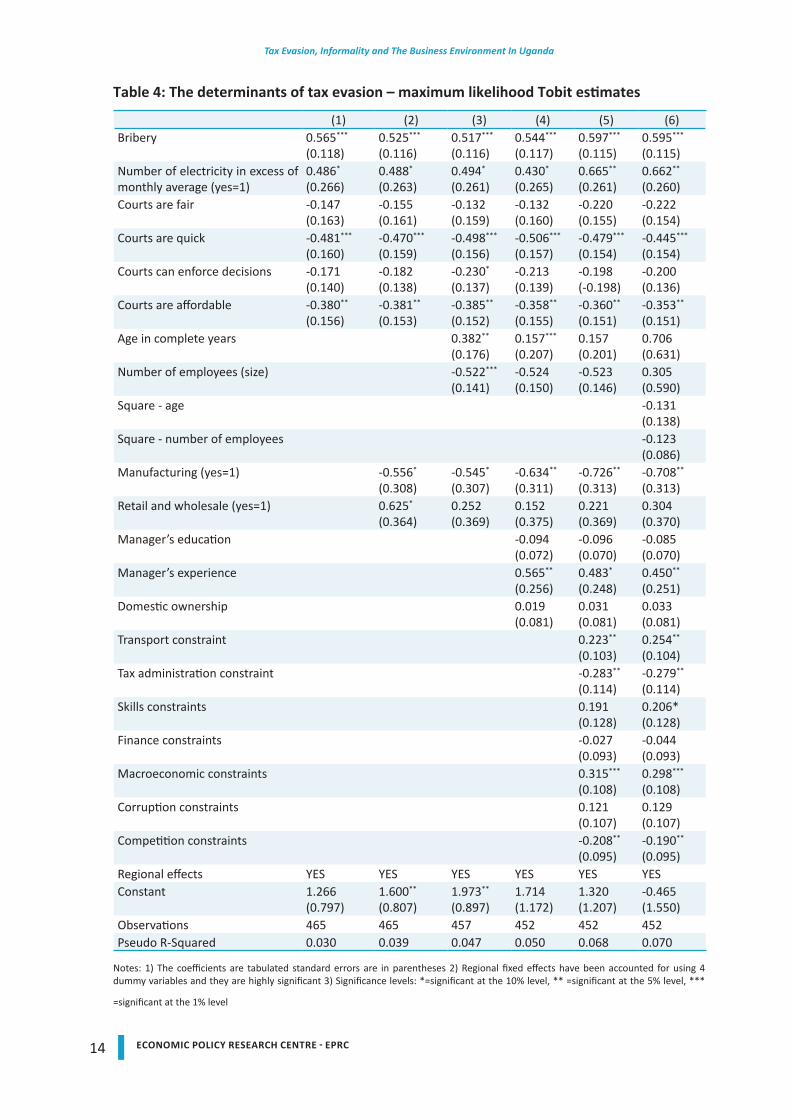
Since the values of the dependent variable – the proportion of annual sales not reported for tax purposes has many values that are zero (28 percent of all firms) then OLS esti-mates may be biased. For this reason there-fore, models were re-estimated using the maximum likelihood Tobit procedures. This estimation strategy corrects for any biases caused by the concentration of variables at the lower limit. The results (table 4) are largely unchanged except that the coef-ficients on bribery and indeed most other variables are bigger implying that OLS coef-ficients were underestimated.

12 ECONOMIC POLICY RESEARCH CENTRE - EPRC
Tax Evasion, Informality and The Business Environment In Uganda
Table 3: The determinants of tax evasion – Ordinary Least Square estimates
(1) (2) (3) (4) (5) (6)Bribery 0.399***
(0.070)0.377***
(0.071)0.380***
(0.071)0.401***
(0.071)0.439***
(0.071)0.442***
(0.071)Dummy - electricity outages in excess of monthly average
0.293*
(0.179)0.296*
(0.178)0.287*
(0.177)0.244(0.181)
0.398**
(0.174)0.397**
(0.174)Courts are fair -0.099
(0.098)-0.102(0.097)
-0.089(0.098)
-0.088(0.098)
-0.148(-0.148)
-0.151(0.098)
Courts are quick -0.345***
(0.100)-0.338***
(0.100)-0.354***
(0.098)-0.362***
(0.098)-0 .342 *** (0.095)
-0.319***
(0.096)Courts can enforce decisions -0.126
(0.089)-0.132(0.087)
-0.167*
(0.087)-0.153*
(0.089)-0.142(0.089)
-0.144*
(0.089)Courts are affordable -0.282***
(0.096)-0.282***
(0.095)-0.278***
(0.094)-0.254***
(0.097)-0.262***
(0.098)-0.256***
(0.098)Age in complete years 0.289**
(0.121)0.134(0.149)
0.136(0.149)
0.551(0.479)
Number of employees (size) -0.320***
(0.090)-0.317***
(0.101)-0.324(0.098)
0.160(0.321)
Square - age -0.100(0.102)
Square - number of employees -0.070*
(0.042)Manufacturing (yes=1) -0.330
(0.210)-0.340*
(0.208)-0.397*
(0.214)-0.463**
(0.214)-0.445**
(0.217)Retail and wholesale (yes=1) 0.375*
(0.231)0.152(0.235)
0.095(0.235)
0.143(0.240)
0.202(0.242)
Manager’s education -0.062(0.048)
-0.062(0.047)
-0.053(0.047)
Manager’s experience 0.374*
(0.202)0.324*
(0.198)0.304*(0.204)
Domestic ownership 0.017(0.058)
0.026(0.059)
0.028(0.059)
Transport constraint 0.161**
(0.076)0 . 1 8 3 * * (0.077)
Tax administration constraint -0.192**
(0.078)-0.188**
(0.078)Skills constraints 0.115
(0.076)0.126*
(0.076)Finance constraints -0.019
(0.064)-0.031(0.065)
Macroeconomic constraints 0.224***
(0.076)0.210***
(0.077)Corruption constraints 0.063
(0.071)0.068(0.072)
Competition constraints -0.159***
(0.062)-0.147***
(0.062)Regional effects YES YES YES YES YES YESConstant 1.822***
(0.479)2.010***
(0.491)2.112***
(0.567)1.881**
(0.777)1.729**
(0.802)0.557(0.997)
Observations 465 465 457 452 452 452R-Squared 0.126 0.149 0.176 0.188 0.247 0.252
Notes: 1) The coefficients are tabulated heteroskedasticity robust standard errors are in parentheses 2) Regional fixed effects have been accounted for using 4 dummy variables and they are highly significant 3) Significance levels: *= significant at the 10% level, ** = significant
at the 5% level, *** =significant at the 1% level

13ECONOMIC POLICY RESEARCH CENTRE - EPRC
Tax Evasion, Informality and The Business Environment In Uganda
The maximum likelihood Tobit estimations (table 4) indicate that bribery has a large and highly statistically significant effect on tax evasion and informality. On average, a one percent change in the proportion of unofficial payments results in a 0.5 – 0.6 percentage increase in tax evasion. Just like in the OLS estimations, the legal environment plays a significant role in explaining tax evasion and informality. In particular, the extent to which courts are perceived to be quick and affordable has implications for tax evasion. This is consistent with our theoretical framework.
In addition, results show that tax evasion is correlated with inadequate supply of public capital. The coefficient of the dummy vari-able for electricity outages in excess of the monthly mean is large and statistically sig-nificant in all the models. This finding could point to the fact that firms that face elec-tricity challenges will most likely invest in own electricity generation at the expense of productive investments and therefore do not have the incentive to pay taxes. Reinik-ka and Svensson (2002) provide a detailed discussion on the effects of inadequately supplied public capital in the context of Ugandan firms. In addition, the coefficient on transport as an obstacle to business op-eration is positive and significant indicating that firms that face the most severe trans-port bottlenecks are more likely to hide out-put and so evade taxes. This may be true if bad roads, for example, necessitate firms to replace motor vehicle parts more frequently and this eats into their profits and capital.Firm characteristics that include firm age and size are also associated with tax evasion. In particular, older firms are associated with increased tax evasion while bigger firms are associated with less tax evasion. An increase
of a firm’s age by one percent increases tax evasion by between 0.15 – 0.30 percentage points. However, I failed to confirm the ex-istence of a nonlinear relationship between tax evasion, firm age and the number of em-ployees.
Results also reveal that tax evasion increas-es with manager’s experience. The man-ager’s level of education does not seem to matter for tax evasion. Firms in the retail and wholesale sectors tend to be associ-ated with more tax evasion, while firms in the manufacturing sector tend to evade less taxes in relation to the rest of the sector. Firm characteristics including firm age and size are shown to be highly correlated with the tendency to evade taxes and to operate informally. In particular young firms learn to evade taxes as they grow older. Bigger firms that employ more people are less likely to operate informally and evade taxes.
Finally, various business constraints have implications for tax evasion and informal-ity. In particular, firms tend to operate at a bigger level of informality when faced with tougher transport, macroeconomic, inad-equately skilled manpower challenges.
Surprisingly, results show that firms operate more formally when faced with tax adminis-tration and competition challenges. I cannot find a plausible explanation to this finding, but I conclude that it could possibly be due to data challenges.
14 ECONOMIC POLICY RESEARCH CENTRE - EPRC
Tax Evasion, Informality and The Business Environment In Uganda
Table 4: The determinants of tax evasion – maximum likelihood Tobit estimates
(1) (2) (3) (4) (5) (6)Bribery 0.565***
(0.118)0.525***
(0.116)0.517***
(0.116)0.544***
(0.117)0.597***
(0.115)0.595***
(0.115)Number of electricity in excess of monthly average (yes=1)
0.486*
(0.266)0.488*
(0.263)0.494*
(0.261)0.430*
(0.265)0.665**
(0.261)0.662**
(0.260)Courts are fair -0.147
(0.163)-0.155(0.161)
-0.132(0.159)
-0.132(0.160)
-0.220(0.155)
-0.222(0.154)
Courts are quick -0.481***
(0.160)-0.470***
(0.159)-0.498***
(0.156)-0.506***
(0.157)-0.479***
(0.154)-0.445***
(0.154)Courts can enforce decisions -0.171
(0.140)-0.182(0.138)
-0.230*
(0.137)-0.213(0.139)
-0.198(-0.198)
-0.200(0.136)
Courts are affordable -0.380**
(0.156)-0.381**
(0.153)-0.385**
(0.152)-0.358**
(0.155)-0.360**
(0.151)-0.353**
(0.151)Age in complete years 0.382**
(0.176)0.157***
(0.207)0.157(0.201)
0.706(0.631)
Number of employees (size) -0.522***
(0.141)-0.524(0.150)
-0.523(0.146)
0.305(0.590)
Square - age -0.131(0.138)
Square - number of employees -0.123(0.086)
Manufacturing (yes=1) -0.556*
(0.308)-0.545*
(0.307)-0.634**
(0.311)-0.726**
(0.313)-0.708**
(0.313)Retail and wholesale (yes=1) 0.625*
(0.364)0.252(0.369)
0.152(0.375)
0.221(0.369)
0.304(0.370)
Manager’s education -0.094(0.072)
-0.096(0.070)
-0.085(0.070)
Manager’s experience 0.565**
(0.256)0.483*
(0.248)0.450**
(0.251)Domestic ownership 0.019
(0.081)0.031(0.081)
0.033(0.081)
Transport constraint 0.223**
(0.103)0.254**
(0.104)Tax administration constraint -0.283**
(0.114)-0.279**
(0.114)Skills constraints 0.191
(0.128)0.206*(0.128)
Finance constraints -0.027(0.093)
-0.044(0.093)
Macroeconomic constraints 0.315***
(0.108)0.298***
(0.108)Corruption constraints 0.121
(0.107)0.129(0.107)
Competition constraints -0.208**
(0.095)-0.190**
(0.095)Regional effects YES YES YES YES YES YESConstant 1.266
(0.797)1.600**
(0.807)1.973**
(0.897)1.714(1.172)
1.320(1.207)
-0.465(1.550)
Observations 465 465 457 452 452 452Pseudo R-Squared 0.030 0.039 0.047 0.050 0.068 0.070
Notes: 1) The coefficients are tabulated standard errors are in parentheses 2) Regional fixed effects have been accounted for using 4 dummy variables and they are highly significant 3) Significance levels: *=significant at the 10% level, ** =significant at the 5% level, ***
=significant at the 1% level
15ECONOMIC POLICY RESEARCH CENTRE - EPRC
Tax Evasion, Informality and The Business Environment In Uganda
So far the estimation procedures have as-sumed that the explanatory variables are purely exogenous. However we have suf-ficient reasons to suspect that one of our key variables, bribery of government of-ficials, is endogenous. First, it is within a firm’s discretion to decide on how much to pay out in unofficial payments or bribes to public officials. Second, there may exist two way relationships between tax evasion and bribe payments. On the one hand, firms that evade taxes may pay bribes to officials so as to cover up or not get reported to the authorities. On the other hand, firms may evade taxes if officials ask for informal pay-ments “to get things done quickly” and in this case the informal payment is perceived as a tax on the firm. If any of the two condi-tions above is correct, then results in tables 4) and 5) may be biased. Therefore OLS and Tobit estimates will not be valid and cannot infer on the direction of causality.
For these reasons I re-estimate the models in tables 3) and 4) using the instrumental variable methods controlling for the pos-sible endogeneity bias due in bribery. The paucity of the data makes it difficult to iden-tify meaningful instruments for bribery. However, I relied on earlier work by Kasuga (2013) and intuition to identify one plausi-ble instrument – the interaction between a firm’s ‘ability to pay’ and corruption as an obstacle in doing business. Ability to pay is constructed as the total cost of labour, in-cluding wages, salaries, bonuses and social payments adjusted for the level of annual sales. Adjusting for sales allows me to con-struct a variable that is comparable across both small and large firms.
Establishing a valid causal relationship be-tween tax evasion and bribery requires that
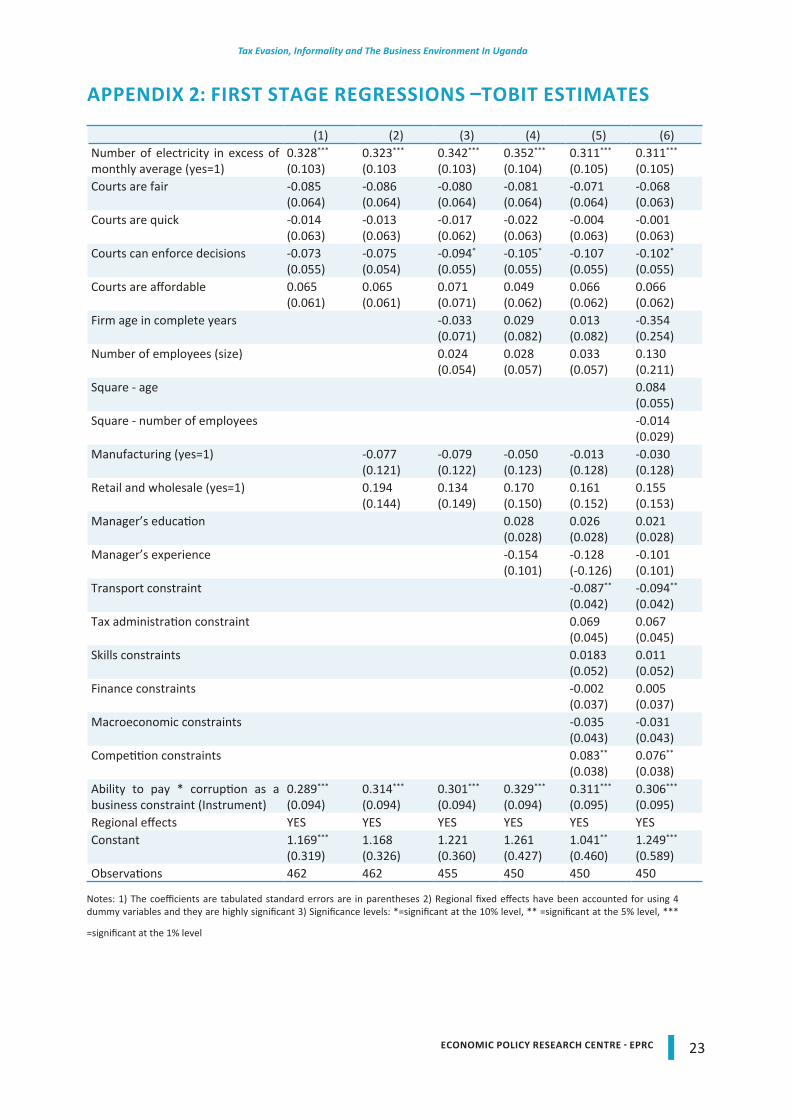
the constructed instrumental variable satis-fies two conditions. The first is that the in-strument must be correlated with bribery. The second condition is that the instrument should affect the tax evasion only via its ef-fect on bribery. These two conditions mean that the instrument must be correlated with bribery but not correlated with tax evasion. It is easy to see from the first stage regres-sions (Appendices 1 and 2) that the first con-dition is satisfied. The second condition is harder to explain but I know that firms only pay bribes if and only if they have the ability to do so. Otherwise they do not. Whereas ability to pay bribes affects bribery, it may not explain tax evasion. Moreover, the other component of the instrument – corruption as a business constraint - was included in all the OLS and Tobit models in tables 3) and 4) and its effect on tax evasion was shown to be quantitatively small and statistically not significant. I am, therefore, comfortable with the choice of instrument. First, I pres-ent the OLS IV results in table 5 below:

16 ECONOMIC POLICY RESEARCH CENTRE - EPRC
Tax Evasion, Informality and The Business Environment In Uganda
Table 5: The determinants of tax evasion – IV OLS estimates
(1) (2) (3) (4) (5) (6)Bribery 1.395**
(0.640)1.538**
(0.700)1.467**
(0.723)1.222**
(0.610)1.163**
(0.546)1.161**
(0.554)Number of electricity in excess of monthly average (yes=1)
0.019(0.298)
0.070(0.303)
0.085(0.316)
0.040(0.278)
0.192(0.256)
0.193(0.257)
Courts are fair -0.017(0.140)
-0.002(0.141)
-0.005(0.137)
-0.025(0.123)
-0.107(0.121)
-0.112(0.120)
Courts are quick -0.368***
(0.125)-0.366***
(0.129)-0.380***
(0.126)0.384***
(0.116)-0.341***
(0.113)-0.316***
(0.113)Courts can enforce decisions -0.038
(0.119)-0.030(0.134)
-0.049(0.141)
-0.057(0.129)
-0.064(0.118)
-0.071(0.116)
Courts are affordable -0.357***
(0.128)-0.367***
(0.138)-0.361***
(0.138)-0.302***
(0.122)-0.314***
(0.118)-0.308***
(0.118)Age in complete years 0.300**
(0.154)0.110(0.168)
0.144(0.146)
0.847*
(0.494)Number of employees (size) -0.342***
(0.110)-0.342***
(0.113)-0.357***
(0.103)0.020(0.384)
Square - age -0.166(0.110)
Square - number of employees -0.054(0.053)
Manufacturing (yes=1) -0.244(0.247)
-0.246(0.241)
-0.337(0.232)
-0.424*
(0.228)-0.394*
(0.228)Retail and wholesale (yes=1) 0.211
(0.325)0.058(0.307)
0.003(0.287)
0.089(0.276)
0.148(0.276)
Manager’s education -0.083(0.055)
-0.078(0.051)
-0.066(0.050)
Manager’s experience 0.460**
(0.230)0.384**
(0.186)0.343*
(0.184)Transport constraint 0.234***
(0.089)0.259***
(0.092)Tax administration constraint -0.239***
(0.090)-0.232**
(0.090)Skills constraints 0.121
(0.093)0.139(0.093)
Finance constraints -0.027(0.066)
-0.044(0.067)
Macroeconomic constraints 0.245***
(0.077)0.230***
(0.077)Competition constraints -0.210**
(0.084)-0.191**
(0.082)Regional effects YES YES YES YES YES YESConstant 0.358
(1.113)0.264(1.207)
0.491(1.312)
0.727(1.243)
1.101(1.053)
-0.155(1.302)
Observations 462 462 455 450 450 450F-statistics (1st stage instrument) 12.274 13.162 12.192 13.952 13.113 12.729
Notes: 1) The coefficients are tabulated standard errors are in parentheses 2) Regional fixed effects have been accounted for using 4 dummy variables and they are highly significant 3) Significance levels: *=significant at the 10% level, ** =significant at the 5% level, ***
=significant at the 1% level, robust standard errors have been corrected for predicted values
17ECONOMIC POLICY RESEARCH CENTRE - EPRC
Tax Evasion, Informality and The Business Environment In Uganda
Results from the instrumental variable OLS estimations indicate that the coefficients for bribery are all highly significant and larger that the ordinary OLS coefficients. This im-plies that the OLS underestimates the true coefficients. However, the coefficient of the dummy variable that captures electricity outages is not only quantitatively smaller but also statistically insignificant implying that the impact of electricity outages on tax evasion might have been over estimated in the earlier models.
The credibility of the court system, particu-larly the extent to which courts are per-ceived as “quick” and “affordable” reduces tax evasion. The coefficients for “quick” and “affordable” are positive and statisti-cally different from zero implying that firms evade taxes if they perceive the legal system as weak and unable to quickly resolve dis-putes or are not affordable. This is because when the legal system is weak firms can bribe their way around and get away with it.Results further indicate that firm level char-acteristics are associated with tax evasion. In particular, bigger firms are less likely to evade tax while older firms are shown to be associated with higher tax evasion. I howev-er fail to confirm the existence of non-linear relationships firm age, size and tax evasion. The coefficients for the squares terms for age and size are not statistically different from zero in table 4 model 6.
Firms in the manufacturing sector are shown to be less likely to evade tax in relation to firms engaged in the rest of the businesses. In addition, our results show that the man-ager’s level of experience is associated with tax evasion. Manager’s education level does not seem to matter for tax evasion.
Of equal importance to this study, I show that the business environment has impli-cations for tax evasion. In particular, when the transport systems are bad and the mac-roeconomic environment is unfavourable, businesses react by evading taxes. The co-efficients for tax administration and macro-economic constraints are positive and sta-tistically significant from the zero implying that tougher business environment condi-tions lead to more tax evasion.
Finally, the instrumental variable Tobit re-sults in table 6) are similar to the OLS instru-mental variable estimates in table 5. The only difference is that the IV-tobit model estimates are larger indicating that IV-OLS model coefficients are under estimated.

18 ECONOMIC POLICY RESEARCH CENTRE - EPRC
Tax Evasion, Informality and The Business Environment In Uganda
Table 6: The determinants of tax evasion – IV TOBIT estimates
(1) (2) (3) (4) (5) (6)Bribery 1.926**
(0.883)2.112**
(0.847)2.026**
(0.865)1.826**
(0.797)1.605**
(0.755)1.570**
(0.763)Number of electricity in excess of monthly average (yes=1)
0.011(0.411)
0.074(0.406)
0.102(0.416)
0.020(0.386)
0.293(0.354)
0.302(0.353)
Courts are fair -0.006(0.191)
-0.0113(0.196)
-0.005(0.191)
-0.004(0.183)
-0.137(0.167)
-0.144(0.165)
Courts are quick -0.491***
(0.173)-0.491***
(0.179)-0.510***
(0.174)-0.538***
(0.168)-0.452***
(0.156)-0.415***
(0.155)Courts can enforce decisions -0.063
(0.165)-0.056(0.169)
-.0701(0.176)
-0.076(0.167)
-0.089(0.162)
-0.100(0.159)
Courts are affordable -0.471***
(0.176)-0.480***
(0.180)-0.478***
(0.178)-0.403***
(0.167)-0.420***
(0.162)-0.411***
(0.161)Age in complete years 0.408**
(0.195)0.150(0.221)
0.187(0.203)
1.184*
(0.711)Number of employees (size) -0.486***
(0.154)-0.571***
(0.157)-0.507***
(0.147)0.277(0.601)
Square - age -0.240(0.159)
Square - number of employees -0.123(0.087)
Manufacturing (yes=1) -0.355(0.349)
-0.343(0.344)
-0.382(0.331)
-0.586*
(0.316)-0.557*
(0.315)Retail and wholesale (yes=1) 0.263
(0.428)0.063(0.415)
0.064(0.397)
0.109(0.379)
0.197(0.3778)
Manager’s education -0.113(0.077)
-0.099(0.071)
-0.084(0.070)
Manager’s experience 0.628**
(0.276)0.539**
(0.260)0.502*
(0.262)Transport constraint 0.323***
(0.124)0.367***
(0.129)Tax administration constraint -0.330***
(0.125)-0.311**
(0.126)Skills constraints 0.171
(0.128)0.180(0.129)
Finance constraints -0.051(0.091)
-0.070(0.094)
Macroeconomic constraints 0.335***
(0.108)0.314***
(0.108)Competition constraints -0.275**
(0.116 -0.242(0.113)
Regional effects YES YES YES YES YES YESConstant -0.732
(1.544) -0.835(1.543)
-0.491(1.626)
0.041(1.538)
0.307(1.465)
-2.608(1.873)
Observations 462 462 462 450 450 543
Notes: 1) The coefficients are tabulated standard errors are in parentheses 2) Regional fixed effects have been accounted for using 4 dummy variables and they are highly significant 3) Significance levels: *=significant at the 10% level, ** =significant at the 5% level, ***
=significant at the 1% level, robust standard errors have been corrected for predicted values

19ECONOMIC POLICY RESEARCH CENTRE - EPRC
Tax Evasion, Informality and The Business Environment In Uganda
6. CONCLUSIONS AND POLICY RECOMMENDATION
Using a rich 2006 World Bank data set on a cross section of Ugandan firms, I examine the causes of tax evasion. In particular, I ex-amine whether the quality of the legal en-vironment, bureaucratic bribery, provision of public goods that are complimentary to private investments, and the business envi-ronment in general are associated with tax evasion. I employ both ordinary least square and maximum likelihood Tobit methods to estimate the effect of the business environ-ment on tax evasion.
I address the potential endogeneity con-cerns associated with bribery by construct-ing an instrument as the interaction be-tween the firm’s ability to pay and corrup-tion as an obstacle in doing business. Abil-ity to pay is constructed as the total cost of labour, including wages, salaries, bonuses and social payments adjusted for the level of annual sales.
Results indicate that: the effectiveness of the court system, bureaucratic bribery, in-sufficient provision of complementary pub-lic capital such as electricity and transport infrastructure as well as an adverse business environment are associated with tax eva-sion. In addition, large firms are less likely to evade taxes. Moreover, tax evasion is much less concentrated in manufacturing firms as compared to firms in the retail and whole-sale business sector.
Results have implications for policy and con-tribute to the growing strand of literature on the determinants of tax evasion and in-formality in Sub Saharan Africa. In particu-
lar, the government should consider taking decisive steps to deal with corruption and bureaucratic bribery, provide public capital such as transport infrastructure and elec-tricity that are complementary to private capital and strengthen the legal environ-ment. In addition, various interventions di-rected towards ameliorating the business environment, and reducing the cost of doing business will reduce tax evasion.
REFERENCES
African Development Bank Group (2010) Do-mestic Resource Mobilistion for Pov-erty Reduction in East Africa: Uganda Case Study, Available at http://www.afdb.org/fileadmin/uploads/afdb/Documents/Project-and-Operations/Uganda%20case%20study%20final.pdf
Ali, M., Fjeldstad, O.H., Sjursen, I.H. (2013) ‘Factors affecting tax compliance at-titude in Africa: Evidence from Kenya, Tanzania, Uganda and South Africa’ Chr. Michelsen Institute Bergen, Nor-way. Paper prepared for Centre for the Study of African Economies 2013 Conference on Economic Develop-ment in Africa.
Benjamin, N.C., Mbaye, A.A. (2012), ‘The informal sector, productivity, and en-forcement in West Africa: a firm level analysis’, Review of Development Eco-nomics, 16:664-680
Buehn, A., & Schneider, F. (2012) ‘Shadow economies around the world: novel insights, accepted knowledge, and new estimates’, International Tax and Public Finance, 19:139-171
Chipeta, C. (2002) ‘The second economy and tax yield in Malawi’, African Economic Research Consortium, AERC Research

20 ECONOMIC POLICY RESEARCH CENTRE - EPRC
Tax Evasion, Informality and The Business Environment In Uganda
Paper 113, NairobiDabla-Norris, E., GradStein, M., and
Inchauste, G. (2008) ‘What causes firms to hide output? The determi-nants of Informality’, Journal of Devel-opment Economics, 85:1-27
De Soto, H., (1989). The other path. Harper & Row, New York.
Djankov, S., Lieberman, I., Mukherjee, J., and Nenova, T. (2002) ‘Going Informal: Benefits and Costs’ in Belev, B. (ed.), The informal economy in the EU ac-cession countries: Size, Scope, Trends and Challenges to the process of EU enlargement. Centre for the Study of Democracy
Dollar, D., Iarossi, G., and Mengistae, T. (2002) ‘Investment Climate and Eco-nomic performance: Some Firm Level Evidence from India’, Center for Re-search on Economic Development and Policy Reform working paper no. 143
Dollar, D., Hallward-Driemeier, M. and Men-gistae, T. (2003) ‘Investment Climate and Firm Performance in Developing Economies’, World Bank, Develop-ment Research Group
Etzioni, A. (2012) ‘The Domestic Sources of Global Adhocracy’, Social Change Re-view, 2:99-124
Fisman, R. and Svensson, J. (2007) ‘Are cor-ruption and taxation really harmful to growth? Firm level evidence’, Journal of Development Economics, 83: 63–75
Fjeldstad, O.H (2005) ‘Corruption in tax ad-ministration: Lessons from institution-al reforms in Uganda’, Chr. Michelsen Institute Working papers, N-5892 Ber-gen, Norway, www.cmi.no/publica-tions
Galiani, S. and Weinschelbaum, F. (2012) ‘Modeling Informality Formally: Households and Firms’, Economic In-
quiry, 50:821-838Gauthiera,B. and Reinikka, R. (2006) ‘Shift-
ing Tax Burdens through Exemptions and Evasion: an Empirical Investiga-tion of Uganda’, Journal of African Economies, 15:373–398
Ingram, M., Ramachandran, V., and Desai, V. (2007), ‘Why do firms choose to be in-formal? Evidence from enterprise sur-veys in Africa’, RPED paper ; no. 134. Washington D.C. - The Worldbank. http://documents.worldbank.org/curated/en/2007/09/8907056/firms-choose-informal-evidence-enterprise-surveys-africa
Ishengoma, E. K., and Kappel, R. (2011) ‘Business Environment and Growth Potential of Micro and Small Manufac-turing Enterprises in Uganda’, African Development Review, 23: 352–365
Kasuga, H. (2013) ‘Why do firms pay bribes? Firm level evidence from the Cambo-dian garment industry’, Journal of In-ternational Development, 25:276-292
Loayza, N. (1996) ‘The economics of the informal sector: a simple model and some empirical evidence from Latin America’, Carnegie–Rochester Confer-ence Series on Public Policy 45:129–162
Matovu, J.M. (2010) ‘Domestic Resource Mobilization in Sub-Saharan Africa: The Case of Uganda’, The North-South Institute
Mawejje, J. (2013) ‘Donor Aid Cuts, Kenya Elections Affect Uganda Business Cli-mate’, Economic Policy Research Cen-tre, The Uganda Business Climate In-dex, Issue 3, http://www.eprc.or.ug/pdf_files/Business%20Climate%20Index%20Issue%203.pdf
Muwonge, A., Obwona, M., and Namb-waayo. V. (2007) ‘Enhancing the con-

21ECONOMIC POLICY RESEARCH CENTRE - EPRC
Tax Evasion, Informality and The Business Environment In Uganda
tributions of the informal sector to na-tional development; the case of Ugan-da’, Economic Policy Research Centre, Occasional paper No. 33
Private Sector Foundation Uganda (PSFU) (2012) ‘Private Sector Platform for Ac-tion: A synopsis of Private sector key growth concerns and recommenda-tions for policy reform’
Reinikka, R. and Svensson, J (2002), ‘Coping with poor public capital’, Journal of development economics 69:51-69
Schneider, F., (2006) ‘Shadow economies and corruption all over the world: what do we really know?’, CESifo Working Paper No. 1806
Schneider, F., Buehn, A., and Montene-gro, C. E. (2010) ‘New Estimates for the Shadow Economies all over the World’, International Economic Jour-nal, 24: 443-461
Sebigunda, E.N (2013) ‘How does invest-ment climate and business environ-ment impact firm efficiency in a post conflict setting?’, Evidence from Dem-ocratic Republic of Congo’, Interna-tional Journal of Business and Man-agement, 8:169-184
Ssenoga, E., Matovu J.M., and Twimukye, E. (2009), ‘Tax Evasion and Widening the Tax Base in Uganda’, Economic Policy Research Centre, Research Series No. 63
Tax Justice Network-Africa and Action Aid International (2012) ‘Tax competition in East Africa: A race to the bottom?’
World Bank (2013) ‘Africa Competitiveness Report 2013’, The World Economic Forum, Geneva Switzerland

22 ECONOMIC POLICY RESEARCH CENTRE - EPRC
Tax Evasion, Informality and The Business Environment In Uganda
APPENDIX 1: FIRST STAGE REGRESSIONS – ORDINARY LEAST SQUARE (OLS) ESTIMATES
(1) (2) (3) (4) (5) (6)Number of electricity in excess of monthly average (yes=1)
0.328***
(0.108)0.323***
(0.108)0.342***
(0.108)0.352***
(0.108)0.308***
(0.108)0.311***
(0.108)Courts are fair -0.085
(0.067)-0.0863(0.067)
-0.081(0.067)
-0.080(0.0667)
-0.074(0.065)
0.068(0.065)
Courts are quick -0.014(0.066)
-0.014(0.065)
-0.017(0.066)
-0.022(0.067)
-0.004(0.065)
-0.001(0.065)
Courts can enforce decisions -0.073(0.057)
-0.075(0.057)
-0.094(0.058)
-0.105*
(0.058)-0.101(0.057)
-0.102*
(0.057)Courts are affordable 0.065
(0.067)0.066(0.066)
0.071(0.067)
0.049(0.068)
0.061(0.064)
0.066(0.064)
Firm age in complete years -0.034(0.073)
0.029(0.084)
0.005(0.084)
-0.354(0.261)
Number of employees (size) 0.024(0.054)
0.028(0.059)
0.042(0.059)
0.130(0.217)
Square - age 0.084(0.057)
Square - number of employees -0.014(0.030)
Manufacturing (yes=1) -0.077(0.118)
-0.079(0.121)
-0.050(0.123)
-0.016(0.131)
-0.030(0.132)
Retail and wholesale (yes=1) 0.194(0.153)
0.134(0.156)
0.170(0.1589)
0.158(0.156)
0.155(0.157)
Manager’s education 0.028(0.0308)
0.032(0.029)
0.021(0.029)
Manager’s experience -0.154(0.097)
-0.116(0.103)
-0.101(0.104)
Domestic ownership 0.040(0.033)
0.038(0.032)
Transport constraint -0.083*
(0.043)-0.093(0.043)
Tax administration constraint 0.072(0.046)
0.067(0.046)
Skills constraints 0.018(0.053)
0.011(0.054)
Finance constraints -0.011(0.039)
0.005(0.038)
Macroeconomic constraints -0.039(0.044)
-0.031(0.045)
Competition constraints 0.316(0.098)
0.076*
(0.039)Ability to pay * corruption as a business constraint (IV)
0.289***
(0.098)0.314***
(0.099)0.301***
(0.099)0.329***
(0.099)0.316***
(0.098)0.306***(0.098)
Regional effects YES YES YES YES YES YESConstant 1.169***
(0.289)1.168***
(0.303)1.221***
(0.357)1.261***
(0.430)0.841*
(0.501)1.249**
(0.606Observations 462 462 455 450 450 450Pseudo R-Squared 0.087 0.092 0.089 0.096 0.107 0.107
Notes: 1) The coefficients are tabulated standard errors are in parentheses 2) Regional fixed effects have been accounted for using 4 dummy variables and they are highly significant 3) Significance levels: *=significant at the 10% level, ** =significant at the 5% level, ***
=significant at the 1% level
23ECONOMIC POLICY RESEARCH CENTRE - EPRC
Tax Evasion, Informality and The Business Environment In Uganda
APPENDIX 2: FIRST STAGE REGRESSIONS –TOBIT ESTIMATES
(1) (2) (3) (4) (5) (6)Number of electricity in excess of monthly average (yes=1)
0.328***
(0.103)0.323***
(0.1030.342***
(0.103)0.352***
(0.104)0.311***
(0.105)0.311***
(0.105)Courts are fair -0.085
(0.064)-0.086(0.064)
-0.080(0.064)
-0.081(0.064)
-0.071(0.064)
-0.068(0.063)
Courts are quick -0.014(0.063)
-0.013(0.063)
-0.017(0.062)
-0.022(0.063)
-0.004(0.063)
-0.001(0.063)
Courts can enforce decisions -0.073(0.055)
-0.075(0.054)
-0.094*
(0.055)-0.105*
(0.055)-0.107(0.055)
-0.102*
(0.055)Courts are affordable 0.065
(0.061)0.065(0.061)
0.071(0.071)
0.049(0.062)
0.066(0.062)
0.066(0.062)
Firm age in complete years -0.033(0.071)
0.029(0.082)
0.013(0.082)
-0.354(0.254)
Number of employees (size) 0.024(0.054)
0.028(0.057)
0.033(0.057)
0.130(0.211)
Square - age 0.084(0.055)
Square - number of employees -0.014(0.029)
Manufacturing (yes=1) -0.077(0.121)
-0.079(0.122)
-0.050(0.123)
-0.013(0.128)
-0.030(0.128)
Retail and wholesale (yes=1) 0.194(0.144)
0.134(0.149)
0.170(0.150)
0.161(0.152)
0.155(0.153)
Manager’s education 0.028(0.028)
0.026(0.028)
0.021(0.028)
Manager’s experience -0.154(0.101)
-0.128(-0.126)
-0.101(0.101)
Transport constraint -0.087**
(0.042)-0.094**
(0.042)Tax administration constraint 0.069
(0.045)0.067(0.045)
Skills constraints 0.0183(0.052)
0.011(0.052)
Finance constraints -0.002(0.037)
0.005(0.037)
Macroeconomic constraints -0.035(0.043)
-0.031(0.043)
Competition constraints 0.083**
(0.038)0.076**
(0.038)Ability to pay * corruption as a business constraint (Instrument)
0.289***
(0.094)0.314***
(0.094)0.301***
(0.094)0.329***
(0.094)0.311***
(0.095)0.306***
(0.095)Regional effects YES YES YES YES YES YESConstant 1.169***
(0.319)1.168(0.326)
1.221(0.360)
1.261(0.427)
1.041**
(0.460)1.249***
(0.589)Observations 462 462 455 450 450 450
Notes: 1) The coefficients are tabulated standard errors are in parentheses 2) Regional fixed effects have been accounted for using 4 dummy variables and they are highly significant 3) Significance levels: *=significant at the 10% level, ** =significant at the 5% level, ***
=significant at the 1% level
24 ECONOMIC POLICY RESEARCH CENTRE - EPRC
Tax Evasion, Informality and The Business Environment In Uganda
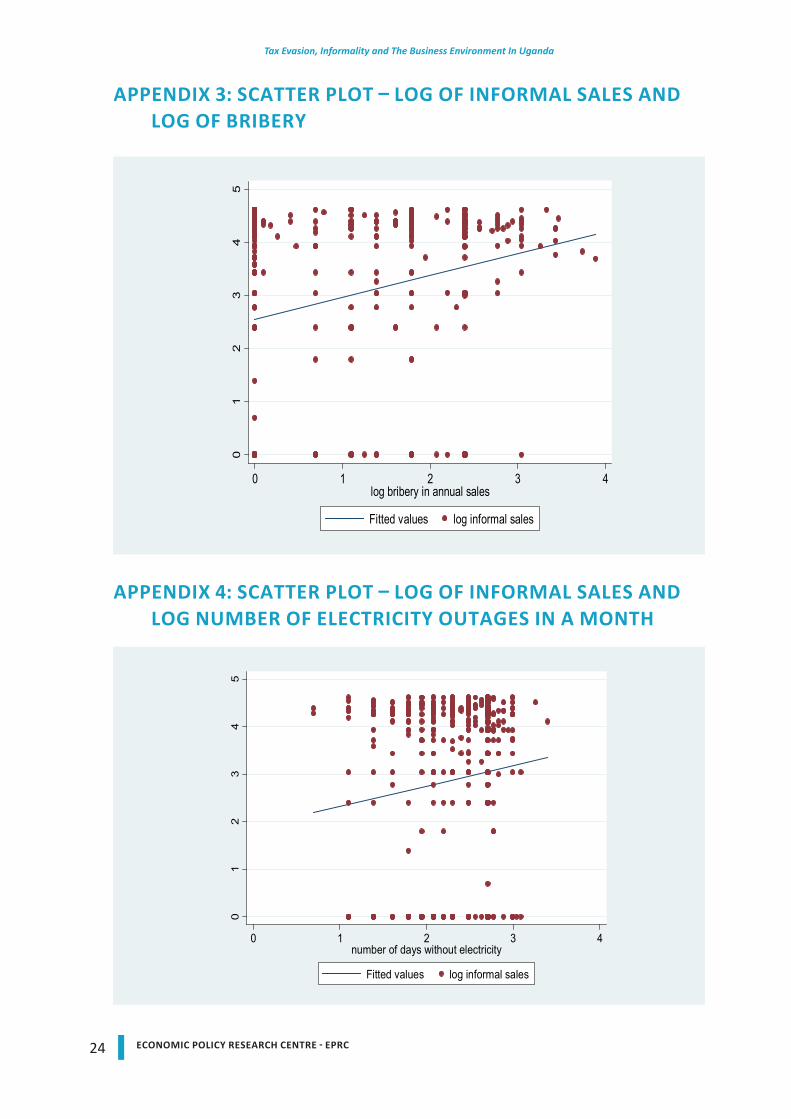
APPENDIX 3: SCATTER PLOT – LOG OF INFORMAL SALES AND LOG OF BRIBERY
APPENDIX 4: SCATTER PLOT – LOG OF INFORMAL SALES AND LOG NUMBER OF ELECTRICITY OUTAGES IN A MONTH
01
23
45
0 1 2 3 4log bribery in annual sales
Fitted values log informal sales
01
23
45
0 1 2 3 4number of days without electricity
Fitted values log informal sales

25ECONOMIC POLICY RESEARCH CENTRE - EPRC
Tax Evasion, Informality and The Business Environment In Uganda
APPENDIX 5: THE BIGGEST OBSTACLES IN DOING BUSINESS
Source: Author computations from the World Bank enterprise survey data

26 ECONOMIC POLICY RESEARCH CENTRE - EPRC
Tax Evasion, Informality and The Business Environment In Uganda
APPENDIX 6: DESCRIPTION OF DATA VARIABLES
Variable names Definition
Evasion Log of (1+the proportion of sales kept off the books for tax purposes)Outage Log of the number of days a firm experienced electricity outages in a typical monthDummy - Outage Dummy variable = 1 if number of outages exceed mean monthly value (10)Courts - fair The extent to which courts are perceived to be fair, impartial and uncorrupted on a scale
1 – 4 where 1 represents strongly disagree and 4 strongly agreeCourts - quick The extent to which courts are perceived to be quick in resolving disputes on a scale 1 – 4
where 1 represents strongly disagree and 4 strongly agreeCourts - affordable The extent to which courts are perceived to be affordable on a scale 1 – 4 where 1
represents strongly disagree and 4 strongly agreeCourts - enforceable The extent to which courts can enforce their decisions on a scale 1 – 4 where 1 represents
strongly disagree and 4 strongly agreeAge Log of firm ageSize Log of the number of employees in a firm Manufacturing Dummy variable =1 if firm is engaged in manufacturingRetail Dummy variable =1 if firm is engaged in retail and wholesale tradeDomestic Log of the percentage of the firm owned by private domestic individuals, companies or
organizationsEducation Firm manager’s level of educationExperience Log of the firm manager’s level of experience in complete yearsExports Log of the percentage of firm’s sales that were direct exports Exports - Dummy Dummy variable if the firm is engaged in export business Bribe Log of the percentage of total annual sales informally paid to public officials “to grease
the system”General constraint - electricity
The extent to which electricity is a major obstacle in doing business on a scale of 1 – 5 where 1 corresponds to no obstacle and 5 very severe obstacle
General constraint - transport
The extent to which transport is a major obstacle in doing business on a scale of 1 – 5 where 1 corresponds to no obstacle and 5 very severe obstacle
General constraint - tax rates
The extent to which tax rates is a major obstacle in doing business on a scale of 1 – 5 where 1 corresponds to no obstacle and 5 very severe obstacle
General constraint - tax administration
The extent to which tax administration is a major obstacle in doing business on a scale of 1-5 where 1 corresponds to no obstacle and 5 very severe obstacle
General constraint - skills
The extent to which inadequately skilled labour force is a major obstacle in doing business on a scale of 1 – 5 where 1 corresponds to no obstacle and 5 very severe obstacle
General constraint – finance
The extent to which access and cost of finance is a major obstacle in doing business on a scale of 1 – 5 where 1 corresponds to no obstacle and 5 very severe obstacle
General constraint - macroeconomic factors
The extent to which the macroeconomic environment is a major obstacle in doing business on a scale of 1 – 5 where 1 corresponds to no obstacle and 5 very severe obstacle
General constraint - corruption
The extent to which corruption is a major obstacle in doing business on a scale of 1 – 5 where 1 corresponds to no obstacle and 5 very severe obstacle
General constraint - competition
The extent to which competition from informal businesses is a major obstacle in doing business on a scale of 1 – 5 where 1 corresponds to no obstacle and 5 very severe obstacle

27ECONOMIC POLICY RESEARCH CENTRE - EPRC
Tax Evasion, Informality and The Business Environment In Uganda
EPRC RESEARCH SERIES
Listing of Research Series published since 2010 to date. Full text format of these and earlier papers can be downloaded from the EPRC website at www.eprc.or.ug
Series No.
Author(s) Title Date
112 Shinyekwa Isaac & Othieno Lawrence
Trade Creation And Diversion Effects Of The East African Community Regional Trade Agreement: A Gravity Model Analysis.
December 2013
111 Mawejje Joseph & Bategeka Lawrence
Accelerating Growth And Maintaining Intergenerational Equity Using Oil Resources In Uganda.
December 2013
110 Bategeka Lawrence et ; UN Wider
Overcoming The Limits Of Institutional Reforms In Uganda
September 2013
109 Munyambonera Ezra Nampewo Dorothy , Adong Annet & Mayanja Lwanga Musa
Access And Use Of Credit In Uganda: Unlocking The Dilemma Of Financing Small Holder Farmers.
June 2013
108 Ahaibwe Gemma & Kasirye Ibrahim
HIV/AIDS Prevention Interventions In Uganda: A Policy Simulation.
June 2013
107 Barungi Mildred & Kasirye Ibrahim
Improving Girl’s Access To Secondary Schooling A Policy Simulation For Uganda
June 2013
106 Ahaibwe Gemma, Mbowa Swaibu & Mayanja Lwanga Musa
Youth Engagement In Agriculture In Uganda: Challenges And Prospects.
June 2013
105 Shinyekwa Isaac & Mawejje Joseph
Macroeconomic And Sectoral Effects Of The EAC Regional Integration On Uganda: A Recursive Computable General Equilibrium Analysis.
May 2013
104 Shinyekwa Isaac Economic And Social Upgrading In The Mobile Telecommunications Industry: The Case Of MTN.
May 2013
103 Mwaura Francis Economic And Social Upgrading In Tourism Global Production Networks: Findings From Uganda.
May 2013
102 Kasirye Ibrahim Constraints To Agricultural Technology Adoption In Uganda: Evidence From The 2005/06-2009/10 Uganda National Panel Survey.
May 2013
101 Bategeka Lawrence,Kiiza Julius &Kasirye Ibrahim
Institutional Constraints To Agriculture Development In Uganda.
May 2013
100 Shinyekwa Isaac &Othieno Lawrence
Comparing The Performance Of Uganda’s Intra-East African Community Trade And Other Trading Blocs: A Gravity Model Analysis.
April 2013
99 Okoboi Geoffrey Kuteesa Annette &Barungi Mildred
The Impact Of The National Agricultural Advisory Services Program On Household Production And Welfare In Uganda.
March 2013

28 ECONOMIC POLICY RESEARCH CENTRE - EPRC
Tax Evasion, Informality and The Business Environment In Uganda
98 Adong Annet, Mwaura Francis &Okoboi Geoffrey
What Factors Determine Membership To Farmer Groups In Uganda? Evidence From The Uganda Census Of Agriculture 2008/9.
January 2013
97 Tukahebwa B. Geoffrey The Political Context Of Financing Infrastructure Development In Local Government: Lessons From Local Council Oversight Functions In Uganda.
December 2012
96 Ssewanyana Sarah&Kasirye Ibrahim
Causes Of Health Inequalities In Uganda: Evidence From The Demographic And Health Surveys.
October 2012
95 Kasirye Ibrahim HIV/AIDS Sero-Prevalence And Socioeconomic Status: Evidence From Uganda.
October 2012
94 Ssewanyana Sarah and Kasirye Ibrahim
Poverty And Inequality Dynamics In Uganda: Insights From The Uganda National Panel Surveys 2005/6 And 2009/10.
September 2012
93 Othieno Lawrence & Dorothy Nampewo
Opportunities And Challenges In Uganda’s Trade In Services.
July 2012
92 Kuteesa Annette East African Regional Integration: Challenges In Meeting The Convergence Criteria For Monetary Union: A Survey.
June 2012
91 Mwaura Francis and Ssekitoleko Solomon
Reviewing Uganda’s Tourism Sector For Economic And Social Upgrading.
June 2012
90 Shinyekwa Isaac A Scoping Study Of The Mobile Telecommunications Industry In Uganda.
June 2012
89 Mawejje JosephMunyambonera EzraBategeka Lawrence
Uganda’s Electricity Sector Reforms And Institutional Restructuring.
June 2012
88 Okoboi Geoffrey and Barungi Mildred
Constraints To Fertiliser Use In Uganda: Insights From Uganda Census Of Agriculture 2008/09.
June 2012
87 Othieno Lawrence Shinyekwa Isaac
Prospects And Challenges In The Formation Of The COMESA-EAC And SADC Tripartite Free Trade Area.
November 2011
86 Ssewanyana Sarah,Okoboi Goeffrey &Kasirye Ibrahim
Cost Benefit Analysis Of The Uganda Post Primary Education And Training Expansion And Improvement (PPETEI) Project.
June 2011
85 Barungi Mildred& Kasirye Ibrahim
Cost-Effectiveness Of Water Interventions: The Case For Public Stand-Posts And Bore-Holes In Reducing Diarrhoea Among Urban Households In Uganda.
June 2011
84 Kasirye Ibrahim &Ahaibwe Gemma
Cost Effectiveness Of Malaria Control Programmes In Uganda: The Case Study Of Long Lasting Insecticide Treated Nets (LLINs) And Indoor Residual Spraying.
June 2011
83 Buyinza Faisal Performance And Survival Of Ugandan Manufacturing Firms In The Context Of The East African Community.
September 2011
82 Wokadala James, Nyende Magidu, Guloba Madina & Barungi Mildred
Public Spending In The Water Sub-Sector In Uganda: Evidence From Program Budget Analysis.
November 2011
81Bategeka Lawrence & Matovu John Mary
Oil Wealth And Potential Dutch Disease Effects In Uganda.
June 2011

29ECONOMIC POLICY RESEARCH CENTRE - EPRC
Tax Evasion, Informality and The Business Environment In Uganda
80 Shinyekwa Isaac &Othieno Lawrence
Uganda’s Revealed Comparative Advantage: The Evidence With The EAC And China.
September2011
79 Othieno Lawrence & Shinyekwa Isaac
Trade, Revenues And Welfare Effects Of The EAC Customs Union On Uganda: An Application Of Wits-Smart Simulation Model.
April 2011
78 Kiiza Julius, Bategeka Lawrence & Ssewanyana Sarah
Righting Resources-Curse Wrongs In Uganda: The Case Of Oil Discovery And The Management Of Popular Expectations.
July 2011
77 Guloba Madina, Wokadala James & Bategeka Lawrence
Does Teaching Methods And Availability Of Teaching Resources Influence Pupil’s Performance?: Evidence From Four Districts In Uganda.
August 2011
76 Okoboi Geoffrey, Muwanika Fred, Mugisha Xavier & Nyende Majidu
Economic And Institutional Efficiency Of The National Agricultural Advisory Services’ Programme: The Case Of Iganga District.
June 2011
75 Okumu Luke &Okuk J. C. Nyankori
Non-Tariff Barriers In EAC Customs Union: Implications For Trade Between Uganda And Other EAC Countries.
December 2010
74 Kasirye Ibrahim & Ssewanyana Sarah
Impacts And Determinants Of Panel Survey Attrition: The Case Of Northern Uganda Survey 2004-2008.
April 2010
73 Twimukye Evarist,Matovu John MarySebastian Levine &Birungi Patrick
Sectoral And Welfare Effects Of The Global Economic Crisis On Uganda: A Recursive Dynamic CGE Analysis.
July 2010
72 Okidi John &Nsubuga Vincent
Inflation Differentials Among Ugandan Households: 1997 – 2007.
June 2010
71 Hisali Eria Fiscal Policy Consistency And Its Implications For Macroeconomic Aggregates: The Case Of Uganda.
June 2010
70 Ssewanyana Sarah & Kasirye Ibrahim
Food Security In Uganda: A Dilemma To Achieving The Millennium Development Goal.
July 2010
69 Okoboi Geoffrey Improved Inputs Use And Productivity In Uganda’s Maize Sector.
March 2010
68 Ssewanyana Sarah & Kasirye Ibrahim
Gender Differences In Uganda: The Case For Access To Education And Health Services.
May 2010
67 Ssewanyana Sarah Combating Chronic Poverty In Uganda: Towards A New Strategy.
June 2010
66 Sennoga Edward & Matovu John Mary
Public Spending Composition And Public Sector Efficiency: Implications For Growth And Poverty Reduction In Uganda.
February. 2010

30 ECONOMIC POLICY RESEARCH CENTRE - EPRC
Tax Evasion, Informality and The Business Environment In Uganda


Economic Policy Research CentrePlot 51, Pool Road, Makerere University Campus
P.O. Box 7841, Kampala, UgandaTel: +256-414-541023/4, Fax: +256-414-541022Email: [email protected], Web: www.eprc.or.ug