tcdxa oct 2014 k9la propagation and solar issues carl luetzelschwab k9la [email protected]
TRANSCRIPT

TCDXA Oct 2014 K9LATCDXA Oct 2014 K9LA
Propagation and Solar Propagation and Solar IssuesIssues
Carl Luetzelschwab K9LACarl Luetzelschwab K9LA
[email protected]@arrl.net
http://k9la.ushttp://k9la.us

TCDXA Oct 2014 K9LATCDXA Oct 2014 K9LA

TCDXA Oct 2014 K9LATCDXA Oct 2014 K9LA
What We’ll CoverWhat We’ll Cover
Update on Cycle 24Update on Cycle 24 Another Maunder Minimum?Another Maunder Minimum? Hints for Working FT4TA TromelinHints for Working FT4TA Tromelin What Do the Numbers Mean?What Do the Numbers Mean? What Bands Are Good? When Are What Bands Are Good? When Are
They Good?They Good?

TCDXA Oct 2014 K9LATCDXA Oct 2014 K9LA
Cycle 24 UpdateCycle 24 Update
We’re still in the second peakWe’re still in the second peak Higher bands should be good this fall/winterHigher bands should be good this fall/winter
Cycle 24 Cycle 24 began in began in late 2008late 2008
First peak First peak after 3½ after 3½ yearsyears
Second Second peak after peak after about 6 about 6 years – years – still in still in progressprogress
Cycle 24 in terms of 10. 7 cm solar flux
60
80
100
120
140
160
180
Jan Jul Jan Jul Jan Jul Jan Jul Jan Jul Jan Jul Jan Jul Jan
2009 2010 2011 2012 2013 2014 2015
10
.7 c
m S
ola
r F
lux
latest monthlySeptember 2014
latest smoothedMarch 2014
K9LA - Mar 2014
TCDXA Oct 2014 K9LATCDXA Oct 2014 K9LA
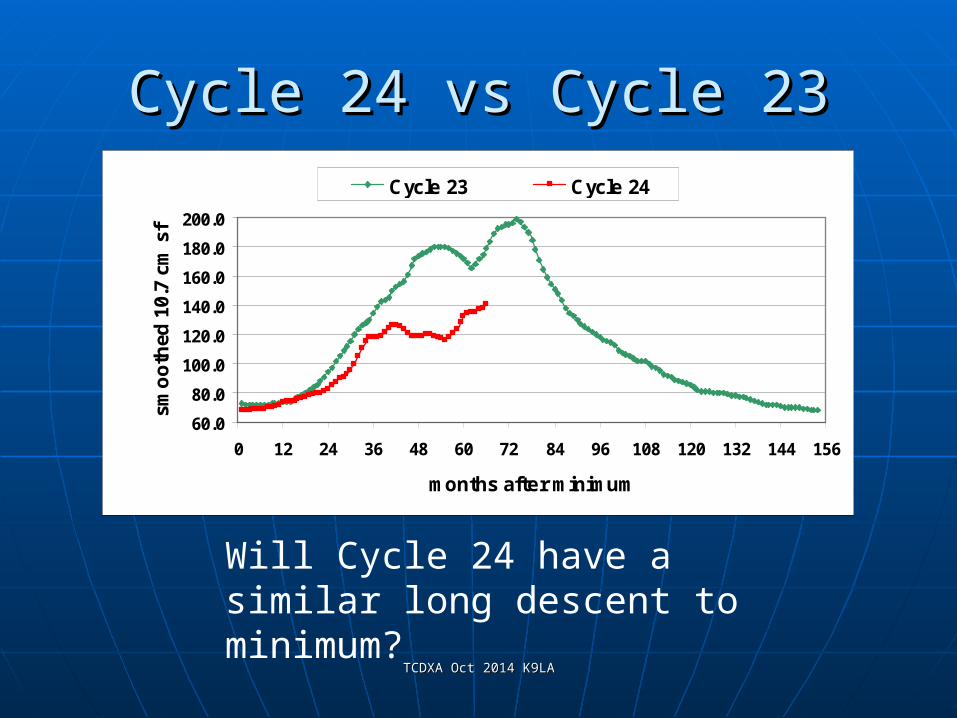
Cycle 24 vs Cycle 23Cycle 24 vs Cycle 23
Will Cycle 24 have a similar long descent to minimum?
60.0
80.0
100.0
120.0
140.0
160.0
180.0
200.0
0 12 24 36 48 60 72 84 96 108 120 132 144 156
months after minimum
smo
oth
ed 1
0.7
cm s
fCycle 23 Cycle 24

TCDXA Oct 2014 K9LATCDXA Oct 2014 K9LA
Speaking of Minimums . . .Speaking of Minimums . . .
We were used to short minimums – about 2 yearsWe were used to short minimums – about 2 years Then the minimum between Cycle 23 and 24 came Then the minimum between Cycle 23 and 24 came
alongalong
0
2
4
6
8
10
12
14
16
18
20
22
1 6 11 16 21 26 31 36 41 46 51 56
number of months below a smoothed sunspot number of 20
smo
oth
ed s
un
spo
t n
um
ber
between Cycles 18 and 19(min Apr 1954)
between Cycles 19 and 20(min Nov 1964)
between Cycles 20 and 21(min Jun 1976)
between Cycles 21 and 22(min Sep 1986)
between Cycles 22 and 23(min Oct 1996)
between Cycles 23 and 24(min Dec 2008)

TCDXA Oct 2014 K9LATCDXA Oct 2014 K9LA
Length of Min vs Next MaxLength of Min vs Next Max
0
20
40
60
80
100
120
1-2
2-3
3-4
4-5
5-6
6-7
7-8
8-9
9-10
10-11
11-12
12-13
13-14
14-15
15-16
16-17
17-18
18-19
19-20
20-21
21-22
22-23
23-24
sola r m inim um be tw e e n indic a te d c yc le s
nu
mb
er o
f mon
ths
bel
ow a
sm
ooth
ed s
un
spo
t n
um
ber
of
20
0
50
100
150
200
250
1 2 3 4 5 6 7 8 9 10 11 12 13 14 15 16 17 18 19 20 21 22 23 24
solar cycle number
max
imu
m s
mo
oth
ed s
un
spo
t n
um
ber
Next Solar Max vs Duration of Previous Solar Min
R2 = 0.5815
0
50
100
150
200
250
10 20 30 40 50 60 70 80 90 100
months at solar minimum (smoothed sunspot number < 20)m
axim
um
sm
oo
thed
su
nsp
ot
nu
mb
er o
f n
ext
sola
r cy
cle
The longer the minimum, the smaller the next cycle

TCDXA Oct 2014 K9LATCDXA Oct 2014 K9LA
Recorded HistoryRecorded History
Three periods of larger cyclesThree periods of larger cycles Two periods of smaller cyclesTwo periods of smaller cycles It looks like we’re headed for a period of smaller It looks like we’re headed for a period of smaller
cyclescycles
0
50
100
150
200
250
1 2 3 4 5 6 7 8 9 10 11 12 13 14 15 16 17 18 19 20 21 22 23 24
solar cycle number
max
imu
m s
mo
oth
ed s
un
spo
t n
um
ber

TCDXA Oct 2014 K9LATCDXA Oct 2014 K9LA
How Small?How Small?Another Maunder Minimum?Another Maunder Minimum?
Maunder min was a 70-year period of Maunder min was a 70-year period of very few sunspotsvery few sunspots
1645-17151645-1715
Cycle 1

TCDXA Oct 2014 K9LATCDXA Oct 2014 K9LA
MM Fueled By Mag Field DataMM Fueled By Mag Field Data
July 2009 paper by W. July 2009 paper by W. Livingston and M. PennLivingston and M. Penn
Sunspots are visible when Sunspots are visible when their magnetic field their magnetic field strength is strength is >> 1500 gauss 1500 gauss
Extrapolating the linear Extrapolating the linear trend line says no sunspots trend line says no sunspots will be visible by the end of will be visible by the end of the decade (2020)the decade (2020)
Is this the signature of a Is this the signature of a Maunder Minimum?Maunder Minimum?

TCDXA Oct 2014 K9LATCDXA Oct 2014 K9LA
Update Thru 2013Update Thru 2013
Magnetic field strength still decreasingMagnetic field strength still decreasing But it looks like it is starting to level offBut it looks like it is starting to level off

TCDXA Oct 2014 K9LATCDXA Oct 2014 K9LA
Update Thru September 2014Update Thru September 2014
It sure looks like it’s leveled offIt sure looks like it’s leveled off Suggests sunspots Suggests sunspots won’twon’t disappear disappear

TCDXA Oct 2014 K9LATCDXA Oct 2014 K9LA
MM Conclusion – For Now!MM Conclusion – For Now!
It’s kind of looking like we’ll just see It’s kind of looking like we’ll just see an extended period of smaller cyclesan extended period of smaller cycles
Not a period of few or no sunspotsNot a period of few or no sunspots We’re going into uncharted territoryWe’re going into uncharted territory
• The Sun will do whatever it wants!The Sun will do whatever it wants!

TCDXA Oct 2014 K9LATCDXA Oct 2014 K9LA
FT4TA TromelinFT4TA Tromelin
End of October thru early November End of October thru early November 20142014• mid point is ~ Nov 5mid point is ~ Nov 5
They plan to concentrate on the They plan to concentrate on the higher-volume bands higher-volume bands
Second priority is the low bands Second priority is the low bands Let’s look at propagation from the Let’s look at propagation from the
MSP area to TromelinMSP area to Tromelin

TCDXA Oct 2014 K9LATCDXA Oct 2014 K9LA
Great Circle Paths from FT4TAGreat Circle Paths from FT4TA
FT4TA
FT4TA antipode
MSP
great circle paths in 10o increments

TCDXA Oct 2014 K9LATCDXA Oct 2014 K9LA
W6ELProp MapW6ELProp Map
Pretty close to Pretty close to a high latitude a high latitude pathpath• More sensitive More sensitive
to elevated K to elevated K and A indicesand A indices
Short path Short path (red) heading (red) heading to the NEto the NE
Long path Long path (black) (black) heading to the heading to the SWSW

TCDXA Oct 2014 K9LATCDXA Oct 2014 K9LA
Predictions on the Higher BandsPredictions on the Higher Bands Black line is Black line is
monthly median monthly median MUFMUF• 50% of the days 50% of the days
of the 1-month of the 1-month period centered period centered on Nov 5on Nov 5
Blue line is Blue line is monthly median monthly median FOTFOT• 90% of the days90% of the days
White = S8White = S8 Yellow = S7Yellow = S7 Green = S6Green = S6 Red = S5Red = S5
short path
20m – good opportunity from 2200-0300 UTC17m, 15m, 12m – good opportunity from 1400-2200 UTC10m – 50% probability from 1600-1900 UTC

TCDXA Oct 2014 K9LATCDXA Oct 2014 K9LA
Predictions on the Higher BandsPredictions on the Higher Bands Long path Long path
openings are openings are pretty much pretty much limited to limited to around and around and after sunriseafter sunrise
White = S5White = S5 Yellow = S4Yellow = S4 Green = S3Green = S3 Red = S2Red = S2 Best shots areBest shots are
• 20m: 13-15z20m: 13-15z• 17m: 14-16z17m: 14-16z• 15m: 14-16z15m: 14-16z
long path

TCDXA Oct 2014 K9LATCDXA Oct 2014 K9LA
FT4TA on 160-MetersFT4TA on 160-Meters Know when the entire path is in darkness Know when the entire path is in darkness
(referred to as common darkness)(referred to as common darkness) For stations in the MSP areaFor stations in the MSP area
• MSP sunset is around 2253 UTCMSP sunset is around 2253 UTC• FT4TA sunrise is around 0148 UTCFT4TA sunrise is around 0148 UTC• Approximately 3 hours of common darknessApproximately 3 hours of common darkness
Watch especially around FT4TA sunriseWatch especially around FT4TA sunrise• Up to a half hour before and a bit afterUp to a half hour before and a bit after
All this also applies to 80-Meters, and to 40-All this also applies to 80-Meters, and to 40-Meters to a lesser extentMeters to a lesser extent

TCDXA Oct 2014 K9LATCDXA Oct 2014 K9LA
Wedge of DaylightWedge of Daylight
All of NA should be able to work FT4TA on 160-Meters (if someone is on at each end!)
The terminator at FT4TA sunrise superimposed on the terminator at FT4TA sunset
TCDXA Oct 2014 K9LATCDXA Oct 2014 K9LA
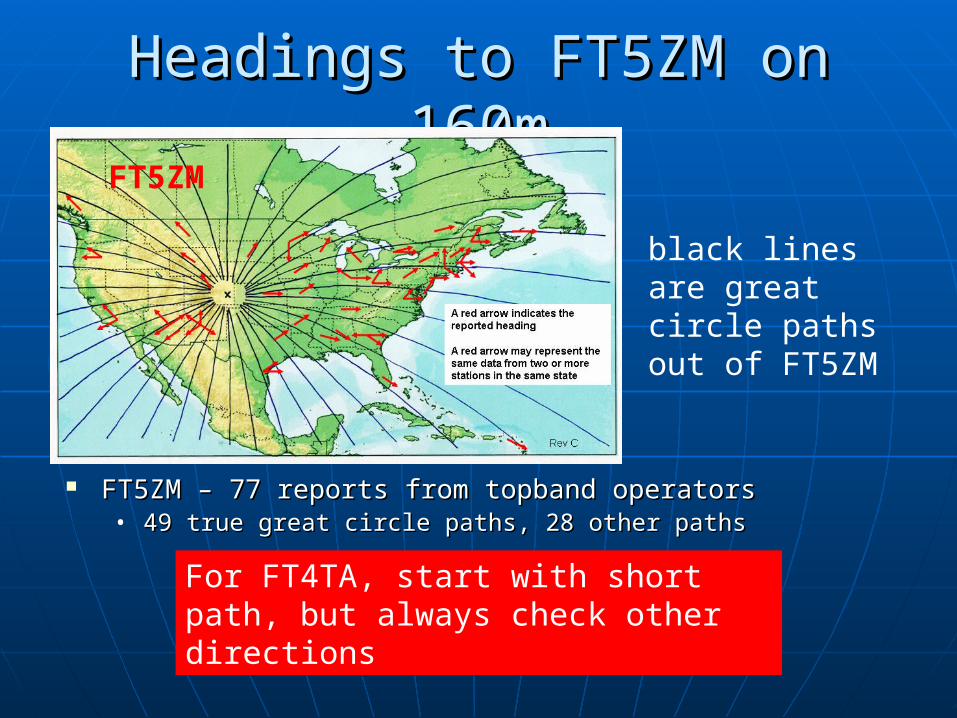
Headings to FT5ZM on 160mHeadings to FT5ZM on 160m
FT5ZM – 77 reports from topband operatorsFT5ZM – 77 reports from topband operators• 49 true great circle paths, 28 other paths49 true great circle paths, 28 other paths
black lines are great circle paths out of FT5ZM
FT5ZM
For FT4TA, start with short path, but always check other directions

TCDXA Oct 2014 K9LATCDXA Oct 2014 K9LA
What Do the Numbers Mean?What Do the Numbers Mean?image from www.qrz.comimage from www.qrz.com
• SFI is 10.7 cm solar flux• Generally the higher the flux, the better the higher bands• But the short-term correlation between daily SFI and daily MUF is poor
• SN is sunspot number• Ditto above comments

TCDXA Oct 2014 K9LATCDXA Oct 2014 K9LA
Numbers - continuedNumbers - continued
• K is 3-hr index• Tells how disturbed the Earth’s magnetic field is
• Generally an elevated K index gives lower mid and high latitude MUFs• An elevated K index may enhance low latitude MUFs
• 0-9, with 0 = quiet and 9 = extremely disturbed• A is daily average of the eight 3-hour K indices
• 0-400, with 0= quiet and 400 = extremely disturbed

TCDXA Oct 2014 K9LATCDXA Oct 2014 K9LA
Numbers - continuedNumbers - continued
• XRY is x-ray flux at 1-8 Angstroms (0.1-0.8 nm)• B, C, M, X - B is least, X is most• Higher letters indicate more adverse impact to D region
• 304A is flux from Sun at 304 Angstroms (30.4 nm)• 26-34 nm ionizes greater than 50% of F2 region• See SFI and SN comments
• Aur is auroral activity from NOAA satellite• Roughly correlates to K index
• Lat is lowest geographic latitude impacted by auroral event

TCDXA Oct 2014 K9LATCDXA Oct 2014 K9LA
Numbers - continuedNumbers - continued
• Bz is direction of interplanetary magnetic field (IMF)• +50 to -50, negative indicates south with disturbed conditions
• SW is solar wind speed in km/s• Average is around 400 km/s• Much higher values suggest CME or coronal hole
• PF is proton flux at geosynchronous altitude• Values of 10 and higher suggest polar cap absorption (PCA)
• EF is electron flux at geosynchronous altitude• Values less than 10 suggest disturbed magnetic field

TCDXA Oct 2014 K9LATCDXA Oct 2014 K9LA
Numbers - continuedNumbers - continued
• MUF Bdr is the MUF over the Boulder ionosonde at the designated time assuming it’s the mid point of a 3000 km path• EME deg is estimated Earth-Moon-Earth path attenuation in words• Band prognosis
• Caveat emptor – subjective assessment• Geomag Field is assessment of K index in words• Sig Noise Lvl is estimated noise in S-units due to SW and K
• Could be masked by man-made and atmospheric noise• CME (UTC) is estimated time when coronal mass ejection will hit

TCDXA Oct 2014 K9LATCDXA Oct 2014 K9LA
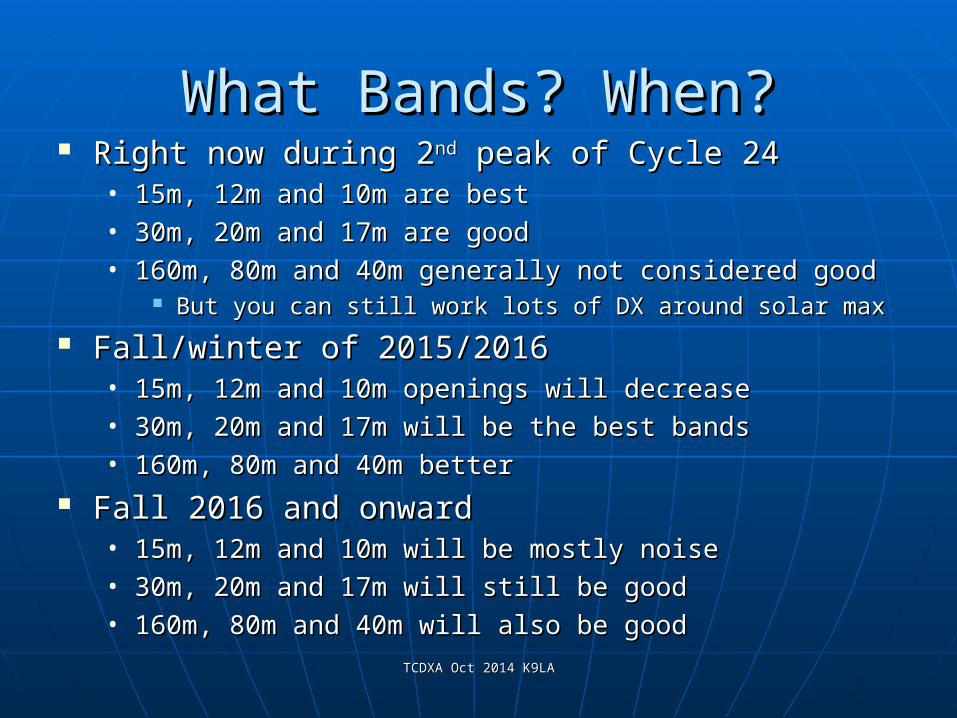
What Bands? When?What Bands? When?
160m, 80m, 40m are driven by absorption160m, 80m, 40m are driven by absorption• These bands are best during night at solar minThese bands are best during night at solar min
15m, 12m, 10m are driven by MUF15m, 12m, 10m are driven by MUF• These bands are best in daylight at solar maxThese bands are best in daylight at solar max
30m, 20m, 17m are good throughout an 30m, 20m, 17m are good throughout an entire solar cycleentire solar cycle• Can withstand more absorption than Can withstand more absorption than
160/80/40m160/80/40m• Don’t need as high a MUF as 15/12/10mDon’t need as high a MUF as 15/12/10m
TCDXA Oct 2014 K9LATCDXA Oct 2014 K9LA
What Bands? When?What Bands? When? Right now during 2Right now during 2ndnd peak of Cycle 24 peak of Cycle 24
• 15m, 12m and 10m are best15m, 12m and 10m are best• 30m, 20m and 17m are good30m, 20m and 17m are good• 160m, 80m and 40m generally not considered good160m, 80m and 40m generally not considered good
But you can still work lots of DX around solar maxBut you can still work lots of DX around solar max
Fall/winter of 2015/2016Fall/winter of 2015/2016• 15m, 12m and 10m openings will decrease15m, 12m and 10m openings will decrease• 30m, 20m and 17m will be the best bands30m, 20m and 17m will be the best bands• 160m, 80m and 40m better160m, 80m and 40m better
Fall 2016 and onwardFall 2016 and onward• 15m, 12m and 10m will be mostly noise15m, 12m and 10m will be mostly noise• 30m, 20m and 17m will still be good30m, 20m and 17m will still be good• 160m, 80m and 40m will also be good160m, 80m and 40m will also be good

TCDXA Oct 2014 K9LATCDXA Oct 2014 K9LA
SummarySummary We’re in the second peak of Cycle 24We’re in the second peak of Cycle 24
• It won’t last foreverIt won’t last forever• Take advantage of good propagation on the higher Take advantage of good propagation on the higher
bands now!bands now! Recent data suggests that we’re not headed into Recent data suggests that we’re not headed into
another Maunder Minimumanother Maunder Minimum• Just a period of small solar cyclesJust a period of small solar cycles• Dust off the low band gearDust off the low band gear
FT4TA should be very workable on all bandsFT4TA should be very workable on all bands We are inundated with space weather dataWe are inundated with space weather data
• I think it’s too much – but it’s colorful!I think it’s too much – but it’s colorful! In the next several years we’ll transition from the In the next several years we’ll transition from the
higher bands being best to the lower bands being higher bands being best to the lower bands being bestbest