teachers know best: making data work ... - s3. · pdf fileteachers know best making data work...
TRANSCRIPT

Teachers Know Best
Making Data Work For Teachers and Students

ABOUT THIS STUDY
As part of the Bill & Melinda Gates Foundation’s broader efforts to improve educational opportunities for all students, the Teachers Know Best research project seeks to encourage innovation in K–12 education by helping product developers and those who procure resources for teachers better understand teachers’ views.
The original Teachers Know Best report, released in 2014, was an attempt to share with educators and product developers detailed information about how K–12 teachers and students view digital instructional tools as a whole. It surveyed a nationally representative sample of more than 3,100 U.S. public school teachers and more than 1,250 public school students in grades 3 through 12. Before the release of this report, access to detailed information about how K–12 teachers and students viewed digital instructional tools was limited. As a result, answers to most questions about whether product developers were creating the digital resources that teachers want and need were mainly anecdotal. Commissioning this research from a leading consulting firm with expertise in consumer analytics and insights provided a way to learn more about the unmet needs of teachers and students and to more clearly use the voice of educators to identify areas in which focused product development could more effectively support their needs.
This follow-up study focuses on the potential of a specific subset of digital instructional tools: those that help teachers collect and make use of student data to tailor and improve instruction for individual students. The use of data is a crucial component in personalized learning, which ensures that student learning experiences—what they learn and how, when, and where they learn it—are tailored to their individual needs, skills, and interests and enable them to take ownership of their learning. Personalized learning is critical to meeting all students where they are, so they are neither bored with assignments that are too easy nor overwhelmed by work that is too hard.
The intent of Making Data Work is to drill down to help educators, school leaders, and product developers better understand the challenges teachers face when working with this critical segment of digital instructional tools. More than 4,600 teachers from a nationally representative sample were surveyed about their use of data to drive instruction and the use of these tools. We asked them to tell us about their behaviors and beliefs, discuss specific occasions in which they use data to guide student learning, describe and rate current tools, tell us about the challenges they face, and offer advice on ways to make digital tools more effective for teachers and students. In addition, the study included qualitative research in innovative schools that are at the forefront of personalizing learning for students, as well as in more traditional public schools.
30
educators in tech-forward schools
54
educators in traditional schools
INTERVIEWS AND OBSERVATIONS
4,600
teachers in traditional schools
ONLINE SURVEY
SURVEYS, INTERVIEWS, AND OBSERVATIONS

CONTENTSSummary of Key Findings 3
What Do Teachers Believe about Data-Driven Instruction and the Tools That Support It? 7
How Do Teachers Use Data to Tailor Instruction? 13
What Are Key Challenges Teachers Identify with the Tools That Support Data-Driven Instruction? 18
What Do Teachers Need to Make Data Work to Drive Instruction in the Classroom? 22
Conclusions and Recommendations 30


Making Data Work for Teachers and Students 3
Summary of Key Findings Teachers believe that knowing their students well is fundamental to effective instruction. Data that matter to teachers are much more than just annual test scores. Data that matter include rich information about students’ academic, social, behavioral, and cultural experiences that can help strengthen the connection between teachers and students and shape how learning takes place.
This study of more than 4,600 teachers focuses on the digital tools available to help teachers collect and use data to tailor and improve instruction for individual students. It recommends how product developers could improve those tools based on the views of teachers themselves. As with previous Teachers Know Best reports, our goal was simple: to bring the voice of educators into identifying areas of unmet need, so that focused product development could more effectively support teaching and learning.
Today, virtually all teachers (93 percent) regularly use some form of digital tool to guide instruction. But more than two-thirds of teachers (67 percent), across a vast range of schools nationwide, say they are not fully satisfied with the effectiveness of the data or the tools for working with data that they have access to on a regular basis.
This study explores four questions:
●● What do teachers believe about data-driven instruction and the tools that support it?
●● How do teachers use data to tailor instruction?
●● What are the key challenges teachers identify with the tools that support data-driven instruction?
●● What do teachers need to make data work to drive instruction in the classroom?

Teachers Know Best4
What do teachers believe about data-driven instruction and the tools that support it?
Teachers believe they have a responsibility to support every student and should tailor instruction based on individual strengths, needs, and interests. More than 8 in 10 teachers (86 percent) are constantly
looking for ways to engage students based on who they are, and nearly as many (78 percent) believe that data help validate where their students are and where they can go.
How do teachers use data to tailor instruction?
Data-driven instruction is characterized by cycles that provide a feedback loop in which teachers plan and deliver instruction, assess student understanding through the collection of data,
analyze the data, and then pivot instruction based on insights from their analysis. This constant dialogue between teachers and students is at the heart of learning.
DATA ARE AT THE HEART OF THE ONGOING DIALOGUE BETWEEN TEACHERS AND STUDENTS
●● Strengths
●● Weaknesses
●● Misconceptions
●● Passions
●● Mindset
●● Behaviors
●● Background experiences
●● Individualized feedback
●● Differentiation
●● Guidance
●● Engaging instruction
But the study found that teachers vary in their approaches and comfort with using data and the technology that supports them, with six key segments:
●● Data mavens focus on individualizing learning plans to address the whole student.
●● Growth seekers use data to differentiate instruction in the classroom and adapt how they teach.
●● Aspirational users believe in using data but often find it overwhelming.
●● Scorekeepers rely on assessment data to help prepare students for state tests and other high-stakes assessments.
●● Perceptives rely on their own observations of how students are doing to guide instruction.
●● Traditionalists focus primarily on grades as a barometer of student progress and an indicator of where to focus their teaching.
Nearly half of teachers (48 percent) fall into the first two groups and are early adopters of data-driven instruction. But an equally large percentage of those surveyed say they are uncomfortable using digital tools to meet student learning objectives.
While teachers at every level of proficiency with data use and tools can be found in all schools, school environment matters. The proportion of data mavens is 15 percentage points higher in technology-forward schools than in other schools. These schools have principals proficient in technology, invest in technology and the staff to support it, provide dedicated time for teachers to make use of data, and give teachers the flexibility to choose the tools they use.
Making Data Work for Teachers and StudentsTeachers Know Best 5
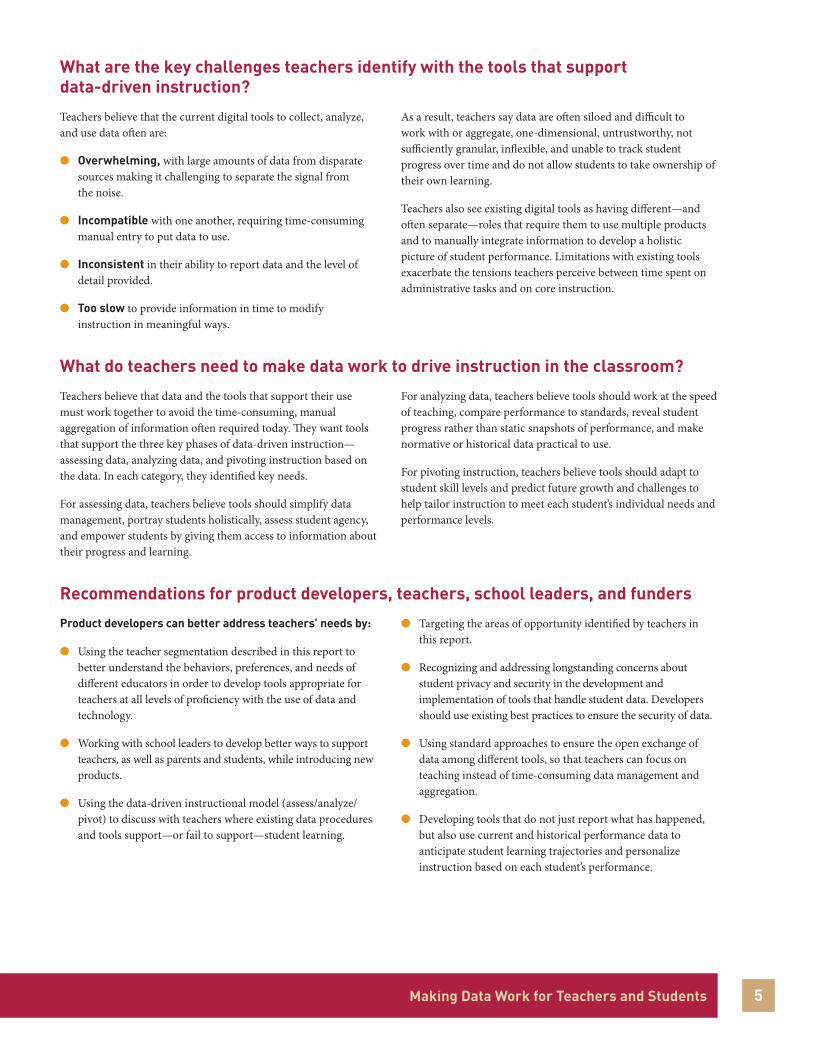
What are the key challenges teachers identify with the tools that support data-driven instruction?
Teachers believe that the current digital tools to collect, analyze, and use data often are:
●● Overwhelming, with large amounts of data from disparate sources making it challenging to separate the signal from the noise.
●● Incompatible with one another, requiring time-consuming manual entry to put data to use.
●● Inconsistent in their ability to report data and the level of detail provided.
●● Too slow to provide information in time to modify instruction in meaningful ways.
As a result, teachers say data are often siloed and difficult to work with or aggregate, one-dimensional, untrustworthy, not sufficiently granular, inflexible, and unable to track student progress over time and do not allow students to take ownership of their own learning.
Teachers also see existing digital tools as having different—and often separate—roles that require them to use multiple products and to manually integrate information to develop a holistic picture of student performance. Limitations with existing tools exacerbate the tensions teachers perceive between time spent on administrative tasks and on core instruction.
What do teachers need to make data work to drive instruction in the classroom?
Teachers believe that data and the tools that support their use must work together to avoid the time-consuming, manual aggregation of information often required today. They want tools that support the three key phases of data-driven instruction—assessing data, analyzing data, and pivoting instruction based on the data. In each category, they identified key needs.
For assessing data, teachers believe tools should simplify data management, portray students holistically, assess student agency, and empower students by giving them access to information about their progress and learning.
For analyzing data, teachers believe tools should work at the speed of teaching, compare performance to standards, reveal student progress rather than static snapshots of performance, and make normative or historical data practical to use.
For pivoting instruction, teachers believe tools should adapt to student skill levels and predict future growth and challenges to help tailor instruction to meet each student’s individual needs and performance levels.
Recommendations for product developers, teachers, school leaders, and funders
Product developers can better address teachers’ needs by:
●● Using the teacher segmentation described in this report to better understand the behaviors, preferences, and needs of different educators in order to develop tools appropriate for teachers at all levels of proficiency with the use of data and technology.
●● Working with school leaders to develop better ways to support teachers, as well as parents and students, while introducing new products.
●● Using the data-driven instructional model (assess/analyze/pivot) to discuss with teachers where existing data procedures and tools support—or fail to support—student learning.
●● Targeting the areas of opportunity identified by teachers in this report.
●● Recognizing and addressing longstanding concerns about student privacy and security in the development and implementation of tools that handle student data. Developers should use existing best practices to ensure the security of data.
●● Using standard approaches to ensure the open exchange of data among different tools, so that teachers can focus on teaching instead of time-consuming data management and aggregation.
●● Developing tools that do not just report what has happened, but also use current and historical performance data to anticipate student learning trajectories and personalize instruction based on each student’s performance.

Teachers Know Best6
Teachers can leverage tools to use data more effectively and support student learning by:
●● Collaborating with one another to master best practices for data-driven instruction, share how students are doing across classes, and discuss the implications of data.
●● Engaging school leaders in conversations around challenges and needs in the use of data.
●● Enabling students to participate in data-driven decisions about their learning whenever feasible and appropriate.
District and school leaders can support data-driven instruction by:
●● Using the data-driven instructional model to discuss where existing data procedures and tools support—or fail to support— student learning.
●● Restructuring learning environments to ensure that teachers have access to rich data every day and recognizing that the depth of data-driven instruction is dependent on the availability of high-quality tools that keep teachers from being overburdened with administrative tasks.
●● Seeking out and potentially incorporating existing solutions that innovative schools have already developed.
●● Supporting teachers by investing in the staff, training, dedicated time, and professional development needed to integrate tools and practice.
●● Engaging teachers in the process of identifying and selecting new tools and strategies.
●● Accelerating the shift to personalized learning by investing in infrastructure and high-quality tools.
●● Explaining to parents and community members the value of data-driven instruction and the safeguards in place to protect student information.
Funders can support developers and educators by:
●● Emphasizing high standards for data privacy and security, as well as tools that have demonstrated impact, interoperability, and interfaces that encourage the sharing and aggregation of data from multiple sources.
●● Encouraging developers to produce better, more scalable solutions that reduce teachers’ administrative burdens and measure student outcomes in multiple ways.
●● Supporting teachers by helping schools and systems identify the staff, training, and professional development needed to integrate tools and practice.
●● Taking an active role in sharing knowledge across teacher and school communities, including the creation of professional development that meets the needs of teachers at all levels of data and technology proficiency.
●● Being vocal advocates for teachers partnering with developers.
●● Targeting funding around the greatest opportunities for improvement and the largest market gaps.
Making Data Work for Teachers and StudentsTeachers Know Best 7
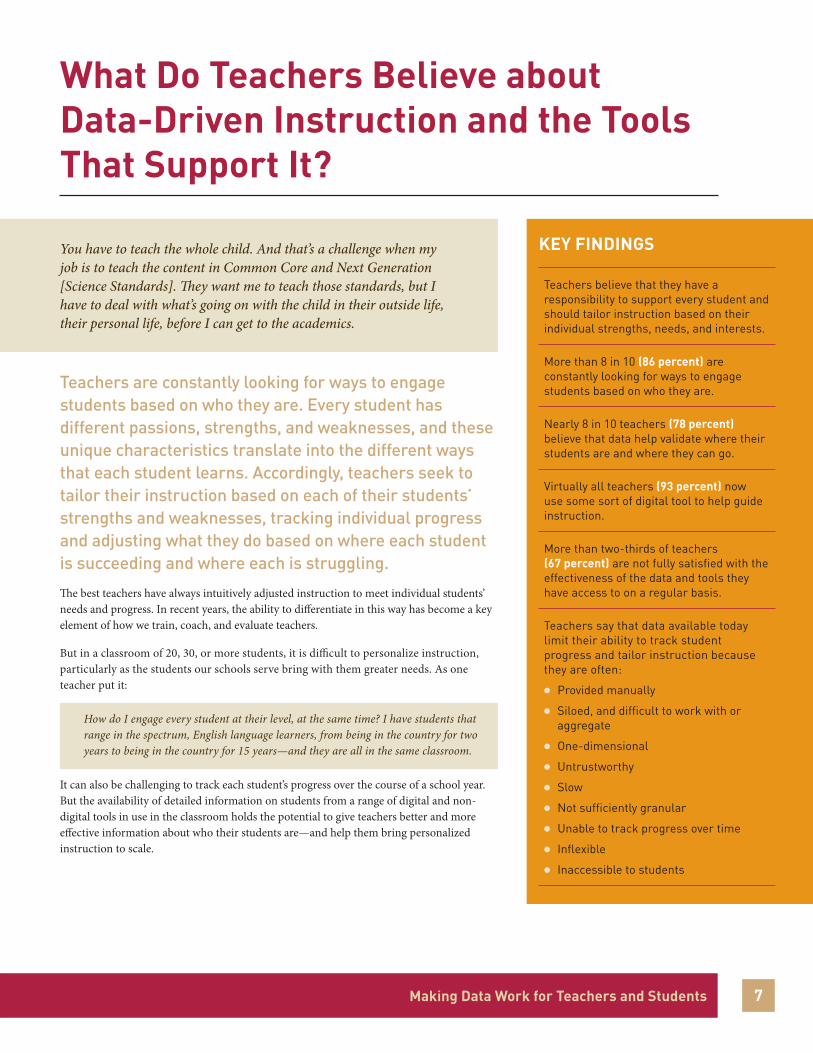
What Do Teachers Believe about Data-Driven Instruction and the Tools That Support It?
Teachers are constantly looking for ways to engage students based on who they are. Every student has different passions, strengths, and weaknesses, and these unique characteristics translate into the different ways that each student learns. Accordingly, teachers seek to tailor their instruction based on each of their students’ strengths and weaknesses, tracking individual progress and adjusting what they do based on where each student is succeeding and where each is struggling.
The best teachers have always intuitively adjusted instruction to meet individual students’ needs and progress. In recent years, the ability to differentiate in this way has become a key element of how we train, coach, and evaluate teachers.
But in a classroom of 20, 30, or more students, it is difficult to personalize instruction, particularly as the students our schools serve bring with them greater needs. As one teacher put it:
How do I engage every student at their level, at the same time? I have students that range in the spectrum, English language learners, from being in the country for two years to being in the country for 15 years—and they are all in the same classroom.
It can also be challenging to track each student’s progress over the course of a school year. But the availability of detailed information on students from a range of digital and non-digital tools in use in the classroom holds the potential to give teachers better and more effective information about who their students are—and help them bring personalized instruction to scale.
KEY FINDINGS
Teachers believe that they have a responsibility to support every student and should tailor instruction based on their individual strengths, needs, and interests.
More than 8 in 10 (86 percent) are constantly looking for ways to engage students based on who they are.
Nearly 8 in 10 teachers (78 percent) believe that data help validate where their students are and where they can go.
Virtually all teachers (93 percent) now use some sort of digital tool to help guide instruction.
More than two-thirds of teachers (67 percent) are not fully satisfied with the effectiveness of the data and tools they have access to on a regular basis.
Teachers say that data available today limit their ability to track student progress and tailor instruction because they are often:
●● Provided manually
●● Siloed, and difficult to work with or aggregate
●● One-dimensional
●● Untrustworthy
●● Slow
●● Not sufficiently granular
●● Unable to track progress over time
●● Inflexible
●● Inaccessible to students
You have to teach the whole child. And that’s a challenge when my job is to teach the content in Common Core and Next Generation [Science Standards]. They want me to teach those standards, but I have to deal with what’s going on with the child in their outside life, their personal life, before I can get to the academics.

Teachers Know Best8
In recent years, schools and districts across the country have focused extensively on the analysis of student data to identify both broader trends across classrooms and grade levels as well as areas of success and challenge for individual students. Considerable investments have been made in training teachers to examine student data to plan and personalize instruction, as well as in tools that allow this information to be collected, analyzed, and put to use in the classroom.
As a result of these investments, virtually all teachers—93 percent of the more than 4,600 teachers who responded to our survey—now use some sort of digital tool as an input to guide their instruction. Nearly half—44 percent—use these tools all of the time; virtually all others use them most of the time. In the right environments, as illustrated in the example below, the results can be transformative.
However, in most places data have proven difficult to actually put to use in the classroom. More than two-thirds of teachers surveyed—67 percent—are not fully satisfied with the effectiveness of the data and tools they have access to on a regular basis. They feel overwhelmed by the volume of data, worry that the data lack the detail required to address the needs of individual students, and believe that the laborious effort
required to pull data together for analysis takes time away from teaching and learning. The average teacher works more than 50 hours per week, and the teachers we surveyed acknowledged longstanding tensions between working directly with students and tasks perceived as more administrative in nature. Despite these challenges, when teachers were asked where they want to spend more time in a 2014 survey commissioned by the foundation, in large numbers they said they wanted to focus on activities that support data-driven instruction, such as lesson planning, reviewing student performance, tutoring students, and collaborating with other teachers.
The challenge, then, is maximizing the limited time teachers have by making the process of collecting data, analyzing them, and putting them to use more efficient. Creating digital tools that better meet teachers’ needs could help personalize learning for students by empowering them to identify where students are in their understanding and tailor instruction to their skills, needs, and interests. A deeper understanding of what teachers believe about data-driven instruction and the tools that support it can serve as a guide to identifying opportunities to improve existing tools and create new ones.
IN CALIFORNIA, REACHING THE SUMMIT OF DATA-DRIVEN INSTRUCTIONElizabeth Dogget remembers how hard it was to personalize instruction to meet student needs while she was student teaching. “It was really difficult to track where my students were on their progress towards meeting a learning objective and giving them timely feedback,” she recalls. “Often I would take a bunch of stuff home over the weekend, but by the time I got through giving them all feedback, it would be too late for them to make meaningful changes.”
Now a teacher at Summit Public Schools, a charter school group in the San Francisco Bay Area, Dogget has access to a broad range of data on each student at her fingertips. Summit’s Personalized Learning Plan, a student dashboard designed in-house, gives both teachers and students access to not just assessment data, but also individual students’ goals and the progress they are making toward them. Fine-grained data from multiple classrooms allow teachers to modify instruction to meet individual students’ needs—for example, simplifying the language on a math test to help English language learners who understand the concepts but may struggle with the wording.
Teachers can also analyze data to identify peers to collaborate with on specific subject areas. “Maybe at one school, students are really struggling in this area, but at this one they’re not—so what is that teacher doing?” explains teacher Jessica Breed. “I want to borrow that strategy, or that graphic organizer, or the different way you explained this concept.”
A key to Summit’s approach is giving students access to their data—and tools to do something with them. Students log into their Personalized Learning Plan daily to set learning and personal goals with the help of their teachers, track their progress, receive feedback, and access learning resources. Parents also have access to the same dashboard, giving them understanding and shared ownership of their children’s progress.
Access to personalized content that meets students where they are is a key to Summit’s approach with the system, says Jon Deane, Summit’s chief information officer. “Even on the best days as a great teacher, differentiating on where students are for content knowledge is pretty darn hard,” he says. “Students should be able to access what they need at the moment they need it, and we provide the resources so that they can do that.”
Summit teachers say the Personalized Learning Plans have transformed the way they teach. “I can’t imagine teaching without having all of this data at my fingertips,” Dogget says. “It makes my life so much easier. It makes the students’ lives so much easier. It makes me a better teacher, and it makes them more successful students.”

Making Data Work for Teachers and StudentsTeachers Know Best 9
Common Goals and Values
Whether they teach in traditional schools or ones at the forefront of adopting new technologies and instructional strategies, teachers believe in the need to engage students on an individual level, to help students take ownership of what they are learning, and to make sure no student falls between the cracks.
Teachers are committed to meeting students where they are. A large majority of teachers (86 percent) told us they are constantly looking for ways to engage students based on who they are.
Teachers value student responsibility. Equally large numbers of teachers (87 percent) believe that the best way for students to learn is to take ownership of their own education.
Teachers believe they have a responsibility to support every student. Among a list of items teachers were asked to rate in terms of importance, reassurance that no student falls between the cracks was considered highly important.
TEACHERS WANT TO SEE THEIR STUDENTS SUCCEED
COMMITMENT TO STUDENTS
86%of teachers are constantly looking for ways to engage students based on who they are.
STUDENT RESPONSIBILITY
87%of teachers believe the best way for students to learn is to take ownership of their education.
SUPPORTING EVERY STUDENT
82Teachers rated “reassurance that no student falls between the cracks” as extremely important.
0not important
100important
The Value of Data
Teachers also overwhelmingly believe that it’s important to know how their students are doing, both inside and outside of the classroom.
Teachers value data as a tool. Nearly 8 in 10 teachers (78 percent) surveyed believe that data help validate where their students are and where they can go. Data help identify misconceptions, struggles, and competencies.
Teachers believe differentiation is a must. Nearly 7 in 10 teachers (69 percent) surveyed believe that tailoring instruction to meet the needs of individual students is required to improve student achievement. As one teacher put it:
I think we all like the sense that someone is paying attention to us individually, and individualizing for us, and taking us into account. And also I think it gives some hope for students that have been struggling and not seeing much progress to say, “Can you focus on that?” It’s just like if you are going to a gym or something, if you can target something, it makes it more manageable.
Teachers believe that using data improves what they do. A majority (61 percent) of teachers surveyed believe that data and digital tools make them better teachers.
Digital tools that help track students are critical. Almost all (91 percent) of the teachers surveyed believe it’s very or extremely important that these tools help them see how the entire class is doing.

Teachers Know Best10
Tools to Help Teachers Gather, Analyze, and Use Data
In classrooms today, virtually all teachers—more than 9 in 10 of those surveyed—use a mix of digital and non-digital strategies and tools to gather and use data for instruction.
Non-digital approaches range from the traditional gradebook and quick, formative assessments such as “exit tickets” to student projects and journals, grouped student discussions, and the teacher’s observations of student behavior and performance. In some schools, students are encouraged to track their own performance, which is shared publicly on a data wall or similar display.
Digital tools include enhancements of traditional approaches, such as digital gradebooks, teacher-updated Excel spreadsheets, and dashboards of student performance that compile data from multiple sources. They also include digital assessments, including ones mandated by districts, ones aligned to the Common Core State Standards or textbooks, and formative and summative assessment tools. Other digital tools that provide data to teachers include enrichment and assessment tools; instructional courseware that moves students through content as they master it; digital remediation tools; performance-based skill classifications; and test creation, administration, and scoring tools.
The Dilemma of Data
As we have seen, the need to educate all students in ways that meet their individual needs is a core belief of educators. Vast majorities believe that data and the digital tools that help them make use of data are invaluable tools in improving teaching through differentiation and personalization. And virtually all teachers—93 percent—are now using digital tools along with non-digital practices to shape instruction.
Yet, as previously stated, more than two-thirds of teachers— 67 percent—are not fully satisfied with the effectiveness of the data and the tools they have access to. And all educators face common challenges with the use of data to drive instruction.
TEACHERS USE A MIX OF DIGITAL AND NON-DIGITAL TOOLS TO GUIDE INSTRUCTION
93%OF TEACHERS USE DIGITAL TOOLS
90%OF TEACHERS USE NON-DIGITAL TOOLS
●● Digital gradebook
●● Automatically uploaded grades
●● Dashboard
●● Excel spreadsheet
●● District-mandated assessments
●● Common Core assessment alignment tool
●● Digital instruction tied to textbooks
●● Digital enrichment/assessment tools
●● Mastery-based advancement features
●● Summative assessment tools
●● Digital remediation tools
●● Test banks tied to Common Core
●● Performance-based skill classification
●● Test creation, administration, and scoring tools
●● Student observation
●● Quick, formative assessments
●● Student projects and journals
●● Grouped student discussions
●● Rubric assessment tool
●● Gradebook
●● Public, self-driven student tracking

Making Data Work for Teachers and StudentsTeachers Know Best 11
DATA EXACERBATE THE TRADEOFFS TEACHERS FACE
Teachers are faced with perennial tensions: assessing the needs of the whole class while meeting the needs of individuals and balancing administrative tasks with interactions with students.
ADMINISTRATIVE TASKS
INDIVIDUAL WHOLE CLASS
CLOSE RELATIONSHIPS WITH STUDENTS
At the heart of these challenges is a familiar problem: the limited time teachers have and the tradeoffs they have always been forced to make between administrative tasks and their desire to spend as much time as possible working directly with students. Teachers have always wanted to spend more time teaching and less time grading, and the proliferation of data and the growing expectation that they be put to use has added additional tensions and tradeoffs for teachers. As one teacher put it:
I feel like I spend so much more time doing paperwork than I do developing lessons at this point.
Teachers believe that the growing quantities of data now available have made administrative tasks more time-consuming, distracting them from building close relationships with their students. And teachers’ desires to assess the needs of their classes as a whole while meeting the needs of individual students has been challenged by data that are difficult to aggregate or that lack the detail needed to meet individual needs.
The two primary reasons teachers use data—to understand how their students are doing and to generate feedback to tailor instruction—are also both limited by the data and tools available today, as seen by the examples that follow.
Understanding the full extent of student progress. To grasp the full extent of the progress of both individual students and the class as a whole, teachers need information about all elements of student performance. However, too often data are:
●● Provided manually, requiring time to prepare data for analysis that could otherwise be used to creatively plan instruction. For example, data are often organized at the student level, making it difficult to develop an aggregated classroom view. As one teacher put it:
It’s just annoying and time-consuming. It’s not difficult to put the data in, but … that’s an hour of time that I need to take these scores and put them over here. I could be using that time to plan a lesson.
●● Siloed, making it challenging to develop a holistic view of individual students or a class. For example, in many places a math teacher may not be able to see how a student is performing in science or how other math students are doing in classes taught by other teachers. In many places, performance data aren’t integrated with demographic data, requiring additional manual aggregation of data—and additional steps for teachers—to get a complete view of each student.

Teachers Know Best12
●● One-dimensional, such as assessment data that focus on a thin slice of academic performance instead of broader measures of student development, including the ability to take ownership in learning, solve problems, and persevere through challenging work. As one teacher said:
When you look at the test score, it’s an indicator of where the child was at that moment. But the test is not the full picture. I have to see their work ethic. I have to see what they do in the classroom, in front of me.
●● Untrustworthy, with tools lacking the transparency that teachers need to trust the data they generate. As one teacher explained:
You really have to take it beyond what the numbers say and actually look at the test itself. If you don’t look at the test itself and you just go with what the numbers say, you are not going to get a true picture of what the standards mastery would be.
Providing feedback that can be used to tailor instruction. If data are to drive an ongoing cycle of feedback and changes in instruction, they must be actionable. However, too often data are:
●● Slow. Data and the subsequent analysis come too late to be included in an ongoing cycle of teaching and learning. In these cases, data document instead of drive instruction.
●● Not sufficiently granular, meaning the information is not detailed enough to drive instruction. For example, data from formative assessments may identify broad standards where students struggled, but not the specific concepts or skill sets where misunderstandings occurred.
●● Unable to track progress over time. Single points of data reduce students to a score on narrow measures of student performance rather than revealing broader, ongoing trends that allow teachers to track progress over time.
●● Inflexible. Digital data can’t be manipulated the way teachers want. In particular, teachers can’t drill down to the level of detail needed to drive instruction.
●● Inaccessible to students. Many teachers say they want students to take ownership of their own learning and progress, but students don’t have timely access to performance data that would allow them to do so.
While data-focused digital tools alone cannot address all of these challenges, they do offer potential solutions to many of the workflow and time issues teachers face. When done right, they could reduce, not increase, the amount of time teachers spend analyzing data, giving them more time to plan and deliver instruction to students. These tools could also help teachers seamlessly aggregate performance trends at the classroom level while drilling down to get a picture of each of their students. However, the high percentage of teachers dissatisfied with the effectiveness of data and digital tools today suggests that much still needs to be done to reach a point where teachers believe these tools will help, not hinder, their efforts to develop close relationships with their students.
While teachers face common challenges, they also put data and the digital tools that support them to use in different ways. In the sections that follow, we examine in more detail the different approaches teachers take with data and the challenges they face in using digital tools intended to simplify the process.

Making Data Work for Teachers and StudentsTeachers Know Best 13
How Do Teachers Use Data to Tailor Instruction?The use of data and digital tools by teachers to differentiate instruction is characterized by different approaches and common struggles.
How Data Shape Instruction
Data-driven instruction is typically defined by cycles. While the specific models and approaches teachers use to interpret data and put them to use in instruction vary, the teachers we surveyed for this report identified common parts of a cycle that is repeated many times over the course of a school year. As seen in the illustration on p. 14, the result is a loop that, over time, moves student understanding forward.
The components of a typical data cycle include:
Plan and teach. Teachers plan and deliver lessons to students, often using data from previous lessons or formative assessments to identify the areas of emphasis for the lesson and strategies for use in whole-class or small-group instruction.
Assess. After lessons, teachers take stock of where their students are and the depth of their understanding. These assessments can vary from informal “exit tickets” given at the end of a daily lesson to ensure that students learned key points to broader assessments of deeper understanding.
Analyze. Individually and in teams, teachers break down the results of assessments to identify areas of need. Data analysis can help pinpoint misconceptions, such as a key concept a teacher may have believed that he or she conveyed correctly but did not, and areas of struggle for both individual students and the class as a whole that signal the need for reteaching or additional instruction. Data analysis can also reveal areas where students have mastered a topic and need no further instruction.
Pivot. Based on the analysis of student data, teachers adjust their approach to address student needs. This could involve reteaching a key concept to the class as a whole, in the case of a widespread misconception, or identifying individual students or small groups of students for targeted instruction.
Plan and teach. These changes are implemented into plans for the next round of teaching, and the cycle begins anew.
For this approach to be effective, data must be readily available within the timeframe of the data cycle to drive a tight feedback loop that allows teachers to assess students, analyze understanding, and pivot instruction quickly and seamlessly on an ongoing basis. Tools that help teachers collect and make sense of data are needed to make this process a consistent part of teaching practice.
KEY FINDINGS
Data-driven instruction is driven by cycles that provide a feedback loop in which teachers assess student understanding through the collection of data, analyze the data, and pivot instruction based on insights from their analysis of the data.
Teachers vary in their approaches to using data and the technology that supports their use, with six key segments:
●● Data mavens, who focus on individualized learning plans that address the whole student.
●● Growth seekers, who use data to differentiate instruction in the classroom and adapt how they teach.
●● Aspirational users, who believe in using data but often find it overwhelming.
●● Scorekeepers, who mainly use assessment data to help prepare students for state tests and other high-stakes assessments.
●● Perceptives, who rely on their own observations of how students are doing to guide instruction.
●● Traditionalists, who focus primarily on grades as a barometer of student progress and where to focus instruction.
A strong dichotomy exists among teachers when it comes to innovation. Nearly half of teachers (48 percent) are among early adopters of data and related innovations. However, 50 percent of teachers surveyed say they are uncomfortable using digital tools to meet student learning objectives.
School environment matters—the proportion of data maven teachers is 15 percentage points higher in technology-forward schools, which have principals who are proficient in technology, invest in technology and the staff to support it, provide dedicated time for teachers to make use of data, and give teachers flexibility to choose tools. However, teachers at every level of proficiency with the use of data and related tools can be found in all schools.

Teachers Know Best14
How Teachers Use Data to Tailor Instruction
To understand how digital tools can be used more effectively, it’s important to examine the ways in which teachers currently tailor instruction. Our research segmented teachers into six groups based on their current comfort level and use of data to inform instruction. Rather than factors like age or experience, these groups are based on teachers’ mindsets when it comes to differentiated instruction and their use of technology to support it.
Data mavens are deeply committed to finding ways to adapt instruction with the data they have—and they want as much data as possible to support the whole student. They focus on data collected over time, along with information about student growth, student strengths and weaknesses, and student engagement. As one teacher put it:
A student history would enable us to create a learning plan for the student. … It would come in with them the day they walked in [and] we could really start immediately teaching the student according to their needs.
More than 8 in 10 of these highly proficient data users believe that the use of technology in their classes makes their day easier, makes them more responsive to student needs, and helps identify gaps in student learning that would have been missed through traditional means. They are also more likely than other teachers to discuss student data and instructional strategies with their peers.
They are capable in the use of data and confident in their ability to differentiate instruction. They are most likely to believe that every student should have a personalized learning plan that focuses on the whole child—academic performance, as well as socioemotional needs. They are also first to adopt tools that enable greater personalization to meet individual students’ needs.
Growth seekers also believe that data about student understanding help them tailor what students learn by differentiating instruction in the classroom. Further, they believe that data from students on their own performance help them adapt how they teach. As two teachers put it:
I do a lot of data analysis ... and I will group [students] and differentiate the activity that we are doing based on where they are. I’ll differentiate what we’re reading. I’ll group students based on their ability level. Sometimes I’ll put a high ability level with a low ability level and group them. I’ll change the activity based on the class.
I always like to use my assessments more as a learning log, so I can see what they learned, how I can improve.
CYCLES OF DATA COLLECTION DRIVE EFFECTIVE INSTRUCTION
PIVOT
Adjust my approach to address what I have learned.
ANALYZE
Pinpoint misconceptions, struggles, and competencies.
ASSESS
Take stock of the depth of understanding.
PLAN AND TEACH
Implement changes to my instruction.
Making Data Work for Teachers and StudentsTeachers Know Best 15
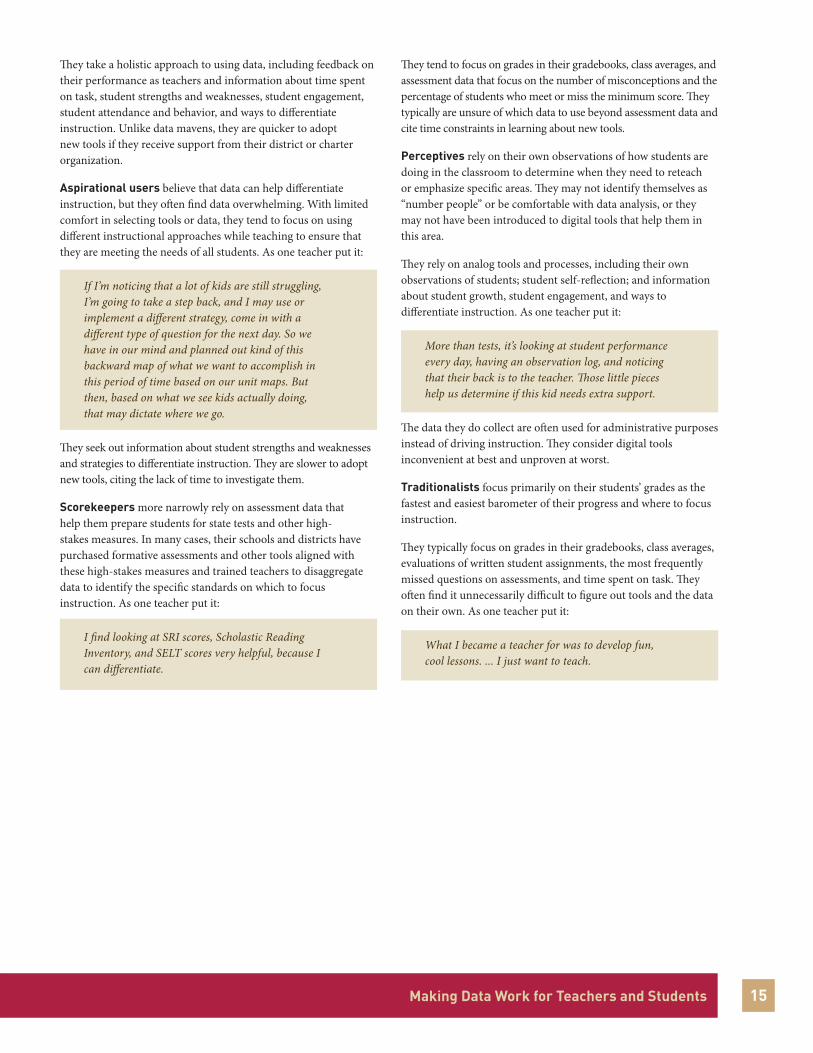
They take a holistic approach to using data, including feedback on their performance as teachers and information about time spent on task, student strengths and weaknesses, student engagement, student attendance and behavior, and ways to differentiate instruction. Unlike data mavens, they are quicker to adopt new tools if they receive support from their district or charter organization.
Aspirational users believe that data can help differentiate instruction, but they often find data overwhelming. With limited comfort in selecting tools or data, they tend to focus on using different instructional approaches while teaching to ensure that they are meeting the needs of all students. As one teacher put it:
If I’m noticing that a lot of kids are still struggling, I’m going to take a step back, and I may use or implement a different strategy, come in with a different type of question for the next day. So we have in our mind and planned out kind of this backward map of what we want to accomplish in this period of time based on our unit maps. But then, based on what we see kids actually doing, that may dictate where we go.
They seek out information about student strengths and weaknesses and strategies to differentiate instruction. They are slower to adopt new tools, citing the lack of time to investigate them.
Scorekeepers more narrowly rely on assessment data that help them prepare students for state tests and other high-stakes measures. In many cases, their schools and districts have purchased formative assessments and other tools aligned with these high-stakes measures and trained teachers to disaggregate data to identify the specific standards on which to focus instruction. As one teacher put it:
I find looking at SRI scores, Scholastic Reading Inventory, and SELT scores very helpful, because I can differentiate.
They tend to focus on grades in their gradebooks, class averages, and assessment data that focus on the number of misconceptions and the percentage of students who meet or miss the minimum score. They typically are unsure of which data to use beyond assessment data and cite time constraints in learning about new tools.
Perceptives rely on their own observations of how students are doing in the classroom to determine when they need to reteach or emphasize specific areas. They may not identify themselves as “number people” or be comfortable with data analysis, or they may not have been introduced to digital tools that help them in this area.
They rely on analog tools and processes, including their own observations of students; student self-reflection; and information about student growth, student engagement, and ways to differentiate instruction. As one teacher put it:
More than tests, it’s looking at student performance every day, having an observation log, and noticing that their back is to the teacher. Those little pieces help us determine if this kid needs extra support.
The data they do collect are often used for administrative purposes instead of driving instruction. They consider digital tools inconvenient at best and unproven at worst.
Traditionalists focus primarily on their students’ grades as the fastest and easiest barometer of their progress and where to focus instruction.
They typically focus on grades in their gradebooks, class averages, evaluations of written student assignments, the most frequently missed questions on assessments, and time spent on task. They often find it unnecessarily difficult to figure out tools and the data on their own. As one teacher put it:
What I became a teacher for was to develop fun, cool lessons. ... I just want to teach.
Teachers Know Best16
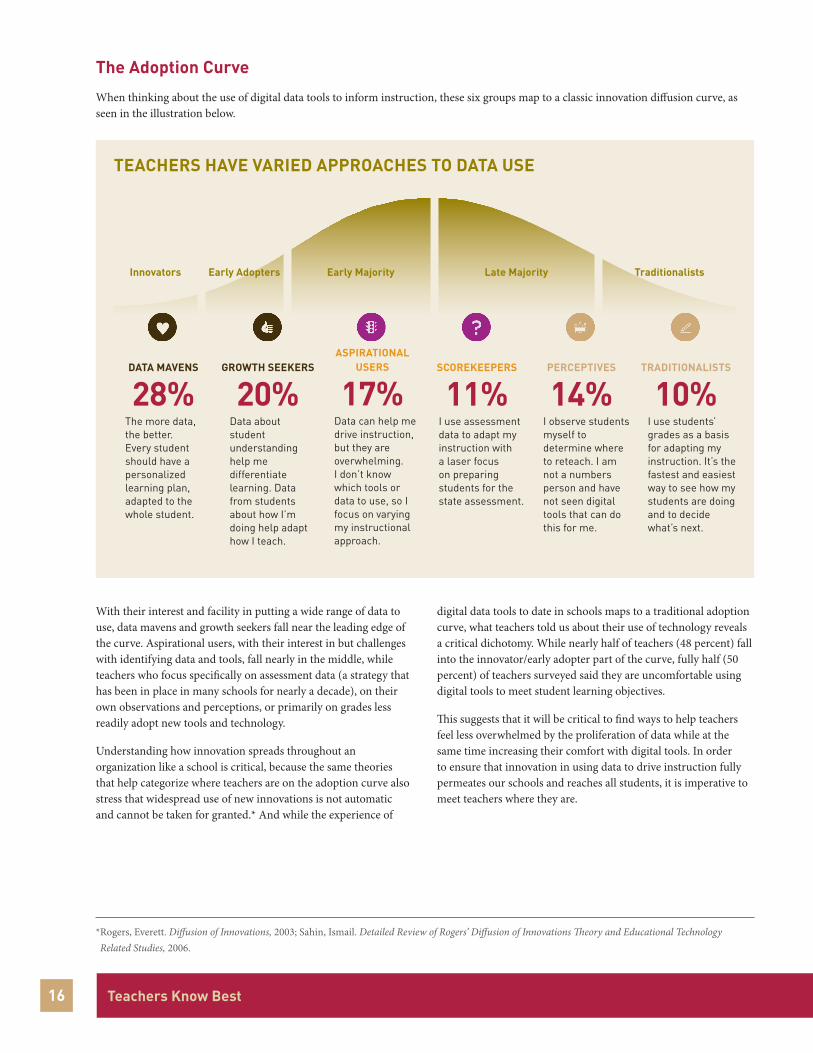
The Adoption Curve
When thinking about the use of digital data tools to inform instruction, these six groups map to a classic innovation diffusion curve, as seen in the illustration below.
TEACHERS HAVE VARIED APPROACHES TO DATA USE
Innovators Early Adopters Early Majority Late Majority Traditionalists
DATA MAVENS
28%The more data, the better. Every student should have a personalized learning plan, adapted to the whole student.
GROWTH SEEKERS
20%Data about student understanding help me differentiate learning. Data from students about how I’m doing help adapt how I teach.
ASPIRATIONAL USERS
17%Data can help me drive instruction, but they are overwhelming. I don’t know which tools or data to use, so I focus on varying my instructional approach.
SCOREKEEPERS
11%I use assessment data to adapt my instruction with a laser focus on preparing students for the state assessment.
PERCEPTIVES
14%I observe students myself to determine where to reteach. I am not a numbers person and have not seen digital tools that can do this for me.
TRADITIONALISTS
10%I use students’ grades as a basis for adapting my instruction. It’s the fastest and easiest way to see how my students are doing and to decide what’s next.
* Rogers, Everett. Diffusion of Innovations, 2003; Sahin, Ismail. Detailed Review of Rogers’ Diffusion of Innovations Theory and Educational Technology Related Studies, 2006.
With their interest and facility in putting a wide range of data to use, data mavens and growth seekers fall near the leading edge of the curve. Aspirational users, with their interest in but challenges with identifying data and tools, fall nearly in the middle, while teachers who focus specifically on assessment data (a strategy that has been in place in many schools for nearly a decade), on their own observations and perceptions, or primarily on grades less readily adopt new tools and technology.
Understanding how innovation spreads throughout an organization like a school is critical, because the same theories that help categorize where teachers are on the adoption curve also stress that widespread use of new innovations is not automatic and cannot be taken for granted.* And while the experience of
digital data tools to date in schools maps to a traditional adoption curve, what teachers told us about their use of technology reveals a critical dichotomy. While nearly half of teachers (48 percent) fall into the innovator/early adopter part of the curve, fully half (50 percent) of teachers surveyed said they are uncomfortable using digital tools to meet student learning objectives.
This suggests that it will be critical to find ways to help teachers feel less overwhelmed by the proliferation of data while at the same time increasing their comfort with digital tools. In order to ensure that innovation in using data to drive instruction fully permeates our schools and reaches all students, it is imperative to meet teachers where they are.
Making Data Work for Teachers and StudentsTeachers Know Best 17
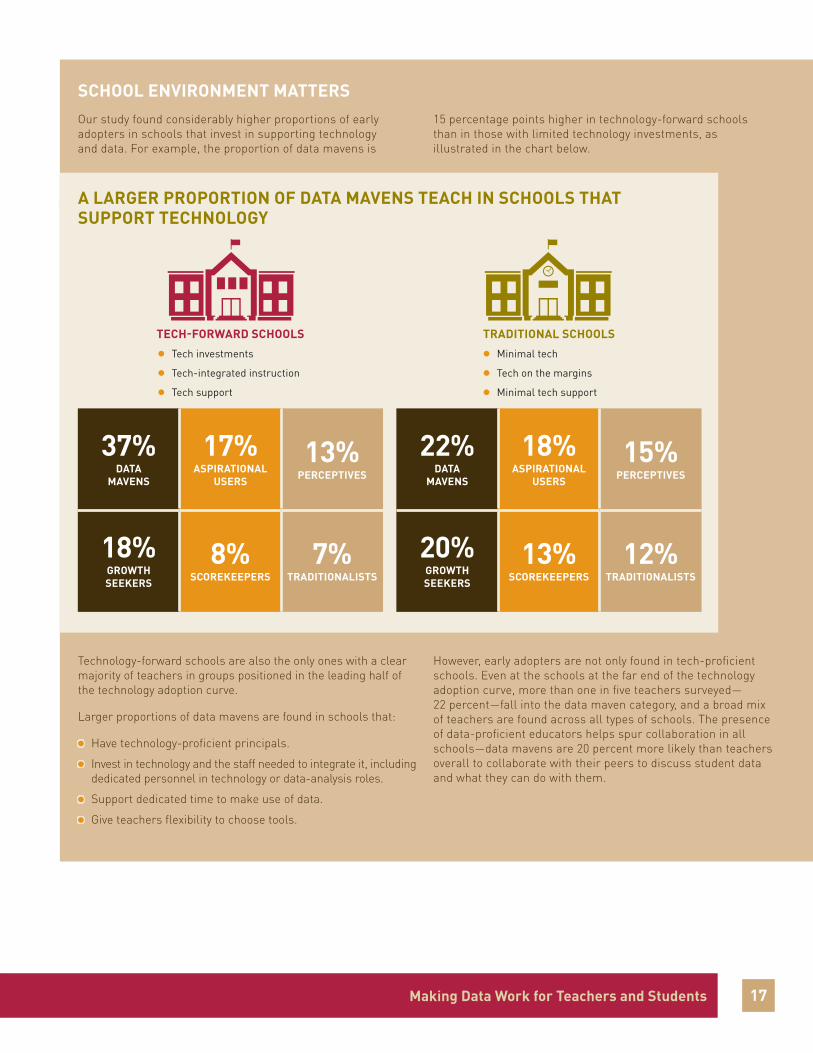
SCHOOL ENVIRONMENT MATTERSOur study found considerably higher proportions of early adopters in schools that invest in supporting technology and data. For example, the proportion of data mavens is
15 percentage points higher in technology-forward schools than in those with limited technology investments, as illustrated in the chart below.
Technology-forward schools are also the only ones with a clear majority of teachers in groups positioned in the leading half of the technology adoption curve.
Larger proportions of data mavens are found in schools that:
●● Have technology-proficient principals.
●● Invest in technology and the staff needed to integrate it, including dedicated personnel in technology or data-analysis roles.
●● Support dedicated time to make use of data.
●● Give teachers flexibility to choose tools.
However, early adopters are not only found in tech-proficient schools. Even at the schools at the far end of the technology adoption curve, more than one in five teachers surveyed— 22 percent—fall into the data maven category, and a broad mix of teachers are found across all types of schools. The presence of data-proficient educators helps spur collaboration in all schools—data mavens are 20 percent more likely than teachers overall to collaborate with their peers to discuss student data and what they can do with them.
A LARGER PROPORTION OF DATA MAVENS TEACH IN SCHOOLS THAT SUPPORT TECHNOLOGY
TECH-FORWARD SCHOOLS●● Tech investments
●● Tech-integrated instruction
●● Tech support
TRADITIONAL SCHOOLS●● Minimal tech
●● Tech on the margins
●● Minimal tech support
37%DATA
MAVENS
17%ASPIRATIONAL
USERS
13%PERCEPTIVES
18%GROWTH SEEKERS
8%SCOREKEEPERS
7%TRADITIONALISTS
22%DATA
MAVENS
18%ASPIRATIONAL
USERS
15%PERCEPTIVES
20%GROWTH SEEKERS
13%SCOREKEEPERS
12%TRADITIONALISTS

Teachers Know Best18
What Are Key Challenges Teachers Identify with the Tools That Support Data-Driven Instruction?
Teachers face common challenges with the use of data to drive instruction and the tools that help them do so. They see these tools as serving different and often separate roles — an issue greatly exacerbated by the inability of many present-day tools to share information with each other.
Digital Tools: What’s Not Working
With the proliferation of digital instructional tools in the classroom that can capture an assortment of student performance and engagement information in real time, teachers today are confronted with more information on their students, from more sources, than ever before.
Given the array of competing pressures on teacher time, it’s not surprising that the key challenges with digital tools, as with the data they collect, largely center around the time and effort it takes to understand, adopt, and put the information they generate to use. Teachers say digital tools often are:
Overwhelming. Growing amounts of data—and the increasing number of sources data come from—can lead teachers to feel overloaded with information on their students. As a result, teachers say they struggle to separate the signal from the noise. Teachers also report being unsure of which data and tools to use in their classrooms.
Incompatible. Digital products aren’t often compatible with one another. The limited use of application programming interfaces (APIs) and other mechanisms (such as common file formats and standards promoting interoperability) that allow products to share information with each other means that data from one tool may not flow to another. This requires teachers to spend excessive amounts of time on data entry before they can even begin analyzing information from multiple sources—which is precisely what they say is critical to developing a complete picture of each student. One teacher described this process as follows:
Right now, part of why it takes so long is because I am taking the standards from the report card, I put them in a spreadsheet, I print out the spreadsheet, I input all the kids’ names, I print out the spreadsheet with all their names on it. As I’m assessing them, and talking to them, and working with them, I’m filling in the spreadsheet. And then I take my hand-written spreadsheet and bring it to the computer, and input all the grades.
KEY FINDINGS
Teachers believe that present-day digital instructional tools focused on the collection, analysis, and use of data often are:
●● Overwhelming, with large amounts of data from disparate sources making it challenging to separate the signal from the noise.
●● Incompatible with one another, requiring time-consuming manual entry to put data to use.
●● Inconsistent in their ability to report data and the level of detail provided.
●● Too slow to provide information in time to modify instruction in meaningful ways.
Teachers currently see existing digital tools as having different—and often separate—roles that require them to use multiple products and manually integrate information to develop a holistic picture of student performance.
Limitations with existing tools exacerbate the tension teachers perceive between administrative tasks and core instruction.

Making Data Work for Teachers and StudentsTeachers Know Best 19
Inconsistent. Different digital tools vary in their ability to report data—some allow teachers to download data reports to spreadsheets like Excel for their own analysis, while others do not. Some products also offer different ways to filter or drill down into different elements of student performance that others don’t. As
a result, teachers again must spend considerable time organizing data for consistency before they can be used.
Too slow. When data from digital products aren’t provided in real time, teachers can’t use data to make timely adjustments to instruction.
HOW TEACHERS VIEW PRESENT-DAY TOOLSTo identify the key challenges teachers face with current tools, we studied tools focused on data to identify how teachers perceive and use them.
Teachers use these tools at various points during the data-driven instructional cycle (assess/analyze/pivot). Since
teachers see these tools as serving separate and often distinct roles (as detailed in the tables below), they often use multiple tools to drive instruction and are forced to manually integrate information to develop the collective picture these tools show about their students.
THE DIFFERENT ROLES OF TODAY’S DATA-FOCUSED TOOLS
Record student behavior in real time
Measure student engagement with the material
Measure student engagement in class
Administer quick formative assessments in class
Check for understanding during a lesson with formative assessment
Check for understanding with electronic exit slips/tickets
Evaluate written assignments
Administer content and quizzes for enrichment
Administer content and quizzes for remediation
Collect and track student reflections about learning
Enable students to track and share their own progress with the class
Provide ongoing qualitative feedback to teachers
Access a digital test bank tied to Common Core
Create, administer, and score a digital test
Automatically calculate grades with a digital gradebook
Automatically upload grades
Check for mastery at the end of a unit with summative assessment
Track performance manually via spreadsheet
Fulfill district-mandated assessment requirements
ASSESS
Summarize historical student achievement in prior years
Determine student placement prior to instruction with pre-assessment
Observe students during class
Enable project collaboration and allow teacher to view work in progress
Tie lessons and quizzes to textbooks
Align quiz/test questions with Common Core or state-specific standards
Track student performance, attendance, and behavior via dashboard
Track student performance from multiple instructional tools via dashboard
Paint a portrait of student performance across subjects
Break down performance data to specific skills
Disaggregate district-mandated test data to identify learning gaps
Predict student performance based on past performance
ANALYZE
Create “hypotheses” to explain learning gaps
Adapt learning roadmap or learning plan
Automatically adapt lessons for the same subject to differing student skill levels
Personalize curriculum based on student strengths and weaknesses
Suggest student groups based on level
Break students into groups to discuss or present
Allow progression based on mastery
PIVOT

Teachers Know Best20
Time and Tradeoffs
Again, the key challenge for teachers seeking to use data-focused tools to shape instruction comes back to time. A look at the schedule of an average K–12 teacher shows how the typical school schedule makes it challenging for teachers to personalize instruction.
TEACHERS HAVE LITTLE TIME FOR THOUGHTFUL INSTRUCTIONAL PLANNING DURING THE SCHOOL DAY
■ Instructional design and development ■ Instructional delivery ■ Administrative tasks ■ Planned collaboration
BY THE NUMBERS ...
~7.5 hours per
week
average time spent on instructional planning during school hours (including planning periods, professional learning communities, and grade-level meetings)
~9 hours per
week
additional time spent on instructional workflow outside of school hours
S M T W T F S
8 a.m.
9 a.m.
10 a.m.
11 a.m.
12 p.m.
1 p.m.
2 p.m.
3 p.m.
4 p.m.
5 p.m.
6 p.m.
7 p.m.
8 p.m.
Arrive/prep classroom
Class time
Lunch
Planning period Planning period
PLC meeting
Class time
Class time
Class time
Class time
Extended day—class time
Class time
Grading/copying/
preparing material
Grade-level meeting
Writing lesson plan
for the week
Developing lesson content/assignments for the next day; searching for new ideas online
Preparing/reviewing
data
BEFORE SCHOOL
SCHOOL HOURS
AFTER SCHOOL
“On evenings or weekends, that’s when I plan out my lessons ... what we’ll cover start to finish … differentiate the instruction, choose the videos, get it all together.”
“[During planning periods] I’m writing notes to parents, fixing up the room, making photocopies, thinking about what we’re going to do today ... feel like I can’t use my preps for planning most of the time.”
Planning period
Class timeClass time

Making Data Work for Teachers and StudentsTeachers Know Best 21
While the average teacher reports spending 7.5 hours per week on instructional planning during school hours, much of that time is spent in meetings and performing more immediate administrative tasks, such as writing notes to parents and making copies. As a result, the average teacher spends roughly nine hours per week outside of school hours on instructional design and development.
This time crunch exacerbates the tradeoff teachers face between administrative tasks and core instruction. It also makes finding ways to ensure that data are readily available and usable for teachers all the more important so they can make the best use of their limited time to plan and personalize instruction.
Thinking back to the data cycle that drives differentiated instruction, teachers say they are spending so much time assembling, assessing, and analyzing data that they have little time to actually alter instruction—which is the end goal of data and the tools that provide them. It is the data cycle itself that teachers say provides the strongest opportunities to improve digital tools that work with data, as is detailed in the section that follows.

Teachers Know Best22
What Do Teachers Need to Make Data Work to Drive Instruction in the Classroom?
Teachers tell us that data and data tools must do two things to truly drive meaningful changes in instruction: they must work well together, and they must collectively support each phase of data-driven instruction—by assessing student performance, analyzing struggles and strengths, and pivoting instruction to meet the needs identified. Together, these requirements suggest opportunities for developers of digital tools to improve existing products by enabling them to work with other tools more efficiently and to create new tools that support the most effective ways in which teachers use data in classrooms.
Playing Well with Others: Integration and Interoperability
As illustrated on p. 10, teachers typically use multiple tools to collect and analyze data. As a result, they often must resort to time-consuming, manual aggregation of information from different tools to create a collective picture of their students and how they are doing in the classroom.
Since teachers use different kinds of data in different ways to inform instruction, no one tool will ever meet all of a teacher’s needs. As a result, developers should seek ways to allow their products to easily share information with other tools to help teachers collect nuanced and useful data without requiring them to resort to manual manipulation of information from different tools or sources.
Key goals for digital tools described by teachers include:
Basic integration, including combining data from multiple sources in ways that make it easier for teachers to identify performance trends and other key areas. For example:
●● Information from multiple applications can be combined in a digital gradebook or dashboard.
●● Demographic information from sources such as student information systems can be integrated with performance data from data tools to provide a more holistic view of students.
KEY FINDINGS
Teachers believe that data and the tools that support their use must work together to avoid the time-consuming, manual aggregation of information often required today.
Teachers want tools that support the three key phases of data-driven instruction: assessing data, analyzing data, and pivoting instruction based on the data. In each category, they identified key needs:
For assessing data, teachers believe tools should:
●● Simplify data management.
●● Portray students holistically.
●● Assess student agency.
●● Empower students with data.
For analyzing data, teachers believe tools should:
●● Work at the speed of teaching.
●● Compare performance to standards.
●● Reveal student progress, not static snapshots of performance.
●● Make normative, or historical, data practical to use.
For pivoting instruction, teachers believe tools should adapt to student levels, helping them tailor instruction to meet each student’s individual needs and performance level.
Making Data Work for Teachers and StudentsTeachers Know Best 23
Interoperability, which allows teachers to conduct nuanced analyses of data in ways that can drive instruction in more meaningful ways. For example:
●● Tools that track academic performance and socioemotional metrics can share information with each other to provide teachers with a richer snapshot of their students.
●● Tools that provide information from formative and summative assessments can align results for each student, providing data that indicate not just scores and areas of struggle, but also a learning trajectory for each student over time.
Developers that address these key needs will help teachers recapture time now spent compiling and analyzing data from multiple sources and use it instead to plan and deliver instruction shaped by data insights.
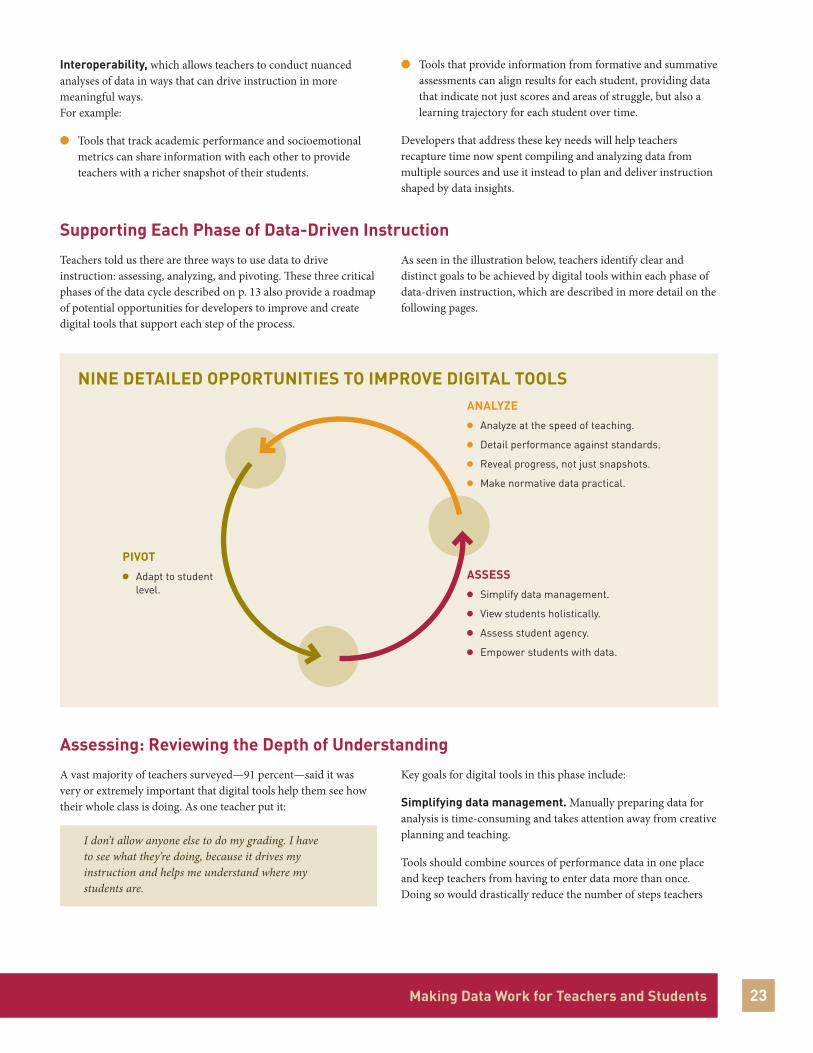
Supporting Each Phase of Data-Driven Instruction
Teachers told us there are three ways to use data to drive instruction: assessing, analyzing, and pivoting. These three critical phases of the data cycle described on p. 13 also provide a roadmap of potential opportunities for developers to improve and create digital tools that support each step of the process.
As seen in the illustration below, teachers identify clear and distinct goals to be achieved by digital tools within each phase of data-driven instruction, which are described in more detail on the following pages.
Assessing: Reviewing the Depth of Understanding
A vast majority of teachers surveyed—91 percent—said it was very or extremely important that digital tools help them see how their whole class is doing. As one teacher put it:
I don’t allow anyone else to do my grading. I have to see what they’re doing, because it drives my instruction and helps me understand where my students are.
Key goals for digital tools in this phase include:
Simplifying data management. Manually preparing data for analysis is time-consuming and takes attention away from creative planning and teaching.
Tools should combine sources of performance data in one place and keep teachers from having to enter data more than once. Doing so would drastically reduce the number of steps teachers
NINE DETAILED OPPORTUNITIES TO IMPROVE DIGITAL TOOLS
PIVOT● Adapt to student
level.
ANALYZE●● Analyze at the speed of teaching.
●● Detail performance against standards.
●● Reveal progress, not just snapshots.
●● Make normative data practical.
ASSESS● Simplify data management.
● View students holistically.
● Assess student agency.
● Empower students with data.
Teachers Know Best24
need to prepare data for analysis so they could draw implications from data rather than merely manipulating them, and would also serve to increase adoption.
Possible solutions would:
●● Remove the need for teachers to ever manually transfer data.
●● Provide seamless batch data entry.
●● Minimize the time it takes for teachers to compile and flexibly compare data from different data sets.
●● Anticipate the ways teachers want data sorted.
●● Allow teachers to sort data on the fly.
●● Ensure that data bring a picture of the class and student to the foreground and put the organization of that data in the background.
Portraying students holistically. Teachers know that understanding who students are outside of class allows them to tailor instruction to their needs, but this information is now often siloed and unavailable to classroom teachers. Connecting data from multiple sources across a student’s academic, social, behavioral, and emotional experiences—while addressing legitimate concerns about the security and confidentiality of student information—will help teachers gain a fuller picture of each student.
Possible solutions would:
●● Scan an entire class for issues and allow for digging deeper into possible academic and social causes.
●● Capture qualitative and informal teacher observations that can help other teachers better understand individual students’ needs (“scaling the water cooler”).
●● Facilitate collaboration and communication among teachers, caseworkers, tutors, and counselors to support students in the classroom.
●● Proactively address necessary regulations and concerns about the privacy of student data by clearly explaining security practices.
●● Enable collaborative interventions before problems arise.
Assessing student agency. Solely tracking academic performance minimizes the importance of critical skills such as student perseverance, collaboration, and self-discipline. Tools should provide ways for teachers to understand where students are with other skills that also prepare them for life beyond school.
Possible solutions would:
●● Allow teachers to record quick, anecdotal observations and aggregate them to identify trends.
●● Give students visibility into the dual importance of life skills and academics.
●● Create dynamic student profiles that change as their interests and capacities change.
●● Combine academic and nonacademic data.
●● Leverage data students generate outside of the classroom to help teachers assess individual skills.
Empowering students with data. Data are usually only visible to teachers, depriving them of students as a key ally and partner in learning. As one teacher put it:
When students see the big picture and they see how it aligns, they’re much more invested in it. And it doesn’t feel [like] some teacher giving them these arbitrary grades.
Providing students with a clear view of what they’ve mastered and what skills they need to learn helps them take ownership of their learning.
Possible solutions would:
●● Create learning paths detailing what’s been covered and where the class is headed in ways that are visible and understandable to students.
●● Allow students to map and connect their individual learning goals to classroom objectives.
●● Communicate to students the multiple trajectories their current performance may put them on depending on how they perform next.

Making Data Work for Teachers and StudentsTeachers Know Best 25
●● Give advanced students the opportunity to challenge themselves with additional content under teachers’ guidance, while at the same time allowing teachers to focus additional direct instruction on the students with greater needs.
●● Allow differentiated access to content based on students’ demonstrated mastery.
●● Customize lessons to students’ personal interests to encourage self-directed work.
WHERE CURRENT TOOLS STAND
Teachers believe tools such as electronic gradebooks help with simplifying data management but still do not fully meet their needs. They also believe few digital tools exist that help them view students holistically, assess student agency, or empower students with data. In addition to digital gradebooks, teachers say that
software that automatically uploads grades entered by teachers; dashboards that include performance, attendance, and behavior metrics; and Excel spreadsheets are the present-day tools that come closest to meeting their needs.
Analyzing: Pinpointing Misconceptions, Struggles, and Competencies
The majority of teachers—78 percent of those surveyed—believe data help validate where students are and where they can go. A teacher explained:
[Examining data in detail] allows me to predict where students are going to get stuck, predict their hiccups, their successes, and their challenges. You have to really know where each student is struggling in order to transform their learning.
Key goals for digital tools in this phase include:
Analyzing at the speed of teaching. Teachers need to give feedback and alter instruction while it’s still effective to do so, and the time it takes to manipulate and analyze data can mean feedback comes too late. As one teacher put it:
I get a flood of data, but making it something I can act on is the tough part. It needs to be actionable at the speed of teaching and learning, so it can be used in real time in the classroom.
Immediate and clear indicators of student performance that are fast and flexible enough to fit into the way teachers run their classes can allow teachers to make quick instructional decisions while they’re still effective.
Possible solutions would:
●● Provide in-class, real-time analysis that is separate from the more deliberate data analysis teachers do after class.
●● Close the distance between students submitting work; teachers assessing it; and teachers providing direct, informed, and detailed feedback.
●● Quickly toggle between class-wide and student-level data so teachers can quickly survey a class for understanding and identify which specific topics and students need attention.
●● Make student data more like a data feed and less like a written report.
Detailing performance against standards. Current tools that connect student performance to standards often aren’t granular enough to allow teachers to understand which key concepts students have mastered or are struggling with. Teachers can more easily tailor instruction to specific areas of student need when they can focus in on not just learning objectives or standards, but also the underlying concepts and skill sets within each standard.
Possible solutions would:
●● Use data analytics to make clear the ways in which the Common Core standards build on each other over time.
●● Give teachers fast, detailed data at the concept and skill levels so they can spend their time creatively planning and teaching.
●● Alert teachers, parents, and students if standards are not met—by specific skill set, by student, and by class.
●● Make meeting standards a compelling challenge instead of a chore for teachers and students alike.
●● Connect performance across multiple standards to facilitate meta-analysis of student skills.
Teachers Know Best26
Revealing progress, not just snapshots. Single points of data reduce students to a test score instead of revealing trends about their progress that teachers care about. As one research director explained:
We have to be able to better communicate to teachers and students where they are and where we want them to be.
Using past and current data to provide a comprehensive view of student performance over time allows teachers to track their progress in more meaningful ways.
Possible solutions would:
●● Visualize trends and patterns in the data.
●● Establish baselines for each student’s ability regardless of grade.
●● Help teachers chart possible learning trajectories and share them with their students.
●● Leverage normative data to identify the points along learning trajectories where student outcomes can be changed.
●● Allow teachers to toggle between current performance scores and the placement of that data within historical context.
●● Identify the factors that contribute to a student’s growth and mastery so they can be replicated with others.
Making normative data practical. While formative data help teachers identify how their students are progressing and summative data track their past performance, looking at historical data from other classes and years can help teachers see how similar students improved over time. As one principal said:
I want a company to be able to tell me, “If kids do x, there’s a y percent chance of z outcome.”
Combining formative, summative, and normative data allows teachers to identify successful interventions that they can put into use in their own classrooms.
Possible solutions would:
●● Predict short- and long-term student performance based on academic and nonacademic data points.
●● Provide enough detailed formative data to allow teachers to shift day-to-day instruction.
●● Chart likely learning trajectories and use normative data to identify the best points for interventions that change them.
●● Help teachers course correct when predicted performance indicates large learning gaps.
WHERE CURRENT TOOLS STAND
Teachers believe that current assessment tools partially meet their needs to analyze data at the speed of teaching but fail to do it quickly enough to fully meet their needs. They also say that few tools exist to help them reveal progress over time or detail performance against standards in ways that allow meaningful impact on instruction. Of the tools available today, teachers
say that pre-assessment tools that determine student levels and placement before instruction, test banks tied to the Common Core or state-specific standards, test creation tools that administer and score assessments and align questions with standards, and digital summative assessments that identify mastery at the end of a unit come closest to meeting their needs.
Making Data Work for Teachers and StudentsTeachers Know Best 27
Pivoting: Adjusting the Approach to Address What Data Tell Us
The majority of teachers—69 percent of those surveyed—believe that improving student achievement depends on tailoring instruction to meet individual students’ needs. As one teacher said:
If I’m noticing that a lot of kids are still struggling, I’m going to take a step back. I may use or implement a different strategy, come in with a different type of question for the next day.
However, many teachers that we interviewed are spending so much time in the earlier phases of the data cycle—assessing and analyzing data—that they struggled to begin to articulate opportunities in this phase. However, survey responses revealed that teachers’ key goals for tools in this area are solutions that adapt to student levels. Adjusting content for students of different skill levels in each class is a time-consuming process for teachers, particularly since content is typically organized by grade level instead of skill level, spread across multiple applications, and rarely flexible enough to allow creative attempts to personalize instruction for individual students.
Flexible and adaptive tools for teachers and students would allow the students who have mastered content to follow a personalized learning path beyond grade-level expectations while giving teachers the time and resources needed to address the specific needs of struggling students. As one educator put it:
Why should a student have to wait to have access to the material for something that they need to learn now? … Students should be able to access what they need at the moment they need it.
Possible solutions would:
●● Allow access to content based on demonstrated mastery rather than defaulting to grade level.
●● Free teachers to attend to struggling students while enabling advanced students to challenge themselves with more advanced content with their teachers’ guidance.
●● Help teachers by linking data about student misconceptions to targeted resources for adapting teaching approaches.
WHERE CURRENT TOOLS STAND
Teachers believe that the current generation of adaptive learning tools help but do not fully meet their needs. Teachers say that adaptive learning tools that automatically move to the next question based on performance during an assessment,
automatically adapt lessons on the same subject to different skill levels, and assess student strengths and weaknesses to personalize instruction to each student’s skill level come closest to meeting their needs today.

Teachers Know Best28
INNOVATIVE SCHOOLS AREN’T WAITING FOR THE MARKET TO PROVIDE ANSWERSAt some innovative schools, educators aren’t waiting for developers to provide answers to these challenges. By developing their own tools, remaking existing ones, or hacking together data displays to include multiple sources of information, they are creating ways to give students windows into their own performance and combine formative, summative, and normative data to help shift the trajectory of learning. In doing so, they are developing tools that enable themselves and other educators to achieve ambitious instructional goals.
KIPP Chicago combined formative, summative, and normative data in its own student performance dashboards to highlight points of successful
intervention that might shift the course of learning from one trajectory to another.
As KIPP’s director of research and analysis explained, this added context helps makes data understandable to students and parents:
A lot of times when you go to them with these numbers, they’re abstract and meaningless. They’re abstract even to me. We try to say, “Look, if you keep growing at this rate, then we can show you what college you’re heading towards.”
Intrinsic Schools, a Chicago-based public charter school, developed its own student portal by accessing an application programming interface and
tying together existing tools including Google Apps for Education, the Illuminate student information system, and Kickboard, which stores data on student behavior and consequences.
Intrinsic’s director of personalized learning said:
[Without the integration of behavioral data, you] have the data point but you don’t have the story behind the data point. … Having all that in one place, which we’re starting to do, has been super helpful.
Merit Prep, a Newark, New Jersey, charter school operated by Matchbook Learning, created Spark, a data integration tool that pulls together
information from online learning and assessment resources from multiple providers. Merit Prep officials estimate that Spark saves teachers between 15 and 75 minutes per student when they aggregate data to track student progress toward mastery.* As Matchbook’s chief technology officer put it:
What we found was that our teachers were spending a lot of their time trying to manipulate this data to even be able to make sense of it before they could make any academic decisions. … The tools we create help support those key interactions, those key points where the magic is supposed to happen. My time as a teacher is not as a data analyst. It’s because I’m good with kids and I have a passion for this and I have a skill set of delivering to and communicating with kids.
Schools that innovate in this way often invest in staffing directors of data or technology directors who help make and remake data tools. Their efforts also point to seven key design principles for digital tools:
●● Help teachers teach by automating data integration.
●● Provide real-time feedback.
●● Focus on progress over time instead of snapshots of student performance.
●● Provide student-centered information granular enough to allow competency, not calendars, to drive the progression of learning.
●● Reveal root causes by connecting data from students’ academic, social, and cultural experiences.
●● Predict and propose interventions by making informed and practical predictions of student outcomes.
●● Be transparent by allowing teachers to see, experience, and assess the rigor and logic of the materials students are using.
*“Next Gen Tools: Matchbook Learning’s Spark,” accessed at www.educause.edu/library/resources/next-gen-tools-matchbook-learnings-spark.

Making Data Work for Teachers and StudentsTeachers Know Best 29

Teachers Know Best30
Conclusions and RecommendationsThis research reflects teachers’ insights about the use of data and digital tools to shape instruction. While large portions of this report focus on the areas in which current digital tools fall short and opportunities to improve them, technology is not a silver bullet for the effective use of data. Ultimately, the story of technology in education is not just about making investments in products, but also listening to educators to determine the best ways to meet their challenges around the use of data and investing in building the capacity of teachers and school leaders to use them wisely and effectively.
As part of its ongoing outreach to education technology developers, the foundation has launched a companion website to this research. The Making Data Work component of the Teachers Know Best website (TeachersKnowBest.org) features more in-depth data from the research, as well as multiple tools for developers and others interested in digital solutions. The website
also includes interviews with a wide range of teachers who provide real-life examples of their needs and challenges.
Through this research and ongoing efforts, the foundation hopes to elevate the voices of educators about what they need and spark conversation among the developer community, teachers, school leaders, and other supporters of public education.
Recommendations for Product Developers
Product developers should first and foremost listen to teachers and other educators. Our research identifies key areas of need and how different groups of teachers prioritize the use of digital tools. Key design principles to consider include:
●● Using the teacher segmentation described in this report to better understand the behaviors, preferences, and needs of different educators in order to develop tools appropriate for teachers at all levels of proficiency with the use of data and technology.
●● Working with school leaders to develop better ways to support teachers, as well as parents and students, while introducing new products.
●● Using the data-driven instructional model (assess/analyze/pivot) to discuss with teachers where existing data procedures and tools support—or fail to support—student learning.
●● Targeting the areas of opportunity identified by teachers in this report.
●● Recognizing and addressing longstanding concerns about student privacy and security in the development and implementation of tools that handle student data. Developers should use existing best practices to ensure the security of data.
●● Using standard approaches to ensure the open exchange of data among different tools, so that teachers can focus on teaching instead of time-consuming data management and aggregation.
●● Developing tools that do not just report what has happened, but also use current and historical performance data to anticipate student learning trajectories and personalize instruction based on each student’s performance.
Recommendations for Teachers
Teachers should work together and with their administrators to find opportunities to leverage tools to use data more effectively, including:
●● Collaborating with one another to master best practices for data-driven instruction, share how students are doing across classes, and discuss the implications of data.
●● Engaging school leaders in conversations around challenges and needs in the use of data.
●● Enabling students to participate in data-driven decisions about their learning whenever feasible and appropriate.
Making Data Work for Teachers and StudentsTeachers Know Best 31
Recommendations for District and School Leaders
School leaders should study the examples of technology-forward schools and look for ways to build attributes that support data-driven instruction in their own buildings, including:
●● Using the data-driven instructional model to discuss where existing data procedures and tools support—or fail to support—student learning.
●● Restructuring learning environments to ensure that teachers have access to rich data every day, and recognizing that the depth of data-driven instruction is dependent on the availability of high-quality tools that keep teachers from being overburdened with administrative tasks.
●● Seeking out and potentially incorporating existing solutions that innovative schools have already developed, such as those highlighted on pp. 8 and 28.
●● Supporting teachers by investing in the staff, training, dedicated time, and professional development needed to integrate tools and practice.
●● Engaging teachers in the process of identifying and selecting new tools and strategies.
●● Accelerating the shift to personalized learning by investing in infrastructure and high-quality tools.
●● Explaining to parents and community members the value of data-driven instruction and the safeguards in place to protect student information.
Recommendations for Funders
Funders can play a critical role in continuing to broaden the conversation between product developers and the educators who use the tools they develop, including:
●● Emphasizing high standards for data privacy and security, as well as tools that have demonstrated impact, interoperability, and interfaces that encourage the sharing and aggregation of data from multiple sources.
●● Encouraging developers to produce better, more scalable solutions that reduce teachers’ administrative burdens and measure student outcomes in multiple ways.
●● Supporting teachers by helping schools and systems identify the staff, training, and professional development needed to integrate tools and practice.
●● Taking an active role in sharing knowledge across teacher and school communities, including the creation of professional development that meets the needs of teachers at all levels of data and technology proficiency.
●● Being vocal advocates for teachers partnering with developers.
●● Targeting funding around the greatest opportunities for improvement and the largest market gaps.


Design: KSA Plus Communications, Inc.

Teachers Know Best4
Guided by the belief that every life has equal value, the Bill & Melinda Gates Foundation works to help all
people lead healthy, productive lives. In developing countries, it focuses on improving people’s health and
giving them the chance to lift themselves out of hunger and extreme poverty. In the United States, it seeks
to ensure that all people—especially those with the fewest resources—have access to the opportunities
they need to succeed in school and life. Based in Seattle, Washington, the foundation is led by CEO Sue
Desmond-Hellmann and Co-chair William H. Gates Sr., under the direction of Bill and Melinda Gates and
Warren Buffett.
For additional information on the Bill & Melinda Gates Foundation, please visit our website: www.gatesfoundation.org.
JUNE 2015
©2015 Bill & Melinda Gates Foundation. All Rights Reserved. Bill & Melinda Gates Foundation is a registered trademark in the United States and other countries.