teaching ngss in elementary school – k - national...
TRANSCRIPT

Title slide
1
LIVE INTERACTIVE LEARNING @ YOUR DESKTOP
December 17, 2014
6:30 p.m. ET / 5:30 p.m. CT / 4:30 p.m. MT / 3:30 p.m. PT
Teaching NGSS in Elementary School— Third Grade
Presented by: Ted Willard, Carla Zembal-Saul, Mary Starr, and
Kathy Renfrew

http://learningcenter.nsta.org
NSTA Learning Center
2

About the NSTA Learning Center
• Discover over 11,900 resources
– 4,200+ free!
– Add to “My Library” and bundle in collections
– Access collections made by NSTA and other teachers
• Connect in the community forums
• Get help from online advisors
• Plan/document learning with free tools
NSTA Learning Center
3
http://learningcenter.nsta.org
Introducing today’s presenters…
Introducing today’s presenters
4
Ted Willard Director, NGSS@NSTA National Science Teachers Association
Carla Zembal-Saul Professor of Science Education Penn State University
Mary Starr Executive Director Michigan Mathematics and Science Centers Network
Kathy Renfrew K-5 Science Coordinator, VT Agency of Education NGSS Curator
5
Developing the Standards

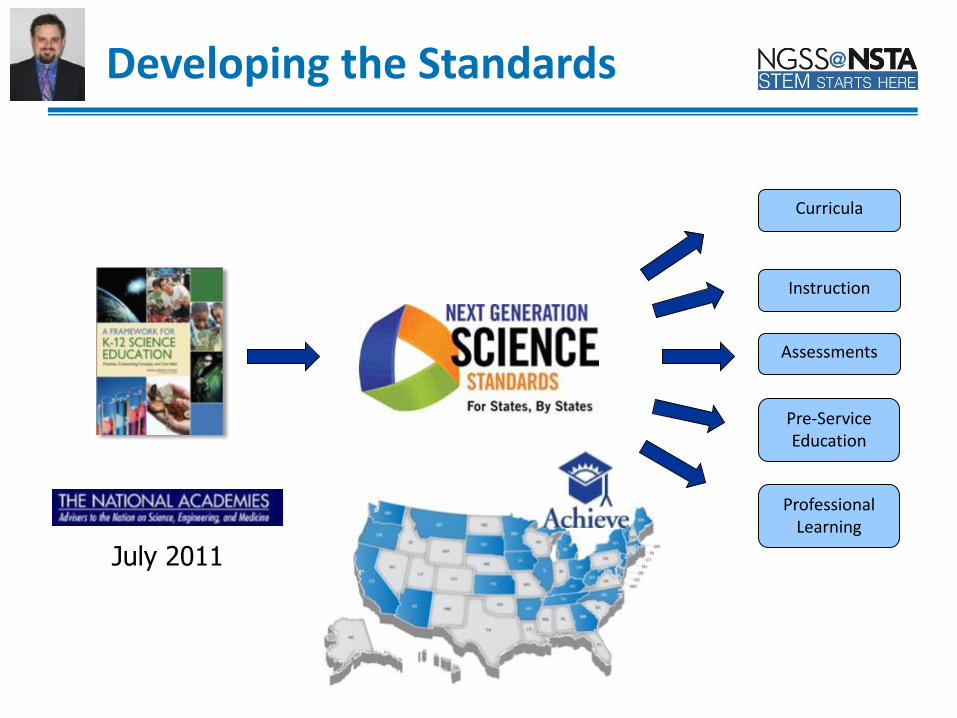
Instruction
Curricula
Assessments
Pre-Service Education
2011-2013
July 2011
Developing the Standards
Professional Learning

7
July 2011
Developing the Standards

8
Three-Dimensions:
• Scientific and Engineering Practices
• Crosscutting Concepts
• Disciplinary Core Ideas
View free PDF from The National Academies Press at www.nap.edu
Secure your own copy from
www.nsta.org/store
A Framework for K-12 Science Education
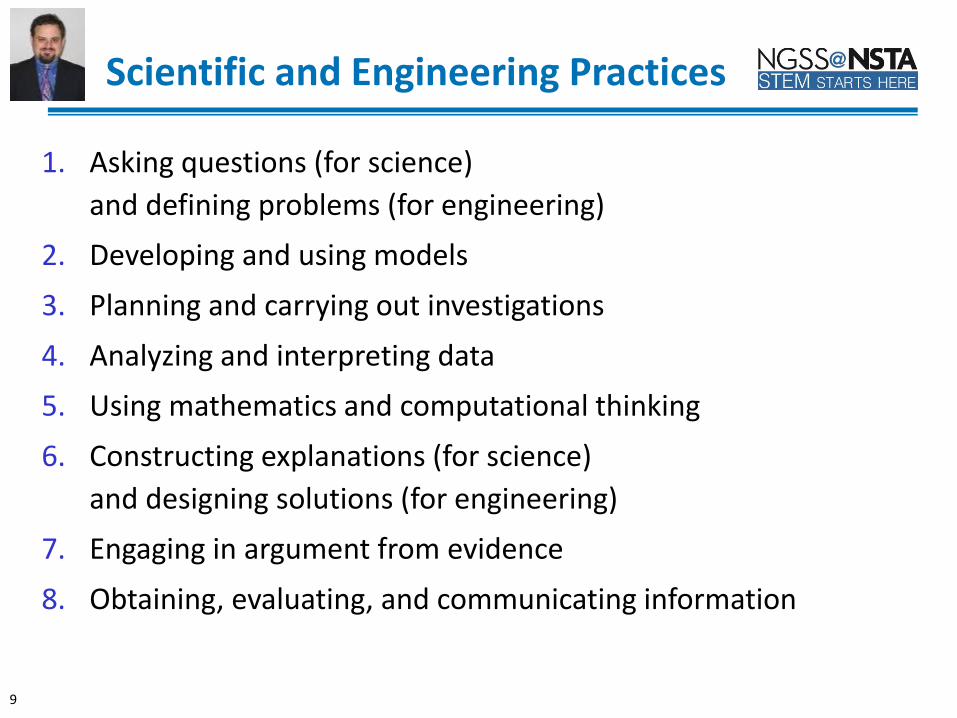
1. Asking questions (for science)
and defining problems (for engineering)
2. Developing and using models
3. Planning and carrying out investigations
4. Analyzing and interpreting data
5. Using mathematics and computational thinking
6. Constructing explanations (for science)
and designing solutions (for engineering)
7. Engaging in argument from evidence
8. Obtaining, evaluating, and communicating information
9
Scientific and Engineering Practices

10
1. Patterns
2. Cause and effect: Mechanism and explanation
3. Scale, proportion, and quantity
4. Systems and system models
5. Energy and matter: Flows, cycles, and conservation
6. Structure and function
7. Stability and change
Crosscutting Concepts

Life Science Physical Science LS1: From Molecules to Organisms: Structures
and Processes
LS2: Ecosystems: Interactions, Energy, and
Dynamics
LS3: Heredity: Inheritance and Variation of
Traits
LS4: Biological Evolution: Unity and Diversity
PS1: Matter and Its Interactions
PS2: Motion and Stability: Forces and
Interactions
PS3: Energy
PS4: Waves and Their Applications in
Technologies for Information Transfer
Earth & Space Science Engineering & Technology
ESS1: Earth’s Place in the Universe
ESS2: Earth’s Systems
ESS3: Earth and Human Activity
ETS1: Engineering Design
ETS2: Links Among Engineering, Technology,
Science, and Society
11
Disciplinary Core Ideas

12
Life Science Earth & Space Science Physical Science Engineering & Technology
LS1: From Molecules to Organisms:
Structures and Processes
LS1.A: Structure and Function
LS1.B: Growth and Development of
Organisms
LS1.C: Organization for Matter and
Energy Flow in Organisms
LS1.D: Information Processing
LS2: Ecosystems: Interactions, Energy,
and Dynamics
LS2.A: Interdependent Relationships
in Ecosystems
LS2.B: Cycles of Matter and Energy
Transfer in Ecosystems
LS2.C: Ecosystem Dynamics,
Functioning, and Resilience
LS2.D: Social Interactions and Group
Behavior
LS3: Heredity: Inheritance and
Variation of Traits
LS3.A: Inheritance of Traits
LS3.B: Variation of Traits
LS4: Biological Evolution: Unity
and Diversity
LS4.A: Evidence of Common Ancestry
and Diversity
LS4.B: Natural Selection
LS4.C: Adaptation
LS4.D: Biodiversity and Humans
ESS1: Earth’s Place in the Universe
ESS1.A: The Universe and Its Stars
ESS1.B: Earth and the Solar System
ESS1.C: The History of Planet Earth
ESS2: Earth’s Systems
ESS2.A: Earth Materials and Systems
ESS2.B: Plate Tectonics and Large-Scale
System Interactions
ESS2.C: The Roles of Water in Earth’s
Surface Processes
ESS2.D: Weather and Climate
ESS2.E: Biogeology
ESS3: Earth and Human Activity
ESS3.A: Natural Resources
ESS3.B: Natural Hazards
ESS3.C: Human Impacts on Earth
Systems
ESS3.D: Global Climate Change
PS1: Matter and Its Interactions
PS1.A: Structure and Properties of
Matter
PS1.B: Chemical Reactions
PS1.C: Nuclear Processes
PS2: Motion and Stability: Forces
and Interactions
PS2.A: Forces and Motion
PS2.B: Types of Interactions
PS2.C: Stability and Instability in
Physical Systems
PS3: Energy
PS3.A: Definitions of Energy
PS3.B: Conservation of Energy and
Energy Transfer
PS3.C: Relationship Between Energy
and Forces
PS3.D: Energy in Chemical Processes
and Everyday Life
PS4: Waves and Their Applications in
Technologies for Information
Transfer
PS4.A: Wave Properties
PS4.B: Electromagnetic Radiation
PS4.C: Information Technologies
and Instrumentation
ETS1: Engineering Design
ETS1.A: Defining and Delimiting an
Engineering Problem
ETS1.B: Developing Possible Solutions
ETS1.C: Optimizing the Design Solution
ETS2: Links Among Engineering,
Technology, Science, and
Society
ETS2.A: Interdependence of Science,
Engineering, and Technology
ETS2.B: Influence of Engineering,
Technology, and Science on
Society and the Natural World
Note: In NGSS, the core ideas for Engineering, Technology, and the Application of Science are integrated with the Life Science, Earth & Space Science, and Physical Science core ideas
Disciplinary Core Ideas
Instruction
Curricula
Assessments
Pre-Service Education
2011-2013
July 2011
Developing the Standards
Professional Learning
2011-2013
14
Developing the Standards
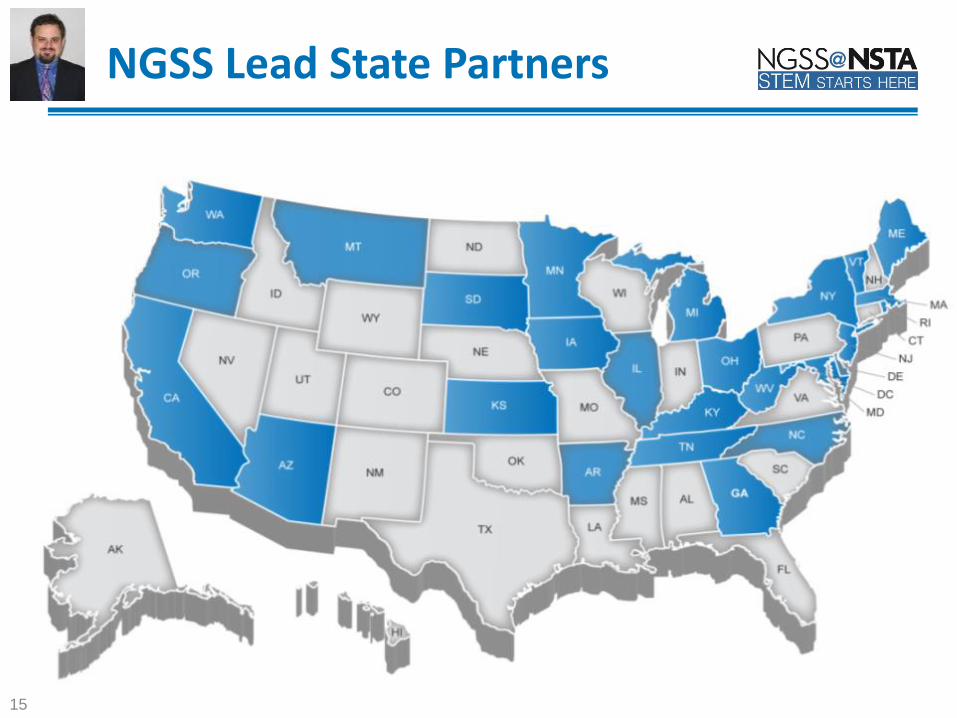
NGSS Lead State Partners
15
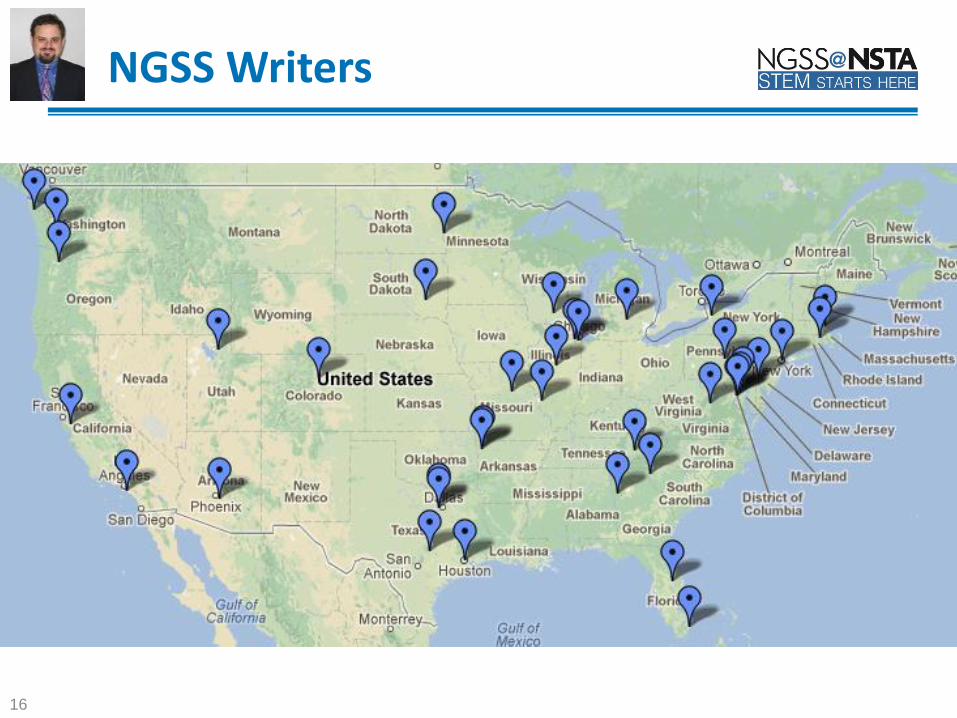
NGSS Writers
16
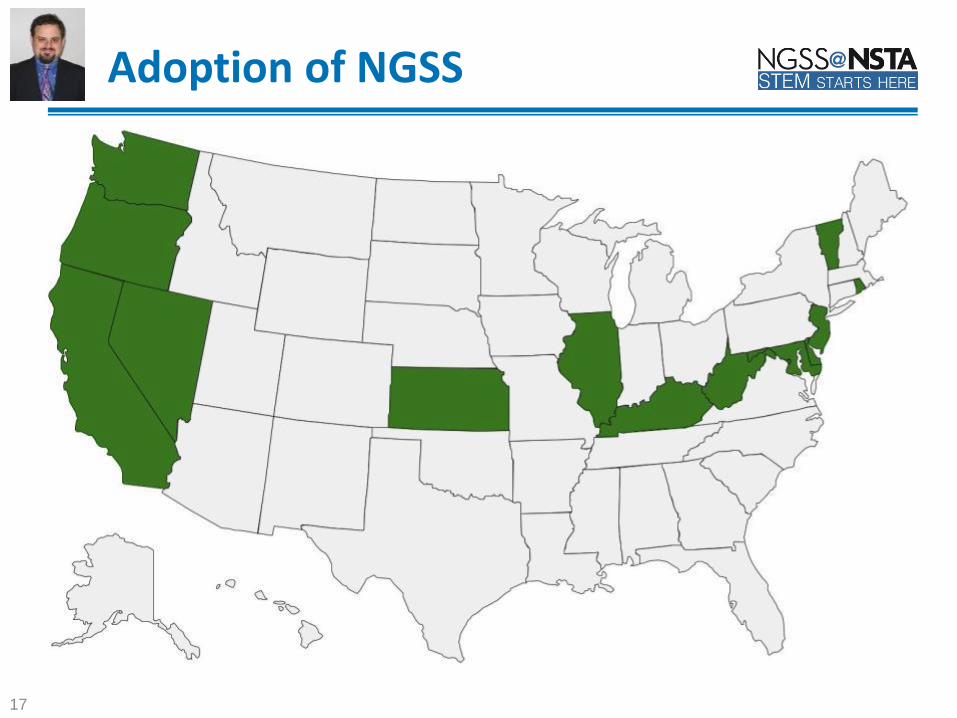
Adoption of NGSS
17

Adoption of NGSS
About 3 in 10 students in the US live in states that have adopted NGSS
29%
71%
Percent of Students in NGSS States

19
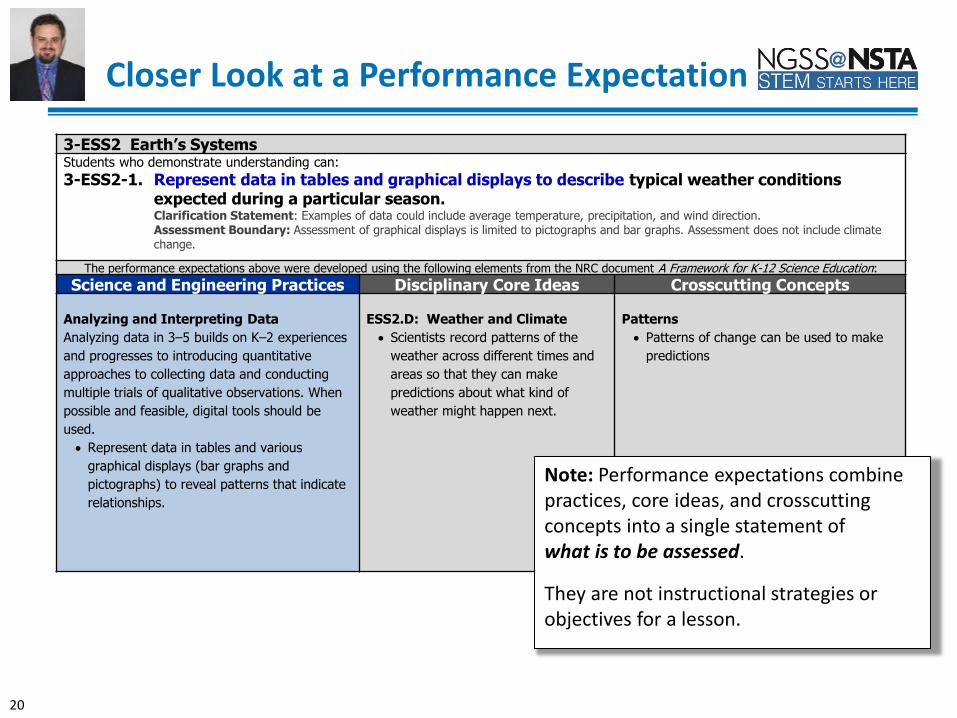
3-ESS2 Earth’s Systems Students who demonstrate understanding can:
3-ESS2-1. Represent data in tables and graphical displays to describe typical weather conditions expected during a particular season.
Clarification Statement: Examples of data could include average temperature, precipitation, and wind direction. Assessment Boundary: Assessment of graphical displays is limited to pictographs and bar graphs. Assessment does not include climate
change.
The performance expectations above were developed using the following elements from the NRC document A Framework for K-12 Science Education:
Science and Engineering Practices Disciplinary Core Ideas Crosscutting Concepts
Analyzing and Interpreting Data
Analyzing data in 3–5 builds on K–2 experiences
and progresses to introducing quantitative
approaches to collecting data and conducting
multiple trials of qualitative observations. When
possible and feasible, digital tools should be
used.
Represent data in tables and various
graphical displays (bar graphs and
pictographs) to reveal patterns that indicate
relationships.
ESS2.D: Weather and Climate
Scientists record patterns of the
weather across different times and
areas so that they can make
predictions about what kind of
weather might happen next.
Patterns
Patterns of change can be used to make
predictions
Note: Performance expectations combine practices, core ideas, and crosscutting concepts into a single statement of what is to be assessed.
They are not instructional strategies or objectives for a lesson.
Closer Look at a Performance Expectation
20
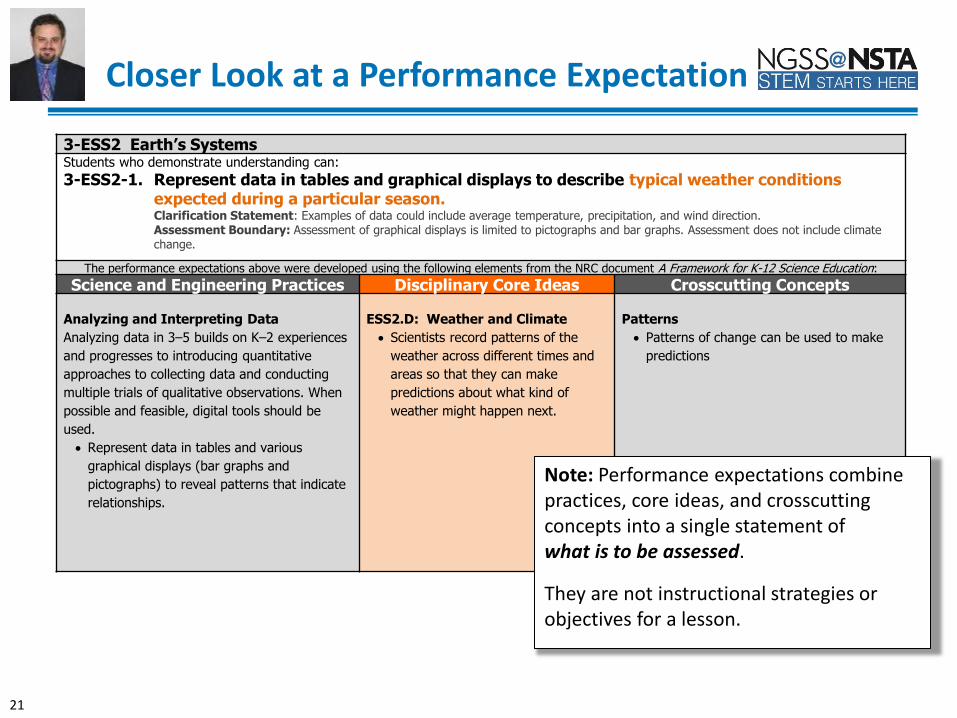
3-ESS2 Earth’s Systems Students who demonstrate understanding can:
3-ESS2-1. Represent data in tables and graphical displays to describe typical weather conditions expected during a particular season.
Clarification Statement: Examples of data could include average temperature, precipitation, and wind direction. Assessment Boundary: Assessment of graphical displays is limited to pictographs and bar graphs. Assessment does not include climate
change.
The performance expectations above were developed using the following elements from the NRC document A Framework for K-12 Science Education:
Science and Engineering Practices Disciplinary Core Ideas Crosscutting Concepts
Analyzing and Interpreting Data
Analyzing data in 3–5 builds on K–2 experiences
and progresses to introducing quantitative
approaches to collecting data and conducting
multiple trials of qualitative observations. When
possible and feasible, digital tools should be
used.
Represent data in tables and various
graphical displays (bar graphs and
pictographs) to reveal patterns that indicate
relationships.
ESS2.D: Weather and Climate
Scientists record patterns of the
weather across different times and
areas so that they can make
predictions about what kind of
weather might happen next.
Patterns
Patterns of change can be used to make
predictions
Note: Performance expectations combine practices, core ideas, and crosscutting concepts into a single statement of what is to be assessed.
They are not instructional strategies or objectives for a lesson.
Closer Look at a Performance Expectation
21
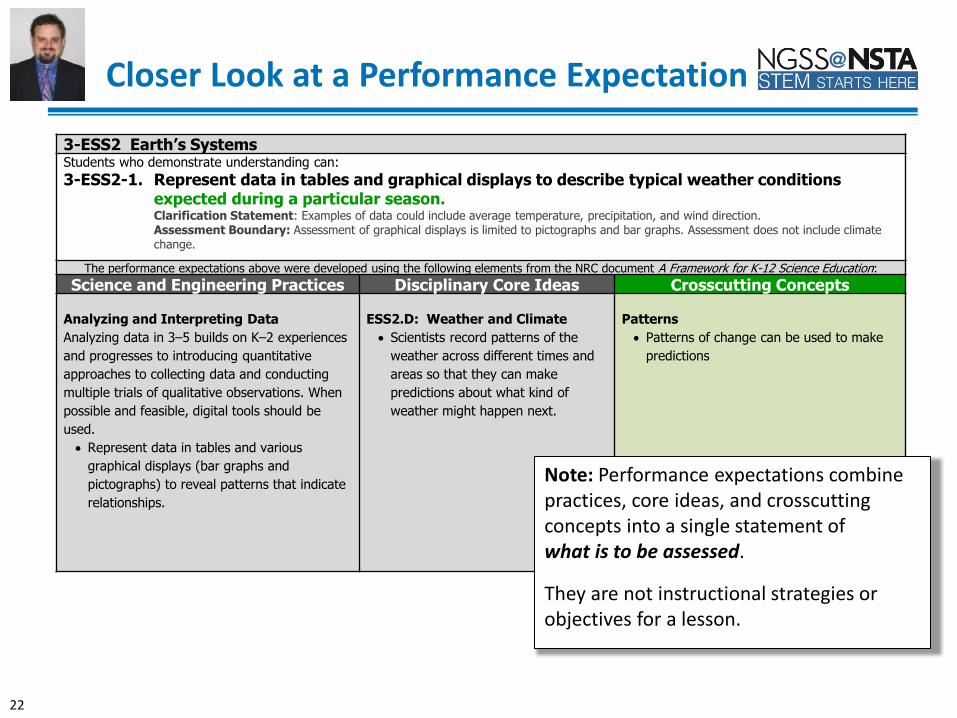
3-ESS2 Earth’s Systems Students who demonstrate understanding can:
3-ESS2-1. Represent data in tables and graphical displays to describe typical weather conditions expected during a particular season.
Clarification Statement: Examples of data could include average temperature, precipitation, and wind direction. Assessment Boundary: Assessment of graphical displays is limited to pictographs and bar graphs. Assessment does not include climate
change.
The performance expectations above were developed using the following elements from the NRC document A Framework for K-12 Science Education:
Science and Engineering Practices Disciplinary Core Ideas Crosscutting Concepts
Analyzing and Interpreting Data
Analyzing data in 3–5 builds on K–2 experiences
and progresses to introducing quantitative
approaches to collecting data and conducting
multiple trials of qualitative observations. When
possible and feasible, digital tools should be
used.
Represent data in tables and various
graphical displays (bar graphs and
pictographs) to reveal patterns that indicate
relationships.
ESS2.D: Weather and Climate
Scientists record patterns of the
weather across different times and
areas so that they can make
predictions about what kind of
weather might happen next.
Patterns
Patterns of change can be used to make
predictions
Note: Performance expectations combine practices, core ideas, and crosscutting concepts into a single statement of what is to be assessed.
They are not instructional strategies or objectives for a lesson.
Closer Look at a Performance Expectation
22
3-ESS2 Earth’s Systems Students who demonstrate understanding can:
3-ESS2-1. Represent data in tables and graphical displays to describe typical weather conditions expected during a particular season.
Clarification Statement: Examples of data could include average temperature, precipitation, and wind direction. Assessment Boundary: Assessment of graphical displays is limited to pictographs and bar graphs. Assessment does not include climate
change.
The performance expectations above were developed using the following elements from the NRC document A Framework for K-12 Science Education:
Science and Engineering Practices Disciplinary Core Ideas Crosscutting Concepts
Analyzing and Interpreting Data
Analyzing data in 3–5 builds on K–2 experiences
and progresses to introducing quantitative
approaches to collecting data and conducting
multiple trials of qualitative observations. When
possible and feasible, digital tools should be
used.
Represent data in tables and various
graphical displays (bar graphs and
pictographs) to reveal patterns that indicate
relationships.
ESS2.D: Weather and Climate
Scientists record patterns of the
weather across different times and
areas so that they can make
predictions about what kind of
weather might happen next.
Patterns
Patterns of change can be used to make
predictions
Note: Performance expectations combine practices, core ideas, and crosscutting concepts into a single statement of what is to be assessed.
They are not instructional strategies or objectives for a lesson.
Closer Look at a Performance Expectation

Teaching NGSS in
Elementary School Third Grade:
Inheritance and Variation of Traits
December 17, 2014
23

Introductions
Carla Zembal-Saul – [email protected]
Professor of Science Education, Penn State University
Co-author, What’s Your Evidence? Engaging K-5 Students in
Constructing Explanations in Science
Twitter: @czem
Mary Starr – [email protected]
Executive Director, Michigan Mathematics and Science Centers
Network
Co-author, Project-Based Inquiry Science
Twitter: @starrscience
Kathy Renfrew - [email protected]
K-5 Science Coordinator, VT Agency of Education,
NGSS Curator
Twitter: @krsciencelady
24

Welcome
Kimber
Hershberger
25

Overview: NGSS for Third Grade
❖ Approaches and tools for
supporting NGSS in the
classroom
❖ NGSS topics for third grade
❖ Unpacking performance
expectation 3-LS3-1
❖ Life science focus: Inheritance
and variation of traits
❖ Scientific practices: Analyze and
interpret data
❖ Video: Using data to determine
that there is inherited variation in
a group of cockroaches
❖ Resources to support instruction
26
Clipart: Tonight’s Audience
27
3rd Grade
Teacher
Teacher at
Another
Grade Level
Preservice
Teacher
Science
Supervisor
University
Faculty
Other

Be an engaged participant.
Participate by responding to polls and using the CHAT window
to share ideas.
Presume positive intentions!
Web Seminar Interactions
28
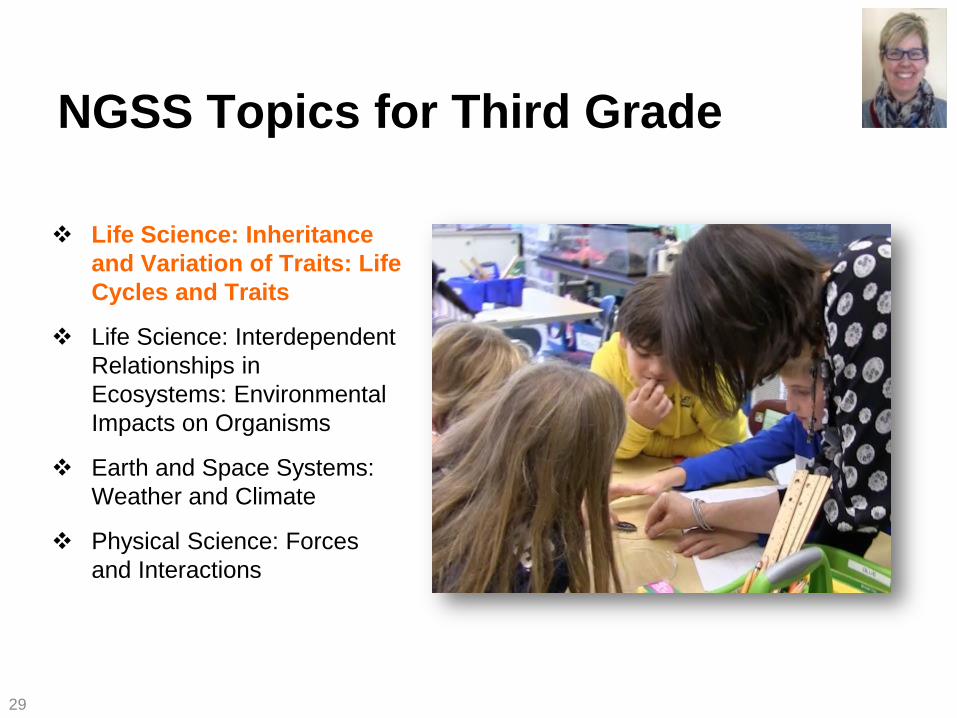
NGSS Topics for Third Grade
Life Science: Inheritance
and Variation of Traits: Life
Cycles and Traits
Life Science: Interdependent
Relationships in
Ecosystems: Environmental
Impacts on Organisms
Earth and Space Systems:
Weather and Climate
Physical Science: Forces
and Interactions
29
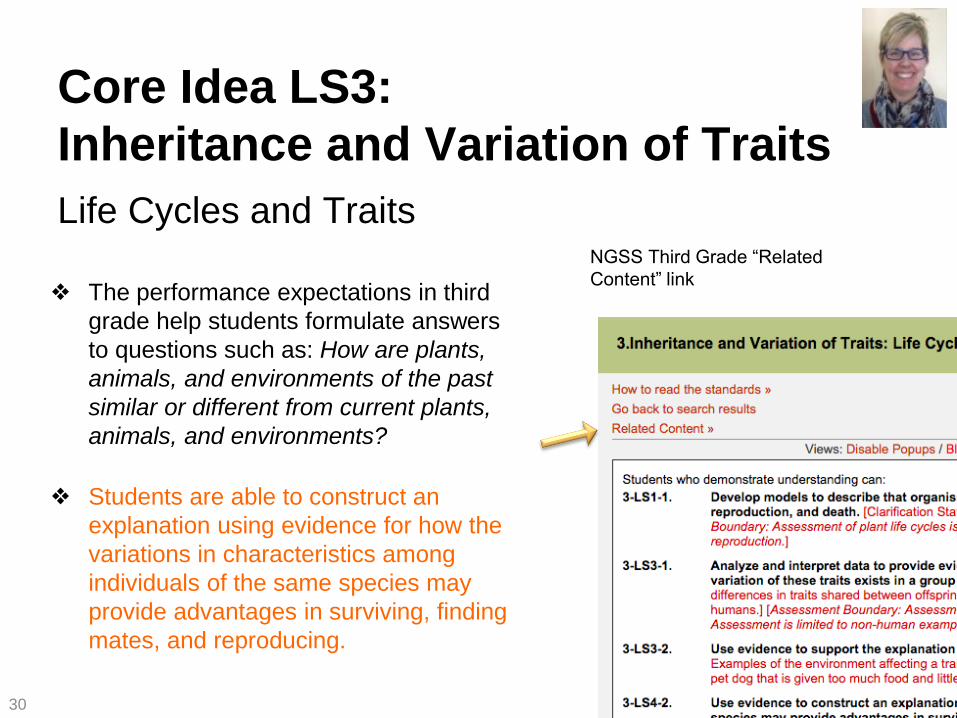
Core Idea LS3:
Inheritance and Variation of Traits
❖ The performance expectations in third
grade help students formulate answers
to questions such as: How are plants,
animals, and environments of the past
similar or different from current plants,
animals, and environments?
❖ Students are able to construct an
explanation using evidence for how the
variations in characteristics among
individuals of the same species may
provide advantages in surviving, finding
mates, and reproducing.
NGSS Third Grade “Related
Content” link
30
Life Cycles and Traits

Support in Framework – Content Knowledge
Framework p. 157
31
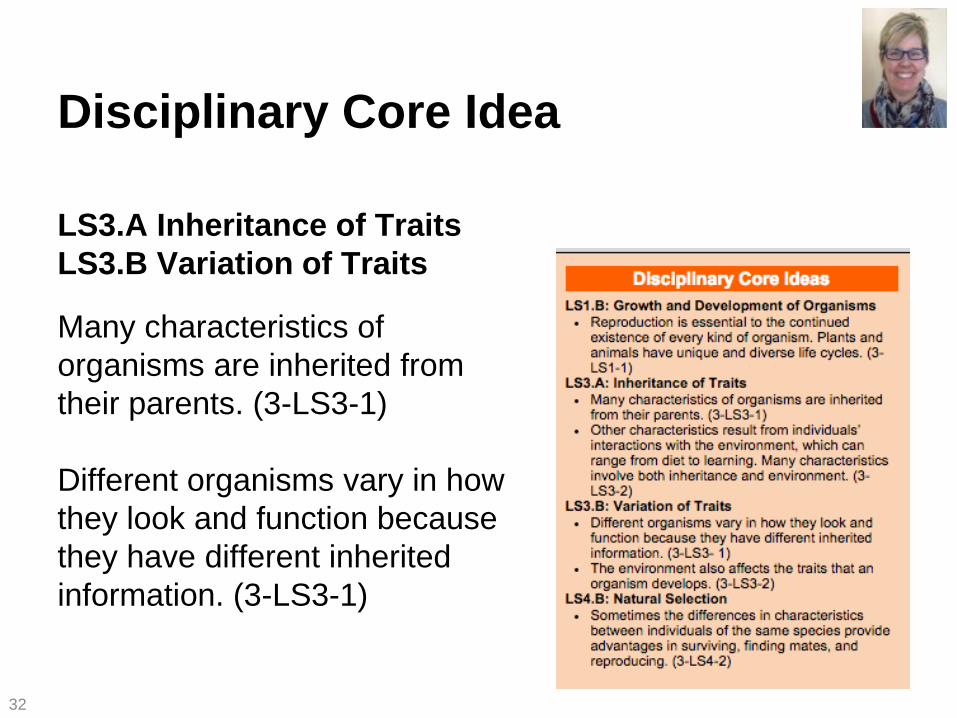
Disciplinary Core Idea
Many characteristics of
organisms are inherited from
their parents. (3-LS3-1)
Different organisms vary in how
they look and function because
they have different inherited
information. (3-LS3-1)
32
LS3.A Inheritance of Traits
LS3.B Variation of Traits

Support in NGSS - Storylines
http://www.nextgenscience.org/search-standards
33
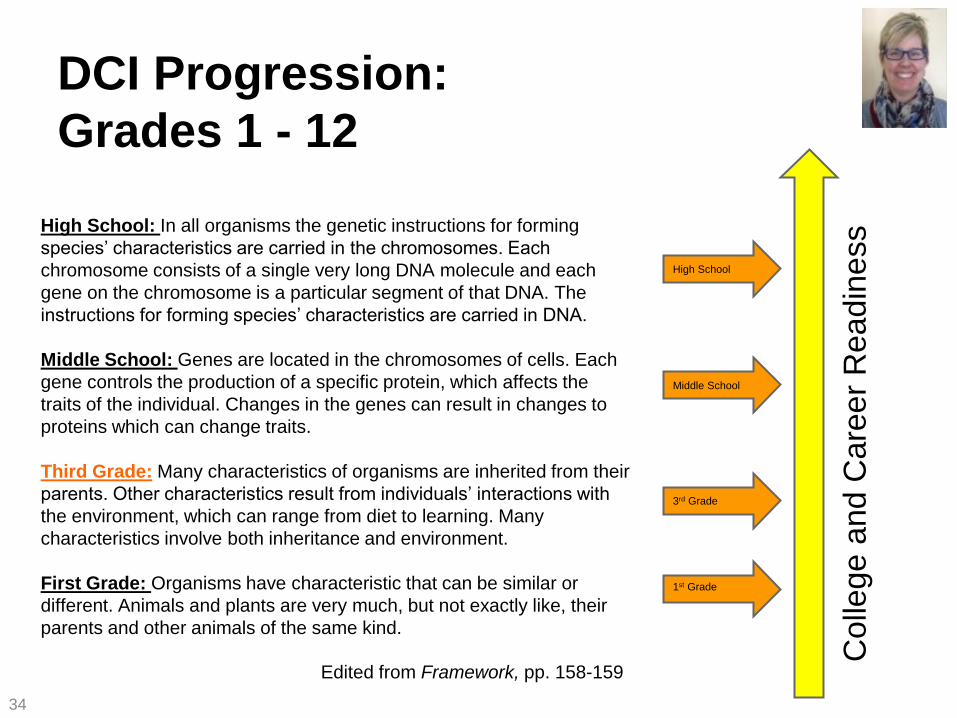
High School: In all organisms the genetic instructions for forming
species’ characteristics are carried in the chromosomes. Each
chromosome consists of a single very long DNA molecule and each
gene on the chromosome is a particular segment of that DNA. The
instructions for forming species’ characteristics are carried in DNA.
Middle School: Genes are located in the chromosomes of cells. Each
gene controls the production of a specific protein, which affects the
traits of the individual. Changes in the genes can result in changes to
proteins which can change traits.
Third Grade: Many characteristics of organisms are inherited from their
parents. Other characteristics result from individuals’ interactions with
the environment, which can range from diet to learning. Many
characteristics involve both inheritance and environment.
First Grade: Organisms have characteristic that can be similar or
different. Animals and plants are very much, but not exactly like, their
parents and other animals of the same kind.
34
Colle
ge a
nd C
are
er
Readin
ess
1st Grade
3rd Grade
Middle School
High School
DCI Progression:
Grades 1 - 12
Edited from Framework, pp. 158-159
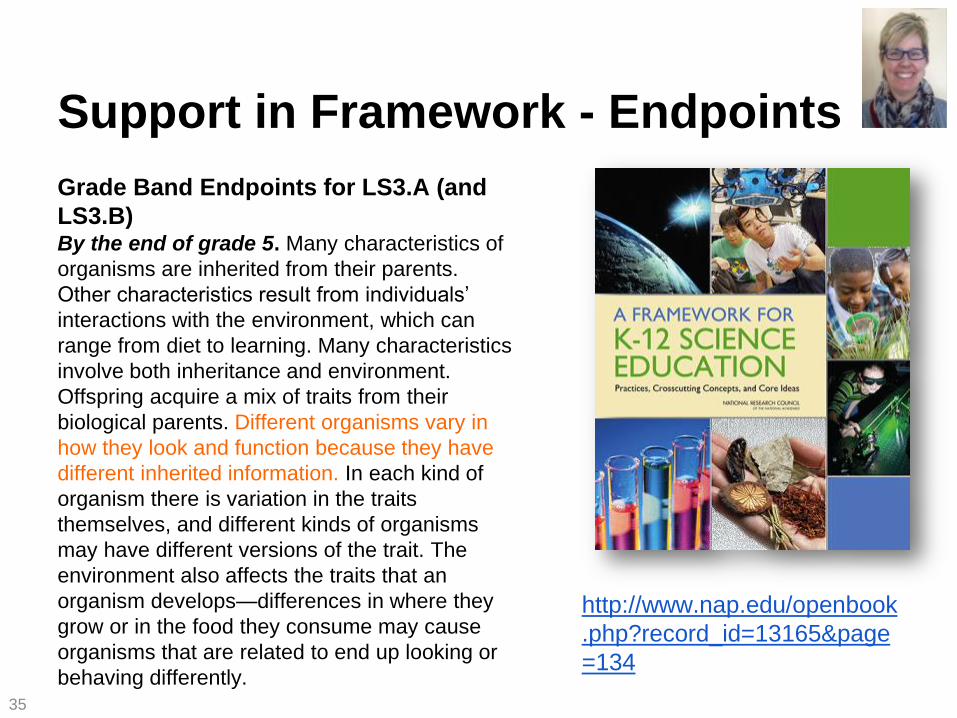
Grade Band Endpoints for LS3.A (and
LS3.B)
http://www.nap.edu/openbook
.php?record_id=13165&page
=134
35
By the end of grade 5. Many characteristics of
organisms are inherited from their parents.
Other characteristics result from individuals’
interactions with the environment, which can
range from diet to learning. Many characteristics
involve both inheritance and environment.
Offspring acquire a mix of traits from their
biological parents. Different organisms vary in
how they look and function because they have
different inherited information. In each kind of
organism there is variation in the traits
themselves, and different kinds of organisms
may have different versions of the trait. The
environment also affects the traits that an
organism develops—differences in where they
grow or in the food they consume may cause
organisms that are related to end up looking or
behaving differently.
Support in Framework - Endpoints
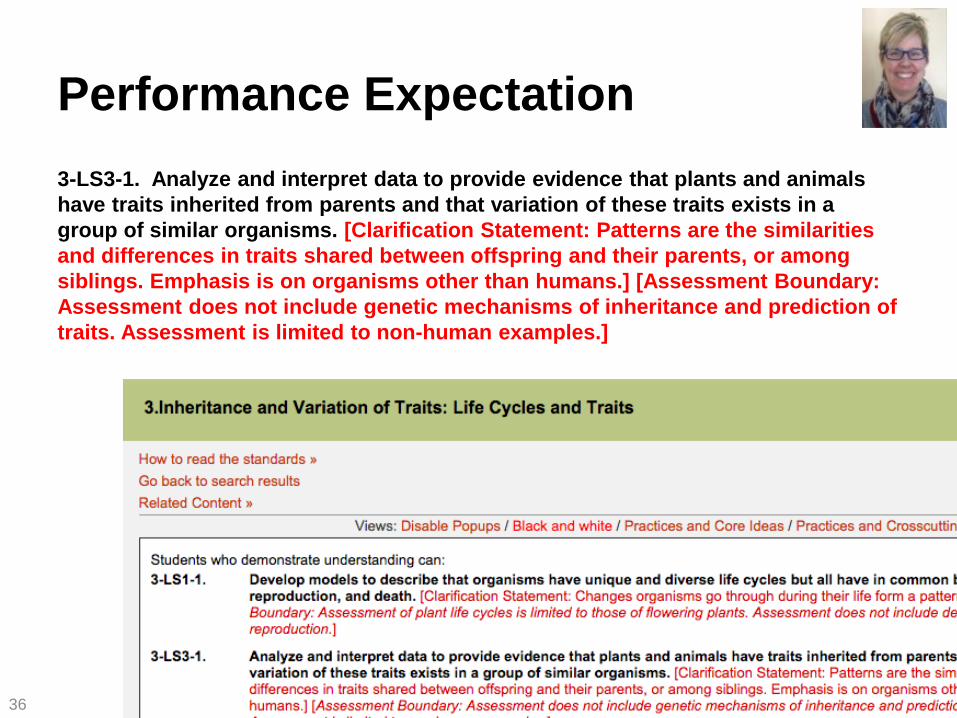
Performance Expectation
3-LS3-1. Analyze and interpret data to provide evidence that plants and animals
have traits inherited from parents and that variation of these traits exists in a
group of similar organisms. [Clarification Statement: Patterns are the similarities
and differences in traits shared between offspring and their parents, or among
siblings. Emphasis is on organisms other than humans.] [Assessment Boundary:
Assessment does not include genetic mechanisms of inheritance and prediction of
traits. Assessment is limited to non-human examples.]
36

37

Scientific and Engineering
Practices
1. Asking probing questions and
defining problems
2. Developing and using models
3. Planning and carrying out
investigations
5. Using mathematics and
computational thinking
8. Obtaining, evaluating, and
communicating information
4. Analyzing and interpreting
data (Identified in the PE)
6. Developing explanations and
designing solutions
7. Engaging in argument from
evidence
38

Check Point
What questions do you
have about…
Making sense of 3rd grade
performance expectations
and/or
Preparing to teach the
content of inheritance and
variation of traits
39
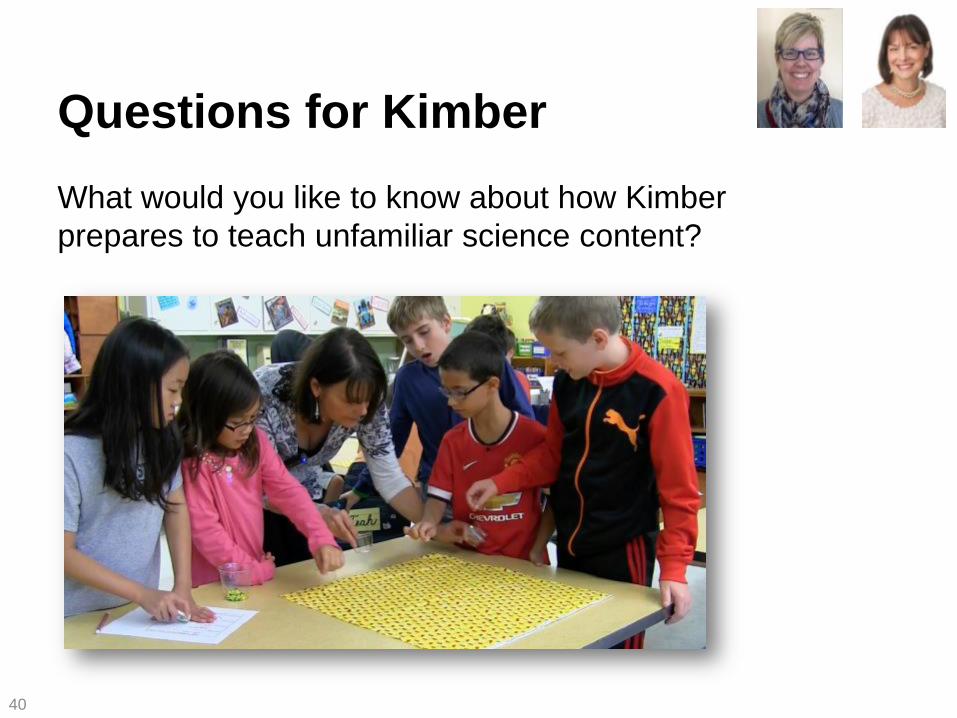
Questions for Kimber
What would you like to know about how Kimber
prepares to teach unfamiliar science content?
40

Poll: Inheritance and variation of traits
Which response best reflects how you have taught
inheritance and/or variation of traits in the elementary
grades (or observed it being taught in K-5)?
a. Create real or imagined organisms that show how particular
adaptations are related to survival (e.g., camouflage).
b. Collect data about how offspring look like (and don’t look like) parents
and siblings.
c. Match pictures of animals and/or plants to offspring.
d. Other (please describe briefly)
41
After you have answered the poll, watch as the results unfold and read the
chat box for teacher’s descriptions of other activities.

Performance Expectation
3-LS3-1. Analyze and interpret data to provide
evidence that plants and animals have traits inherited
from parents and that variation of these traits exists in
a group of similar organisms. [Clarification Statement:
Patterns are the similarities and differences in traits shared
between offspring and their parents, or among siblings.
Emphasis is on organisms other than humans.]
[Assessment Boundary: Assessment does not include
genetic mechanisms of inheritance and prediction of traits.
Assessment is limited to non-human examples.]
42

Before this lesson…
43
Build-A-Bug:
Common characteristics of insects
Common characteristics of a species

Coherent Science Content Storyline
A main learning goal
Goal statement or
question
Activities that match the
learning goal
Content representations
that match the learning
goal
Content ideas linked to
other content ideas
Key ideas and activities
sequences appropriately
44
Roth et al., 2011

Adaptations Unit Storyline
45
Question Claim Evidence Reasoning Investigation
Do cockroaches have individual differences?
Yes. We were able to identify our team’s individual cockroach because…
Close observation of individual adult cockroaches (e.g., ours was 7 cm and had light and dark stripes on the abdomen)
There are variations of traits in a species that provides a survival advantage for some individuals in a given environment.
Each team closely observes their cockroach, records its coloration and size, and tries to identify it when mixed in with others.
46
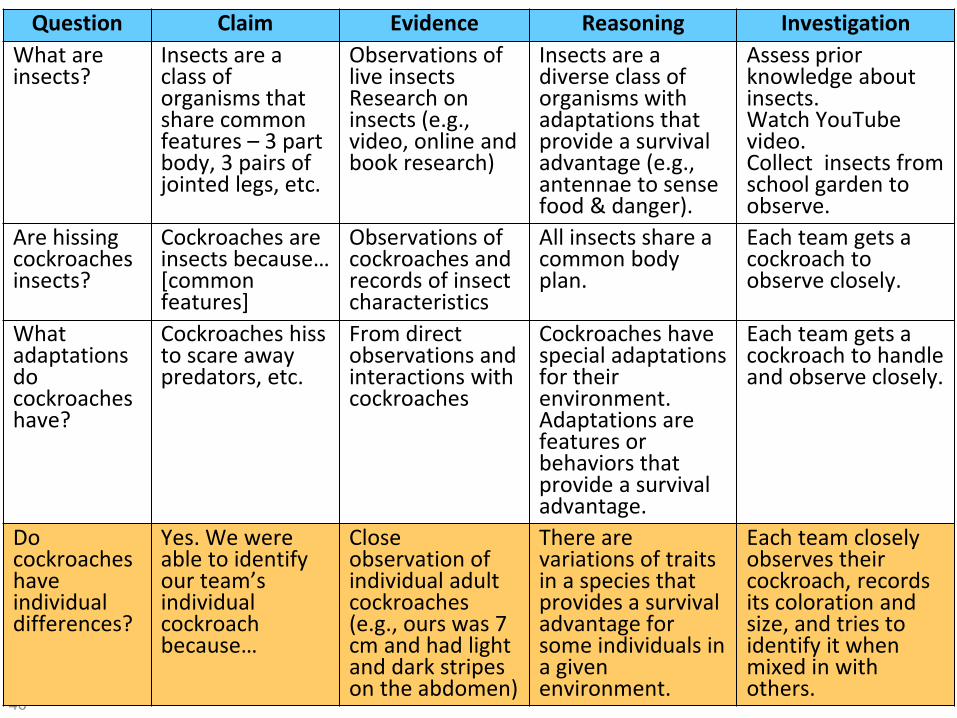
Question Claim Evidence Reasoning Investigation
What are insects?
Insects are a class of organisms that share common features – 3 part body, 3 pairs of jointed legs, etc.
Observations of live insects Research on insects (e.g., video, online and book research)
Insects are a diverse class of organisms with adaptations that provide a survival advantage (e.g., antennae to sense food & danger).
Assess prior knowledge about insects. Watch YouTube video. Collect insects from school garden to observe.
Are hissing cockroaches insects?
Cockroaches are insects because… [common features]
Observations of cockroaches and records of insect characteristics
All insects share a common body plan.
Each team gets a cockroach to observe closely.
What adaptations do cockroaches have?
Cockroaches hiss to scare away predators, etc.
From direct observations and interactions with cockroaches
Cockroaches have special adaptations for their environment. Adaptations are features or behaviors that provide a survival advantage.
Each team gets a cockroach to handle and observe closely.
Do cockroaches have individual differences?
Yes. We were able to identify our team’s individual cockroach because…
Close observation of individual adult cockroaches (e.g., ours was 7 cm and had light and dark stripes on the abdomen)
There are variations of traits in a species that provides a survival advantage for some individuals in a given environment.
Each team closely observes their cockroach, records its coloration and size, and tries to identify it when mixed in with others.

47
Question Claim Evidence Reasoning Investigation
Do cockroaches have individual differences?
Yes. We were able to identify our team’s individual cockroach because…
Close observation of individual adult cockroaches (e.g., ours was 7 cm and had light and dark stripes on the abdomen)
There are variations of traits in a species that provides a survival advantage for some individuals in a given environment.
Each team closely observes their cockroach, records its coloration & size, & tries to identify it when mixed in with others.
Do variations in traits help individuals to survive in a particular environment?
Some “toothpick grasshoppers” were able to blend in with the grass better than others, so they avoided predators.
We started with 50 of each color of toothpick. The yellow and green survived predation the best because they had the most left (48 and 39).
Camouflage is an adaptation that allows organisms to blend in with its environment. Variations in color within a species can result in some individuals to have a survival advantage.
Simulation with different colored toothpicks in grass.
How does the environment influence survival of a species?
Over 4 generations, there were more brown “dot beetles” in the group than any other color because they were better camouflaged.
We started with 50 of each color of dots. After each round of predation, the surviving dots got to reproduce. The data shows the numbers of each color…
Organisms of a group that survive & reproduce in an environment pass their traits to their offspring. Over time the traits of survivors become more common in the group.
Dot lab with fabric “environment”
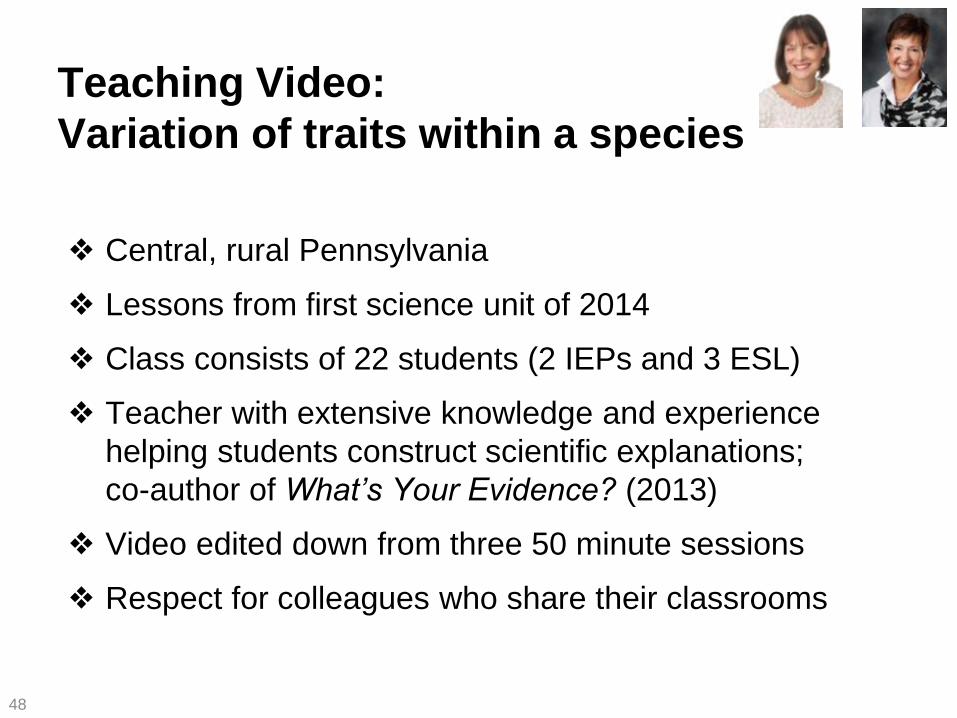
Teaching Video:
Variation of traits within a species
❖ Central, rural Pennsylvania
❖ Lessons from first science unit of 2014
❖ Class consists of 22 students (2 IEPs and 3 ESL)
❖ Teacher with extensive knowledge and experience
helping students construct scientific explanations;
co-author of What’s Your Evidence? (2013)
❖ Video edited down from three 50 minute sessions
❖ Respect for colleagues who share their classrooms
48

Talk Moves from Ready, Set, Science!
Michaels et al., 2008, p.91
Talk Move Example Teacher Statement
Asking students to
restate someone else’s
reasoning
Can you repeat what he just said in your
own words?
Prompting students for
further participation
Do you agree and disagree and why?
What evidence helped you arrive at that
answer?
Asking students to
explicate their
reasoning
Would someone like to add on?
Using wait time Take your time – we’ll wait.
Revoicing So let me see if I’ve got your thinking
right. You’re saying ___________?

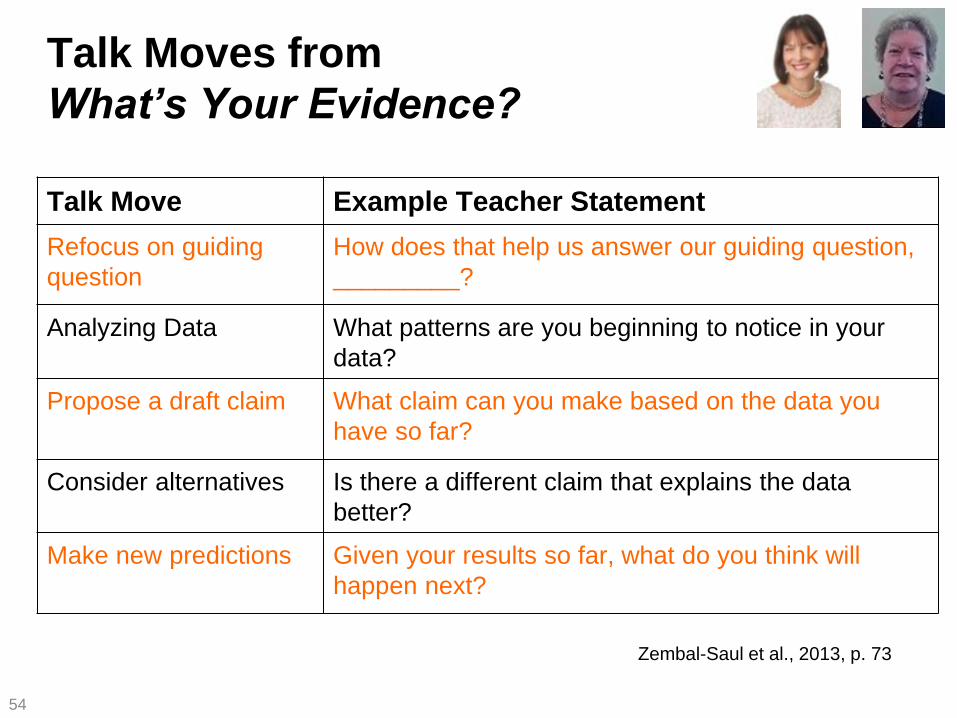
Talk Moves from
What’s Your Evidence?
Zembal-Saul et al., 2013, p. 73
Talk Move Example Teacher Statement
Refocus on guiding
question
How does that help us answer our guiding question,
_________?
Analyzing Data What patterns are you beginning to notice in your
data?
Propose a draft claim What claim can you make based on the data you
have so far?
Consider alternatives Is there a different claim that explains the data
better?
Make new predictions Given your results so far, what do you think will
happen next?
50

Watch the Video
https://psu.box.com/s/sfe0d5iflj7dtof68pxo 51

How did Kimber use
talk moves to
scaffold the
experience of
analyzing qualitative
data and
constructing a claim
from evidence?
52
Reflection
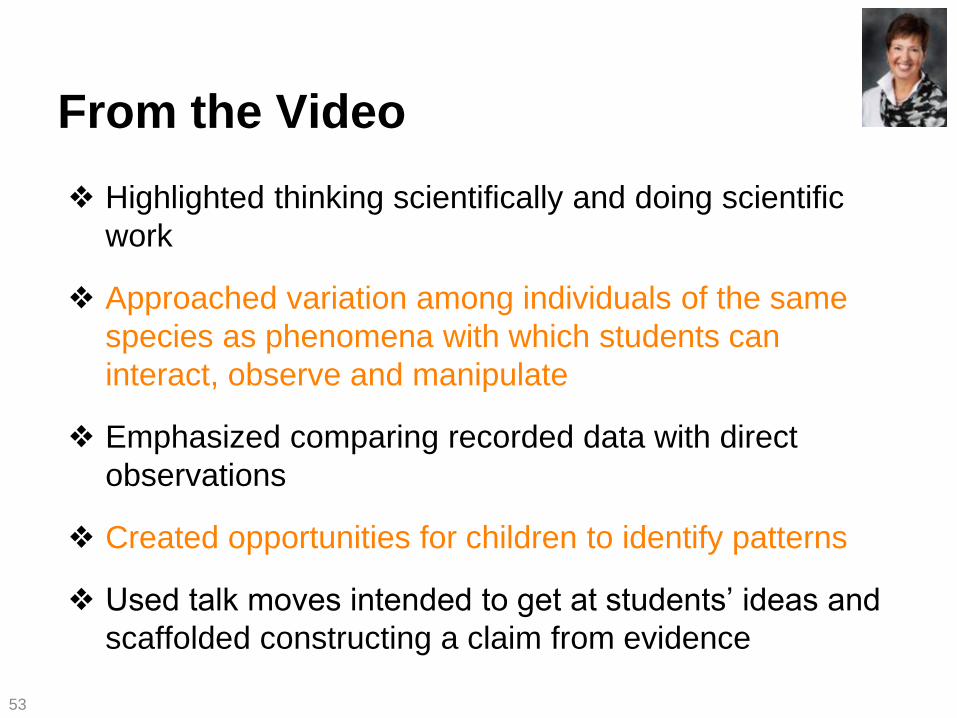
From the Video
❖ Highlighted thinking scientifically and doing scientific
work
❖ Approached variation among individuals of the same
species as phenomena with which students can
interact, observe and manipulate
❖ Emphasized comparing recorded data with direct
observations
❖ Created opportunities for children to identify patterns
❖ Used talk moves intended to get at students’ ideas and
scaffolded constructing a claim from evidence
53
Talk Moves from
What’s Your Evidence?
Zembal-Saul et al., 2013, p. 73
Talk Move Example Teacher Statement
Refocus on guiding
question
How does that help us answer our guiding question,
_________?
Analyzing Data What patterns are you beginning to notice in your
data?
Propose a draft claim What claim can you make based on the data you
have so far?
Consider alternatives Is there a different claim that explains the data
better?
Make new predictions Given your results so far, what do you think will
happen next?
54

Scaffolding data collection
55

Constructing claims
from evidence
56

Scientific and Engineering
Practices
57
1. Asking probing questions and
defining problems
2. Developing and using models
3. Planning and carrying out
investigations
4. Analyzing and interpreting
data (Identified in the PE)
5. Using mathematics and
computational thinking
6. Developing explanations and
designing solutions
7. Engaging in argument from
evidence
8. Obtaining, evaluating, and
communicating information

Explanation and Argument
Constructing scientific explanation – the use of
observations/data and science ideas to construct evidence-
based accounts of natural phenomena
Argument from evidence – the process of reaching
agreement about explanations
58
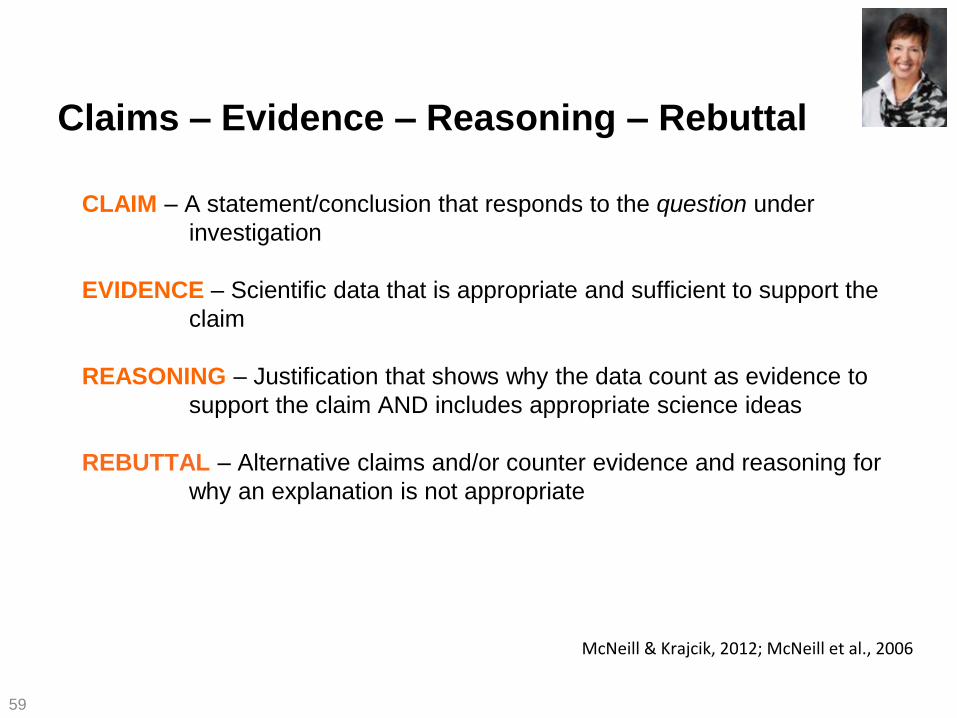
Claims – Evidence – Reasoning – Rebuttal
CLAIM – A statement/conclusion that responds to the question under
investigation
EVIDENCE – Scientific data that is appropriate and sufficient to support the
claim
REASONING – Justification that shows why the data count as evidence to
support the claim AND includes appropriate science ideas
REBUTTAL – Alternative claims and/or counter evidence and reasoning for
why an explanation is not appropriate
McNeill & Krajcik, 2012; McNeill et al., 2006
59

CER Framework
Evidence
Evidence
Evidence
CLAIM 1 not b/c CLAIM 2
EVIDENCE
and
REASONING
Reasoning McNeill & Krajcik, 2012
Engage with
phenomena
Ask questions that
require investigation
60

Beyond Activities
❖ Activities (“hands-on”) alone are not enough
❖ Integration of core ideas, scientific practices, and cross-
cutting concepts (3D learning) essential for meaningful
science learning
❖ Investigations as a vehicle for...
● Engaging with scientific phenomena
● Collecting data from which to construct arguments and explanations
● Testing ideas and explanations
61
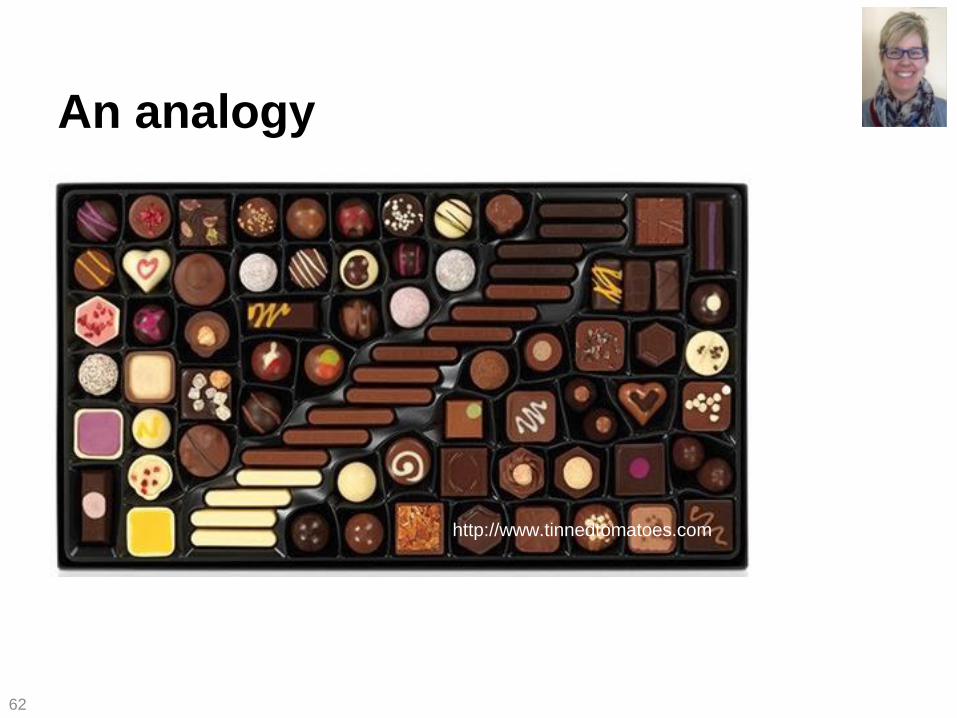
An analogy
62
http://www.tinnedtomatoes.com
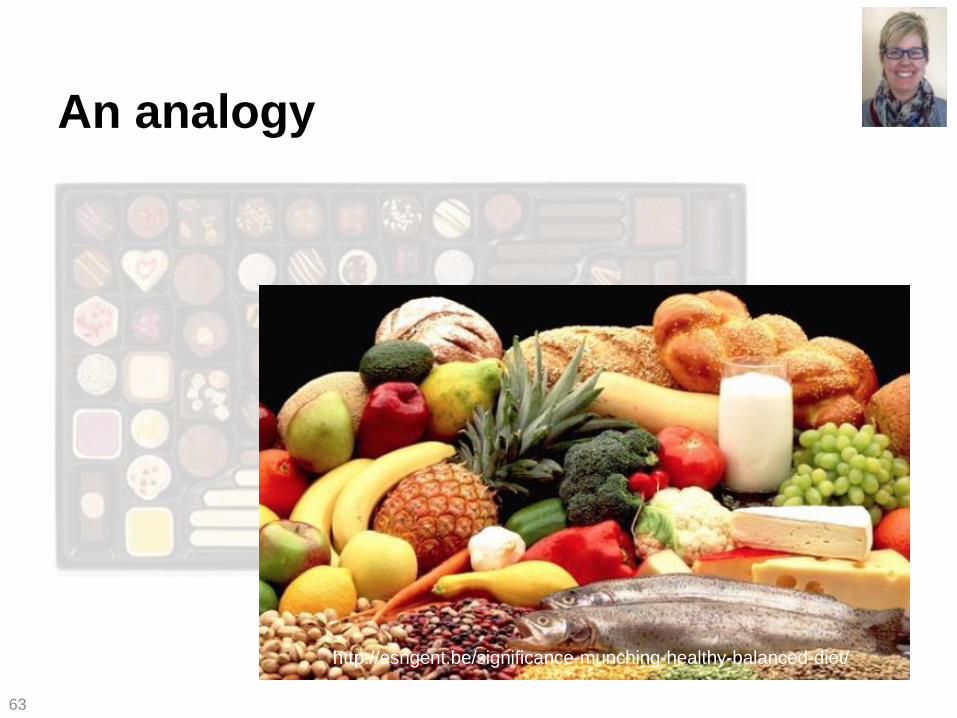
An analogy
63
http://www.tinnedtomatoes.com
http://esngent.be/significance-munching-healthy-balanced-diet/

What teachers need to know...
❖ Disciplinary core ideas (and cross-cutting concepts)
❖ Scientific (and engineering) practices
❖ Children’s ideas and reasoning
❖ Learning progressions
❖ Strategies for rich classroom talk
❖ Formative assessment approaches
❖ Interdisciplinary connections
64

What teachers need to know...
65
❖ Disciplinary core ideas (and cross-cutting concepts)
❖ Scientific (and engineering) practices
❖ Children’s ideas and reasoning
❖ Learning progressions
❖ Strategies for rich classroom talk
❖ Formative assessment approaches
❖ Interdisciplinary connections

NGSS Webinar Series for K-5
66
❖ Importance of engaging young children in meaningful science
learning and scientific discourse and practices
❖ Foundation for future learning in science
❖ Opportunity to examine NGSS in early grades and focus on teaching
particular content and practices
❖ Connecting core ideas with ELA and mathematics
❖ Development of a community of practice focused on elementary
grades
❖ Vehicle to access instructional resources for teaching

Professional Learning
What is one idea or practice from the webinar
that you will take back to your instructional
setting and use?
Please share in the chat window.
67

NSTA Learning Center
68

Instructional Resources
69
http://goo.gl/7tSC35
http://goo.gl/LKwXLy
http://goo.gl/qml3MW http://goo.gl/puUqX5
http://goo.gl/lzFyc2
http://goo.gl/7d7pNS
http://goo.gl/JOPdnH
On the Web
nextgenscience.org
nsta.org/ngss
70
Welcome to the NGSS@NSTA Hub!

Connect and Collaborate
Discussion forum on NGSS in the Learning center
NSTA Member-only
Listserv on NGSS
71
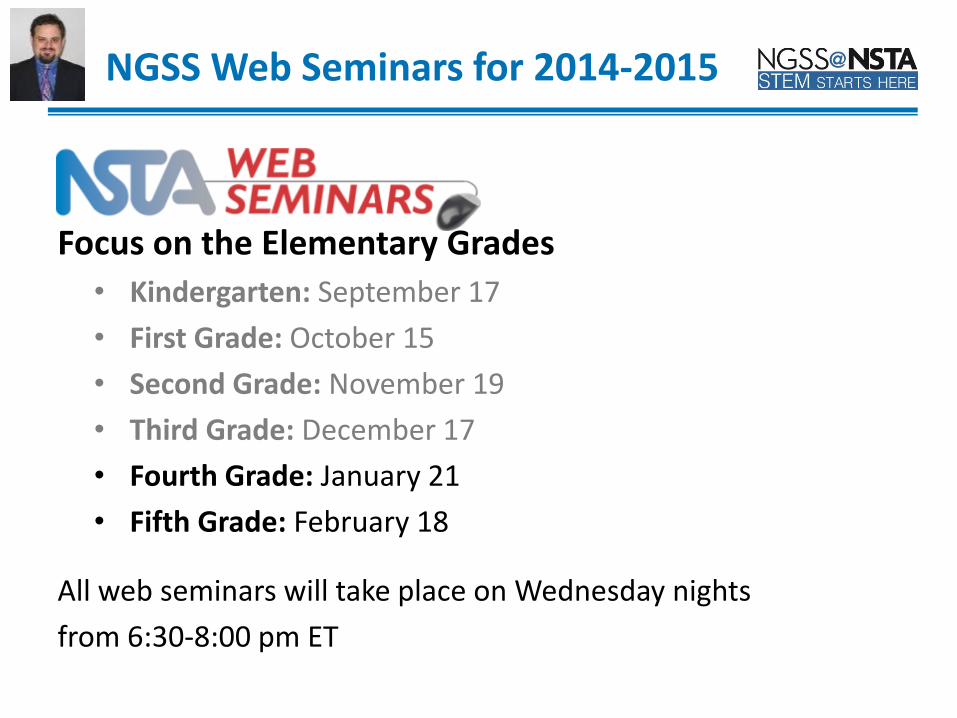
NGSS Web Seminars for 2014-2015
Focus on the Elementary Grades
• Kindergarten: September 17
• First Grade: October 15
• Second Grade: November 19
• Third Grade: December 17
• Fourth Grade: January 21
• Fifth Grade: February 18
All web seminars will take place on Wednesday nights
from 6:30-8:00 pm ET

NSTA Resources on NGSS
Web Seminar Archives
• Practices (Fall 2012)
• Crosscutting Concepts (Spring 2013)
• Disciplinary Core Ideas (Fall 2013, Spring 2014)
• Assessment (January 2014)
Journal Articles
• Science and Children
• Science Scope
• The Science Teacher
73

From the NSTA Bookstore
74

NGSS App
75

Conferences in 2015
National Conference
Chicago March 26-29, 2015
76
STEM Forum
Minneapolis May 20-23, 2015
Conferences in 2015
77
Philadelphia, PA November 12-14
Reno, NV October 22-24
Kansas City, MO December 3-5

Thanks to today’s presenters!
Thanks to today’s presenters
78
Ted Willard Director, NGSS@NSTA National Science Teachers Association
Carla Zembal-Saul Professor of Science Education Penn State University
Mary Starr Executive Director Michigan Mathematics and Science Centers Network
Kathy Renfrew K-5 Science Coordinator, VT Agency of Education NGSS Curator

Thank you to the sponsor of today’s web seminar:
This web seminar contains information about programs, products, and services offered by third parties, as well as links to third-party websites. The presence of a listing or
such information does not constitute an endorsement by NSTA of a particular company or organization, or its programs, products, or services.
Thanks to today’s sponsor
79

Thanks to NSTA administration
National Science Teachers Association
David Evans, Ph.D., Executive Director
Al Byers, Ph.D., Associate Executive Director, Services
NSTA Web Seminar Team
Flavio Mendez, Senior Director, NSTA Learning Center Dayna Anderson, NSTA Learning Center Help Desk Manager
Stephanie Erickson, e-Learning Coordinator Jeff Layman, Technical Coordinator
80