technical considerations and best practices in imagery...
TRANSCRIPT

Technical Considerations and Best Practices in Imagery and LiDAR Project Procurement
Presented to the 2014 WV GIS Conference By Brad Arshat, CP, EIT Date: June 4, 2014

Project Accuracy
A critical decision - Accuracy in a large part determines the cost of a project.
Common Standards:
• National Map Accuracy Standards (NMAS)
• American Society for Photogrammetry and Remote Sensing (ASPRS) Accuracy Standards
• National Standard for Spatial Data Accuracy (NSSDA)
5/30/2014 ©2013, The Sanborn Map Company, Inc. 2

NMAS Specifications • National Map Accuracy Standards (NMAS) – Developed by the
U.S. government before WWII and originally applied primarily to small-scale maps such as USGS Quads.
• Developed prior to the existence of digital mapping, when hard copy maps of a fixed scale were the state of technology.
• Basic Specification:
– Horizontal Accuracy: No more than 10 percent of sampled points may be in error by more than 1/30” at map scale.
– Vertical Accuracy: Vertical accuracy is tied to a contour interval. Not more than 10 percent of the elevations sampled may be in error by more than one-half the contour interval. Spot elevations are required to be twice as accurate as contours.
5/30/2014 ©2013, The Sanborn Map Company, Inc. 3

ASPRS Accuracy Specifications American Society of Photogrammetry and Remote Sensing (ASPRS) Accuracy Standards for Large Scale Maps
– Developed in the early 1990’s, as digital mapping was becoming more prevalent
– Three accuracy classes: A map with the highest order accuracy is a “Class 1” map. Class 2 or Class 3 maps have RMSE’s of 2 and 3 times that of Class 1.
– Horizontal Accuracy: Accuracy is expressed in ground units as a limiting RMSE against field-surveyed checkpoints, and associated with a typical corresponding map scale. For example, a 1-foot limiting RMSE correlates with a Class 1 map at 1”=100’.
– Vertical Accuracy: The ASPRS standards set the limiting RMSE for Large-scale Class 1 maps at 1/3 of the contour interval, and for spot elevations at 1/6 of the contour interval.
5/30/2014 ©2013, The Sanborn Map Company, Inc. 4
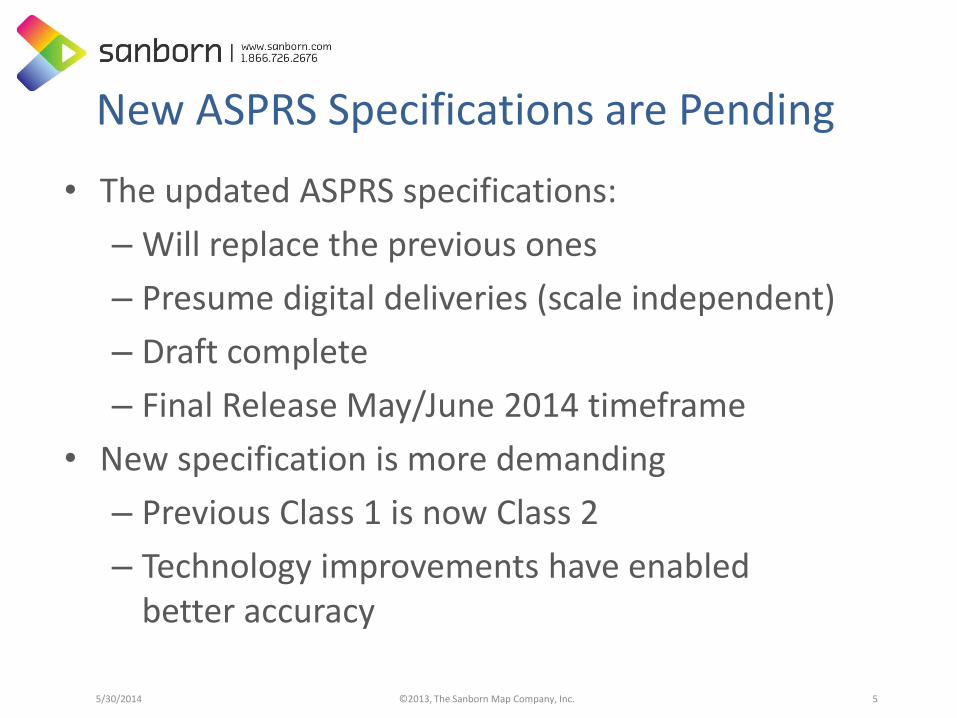
New ASPRS Specifications are Pending
• The updated ASPRS specifications:
– Will replace the previous ones
– Presume digital deliveries (scale independent)
– Draft complete
– Final Release May/June 2014 timeframe
• New specification is more demanding
– Previous Class 1 is now Class 2
– Technology improvements have enabled better accuracy
5/30/2014 ©2013, The Sanborn Map Company, Inc. 5

New ASPR Horizontal
Accuracy/Quality Specification for Orthophotos -
2014
5/30/2014 ©2013, The Sanborn Map Company, Inc. 6
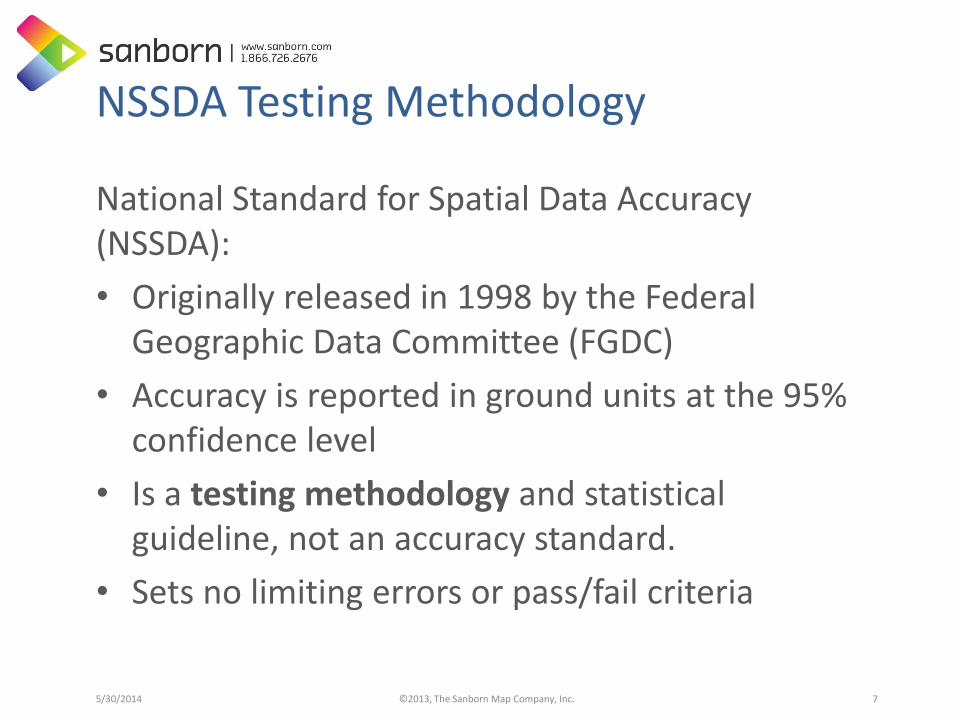
NSSDA Testing Methodology
National Standard for Spatial Data Accuracy (NSSDA):
• Originally released in 1998 by the Federal Geographic Data Committee (FGDC)
• Accuracy is reported in ground units at the 95% confidence level
• Is a testing methodology and statistical guideline, not an accuracy standard.
• Sets no limiting errors or pass/fail criteria
5/30/2014 ©2013, The Sanborn Map Company, Inc. 7

Orthoimagery
A raster image that is combined with differential rectification to remove image displacements caused by camera tilt and terrain relief. It is a map-accurate representation of the surface of the earth.
5/30/2014 ©2013, The Sanborn Map Company, Inc. 8

Ground Sampling Distance (GSD) or Pixel Resolution
9
6” color
12” color
3” color

1-Foot
10

6-Inch
11

3-Inch
12

13
Color and Near-Infrared Bands
Natural Color Near-Infrared
Captured simultaneously on current generation digital aerial cameras

Geo-referencing • Primary image position and orientation information now usually
comes from airborne GPS and IMU technologies, which have reduced dependence on ground control.
• Ground control needs are determined by project accuracy and resolution requirements
• Control must be in correct positions relative to the flight lines and photographic exposure locations
• Targeted control points vs. photo-identification
5/30/2014 ©2013, The Sanborn Map Company, Inc. 14
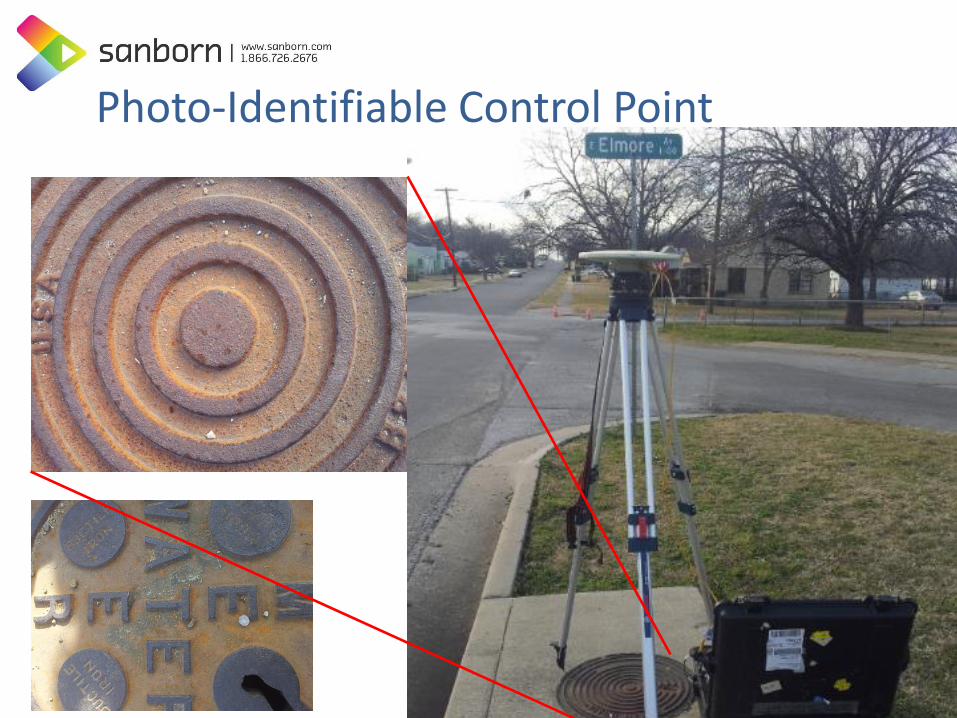
Photo-Identifiable Control Point
16 Stereo Model
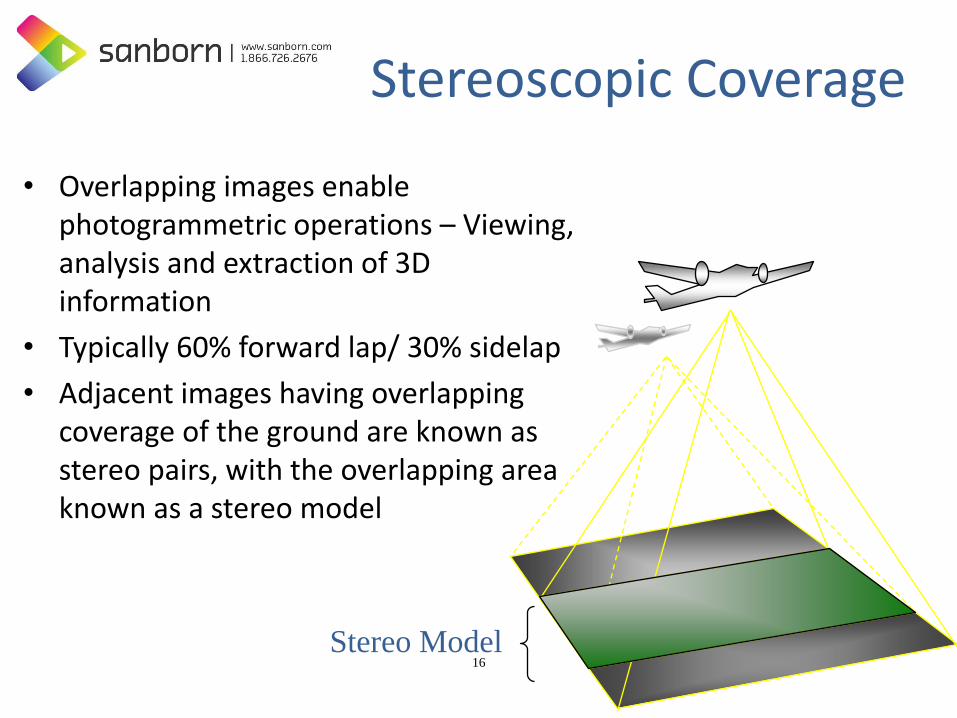
Stereoscopic Coverage
• Overlapping images enable photogrammetric operations – Viewing, analysis and extraction of 3D information
• Typically 60% forward lap/ 30% sidelap
• Adjacent images having overlapping coverage of the ground are known as stereo pairs, with the overlapping area known as a stereo model

Urban Areas - Minimizing Radial Displacement or “Building Lean”
• High Overlap of imagery
– Standard 60%/30%
– High Urban 80%/60%
– Extreme Urban 80%/90%
• True Orthoimagery
– Results removal of building lean
– Less obstruction of ground features
5/30/2014 ©2013, The Sanborn Map Company, Inc. 17
18
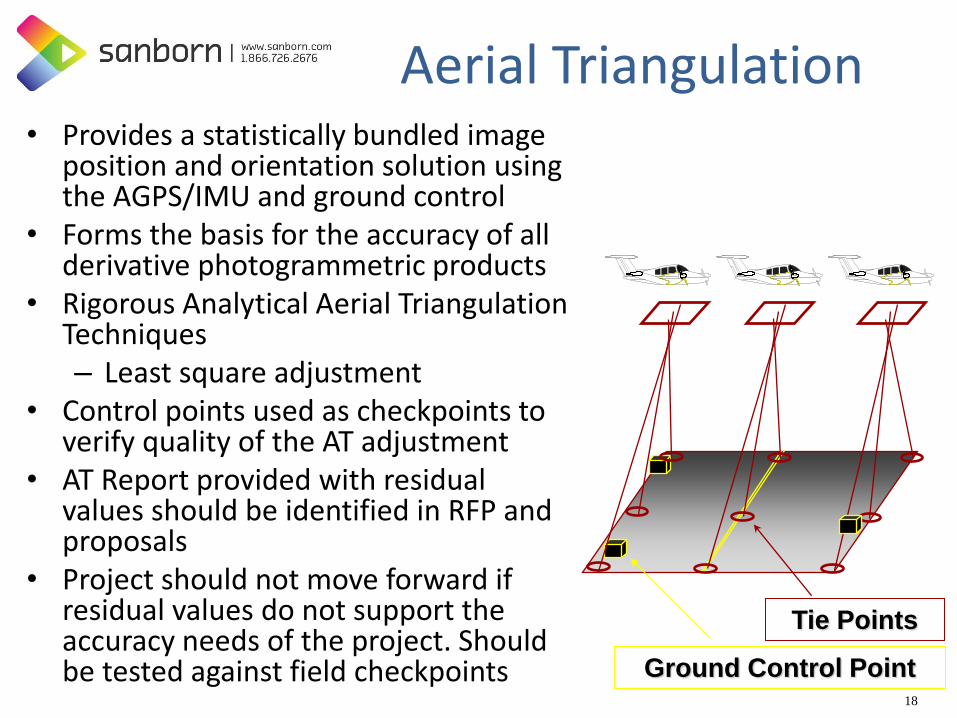
Aerial Triangulation • Provides a statistically bundled image
position and orientation solution using the AGPS/IMU and ground control
• Forms the basis for the accuracy of all derivative photogrammetric products
• Rigorous Analytical Aerial Triangulation Techniques – Least square adjustment
• Control points used as checkpoints to verify quality of the AT adjustment
• AT Report provided with residual values should be identified in RFP and proposals
• Project should not move forward if residual values do not support the accuracy needs of the project. Should be tested against field checkpoints
Tie Points
Ground Control Point

Elevation Model Needed for Ortho- Rectification
• Terrain Data Sources
– LiDAR
– Extraction from Aerial Imagery
• Autocorrelation – automated extraction from stereo imagery
– Public Sources such as USGS 10M or 30M DEM • Usually not sufficient for 6” or better resolution • May need updating
– SAR/Satellite/IFSAR • lowest accuracy; atypical for high accuracy/resolution
projects 5/30/2014 ©2013, The Sanborn Map Company, Inc. 19

Orthophoto Production
20
Digital Orthophoto Imagery
Ortho Rectification Process
Controlled Digital Stereo Images
TIN/DEM
Exterior Orientation From A/T

Typical Imagery Corrections
5/30/2014 ©2013, The Sanborn Map Company, Inc. 21
Typical Bridge Distortion
Orthophoto without
intelligent seams
Orthophoto mosaic with
intelligent seams
Following Correction.

Color Balancing Process Flow
5/30/2014 ©2013, The Sanborn Map Company, Inc. 22

Flitner Overview_LiDAR 23
‘True’ Orthophotos
Conventional Ortho
with Planimetric Overlay
True Ortho with
Planimetric Overlay
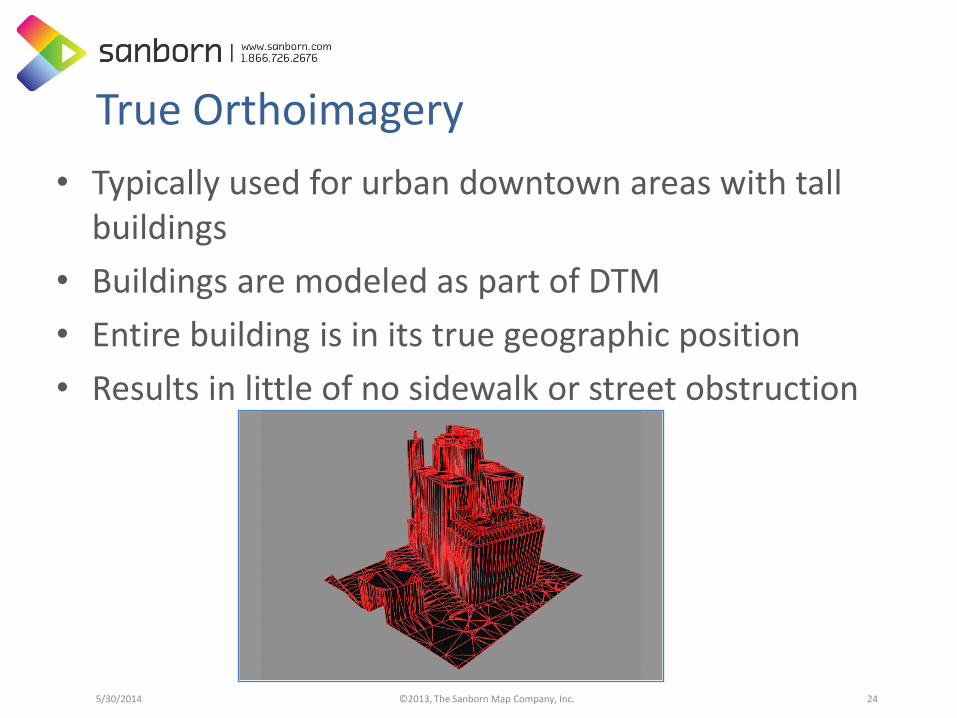
True Orthoimagery
• Typically used for urban downtown areas with tall buildings
• Buildings are modeled as part of DTM
• Entire building is in its true geographic position
• Results in little of no sidewalk or street obstruction
5/30/2014 ©2013, The Sanborn Map Company, Inc. 24

Airborne Light Detection and Ranging (LiDAR)
5/30/2014 ©2013, The Sanborn Map Company, Inc. 25
Aerial sensor Collects/scans data, either photons (reflected light) or laser pulses
Aerial GPS (Global Positioning System) Based on GPS satellite triangulation, measures the location of the aircraft up to 0.1 second.
IMU (Inertial Measurement Unit) Measures attitude (pitch/yaw/roll) of aircraft every .002 second.
Ground GPS Measures the location of the aircraft up to 0.1 second relative to a known ground position

26
LiDAR Raw Point Cloud
• LiDAR produces very-high-resolution three-dimensional point clouds
• Base product is called a “raw”, or calibrated-unclassified point cloud
• Contains all collected points, georeferenced, in 3D
• Untiled – delivered by swath
• LAS data format
• Requires software and expertise to exploit
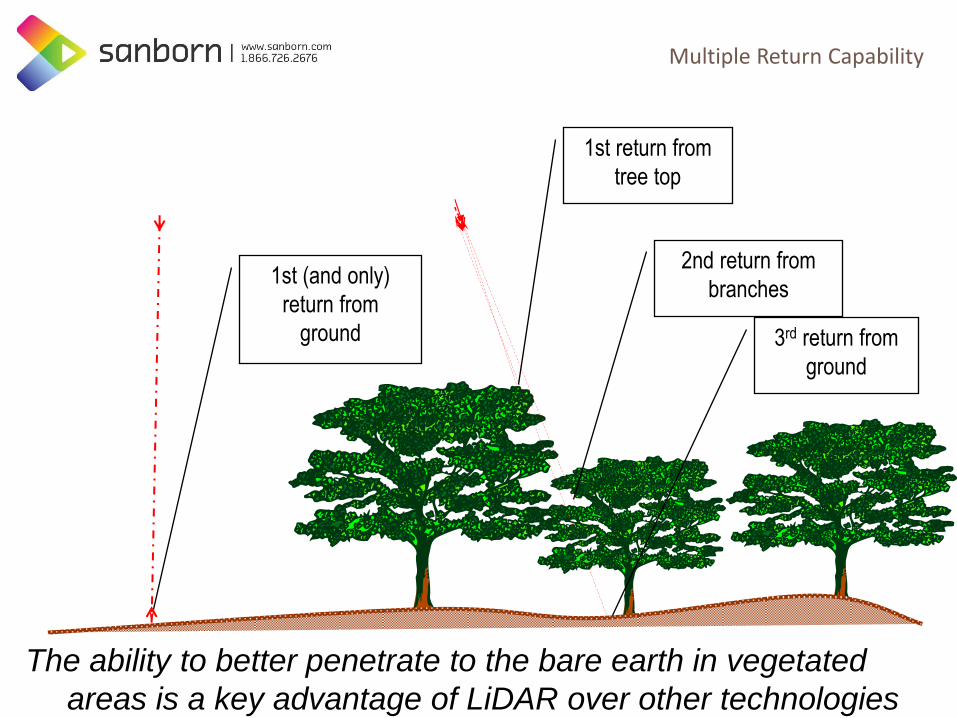
1st (and only)
return from
ground 3rd return from
ground
1st return from
tree top
2nd return from
branches
The ability to better penetrate to the bare earth in vegetated
areas is a key advantage of LiDAR over other technologies
Multiple Return Capability

28
LiDAR Project Planning
• Point density and accuracy needed
• Classification requirements
• Derivative data products needed
• Ground checkpoints
– In different land cover types, if needed (FVA/SVA/CVA)
• Can be collected day or night – no sun angle limitations
• Season of collection
– Most collects are done in the spring and fall
• Leaf off or on?
– Summer collects take place for special applications such
as forestry/timber, WiFi or cell signal analysis
• Rain/Fog/Smoke/Sandstorms are detrimental

29
Fairly flat surface
(e.g., runway)
Test field
surface
Lidar scans
Flig
ht
dir
ec
tio
n
LiDAR System Calibration Critical to data accuracy and quality

30
7,457 sample points, RMSE = 0.11 m, average vertical bias = -0.08 m
Difference Between LIDAR Points and Runway Surface (Post-Processed IMU Data)
-0.5
-0.4
-0.3
-0.2
-0.1
0
0.1
0.2
3953325 3953375 3953425 3953475 3953525 3953575 3953625 3953675 3953725 3953775
Distance (Meters)
Diffe
rence (
Mete
rs)

31
LiDAR Terrain Model Terms What is a DEM, DTM and DSM?
• DEM: Digital Elevation Model
– ‘Bare Earth’; Data structure made up of x, y points with z-values
representing elevations
– No breaklines, mass points only
• DTM: Digital Terrain Model
– A data structure made up of x, y points with z-values
representing elevations
– Bridge removal
– DEM + breaklines = DTM
• DSM: Digital Surface Model
– A model that includes features above ground
(buildings and vegetation)
– Used to distinguish a bare-earth elevation model

32
DEM vs DTM
Breaklines needed to
more accurately
define surface

33
DTM Made Up of LiDAR Masspoints with Breaklines
Breaklines improve surface
fidelity
Breakline

34
LiDAR: All-Return DSM

35
LiDAR: Bare-earth DEM

LiDAR - The Classified Point Cloud
36 Michigan GIS User's Group
• Classification process separates LiDAR points into different categories
• Most basic objective is usually to separate ground points from non-ground points to create a bare-earth surface
• Delivered as tiles or swaths
• LAS data format
Ground/Non-Ground Classification
Class 1 Unclassified
Class 2 Bare earth ground
Class 7 Noise (low or high)
Class 9 Water
Class 10 Ignored Ground
Class 11 Withheld

LiDAR – The Classified Point Cloud
9/11/2013 ©2013, The Sanborn Map Company, Inc. 37
Enhanced Classification Class 0 Created, Never Classified
Class 1 Unclassified
Class 2 Bare Earth Ground
Class 3 Low Vegetation
Class 4 Medium Vegetation
Class 5 High Vegetation
Class 6 Building
Class 7 Low Points (Noise)
Class 8 Model Key Point
Class 9 Water
Class 12 Overlap

LiDAR Sensors: Supervised Classification
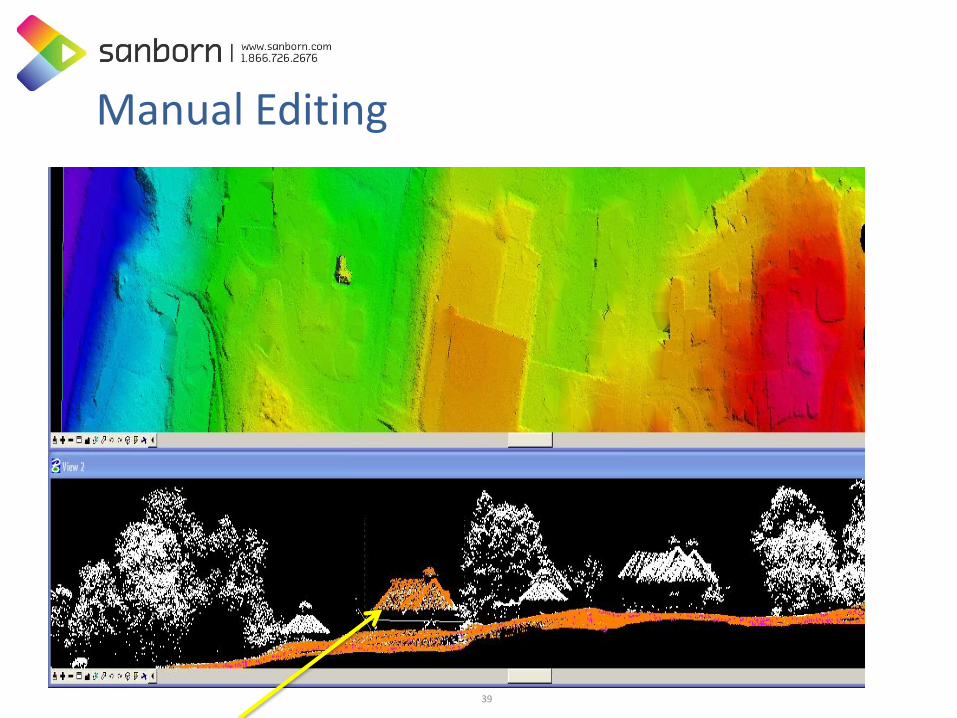
Manual Editing
39

Final Manual Edit & QC
40

Need for Hydrologic Breaklines
• Why Hydro Breaklines
– LiDAR is an active, IR beam
– LiDAR doesn’t provide an accurate return (elevation value) off of water
– Without hydro breaklines, water surface irregular, provide false elevation values, not aesthetically pleasing
– Hydro breaklines flatten surface to lowest adjacent ground elevation
Without hydro breaklines
With hydro breaklines

LiDAR – Hydro Flattening
42
• Hydrological Conditioning - Enhancement of a DEM so you have a uniform,
continuous hydrological surface.
• Hydrological Enforcement - Processing of mapped water bodies so that streams
flow downhill
Before After

LiDAR – The Intensity Image
43
• Each LiDAR return has an intensity value
• Intensity image is a collective display of the intensity values.
• White areas show high reflectance (strong return) while black areas show low reflectance (weak return).
• Useful for: • Quality controlling
LiDAR • Breakline extraction • LiDARgrammetry • Feature Extraction

Current LiDAR Specifications • U.S. Geological Survey, 2009 (draft), National
Geospatial LiDAR Guidelines and Base Specifications; Version 1.0 (2012 published)
– For the first time, a comprehensive national LiDAR guideline and specification document
– All stimulus funding through USGS had to follow spec, most of the other federal agencies have started to follow this spec, many state agencies and some local government follow this spec and some add additional language to scope of work
• FEMA document, 2010 – Procedure Memorandum No. 16; Standards for LiDAR and Other High Quality Digital Topography – much of the LiDAR specs are based on the USGS National LiDAR specs
5/30/2014 ©2013, The Sanborn Map Company, Inc. 44

USGS Required LiDAR Products Under Base Specification V1
• Raw point cloud (LAS file format)
• Classified point cloud (LAS format)
• Bare earth DEM (hydro-flattened)
• Breaklines
• FGDC Metadata
• Acquisition/Survey LiDAR Report
• Ground checkpoints & accuracy assessment

National Enhanced Elevation Assessment (NEEA) • 2011 federally commissioned study on
nationwide LiDAR cost/benefits
• Primary Reasons for study
– Document national-level requirements for improved elevation data
– Identify program implementation alternatives, costs and benefits of meeting priority Federal, State and other national needs
– Evaluate multiple national-level program-implementation scenarios
9/11/2013 ©2013, The Sanborn Map Company, Inc. 46
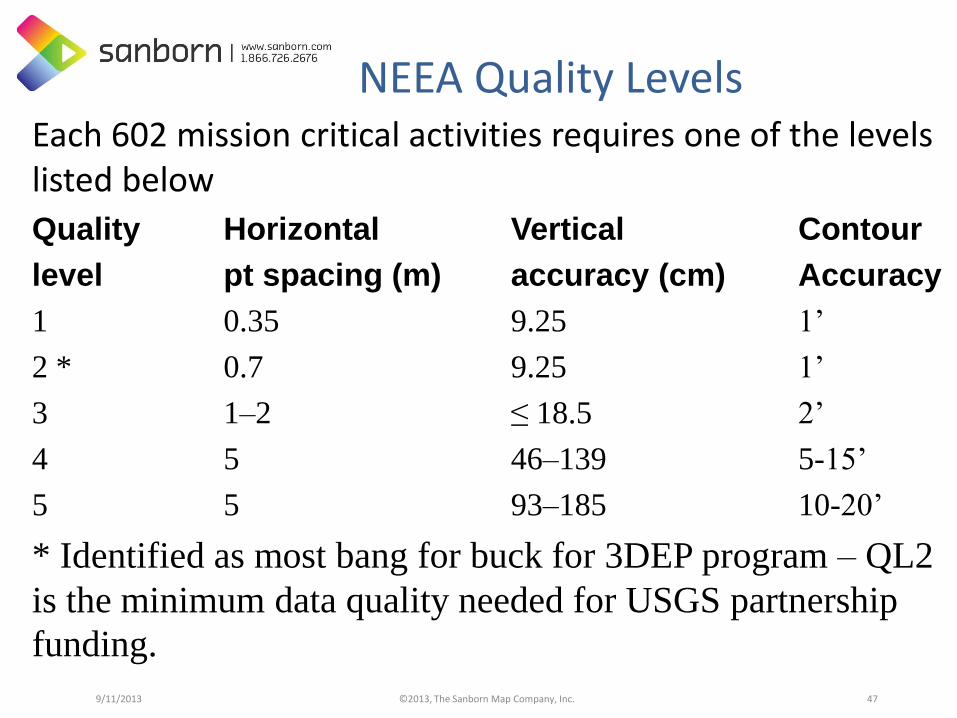
NEEA Quality Levels Each 602 mission critical activities requires one of the levels
listed below
Quality Horizontal Vertical Contour
level pt spacing (m) accuracy (cm) Accuracy
1 0.35 9.25 1’
2 * 0.7 9.25 1’
3 1–2 ≤ 18.5 2’
4 5 46–139 5-15’
5 5 93–185 10-20’
* Identified as most bang for buck for 3DEP program – QL2
is the minimum data quality needed for USGS partnership
funding. 9/11/2013 ©2013, The Sanborn Map Company, Inc. 47
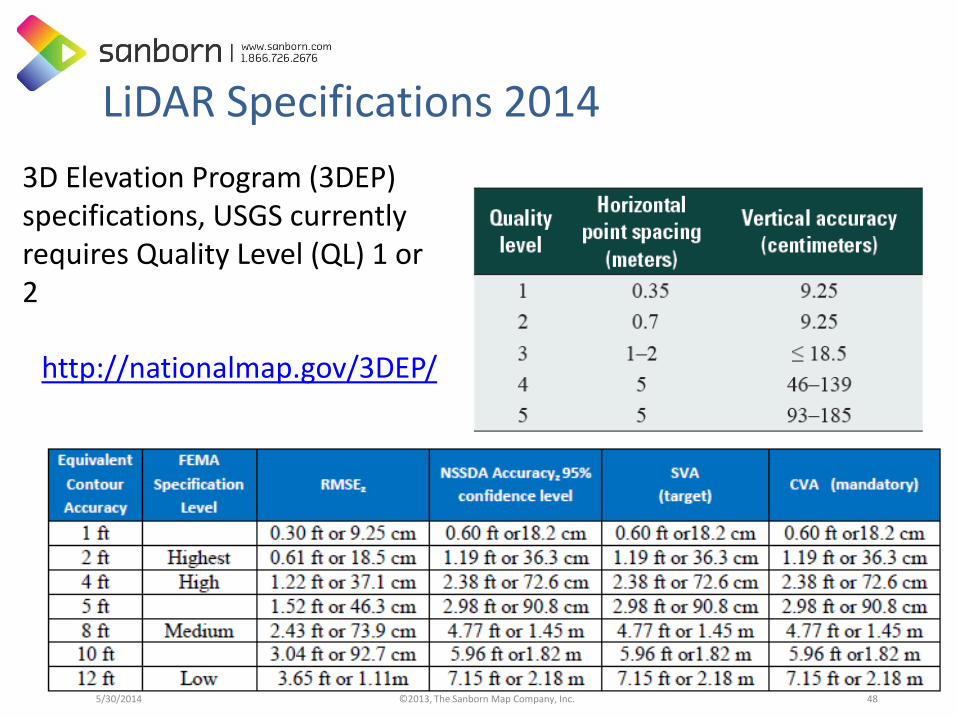
LiDAR Specifications 2014
5/30/2014 ©2013, The Sanborn Map Company, Inc. 48
http://nationalmap.gov/3DEP/
3D Elevation Program (3DEP) specifications, USGS currently requires Quality Level (QL) 1 or 2

49
LiDAR Accuracy
LiDAR should be tested against field checkpoints
prior to delivery and an accuracy report provided.
• FVA: Fundamental Vertical Accuracy
– Based on testing against well-distributed checkpoints located
only in open terrain, free of vegetation, where there is a high
probability that the sensor will have detected the ground surface
• SVA: Supplemental Vertical Accuracy
– Based on testing against checkpoints in a single land cover
category (e.g. forest, grassland)
• CVA: Consolidated Vertical Accuracy
– Based on testing against checkpoints in multiple land cover
categories combined, normally including open terrain and
vegetated terrain representative of the land cover for the project
area being tested

Questions?