technical efficiency measurement within the ivorian ...publi.cerdi.org/ed/2002/2002.04.pdf · nous...
TRANSCRIPT
CERDI, Etudes et Documents , E 2002.04
CENTRE D’ETUDESET DE RECHERCHESSUR LE DEVELOPPEMENTINTERNATIONAL
Document de travail de la sérieEtudes et Documents
E 2002.04
Technical Efficiency measurementwithin the Ivorian Manufacturing Sector:a Data Envelopment Analysis Approach
Karine Chapelle Patrick PlaneCERENE CERDI - UMR 6587Université du Havre Université d'Auvergne25, rue Philippe Lebon 65, boulevard F. Mitterrand
janvier 2002, 27 p.
The authors would like to thank Jean-Louis Arcand (CERDI, Université d'Auvergne), Bernard Decaluwé(CREFA, Université Laval), Kristiann Kerstens (CRESEG, Université de Lille) and Bruno Larue(CREFA, Université Laval), for there useful comments of previous versions of this paper.

CERDI, Etudes et Documents , E 2002.04
2
Abstract
The African industrial structure is characterised by a strong firm-size heterogeneitywith a co-existence of small if not micro-enterprises of the informal sector and largeformal organisations operating with a modern technology. In this paper, we investigatethe technical efficiency of Ivorian manufacturing firms in four sectors of economicactivity: textile and garment, metal products, wood and furniture, food processing. TheDEA production frontier is the non-parametric methodology to which we refer to.
Efficiency scores are calculated by following the four-stage procedure as presentedby Fried, Schmidt and Yaisawarng (1999). In other words, the initial DEA scores areadjusted to take into account the impact of the external operating environment on thevolume of the input use. Technical efficiency are then decomposed into three elements:the pure managerial effect, the impact of the production scale, but also a technologicaleffect capturing the potential gain that could result from the adoption of the moderntechnology by small informal firms.
Key words: Technical efficiency, Côte d'Ivoire, non parametric frontier, manufacturingsector, formal-informal sectors
Résumé
La structure industrielle africaine est caractérisée par une importantehétérogénéité avec une coexistence de petites sinon de micro-entreprises du secteurinformel et de grandes organisations opérant dans le secteur moderne. Dans cet article,nous étudions l'efficience technique des entreprises manufacturières ivoiriennes dansquatre secteurs d'activité: le textile et l'habillement, la métallurgie, le travail du bois etles activités agro-alimentaires. La frontière de production DEA est la méthodologie nonparamétrique à laquelle nous nous référons.
Les scores d'efficience sont calculés en suivant la procédure en quatre étapesproposée par Fried, Schmidt et Yaisawarng (1999). En d'autres termes, les scoresinitiaux obtenus de l'utilisation de la technique DEA sont ajustés pour tenir compte del'impact de l'environnent externe sur le volume de la consommation de facteurs deproduction. Les efficiences techniques sont alors décomposées en trois éléments: l'effetmanagérial pur, l'impact de l'échelle de production, mais également un effettechnologique qui capte le gain potentiel pouvant résulter de l'adoption par les petitesentreprises informelles de la technologie du secteur moderne.
Mots clé : Efficience technique, Côte d'Ivoire, frontière non paramétique, secteurmanufacturier, secteurs formel-informel.

CERDI, Etudes et Documents , E 2002.04
3
I. Introduction
In the standard neo-classical theory, the long run equilibrium refers to a situation
where all firms supply homogenous products and quantities at the same market price
(see Viner, 1932). We know that economic reality provides little evidence of this
theoretical assumption. In developed countries, small firms have structurally maintained
a significant share of the global manufacturing activity, but with a compensation
between entering and dying enterprises that reflects a strong turn over effect. A similar
asymmetric firm size distribution is also observed in developing countries. Here,
however, not only do small or even micro-enterprises account for a significant
proportion of aggregate employment and output, but some of them demonstrate a
remarkable ability to survive a long time by producing below the minimum efficient
scale of the sector (see Weiss 1991).
A current explanation for this structural coexistence of small and large firms has
called attention on market, but also on government failures. When modern producers
face public regulations while the activity is slowing down, there are some reasons to
believe that large firms will remain within their possibility frontier, failing to reach the
higher level of technical efficiency. Small and flexible informal enterprises will have
more chance to be closer to their production frontier thanks to more limited adjustment
delays. This economic and institutional context illustrates the dual industrial structure
and sheds some light on the difficulty to stimulate an intermediate sector, the so-called
missing middle. However, if small or microscopic firms may survive, sometimes over a
long period, the external operating environment is not the sole factor to be mentioned.
Specific managerial abilities have also to be considered.
In this paper, we investigate above issues by focusing on a sample of firms that are
representative of the Ivorian manufacturing sector. Productive efficiency is the
appealing concept to which we refer to. Empirical indicators are calculated by
mathematical programming models derived from the Data Envelopment Analysis
(DEA) technique. The data set comes from the Regional Program of Enterprise
Development (RPED), a heavy survey that the World Bank conducted over six Sub

CERDI, Etudes et Documents , E 2002.04
4
Saharan African manufacturing sectors (Burundi, Cameroon, Côte d'Ivoire, Kenya,
Zambia, Zimbabwe) between 1995 and 1996.
Section II reviews the complex analytical relationship between firm size and
economic efficiency. Section III presents the random sample that was drawn from four
Ivorian manufacturing sectors: textile and garment; metal products; wood and furniture;
food processing. Section IV describes the non-parametric frontier method. Two
amendments to the classical DEA program are proposed. First, following the method
used by Fried, Schmidt and Yaisawarng (1999), efficiency scores are adjusted for the
average impact of short run exogenous variables which capture the external economic
and institutional operating environment. Secondly, we propose a breakdown of
efficiency scores in three elements: managerial, scale, and technological effects. The
last effect allows to appraise the productive performance that the informal sector would
reach by adopting the more efficient technology of the formal sector. Section V is
devoted to comment the empirical results while section VI summarises this work and
discusses avenues for further research.
II. The ambiguous relationship between productive Efficiency and firm size.
In the Marshallian microeconomic framework, the main function of the
entrepreneur lies in the "business organisation". The technology being given by the
market, the entrepreneur has to find the right allocation of the resources and the right
scale of the production. The most talented will succeed in developing their business
while the others will progressively excluded from the market. A positive correlation
between entrepreneurial talents and the firm size is therefore expected, the
heterogeneity of the industrial structure simply reflecting a temporary disequilibrium
phenomenon. 1
1 Lucas (1978) proposed the first major theory explaining the simultaneous existence of large an smallfirms in a given industry. Those managers who are endowed with a greater amount of competence areable to manage large enterprises
CERDI, Etudes et Documents , E 2002.04
5
In the early development economics literature large organisations have effectively
been considered as the driving force of the economic progress through the use of a
modern technology while small enterprises have been seen as a temporary survival of
archaic modes of production (see Fafchamps, 1994). Lewis (1954) contributed to the
popularisation of these ideas, depicting small enterprises as a means to temporarily
mitigate the social cost of large and unemployed people. Retrospectively, this
hypothesis did not prove to be relevant as many small enterprises have demonstrated an
ability to survive a long time for various reasons on which different bodies of literature
have called attention.
Following the initial property rights theory or the more recent developments
underlying the principal-agent approach, large modern organisations are particularly
sensitive to the informational issue. They involve a wide range of delegations giving
rise to adverse selection and moral hazard phenomena. The relationship between the
owner and the manager has been the emblematic case of the agency theory. But the
economic problematic still remains relevant for other contractual arrangements. To
overcome any substantial deviation from the profit goal, penalties and rewards affecting
the behaviour of rational agents have to be introduced within the contractual
arrangement. Large organisations are very exposed to these transaction and agency
costs. Due to the macroeconomic instability and unpredictable events, sophisticated
arrangements are avoided. The structural weakness of the African judicial institution
strengthens this propensity with few disputes finding a relevant resolution through legal
proceedings. Direct bargaining is the favoured conflict resolution method within the
informal sector while large operators give their preference to authority relation
characterised by hierarchical relationships.
The interaction between the size of the firm and its economic efficiency has been
an important issue for the transaction cost economics. Here, the authority relation
through the internal governance structure is supposed to be a less costly and hazardous
instrument for an efficient co-ordination than the negotiation and the writing of a
network of optimal contracts. However the firm has to integrate that there are
decreasing returns to the entrepreneurial function, the cost of organising additional

CERDI, Etudes et Documents , E 2002.04
6
transactions rising with the size of the firm (see Coase, 1937). Williamson (1985) has
extended this initial analysis by supporting the view that the governance is an efficient
means against bounded rationality and opportunistic behaviours. But large firms will
find themselves uneasy to set up the best hierarchical organisation in a context of high
degrees of asset specificity and non-separable tasks.
With a large team of production, individual productivity cannot be assessed by
measuring output. An incentive to free ride, or to shirk within the frontier of the firm,
consequently exists which in turn requires more monitors, more bureaucratic costs to
regulate inputs into work activity (see Alchian and Demsetz, 1972). The good shape of
the hierarchical organisation is therefore a difficult challenge to take up. The
maintained hypothesis of much of the organisation literature is the existence of
economic gains that can only be achieved through large firm size, but above a certain
size, the firm's activities become so complex that hierarchical management is no longer
an efficient allocation mechanism (see Aoki, 1988).
The relationship between the size and the efficiency of the organisation is therefore
a potential explanation for the strong heterogeneity of the industrial structure. Small
enterprises have a limited workforce. The direct participation of the owner to the
production means less agency costs and "free riding" phenomena. In these small
organisations where the natural authority of the entrepreneur helps to promote loyalty,
the emergence of efficient social conventions and behavioural norms might be easier. In
accordance with the profit maximisation goal, internal pressure from the top as well as
from the peers could be strong enough to ensure a high level of effort and lower X-
inefficiency (cf. Schotter 1981, Leibenstein, 1989).
Beyond these theoretical arguments, attention has also been called upon factors
proceeding from the external operating environment. In African manufacturing sectors,
large firms have been created with a significant initial size. This suggests that size has
not been the result of an endogenous process involving the emergence of efficient firms
across the natural selection process. Big inward looking enterprises have been protected
by public regulations from any entry within the modern sector and sheltered from the
CERDI, Etudes et Documents , E 2002.04
7
international competition through high trade tariffs and quantitative barriers. This
argument has been relevant for the Ivorian manufacturing sector where upward
adjustments of the trade protection were recurrently operated, highlighting the principle
of an endogenous protection and its perverse consequences for the organisational
efficiency.
Small enterprises evolve in a more market friendly environment facing few public
restrictions to adjust the labour input in accordance with the level of output and the
profit goal. With regard to the capital input, as small Ivorian enterprises have a limited
access to formal credit and moneylenders, investment has to be financed by personal
savings or funds from friends and relatives. Difficulties in raising those funds and the
willingness of borrowers to maintain trust and reputation are potential factors for a
reduced waste of this financing.
If small is beautiful, thanks to lower supervision and tutoring as a result of a
more limited workforce and fewer delegations, one has to keep in mind that being small
entails some disadvantages too. When large private firms resort to delegations of
powers, they are supposed to do it for the profit goal that results from human
specialisation of tasks. In other words, bureaucratic costs and managerial slacks are
only one side of the coin, economic efficiency being the final target when shaping the
governance structure. Moreover, these organisational costs are not given once for all.
They can be reduced through the redefinition of the hierarchical relation.
As Chandler (1962) has shown, the multidivisional organisation (M-form) has
developed because of organisational problems created by diversifying within a
functional/U-form structure. By this organisational innovation large firms succeeded to
maintain the advantages of their size while reducing the accompanying costs by
creating semi-autonomous divisions allowing less informational problems. In addition,
as there is evidence that the labour turnover tends to be lower in large enterprises, some
firm-specific skills can be acquired by individuals, allowing the creation of what some
authors call "core competence". Then a collective learning of the organisation builds up,

CERDI, Etudes et Documents , E 2002.04
8
making possible a high productivity resulting from the co-ordination of diverse
production skills and the integration of a multiple streams of technologies.
Leibenstein (1989) discussion of intra-firm behaviour is useful in this respect.
Management-worker relationships can be analysed in game theoretic terms with
resulting co-operative and non-co-operative equilibria. The former is based on the
development of trust, not on narrowly defined individual interest. This cooperation only
emerges if the probability of mutual advantages is high enough for the stability of the
reciprocity to be maintained on a long run basis. With few players and lower
informational issues, small organisations might have an advantage. But the story can be
turned around. The emergence of co-operation can be seen as easier if the same game is
played repetitively an unknown number of times. To some extent, large firms are more
likely to be in this situation. Their probability to survive over a long period being
higher, it facilitates an efficient productive behaviour through human investments in
new firm-specific skills.
No clear-cut conclusion appears at this stage about the relationship between size
and productive efficiency. On the one hand, we do not neglect potential advantages of
large formal firms, with their modern technology and their organisational know how but
on the other hand, we do not ignore those of small informal ones through less diluted
responsibilities and more operational flexibility. In his analysis of the reasons for policy
interventions in favour of small manufacturing enterprises, Little (1987) suggests from
surveys of small Indian and Colombian manufacturing enterprises, that small units use
factor inputs more productively than their larger counterparts. In this context, a shift of
resources in favour of smaller units would yield a net increase in output, as well as an
increase in the demand for unskilled labour. Whatever the scope of this assertion from
limited empirical observations, some authors will argue that when the incentive
structure changes frequently and unpredictably, generally with the macroeconomic
instability, plants created at different times and using different technologies may coexist
indefinitely ( Tybout,1996).

CERDI, Etudes et Documents , E 2002.04
9
III. The sample of the Ivorian manufacturing firms .
Our data set comes from a survey of manufacturing firms conducted in six Sub
Saharan African countries. The collection of these data has been implemented by
several teams co-ordinated by the World Bank in the framework of the Regional
Program on Enterprise Development (RPED). The main objective of these surveys was
to enlarge the knowledge about the creation process of African manufacturing firms but
also the problems that they encounter in their local development. Only four sectors of
economic activity have been explored: Textile and garment, metal products, wood and
furniture, food processing. The random sample of 230 firms was drawn from a
population of 620 enterprises belonging to formal and informal sector, with a limited
number of entities classified in the "half formal" category.
When the survey took place in 1995 and 1996, respectively, the whole Ivorian
manufacturing sector had 10 000 enterprises and accounted for about 25% of the Gross
Domestic Product. The survey involved two distinct stages. In 1995, the creation
process of firms was investigated. In 1996, this phase was complemented by some light
on the entry and exit movements within the manufacturing sector. Bankruptcy was the
criterion retained to appraise the death of formal and half-formal registered firms. The
loss of visibility on the organisation or its activity was considered for informal ones.
Table 1 summarises the main characteristics of Ivorian firms we are interested in.
As suggested above the sample has been divided in two sub-samples reflecting the
formal and informal status of enterprises. We know that these economic notions have
enhanced considerable discussions, the main difficulty being to define exactly what is
the "informal sector". Although some authors are sceptical on the operational value of
this concept (see Little, 1987), few of them have rejected the importance of these
activities over the development process. The informal sector, characterised by a labour
intensive technology, operates in an institutional context where flexibility is generally
seen as an element allowing a good productive efficiency. The former assertion is
highlighted in table 1 while the latter is what we want to study in this paper.

CERDI, Etudes et Documents , E 2002.04
10
Table 1: Main production characteristics of Ivorian firms, by institutional status.
Sample averages in 1995
Formal Informal Total
1- Number of firms 129 57 186
2- Value added (Q) (a) 188 1860 12000 79 321
3- Capital stock (K) 542 370 1980 18 440
4- Workers (L) (b) 179.9 6.6 79.6
5- Human capital (H) (c) 5.20 5.13 5.16
6- Q/K 3.46 6.1 4.30
Nota bene. (a) Thousands of CFA francs ; (b) Number of workers, the number of hours beingconsidered for the DEA calculations ; (c) number of school years, calculated from therepresentative agent of the firm.Source: Authors' calculations from the Ivorian base, RPED, World Bank.
Table 2: Statistic distributions of firms according to their size, age and sector based activity.
(Sample: 230 firms)
Sector of activity Number of years
(since the creation of the firm)
Foodprocessing
Textileandgarment
Woodandfurniture
Metalproducts
Rateofexit
[ 0, 5] ] 5, 10] ]10, 20] ] 20, +[Total
% %
Micro 1 (2) 65 (61) 27 (42) 7 (18) 22 40 (66) 28 (46) 26 (32) 6 (12) 100
Small 22 (54) 34 (35) 23 (39) 21 (60) 18 15 (27) 28 (50) 41 (54) 17 (36) 100
Medium 37 (12) 11 (1) 19 (4) 33 (13) 16 19 (5) 11 (3) 35 (6) 35 (10) 100
Large 46 (32) 12 (3) 31 (15) 11 (9) 13 5 (2) 2 (1) 22 (8) 70 (42) 100
Total 17 (100) 43 (100) 25 (100) 15 (100) 24 (100) 24 (100) 32 (100) 20 (100) 100
Rate ofexit %
19 18 12 18 18 12 16 25 17

CERDI, Etudes et Documents , E 2002.04
11
An additional information about the 230 surveyed firms is given in Table 2. This
information is presented in a way that aims at highlighting the relationships between
size, age and the rate of exit. A rapid outlook suggests that microenterprises are
particularly important in two sectors: textile and garment, to a lesser degree, wood and
furniture. Few of them are found in metal products or food processing. The descriptive
statistics confirm the intuition that size and age are positively correlated, small
organisations are young ones while most of large firms have at least twenty years old.
Furthermore, while 52% of the enterprises have more than ten years old, the last row of
the table shows that 18% of them died between the two phases of the survey. The rate
of failure is higher for micro (22%) and small enterprises (18%), but not negligible for
medium ones which are for 70% within the age group of 10 years old and more.
IV. The formal procedure of the non-parametric measure of technical inefficiency.
A) The trade off between parametric and non-parametric frontier methods
The technical efficiency of Ivorian firms will be calculated using the Data
Envelopment Analysis (DEA) approach. In comparison with the parametric technique,
DEA does not require any hypothesis about the functional form relating inputs and
outputs, and no specific assumption about the distribution of the error term. In a cross-
section analysis with heterogeneous firms, this can be seen as an advantage, the risk of
the econometric method being to confound the effects of misspecification of the
functional form with efficiency (Lovell, 1993).
The programming approach is likely less subject to the aforementioned
specification error, but it can't disentangle inefficiency from random noise. Therefore,
any deviation from the deterministic frontier will be regarded as inefficiency, one
consequence of which is a particular sensitivity to outliers (see Cornwell and
Schmidt,1996). However, in contrast to parametric analysis where the single optimised
regression equation is assumed to apply to each empirical observation, DEA allows to
calculate the performance of each Decision-Making Unit with regard to a specific peer
group reflecting the best practice for the observation (Seiford, 1996). An outlier with a

CERDI, Etudes et Documents , E 2002.04
12
"very poor" performance does not influence the efficiency score of other units, as it
does not contribute to the frontier, that is the convex hull of intersecting planes
enveloping the data. If the outlier is a peer, its impact can be restrained with the
convexity restriction limiting the benchmarking within a sub-sample of firms. With the
variable returns to scale model (VRS DEA), a firm cannot be benchmarked against
peers which are substantially larger or smaller than it.
B) The external environment and the four stage procedure.
In trying to explain the reasons of the heterogeneous structure of the
manufacturing sector, implicitly the possibility for small firms to survive, attention has
been called upon the complexity of the factors contributing to the productive
performance. The potential impact of exogenous variables of the operating environment
has been noticed, as well as the diversity of the economic elements contributing to this
performance. To investigate the respective role of these factors, the four-stage
procedure introduced and applied by Fried, Schmidt and Yaisawarng (1999) has been
adopted.
First, the classical non-parametric DEA frontier is calculated to derive a
distribution of efficiency scores. These scores refer to the radial measure of technical
efficiency as defined by Farrell (1957). In the second stage, an econometric regression
analysis is performed to correct the input use from effects outside the control of
managers. To implement this exercise for an input oriented model, the sum of radial
and non-radial input slack is econometrically regressed on a vector of variables
reflecting the average impact of exogenous factors2. In the third stage, the regression
parameters are used to reassess the virtual consumption of inputs that would be
observed if all Ivorian firms had to evolve in the least favourable external conditions. In
the last and fourth stage, adjusted primary inputs are used to re-run a DEA frontier with
efficiency scores revealing a more appropriate measure of intrinsic managerial abilities.
2 Following a more strict definition than Farrell's, Koopmans (1951), defines technical inefficiency interms of the radial reduction in inputs that is possible, but also in terms of input or output slacks. SeeCoelli et al (1998), or Fried et al (1999) for an illustration of the economic issue.

CERDI, Etudes et Documents , E 2002.04
13
The first stage refers to the DEA mathematical programming model suggested
by Banker, Charnes and Cooper (1984). This model makes it possible to control for an
economic inefficiency coming from production under variable returns to scale (VRS).
Firm performance can therefore be decomposed into "pure" and scale inefficiency. As
African manufacturing firms operate in a context of imperfect competition with various
financial and regulatory constraints, most of them do not exhaust scale economies.
The possibility to account for a sub-optimal scale (VRS) is easily obtained by
the convexity constraint (λI = 1), ensuring that an inefficient firm is only benchmarked
against firms of a similar size. The input distance function being used, the production
technology denotes the set of all input vectors (X), which can produce the output
vectors (Q). The input distance function introduced by Shephard (1970) characterises
the production technology by considering a minimal proportion contraction of the input
vector given an output vector.
( ) { }iRIxXqQxqL +∈=≤≥= λλλλ ,1,,:
Given the piecewise linear input requirement set L(q), under variable returns to
scale, the DEA model is derived from the following linear programming problem where
θ is a scalar representing the proportional contraction of all inputs (j), holding input
ratios and output level constant.
minθ, λ
θ i
s ⋅ t λQ ≥ q i
λX ≤ θx i
λI = 1
λ ∈R +i
i =1, ..., n (firms )
j = 1,..., k (inputs )
To adjust firm technical inefficiency for the excessive use of inputs resulting
from factors outside the managerial control, tobit regressions have been retained to
account for the unilateral distribution of the dependant variable that is, the sum of the
radial and non radial input slack denoted (TISj
i ). The radical input slack is calculated as
CERDI, Etudes et Documents , E 2002.04
14
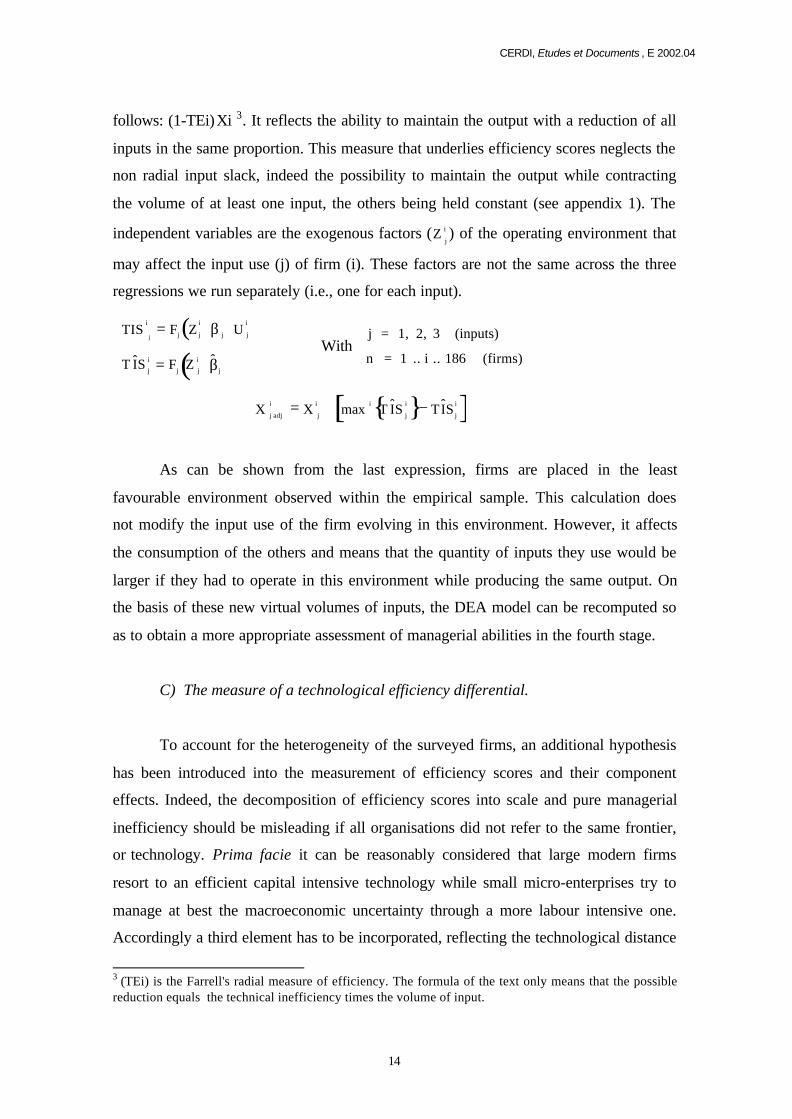
follows: (1-TEi)Xi 3. It reflects the ability to maintain the output with a reduction of all
inputs in the same proportion. This measure that underlies efficiency scores neglects the
non radial input slack, indeed the possibility to maintain the output while contracting
the volume of at least one input, the others being held constant (see appendix 1). The
independent variables are the exogenous factors (Zj
i ) of the operating environment that
may affect the input use (j) of firm (i). These factors are not the same across the three
regressions we run separately (i.e., one for each input).
TISj
i = Fj Z j
i ⋅β j ⋅ U j
i( )T ˆ I S j
i = Fj Z j
i ⋅ ˆ β j( )
With j = 1, 2, 3 (inputs)
n = 1 .. i .. 186 (firms)
X j adj
i = X j
i + max i T ˆ I S j
i{ }− Tˆ I S j
i[ ]
As can be shown from the last expression, firms are placed in the least
favourable environment observed within the empirical sample. This calculation does
not modify the input use of the firm evolving in this environment. However, it affects
the consumption of the others and means that the quantity of inputs they use would be
larger if they had to operate in this environment while producing the same output. On
the basis of these new virtual volumes of inputs, the DEA model can be recomputed so
as to obtain a more appropriate assessment of managerial abilities in the fourth stage.
C) The measure of a technological efficiency differential.
To account for the heterogeneity of the surveyed firms, an additional hypothesis
has been introduced into the measurement of efficiency scores and their component
effects. Indeed, the decomposition of efficiency scores into scale and pure managerial
inefficiency should be misleading if all organisations did not refer to the same frontier,
or technology. Prima facie it can be reasonably considered that large modern firms
resort to an efficient capital intensive technology while small micro-enterprises try to
manage at best the macroeconomic uncertainty through a more labour intensive one.
Accordingly a third element has to be incorporated, reflecting the technological distance
3 (TEi) is the Farrell's radial measure of efficiency. The formula of the text only means that the possiblereduction equals the technical inefficiency times the volume of input.

CERDI, Etudes et Documents , E 2002.04
15
between the two sub-samples. The breakdown of the sample has been decided by
running various simple regressions. Efficiency scores were regressed on several
alternative criteria including the firm size, the capital-labour ratio, and the technological
dualism between formal and informal activities.4 The last option proved to be the more
relevant as evidenced by the adjusted coefficient of determination. 5 Figure 1 illustrates
the problematic of the measurement we are interested in.
Figure 1 - Firm technical inefficiency and its components
4 Through sector-based binary variables we have also tested, and statistically rejected, the possibility tohave a different technology for each of the four sectors we are interested in.5 To implement these simple regressions, efficiency scores of the DEA model have been considered,calculated under the constant returns to scale hypothesis. Compared to the capital-labour ratio, thisvariable does not require the choice of any subjective threshold in the breakdown of the sample. But, ofcourse, the restrictive hypothesis is that the category to which firms belong to is exogenously given.
0 PT
PC PV P X
A
Q
Formaltechnology
Informaltechnology
AP T
AP1 2 4 3 4 = AP T
AP C1 2 4 3 4
× AP V
AP1 2 4 3 4 × AP C
AP V1 2 4 3 4 Technical
inefficiency= Techno log ical
inefficiency× Managerial
inefficiency× Scale
inefficiency
Managerialinefficiency
NB: Two sources of technical inefficiency are retained for formal firms, but three for informalones. For a more convenient reading of the figure, let say that the P, PT,PV,PC on the abscissa(OX) refer to different levels of a input X for the production of output A.
Technologicalinefficiency
Scale
ineff.

CERDI, Etudes et Documents , E 2002.04
16
We assume that formal firms have the appropriate technology, the upper
frontier, while the informal ones refer to the lower frontier. Consequently, an informal
enterprise operating with a combination (A,P) faces three sources of technical
inefficiency that we express in a ratio form. The product of these ratios measures the
input oriented technical inefficiency. As regards the failure to reach the frontier of the
informal sector, we appraise the managerial inefficiency by AP V/AP, and the scale
inefficiency by APC/AP V. The difference between the informal and formal constant
returns to scale frontiers, APT/APC, captures the technological inefficiency, or the
advantage that an informal firm would gain by adopting the more efficient technology
of the modern sector6.
V. Non parametric measures of efficiency scores: the empirical analysis.
A) The variables of the production technology.
To approximate the capital stock at constant market prices, we have referred to
the perpetual-inventory method. As the organisations were not asked to report their
balance sheet, and in fact informal ones do not have one, the capital stock has been
constructed by combining data about the initial equipment and the value of registered
investments over the 1984-1993 period. An other informational problem concerns the
depreciation of the capital stock. Figures being unavailable neither by type of assets or
in global terms, an annual depreciation of 4.5% has been hypothesised which represents
a mean asset life of 22 years.
The labour input has been measured by category of workers as the number of
hours multiplied by the relative weight of the category within the workforce of the firm.
Compared to the number of employees, this calculation allows to account for temporary
and permanent employees who are subject to vary across firms. In connection with this
input, a third one has been taken into account to capture the specific impact of human
6 We assume that formal firms have only two potential sources of technical inefficiency : one resultingfrom the management, and one proceeding from the scale of production. In figure 1, the VRS-DEAmodel of formal firms is not represented. The illustrative example only refers to the case of an informalfirm.

CERDI, Etudes et Documents , E 2002.04
17
qualifications. Instead of distinguishing between skilled and unskilled workers, we have
calculated a variable reflecting the specific human capital of the firm as follows. For
each category of workers, the average number of school years has been considered for
what the questionnaire calls the representative agent. A weighted average of these
statistics proxies the human capital of the organisation.
B) The variables of the external operating environment.
To adjust input quantities for exogenous features of the external environment,
the variables that affect the relative importance of transaction costs have been
considered. Official regulation (REG) and corruption (COR) do not have the same
impact among firms. The way they are subjectively perceived by managers reflects
potential excess unit costs that could be more significant in large modern firms. A
similar impact should be expected for firms where trade unions (UNION) are present
and play an active role in internal negotiations upon the distribution of the potential
surplus. To some extent, these organisations may be efficiency enhancing through the
emergence of procedural arrangements encouraging efforts and loyalty. However, their
behaviour also constraints the set of managerial decisions by restraining the speed of
adjustment of the labour force to the trade liberalisation process as well as the cyclical
swings of the domestic activity.
In addition to these institutional factors that seem to primarily affect the formal
sector (FOR), we have tested the economic cost resulting from public restrictions in the
geographical choice of investments (LOC), and the effect of the poor public
infrastructure on productivity (INFRA). As recalled by a study conducted by Kerf and
Smith (1996), no region in the World is in greater need of new investment in and more
efficient operation of its infrastructure than Sub-Saharan Africa. Transportation costs
and inadequate provision in electricity or telecommunication services may handicap
small enterprises, in spite of their flexible technology, but also, and perhaps even more,
large firms for which poor services increase economic uncertainty. In the survey we
refer to, Ivorian managers were asked to value the severity of the productive problem
CERDI, Etudes et Documents , E 2002.04
18
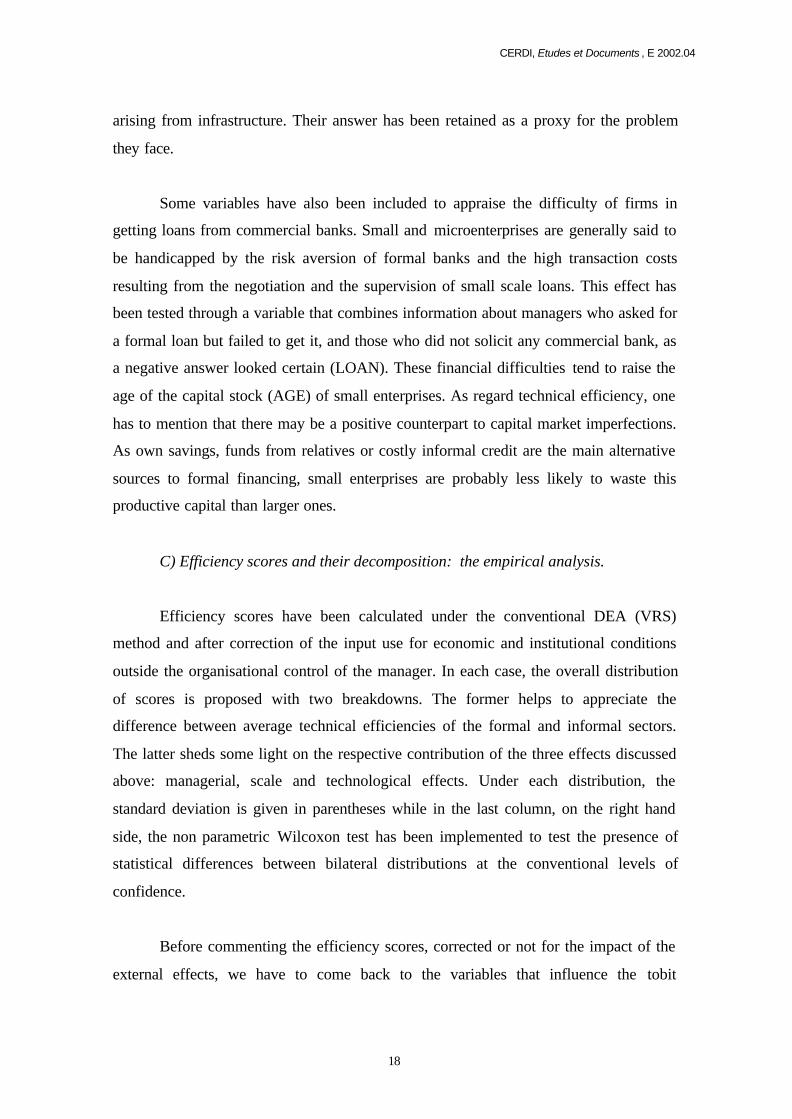
arising from infrastructure. Their answer has been retained as a proxy for the problem
they face.
Some variables have also been included to appraise the difficulty of firms in
getting loans from commercial banks. Small and microenterprises are generally said to
be handicapped by the risk aversion of formal banks and the high transaction costs
resulting from the negotiation and the supervision of small scale loans. This effect has
been tested through a variable that combines information about managers who asked for
a formal loan but failed to get it, and those who did not solicit any commercial bank, as
a negative answer looked certain (LOAN). These financial difficulties tend to raise the
age of the capital stock (AGE) of small enterprises. As regard technical efficiency, one
has to mention that there may be a positive counterpart to capital market imperfections.
As own savings, funds from relatives or costly informal credit are the main alternative
sources to formal financing, small enterprises are probably less likely to waste this
productive capital than larger ones.
C) Efficiency scores and their decomposition: the empirical analysis.
Efficiency scores have been calculated under the conventional DEA (VRS)
method and after correction of the input use for economic and institutional conditions
outside the organisational control of the manager. In each case, the overall distribution
of scores is proposed with two breakdowns. The former helps to appreciate the
difference between average technical efficiencies of the formal and informal sectors.
The latter sheds some light on the respective contribution of the three effects discussed
above: managerial, scale and technological effects. Under each distribution, the
standard deviation is given in parentheses while in the last column, on the right hand
side, the non parametric Wilcoxon test has been implemented to test the presence of
statistical differences between bilateral distributions at the conventional levels of
confidence.
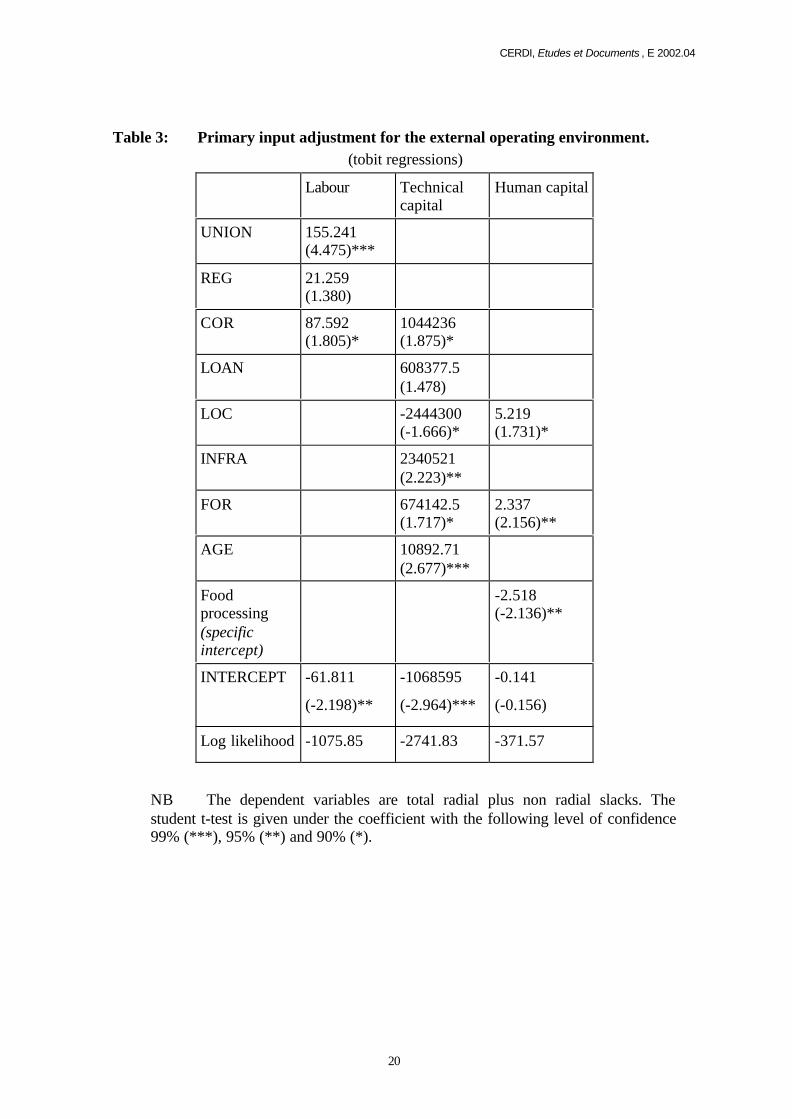
Before commenting the efficiency scores, corrected or not for the impact of the
external effects, we have to come back to the variables that influence the tobit

CERDI, Etudes et Documents , E 2002.04
19
regressions of table 3. Most of them display the expected sign with statistically
significant coefficients. In other words, the economic and institutional environment
partly determine the managerial performance of organisations. Especially for the labour
input, the hypothesis that the external conditions enhances a severe constraint for
modern firms is evidenced by the positive correlation of three variables: the presence of
a trade union in the firm (UNION), the role of regulations (REG) and corruption
(COR). As regards the other inputs, the conclusion is not so clear although larger
organisations suffer a greater sensibility to the quality of the infrastructure (INFRA).
For technical capital as well as human capital, the positive correlation of FORM does
not reject the hypothesis of an excess use of inputs by the "modern" activities. Under
the hypothesis that this variable is exogenous (see infra), it sums up a potential loss of
technical efficiency that highlights why an important part of small and medium-size
enterprises try to evade these costs by remaining informal.
Due to the cross-sectional dimension of the sample, the omission of relevant
variables is likely, illustrating one of the limits of the above econometric results. For
example, we have been unable to test the implications of the fiscal system. Some
authors assert that taxes are predominantly focused on small businesses, others qualify
this assertion and notice that the collector fails to reach micro-enterprises, although the
weight of taxes on small modern enterprises can be significant. In Fortin et al (1997)
this fiscal aspect is one way of defining the informal sector. Informal enterprises are
those that are unregistered to avoid state regulations, but also corporate income taxes
and social security contributions, registration fees or income taxes on informal wage
income. But the reason why some firms comply with the legal requirements of
registration while other do not is itself a debatable issue. For McPherson and Liedholm
CERDI, Etudes et Documents , E 2002.04
20
Table 3: Primary input adjustment for the external operating environment.(tobit regressions)
Labour Technicalcapital
Human capital
UNION 155.241(4.475)***
REG 21.259(1.380)
COR 87.592(1.805)*
1044236(1.875)*
LOAN 608377.5(1.478)
LOC -2444300(-1.666)*
5.219(1.731)*
INFRA 2340521(2.223)**
FOR 674142.5(1.717)*
2.337(2.156)**
AGE 10892.71(2.677)***
Foodprocessing(specificintercept)
-2.518(-2.136)**
INTERCEPT -61.811
(-2.198)**
-1068595
(-2.964)***
-0.141
(-0.156)
Log likelihood -1075.85 -2741.83 -371.57
NB The dependent variables are total radial plus non radial slacks. Thestudent t-test is given under the coefficient with the following level of confidence99% (***), 95% (**) and 90% (*).

CERDI, Etudes et Documents , E 2002.04
21
(1996), the lack of information rather than the willingness to avoid the visibility to
agents of the Administration would be the prevailing explanation. The way we answer
the questions is not of minor importance. In one case the classification of firms proves
to be endogenous while in the second, the categorization (i.e. formal versus informal)
remains an exogenous variable.
The parameter estimates of the three tobit equations have been used to re-
compute the DEA program with adjusted primary inputs, so as to place all the sample
firms in the least favourable set of external conditions. A high heterogeneity prevails
within the sample and sub-samples of efficiency scores (see table 4). The correction for
the external environment does not deeply modify this result although in this case, the
average performance of the formal sector increases somewhat and reveals a lower
standard deviation. The decomposition of technical efficiency scores is interesting in
several respects. First, it is shown that the managerial efficiency is higher with the
informal sector, the difference being narrower when adjusted primary inputs are
considered. Therefore, arguments underlying the transaction cost economics and the
theory of agency relationships are not rejected. Secondly, and to some extent
surprisingly, if small organisations prove to be better than large ones in reducing X-
inefficiency, they are not more efficient in choosing the scale of production while the
labour intensive technology would help to do it as investment decisions are less subject
to indivisibility effects. This result suggests that when starting a business, small
entrepreneurs face fixed or sunk costs that prevent them to reach the cost minimisation
gaol. The relative importance of this cost is especially significant, as micro-enterprises
are young and exposed to a higher rate of exit. The procedural rationality underlying the
decision-making has its own part of responsibility. Because of their limited knowledge
and power of calculation, small operators fail to determine the right dimension of their
initial investment.
Finally, and this is a key element in the explanation of the average technical
efficiency difference between sub samples, on balance, being in the formal sector
means the use of a more efficient technology. The question then arises to know whether

CERDI, Etudes et Documents , E 2002.04
22
Table 4: Descriptive statistics of technical efficiency scores, adjusted or not forthe external operating environment.
Exogenousfactors
Technicalefficiencycomponents
Formal
(129)
Informal
(57)
Total
(186)
Wilcoxontest(formalversusinformal)
Total 0,43(0,30)
0,26(0,18)
0,38(0,26)
***F>I
Technological 1 0,55 0,84
Managerial 0,62(0,37)
0,82(0,49)
0,68(0,40)
***I>F
Not adjustedfor externalenvironment
scale 0,70
(0,38)
0,60
(0,35)
0,67
(0,38)
**
F>I
Total 0,53
(0,18)
0,25
(0,16)
0,44
(0,12)
***
F>I
Technological 1 0,55 0,86
Managerial 0,71
(0,34)
0,78
(0,51)
0,73
(0,41)
**
I>F
Adjusted for
external
environment
scale 0,75
(0,31)
0,59
(0,28)
0,70
(0,44)
**
F>I
Note: Standard deviation is given in parenthesis. The Wilcoxon test is a non-parametric rank test that we use to compare the formal and informal distributions.The difference of the distributors is tested at the 99% (***), 95% (**) and 90%(*) level of confidence.
such a technology could be adopted and properly managed by Ivorian micro-
entrepreneurs. Indeed, the industrial skill of a firm consists of a practical knowledge
CERDI, Etudes et Documents , E 2002.04
23
and know how, a set of relevant habits, acquired and routinised over time. Therefore,
trying to become fully efficient is an uncertain process as changing capital and
retraining labour means significant costs before the process earns its full return. As
Stiglitz (1989) remarked, a major difference between the more and less developed
countries arises from learning by doing and limits on the ability to transfer what
learning occurs across boundaries. Such a transfer is not locally easier between formal
and informal organisations in accordance with the missing middle analysis. The
productive interest of a modern technology is therefore hypothetical, especially if the
objective of small enterprises remains to satisfy some niches, some specific segments of
the domestic demand.
VI. Conclusion
We have investigated the technical efficiency of Ivorian firms by considering a
random sample that has been drawn from four sectors of manufactured activities. To
implement this exercise, the conventional Data Envelopment Analysis (DEA) method
has been adopted with efficiency scores derived from a non-parametric linear
programming framework. Following the four-stage procedure, we have also calculated
a performance adjusted for the influence of external variables on the use of primary
inputs. Whatever the DEA model we refer to, small and informal enterprises have
demonstrated a higher managerial performance. This empirical result is in accordance
with the views that relations between managers and the labour force are weakened with
an increasing hierarchical structure that tends to reduce effort levels. But this is only
one side of the coin as large modern firms benefit a more efficient technology that
proves to be a crucial element in the explanation of the overall technical efficiency.
Although these results are interesting in themselves, they still remain
exploratory in nature. More work is needed to strengthen the empirical conclusions.
One important factor limiting our study comes from restrictive assumptions about the
calculation of efficiency scores and their components. The empirical hypothesis that all
formal firms have the good technology while informal ones do not and would gain
economic efficiency in choosing it is restrictive. The reality is certainly more complex
and the hypothesis would deserve to be revisited. It is reasonable to consider that small
CERDI, Etudes et Documents , E 2002.04
24
businessmen do not have the managerial "know how" required by such a radical
change. And we do not forget that a capital intensive technology means more rigidities
when the production capacity has to be adjusted downward. In other words, a labour
intensive technology allows small informal firms to benefit from the flexibility of their
environment. But will these advantages go on in a trade liberalisation context?
We would expect that the more competition in an industry appears to be
impeded, the greater the chance for inefficient firms to survive. Some impediments are
likely to occur, coming from entry or exit barriers. The trade liberalisation process
makes the local markets more contestable. Lower quantitative barriers mean a credible
threat against the survival of large and inefficient firms. But a more flexible labour
market is also a chance for large efficient ones to improve the management of this
resource. Thus, the deregulation might enhance dramatic changes in the Ivorian
industrial structure. Vis-à-vis large and modern local firms, small informal enterprises
might loose a significant part of their comparative advantage arising from their
managerial flexibility and ability to satisfy narrow segments of the demand through
small scale production techniques (see Sherer 1973 and Pryor 1972). These
organisations will prove to be very exposed to changes in economic policy measures
and programs for an improvement of the infrastructural endowment implying a higher
level of market contestability and a lower natural trade protection. In short, in Côte
d'Ivoire as anywhere else in Sub-Saharan Africa, a more market friendly environment
could contribute to enlarge the role of competitive organisations combining the right
technology and the good management of scarce resources in the right production scale.
The operating environment will be a more selective one with an uncertainty outcome
for the evolution of the industrial structure. According to the so-called Darwinian
principle of the survival of the fittest, economic selection should eliminate weaker
organisations, small or large ones, those which prove to be unprofitable.
CERDI, Etudes et Documents , E 2002.04
25
References
Aoki, Masahiko (1988). "Information, Incentives and Bargaining in the JapaneseEconomy", Cambridge Press, New York.
Alchian, Armen and Harold Demsetz. (1972). "Production, Information costs andEconomic Organization", American Economic Review, vol. 62, pp. 777-95.
Banker, Rajiv. D, Charnes, Abraham and William .W, Cooper (1984). "Some Modelsfor Estimating Technical and Scale Inefficiencies in Data EnvelopmentAnalysis", Management Science, vol. 30, pp. 1078-1092.
Baumol, William J (1982). "Contestable Markets: An Uprising in the Theory ofIndustry Structure.", American Economic Review, may, pp. 1-15
Chandler, Alfred (1962). Strategy and Structure. Chapters in the History of theIndustrial Enterprise, Cambridge, Mass : MIT Press.
Chapelle, Karine ( 1996). "Contestabilité et configuration hétérogène de long terme:estimation économétrique sur données micro-économiques. Le cas du secteurmanufacturier ivoirien.", Études et Documents, CERDI, E.96.22 inConcurrences, Stratégies et mutations industrielles, PUF Économie.
Coase, Ronald H ( 1937). "The Nature of the Firm", Economica, N. S. 4, pp. 386 - 405.
Coelli, Tim, Prasada Rao and George : E Battese (1998). An Introduction to Efficiencyand Productivity Analysis, Kluwer Academic Publisher, 275 p.
Cornwell, Christopher and Peter, Schmidt (1996). "Production Frontiers and EfficiencyMeasurement" in Laszlo, Matyas and Patrick, Sevestre. The Econometricsof Panel Data, a handbook of the theory with applications, KluwerAcademic Publishers.
Farrell, M.J (1957). "The Measurement of Productive Efficiency", Journal of the RoyalStatistical Society, Series A, General, vol. 120 (3), pp. 253-281.
Fafchamps, Marcel (1994). "Industrial Structure and Microenterprises in Africa", TheJournal of Developing Areas, vol. 29, October, pp. 1-30.
Fortin, Bernard, Marceau, Nicolas and Luc, Savard (1997). "Taxation wage controlsand the informal sector", Journal of Public Economics, vol 66, pp293-312.
Fried, Harold, Schmidt, Shelton and Yaisawarng Suthathip (1999). "Incorporating theOperating Environment into a Nonparametric Measure of TechnicalEfficiency", Journal of Productivity Analysis, vol. 12, pp. 249-267.
Kerf, Michel and Smith Warrick (1996). Privatizing Africa's Infrastructure, Promiseand Challenge, World Bank, Washington, 99 p.

CERDI, Etudes et Documents , E 2002.04
26
Koopmans, T C (1951). "An Analysis of Production as an Efficient Combination ofActivities" in T C Koopmans (ed.), Activity Analysis of Production andAllocation, Cowles Commission for Research in Economics, Monographn° 13, Wiley, New York.
Lambson, Val (1991). "Industry Evolution with Sunk Costs and Uncertain MarketConditions", International Journal of Industrial Organization, vol. 9,pp. 171-196.
Leibenstein, Harvey (1989). "Organizational Economics and Institutions as MissingElements in Economic Development Analysis," World Development, vol. 17,n° 9, pp. 1361-1374.
Lesueur, Jean-Yves And Patrick Plane (1998). "Efficience technique et incitationsmanagériales dans l'industrie ivoirienne : estimation de frontières deproduction sur données de panel", Revue Économique, vol. 49, n° 2.
Lewis, Arthur, W (1954). "Economic Development with Unlimited Supplies ofLabour", Manchester School, vol. 22, May, pp. 139-191.
Little, Ian (1987). "Small Manufacturing Enterprises in Developing Countries", TheWorld Bank Economic Review, vol. 1, January, n° 2, pp. 203-236.
Lovell, Knox C.A (1993). "Production Frontiers and Productive Efficiency", in TheMeasurement of Productive Efficiency, in Fried Harold, Knox Lovell andShelton Schmidt editors, Oxford University Press.
Lucas, Robert. E (1978). E (1978). "On the size distribution of business firms", BellJournal of Economics, n° 9, pp 508-523.
Marshall, Alfred (1890). Principles of economics, Macmillan, London.
McPherson, Michael.A and Carl, Liedholm (1996)."Determinants of Small and MicroEnterprise Registration: Results from Surveys in Niger and Swaziland",World Development, vol 24,n°3, pp 481- 487.
Pryor, F.L (1972). "The Size of Production Establishments in Manufacturing",Economic Journal, 1972, 82, June.
Schotter, A (1981). The economic Theory of Social Institutions, Cambridge UniversityPress, New York.
Seiford, Laurence M (1996). "Data Envelopment Analysis", The Evolution of the Stateof Art, (1975-1995), Journal of Productivity Analysis, vol. 7, pp. 99-138.
Shephard, RW(1970). Theory of Cost and Production Functions, Princeton UniversityPress.
Sherer F.M (1973). "The Determinants of Industrial Plant Sizes in Six Nations", Reviewof Economics and Statistics, 55, May, pp. 135-145.

CERDI, Etudes et Documents , E 2002.04
27
Stiglitz, Joseph E (1989). "Markets Failures and Development", American EconomicReview, Papers and Proceedings, May, pp. 197-203.
Tybout, James.R (1996). "Heterogeneity and Productivity Growth: Assessing theEvidence" in Roberts J. and JR. Tybout, Industrial Evolution in DevelopingCountries, published for the World Bank, Oxford University Press.
Viner, Jacob (1932). "Cost Curves and Supply Curves", Zeitschrift fürNationalökonomie, 3, pp. 23-46.
Weiss, Leonard. W (1991). "Structure, Conduct and Performance", Audretsch andYamawaki eds., New York, New York University Press.
Williamson, Oliver E (1985). The Economic Institutions of Capitalism, The Free Press,Macmillan, Inc., New York.