technical efficiency of blood component preparation in blood
TRANSCRIPT

| 1 |
Technical efficiency of blood componenT preparaTion in blood cenTres of 10 european counTries
Marketta Veihola
Finnish Red Cross Blood ServiceHelsinki, Finland
Department of Public HealthFaculty of Medicine
University of Helsinki, Finland
ACADEMIC DISSERTATION
To be publicly discussed, with the permission of the Faculty of Medicine, University of Helsinki, in the Nevanlinna Auditorium of the Finnish Red
Cross Blood Service, Kivihaantie 7, Helsinki, on October 17th, 2008, at 12 o’clock noon.
Helsinki 2008

| 2 |
academic disserTaTions from The finnish red cross blood serVicenumber 53
SUPERVISORS
Riitta Kekomäki, MD, PhDDocentFinnish Red Cross Blood ServiceHelsinki, Finland
Harri Sintonen, PhDProfessorDepartment of Public HealthUniversity of HelsinkiHelsinki, Finland
REVIEWERS
Heikki A. Loikkanen, Dr.Soc.Sc.ProfessorDepartment of GeographyUniversity of HelsinkiHelsinki, Finland
Seppo Pakkala, MD, PhDDocentManaging Director, Clinical Research Institute HUCH Ltd.Biomedicum HelsinkiHelsinki, Finland
OPPONENT
Toivo T. Salmi, MD, PhDProfessorDepartment of PaediatricsTurku University Central HospitalTurku, Finland
ISBN 978-952-5457-18-6 (print)ISBN 978-952-5457-19-3 (pdf)ISSN 1236-0341http://ethesis.helsinki.fiHelsinki 2008Yliopistopaino

| 3 |
To my children and grandchildren

| 4 |
TABLE OF CONTENTS
1 ABSTRACT ....................................................................................................5
2 LIST OF ORIGINAL ARTICLES .........................................................................7
3 ABBREVIATIONS ...........................................................................................8
4 INTRODUCTION ............................................................................................9
5 REVIEW OF THE LITERATURE .......................................................................10 5.1 Management of blood transfusions ..........................................................10 5.1.1 Blood supply and demand .................................................................10 5.1.2 RBC transfusions .............................................................................10 5.1.3 PLT transfusions ...............................................................................11 5.2 From blood to blood product ...................................................................12 5.2.1 Blood service systems .....................................................................12 5.2.2 Blood collection ...............................................................................13 5.2.3 Component preparation ....................................................................13 5.2.4 Cellular components and fresh-frozen plasma .....................................15 5.2.5 Discarded components .....................................................................16 5.2.6 Inventory management ....................................................................17 5.3 Costs in blood establishments .................................................................19 5.4 Efficiency research in health care ............................................................20 5.4.1 Efficiency concepts ...........................................................................21 5.4.2 Measures of efficiency in productivity analysis .....................................22 5.4.3 Empirical efficiency studies in blood banking .......................................24 5.4.4 Methods of analysing efficiency .........................................................25 5.4.5 International comparison ..................................................................26
6 AIMS OF THE STUDY ...................................................................................27
7 MATERIALS AND METHODS ..........................................................................28 7.1 Data sources ........................................................................................28 7.1.1 Participating centres .........................................................................28 7.1.2 Data collection .................................................................................28 7.1.3 Material of original articles ................................................................29 7.2 Methods ...............................................................................................31 7.2.1 Data envelopment analysis ...............................................................32 7.2.2 DEA models.....................................................................................33
8 RESULTS ....................................................................................................34 8.1 Platelet production (I) ............................................................................34 8.1.1 Production volumes and methods (I) ..................................................34 8.1.2 Discard rates of PLTs and RBCs (I, III) ................................................34 8.2 Technical efficiency (II) ..........................................................................36 8.2.1 Discard rate and technical efficiency (III) ............................................37 8.3 Labour efficiency and cost efficiency (I, IV) ..............................................37 8.3.1 Savings potential (IV) .......................................................................39 8.3.2 Unit cost (IV) ..................................................................................39 8.4 Scale efficiency (II-IV) ...........................................................................39
9 DISCUSSION AND CONCLUSIONS .................................................................40
10 ACKNOWLEDGEMENTS ...............................................................................44
11 REFERENCES ............................................................................................45
12 APPENDICES .............................................................................................53
13 ORIGINAL ARTICLES ..................................................................................63

| 5 |
1 ABSTRACT
Various reasons, such as ethical issues in maintaining blood resources, growing costs, and strict requirements for safe blood, have increased the pressure for efficient use of resources in blood banking. The competence of blood establishments can be characterized by their ability to predict the volume of blood collection to be able to provide cellular blood components in a timely manner as dictated by hospital demand. The stochastically varying clinical need for platelets (PLTs) sets a specific challenge for balancing supply with requests. Labour has been proven a primary cost-driver and should be managed efficiently. International comparisons of blood banking could recognize inefficiencies and allow reallocation of resources.
Seventeen blood centres from 10 countries in continental Europe, Great Britain, and Scandinavia participated in this study. The centres were national institutes (5), parts of the local Red Cross organisation (5), or integrated into university hospitals (7). This study focused on the departments of blood component preparation of the centres. The data were obtained retrospectively by computerized questionnaires completed via Internet for the years 2000-2002. The data were used in four original articles (numbered I through IV) that form the basis of this thesis. Non-parametric data envelopment analysis (DEA, II-IV) was applied to evaluate and compare the relative efficiency of blood component preparation. Several models were created using different input and output combinations. The focus of comparisons was on the technical efficiency (II-III) and the labour efficiency (I, IV). An empirical cost model was tested to evaluate the cost efficiency (IV). Purchasing power parities (PPP, IV) were used to adjust the costs of the working hours and to make the costs comparable among countries.
The total annual number of whole blood (WB) collections varied from 8,880 to 290,352 in the centres (I). Significant variation was also observed in the annual volume of produced red blood cells (RBCs) and PLTs. The annual number of PLTs produced by any method varied from 2,788 to 104,622 units. In 2002, 73% of all PLTs were produced by the buffy coat (BC) method, 23% by aphaeresis, and 4% by the platelet-rich plasma (PRP) method. The annual discard rate of PLTs varied from 3.9% to 31%. The mean discard rate (13%) remained in the same range throughout the study period and demonstrated similar levels and variation in 2003-2004 according to a specific follow-up question (14%, range 3.8%-24%). The annual PLT discard rates were, to some extent, associated with production volumes. The mean RBC discard rate was 4.5% (range 0.2%-7.7%).
Technical efficiency showed marked variation (median 60%, range 41%-100%) among the centres (II). Compared to the efficient departments, the inefficient departments used excess labour resources (and probably) production equipment to produce RBCs and PLTs. Technical efficiency tended to be higher when the (theoretical) proportion of lost WB collections (total RBC+PLT loss) from all collections was low (III). The labour efficiency varied remarkably, from 25% to 100% (median 47%) when working hours were the only input (IV). Using the estimated total costs as the input (cost efficiency) revealed an even greater variation (13%-100%) and

| 6 |
overall lower efficiency level compared to labour only as the input. In cost efficiency only, the savings potential (observed inefficiency) was more than 50% in 10 departments, whereas labour and cost savings potentials were both more than 50% in six departments. The association between department size and efficiency (scale efficiency) could not be verified statistically in the small sample.
In conclusion, international evaluation of the technical efficiency in component preparation departments revealed remarkable variation. A suboptimal combination of manpower and production output levels was the major cause of inefficiency, and the efficiency did not directly relate to production volume. Evaluation of the reasons for discarding components may offer a novel approach to study efficiency. DEA was proven applicable in analyses including various factors as inputs and outputs. This study suggests that analytical models can be developed to serve as indicators of technical efficiency and promote improvements in the management of limited resources. The work also demonstrates the importance of integrating efficiency analysis into international comparisons of blood banking.

| 7 |
2 LIST OF ORIGINAL ARTICLES
This thesis is based on the following original articles, which are referred to in the text by their Roman numerals (I-IV).
I Veihola M, Aroviita P, Linna M, Sintonen H, Kekomäki R. Variation of platelet production and discard rates in 17 blood centres representing 10 European countries from 2000 to 2002. Transfusion 2006; 46 (6): 991-5.
II Veihola M, Aroviita P, Linna M, Sintonen H, Kekomäki R. International comparison of the technical efficiency of component preparation. Transfusion 2006; 46 (12): 2109-14.
III Veihola M, Aroviita P, Kekomäki R, Linna M, Sintonen H. Discarded cellular components and the technical efficiency of component preparation. The European Journal of Health Economics 2007 Oct 26 (Epub ahead of print).
IV Veihola M, Kekomäki R, Linna M, Sintonen H, Aroviita P. Working hours and produced cellular components as variables to evaluate blood bank efficiency. Transfusion Medicine, 2008, 18, 241-249.
The original articles are reprinted with permission from the copyright holders.

| 8 |
3 ABBREVIATIONS
BC buffy coat CRS constant returns to scaleD blood component preparation departmentDEA data envelopment analysisDRS decreasing returns to scaleFFP fresh-frozen plasmaIRS increasing returns to scaleOECD Organisation of Economic Co-operation and Developmentp probability valuePAS platelet additive solutionPLT plateletPPP purchasing power parityPRP platelet-rich plasmar correlation coefficientRBC red blood cellSD standard deviationVRS variable returns to scaleWB whole bloodWBC white blood cell, leukocyte

| 9 |
4 INTRODUCTION
In modern transfusion therapy, donated blood is not transfused to the patient as-is but is instead reduced to blood products, which was made possible by the development of plastic bags (Walter C and Murphy W, 1952). After this invention, associated preparation methods were developed (Slichter SJ and Harker LA, 1976), and cellular blood products, RBCs and PLTs are derived by various techniques; for example, RBCs can be produced by preparative centrifugation and PLTs by alternative methods.
In Europe, WB-derived or BC-derived PLT production has been adopted by several countries (Murphy S, 2005; Murphy S et al., 1996). In the BC method, RBCs and PLTs are prepared by centrifugation of a WB unit obtained from a donor. A PRP method, commonly used earlier in the European blood community, has been almost totally replaced by the BC method. In the U.S., PLTs are often derived from a donor by using an automated cell separator (a method of aphaeresis) (Devine P et al., 1996). Theoretically, if 100% of PLTs were collected by aphaeresis, all PLTs from WB donations would be discarded. In the BC, PRP, and aphaeresis methods, blood plasma can be collected to be used either freshly frozen (fresh-frozen plasma, FFP), or fractionated further to medicinal products.
Blood collection and processing are carried out by authorized blood service organization(s) according to the respective national health policy of each country. Where not organized by government, blood service operations can be delegated to other institutes, the local Red Cross, communes, or hospitals. In Europe, the blood establishments and blood banks are governed by the blood directive (European Commission, 2004) and the recommendations in the “Guide to the preparation, use and quality assurance of blood components” by the Council of Europe (Guide, 2007). Therefore, the blood components in the EU may be considered similar.
Blood and blood components are subject to regular measures of ensuring their safety, efficacy, and quality. Special emphasis is put on selecting healthy donors and screening donors for infectious markers of blood-transmittable microbes. New tests and safety measures have increased expenditure at blood establishments.
Blood components are inadvertently wasted throughout the supply chain. Most of the losses, however, are due to the expiration of the products. A short shelf life and unexpected variation in the demand of PLTs emphasize the importance of managing economic and human resources at blood establishments.
Blood establishments devote considerable resources to the production of blood components, considered a core process of blood banking, and a significant part of blood processing costs are attributed to labour costs (Amin M et al., 2004). The efficiency of component preparation, however, has been rarely studied (Butch SH, 1998; Pitocco C and Sexton TR, 2005; Pereira A, 2006). Benchmarking may help blood establishments identify ways to meet the demand, especially in a situation of a narrowing margin between blood donation and transfusion, as well as under economic constraints.
The present study was ethically justified, as the blood establishments are reimbursed by hospitals for the blood products and are responsible to the blood donors for optimal use of their gift.

| 10 |
5 REVIEW OF THE LITERATURE
5.1 managemenT of blood Transfusions
As a special characteristic, blood establishments cannot predict production according to availability of blood only; they also need to respond to varying demand from hospitals. Close collaboration between suppliers (blood establishments and blood banks) and users (hospitals) is of utmost importance in the efficient management of blood resources. The present study does not include the stages of management from the delivery of blood products to the hospital or from the hospital blood bank to the patient for transfusion.
5.1.1 blood supply and demand
Donor recruitment, donor screening, and blood collection are inherent activities in maintaining a sufficient blood supply. Donor recruitment has become a delicate issue as donors become less available because of socio-demographic changes in population and because screening requirements are increasingly strict (Brittenham GM et al., 2001; Reynolds E et al., 2001).
There is a clear downward trend in RBC demand and utilization in Europe, as reported by the EBA (European Blood Alliance) benchmarking project from 11 countries (Gorham M, 2007). On the other hand, the number of transfusions has been reported to increase, contributing to an even chronic shortage of RBCs in the U.S. (Pitocco C and Sexton TR, 2005; Sullivan MT et al., 2007). Blood is a perishable resource, and contributing to its further replenishing through regular, voluntary, and non-remunerated donations has raised questions, for example, about changing the age criteria of donors or using automated technology by collecting two RBC units from a single donor (Gilcher RO, 2003; Goldman M et al., 2007).
The number of WB collections is predicted by hospital demand for RBCs. Accordingly, blood establishments aim to plan for WB collections to correspond to the basic clinical need and to balance them with the blood group distribution in the population. To satisfy the often stochastic demand for PLTs, blood establishments may use supplementary methods, such as aphaeresis, to derive more units of PLTs at a time (Snyder EL et al., 2003; Vassallo RR, Jr. et al., 2004). Efficient management over the whole supply chain with special attention to the inventory would assure an optimal supply of RBCs and PLTs and decrease the expiration of the components.
5.1.2 rbc transfusions
The main purpose of RBC transfusion is to improve the delivery of oxygen to the tissues. The physiology of oxygen delivery has been described, whereas the appropriate universal trigger for transfusion, such as haemoglobin concentration (Weiskopf RB et al., 1998; Lieberman JA et al., 2000) or haematocrit value (Crowell JW and Smith EE, 1967) remains controversial. Thus, clinical practices in the use of RBCs vary widely. The Safe and Good Use of Blood in Surgery study compared the usage of blood components in elective surgical procedures among

| 11 |
43 European teaching hospitals and detected a variation in the risk of receiving transfusions for equivalent procedures from 0% to 100% among the hospitals (SANGUIS, 1994). Another study revealed a six-fold variation in the mean number of blood components transfused per patient in coronary artery bypass grafting (CABG) operations in nine Finnish hospitals (Kytola L et al., 1998).
Most RBC transfusions are administered to surgical and intensive care patients (Vincent JL et al., 2002; Rao MP et al., 2002). According to a Finnish study, more than half of 59,535 transfusions were conducted during surgical operations (Palo R et al., 2005). The majority of RBCs were transfused to surgical patients undergoing either cardiac or orthopaedic surgery (Capraro L and Syrjala M, 2001). Chronic or congenital anaemia may also indicate RBC transfusion. A recent study reports a wide variation in the incidence rate of RBC transfusions in the U.S., Australia, England, and Denmark, from 44.7 to 54.1 units per 1,000 population (Cobain TJ et al., 2007). In Europe, the incidence rate was highest in Denmark, Greece, Austria, and Finland, where more than 52 RBC products per 1,000 population were used, whereas in several other countries, the rate varied from 30 to 40 units (European Health Committee (CDSP), http://www.coe.int/t/dg3/health/CDSP_en.asp). According to U.S. data from 1989-1992, more than 53% of all RBC components were transfused into patients over 65 years of age (Vamvakas EC and Taswell HF, 1994). The trend is similar in Europe (Wells AW et al., 2002); thus, elderly patients may be an expanding group of transfusion recipients.
In the U.S., according to a large survey covering 2,247 blood centres and banks, transfusions of WB and RBCs increased by 12.2% from 1999 to 2001 (Sullivan MT and Wallace EL, 2005).
Based on current usage, the demand for blood products is expected to exceed the supply within 20 years (Currie CJ et al., 2004). European studies have reported a decrease during recent years in the use of RBCs in elective surgeries. RBC transfusions decreased in CABG surgeries from 47% in 1997/1998 to 31.6% in 2001/2002 in British hospitals (Cobain TJ, 2004). The number of donor exposures, including the CABG patients, decreased from 76% in 1998 to 48% in 1999 in a Finnish study (Capraro L and Syrjala M, 2001). A wide variation in the incidence rate of RBC transfusions internationally, even in Europe, may require varying the relative amount of resources used by blood establishments to respond to the demand for RBCs.
5.1.3 plT transfusions
PLTs may be transfused when a low PLT count (thrombocytopenia) is observed in diseases that affect their production or function, such as leukaemia, aplastic anaemia, cancer, congenital defects, trauma, and viral infections. Most PLT transfusions are prophylactic to prevent bleeding in thrombocytopenic haematological patients or are given therapeutically to stop haemorrhage, whereas only 15% are transfused in surgical procedures (Simon TL, 1991). Triggers for prophylactic PLT transfusions have been discussed in many studies, but a single PLT threshold value does not apply to different situations.
Among the U.S., Australia, England, and Denmark, a major variation was recently reported in the incidence rate for PLT transfusions, from 2 to 6 units per 1,000 inhabitants per year (Cobain TJ et al., 2007).

| 12 |
According to multiple reports, the demand for PLTs has shown a tendency to increase (Critchfield GC et al., 1985; Sullivan MT and Wallace EL, 2005). Nearly 10.2 million units of PLTs were transfused in the U.S. in 2001, an increase of 12.6% over the number of units transfused in 1999. The trend is similar in Europe. Demand for PLTs rose by 450% in Wales U.K. from 1980-1992 (Booth T et al., 1992) and doubled in Switzerland from 1991-1995 (Nydegger UE and Schneider P, 1997). Also in Finland, the clinical use of PLTs has been increasing (Finnish Red Cross Blood Service, 2006). It seems obvious that the use of PLTs will continue to grow for various indications.
A short shelf life (5-7 days) of PLTs is a critical factor that sets up a challenge for the blood centre and the hospital. Again, varying the amount of resources may be needed locally to satisfy the demand for PLTs in a timely way. .
5.2 from blood To blood producT
The path from blood to blood products is a demanding technological process that starts with collection of WB and ends with RBC and PLT products (Figure 1). Discarded products comprise those wasted in production and those that are outdated. Collection of PLTs by aphaeresis can be used to supplement PLT production, and sophisticated production materials and equipment have been developed for this purpose. For issuing blood products to hospitals, blood establishments may be reimbursed at a price estimated to equal the production cost of the manufacturing processes.
figure 1 The operations of a blood establishment
5.2.1 blood service systems
The organisation of blood transfusion services has been an issue of national policy. Where government has not undertaken this task, blood service operations have been delegated to the local Red Cross, hospital blood banks, not-for-profit institutes, or commercial organisations. Plasma fractionation is concentrated on commercial plasma fractionation companies or larger scale pharmaceutical enterprises.
In all of the Nordic countries with the exception of Finland, hospitals or communes are responsible for blood banking. A centralized system for blood collection,
produced rbcs
discarded rbcs/plTspaTienT
aT hospiTal
Wb collections
aphaeresis- plTs
Production
produced plTs

| 13 |
processing, and distribution has been entrusted to the Red Cross in countries such as Australia, Canada, the U.S., Switzerland, Belgium, Austria, Germany, Greece, Spain, and Finland, although other involved institutes may coexist (Leikola J, 2004; Tretiak R et al., 1996; Tretiak R et al., 1996).
A national, centralized blood service system has been adopted by France and the U.K., organized by the government nationwide. In the U.K., one national blood service (NBSNHS) governed by the National Health Service (NHS) authority has been formed from the 14 (until 1993) previously independent blood services. There is a similar trend towards centralization in countries with large networks of hospital blood banks, particularly in Sweden and Norway.
5.2.2 blood collection
More than 75 million units of blood are collected annually worldwide (Red Cross Red Crescent – Blood Services). Of these, voluntary unpaid donations cover 92% in developed countries and 67% in developing countries (Blood transfusion, http://www.who.int/topics/blood_transfusion/en). In the U.S., 15.3 million WB units were collected in 2001 (Sullivan MT et al., 2007).
Donor recruitment and blood collection are likely the most critical parts of blood establishments. Blood donors have become less available compared to the growing demand for blood products. New recruitment techniques have been adapted to induce new donors, and donation criteria may have been mitigated, for example, by extending the age limits, to retain regular donors (van der Pol MM and Cairns JA, 1998; Smith JW et al., 2002; Smith JW et al., 2002). Multicomponent aphaeresis for deriving combinations of RBC, PLT, and plasma units (Waxman DA, 2002) and collection of double RBC units are increasingly used to alleviate blood shortages, especially in the U.S. (AuBuchon JP et al., 2007).
Because blood collections are driven by the demand for the RBCs, blood banks tend to pre-estimate the mere clinical use of blood products in hospitals to balance the collections accordingly. The choice of collection bag has been determined by the aims of production; that is, optimising BC separation, maximising RBC recovery, or maximising plasma harvest (van Rhenen DJ et al., 1998). Recruiting donors and maintaining the donor base will challenge blood establishments because these activities will become more costly and require greater effort in the future. Blood establishments need to explore strategies that allow the collections to be performed at a lower cost and, at the same time, assure a sufficient supply of blood (van der Pol M et al., 2000).
5.2.3 component preparation
A common goal of component preparation methods is to produce RBCs, PLTs, and FFP that contain maximum amounts of therapeutic blood elements and minimum amounts of unnecessary residual cells. The separation of blood into its components can be accelerated by centrifugation, which is based on different physicochemical properties, such as density of blood cells. Changing centrifugation parameters, such as time, temperature, and rotation speed can affect the composition of separated fractions. With the development of the processing technique, blood component preparation has become a routine procedure worldwide (van Delden CJ et al., 1998; Heaton WA et al., 1997).

| 14 |
Removal of white blood cells (WBCs) from blood components (leukocyte reduction) has been established to obtain less-contaminated blood concentrates to prevent febrile reactions following blood transfusions and to reduce alloimmunization (Uhlmann EJ et al., 2001; Pruss A et al., 2004; Capraro L et al., 2007). RBCs and PLTs can be filtered after the separation to obtain leukocyte-reduced components. RBCs can also be derived from WB that has been filtered to remove leukocytes (Riggert J et al., 1997). In this procedure, even PLTs are lost.
The production methods of PLTs (PRP and BC methods) vary in different areas of the world. About 75% of the PLTs (therapeutic doses) transfused in the U.S. are obtained by aphaeresis (single-donor PLTs) and 25% are prepared from WB using the PRP method. The number of single-donor PLTs transfused increased by 26% from 1999 to 2001, whereas the use of WB-derived PLTs declined by 13.9% (Sullivan MT et al., 2007). In Europe, 14 countries reported that about 44% of transfused PLTs were derived from BC, 49% from aphaeresis, and only 7% from PRP (Murphy S, 2005). In studies of the clinical advantages, e.g., the therapeutic efficacy, both WB-derived PLTs and aphaeresis-PLTs are comparable in their ability to prevent and stop bleeding (Sloand EM et al., 1996).
Figure 2 shows the processes of PLT production methods. BC and PRP methods are based on separation of blood components, RBCs, PLTs and plasma, from WB collection. In the BC method, 4-6 BCs are pooled to give one PLT concentrate. In the PRP method, the single-unit PLTs have been separated from PLT-rich plasma. The aphaeresis device allows both collection of the PLTs and preparation of the final PLT concentrate during collection.
Figure 2 The processes of the PLT production methods Open arrows denote a centrifugation phase
PLt concentratePooling of 4-6
single-unit PLtsWB
collectionPLt-rich plasma
rBc
PLt-rich plasma
rBc
prp methodPLt-poor plasma
Single-unit PLt Single-unit PLt
Pooling of 4-6 Bc layers containing the PLts
WB collection
PLt-poor plasmaBc layer (PLt +WBc)
rBc
PLt-poor plasma
Bc layer
rBc
PLt-rich layer
residual rBcs
bc method
PLt concentrate
Blood cell separation
PLt concentrate equal to 4-12 PLt units
aphaeresis method

| 15 |
Buffy coat (BC) method Concern about the contamination of RBCs, the quality of PLTs, and the need for plasma derivatives contributed to the switch from the PRP method to the BC method in Europe (Prins HK et al., 1980; Murphy S, 2005). Technology for the removal of BC from a WB unit by manual techniques was initiated by the Finnish Red Cross Blood Service to use leukocytes in human interferon production. Therefore, the majority of leukocytes (approximately 90%) have been removed from all RBCs in Finland since 1979 (Oksanen K, 1994). The BC layer (PLT + WBC) was later launched as a source for PLT component preparation (Pietersz RN et al., 1987), first from single-donor PLT units and later from BC pools. Pooling of PLTs was applied to increase the usability of PLTs and to save plasma while using the PLT additive solution (Eriksson L and Hogman CF, 1990).
In the BC method, intense primary centrifugation of the WB unit allows separation of RBCs, the BC layer, and plasma. Further centrifugation of BC in PLT additive solution or plasma makes it possible to separate PLTs from WBCs and residual RBCs. If the aim is to prioritize obtaining pooled BCs, WB can be collected in a bag suitable for this purpose. Although PLTs can be obtained in sufficient amounts with current preparation methods, the short survival of PLTs is a challenge to their timely availability.
Today, processing of BCs to clinical PLT products is performed by semi-automated, closed, and sterile systems accompanied by several technological improvements, such as sterile connecting devices, the bottom-and-top bag system, separation devices, and new synthetic storage media (Hogman CF et al., 1988; Gulliksson H et al., 2002; Larsson S et al., 2005). Each prepared adult PLT concentrate should contain PLTs equivalent to the amount obtained from 4-6 WB collections (> 240 x 109) (Guide, 2007).
Platelet-rich plasma (PRP) methodThe PRP method has been a standard separation procedure since the introduction of plastic bags in the 1960s (Vassallo RR and Murphy S, 2006). The PRP continues to be commonly used in the U.S., but it has disappeared in Europe except in some southern areas (Murphy S, 2005).
Aphaeresis methodThe aphaeresis method allows deriving of four- to twelve-fold yield of PLTs in one donor session. Because of the smaller number of donor contacts for a patient, aphaeresis is also less prone to resulting in transmission of infections (Slichter SJ, 2007). Aphaeresis is costly, however, because the cell separation automation equipment, whether rented or purchased, is expensive, as are the disposable materials. Under certain conditions, however, aphaeresis is preferable.
5.2.4 cellular components and fresh-frozen plasma
The bone marrow continuously produces new blood cells into the blood, where RBCs circulate with an average lifespan of 120 days, and PLTs, 7-10 days. Blood cells can be separated by centrifugation into at least three layers: RBC, BC, and plasma. The separation is improved after a so-called resting time of WB. Commonly used resting times vary from 2-8 hours to 16-24 hours (Oksanen K, 1994).

| 16 |
RBCs One RBC unit is produced from one WB unit. The collection bag must contain the appropriate anticoagulant solution. Depending on the indication for use, RBCs are modified to be suitable for clinical use by BC removal, leukocyte reduction, washing, irradiation, or all of these procedures. A standard adult RBC unit should contain Hb at minimum 43 g/unit (Guide, 2007). Double (2) units of RBCs can be collected and processed at a time, which allows transfusion using units of higher Hb content (Snyder EL et al., 2003; Arslan O et al., 2004). RBCs can be stored before transfusion for 35 – 42 days at 2oC-8oC depending on the storage solution. The ABO and RhD compatibility of the donor and recipient must be ensured before transfusion.
PLTs PLTs are prepared from units of WB collected from random donors into blood collection bags or alternatively, using a blood cell processor (aphaeresis) to collect one (to three) adult dose(s) of PLTs from a single donor. WB can be processed further for clinical use by centrifugation and separation procedures (the PRP or BC method) (Murphy S et al., 1996). The amount of PLTs in an adult standard dose is equivalent to the amount obtained from a pool of 4 to 6 units of WB. A BC-prepared PLT unit counts as more than 60 × 109 PLTs per single unit equivalent. The viability of PLTs is preserved from 5-7 days at 20oC to 24oC depending on storage conditions. Plasma or another solution is used as the storage liquid for PLTs (Guide, 2007).
FFP FFP is obtained either by separation of plasma from WB during preparation of RBCs and PLTs, or by plasmaphaeresis during PLT collection directly from a donor; thus, it can be considered a by-product of these processes. In either case, plasma is frozen no later than 8 hours after collection. FFP is used for clinical purposes or as source plasma for fractionation.
5.2.5 discarded components
Blood components may be inadvertently wasted at any stage of the preparation (Cobain TJ, 2004). Hospitals across Canada were reported to waste on average 2% of RBC units per year, with the cost of wastage at less than a dollar per unit in a survey of eight hospitals (Amin M et al., 2004). In another Canadian study, the mean wastage rate in hospitals was 5% for RBCs (mean cost 5 USD/unit) (Tretiak R et al., 1996). The quality systems, however, assure that less wastage occurs during the production process by decreasing the deviations that lead to discards (Guide, 2007). Monitoring of the wastage and its causes has become a routine quality-assurance procedure in blood establishments (Clark JA and Ayoub MM, 1989; Novis DA et al., 2002).
Because blood is perishable, the outdating of labile blood components, such as PLTs, has been considered the main reason for discards. A three-year statistical data analysis by the AABB from blood centres and blood banks showed a significant upward trend over time in the outdating or wastage of RBCs and PLTs (Devine P et al., 1996). Another large study reported a mean PLT discard rate of 18% in American blood banks in 1999 (Sullivan MT and Wallace EL, 2005). Because resources used to produce the discards are a lost production input and the discards represent lost revenue, discarded components should be subject to economic analysis in blood establishments.

| 17 |
Outdating of RBCsBecause the shelf life of RBCs is 35-42 days in blood service conditions, they are not as perishable as PLTs. Factors that affected enhanced expiration rates of RBCs in Australian public hospitals included, for example, the absence of a hospital transfusion committee, a high ratio of average stock levels, and premature cross-matching of RBCs. Providing each of the hospital blood banks with individual improvement recommendations resulted in a significant reduction in the overall outdating rate from 5% to 1% (Pink J et al., 1994). In the U.S., 6.3% of all collected RBC units were outdated in 2001 (Sullivan MT et al., 2007). At the same time, the unmet demand for the RBCs was estimated at 7.3%. Decreasing the outdating of RBCs, however, has not been the focus of studies seeking solutions for the chronic shortages of RBCs in the U.S. (Wallace EL, 2003; Gilcher RO, 2003).
Outdating of PLTsAdditional expenditure by blood establishments has occurred because of the loss of PLTs because of their short shelf life (5-7 days) and the greatly varying demand for them. After a PLT unit has been released from all infection marker testing to delivery stock, the remaining shelf life may be only two days. Depending on the dose size of a PLT concentrate (e.g., four PLT units/adult dose), several units may be outdated at a time. As much as a fifth of produced PLT concentrates has been reported to become outdated (Sullivan MT and Wallace EL, 2005), and the expiration rate was more than 25% for random donor PLTs and more than 10% for aphaeresis-PLTs in every tenth blood bank of 1639 U.S. hospitals studied (Novis DA et al., 2002).
Methods allowing prolonged PLT survival, such as bacterial screening (Brecher ME and Hay SN, 2004; Blajchman MA et al., 2004), new preservation solutions, and cold storage (Hoffmeister KM et al., 2003) are highly desirable. High outdate rates may not be a necessary evil if the supply and production could be scaled to balance the stochastic need for PLTs, for example, by production planning and improving inventory management (Critchfield GC et al., 1985; Pink J et al., 1994). Independent of the basic production method, a flexible PLT production system would enhance responsiveness to meet demand peaks.
5.2.6 inventory management
RBCs are obtained by every WB collection, whereas PLTs are derived from WB according to estimated transfusions for PLTs. Blood supply has been traditionally determined by the ability of the RBC supplies to meet transfusion demand. RBCs may not be sufficiently available, for example, because of sporadic shortages of donors, increased use, disruptions in production, or product recalls (Goodnough LT et al., 2003; Sullivan MT et al., 2007). Planning and maintaining an adequate RBC inventory with ABO/Rh-typed units is based on better predictability of their need, such as for elective surgeries, and their longer shelf life.
Supplies of PLTs have proven more complex to predict owing to their stochastic demand and short shelf life. While aiming at minimizing the outdating of blood components is an important economic issue, the primary task of inventory management is to assure the timely provision of blood products for transfusion.
Several techniques have been employed to monitor the stock levels, particularly of PLTs, to match supply to demand. Ledman and Groh established a committee

| 18 |
responsible for planning the PLT production based on everyday evaluations of PLT need in 60 hospitals (1984). The PLT outdate rate fell from 20% to 3%, and the need was satisfied over a 6-month period. Katz et al. developed a computer simulation model of PLT production and distribution (1983). Based on two years of PLT orders, the model generated daily orders and calculated mean demand and standard deviation of demand. The number of PLT concentrates to be produced each day was calculated with this information. The model was found to be applicable with a 5-day storage life for PLTs, regardless of the varying logistics of PLT production and distribution in the centres. The potential of time series models was investigated in the prediction of next-day PLT utilization (Critchfield GC et al., 1985). Simple mathematical models were found superior to one- or two-day moving averages, but they did not predict the day-of-the-week variation (seasonality) of PLT need more accurately than an experienced coordinator. Application of the time series model decreased the number of PLT outdates and resulted in significant savings in labour cost for the PLT inventory.
Sirelson and Brodheim presented a computer model for PLT inventory management (1991). The model was based on the estimates of the mean values of PLT demand. Changes in the mean values predicted the shortage and outdate rate of PLTs in the inventory. A Finnish project for improving the supply chain involved, for example, tracking inventory levels at all stages of the chain with computer systems that were compatible between supplier and hospitals (Rautonen J, 2007). The other goal was to create a joint management system over hospital inventories, which would promote achieving deliveries that match with clinical need. Hospitals supported the idea of a collaborative approach.
A decline of nearly 40% was marked in the margin between RBC supply and RBC transfusion demand from 1989 to 2001 in the U.S. (Sullivan MT et al., 2007). Nightingale et al. developed a system designed to detect the threat of shortages in real time. The system was based on daily reporting of transfusion service activities in a sample of large urban hospitals (2003). In the U.S., however, more than 90% of all WB units are collected by blood centres, which maintain buffering stocks for hospitals. The system has been suggested to be enlarged nationally to encompass all U.S. blood centres (Wallace EL, 2003). Pereira tested a stochastic model to simulate performance of a hospital blood bank inventory that held only unassigned inventories (type and screen procedure, where specific RBCs are not cross-matched to particular patients) (Pereira A, 2005). RBC shortage and outdate rates increased with the variation in daily demand for transfusion, the major parameter in defining the performance of blood inventory. The findings suggested adjusting the residual shelf life of RBCs to the variation in daily usage.
Managing inventories efficiently has proven complex. Maximum use of blood resources requires recognizing the interrelations of supply and demand, and happens through the combined efforts of the parties involved. Redesigning computer and networking systems to operate with actual data on blood supplies and usage to be visible for all parties in the supply chain would contribute to minimizing shortages and outdates and allow timely transfusions (Chapman J, 2007).

| 19 |
5.3 cosTs in blood esTablishmenTs
Cost efficiency analyses of blood supply and transfusion are not available in the literature, whereas cost accounting and cost comparisons have received more attention.
Costs of a blood centre can be demonstrated as four basic functions (Figure 3). All of these functions involve specialized equipment and materials, such as special blood bag systems, automated blood scales, and sterile docking devices. A Finnish study reported that materials and screening tests of a blood service accounted for 24% of all blood transfusion costs (Rautonen J, 2007). Purchases represented 16% of the RBC unit cost in Canadian blood centres (Tretiak R et al., 1996). Categorized by functions, blood collection and WB processing have been suggested to involve more than two thirds of direct blood service costs (Guest JF et al., 1998; Custer B et al., 2005).
Blood collection, production, and distribution were evaluated to account for 40%
of the cost of RBC transfusion in six Canadian blood centres (Tretiak R et al., 1996). A later study found that these functions represented more than half of the total RBC transfusion cost (Amin M et al., 2004). A British study concluded that even 76% of annual direct costs of blood transfusion were carried by blood centres (Guest JF et al., 1998). A recent analysis of the costs of blood supply in Finland suggested that blood service costs account for a similar proportion (76%) of blood transfusion costs (excluding the costs of the transfusion event) (Rautonen J, 2007).
The donor time designated to donation is considered a productivity cost, and it has been reported to be directly or indirectly equivalent to 6%-16% of the blood product cost (Guest JF et al., 1998; Amin M et al., 2004; Custer B et al., 2005). In a U.S. study, a community blood supply model was developed to evaluate donor requirements on blood supply and cost of blood. The unit cost of obtaining blood was lowest (196 USD including donor’s time in addition to production cost) among older males (55 years or older) and highest (216 USD) among young females (16–24 years) (Custer B et al., 2005). A Canadian study revealed substantial variation in RBC transfusion costs across hospitals. The mean opportunity cost of donor time was evaluated at 18.21 USD (7% of transfusion costs) (Amin M et al., 2004).
DONOR RECRUITmENT AND BLOOD COLLECTION
BLOOD TESTING
BLOOD COmpONENT pREpARATION
INVENTORy AND DELIVERy
Figure 3 Cost elements in blood establishments

| 20 |
Few efforts have been made to evaluate the cost of individual product in the conditions of joint production. Jacobs et al. developed a flowchart that separated processes from their related inputs and outputs and allowed common costs to be allocated to each product (1992). Guest et al. stratified costs according to blood product and estimated that RBCs accounted for 60% and PLTs for 23% of production and issuing costs in blood services in the U.K. in 1994/1995. In a later comparative study from 2000/2001, RBCs and PLTs accounted for 77% and 7%, respectively, of blood service costs (Guest JF et al., 1998; Varney SJ and Guest JF, 2003). The annual cost of provision and transfusion of blood products was reported to increase by 256% in the U.K. between 1994 and 2001.
From an economic and management perspective, labour represents the most costly input in blood banking. In a Canadian study, 41% of the mean cost of blood collection, preparation, and distribution were attributed directly to labour cost (Amin M et al., 2004). Tretiak et al. categorized blood transfusion costs into four stages: collection, production, distribution, and delivery. Personnel was the primary cost driver representing 60% of the RBC unit cost (1996). According to Pereira, personnel accounts for more than 70% of all transfusion costs (Pereira A, 2002).
Introduction of new measures to improve the safety of blood transfusions has markedly increased costs in blood centres (AuBuchon JP et al., 2001; Goodnough LT et al., 2003). At the same time, the availability of blood has decreased, compelling blood centres to enhance efforts and financing to recruit donors (Custer B et al., 2005). Although increasing costs have accumulated in assaying for infection markers and maintaining a sufficient donor base, improving the productivity of labour should be seen as a target in strategies to contain the costs of blood transfusion (Pereira A, 2002).
Cost efficiency analysis is an inseparable part of an assessment of economic performance. Blood services would benefit from comparisons that evaluate the real cost efficiency of the whole blood supply chain from donation to transfusion. If measuring cost efficiency is possible, it enables estimation of savings potential.
5.4 efficiency research in healTh care
The economic importance of health care started to grow rapidly in the 1950s. For example, in Finland the percentage of GDP allocated to health care grew from 3.9% (1960) to 9.3% (1992), fell after that as a result of cuts in health care resources and accelerated growth of GDP to 6.6% in 2000, and has grown steadily since to 7.5% in 2004. The growth has been significant also in other European countries (OECD, www.oecd.org). Increasing public expenditure on health care has motivated the search for sources of rising costs and measures of assessing the performance of health care organisations and technologies.
Efficiency analyses were more widely adapted by the health care sector in the 1980s. Absorbing a significant proportion of public spending, hospitals have been the focus of such analyses. Performance of not-for-profit organisations, e.g., hospitals, has often been measured by evaluating their productivity and efficiency (Grosskopf S and Valdmanis V, 1987; Magnussen J, 1996; Smet M, 2007), and there has been growing interest in comparing their relative performance (Ferrier G and Valdmanis V,

| 21 |
1996; Linna M and Häkkinen U, 1999). The non-parametric DEA was applied in a cost efficiency analysis, which revealed marked differences among and within Finnish and Norwegian hospitals (Linna M et al., 2006).
It is generally assumed that a large production volume allows more efficient use of resources (scale efficiency). In a study measuring the efficiency of 64 long-term care units in Finland, larger units seemed to operate more efficiently than smaller units (Bjorkgren MA et al., 2001). Another Finnish study revealed no clear association between technical efficiency and the size of 114 long-term care units (Laine J et al., 2005). A Salter diagram was applied to illustrate the efficiency distribution in the units.
5.4.1 Efficiency concepts
In the health care literature, the same concepts are often used to indicate quite different measures of performance. To clearly express what the concepts actually mean in various contexts, it is useful to distinguish among the four elements of health care activity (Sintonen H and Pekurinen M, 2006).
The first element is the inputs, the resources (manpower, capital) available for health care. Their amount can be measured commensurably by costs, by their monetary value. The second element is the production process, where resources are combined to produce the third element, the output. The output is composed of different services, products, or technologies, which in turn produce changes in health status. These changes in health status, or health effects, are referred to as effectiveness, which represents the fourth element.
inPutS resources costs
Pooling of 4-6 Bc layers containing the PLts
Production ProcESS combining the resources
= output/input
= costs/output
= costs/Effectiveness Efficiency cost effectiveness
unit costs cost efficiency
Productivity technical efficiency
Productive efficiency operative efficiency
EFFEctiVEnESS change in health status
outPut Servicestechnologies
Figure 4 Elements of health care activity and the relationships between them (adapted from Sintonen H and Pekurinen M, 2006)

| 22 |
There are two approaches to assessing the performance of health care. One concentrates on exploring the performance in terms of the relationship between the inputs and output as measured by the different services, products, or technologies produced. This approach can be called the productivity school. It aims to find the best ways of converting inputs, measured either in physical or monetary terms, into output. In this school, often-used measures of performance are productivity, technical efficiency, productive efficiency, operative efficiency, allocative efficiency, and cost efficiency. This school does not pay explicit attention to the health effects of output. There may be several reasons for that, such as an assumption that all services, products, or technologies that health care produces are beneficial to health and thus effective (which clearly does not hold in practice) or that measuring the differential health effects at least commensurably is too difficult to be worth the effort.
The other approach concentrates on exploring the performance of health care in terms of the relationship between the inputs and effectiveness. The most often used measures of performance are referred to as cost effectiveness or efficiency. This school aims to identify the best ways to convert inputs, measured in monetary terms, into effectiveness. Health effects are measured explicitly because of the idea that the health effects produced are the ultimate measures of output and that different services, products, or technologies are just necessary intermediate outputs; thus, in a sense, they are the inputs to the production of ultimate outputs, i.e., health effects. In addition, different services, products, or technologies can result in zero or even negative effectiveness, and the positive effectiveness can vary a great deal; therefore, the assumption that all services, products, or technologies are beneficial to health is unwarranted. Thus, the concept of efficiency should be reserved to indicate this more fundamental relationship between costs (inputs) and effectiveness, and this approach constitutes the “real” efficiency school (Sintonen H and Pekurinen M, 2006).
In summary, when encountering the various versions of the concept of efficiency, it is necessary to be clear about how the output is measured. If the output is measured in terms of services, products, or technologies produced, we are dealing with a productivity analysis. If it is measured in terms of effectiveness (health effects), then the approach is the “real” efficiency analysis.
The present study belongs to the realm of productivity analysis. Below, the meaning of different efficiency concepts used in this area is briefly clarified.
5.4.2 Measures of efficiency in productivity analysis
Simple measures of productivity can be defined as the ratio of the output produced to the inputs used in a certain period of time. In the calculation of total productivity, all inputs are included. In case of capital productivity, the output is divided by the capital. A measure of labour productivity can be obtained by dividing the output by the amount of labour used. In the case of multiple outputs and inputs, they have to be weighted in an appropriate way to achieve unidimensionality on both sides. Usually the outputs and inputs are weighted by their monetary values. These simple measures do not tell, however, how well different production units perform in producing a given output and whether they are performing in the best possible way given the technology.
Technical efficiency was defined by Koopmans as follows: a production unit is technically efficient if an increase in any output requires a reduction in at least one other output or an increase in at least one input, and if a reduction in any input

| 23 |
requires an increase in at least one other input or a reduction in at least one output (Koopmans T, 1951). Technical efficiency occurs when the maximum amount of output is produced with a given set of inputs (output-oriented technical efficiency), or when the minimum amount of inputs is required to produce a given output (input-oriented technical efficiency) in a certain time. Unit A is thus technically efficient compared to unit B if unit A uses less of at least one input and not more of the other inputs to achieve the same output than unit B.
The idea of technical efficiency can be illustrated with Figure 5. The shaded area L(y) represents a certain amount of output that can be produced with different combinations of inputs x1 and x2. Isoquant Isoq L(y) combines the production units, which produce that output with the least combinations of inputs. The isoquant locating closest to the origin is also called the efficiency frontier. Now according to the definition of Koopmans, combinations xC, xD, xB, and λAxA are technically efficient, whereas xA is not. It is questionable though, whether combination λAxA can be regarded as technically efficient because combination xB can produce the same output with less input x1 without using any more input x2. Thus, there is slack in the use of x1, and in the definition of Farrell (1957), therefore, λAxA is not technically efficient. Some authors use productive or operational efficiency as synonyms of technical efficiency (Rosko MD, 1990; Parkin D and Hollingsworth B, 1997).
Figure 5 Illustration of the concepts of technical and allocative efficiency (source Linna M, 1999)
Inpu
tx 2
W’
XC
λAXA
W W”
XD
XB XA
L(y)
Input x1
Isoq L(y)
Usually inputs are not free but have to be acquired at a price. The budget lines w, w’, and w’’ represent different amounts of money (budgets) by which a different combination of x1 and x2 can be acquired. The budget line w indicates all combinations of x1 and x2 that can be obtained with this budget. Lines w’ and w’’ represent higher budgets. They are parallel to w, and the slope of the lines is determined by the relative prices of inputs x1 and x2.

| 24 |
Assuming that the production units aim at cost minimisation, then the input combination xD is the least costly, as the lowest budget line touches the isoquant at xD. Thus, that combination is called allocatively efficient because with it the unit production costs (production costs/output) are at their minimum. This least unit cost combination can also be called cost efficient. Allocative efficiency thus coincides with cost efficiency, and maximisation of cost efficiency thus implies minimisation of unit cost. The ratio of minimum unit cost to observed unit cost provides a measure of cost efficiency. In Figure 5, the measure of cost efficiency for combination xB is w/w’. A measure of cost inefficiency or savings potential for combination xB in comparison to the cost efficient combination is 1 – (w/w’).
It is generally assumed that large production volumes result in scale efficiency or economies of scale, also called increasing returns to scale (IRS), meaning that with increasing volumes, unit production costs would decrease. Such a situation would prevail if an equal percentage increase in all inputs were to result in a greater percentage increase in output. Constant returns to scale (CRS) would prevail if an equal percentage increase in all inputs were to result in the same percentage increase in output. Decreasing returns to scale (DRS) would prevail if an equal percentage increase in all inputs were to result in a lower percentage increase in output.
5.4.3 Empirical efficiency studies in blood banking
Efficiency analyses are scarce in blood banking. In an early study, the labour efficiency index (sum of standard output units divided by staff working time, median 0.32, range 0.12-0.98) calculated in 40 hospital-based blood banks suggested a considerable amount of slack time for the staff of most of blood banks (Lam HC et al., 1994). A case study identified quality tools, such as the fishbone diagram, that could contribute to improving the labour efficiency (Butch SH, 1998). Pitocco and Sexton evaluated the operational efficiency in 70 U.S. blood banks and found that 34 operated inefficiently (2005). The collective output of PLTs could be increased by 17% and that of RBCs by 7.3% if the inefficiency decreased by half. Pereira found 6 of 71 blood banks to be technically efficient under the assumption of CRS and defined the optimal size of a blood bank to be 75,000-100,000 produced RBCs per year (2006). In his recent study, Pereira concluded that regulated competition between blood suppliers would help alleviate diseconomies of blood transfusion (2007).
Conclusions about the scale efficiency in blood services are controversial. Pierskalla found that blood banks producing 50,000 to 70,000 RBCs annually operate most efficiently (Pierskalla WP et al., 1987). Pereira concluded that most of the technical inefficiency was scale independent in 39 (55%) of 71 surveyed blood centres operating under the assumption of IRS (2006). Pitocco and Sexton demonstrated the efficiency frontier to be characterized by IRS and suggested that blood centres can increase their operational efficiency and gain economies of scale, for example, through a merger (2005).
Until now, comparative efficiency studies have mainly been national (Bell AM et al., 2008).

| 25 |
5.4.4 Methods of analysing efficiency
Data envelopment analysis
Data envelopment analysis (DEA) is a linear non-parametric technique first introduced by Farrell and later developed by Charnes, Cooper, and Rhodes (Farrell MJ, 1957; Charnes A et al., 1978). DEA is based on relative efficiency measures, and in this framework a unit is judged to be efficient if it is operating on the best practice production frontier (efficiency frontier). The efficiency frontier is a numerical definition of the most efficient combination of inputs to produce a given output. Efficiency of any production unit can be measured by comparison with this frontier.
Specific features of DEA make it applicable for efficiency analysis. DEA requires a minimal assumption for the functional specification of the underlying production technology. DEA also enables accommodation of several inputs and outputs with different units of measurement, such as physical parameters or monetary units. A priori chosen weights are not required for the aggregation of variables. DEA has also proven feasible in small sample sets. Importantly, in addition to identifying inefficient production units, DEA outlines direction for eliminating inefficiency (Rosko MD, 1990).
There are restrictions that may limit the usefulness of DEA. Unit-specific efficiency scores may be sensitive to influential observations, which can have an effect on the placement of the efficiency frontier. Particularly in small sample sizes, DEA models are sensitive to the selection and the number of variables. Too-complex models can result in misspecification of efficiency (Rosko MD, 1990; Smith P, 1997). Because DEA is a non-parametric method, it converges slowly with statistical inference and hypothesis testing.
DEA has been widely used in studies evaluating the productive or technical efficiency of hospitals (Hollingsworth B and Parkin D, 1995; Magnussen J, 1996; Hollingsworth B and Parkin D, 2003). A Finnish study applied DEA for assessing the cost efficiency of Finnish and Norwegian hospitals. Cost differences were equalized by adjusting a part of the hospital operating costs with purchasing power parities (PPP) (Linna M et al., 2006). Purchasing power parities are rates of currency conversion developed to account for cross-national variation in prices and to make them comparable (Purchasing power parity, http://ec.europa.eu/eurostat). In comparison, the exchange rate between two currencies takes into account only the ratio of the prices.
DEA has been employed recently by two U.S. studies addressing efficiency in blood centres. In one study, DEA was applied with an output orientation assuming variable returns to scale (VRS) (Pitocco C and Sexton TR, 2005). The other study explored the technical efficiency in 71 blood centres assuming DEA with an input orientation under CRS and VRS, finding that 28% of the centres were operating in the CRS region, 55% in the IRS region, and 37% in the DRS region (Pereira A, 2006).
Parametric methods and DEA
Stochastic frontier analysis (SFA) is a parametric frontier method that, like DEA, is based on relative efficiency measures and on estimates of a best practice frontier (Meeusen W and van den Broeck J, 1977). SFA defines best practices by calculating a theoretical best-practice frontier, while that of DEA is based on actual firms (production units). While DEA lacks a stochastic component by assuming that all departures

| 26 |
from the efficiency frontier are due to inefficiency, SFA allows for the separation of random errors and statistical noise from inefficiency (Rosko MD and Mutter RL, 2008). Inefficiency estimates obtained by SFA may thus be lower compared to those of DEA. The use of SFA in hospital applications has been criticized, because unlike DEA, it requires strong assumptions about the functional form (e.g., the production technology or the distribution of inefficiency). Using an incorrect functional form may confound inefficiency estimates in SFA (Newhouse JP, 1994). Compared to DEA, SFA is less sensitive to data variations (e.g., outliers) because SFA estimates are based on average parameter values in the regression equation (Jacobs R, 2001). The availability of data may also influence the choice of an appropriate method. SFA is more focused on cost inefficiency than on technical inefficiency, which is the primary focus of DEA analyses. If input price data are available, a cost-oriented SFA might be an appropriate method to evaluate the cost (in)efficiency (Kumbhakar S and Lovell C, 2000).
A stochastic frontier regression (SFR) and DEA have been applied for scoring hospital efficiency (Chirikos TN and Sear AM, 2000), and cost indicators were used in modelling. SFR and DEA suggested convergent results of efficiency at the industry level but yielded divergent evidence about characteristics of the best and worst performers. In a comparison of results obtained using DEA and parametric methods in the measurement of hospital technical efficiency, the highest correlations were found in the efficiency scores between CRS-DEA and parametric models. Correlation was higher in models with one output than in two-output models (Siciliani L, 2006).
Frontier efficiency analyses have gained widespread application in improving managerial performance and providing data for support of health policy decisions in hospitals and other health care organisations (Berger A and Humphrey D, 1997).
5.4.5 international comparison
Interest in comparing the relative performance of health systems has been growing, although international comparisons are still scarce in the literature (Mobley Lee Rivers MJ, 2006; Steinmann L et al., 2004). In performance evaluation, efficiency has been considered one of most challenging objectives of a health system, and many OECD countries are developing indicators for measuring, for example, productivity (Hurst J and Jee-Hughes M, 2001). Common performance measures would serve as indicators for efficiency benchmarking internationally.
International cost comparisons must be based on a common currency. Applying only exchange rates tends to overvalue real consumption in countries with a relatively low price level and overvalue consumption in countries with a higher price level. This outcome leads to comparisons that may confuse price differences with differences in real health expenditure. For assessing the cost efficiency of health organisations, PPP adjustment can be used for input and output prices in cross-national cost comparisons (Linna M et al., 2006).
International research on the comparability of the efficiency in blood banking has not been conducted so far.

| 27 |
6 AImS OF THE STUDy
The main aim of this study was to explore and compare retrospectively the relative technical efficiency, especially from a management (labour resources) and economic (total costs) perspective, of a number of European blood component preparation departments in three consecutive years.
The specific aims were:
Article I. To describe the preparation methods and production volumes of PLTs and the PLT discard rates in a number of European blood centres and to analyse whether preparation methods and production volumes would help to explain the possible differences in PLT discard rates.
Article II. To assess the technical efficiency of component preparation departments and to analyse factors that affect the efficiency. In this analysis, differences in the use of resources (inputs) received special emphasis. The hypothesis was that large departments could be more efficient.
Article III. To explore to what extent the discard rates of RBCs and PLTs are associated with the technical efficiency of component preparation.
Article IV. To assess the labour efficiency and the cost efficiency of component production departments and on the basis of the results estimate possible savings potential in the departments.

| 28 |
7 mATERIALS AND mETHODS
7.1 daTa sources
Ethical review was not included because only statistical data were involved. The names of the participating centres were coded to protect their anonymity.
7.1.1 participating centresOriginally, 22 blood centres were invited to participate in this study. Seventeen centres from 10 countries in continental Europe, Great Britain, and Scandinavia accepted the invitation (Appendix I, Participating centres). The centres were of different sizes in terms of the annual WB collection volumes and were integrated into university hospitals (seven blood banks), were national institutions (five national institutes), or were part of the Red Cross organisation (five blood services). All seven hospital-based blood banks and one Red Cross centre represented the Nordic countries and four Red Cross centres and all national institutes were from Central and Southern Europe. All centres were considered non-profit organisations with voluntary, non-remunerated blood donation. Both Red Cross centres and national institutes were categorized as centralized blood service systems, a specific element of which was the subject of this study.
This study focused on the component preparation departments of the centres (blood establishments, blood banks). The departments functioned as production units; they prepared and issued blood products according to demand in their service area with the exception of one centre, which supplied only part of the PLTs required in its area. Because processes of component production are similar among the centres, the preparation departments were chosen as models. Blood centres, in contrast, cannot be similarly “forced”.
7.1.2 data collection
The data were gathered from component preparation departments by standardized, structured questionnaires via the Internet for the years 2000-2002 during the period of July 2003–March 2004 (Appendix II, Data questionnaire; Appendix III, Guidance for replying). The questionnaires were managed technically by Digium Oy, Turku. To complete and clarify the data, several site visits were performed in 2002-2004. Participants were given an opportunity to comment on the questions through a draft questionnaire distributed beforehand.
The questionnaires contained 92 questions divided into seven sections: explanatory data, output data, economic data, labour input in component processing, technical data of processing PLTs, long-term capital and capital cost input, and short-term capital cost input, i.e., consumables. Response guidance was included with selected questions. A specific question concerning the proportion of discarded PLTs of all produced PLTs in 2003 and 2004 received a reply from 11 blood centres from eight countries. Because the data were obtained retrospectively, questions to monitor the reliability of answers and to promote uniform data interpretation were included, and the coherence of the answers was tested. All the data were displayed in a matrix of observations, which was evaluated regarding its completeness, and approved.

| 29 |
7.1.3 material of original articles
The number of participants in original articles varied from 13 to 17 (Table 1). The blood centres that provided the most complete data set formed the basis for the present study. Because all data were not available from all centres, the pooled sample size varied. The number of samples in each analysis is indicated in the results.
Table 1 Material of original articles
Article Number of participants
Pooled sample sizea
Reasons for exclusion from the pooled sample of 51 – missing data or year
I Variation of platelet pro-duction and discard rates in 17 blood centres repre-senting 10 European coun-tries from 2000 to 2002
17
in some analyses
51
44 Aphaeresis-PLTs of Db7 (n=3 individual years); discarded PLTs of D6 (n=3); year 2001 data of D14 (n=1)
II International comparison of the technical efficiency of component preparation
16 46 Aphaeresis-PLTs of D7 (n=3); year 2001 data of D11 and D14 (n=2)
III Discarded cellular com-ponents and the technical efficiency of component preparation
13 37 Aphaeresis-PLTs of D7 (n=3); discarded PLTs of D6 (n=3); discarded RBCs of D1 and D2 (n=6); year 2001 data of D11 and D14 (n=2)
IV Working hours and pro-duced cellular components as variables to evaluate blood bank efficiency
13
cost analysis
37
35
Aphaeresis-PLTs of D7 (n=3); discarded PLTs of D6 (n=3); discarded RBCs of D1 and D2 (n=6); year 2001 data of D11 and D14 (n=2)
Above mentioned missing data (n=14) and mean hourly earnings of year 2001 of D12 and D13 (n=2)
a The number of individual years for which data were availableb D refers to the blood component preparation department of the centre

| 30 |
Variables of the original articles are listed in Table 2. The processed blood components were assumed to meet the requirements of the Blood Directive and the Council of Europe’s “Guide to the preparation, use and quality assurance of blood components”. Regardless of production method, a PLT unit was defined as PLTs derived from one WB collection with a PLT count of greater than 60 × 109, which was also taken as a single unit equivalent (Guide, 2007).
Article I. Working hours included the hours of full-time, temporary, and part-time personnel. Produced RBCs comprised the total of leukocyte-reduced and non-filtered RBCs as single units. Produced PLTs comprised all PLTs produced by any method. Discarded PLTs comprised the total PLT loss, including those wasted in production and those that became outdated, regardless of production method. PLT production methods included the BC, PRP, and aphaeresis methods. The discard rate was calculated by dividing the number of discards by the number of produced PLTs/RBCs. The labour index was calculated by dividing the total of produced PLTs + RBCs by the number of working hours.Article II. Premises included the space (m2) that was used for preparation of blood components, aphaeresis, and the immediate office facilities. Equipment comprised the centrifuges, separators, and aphaeresis devices that were purchased or hired, including those in stock. Lead time of PLTs was the time from WB collection to a ready PLT product.
Table 2 Variables in original articles
Article Variables Described Site characteristics Analysed
I WB collectionsWorking hoursProduced RBCs and PLTsDiscarded RBCs and PLTs
PLT production methodsDiscard rates of RBCs and PLTs
Not tested Descriptive analysisLabour index
Input variables Output variables
II WB collectionsWorking hoursPremisesEquipment
Produced RBCs and PLTs (FFP)
WB resting timeProportion of leukodepleted RBCs from all RBCsProportion of BCs from WBProportion of BC-PLTs from all PLTsLead time of PLTsProportion of discarded PLTs from all PLTs
Technical efficiencyScale efficiency
III WB collectionsAphaeresis-PLTsDiscarded RBCs and PLTs
Produced RBCs and PLTs
WB collections lost
Not tested Technical efficiencyScale efficiency
IV Working hoursEstimated total costs
Produced RBCs and PLTs
Discarded RBCs and PLTsSavings potentialWaste costUnit cost
Not tested Labour efficiencyCost efficiencyScale efficiency

| 31 |
Article III. PLTs derived from aphaeresis comprised PLT units as single unit equivalent. The proportion of WB collections lost was defined as (total RBC loss + total PLT loss)/collected WB units. Article IV. Estimated total costs were calculated based on the assumption that the costs of working hours represent 20% of the total department costs. Savings potential (observed inefficiency) was the distance of achieved efficiency from the efficiency frontier (savings potential = 1.0 – efficiency score). Waste cost was the unit cost multiplied by the number of discarded RBCs and PLTs. Unit cost was the estimated total costs divided by the number of produced RBCs and PLTs.
7.2 meThods
Article I: Descriptive statistics were used to categorize the blood centres according to size and production-related characteristics, such as the PLT preparation methods, discard rate, and labour index. Articles II-IV: DEA (Farrell MJ, 1957) was used to determine an efficiency frontier and to calculate efficiency scores for the preparation departments. The non-parametric Mann-Whitney U test was used to compare groups, and simple linear regression was used to analyse the association between the descriptive data of groups and DEA efficiency models. A two-sided p value of <0.05 was deemed statistically significant. A Salter diagram was applied to illustrate the distribution of technical efficiency scores (II). Article III: The independent samples Mann-Whitney U test was used to analyse the impact of discards on the efficiency scores; the Pearson correlation coefficient was used to explore the linear association between variables (inputs and outputs in DEA models); the Tobit regression model was used to explain the variance in the efficiency scores (Tobin J, 1958; Greene WH, 1998; Wooldridge JM, 2002); the year dummies was used to demonstrate a time trend in the efficiency scores; and the Kolmogorov statistic and Shapiro-Wilk statistic were used for testing the normality of the residuals distribution.Article IV: Purchasing power parities were applied to adjust the costs for the working hours and to make them comparable between countries (Purchasing power parity, http://ec.europa.eu/eurostat). PPP of private consumption including households and non-profit institutions was selected for the present study. Calculation of the costs was based on the mean hourly health and social work earnings (class N) of each country for the years 2000, 2001, and 2002 (United Nations Statistic Division, International Standard Industrial Classification (ISIC), Economic and Social Statistical Classifications, http://unstats.un.org/unsd/class; Earnings per hour/month, http://laborsta.ilo.org).
Mean hourly earnings were adjusted with the PPP to obtain the mean cost for a working hour of each department (country). This value was then multiplied by the number of annual working hours. The following exceptions were made: (1) Mean hourly earnings from 2004 of class N were implemented because class N was not available for 2000–2002 (D9). (2) The local currencies from 2000 (D5, D16) and from 2000-2001 (D8) were first converted to euro using fixed conversion coefficients for the years. (3) Mean monthly earnings were divided by 160 to obtain the costs for the mean hourly earnings (D3, D12, D13, D14).

| 32 |
Figure 6 DEA efficiency definition with simplified production technology of one output and two inputs. The shaded area indicates all feasible combinations of inputs 1 and 2 to produce output y. All units on the efficiency frontier (southwest edge of shaded area) operate ef-ficiently by producing the same output with minimal combinations of the two in-puts. Units C and D are effi-cient and receive a technical efficiency score of 1.0. Unit A does not lie on the frontier and is technically inefficient (score is less than 1.0). The technical efficiency score for unit A was calculated by the ratio λ=OF/OA, which is directly related to unit A’s distance from the efficiency frontier. Unit A’s input vector xA can be contracted radially up to point F and still remain capable of producing output y (Linna M, 1999).
7.2.1 data envelopment analysis
DEA was employed to evaluate the efficiency of the component preparation departments (Farrell MJ, 1957; Charnes A et al., 1978). Linear programming techniques were used to estimate the efficiency frontier and to calculate the unit-specific efficiency scores for each department. The departments lying on the frontier received a score of 1.0 (100% efficiency). Less-efficient departments received a score lower than 1.0 but higher than 0. For example, if a department’s efficiency score was 0.80, its inefficiency was 20%, and it could use 20% less of input resources to produce the same output. In the present study, the departments that received a score lower than 0.90 were rated as technically inefficient (II, III). In measures of labour efficiency and cost efficiency (IV), scores lower than 1.0 indicated inefficiency. An example of the DEA technical efficiency definition is given in Figure 6.
DEA enables calculation of the efficiency scores under various assumptions of scale economies. Comparing the individual efficiency scores by CRS and VRS, it is possible to determine whether a production unit is situated in the region of IRS, DRS, or CRS and make inferences about the benefits of down- or upsizing its production. In the present study, the efficiency scores were calculated from two alternative assumptions, CRS (CRS-DEA) and VRS (VRS-DEA, II) (Table 3).
The purpose of the analysis affects the choice of orientation in DEA. An input orientation aims at recognizing the potential reductions in the input while keeping the output constant. An output orientation aims at recognizing the potential increases in the output while keeping the input constant. Blood centres are usually required to
F
o
Xd
inp
uT
X2
W’Xc
c
a
xa
d
λaXa
e
inpuT X1
f

| 33 |
meet the hospital demand in their service area, that is, to scale the product volumes (output) according to the estimated demand. They can more freely adjust the use of resources (input) needed for the production. Thus, the analysis was focused on the efficiency with the minimum amount of inputs required to produce a given output (input orientation).
Estimation of the cost differences of RBC/PLT preparation was one of the goals of this study. Because market prices (output prices) for blood products are not available, DEA cost efficiency was used as an approximation.
7.2.2 dea models
Variables for the DEA models were selected based on the aim to illustrate the efficiency (technical, labour, cost) in relation to component production. Several different models were created and tested. In article II, four DEA models were tested. Two of the models, DEA 3 and DEA 4, were selected for further analysis. Models DEA 1 and DEA 2 did not reveal differences between the departments. In the DEA model in article III, discarded RBCs and PLTs were technically treated as inputs, although they are conceptually considered a negative output of production. Article IV included an empirical cost model, DEA/Ct, in which the estimated total costs of component preparation were chosen as the input variable. DEA/Wh (working hours) was applied for the relative labour efficiency. Selected DEA models are shown in Table 3.
Table 3 Models of DEA used in the comparative analyses
Article Model Input Output Pooled sample sizea Assumption
I DEA 1 Working hours, premises, WB collections RBCs, PLTs 46 CRSb
DEA 2 Working hours, WB collections RBCs, PLTs 46 CRS
DEA 3 Working hours, equipment RBCs, PLTs 46 CRS, VRSc
DEA 4 Working hours, equipment, WB collections
RBCs, PLTs 46 CRS, VRS
III DEA WB collections, aphaeresis-PLTs, discarded RBCs and PLTs
RBCs, PLTs 37 CRS
IV DEA/Wh Working hours RBCs, PLTs 37 CRS
DEA/Ctd Estimated total costs RBCs, PLTs 35 CRS
a The number of individual years for which data were availableb CRS, constant returns to scalec VRS, variable returns to scaled Ct, cost total

| 34 |
8 RESULTS
8.1 plaTeleT producTion (i)
8.1.1 production volumes and methods (i)
The number of annual WB collections varied from 8,880 to 290,352 in the centres. The total annual number of WB collected by the centres decreased slightly over the study period. The hospital-based centres were significantly smaller than the other centres (median 38,000 and 99,407, respectively, p<0.0001, Mann-Whitney U test).
The number of produced RBCs and the total number of PLTs produced by any method varied greatly among the centres (Figure 7A, B). In 2002, 73% of all PLTs were produced by the BC method, 23% by aphaeresis, and 4% by the PRP method. The total number of PLTs produced increased by 5.6% and that of RBCs remained the same from 2000 to 2002.
The mean proportion of WB donations used for preparation of BC-PLTs was 35% in 2000 (min 8, max 55%), rising to 41% in 2002 (min 8, max 64%; Figure 8). BC-PLTs were prepared in 15 of 17 blood centres.
All centres also collected PLTs by aphaeresis, and two centres collected all PLTs by this method. The proportion of PLTs produced by the BC method from all PLTs varied from 36% to 99%, and that of aphaeresis-derived PLTs from 1.1% to 100% between the centres. The amount of PRP-PLTs prepared in one centre decreased over time.
8.1.2 discard rates of plTs and rbcs (i, iii)
The proportion of discarded PLTs from all PLTs produced varied widely (the annual PLT discard rate was from 3.9% to 31%; Figure 7B). The mean annual PLT discard rate (13%) remained in the same range (15% in 2000 and 12% in 2002) in all centres, including the four centres reporting prolonged shelf lives (6-7 days instead of 5 days) throughout the study period. In all, discard rates demonstrated similar levels and variation between centres in 2003 to 2004 (2-year mean 14%, range 3.8%-24%, n=11), as in 2000 to 2002. Because the discards were given by the centres as the total loss of PLTs regardless of production method, the causes leading to discards could not be further evaluated.
The annual PLT discard rates were, to some extent, associated with production volumes (r=0.35, p=0.03, n=37, DEA). This association could not be demonstrated statistically in study I using the three-year mean values in the analysis. The mean RBC discard rate was 4.5%, varying annually from 0.2% to 7.7% (Figure 7A). Annual RBC discard rates demonstrated a similar association with production volumes (r=0.38, p=0.02, n=37, DEA). No other reasons were identified for the discard rates of each centre.
No significant correlation was found between the RBC and PLT discard rates (r=-0.16, p=0.35, n=37), although a close linear relationship of RBCs to the production volume of PLTs was observed (r=0.95, II).

| 35 |
Figure 7 Production volumes (bars) and discard rates (diamonds) of RBCs (A) and of PLTs (B) in the participating centres. Some data were missing (D1, D2, RBC discards; D6, PLT discards; D7, aphaeresis-PLTs; D11, D14, year 2001).
35
d3 d4 d5 d8 d9 d10 d11 d12 d16d15d13 d17d14
Produced PLTs, units
30
25
20
15
10
5
0
120 000
100 000
80 000
60 000
40 000
0
20 000
Discarded PLTs, %
9
d3 d4 d5 d8 d9 d10 d11 d12 d16d15d13 d17d14
Produced RBCs, units
8
7
6
5
4
3
2
1
0
300 000
250 000
200 000
150 000
100 000
0
50 000
Discarded RBCs, %a
b

| 36 |
Figure 8 Proportion of WB collections used for preparation of BC-PLTs in the centres during the three study years. Dark bars indicate the number of WB collections, light bars the number of BCs. Diamonds indicate the proportion BC-PLTs produced from WB collections. Data for the year 2001 were missing (D14). Two centres (D3 and D13) prepared all PLTs by aphaeresis.
70
d1 d2 d4 d5 d6 d7 d8 d9 d14d12d10 d17d11
WB Collections
60
50
40
30
20
10
0
300 000
250 000
200 000
150 000
100 000
0
50 000
Proportion of BCs from WB collections, %
d15 d16
8.2 Technical efficiency (ii)
Moderate differences were shown in technical efficiency (median score 0.92, range 0.72-1.0, n=46) among departments, when WB collections, working hours, and equipment were used as inputs and the produced RBCs and PLTs as outputs (DEA 4). Removing the non-substitutable input, WB, from the model revealed marked variation in efficiency (DEA 3, median 0.60, range 0.41-1.0, n=46). Twelve of sixteen departments were labelled inefficient because their annual efficiency scores were less than 0.90 in all study years. This outcome suggests that there was an excess use of labour resources (working hours) and/or production equipment in the inefficient departments. Compared with the efficient departments, they used more hours per WB collection to produce the RBCs and PLTs. Only four departments, all from different countries, were technically efficient in both DEA 3 and DEA 4.
Technical efficiency decreased in the observation period in three departments in DEA 3. In the two small departments, the efficiency decreased from 1.0 to 0.54 and from 0.88 to 0.68, respectively. In both cases, this decrease could be explained by an increase both in the working hours (124% and 20%, respectively) and in the amount of equipment (140% and 29%, respectively) as the departments started developing their PLT production methods and enhanced PLT volumes by 20% and

| 37 |
11%, respectively. In the third department, which implemented new programs in the component preparation, the number of produced RBCs and PLTs declined by 4.6% and 7.8%, respectively, and the number of working hours increased by 22%. Although these three departments performed inefficiently in DEA 3, they were rated efficient based on DEA 4. Technical efficiency remained essentially at the same level in 13 departments through the study years.
Assuming VRS, the technical efficiency remained at the same level in 11 departments compared to the results of CRS.
Technical efficiency could not be explained by site characteristics derived from production-related technology, such as resting time of WB, proportion of leukocyte-reduced RBCs from all RBCs, proportion of BCs from WB, proportion of BC-PLTs from all PLTs produced, lead time of PLTs, or proportion of discarded PLTs from all PLTs.
8.2.1 Discard rate and technical efficiency (III)
Technical efficiency scores varied from 0.82 to 1.0, when the WB collections, aphaeresis-PLTs, and discarded RBCs and PLTs (negative output) were in the analysis as inputs (DEA). The produced RBCs and PLTs were outputs. More than half (51%) of departments achieved the highest efficiency (score 1.0). Efficiency was lowest in two departments (score 0.82 both) throughout the study period. In the most inefficient department, the mean annual PLT discard rate was 22%. It was a large centre, annually collecting more than 250,000 WB units and deriving 39% of all PLTs from aphaeresis. In the other department, the annual PLT discard rate varied from 12% to 29%. It collected about 30,000 WB units per year and derived all PLTs from aphaeresis.
There was a tendency for technical efficiency to be higher when the (theoretical) proportion of lost WB donations (total RBC+PLT loss) from all collections was low (Mann-Whitney U test).
Waste cost (IV) The median waste cost incurred by the discarded RBCs and PLTs was higher in the four largest departments (median 9.4%, range 5.6%-11.3%, n=12) than in all the other (smaller) departments (median 6.6%, range 3.4%-12.4%, n=23, p=0.004, Mann-Whitney U test).
8.3 labour efficiency and cosT efficiency (i, iV)
Labour efficiency (DEA/Wh) varied significantly, from 0.25 to 1.0 (median score 0.47), when working hours were used as the input. With the estimated total costs as the input (DEA/Ct), the variation of efficiency was even greater, from 0.13 to 1.0 (median 0.25). Cost efficiency demonstrated lower scores compared to labour efficiency in most departments. A “sensitivity analysis” performed with a higher proportion of labour from the estimated total costs did not demonstrate changes in the order of departments, which is in line with the basic assumption of DEA.
The labour index (mean 4.2 units per hour, min 2.4, max 7.3, n=15, data from D7 and 14 were missing) was not associated with the total number of produced RBCs and PLTs, the proportion of leukocyte-reduced RBCs, the PLT preparation method, or the proportion of discarded PLTs.

| 38 |
As expected, the correlation was strong (r=0.94, p<0.0001, n=37) between labour efficiency and labour index. A marked correlation also existed between cost efficiency and labour index (r=0.55, p=0.0007, n=35).
The two most labour-efficient departments were both hospital-based blood banks, in which the annual efficiency scores varied from 0.79 to 1.0 and the produced RBCs and PLTs from 25,104 to 106,340 units. One of these two departments was also one of the most cost-efficient departments, in which scores varied between 0.66 and 0.71, even if these are fairly low in absolute terms. Another department received an efficiency score of 1.0 in the first year, but its efficiency decreased to 0.45 during the three study years. This decrease could be due to technological changes made in the production of blood components.
Efficiency of component preparation departments was analysed using several DEA models, which included various inputs or input combinations. Changing input variables also changed the outcome, as expected (Figure 9). Additionally, over time, changes in efficiency could be observed in departments during the three-year study period.
figure 9 Efficiency scores for departments obtained using DEA models in 2002 (bars). Not all data were available from all centres. The bars indicate models (with different inputs): white=DEA 3 (working hours, equipment), light grey=DEA 4 (working hours, equipment, WB collections), darker grey=DEA (WB collections, aphaeresis-PLTs, discarded RBCs and PLTs), gradient = DEA/Wh (working hours), and black=DEA/Ct (estimated total costs). White circles indicate the number of produced RBCs and PLTs in 2002. Departments are ranked from left to right by the amount of production (smallest-largest).
0.00
0.10
0.20
0.30
0.40
0.50
0.60
1.00
0.90
0.80
0.70
0
100 000
150 000
200 000
250 000
300 000
350 000
400 000
d2 d12 d14 d13 d4 d1 d6 d10 d8 d17d16d15 d11 d9 d5 d3
Efficiency scores DEA3 DEA4 DEA DEA/Wh DEA/Ct Produced RBCs and PLTs

| 39 |
8.3.1 savings potential (iV)
In six of the thirteen departments, the savings potential, both in labour and costs, was more than 50% in all study years. When evaluated using the estimated total costs (DEA/Ct), 10 departments had a savings potential of more than 50%. The savings potential was similar in both analyses. Theoretically, this implies an annual savings potential of more than two million euros in several inefficient departments. No association was observed between savings potential and the number of WB collections. 8.3.2 unit cost (iV)
A unit cost was obtained by dividing the estimated total costs by the number of produced RBCs and PLTs. The unit cost varied widely (median 17.00 €, range 3.40 €-32.60 €, n=35) and did not depend on production volume.
8.4 scale efficiency (ii-iV)
There was little indication of scale economies in the technical efficiency of larger preparation departments (processing more than 60,000 WB units per year). They had consistently an efficiency score over 0.85 (median 0.96, range 0.87–1.0, n=20, DEA 4). On the other hand, there were efficient and inefficient departments among those processing fewer than 60,000 WB units (median 0.91, range 0.72–1.00, n=26). The difference between the efficiency scores of the two groups was not significant (p=0.19).
The scale advantage disappeared when labour efficiency and cost efficiency were assessed. No link between scale efficiency and low discard rate was observed.

| 40 |
9 DISCUSSION AND CONCLUSIONS
Along with the abating resources and increasing expenses of the blood system, enhancing efficiency has become a necessary challenge in blood banking (Pereira A, 2007). The focus of studies has been in national evaluations, only a few of which have contained efficiency analyses (Pitocco C and Sexton TR, 2005; Pereira A, 2006; Bell AM et al., 2008). These analyses revealed that the relative technical and operational efficiency could be markedly improved in the inefficient centres. The present study was designed to evaluate the relative efficiency of blood component preparation in European blood centres. Interest in benchmarking blood bank activities internationally has increased recently. As an example, a joint conference was arranged between the European Blood Alliance (EBA) and America’s Blood Centers (ABC) (MacPherson J, 2007). The outcome of the conference suggested a need for improving the co-operation and the efficiency of the logistic chain between blood centres and hospitals. Efficiency comparisons, even cross-national, have been published in other health care fields (Steinmann L et al., 2004; Linna M et al., 2006), but international analyses that benchmark performance in blood banking have not been reported previously.
The approach of the present study was multidisciplinary, involving elements from medical, technical, and economic perspectives. The technical, labour, and cost efficiency analysis addressed the blood component production subject to the highest medical safety requirements (Blood Directive; Guide). DEA was considered an appropriate method because it could be applied for a small sample size and allowed description of inputs and outputs in different physical units. The inputs and outputs were selected to illustrate the production factors within the limits of data. Complete data from three consecutive years were available from most of the centres. Analytical models were created that may be used to compare several aspects of blood component production, even internationally.
Outdating and timely provisions of blood components
Efforts to create a safer blood supply continue to result in the development of new technologies (Allain JP et al., 2005). Blood components can be distributed only after release from infectious testing. As a consequence, components are held a longer time in storage, which may contribute to outdating of PLTs. Outdated PLTs may represent as much as a fifth part of all produced PLTs (Sullivan MT and Wallace EL, 2005). Because the outdated components should be considered a lost resource, the extension of the shelf life of cellular components and efficient management of the blood supply chain are the targets of extensive research.
The aim of establishing an efficient blood supply and component preparation is to ensure the timely availability of blood products. Although the number of products prepared for security stock was included in the production volumes, their relative proportion from all prepared products may have varied according to the obligations set for maintenance of the stock. The present study does not, however, take a stance on whether the production departments, efficient or not, were able to respond in a timely way to the demand for blood products.

| 41 |
Efficiency analysis
Technical efficiency varied widely among the component preparation departments. The efficiency was not associated significantly with site characteristics, such as WB resting time, proportion of filtered RBCs from all RBCs, proportion of BCs from WB, proportion of BC-PLTs from all PLTs produced, or proportion of PLT discards from all PLTs. Heterogeneity of blood centres (size, production volume, administrative structure) may have distorted the efficiency frontier (Pitocco C and Sexton TR, 2005).
There was a tendency for the largest departments to be technically more efficient, when the working hours, the equipment, and the WB collections were used as inputs (DEA 4, II). When the inputs were replaced by the WB collections, aphaeresis-PLTs, and aggregated discarded RBCs and PLTs, the scale advantage disappeared (DEA, III). Neither were the higher labour efficiency scores associated with larger production volumes (DEA/Wh). A similar result was obtained in a recent comparative labour productivity analysis, which evaluated the efficiency of total collections (WB+aphaeresis) per employee in eight blood centres (Bell AM et al., 2008). Although conclusions about scale efficiency are controversial in blood banking (Pierskalla WP et al., 1987; Pitocco C and Sexton TR, 2005; Pereira A, 2006), increasing the sample size or redesigning the input/output combinations may demonstrate clear economies of scale.
The labour efficiency was evaluated by the number of working hours. It was assumed that the working hours were addressed correctly to the component preparation departments. The hours may, however, contain some uncertainty owing to differences in the allocation of resources for overlapping positions. Because the data on total production volumes were available, it was possible to calculate the number of units (RBCs+PLTs) produced per hour (labour index). When the labour efficiency was assessed by DEA (DEA/Wh), the RBCs and PLTs were treated as two outputs. The results were similar to those obtained using the simple labour index. The efficiency varied greatly among the departments. In comparison with the technical efficiency, the variation was wider and the level was lower in the labour efficiency. This variation may be due to different variables in DEA. In DEA, the departments are rated according to their relative performance. Because the outliers affect the rating in small samples, there may have been such an effect in the DEA scoring.
The cost efficiency of component preparation was assessed using an empirical cost model in which the estimated total costs of component preparation were used as an input. The total costs were approximated by the aid of the data on working hours (Pereira A, 2007). International comparisons that contain cost data must be based on a common currency. PPP incorporates the currency conversion rates to account for price differences, considering a basket of goods and calculating the price (output price) of this basket in each country using local currency. In the present study, the PPP-adjusted mean costs of working hours (input price) were used to compare the cost differences among countries.
The analysis revealed a substantial variation in cost efficiency. The efficiency levels were in general lower than those in technical efficiency. The technically efficient departments were thus not necessarily cost efficient. The observed inefficiency identified remarkable savings potential in 10 departments. This kind of benchmarking may provide an approximation for blood establishments of lost resources in relation to the other participants. It was also possible to calculate
| 42 |
the cost for the proportion of discarded PLTs and RBCs (waste cost) and further evaluate the unit costs. The costs per blood unit varied widely with a median cost of 17.00 €. A Canadian study evaluated the mean cost of processing a blood unit at 16.65 USD (6% of transfusion costs) (Amin M et al., 2004). In the present study, the experimental analysis was interesting because blood products are included in hospitals’ prices for disease-related groups.
Real cost efficiency was not the aim of the present study. Measuring cost efficiency requires specification of an economic objective and data on market prices. Statistical data on costs, including salaries, are scarce, even nationally. The hours were purely physical items that did not include, for example, costs of overtime or working on Sundays. Labour is considered a cost-driver, and many activities are labour intensive, requiring qualified employees to ensure the supply of blood under stochastic demand. Lack of relevant comparable cost data has prevented blood establishments from being able to identify sources of inefficiency.
Methodological aspects
In health care, questionnaires have been generally used to collect information for epidemiological purposes and for various registries. Questionnaires are quick and cost effective, but disadvantages include the risk that respondents misinterpret questions or answer superficially, particularly where multiple languages are common. A similar risk is caused by the lack of uniform terminology. Current computer systems would allow replacement of questionnaires by real-time, Web-based data collection. The contents of data fields should be prospectively defined to ensure commensurability. The data would thus be transferred directly via an interface to a research coordinator, enabling on-line analysis of coordinated data.
DEA measures relative efficiency within the sample. If the department with the highest efficiency score (1.0) were tested in another sample (or by other variables), it might perform less efficiently. A small sample size would be a problem if other methods were used. DEA is, however, less sensitive to a small sample size. The size variation of the departments was unexpectedly wide, which could have weakened the relative performance of smaller departments in the sample. Physical variables were applicable in DEA analysis of technical efficiency, whereas more uncertainty was associated with the cost analysis. Because monetary data were not available publicly from all centres, the total costs were estimated using PPP-adjusted costs for the working hours. The PPP-adjustment was assumed to improve the comparability, although the cost estimates would still contain some inaccuracy (Linna M et al., 2006).
Study limitations
Product-mix could be one site characteristic affecting efficiency. To simplify the models, the sums of RBCs and PLTs, respectively, were used as variables, although some centres may have had considerable amounts of different products.
When the FFP was included as one of the outputs in the analysis of technical efficiency (DEA 3, DEA 4) the main results did not change. One large department received a lower efficiency score in DEA 4, and another small hospital blood bank achieved higher technical efficiency. FFP was not included in the cost efficiency analysis as an output, although it may have affected the result (Zingsem J et al., 2002).

| 43 |
Conclusions
Both ethical and economic reasons advocate for more profound research in the future. The present study evaluated data from European blood centres (years 2000-2002; specific additional question for 2003-2004). The results demonstrated remarkable inefficiencies and lost outputs. The results, however, are retrospective and should be re-evaluated in a prospective setting.
Because obtaining the data was complex, synchronized, real-time data should be made available. These data are needed, for example, for terminology so that the studies can allow online analysis and active management improvement. The present study provided applicable DEA models for the blood bank community. Because discarded cellular blood components can be considered a lost production output, they require excess labour resources. Although some amount of discards is unavoidable, what an acceptable amount is remains to be identified.
Although the collection of WB was dictated by the demand for RBCs, it was interesting to note a close association of the number of produced RBCs to the production volume of PLTs. This association suggested a similar demand ratio for RBCs and PLTs in the service areas of the blood centres.
Labour and supplies are the main cost-drivers in blood centres, and labour is subject to efficiency improvements because labour inefficiency is found to be a major cause of technical inefficiency. By reallocating excess labour resources, blood centres may reduce the inefficiency observed in the benchmarking. Considerable waste cost was observed in this novel approach to studying efficiency, and the lost production output (discarded blood components) thus should not be ignored.

| 44 |
10 ACKNOWLEDGEMENTS
This work was performed at the Finnish Red Cross Blood Service in Helsinki. Financial support from a Finnish Red Cross Blood Service EVO grant, the Yrjö Jahnsson Foundation, and the University of Helsinki are warmly acknowledged.
I’m grateful to Docent Jukka Rautonen, Director of the Institute, for contributing to the start of the study, and for providing me with inspiring working facilities for so many years. I thank Professor Juhani Leikola, the former Director, for valuable advice and for sharing with me his wide international network of blood service contacts.
Professor Jukka Koistinen is acknowledged for placing at my disposal his experience and large knowledge of blood service systems worldwide as I initiated this work. I appreciate his polite but determined way of pushing me forward.
I express my deep gratitude to my supervisor, Docent Riitta Kekomäki, for her decisive guidance through this study. I was impressed by her profound knowledge of platelets and blood banking, her innovative and creative mind, and her dogged perseverance that helped me to find answers to the right questions. Her ability to focus on the essential and her foresight made this research exciting and enjoyable.
Professor Harri Sintonen, my second supervisor, is thanked for his constructive criticism and useful comments. His outstanding expertise in health economics and methodology significantly improved the quality of this study.
I thank Professor Heikki Loikkanen and Docent Seppo Pakkala for reviewing this thesis, for their accurate comments, and for interesting discussions.
I’m indebted to my co-authors, Pekka Aroviita, MD, PhD, and Docent Miika Linna, for their invaluable contribution to this work. I thank Miika for lending his vast expertise on methods of efficiency and productivity analysis to this study. My heartfelt thanks and sincere admiration go to Pekka for spending numerous hours of his time helping me analyse the data and in processing all those ideas that occurred during our four common study years.
It was a great opportunity to be able to perform the work and accomplish this study at the Finnish Red Cross Blood Service. I thank my colleagues there for assisting in data collection and for sharing their knowledge and experience of the blood service field with me. I warmly thank Marja-Leena Hyvönen, MA, and Mrs. Maija Ekholm for their professional help in providing me with library services.
The participation of the 17 blood services or blood banks from Austria, Belgium, Denmark, Finland, Norway, Portugal, Sweden, Switzerland, the Netherlands and the United Kingdom made this work possible. I extend my cordial thanks to the participants and individual colleagues for their contributions in providing me with the original data and for their kind assistance and continuous interest in this study.
Finally, I thank Markku for his intellectual support and incisive comments on the manuscripts. He is also gratefully appreciated for being the hunter and gatherer and for assuring regular meals accompanied by unparalleled culinary experience.
This thesis is dedicated to my children, Panu, Pekka, and Lauri, my daughter-in-law, Saara, and my little twin grandchildren, Selja and Otso. Their existence was the guiding spirit of my work.
Kirkkonummi, September 2008

| 45 |
AuBuchon JP, Petz LD, Fink A, ed. Policy alternatives in transfusion medicine. Bethesda: AABB Press; 2001.
Allain JP, Bianco C, Blajchman MA, Brecher ME, Busch M, Leiby D, Lin L, Stramer S. Protecting the blood supply from emerging pathogens: the role of pathogen inactivation. Transfus Med Rev 2005;19(2):110-26.
Amin M, Fergusson D, Wilson K, Tinmouth A, Aziz A, Coyle D, Hebert P. The societal unit cost of allogenic red blood cells and red blood cell transfusion in Canada. Transfusion 2004;44(10):1479-86.
Arslan O, Toprak S, Arat M, Kayalak Y. Hb content-based transfusion policy successfully reduces the number of RBC units transfused. Transfusion 2004;44(4):485-8.
AuBuchon JP, Dumont LJ, Herschel L, Roger J, Beddard RL, Taylor HL, Whitley PH, Sawyer SL, Graminske S, Martinson K, Dora R, Heldke S, Adamson J, Rose LE. Automated collection of double red blood cell units with a variable-volume separation chamber. Transfusion 2007.
Bell AM, Kemp JD, Raife TJ. A comparative labor productivity analysis of blood collection centers. Transfusion 2008;48(2):258-63.
Berger A, Humphrey D. Efficiency of financial institutions: International survey and directions for future research. European Journal of Operational Research 1997;98:175-212.
Bjorkgren MA, Hakkinen U, Linna M. Measuring efficiency of long-term care units in Finland. Health Care Manag Sci 2001;4(3):193-200.
Blajchman MA, Goldman M, Baeza F. Improving the bacteriological safety of platelet transfusions. Transfusion Medicine Reviews 2004;18(1):11-24.
Blood transfusion. URL: http://www.who.int/topics/blood_transfusion/en (accessed January 2008).
Booth T, Hayward MM, Brewer MD, Priday C, Trenchard PM. Preparation of platelet concentrates after overnight hold at 20 degrees C. Blood Coagul Fibrinolysis 1992;3(5):621-3.
Brecher ME, Hay SN. Improving platelet safety: bacterial contamination of platelets. Curr Hematol Rep 2004;3(2):121-7.
Brittenham GM, Klein HG, Kushner JP, Ajioka RS. Preserving the national blood supply. Hematology Am Soc Hematol Educ Program 2001;422-32.
Butch SH. Modifying blood bank processes for efficiency and effectiveness: a case study. Clin Lab Sci 1998;11(2):114-21.
Capraro L, Kuitunen A, Vento AE, Suojaranta-Ylinen R, Kolho E, Pettila V. Universal leukocyte reduction of transfused red cells does not provide benefit to patients undergoing cardiac surgery. J Cardiothorac Vasc Anesth 2007;21(2):232-6.
Capraro L, Syrjala M. Advances in cardiac surgical transfusion practices during the 1990s in a Finnish university hospital. Vox Sang 2001;81(3):176-9.
Chapman J. Unlocking the essentials of effective blood inventory management. Transfusion 2007;47(2 Suppl):190S-6S.
11 REFERENCES

| 46 |
Charnes A, Cooper WW, Rhodes E. Measuring the efficiency of decision making units. European Journal of Operational Research 1978;(2):429-44.
Chirikos TN, Sear AM. Measuring hospital efficiency: a comparison of two approaches. Health Serv Res 2000;34(6):1389-408.
Clark JA, Ayoub MM. Blood and component wastage report. A quality assurance function of the hospital transfusion committee. Transfusion 1989;29(2):139-42.
Cobain TJ. Fresh blood product manufacture, issue, and use: a chain of diminishing returns? Transfus Med Rev 2004;18(4):279-92.
Cobain TJ, Vamvakas EC, Wells A, Titlestad K. A survey of the demographics of blood use. Transfus Med 2007;17(1):1-15.
Critchfield GC, Connelly DP, Ziehwein MS, Olesen LS, Nelson CE, Scott EP. Automatic prediction of platelet utilization by time series analysis in a large tertiary care hospital. Am J Clin Pathol 1985;84(5):627-31.
Crowell JW, Smith EE. Determinant of the optimal hematocrit. J Appl Physiol 1967;22(3):501-4.
Currie CJ, Patel TC, McEwan P, Dixon S. Evaluation of the future supply and demand for blood products in the United Kingdom National Health Service. Transfus Med 2004;14(1):19-24.
Custer B, Johnson ES, Sullivan SD, Hazlet TK, Ramsey SD, Murphy EL, Busch MP. Community blood supply model: development of a new model to assess the safety, sufficiency, and cost of the blood supply. Med Decis Making 2005;25(5):571-82.
Devine P, Goldstein R, Linden JV, Postoway N, Hoffstadter LK, Hines DM. Data on apheresis, blood collection, and transfusion-related activities: statistical analyses of the American Association of Blood Banks institutional membership questionnaires. Transfusion 1996;36(4):375-81.
Earnings per hour/month. URL: http://laborsta.ilo.org (accessed February 2007).
Eriksson L, Hogman CF. Platelet concentrates in an additive solution prepared from pooled buffy coats. 1. In vitro studies. Vox Sang 1990;59(3):140-5.
European Commission (2004) Directive 2002/98/EC of the European Parliament and of the Council of 27 January 2003 setting standards of quality and safety for the collection, testing, processing, storage and distribution of human blood and blood components and amending Directive 2001/83/EC. Official Journal of the European Union L 033, 08/02/2003 P. 0030-0040. Brussels: European Commission; 2004. URL: http://europa.eu.int/comm/health/horiz_legal.htm#32.
European Health Committee (CDSP). URL: http://www.coe.int/t/dg3/health/CDSP_en.asp (accessed January 2008).
Farrell MJ. The measurement of productive efficiency. J R Stat Soc A 1957;120(III):253-90.
Ferrier G, Valdmanis V. Rural Hospital Performance and Its Correlates. The Journal of Productivity Analysis 1996;7:63-80.
Finnish Red Cross Blood Service. Annual Report. 2006.
Gilcher RO. It’s time to end RBC shortages. Transfusion 2003;43(12):1658-60.
Goldman M, Fournier E, Cameron-Choi K, Steed T. Effect of changing the age criteria for blood donors. Vox Sang 2007;92(4):368-72.
Goodnough LT, Shander A, Brecher ME. Transfusion medicine: looking to the future. Lancet 2003;361(9352):161-9.

| 47 |
Gorham M. Blood center and hospital partnerships that increase transfusion safety and value: a European perspective. Transfusion 2007;47 (2Suppl):106S-8S.
Greene WH. LIMDEP Version 7.0, User’s Manual, Revised Edition. Econometric Software Inc., 1998.
Grosskopf S, Valdmanis V. Measuring hospital performance. A non-parametric approach. J Health Econ 1987;6(2):89-107.
Guest JF, Munro V, Cookson RF. The annual cost of blood transfusions in the United Kingdom. Clin Lab Haematol 1998;20(2):111-8.
Guide to the preparation, use and quality assurance of blood components, Recommendation No. R (95) 15. 13th ed. Strasbourg: Council of Europe Publishing; 2007.
Gulliksson H, AuBuchon JP, Vesterinen M, Sandgren P, Larsson S, Pickard CA, Herschel I, Roger J, Tracy JE, Langweiler M. Storage of platelets in additive solutions: a pilot in vitro study of the effects of potassium and magnesium. Vox Sang 2002;82(3):131-6.
Heaton WA, Rebulla P, Pappalettera M, Dzik WH. A comparative analysis of different methods for routine blood component preparation. Transfusion Medicine Reviews 1997;11(2):116-29.
Hoffmeister KM, Josefsson EC, Isaac NA, Clausen H, Hartwig JH, Stossel TP. Glycosylation restores survival of chilled blood platelets. Science 2003;301(5639):1531-4.
Hogman CF, Eriksson L, Hedlund K, Wallvik J. The bottom and top system: a new technique for blood component preparation and storage. Vox Sang 1988;55(4):211-7.
Hollingsworth B, Parkin D. The efficiency of Scottish acute hospitals: an application of data envelopment analysis. IMA J Math Appl Med Biol 1995;12(3-4):161-73.
Hollingsworth B, Parkin D. Efficiency and productivity change in the English National Health Service: can data envelopment analysis provide a robust and useful measure? J Health Serv Res Policy 2003;8(4):230-6.
Hurst J, Jee-Hughes M. Performance Measurement and Performance Management in OECD Health Systems. URL: http://www.olis.oecd.org/OLIS/2000DOC.NSF/LINKTO/DEELSA-ELSA-WD(2000)8. Occasional papers 2001;(47).
Jacobs P, Turner AR, Kopetsky D. Joint costs in health care: application to blood component production. J Ambul Care Manage 1992;15(1):48-55.
Jacobs R. Alternative methods to examine hospital efficiency: data envelopment analysis and stochastic frontier analysis. Health Care Manag Sci 2001;4(2):103-15.
Katz AJ, Carter CW, Saxton P, Blutt J, Kakaiya RM. Simulation analysis of platelet production and inventory management. Vox Sang 1983;44(1):31-6.
Koopmans T. Activity analysis of production and allocation. New York: Wiley; 1951.
Kumbhakar S, Lovell C. Stochastic frontier analysis. Cambridge: Cambridge University Press; 2000.
Kytola L, Nuutinen L, Myllyla G. Transfusion policies in coronary artery bypass: a nationwide survey in Finland. Acta Anaesthesiol Scand 1998;42(2):178-83.
Laine J, Finne-Soveri UH, Bjorkgren M, Linna M, Noro A, Hakkinen U. The association between quality of care and technical efficiency in long-term care. Int J Qual Health Care 2005;17(3):259-67.

| 48 |
Lam HC, Kominski GF, Petz LD, Sofaer S. Factors affecting the labor efficiency of hospital-based blood bank laboratories. Transfusion 1994;34(9):811-7.
Larsson S, Sandgren P, Sjodin A, Vesterinen M, Gulliksson H. Automated preparation of platelet concentrates from pooled buffy coats: in vitro studies and experiences with the OrbiSac system. Transfusion 2005;45(5):743-51.
Ledman RE, Groh N. Platelet production planning to ensure availability while minimizing outdating. Transfusion 1984;24(6):532-3.
Leikola J. Pieni vaiva, hyvä mieli. Suomen Punainen Risti, Veripalvelu. Helsinki 2004.
Lieberman JA, Weiskopf RB, Kelley SD, Feiner J, Noorani M, Leung J, Toy P, Viele M. Critical oxygen delivery in conscious humans is less than 7.3 ml O2 x kg(-1) x min(-1). Anesthesiology 2000;92(2):407-13.
Linna M. Measuring hospital performance: the productivity, efficiency and costs of teaching and research in Finnish hospitals. Academic dissertation, Helsinki University of Technology; 1999.
Linna M, Häkkinen U. Determinants of cost efficiency of Finnish hospitals: A comparison of DEA and SFA. Systems Analysis Laboratory Research Reports A78. Helsinki University of Technology; 1999.
Linna M, Hakkinen U, Magnussen J. Comparing hospital cost efficiency between Norway and Finland. Health Policy 2006;77(3):268-78.
MacPherson J. The Role of Blood Centers in Transfusion, Recipient Care Second Joint Conference of America’s Blood Centers and the European Blood Alliance. Transfusion 2007;47(2S).
Magnussen J. Efficiency measurement and the operationalization of hospital production. Health Serv Res 1996;31(1):21-37.
Meeusen W, van den Broeck J. Efficiency estimation from Cobb-Douglas production functions with composed error. International Economic Review 1977;18:435-44.
Mobley Lee Rivers MJ. An international comparison of hospital efficiency: does institutional environment matter? Applied Economics 2006;30(Number 8/August 8, 1998):1089-100.
Murphy S. Platelets from pooled buffy coats: an update. Transfusion 2005;45(4):634-9.
Murphy S, Heaton WA, Rebulla P. Platelet production in the Old World - and the New. Transfusion 1996;36(8):751-4.
Newhouse JP. Frontier estimation: how useful a tool for health economics? J Health Econ 1994;13(3):317-22.
Nightingale S, Wanamaker V, Silverman B, McCurdy P, McMurtry L, Quarles P, Sandler SG, Triulzi D, Whitsett C, Hillyer C, McCarthy L, Goldfinger D, Satcher D. Use of sentinel sites for daily monitoring of the US blood supply. Transfusion 2003;43(3):364-72.
Novis DA, Renner S, Friedberg RC, Walsh MK, Saladino AJ. Quality indicators of fresh frozen plasma and platelet utilization. Arch Pathol Lab Med 2002;126(5):527-32.
Nydegger UE, Schneider P. Production of platelet concentrates in Switzerland. Transfus Sci 1997;18(1):19-20.
OECD. URL: www.oecd.org (accessed March 2008).

| 49 |
Oksanen K. Leukocyte-depleted blood components in hematologic malignancies. Academic dissertation, Helsinki University; 1994.
Palo R, Ali-Melkkilä T, Hanhela R, Krusius T, Leppänen E, Mahlamäki E, Perhoniemi V, Rajamäki A, Rautonen J, Räsänen A, Salmenperä M, Savolainen E-R, Sjövall S, Syrjälä M, Tienhaara A, Tolppanen E-M, Vähämurto M, Mäki T. Verenkäyttö vertailussa - VOK-hanke, Verivalmisteiden optimaalinen käyttö. Suomen Lääkärilehti 2005;60(17):1981-5.
Parkin D, Hollingsworth B. Measuring production efficiency of acute hospitals in Scotland, 1991-94: validity issues in data envelopment analysis. Applied Economics 1997;29(11):1425-33.
Pereira A. Determinants of costs in blood services: blood transfusion from an economic perspective. Pharmacoeconomics Outcomes Research 2002;2(3):201-10.
Pereira A. Blood inventory management in the type and screen era. Vox Sang 2005;89(4):245-50.
Pereira A. Economies of scale in blood banking: a study based on data envelopment analysis. Vox Sang 2006;90(4):308-15.
Pereira A. The economics of blood transfusion in the 21st century. ISBT Science Series 2007;2(1):184-8.
Pierskalla WP, Cohen M, Sassetti Ret al. Economies of scale in blood banking. In: Clark G, ed. Competition in Blood Services. Arlington: AABB Press; 1987:25-39.
Pietersz RN, Reesink HW, Dekker WJ, Fijen FJ. Preparation of leukocyte-poor platelet concentrates from buffy coats. I. Special inserts for centrifuge cups. Vox Sang 1987;53(4):203-7.
Pink J, Thomson A, Wylie B. Inventory management in Sydney Public Hospital Blood Banks. Transfusion Medicine 1994;4(3):237-42.
Pitocco C, Sexton TR. Alleviating blood shortages in a resource-constrained environment. Transfusion 2005;45(7):1118-26.
Prins HK, de Bruijin JC, Henrichs HP, Loos JA. Prevention of microaggregate formation by removal of buffy-coats. Vox Sang 1980;39:48-51.
Pruss A, Kalus U, Radtke H, Koscielny J, Baumann-Baretti B, Balzer D, Dorner T, Salama A, Kiesewetter H. Universal leukodepletion of blood components results in a significant reduction of febrile non-hemolytic but not allergic transfusion reactions. Transfus Apher Sci 2004;30(1):41-6.
Purchasing power parity. URL: http://ec.europa.eu/eurostat (accessed February 2007).
Rao MP, Boralessa H, Morgan C, Soni N, Goldhill DR, Brett SJ, Boralessa H, Contreras M. Blood component use in critically ill patients. Anaesthesia 2002;57(6):530-4.
Rautonen J. Redesigning supply chain management together with the hospitals. Transfusion 2007;47(2 Suppl):197S-200S.
Reynolds E, Wickenden C, Oliver A. The impact of improved safety on maintaining a sufficient blood supply. Transfus Clin Biol 2001;8(3):235-9.
Riggert J, Schwartz DW, Wieding JU, Mayr WR, Kohler M. Prestorage inline filtration of whole blood for obtaining white cell-reduced blood components. Transfusion 1997;37(10):1039-44.
Rosko MD. Measuring technical efficiency in health care organizations. J Med Syst 1990;14(5):307-22.

| 50 |
Rosko MD, Mutter RL. Stochastic frontier analysis of hospital inefficiency: a review of empirical issues and an assessment of robustness. Med Care Res Rev 2008;65(2):131-66.
SANGUIS. Use of blood products for elective surgery in 43 European hospitals. The Sanguis Study Group. Transfus Med 1994;4(4):251-68.
Siciliani L. Estimating technical efficiency in the hospital sector with panel data: a comparison of parametric and non-parametric techniques. Appl Health Econ Health Policy 2006;5(2):99-116.
Simon TL. Platelet transfusion therapy. In: Rossi EC, Simon TL, Moss GS, ed. Principles of transfusion medicine. Baltimore: Williams & Wilkins; 1991:219-22.
Sintonen H, Pekurinen M. Terveydenhuollon elementit. In: Terveystaloustiede. Porvoo: WSOY; 2006:52-6.
Sirelson V, Brodheim E. A computer planning model for blood platelet production and distribution. Comput Methods Programs Biomed 1991;35(4):279-91.
Slichter SJ. Platelet transfusion therapy. Hematol Oncol Clin North Am 2007;21(4):697-729, vii.
Slichter SJ, Harker LA. Preparation and storage of platelet concentrates. I. Factors influencing the harvest of viable platelets from whole blood. Br J Haematol 1976;34(3):395-402.
Sloand EM, Yu M, Klein HG. Comparison of random-donor platelet concentrates prepared from whole blood units and platelets prepared from single-donor apheresis collections. Transfusion 1996;36(11-12):955-9.
Smet M. Measuring performance in the presence of stochastic demand for hospital services: an analysis of Belgian general care hospitals. Journal of Productivity Analysis 2007;27:13-29.
Smith P. Model misspecification in Data Envelopment Analysis. Annals of Operations Research 1997;73:233-52.
Smith JW, Forsberg JE, Gilcher RO. Innovations in blood donor screening and blood collection. Curr Hematol Rep 2002;1(2):129-33.
Snyder EL, Elfath MD, Taylor H, Rugg N, Greenwalt TJ, Baril L, Whitley P, Brantigan B, Story K. Collection of two units of leukoreduced RBCs from a single donation with a portable multiple-component collection system. Transfusion 2003;43(12):1695-705.
Steinmann L, Dittrich G, Karmann A, Zweifel P. Measuring and comparing the (in)efficiency of German and Swiss hospitals. Eur J Health Econ 2004;5(3):216-26.
Sullivan MT, Cotten R, Read EJ, Wallace EL. Blood collection and transfusion in the United States in 2001. Transfusion 2007;47(3):385-94.
Sullivan MT, Wallace EL. Blood collection and transfusion in the United States in 1999. Transfusion 2005;45(2):141-8.
Tobin J. Estimation of relationships for limited dependent variables. Econometrica 1958;26:24-36.
Tretiak R, Laupacis A, Riviere M, McKerracher K, Souetre E. Cost of allogeneic and autologous blood transfusion in Canada. Canadian Cost of Transfusion Study Group. CMAJ 1996;154(10):1501-8.
Uhlmann EJ, Isgriggs E, Wallhermfechtel M, Goodnough LT. Prestorage universal WBC reduction of RBC units does not affect the incidence of transfusion reactions. Transfusion 2001;41(8):997-1000.

| 51 |
United Nations Statistic Division, International Standard Industrial Classification (ISIC), Economic and Social Statistical Classifications. URL: http://unstats.un.org/unsd/class (accessed February 2007).
Vamvakas EC, Taswell HF. Mortality after blood transfusion. Transfus Med Rev 1994;8(4):267-80.
van Delden CJ, de Wit HJ, Sibinga CT. Comparison of blood component preparation systems based on buffy coat removal: component specifications, efficiency, and process costs. Transfusion 1998;38(9):860-6.
van der Pol M, Cairns J, Galea G. The efficient organization of blood donation: what determines the number of donors and donations? Transfus Med 2000;10(1):5-11.
van der Pol MM, Cairns JA. The efficient organization of blood donation. Health Econ 1998;7(5):455-63.
van Rhenen DJ, Vermeij J, de Voogt J, Bernes JC, Payrat JM. Quality and standardization in blood component preparation with an automated blood processing technique. Transfusion Medicine 1998;8(4):319-24.
Varney SJ, Guest JF. The annual cost of blood transfusions in the UK. Transfus Med 2003;13(4):205-18.
Vassallo RR, Murphy S. A critical comparison of platelet preparation methods. Curr Opin Hematol 2006;13(5):323-30.
Vassallo RR, Jr., Wahab F, Giordano K, Murphy S. Improving technology for collecting platelets by apheresis: five-year experience in one blood center. Transfusion Medicine Reviews 2004;18(4):257-66.
Vincent JL, Baron JF, Reinhart K, Gattinoni L, Thijs L, Webb A, Meier-Hellmann A, Nollet G, Peres-Bota D. Anemia and blood transfusion in critically ill patients. JAMA 2002;288(12):1499-507.
Wallace EL. Monitoring the nation’s blood supply. Transfusion 2003;43(3):299-301.
Walter C, Murphy W. A closed gravity technique for the preservation of whole blood in ACD solution utilizing plastic equipment. Surg Gynecol Obstet 1952;94(6):687-92.
Waxman DA. Volunteer donor apheresis. Ther Apher 2002;6(1):77-81.
Weiskopf RB, Viele MK, Feiner J, Kelley S, Lieberman J, Noorani M, Leung JM, Fisher DM, Murray WR, Toy P, Moore MA. Human cardiovascular and metabolic response to acute, severe isovolemic anemia. JAMA 1998;279(3):217-21.
Wells AW, Mounter PJ, Chapman CE, Stainsby D, Wallis JP. Where does blood go? Prospective observational study of red cell transfusion in north England. BMJ 2002;325(7368):803.
Wooldridge JM. Corner solution outcomes and censored regression models. In: Econometric analysis of cross section and panel data. Cambridge, Massachusetts: The MIT Press; 2002.
Zingsem J, Weisbach V, Zimmermann R, Glaser A, Bunkens H, Eckstein R. Preparation of FFP as a by-product of plateletpheresis. Transfusion 2002;42(1):81-6.

| 52 |

| 53 |
12 AppENDICES

| 54 |

| 55 |
AppENDIX I
The following centres participated in the study. I sincerely thank my colleagues for their contribution in providing me with the original data:
Blood Transfusion Centre, Aarhus University Hospital, Skejby, Denmark (N Grunnet, MD, PhD; B Samuelsen, MD)
Austrian Red Cross Blood Transfusion Services, Vienna, Austria (E Menichetti, MD, PhD; M Winter, MD)
Blood Bank, Haukeland University Hospital, Bergen, Norway (T Hervig, MD, PhD)
Blood Bank, Huddinge University Hospital, Stockholm, Sweden (A Shanwell, MD, PhD)
Blood Bank of Oslo, Ullevaal University Hospital, Oslo, Norway (HE Heier, MD, PhD, MHA; S Hvitsand, MSc)
Blood Bank of the City of Copenhagen, Copenhagen, Denmark (P Johansson, MD, MPA)
Blood Bank, University Hospital, Tromsoe, Norway (A Husebekk, MD, PhD; BH Johnsen, MD)
Blood Transfusion Centre Antwerpen, Antwerpen, Belgium (M Baeten, MD)
Blood Transfusion Service, Swiss Red Cross, Aarau, Switzerland (R Schwabe, PhD; J Burger, MD)
Blood Transfusion Service, Swiss Red Cross, Vaud, Switzerland (R Schwabe, PhD; D-H Vu, MD)
Finnish Red Cross Blood Service, Helsinki, Finland (A Hemminki, PhD)
Funen Transfusion Service, Odense, Denmark (J Georgsen, MD; K Titlestad, MD, PhD)
National Blood Service, NHS, Birmingham, the United Kingdom (V Sydenham, ACMA)
Northern Ireland Blood Transfusion Service, NHS, Belfast, the United Kingdom (WM McClelland, MB FRCPath)
Portuguese Blood Institute, Lisbon, Portugal (VMC Marques, Hospital Administrator)
Sanquin Blood Supply Foundation, Amsterdam, the Netherlands (E Jansen, GHM)
Welsh Blood Service, NHS, Pontyclun, the United Kingdom (J Lewis, Acting Finance Manager)

| 56 |
Status of Blood Service 1. 1 = Red Cross 2 = National (foundation etc) 3 = Hospital basedName and location of Blood Centre2. Number of whole blood donations3. Number of donations by Apheresis4. Number of HLA- and HPA-typed platelet units produced by 5. Apheresis upon requestVolume of whole blood collected at a donation (ml)6. What determined total number of whole blood units to be 7. collected annually?Use of platelets per 1 000 inhabitants in the country 8. (unit = platelets of one donation)Were platelets collected from both new and known donors? 9. 1 = Known 2 = BothIs there a policy to give platelets of patients’ own blood group 10. only? 1 = Yes 2 = No 3 = VariesWhat proportion of the provided platelets were ABO and RhD 11. -identical? Give a rough estimation in percentage.
2000 2001 2002
5/Efficiency Study 22 July 2003 Data Questionnaire
Costs and efficiency of processing platelet concentrates. Comparative study of three common methods: buffy coat, platelet-rich plasma and apheresis
Abbreviations: BC = buffy coat, PRP = platelet-rich plasma FFP = fresh-frozen plasma
OUTPUT DATA 2000 2001 2002
Methods of platelet preparation, please mark (1 = In use) 12. BC ................................................................................. Aprehesis ........................................................................ PRP ................................................................................Total number of platelet units (as single units incl. special 13. products) processed by BC methodTotal number of platelet units (as single units incl. special 14. products) processed by ApheresisTotal number of platelet units (as single units incl. special 15. products) processed by PRP methodTotal number of all discarded platelet units (as single units)16. Number of platelet units discarded due to outdating (as 17. single units)Number of produced leucocyte- 18. depleted adult platelet concentrates (as single units incl. spe-cial products) by production method BC ................................................................................. Aprehesis ........................................................................ PRP ................................................................................Number of produced leucocyte-depleted paediatric platelet 19. concentrates (as single units incl. special products) by pro-duction method BC ................................................................................. Aprehesis ........................................................................ PRP ................................................................................
EXPLANATORY DATA
AppENDIX II

| 57 |
Number of produced (non-filtered) adult red cell concentrates20. Number of produced leucocyte-depleted (filtered) adult red 21. cell concentratesNumber of produced paediatric (non-filtered) red cell con-22. centratesNumber of produced paediatric leucocyte-depleted (filtered) 23. red cell concentratesTotal number of all discarded red cell concentrates24. Number of red cell concentrates discarded due to outdating25. Average unit volume and number of produced adult FFP units 26. by production method Whole blood (unit volume, ml) .......................................... Apheresis (unit volume, ml) ............................................. Whole blood .................................................................... Aprehesis ........................................................................Average unit volume and number of produced paediatric FFP 27. units by production method Whole blood (unit volume, ml) .......................................... Apheresis (unit volume, ml) ............................................. Whole blood .................................................................... Aprehesis ........................................................................Definition of the main platelet product28. Number of produced main platelet products 29. Pools of 1 units ................................................................ Pools of 2 units ................................................................ Pools of 3 units ................................................................ Pools of 4 units ................................................................ Pools of 5 units ................................................................ Pools of 6 units ................................................................Number of discarded main platelet products 30. (incl. outdated platelets) Pools of 1 units ................................................................ Pools of 2 units ................................................................ Pools of 3 units ................................................................ Pools of 4 units ................................................................ Pools of 5 units ................................................................ Pools of 6 units ................................................................
2000 2001 2002OUTPUT DATA
2000 2001 2002ECONOMIC DATA
Number of adult platelet concentrates delivered to hospitals 31. (as single units incl. special products)Number of paediatric platelet concentrates delivered to hospi-32. tals (as single units incl. special products)Sales (invoiced, EUR) of adult platelet concentrates (incl. 33. special products)Sales (invoiced, EUR) of paediatric platelet concentrates (incl. 34. special products)Number of leucocyte-depleted (filtered) adult red cell units 35. delivered to hospitalsNumber of leucocyte-depleted (filtered) paediatric red cell 36. units delivered to hospitalsNumber of non-filtered adult red cell units delivered to 37. hospitalsNumber of non-filtered paediatric red cell units delivered to 38. hospitalsSales (invoiced, EUR) of leucocyte-depleted (filtered) adult 39. red cellsSales (invoiced, EUR) of leucocyte-depleted (filtered) 40. paediatric red cellsSales (invoiced, EUR) of non-filtered adult red cells41. Sales (invoiced, EUR) of non-filtered paediatric red cells42. Number of adult FFP units delivered to hospitals, by 43. production method Whole blood .................................................................... Aprehesis...................................... ..................................

| 58 |
Number of paediatric FFP units delivered to hospitals, by 44. production method Whole blood .................................................................... Aprehesis ........................................................................Sales (invoiced, EUR) of adult FFP units, by production method 45. Whole blood .................................................................... Aprehesis ........................................................................Sales (invoiced, EUR) of paediatric FFP units, by production 46. method Whole blood .................................................................... Aprehesis ........................................................................Total sales of all blood products produced in the centre (EUR) 47. (excl. plasma for fractionation and plasma derived products)
2000 2001 2002ECONOMIC DATA
2000 2001 2002LABOUR INPUT IN COMPONENT PROCESSING
Please categorise the employees into two groups according to 48. their position: I Leading position ........................................................... (supervisors, dep. heads, chiefs) II Operational position ...................................................... (all other staff, nurses, lab. workers, technicians etc)Please estimate the number of employees in permanent 49. positions, per yearPlease estimate the number of employees in temporary or 50. part-time positions, per yearNumber of theoretical working hours of the employees in 51. permanent positions, per yearNumber of theoretical working hours of the employees in 52. temporary, part-time or other short-term positions, per yearTotal number of absence hours, per year53. Total of taxable salaries (EUR), per year54. Additional salary expenses (EUR), per year55.
2000 2001 2002TEChNICAL DATA OF PROCESSING PLATELETS
Mean recovery of platelets per unit 56. (Council of Europe Guide PC > 60 x 109/single unit equivalent)Recovery of platelets per leucocyte-depleted platelet unit57. Mean residual leucocyte count per leucocyte-depleted platelet 58. unit (Council of Europe Guide < 0.2 x 10⁶/unit)Average lead-time of processing platelets (h)59. Was whole blood stored (“resting”) before first 60. centrifugation? If yes, for how long (h)?Number of bags in centrifuge at a time61. Were pools stored (“resting”) before adding storage solution? 62. If yes, for how long (h)?Pooling of 1, 2, 3, 4, 5 or 6 units. Please mark the number.63. Pooling of platelets (1 = In use) 64. of same ABO blood group .................................................. selected blood groups..................... .................................. any blood groups .............................................................Average volume of platelet concentrate (pool or single, 65. please specify) (ml) Pools of 1 units Pools of 2 units Pools of 3 units Pools of 4 units Pools of 5 units Pools of 6 unitsSize of ordinary adult therapeutic dose of platelets in hospital66. Was integrated storage bag/platelet filter system used for 67. platelets? 1 = Yes 2 = No

| 59 |
Was plasma used as preserve solution for platelets? (1 = In use) 68. BC ................................................................................. Aprehesis ........................................................................ PRP ................................................................................Was pathogen inactivation used and if yes, since when? Mark 69. the year 1 = Yes 2 = NoWas bacterial culture used and if yes, for the process control only 70. or as criterion to release the products for use? 1 = Yes 2 = No Process control ................................................................ As criterion to release .......................................................Shelf-life of platelet concentrates and time when 71. calculation starts
2000 2001 2002TEChNICAL DATA OF PROCESSING PLATELETS
Area of premises in m72. 2 used for component processing Average market value of own premises per m2 (EUR) 73. Current price (rent) per m74. 2
Number of all centrifuges in blood component processing75. Please estimate the number of centrifuges in regular use76. Please give an estimation of the average age (in years) of the 77. centrifuges in regular useNumber of all separation devices in blood component 78. processingPlease estimate the number of separation devices in regular use79. Please give an estimation of the average age (in years) of the 80. separation devices in regular useNumber of all Apheresis devices in blood component 81. processingPlease estimate the number of Apheresis devices in regular use82. Please give an estimation of the average age (in years) of the 83. Apheresis devices in regular use
2000 2001 2002Long-tErm CapitaL anD CapitaL Cost input
2000 2001 2002short-tErm CapitaL Cost input ConsumabLEs
Total purchase cost (EUR) of the bags and bag systems used 84. for whole blood collection in the centre, per year a) with leucocyte removal filter for red cells......................... b) without leucocyte removal filter for red cells .................... c) with leucocyte removal filter for whole blood ....................Please guesstimate, which proportion (in percentage) of the 85. bags expressed in question 84 was used for processing of platelets, per yearTotal purchase cost (EUR) of the stand-alone leucocyte 86. removal filters for red cells, per yearTotal purchase cost (EUR) of the stand-alone leucocyte removal 87. filters for platelet concentrates, per yearTotal purchase cost (EUR) of the stand-alone storage bags for 88. platelets, per yearTotal purchase cost (EUR) of the integrated storage bag/89. leucocyte removal filters for platelet concentrates, per yearTotal purchase cost (EUR) of storage (preserve) solutions for 90. platelets, per yearTotal purchase cost (EUR) of sterile connections for 91. processing platelets, per yeara) What proportion (in percentage) of platelets were cultured 92. to detect bacterial contamination? b) Please estimate the total cost (EUR) of culturing, per year
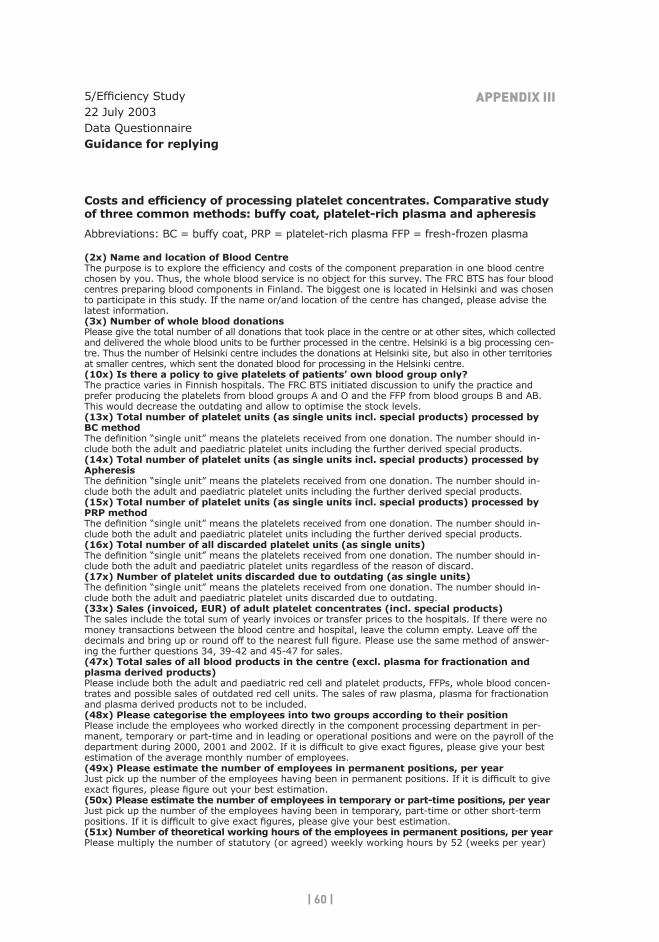
| 60 |
(2x) Name and location of Blood CentreThe purpose is to explore the efficiency and costs of the component preparation in one blood centre chosen by you. Thus, the whole blood service is no object for this survey. The FRC BTS has four blood centres preparing blood components in Finland. The biggest one is located in Helsinki and was chosen to participate in this study. If the name or/and location of the centre has changed, please advise the latest information. (3x) Number of whole blood donationsPlease give the total number of all donations that took place in the centre or at other sites, which collected and delivered the whole blood units to be further processed in the centre. Helsinki is a big processing cen-tre. Thus the number of Helsinki centre includes the donations at Helsinki site, but also in other territories at smaller centres, which sent the donated blood for processing in the Helsinki centre.(10x) is there a policy to give platelets of patients’ own blood group only?The practice varies in Finnish hospitals. The FRC BTS initiated discussion to unify the practice and prefer producing the platelets from blood groups A and O and the FFP from blood groups B and AB. This would decrease the outdating and allow to optimise the stock levels.(13x) total number of platelet units (as single units incl. special products) processed by BC methodThe definition “single unit” means the platelets received from one donation. The number should in-clude both the adult and paediatric platelet units including the further derived special products. (14x) total number of platelet units (as single units incl. special products) processed by ApheresisThe definition “single unit” means the platelets received from one donation. The number should in-clude both the adult and paediatric platelet units including the further derived special products.(15x) total number of platelet units (as single units incl. special products) processed by PRP methodThe definition “single unit” means the platelets received from one donation. The number should in-clude both the adult and paediatric platelet units including the further derived special products.(16x) Total number of all discarded platelet units (as single units)The definition “single unit” means the platelets received from one donation. The number should in-clude both the adult and paediatric platelet units regardless of the reason of discard.(17x) Number of platelet units discarded due to outdating (as single units)The definition “single unit” means the platelets received from one donation. The number should in-clude both the adult and paediatric platelet units discarded due to outdating.(33x) sales (invoiced, Eur) of adult platelet concentrates (incl. special products)The sales include the total sum of yearly invoices or transfer prices to the hospitals. If there were no money transactions between the blood centre and hospital, leave the column empty. Leave off the decimals and bring up or round off to the nearest full figure. Please use the same method of answer-ing the further questions 34, 39-42 and 45-47 for sales.(47x) total sales of all blood products in the centre (excl. plasma for fractionation and plasma derived products)Please include both the adult and paediatric red cell and platelet products, FFPs, whole blood concen-trates and possible sales of outdated red cell units. The sales of raw plasma, plasma for fractionation and plasma derived products not to be included.(48x) please categorise the employees into two groups according to their positionPlease include the employees who worked directly in the component processing department in per-manent, temporary or part-time and in leading or operational positions and were on the payroll of the department during 2000, 2001 and 2002. If it is difficult to give exact figures, please give your best estimation of the average monthly number of employees. (49x) please estimate the number of employees in permanent positions, per yearJust pick up the number of the employees having been in permanent positions. If it is difficult to give exact figures, please figure out your best estimation. (50x) please estimate the number of employees in temporary or part-time positions, per yearJust pick up the number of the employees having been in temporary, part-time or other short-term positions. If it is difficult to give exact figures, please give your best estimation.(51x) number of theoretical working hours of the employees in permanent positions, per yearPlease multiply the number of statutory (or agreed) weekly working hours by 52 (weeks per year)
5/Efficiency Study 22 July 2003 Data Questionnaire guidance for replying
Costs and efficiency of processing platelet concentrates. Comparative study of three common methods: buffy coat, platelet-rich plasma and apheresis
Abbreviations: BC = buffy coat, PRP = platelet-rich plasma FFP = fresh-frozen plasma
AppENDIX III

| 61 |
and by the number of permanent employees. Example from the FRC BTS: 38,15 h x 52 x 47 = 93 239 h. Additionally: 30,00 h x 52 x 5 = 7 800 h and total 101 039 h. Leave off the decimals and bring up or round off to the nearest full figure. If it is difficult to give exact figures, please give your best estimation.(52x) number of theoretical working hours of the employees in temporary, part-time or other short-term positions, per year Please calculate or give your best estimation on the agreed working hours of temporary, part-time or other short-term employees per each year.(53x) total number of absence hours, per yearIn order to calculate the effective working hours, all the absence hours should be included. The ab-sence hours consist of the statutory vacations and other absences by any reason. Please include the yearly absence hours of both permanent and temporary, part-time or other short-term employees. Please calculate or give your best estimation. (54x) total of taxable salaries (Eur), per yearPlease include the taxable salaries of all employees having been on the payroll of the blood process-ing department. Do not include the additional salary expenses paid by the employer.(55x) additional salary expenses (Eur), per yearThe purpose is to calculate the total of additional salary expenses that the blood centre was obliged to pay in connection with monthly salaries. In the FRC BTS the additional salary expenses are called as social payments representing about 24-26% of the taxable salary. The social payment consists of the social security fee, employee pension fee and the accident insurance. (59x) average lead-time of processing the plateletsThe time starts from the moment of collecting the blood and ends when the platelet bag is in the “swingboard” in the guarantee or delivery store of the blood centre or hospital. Give your best esti-mation for the average lead-time. (72x) Area of premises in m2 used for component processingInclude the premises normally used for processing, but also those being in reserve but not used regu-larly. Include the storage and office premises, which are used by the employees of the component preparation. Do not include the premises for plasma fractionation. (73x) average market value of own premises per m2 (Eur)In case the processing premises are of your own property, please estimate their current market value per m2. The current market value indicates the value of the premises, if they were sold out on the free market. (75x) Number of all centrifuges in blood component processingInclude the total number of centrifuges located in the component preparation department regardless of their purpose of use. (76x) Please estimate the number of centrifuges in regular useInclude all centrifuges regularly used in the component preparation regardless of their purpose of use. (77x) please give an estimation for the average age (in years) of the centrifuges in regular useExample: 10 centrifuges purchased in 1992 and 4 in 1996. 10 x 9 (years 1992-2000) and 4 x 5 (1996-2000) makes 110 years. 110 divided by 14 (nr of centrifuges) gives the average age of 7,9 years. You can also give your best estimation. (78x) number of all separation devices in blood component processingInclude the total number of separation devices located in the component preparation department regardless of their purpose of use.(79x) please estimate the number of separation devices in regular useInclude all separation devices regularly used in the component preparation department regardless of their purpose of use.(80x) please give an estimation for the average age (in years) of the separation devices in regular usePlease calculate according to the example of the question 77 or give your best estimation.(81x) number of all apheresis devices in blood component processingInclude the total number of Apheresis devices used in the component preparation department regard-less of their purpose of use.(82x) please estimate the number of apheresis devices in regular use Include all Apheresis devices regularly used in the component preparation department regardless of their purpose of use.(83x) please give an estimation for the average age (in years) of the apheresis devices in regular usePlease calculate according to the example of the question 77 or give your best estimation.(84x) total purchase cost (Eur) of the bags and bag systems used for whole blood collec-tion in the centre, per yearPurchase contracts are often done for more than one year. The deliveries take place and are invoiced several times during the year. The purchase costs consist of the sum of the invoices paid during the year in question. Please mark the sum on the column of each year and mark with “0” (zero) to indi-cate the year with no purchases. Use the same method of answering all further questions 86-91 for purchase costs.(92bx) please estimate the total cost (Eur) of culturing, per yearInclude the costs, if the culturing was performed as a criterion to release the platelet products for use or as a routine/occasional follow-up and control procedure.

| 62 |

| 63 |
13 ORIGINAL ARTICLES

| 64 |