technical performance evaluation for phase i of the c-400 ... · remedial project manager ... c-400...
TRANSCRIPT

Mr. Wm. Turpin Ballard Remedial Project Manager
Department of Energy
Portsmouth/Paducah Project Office 1017 Majestic Drive, Suite 200
lexington, Kentucky 40513 (859) 219-4000
AUG 23 2011
U.S. Environmental Protection Agency, Region 4 61 Forsyth Street Atlanta, Georgia 30303
Mr. Edward Winner, FF A Manager Kentucky Department for Environmental Protection Division of Waste Management 200 Fair Oaks Lane, 2nd Floor Frankfort, Kentucky 40601
Dear Mr. Ballard and Mr. Winner:
PPPO-02-1222665-11 B
TRANSMITTAL OF THE TECHNICAL PERFORMANCE EVALUATION FOR THE C-400 INTERIM REMEDIAL ACTION AT THE PADUCAH GASEOUS DIFFUSION PLANT, PADUCAH, KENTUCKY (DOEILx/07-1260&Dl)
Please find enclosed the certified Dl Technical Performance Evaluationfor the C-400 Interim Remedial Action at the Paducah Gaseous Diffusion Plant, Paducah, Kentucky, DOE/LXl07-1260&Dl.
If you have any questions or require additional information, please contact Dave Dollins at (270) 441-6819.
Enclosure:
einhard Knerr Paducah Site Lead Portsmouth/Paducah Project Office
Technical Performance Evaluation for the C-400 Interim Remedial Action

Mr. Ballard and Mr. Winner
e-copy w/enclosure: [email protected], LAT AlKevil [email protected], EP AI Atlanta [email protected], LAT AlKevil [email protected], LA T AlKevil [email protected], LA T AlKevil [email protected], LA T A/Kevil [email protected], PPPOIP AD [email protected], KDEP/Frankfort [email protected], KDEP/PAD [email protected], LA T AlKevil [email protected], KDEPlFrankfort [email protected], KDEP/Frankfort [email protected], SST/Kevil [email protected], LAT AlKevil [email protected], PPPO/PAD [email protected], PPPO/P AD [email protected], KDEP/Frankfort [email protected], EP AI Atlanta
2 PPPO-02-1222665-11 B

DOE/LX/07-1260&D1 Secondary Document
Technical Performance Evaluation for Phase I of the C-400 Interim Remedial Action
at the Paducah Gaseous Diffusion Plant, Paducah, Kentucky
CLEARED FOR PUBLIC RELEASE


20110821 C-400 Technical Performance Evaluation IRA D1 400
DOE/LX/07-1260&D1 Secondary Document
Technical Performance Evaluation for Phase I of the C-400 Interim Remedial Action
at the Paducah Gaseous Diffusion Plant, Paducah, Kentucky
Date Issued—August 2011
Prepared for the U.S. DEPARTMENT OF ENERGY
Office of Environmental Management
Prepared by LATA ENVIRONMENTAL SERVICES OF KENTUCKY, LLC
managing the Environmental Remediation Activities at the
Paducah Gaseous Diffusion Plant under contract DE-AC30-10CC40020
CLEARED FOR PUBLIC RELEASE

THIS PAGE INTENTIONALLY LEFT BLANK

iii
CONTENTS
FIGURES ...................................................................................................................................................... v
TABLES ..................................................................................................................................................... vii
ACRONYMS ............................................................................................................................................... ix
EXECUTIVE SUMMARY ......................................................................................................................... xi
1. INTRODUCTION .................................................................................................................................. 1 1.1 OBJECTIVES ............................................................................................................................. 1 1.2 ORGANIZATION ...................................................................................................................... 2
2. BACKGROUND INFORMATION ....................................................................................................... 3 2.1 HISTORY ................................................................................................................................... 3 2.2 PHASE I OBJECTIVES ............................................................................................................. 5 2.3 SOURCES OF INFORMATION ................................................................................................ 7
3. PHASE I PERFORMANCE................................................................................................................... 9 3.1 CONTAMINANT REMOVAL .................................................................................................. 9
3.1.1 Interim RAOs .................................................................................................................. 9 3.1.2 Soil Sample Results ......................................................................................................... 9 3.1.3 Groundwater Sample Results ........................................................................................ 12
3.2 HEATING PERFORMANCE .................................................................................................. 20 3.2.1 Target Temperatures ...................................................................................................... 20 3.2.2 Temperature Monitoring ................................................................................................ 27 3.2.3 East Treatment Area Heating Performance ................................................................... 27 3.2.4 Southwest Treatment Area Heating Performance ......................................................... 33
3.3 VAPOR AND GROUNDWATER EXTRACTION PERFORMANCE .................................. 37 3.3.1 Vapor Extraction ............................................................................................................ 37 3.3.2 Groundwater Extraction ................................................................................................ 44
3.4 INSTALLATION AND OPERATIONS .................................................................................. 49 3.4.1 Installation ..................................................................................................................... 49 3.4.2 Operations ...................................................................................................................... 54
4. PRELIMINARY DESIGN CONSIDERATIONS ................................................................................ 57 4.1 ELECTRICAL RESISTANCE HEATING ............................................................................. 57
4.1.1 UCRS Heating ............................................................................................................... 57 4.1.2 RGA Heating ................................................................................................................. 57 4.1.3 Groundwater Velocity, Soil Resistivity, and Groundwater Conductivity ..................... 57 4.1.4 Phase II Preliminary Design Simulation for ERH in the RGA ...................................... 59
4.2 CONTAMINANT RECOVERY .............................................................................................. 65 4.3 ENHANCEMENTS TO WELL FIELD PIPING SYSTEM AND THE SVGTS ..................... 66
5. CONCLUSIONS AND RECOMMENDATIONS ............................................................................... 67
6. REFERENCES ..................................................................................................................................... 71 APPENDIX A: NUMERICAL SIMULATION STUDY OF IN SITU HEATING WITH
GROUNDWATER FLOW IN THE RGA UNIT .......................................................... A-1

iv
APPENDIX B: INDEPENDENT TECHNICAL REVIEW TEAM REPORT OF PHASE I
PERFORMANCE ........................................................................................................... B-1 APPENDIX C: TEMPERATURE DATA PLOTS FOR ALL DIGITAM™ LOCATIONS ................... C-1

v
FIGURES
1. Location of C-400 ............................................................................................................................... 4 2. C-400 Treatment Areas ....................................................................................................................... 6 3. East Area Soil Sample Locations and Preliminary Results ............................................................... 13 4. Southwest Area Soil Sample Locations and Preliminary Results ..................................................... 17 5. East Area Groundwater Sample Locations and Preliminary Results ................................................ 19 6. Baseline, Operational, and Preliminary Postoperational Trichloroethene Groundwater Data
East Area ........................................................................................................................................... 21 7. Southwest Area Groundwater Sample Locations and Preliminary Results ...................................... 23 8. Baseline, Operational, and Preliminary Postoperational Trichloroethene Groundwater Data
Southwest Area, 65 ft bgs ................................................................................................................. 24 9. Baseline, Operational, and Preliminary Postoperational Trichloroethene Groundwater Data
Southwest Area, 75 ft bgs ................................................................................................................. 25 10. Baseline, Operational, and Preliminary Postoperational Trichloroethene Groundwater Data
Southwest Area, 100 ft bgs ............................................................................................................... 26 11. Boiling Temperature Versus Depth................................................................................................... 28 12. East Area Average Daily digiTAM™ D44 Readings, 18-62 ft bgs .................................................. 29 13. East Area Average Daily digiTAM™ D43 Readings, 18-62 ft bgs .................................................. 30 14. East Area Average Daily digiTAM™ D46 Readings, 18-62 ft bgs .................................................. 31 15. East Area Average Daily digiTAM™ D44 Readings, RGA 62-71 ft bgs ........................................ 32 16. Southwest Area Average Daily digiTAM™ D07 Readings, UCRS 18-62 ft bgs ............................. 34 17. Southwest Area Average Daily digiTAM™ D07 Readings, 62-100 ft bgs ...................................... 35 18. Vapor Extraction Well ...................................................................................................................... 37 19. East Area Header Average Photoacoustic Readings ......................................................................... 41 20. East Area Average Extraction Well Photoacoustic Readings ........................................................... 42 21. East Area Average Extraction Well Photoacoustic Readings August to December 2010 ................ 43 22. Southwest Area Header Average Photoacoustic Readings ............................................................... 45 23. Southwest Area Average Extraction Well Photoacoustic Readings ................................................. 46 24. Southwest Area Average Extraction Well Photoacoustic Readings August to December
2010 ................................................................................................................................................... 47 25. Sediment in the Vapor Extraction Header ......................................................................................... 49 26. Groundwater/Vapor Treatment System Equipment Layout .............................................................. 51 27. Picture of Groundwater/Vapor Treatment System Area ................................................................... 53 28. Portions of the SVGTS ...................................................................................................................... 54 29. Condensate Pump .............................................................................................................................. 55 30. Condensate Pump and Insulated Vapor Header ................................................................................ 55 31. ERH Well Field Layout from RDR................................................................................................... 63 32. ERH Well Field Layout Indicated by Latest Modeling .................................................................... 64

THIS PAGE INTENTIONALLY LEFT BLANK

vii
TABLES
1. East Area Baseline and Preliminary Postoperational Soil Trichloroethene Results ......................... 11 2. Southwest Area Baseline and Preliminary Postoperational Soil Trichloroethene Results ................ 15 3. East Area Baseline and Preliminary Postoperational Groundwater Trichloroethene Results .......... 18 4. Southwest Area Baseline and Preliminary Postoperational Groundwater Trichloroethene
Results ............................................................................................................................................... 22 5. East Area Weekly Well Field Flow Measurement Summary ........................................................... 38 6. East Area Vacuum Measurement Summary ..................................................................................... 38 7. Vacuum Radius of Influence Testing during Pulsed Operation (October 25, 2011) ........................ 39 8. East Area Photoacoustic Trichloroethene Readings Summary ......................................................... 40 9. Southwest Area Weekly Well Field Flow Measurement Summary .................................................. 44 10. Southwest Area Vacuum Measurement Summary ............................................................................ 44 11. Southwest Area Photoacoustic Trichloroethene Readings Summary ............................................... 48 12. Extracted and Injected Groundwater during Phase I ......................................................................... 48 13. Power Requirements for Various Simulated Groundwater Velocities .............................................. 58 14. Comparison of Numerical Simulations for Phase II ......................................................................... 59 15. Phase IIb Specific Design Revisions and Associated Rough Order of Magnitude Costs ................. 61

THIS PAGE INTENTIONALLY LEFT BLANK

ix
ACRONYMS
CSM Conceptual Site Model digiPAM™ digital pressure acquisition module digiTAM™ digital temperature acquisition module DNAPL dense nonaqueous-phase liquid DOE U.S. Department of Energy DOECAP DOE Consolidated Audit Program ERH electrical resistance heating gpm gal per minute HU hydrogeologic unit IRA Interim Remedial Action ITR independent technical review kW-HR kilowatt hour LATA Kentucky LATA Environmental Services of Kentucky, LLC Mc2 McMillan-McGee Corporation MW monitoring well MW-HR megawatt hour PGDP Paducah Gaseous Diffusion Plant POE point of exposure ppmv parts per million by volume RAO remedial action objective RAWP Remedial Action Work Plan RDR Remedial Design Report RGA Regional Gravel Aquifer ROD Record of Decision ROI radius of influence ROM rough order of magnitude SAP Sampling and Analysis Plan scfm standard ft3 per minute SME subject matter expert SVE soil vapor extraction SVGTS soil vapor and groundwater treatment system SWMU solid waste management unit TCE trichloroethene UCRS Upper Continental Recharge System UF6 uranium hexafluoride USEC United States Enrichment Corporation VOC volatile organic compound WAG waste area group

THIS PAGE INTENTIONALLY LEFT BLANK
xi
EXECUTIVE SUMMARY
This document, Technical Performance Evaluation for the C-400 Interim Remedial Action at the Paducah Gaseous Diffusion Plant, Paducah, Kentucky, has been prepared in support of U.S. Department of Energy (DOE) environmental remediation efforts at the Paducah Gaseous Diffusion Plant in Paducah, Kentucky. The report presents a summary of performance results and observations compiled from Phase I of the C-400 Interim Remedial Action (IRA). Electrical resistance heating (ERH) was implemented as the C-400 IRA remedy to remove volatile organic compound (VOC) contamination, primarily trichloroethene (TCE), from subsurface soils in the vicinity of the C-400 Cleaning Building. This decision was documented in a Record of Decision (ROD) signed in August 2005.
The C-400 IRA is being implemented in phases to mitigate the risks/uncertainties associated with full-scale deployment of such a complex remedy in a complicated setting like the C-400 Cleaning Building area. Phase I implemented the ERH design presented in the Remedial Design Report in the southwest and east treatment areas of the C-400 Cleaning Building complex. In addition to removing VOCs from these areas, another important objective of Phase I was to evaluate the heating performance of the design through the Regional Gravel Aquifer (RGA) down to the contact with the McNairy Formation in the southwest treatment area. In addition to evaluating heating performance in the RGA, operation of Phase I also provided the opportunity to evaluate the radius of influence of the vapor recovery system, assess hydraulic containment, and optimize the aboveground vapor/liquid treatment system. Treatment in the east treatment area addressed only the Upper Continental Recharge System (UCRS). Phase II of the project is to focus on the southeast treatment area. Phase II is further subdivided into (1) a UCRS/upper RGA action (Phase IIa) and (2) a lower RGA action (Phase IIb). The project site is immediately adjacent to a fully operational support facility located in the middle of an operating industrial complex. The ERH technology is being deployed at depths and in geologic/hydogeologic conditions that combine to provide a unique challenge for this technology. The phased deployment strategy was developed to remove VOC contamination from UCRS soils in the east and southwest areas and to evaluate the adequacy of the ERH design for heating the lithologic components of the highly permeable and electrically resistive RGA. Phase I construction began in December 2008 and was substantially complete in December 2009; at that time, start up and shakedown testing began. Testing was complete and operations commenced at the end of March 2010. Heating operations ceased (soil vapor extraction continued) at the end of October 2010, and all system operations ended on December 4, 2010.
This performance assessment presents a summary of Phase I installation, operating experiences, and performance results. Data presented support the conclusion that Remedial Action Objectives, (RAOs) as documented in the ROD, were achieved for the UCRS and upper RGA in the Phase I treatment areas. Postoperational soil sample results show average percent reductions in TCE concentrations of 95% and 99% in the Phase I east and southwest treatment areas. Groundwater analytical results from postoperational samples show average reductions of 76% and 99% in the east and southwest areas, respectively.
Target temperatures were attained in treatment areas and depths targeted for VOC removal, indicating that the ERH design was adequate for thermal treatment of UCRS soils.
Target temperatures were not attained in the deep RGA. Key factors that affected attainment of target temperature in the deep RGA include groundwater flow velocity, formation resistivity, and heat loss due to convective flow. These parameters have the potential to impact thermal performance significantly.

xii
Observed maximum formation temperatures attained during Phase I operations in the lower RGA fell short of target temperature by over 100ºF. Contingency thermal engineering techniques identified in the RAWP to boost formation heating were implemented during Phase I in attempts to attain target temperatures. These techniques included injection of saline solutions and maximizing the delivery of electrical power to the electrodes in the lower RGA. Phase I operating experience in the southwest treatment area and subsequent modeling results using a groundwater velocity of 3.0 ft per day indicate that, in order to achieve target temperatures in the RGA, the ERH configuration developed for Phase I would require significant scale up. This design simulations for heating the RGA in Phase II calls for 35 additional electrode borings (76% increase), 103 additional electrodes (76% increase), an estimated increase in total energy for Phase II operations of almost 5,000 MW-Hr (100% increase), and associated additional costs of approximately $7.3M. The design also would require upgradient electrode borings for preheating and upgradient groundwater extraction to reduce the flux of groundwater that requires heating through the target volume. Additionally, the ERH technology subcontractor suggests augmenting heating by providing hot water injection at the electrodes.
One of the key questions this document is intended to address is “What recommendations can be made regarding implementation of Phase II of the IRA?” Based on the Phase I experience and results, ERH should be deployed in the UCRS soils of the southeast treatment area. Lessons learned during Phase I relative to RGA heating identified the following uncertainties:
• The range of groundwater velocity in the formation is considered to be a substantial contributing factor in the inability to attain target temperature in the RGA;
• Utility and building operations avoidance posed more significant coordination challenges than originally assumed, and additional logistical challenges would be posed as part of Phase II based on the greater boring density that would be necessary for heating the RGA;
• RGA formation electrical resistivity characteristics are high, leading to difficulty in attaining target temperatures and requiring contingency actions such as additional power and salt injection to improve conductivity;
• The viability of continuous saltwater injection to increase formation electrical conductivity; and
• Attainment of higher target temperatures (up to 50ºF higher in the bottom of the RGA versus the top) when Phase I was more than 100°F below target temperatures in the deep RGA.
Preliminary Phase II thermal design modeling has been conducted to identify a design that potentially accounts for the key formation and performance uncertainties identified here (groundwater flow velocity, formation resistivity, and attainment of target temperature in the lower RGA). While the revised design suggests that Phase II objectives can be realized using ERH in the RGA, the initial identification of requirements include additional infrastructure, implementation of contingency heating methods, and an associated increase in project costs. Because of the substantial shortfall in attainment of RGA target temperature during Phase I despite implementation of contingency actions identified in the RAWP, and because the success of ERH hinges critically on the attainment of target temperature, it is recommended that implementation of Phase II ERH in the RGA be considered with caution. The investment in Phase II implementation in the RGA would be substantial and consensus has not been reached regarding the design requirements necessary to ensure attainment of heating objectives and satisfaction of the C-400 IRA RAOs for the RGA due to lingering uncertainty regarding ambient groundwater flow velocity, the potential for thermally induced convective groundwater flow, and formation resistivity characteristics. Consequently, it is strongly recommended that alternate technologies, or combinations of technologies, be

xiii
evaluated to take advantage of increased knowledge of RGA characteristics to develop a refined technical strategy for successful attainment of the RAOs for the C-400 IRA.

THIS PAGE INTENTIONALLY LEFT BLANK

1
1. INTRODUCTION
This Technical Performance Evaluation for Phase I of the C-400 Interim Remedial Action at the Paducah Gaseous Diffusion Plant, Paducah, Kentucky, presents a summary of the observations and performance results compiled during Phase I of the electrical resistance heating (ERH) remedy installation and operation conducted during environmental remediation efforts at the U.S. Department of Energy (DOE) owned Paducah Gaseous Diffusion Plant (PGDP). The information contained in this document includes descriptions and details of the construction and implementation of Phase I of the remedial action, as well as the results of operational and monitoring data collected during and subsequent to Phase I implementation. The Remedial Action Work Plan for the Interim Remedial Action for the Volatile Organic Compound Contamination at the C-400 Cleaning Building at the Paducah Gaseous Diffusion Plant, Paducah, Kentucky, DOE/LX/07-0004&D2/R2/A1/R1, (DOE 2010) provides project background information regarding remedy selection under the Comprehensive Environmental Response, Compensation, and Liability Act; presents a summary of remedial design support investigation information; and conveys information on project organization, planning, quality assurance/quality control, and implementation. Section 8 of the Remedial Action Work Plan (RAWP) includes planning information that specifically addresses the collection and analysis of samples collected for baseline, during operations, and postoperations that are discussed in this document and form the basis for evaluation of Phase I performance.
1.1 OBJECTIVES
The purpose of this document is to provide a basis for determining if the implementation of Phase I of the C-400 Interim Remedial Action (IRA) project:
• Attained the remedial action objectives (RAOs) identified in the Record of Decision (ROD);
• Met established performance metrics regarding attainment of target temperatures in contaminant treatment zones in the east and southwest treatment areas; and
• Demonstrated how effective Phase I implementation was in regard to the removal of contaminants from the East and Southwest treatment zones.
In addition, information is presented to convey the following:
• Aspects of Phase I installation and implementation that progressed as expected and those aspects that presented challenges or required modifications to implementation plans;
• Where the results and observations of Phase I installation and implementation provide guidance on design modifications or improvements that should be considered for Phase II installation and implementation; and
• The identification of major uncertainties that relate to technology implementation and how information obtained during Phase I installation and operation inform recommendations for Phase II implementation.

2
1.2 ORGANIZATION
The report is organized as follows:
• Section 1 provides an introduction, description of the objectives of this document, and details about document organization.
• Section 2 provides a brief history of the project leading up to the installation of the remedy, summarizes the objectives of Phase I, and lists the various sources of information utilized in the development of this report.
• Section 3 topics include a review of contaminant removal efficacy, a summary of heating performance results, a presentation of vapor and groundwater extraction results, and a summary of the activities and time frames associated with system installation and operation. Observations and discussions of the challenges, uncertainties, and lessons learned during Phase I are presented within each of the topic areas in Section 3.
• Section 4 presents preliminary design concepts to be considered for Phase II of the C-400 IRA.
• Section 5 provides conclusions and recommendations.

3
2. BACKGROUND INFORMATION
This section provides a history of the C-400 project including a brief description of C-400 Building operations, initial observations of contaminant release and key environmental actions, documentation, and remedial action objectives for the IRA Phase I objectives also are presented.
2.1 HISTORY
The C-400 Cleaning Building is located near the center of the industrial section of PGDP. The building is bounded by 10th and 11th Streets to the west and east, respectively, and by Virginia and Tennessee Avenues to the north and south, respectively. Figure 1 shows the location of the C-400 Cleaning Building and immediate area. Historically, some of the primary activities associated with the C-400 Building have been cleaning of machinery parts, decontaminating the interiors of used uranium hexafluoride (UF6) cylinders, disassembling and testing of cascade components, and laundering of plant clothes. The building also has housed various other processes and activities, including recovery of precious metals and treatment of radiological waste streams.
In June 1986, a routine construction excavation along the 11th Street storm sewer revealed trichloroethene (TCE) soil contamination. The cause of the contamination was determined to be a leak in a drain line from the C-400 Building’s basement sump to the storm sewer. The area of contamination became known as the C-400 TCE Leak Site and was given the designation of Solid Waste Management Unit (SWMU) 11. After the initial discovery of contamination, four borings were installed to better define the extent of the soil contamination. SWMU 11 and the C-400 Building area have been the subject of several investigations since then.
Significant concentrations of TCE were detected during the Waste Area Group (WAG) 6 Remedial Investigation. TCE was identified in two hydrostratigraphic units: the Upper Continental Recharge System (UCRS) and the Regional Gravel Aquifer (RGA). At C-400, the UCRS extends from surface to approximately 56 ft to 66 ft below ground surface (bgs). The RGA extends from the bottom of the UCRS with a thickness range of approximately 25 ft to 36 ft. Some results indicated the presence of TCE as a dense nonaqueous-phase liquid (DNAPL).
Two previous actions have remediated some of the soil contamination near the southeast corner of C-400 Building. After the discovery of the C-400 TCE Leak Site in June 1986, some of the soils were excavated in an attempt to reduce the contamination in the area. Approximately 310 ft3 of TCE-contaminated soil was drummed for off-site disposal. The excavation was backfilled with clean soil, and the area was capped with a layer of clay. A 2003 Six-Phase Heating Treatability Study removed over 22,000 lbs of TCE (approximately 1,900 gal) from the subsurface in a 43-ft diameter treatment area (5,378 yd3 of contaminated soil and subsurface aquifer) in the southeast corner of the area near the C-400 Building.
In August 2005, a ROD was finalized for an interim remedial action at C-400. The Record of Decision for Interim Remedial Action for the Groundwater Operable Unit for the Volatile Organic Compound Contamination at the C-400 Cleaning Building at the Paducah Gaseous Diffusion Plant, Paducah, Kentucky, DOE/OR/07-2150&D2/R2, (DOE 2005) documented the selection of ERH as the technology to address the source area contaminated with TCE and other volatile organic compounds (VOCs).

4
Figure 1. Location of C-400
5
RAOs of the IRA are as follows: • Prevent exposure to contaminated groundwater by on-site industrial workers through institutional
controls (e.g., excavation/penetration permit program);
• Reduce VOC contamination (primarily TCE and its breakdown products) in UCRS soil at the C-400 Cleaning Building area to minimize the migration of these contaminants to RGA groundwater and to off-site points of exposure (POEs); and
• Reduce extent and mass of the VOC source (primarily TCE and its breakdown products) in the RGA in the C-400 Cleaning Building area to reduce the migration of the VOC contaminants to off-site points of exposure.
The C-400 IRA was implemented in phases to mitigate the risks and uncertainties associated with large scale deployment of ERH in the highly permeable RGA.
2.2 PHASE I OBJECTIVES
ERH was the technology selected to address the C-400 source area, which contains TCE and other VOCs released at the C-400 Cleaning Building. The C-400 IRA is being implemented in phases to mitigate the risks and uncertainties associated with large scale deployment of ERH in the highly permeable RGA. This phased approach is in accordance with Remedial Action Work Plan for the Interim Remedial Action for the Volatile Organic Compound Contamination at the C-400 Cleaning Building at the Paducah Gaseous Diffusion Plant, Paducah, Kentucky, DOE/LX/07-0004&D2/R1 (DOE 2008a).
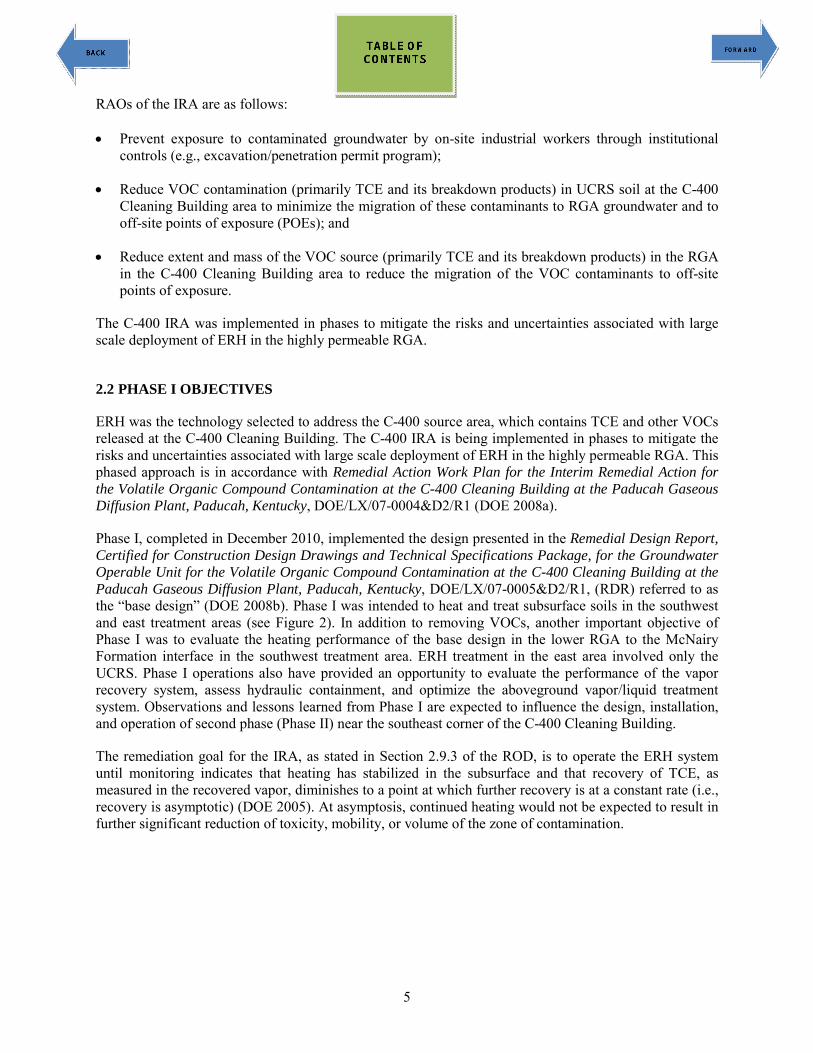
Phase I, completed in December 2010, implemented the design presented in the Remedial Design Report, Certified for Construction Design Drawings and Technical Specifications Package, for the Groundwater Operable Unit for the Volatile Organic Compound Contamination at the C-400 Cleaning Building at the Paducah Gaseous Diffusion Plant, Paducah, Kentucky, DOE/LX/07-0005&D2/R1, (RDR) referred to as the “base design” (DOE 2008b). Phase I was intended to heat and treat subsurface soils in the southwest and east treatment areas (see Figure 2). In addition to removing VOCs, another important objective of Phase I was to evaluate the heating performance of the base design in the lower RGA to the McNairy Formation interface in the southwest treatment area. ERH treatment in the east area involved only the UCRS. Phase I operations also have provided an opportunity to evaluate the performance of the vapor recovery system, assess hydraulic containment, and optimize the aboveground vapor/liquid treatment system. Observations and lessons learned from Phase I are expected to influence the design, installation, and operation of second phase (Phase II) near the southeast corner of the C-400 Cleaning Building.
The remediation goal for the IRA, as stated in Section 2.9.3 of the ROD, is to operate the ERH system until monitoring indicates that heating has stabilized in the subsurface and that recovery of TCE, as measured in the recovered vapor, diminishes to a point at which further recovery is at a constant rate (i.e., recovery is asymptotic) (DOE 2005). At asymptosis, continued heating would not be expected to result in further significant reduction of toxicity, mobility, or volume of the zone of contamination.
6
Figure 2. C-400 Treatment Areas

7
The first part of the remediation goal, as stated in Section 3.3 of the RDR, is to operate the ERH system until monitoring indicates that heating has stabilized. The stable heating goals for Phase I are defined as follows:
• Target temperatures in the soil above the potentiometric surface of the RGA (approximately 53 ft bgs at the C-400 Building) are at or above 90°C (194°F). The boiling point of free-phase TCE is 87°C (189°F) at sea level pressure conditions.
• Target temperatures below the potentiometric surface are at or above the boiling point of the free-phase TCE at the depth of treatment [e.g., approximately 87°C (189°F) at the potentiometric surface and approximately 115°C (239°F) at 98 ft bgs].
• Target temperatures at each depth interval will be verified by 90% of the digital temperature monitoring sensors installed at 3-ft intervals throughout the heated volume.
• Target temperatures presented in bullets one and two (above) are maintained for the period of time necessary to achieve asymptosis, as defined below.
The second part of the remediation goal is to achieve asymptotic recovery of TCE in vapor. Asymptotic conditions are confirmed based on visual inspection of data plots showing TCE mass removal rate and TCE vapor concentration versus time. When the slope of the curves presented in these data plots approaches zero, representing a slow rate of change, the curves are considered to be at asymptosis. At asymptosis, the rate of TCE recovery is constant and past experience with ERH systems used for in situ remediation of TCE indicates that when recovery rates reach asymptosis, the majority of available mass has been recovered, assuming attainment of target temperatures, and the cost benefit for continued operation typically results in the decision to cease operations. Groundwater TCE concentrations and mass recovery in groundwater also will be evaluated as indicators of when the point of diminishing returns is being approached in TCE mass recovery.
2.3 SOURCES OF INFORMATION
Information presented in this report came from a number of sources. C-400 project team members and subject matter experts (SMEs) from LATA Environmental Services of Kentucky, LLC, (LATA Kentucky) teaming partners and subcontractors provided much of the information presented in this report.
The RDR and RAWP, referenced in Section 2.2, describe the Phase I design and implementation strategy. In 2007, DOE commissioned an independent technical review (ITR) of the C-400 90% RDR. The 2007 ITR team consisted of SMEs from DOE, the environmental remediation field, and the U.S. Environmental Protection Agency. The ITR Team published their report in October 2007, Review Report: Building C-400 Thermal Treatment 90% Remedial Design Report and Site Investigation, PGDP, Paducah Kentucky, WSRC-STI-2007-00427 (ITR 2007). Observations and recommendations from ITR team members helped shape the final design and led to the phased deployment strategy.
Appendix B of the RDR presents the McMillan-McGee Corporation (Mc2) modeling results upon which the Phase I ERH design was based. A subsequent modeling effort by Mc2, performed after completion of Phase I operations, evaluated heating in the RGA using a groundwater velocity of 3 ft/day. The results of this second modeling effort are discussed in Section 4.1.1.4 of this report and included in Appendix A of this report.

8
A second ITR team, chartered by DOE in September 2010, Independent Technical Review of the C-400 Interim Remedial Project Phase I Results, Paducah, Kentucky, SRNL-STI-2010-00681, evaluated Phase I performance and results of the follow up Mc2 modeling (ITR 2010). Observations by the 2010 ITR are included in discussions in Section 4 of this report. The full 2010 ITR report is included in Appendix B of this report.

9
3. PHASE I PERFORMANCE
This section provides an assessment of contaminant removal as observed in soil and groundwater analytical data, heating and vapor and groundwater extraction performance, and key aspects of Phase I installation and operations. Where appropriate, discussion is added for individual treatment areas.
3.1 CONTAMINANT REMOVAL
3.1.1 Interim RAOs
The RAOs for the C-400 IRA, as documented in Section 2.8 of the C-400 ROD, are as follows:
• Prevent exposure to contaminated groundwater by on-site industrial workers through institutional controls (e.g., excavation/penetration permit program);
• Reduce VOC contamination (primarily TCE and it breakdown products) in UCRS soil at the C-400 Cleaning Building area to minimize the migration of these contaminants to RGA groundwater and to off-site POEs; and
• Reduce the extent and mass of the VOC source (primarily TCE and its breakdown products) in the RGA in the C-400 Cleaning Building area to reduce the migration of the VOC contamination to off-site POEs.
RAO 1 is addressed in the Land Use Control Implementation Plan for the C-400 IRA, which is included as Appendix H to the RDR. The following sections address the performance of Phase I relative to RAOs 2 and 3.
3.1.2 Soil Sample Results
The sampling for this project was completed in accordance with the Sampling and Analysis Plan (SAP) and Quality Assurance Program Plan contained in the RAWP. For ease of reporting, all of the sample collection depths that are discussed in this document correspond to the planned sample depths and not the actual depths collected (Appendix C is a CD containing the analytical and operational data). The selection of the sample interval was biased to characterize zones of highest VOC level, as determined by field monitoring instruments (e.g., PID or photoionization detector).
Soil core from a rotary sonic drill rig was sampled to characterize baseline VOC levels. The rotary sonic drill rig collected soil core in a flexible clear plastic liner. Collection of postoperational soil samples was performed using an auger drill rig with borings offset within 2 ft of the baseline locations. Postoperational soil samples were collected in stainless steel liners. High residual heat of soil samples collected after ERH operation presented an additional challenge to the samplers. Postoperational soil sampling involved capping the ends of the stainless steel liners and submerging them in an ice bath to lower the soil temperature and minimize the off-gassing of VOCs before collecting the sample.
To ensure the sample collected was representative of the same area that was characterized in the baseline sampling effort, postoperational soil samples targeted the actual sample depth of the corresponding baseline sample. Postoperational soil sampling was completed in April 2011 to support analysis of the percent reduction of VOCs as a result of the C-400 IRA Phase I operations. Baseline and postoperational

10
TCE and TCE degradation product concentrations are used as an indicator of the reduction of these VOCs. Baseline soil sample collection was completed in May 2009.
The primary means to assess the removal efficiency of TCE in the UCRS and RGA is a comparison of baseline and postoperational soil sampling results. The samples targeted silty and sandy portions of the UCRS and sandy portions of the RGA. Clayey and gravely portions of the UCRS are less likely to be represented adequately by a single sample. Sand intervals were preferentially sampled, as sand samples are more likely to retain representative TCE contaminant levels. Field scans of VOC levels (e.g., via photoionization detector) were used to identify sands with the highest levels of contamination for sampling.
Soil samples obtained from borings used to install ERH equipment were used to determine the concentrations of TCE and TCE degradation products in the soil prior to the operation of the ERH electrodes. Postoperational samples from collocated borings were obtained for comparison to baseline soil sample analyses to determine the residual TCE concentrations subsequent to the operation of Phase I. The paired baseline and postoperational sample results were compared to assess the reduction in concentrations. Also, additional samples were collected in previously unsampled areas to assess residual concentrations within the east treatment area.
While preliminary results have been received from the DOE Consolidated Audit Program (DOECAP) laboratory and reviewed for sample completeness, the data assessment process has not been completed as of August 2011. Although the data are not expected to change following assessment, they are presented in this report as preliminary until completion of the data assessment process. Data assessment should be completed in September 2011.
Baseline and postoperational soil samples were collected from 12 locations in the east area.
East Treatment Area
Table 1 lists the soil sampling results, and Figure 3 shows the east area sampling locations and presents the east area soil data. For the east treatment area, there are 25 paired sampling sets for comparison. Comparing the baseline to the postoperational shows a 95% reduction in concentration, shifting the average concentration of 584 µg/Kg to 29 µg/Kg. Note that in the eastern area, there were 18 samples that began and ended with a low concentration (<100 µg/kg). Variations in these concentrations are not considered significant. The sample at E106 (20 ft depth) had a baseline concentration of 20 µg/kg and a postoperational concentration of 315 µg/kg. This apparent increase is not considered significant and potentially could reflect redistribution of TCE during operation. Alternatively, the increase may simply reflect the variation of sample results (considering that the baseline and postoperational paired samples are not from identical locations and are within a few ft apart).
Additional postoperational data were collected from borings located between the electrodes where the potential for cooler areas and greater residual mass. Samples SB061 and SB062 were collected to help assess removal performance. The samples at depths of 31, 43, 54 ft bgs all contained low concentrations (i.e., < 100 µg/kg) of TCE. Because there is not a baseline sample, the data from these locations do not provide information on treatment efficiency, but provide information that appreciable mass does not remain between the electrodes. The deeper samples at 59 ft in SB061 still are considered low at 125 µg/kg. The result of 2,900 µg/kg at 59 ft bgs in SB062 is the highest postoperational value for the east area and is well outside the range established for paired baseline and postoperational sample analyses. There are several potential explanations for this data point near the lower elevation of heating (heating was targeted to 60 ft). One explanation is that there was not as effective heating at this lower depth, as it is near the limit of the heating. Another explanation is that the 2,900µg/kg soil data represents contamination from adjacent RGA groundwater 3 months after the remedy was completed. The 59-ft

11
sample is within the sandy upper RGA [hydrogeologic unit (HU)4] above the lower RGA gravel (HU5). For example, a concentration of 18,000 µg/L of groundwater resaturating a clean sand section at 59 ft would yield a soil concentration of 2,900 µg/kg (using a soil porosity of 0.30 and soil density of 1.84 g/cc). Although there are no direct data to confirm the value, the concentration is within the range of observed groundwater concentrations in the C-400 area.
For the paired sampling data set, the average baseline concentrations were 584 µg/kg TCE and the postoperational was 29 µg/kg, yielding an average reduction of 95% These data demonstrate significant mass reduction within the UCRS in the East Area. Postoperational soil sampling results indicate that the RAOs were achieved in the treatment areas (UCRS) in the east treatment area in accordance with the second RAO.
Table 1. East Area Baseline and Preliminary Postoperational Soil Trichloroethene Results
Location Depth (ft bgs)
Baseline Result (µg/kg)
Post Op Result (µg/kg)
Baseline—Post Op (µg/kg)
Reduction1 (%)
E095 20 10.9 5.5 5.4 49.5 E095 35 6.91 9.28 -2.37 -34.3 E095 52 1,880 <5 1875 99.7 E095 60 5.46 75 -69.54 -1,273.6 E095 80 8.08 20.2 -12.12 -150.0 E097 35 <4.98 36 -31.02 -622.9 E098 20 <5.03 <4.99 0.04 0.8 E098 35 <5.02 <5.01 0.01 0.2 E099 35 6.37 <5.02 1.35 21.2 E100 20 7,820 <5 7,815 99.9 E100 35 1,860 <5.02 1,854.98 99.7 E102 20 27.9 <4.99 22.91 82.1 E102 35 30.5 7.73 22.77 74.7 E103 20 <4.99 <5 -0.01 -0.2 E103 35 <5.01 <5.02 -0.01 -0.2 E103 52 <5.02 <5.01 0.01 0.2 E104 20 <4.97 <5.01 -0.04 -0.8 E104 35 196 9.4 186.6 95.2 E105 35 <5 <5 0 0 E106 20 20 315 -295 -1,475 E106 35 <5 9.15 -4.15 -83 E107 35 60.2 118 -57.8 -96 E110 20 8.46 <5.03 3.43 40.5 E110 35 10.6 46.1 -35.5 -334.9 E110 52 2,610 5.23 2,604.77 99.8
Count2 25 25 Average2 (µg/kg) 584 29 95
Minimum2 (µg/kg) 4.97 4.99 Maximum2 (µg/kg) 7,820 315 Count2 <70 µg/kg 20 22
Count nondetectable2 9 16

12
Table 1. East Area Baseline and Preliminary Postoperational Soil Trichloroethene Results (Continued)
Location Depth (ft bgs)
Baseline Result (µg/kg)
Post Op Result (µg/kg)
Baseline—Post Op (µg/kg)
Reduction1 (%)
SB061 31 19.9 SB061 43 <5.01 SB061 54 <5.01 SB061 59 125 SB061 78 <4.99 SB062 31 15.2 SB062 43 19 SB062 54 13 SB062 59 2,900 SB062 78 6.15
1 Reduction Percentage = (Baseline Result - Post Op Result)/Baseline Result*100 2 Only the locations that have both a baseline and postoperational sample are included.
Southwest Treatment Area
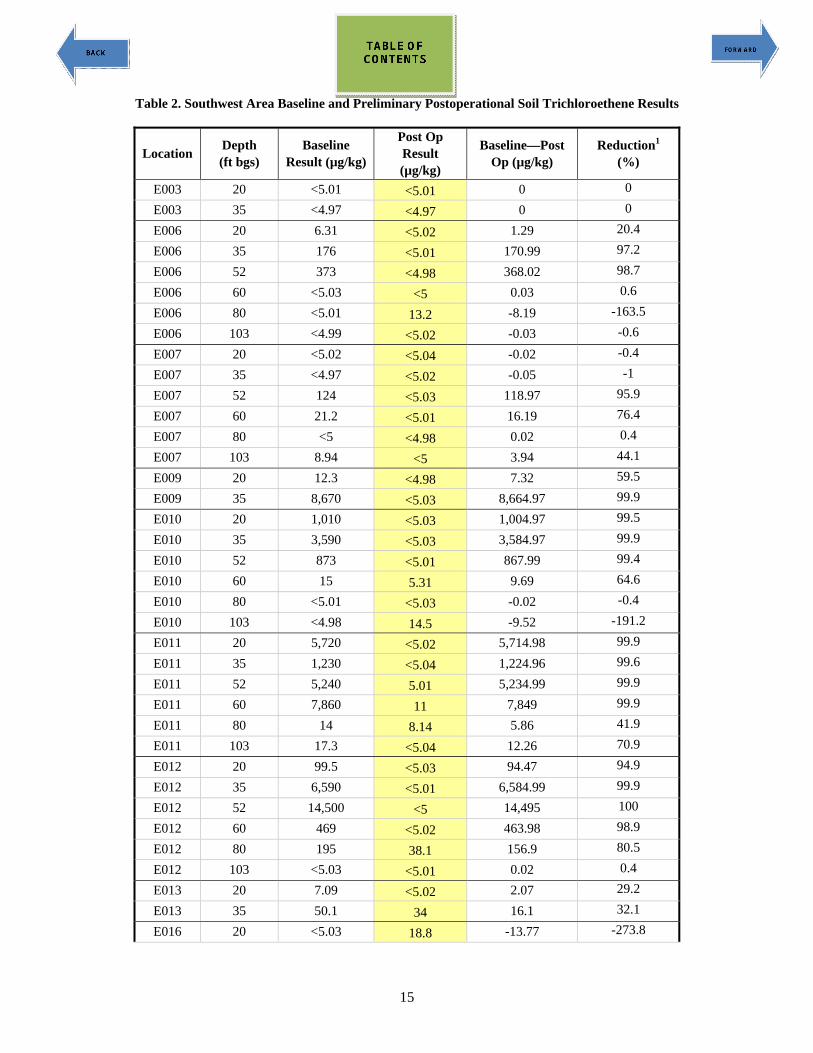
Baseline and postoperational soil samples were collected from 15 locations in the southwest area. Table 2 lists the soil sampling results from the southwest area and Figure 4 shows the southwest area sampling locations and presents the southwest area soil data. While 9 of the 63 pairs with detectable results showed an increase from baseline results, both the baseline and postoperations results were relatively low (nondetect–11.9 µg/kg and 9.93–88 µg/kg, respectively).
For the southwest treatment area, there are 63 paired sampling sets for comparison. Comparing the baseline to the postoperational shows a 99% reduction in concentration, shifting the average concentration of 1046 µg/kg to 15 µg/kg. Note that in the southwestern area, there were 41 samples that began and ended with a low concentration (< 100 µg/kg). For those 41 samples, variations in concentrations are not considered significant. These data demonstrate significant mass reduction in the southwest area. Postoperational soil sampling results indicate that the RAOs were achieved in the treatment areas (UCRS) in the southwest locations in accordance with the second RAO. The data from 60 to 80 ft intervals demonstrate a reduction in concentrations in the upper RGA in accordance with the third RAO.
3.1.3 Groundwater Sample Results
If the TCE is a leaking source from the UCRS and ERH is successful, groundwater concentrations in the RGA should decrease following application of ERH in the UCRS. If groundwater concentrations do not decrease in the RGA following ERH in the UCRS, it could be because the source removal is unsuccessful or due to ambient concentrations of TCE within the RGA in the vicinity.
To further understand the conceptual site model (CSM), groundwater samples were collected from extraction wells installed as a part of the ERH system evaluation in accordance with the SAP and Quality Assurance Program Plan contained in the RAWP. The sample results were used to characterize TCE

U.S. DEPARTMENT OF ENERGYDOE PORTSMOUTH/PADUCAH PROJECT OFFICE
PADUCAH GASEOUS DIFFUSION PLANTArea Shown
��Figure 3. East Area Soil Sample Locations and Preliminary Results

14
concentrations in groundwater before, during, and after operation of the ERH system as an indicator of reduced TCE impacts to the RGA. Extraction wells that were independent of the electrodes provided groundwater and vapor extraction during the ERH heating phase and allowed for collection of groundwater samples for characterization of dissolved TCE concentrations, prior to, during, and subsequent to heating the subsurface.
Each of the RGA wells was sampled three times over a four week period before and after heating the subsurface to establish representative dissolved TCE (and TCE degradation products) concentrations for each well for the period. Section 8 of the RAWP contains details of the groundwater sampling plan.
Existing monitoring wells MW155 and MW156, located within the east treatment area, offered an opportunity for additional groundwater characterization. Both of these wells were sampled during the baseline and postoperational sampling events.
Results from groundwater samples collected at extraction wells throughout the treatment areas provided data for use in assessing the progress of the IRA. Water samples also were collected routinely from various sample ports throughout the groundwater treatment system in accordance with the Operations and Maintenance Plan to monitor the operational effectiveness of the treatment system (DOE 2009). Samples were collected routinely from the water treatment system effluent to ensure compliance with discharge criteria.
Baseline groundwater sampling was completed in September 2009, approximately 5 months before heating operations commenced and postoperational sampling was completed in May 2011, approximately 6 months after heating ceased.
While preliminary results have been received from the DOE Consolidated Audit Program (DOECAP) laboratory and reviewed for sample completeness, the data assessment process has not been completed as of August 2011. Although the data are not expected to change following assessment, they are presented in this report as preliminary until completion of the data assessment process. Data assessment should be completed in September 2011.
Table 3
East Treatment Area
lists the preliminary baseline and postoperational results for the east area groundwater samples. Figure 5 shows the east area sampling locations and presents the east area groundwater data.
15
Table 2. Southwest Area Baseline and Preliminary Postoperational Soil Trichloroethene Results
Location Depth (ft bgs)
Baseline Result (µg/kg)
Post Op Result (µg/kg)
Baseline—Post Op (µg/kg)
Reduction1 (%)
E003 20 <5.01 <5.01 0 0
E003 35 <4.97 <4.97 0 0
E006 20 6.31 <5.02 1.29 20.4
E006 35 176 <5.01 170.99 97.2
E006 52 373 <4.98 368.02 98.7
E006 60 <5.03 <5 0.03 0.6
E006 80 <5.01 13.2 -8.19 -163.5
E006 103 <4.99 <5.02 -0.03 -0.6
E007 20 <5.02 <5.04 -0.02 -0.4
E007 35 <4.97 <5.02 -0.05 -1
E007 52 124 <5.03 118.97 95.9
E007 60 21.2 <5.01 16.19 76.4
E007 80 <5 <4.98 0.02 0.4
E007 103 8.94 <5 3.94 44.1
E009 20 12.3 <4.98 7.32 59.5
E009 35 8,670 <5.03 8,664.97 99.9
E010 20 1,010 <5.03 1,004.97 99.5
E010 35 3,590 <5.03 3,584.97 99.9
E010 52 873 <5.01 867.99 99.4
E010 60 15 5.31 9.69 64.6
E010 80 <5.01 <5.03 -0.02 -0.4
E010 103 <4.98 14.5 -9.52 -191.2
E011 20 5,720 <5.02 5,714.98 99.9
E011 35 1,230 <5.04 1,224.96 99.6
E011 52 5,240 5.01 5,234.99 99.9
E011 60 7,860 11 7,849 99.9
E011 80 14 8.14 5.86 41.9
E011 103 17.3 <5.04 12.26 70.9
E012 20 99.5 <5.03 94.47 94.9
E012 35 6,590 <5.01 6,584.99 99.9
E012 52 14,500 <5 14,495 100
E012 60 469 <5.02 463.98 98.9
E012 80 195 38.1 156.9 80.5
E012 103 <5.03 <5.01 0.02 0.4
E013 20 7.09 <5.02 2.07 29.2
E013 35 50.1 34 16.1 32.1
E016 20 <5.03 18.8 -13.77 -273.8

Table 2. Southwest Area Baseline and Preliminary Postoperational Soil Trichloroethene Results (Continued)
16
Location Depth (ft bgs)
Baseline Result (µg/kg)
Post Op Result (µg/kg)
Baseline—Post Op (µg/kg)
Reduction1 (%)
E016 35 28.9 <5.03 23.87 82.6
E017 20 607 <5.02 601.98 99.2
E017 35 3,770 <5.02 3,764.98 99.9
E017 52 55.7 <5.03 50.67 91
E017 60 <46.3 <4.99 41.31 89.2
E017 80 <49.3 <5.04 44.26 89.8
E017 103 <4.97 <5.01 -0.04 -0.8
E018 20 676 92.6 583.40 86.3
E018 35 522 14.3 507.70 97.3
E018 52 323 <5.02 317.98 98.4
E018 60 706 228 478 67.7
E018 80 <5.01 <5.01 0 0
E018 103 6.57 <5 1.57 23.9
E019 20 11.9 68.9 -57 -479
E019 35 69.7 <4.98 64.72 92.9
E019 52 1,900 13.8 1,886.2 99.3
E020 20 120 <5.04 114.96 95.8
E020 35 <5.04 9.93 -4.89 -97
E026 20 26.7 <4.99 21.71 81.3
E026 35 <5 27.2 -22.2 -444
X06 20 <5.02 <5.03 -0.01 -0.2
X06 35 <5.03 <4.99 0.04 0.8
X06 52 <5.03 88 -82.97 -1,649.5
X06 60 14.5 7.88 6.62 45.7
X06 80 <5.03 24.6 -19.57 -389.1
X06 103 <4.99 12.7 -7.71 -154.5
Count 63 63
Average (µg/kg) 1,046 15 99
Minimum (µg/kg) 4.97 4.97
Maximum (µg/kg) 14,500 228
Count <70 µg/kg 39 60
Count nondetectable 23 43 1 Reduction Percentage = (Baseline Result - Post Op Result)/Baseline Result*100

U.S. DEPARTMENT OF ENERGYDOE PORTSMOUTH/PADUCAH PROJECT OFFICE
PADUCAH GASEOUS DIFFUSION PLANTArea Shown
��Figure 4. Southwest Area Soil Sample Locations and Preliminary Results

18
Table 3. East Area Baseline and Preliminary Postoperational Groundwater Trichloroethene Results
Location Target Depth (ft bgs)
Event Actual
Screen Depth (ft bgs)
Baseline Result (µg/L)
Post Op Result (µg/L)
Baseline— Post Op (µg/L)
Reduction1 (%)
MW155 100 1 87-92 14,000 3,100 10,900 77.9
MW155 100 2 87-92 14,000 6,000 8,000 57.1
MW155 100 3 87-92 13,000 3,500 9,500 73.1
MW156 65 1 63-70 34,000 52,000 -18,000 -52.9
MW156 65 2 63-70 36,000 52,000 -16,000 -44.4
MW156 65 3 63-70 39,000 58,000 -19,000 -48.7
X26 65 1 55-65 110,000 73,000 37,000 33.6
X26 65 2 55-65 120,000 41,000 79,000 65.8
X26 65 3 55-65 120,000 49,000 71,000 59.2
X27 65 1 55-65 180,000 28,000 152,000 84.4
X27 65 2 55-65 190,000 20,000 170,000 89.5
X27 65 3 55-65 200,000 34,000 166,000 83
X28 65 1 55-65 250,000 4,300 245,700 98.3
X28 65 2 55-65 260,000 6,600 253,400 97.5
X28 65 3 55-65 260,000 8,300 251,700 96.8
Count 15 15
Average (µg/L) 123,000 29,000 76
Minimum (µg/L) 13,000 3,100
Maximum (µg/L) 260,000 73,000 1 Reduction Percentage = (Baseline Result - Post Op Result)/Baseline Result*100
Based on review of baseline data and preliminary postoperational data, there were significant decreases in TCE concentrations in the east area in every location but one. The one anomalous location was MW156, which is screened from 63-70 ft bgs (Upper RGA). Extraction well X27 is located upgradient of MW156 and the screened interval intercepts groundwater from 55-65 ft bgs. The groundwater concentrations in X27 dropped by > 80%, while concentrations in MW156 increased. The apparent performance disparity

19
Figure 5. East Area Groundwater Sample Locations and Preliminary Results

20
for these two samples may be attributed to the fact that the heating target for the east area was effective to 60 ft, but not effective down to 66.5 ft bgs (the mid screen depth of MW156). A second explanation of the data is that the groundwater in the vicinity of the western margin of the East Treatment area may be downgradient or crossgradient of the yet to be addressed southeast area. Although the groundwater gradient in the vicinity of C-400 is nominally north (plant north), the gradient is relatively flat (3.3 x 10⁻⁴ ft/ft as measured in January 2011) and local flow directions are to the northeast in the vicinity of the east treatment area indicating the potential for TCE values in groundwater beneath the east treatment area to be influenced by groundwater from the southeast treatment area. Additionally due to the shallow hydraulic in the vicinity of C-400, chemical concentration gradients (from the southeast area to the east treatment area) also could play a factor in the increase.
In general, postoperational decreases in groundwater concentrations in the RGA are a positive indicator of successful remedial performance in the UCRS to a depth of 60 ft. The exception to the general decrease in MW156 may be explained by contribution from contaminated groundwater within the upper RGA from the adjacent southeast area that has yet to be addressed. The east area average baseline concentration was 123,000 µg/L, and the average postoperational sample was 29,000 µg/L, which is an average reduction of 76%.
Figure 6 provides baseline, operational, and postoperational TCE analytical results for east area monitoring locations and depicts reductions in TCE as a result of ERH operations for all locations, with the exception of MW156, as discussed.
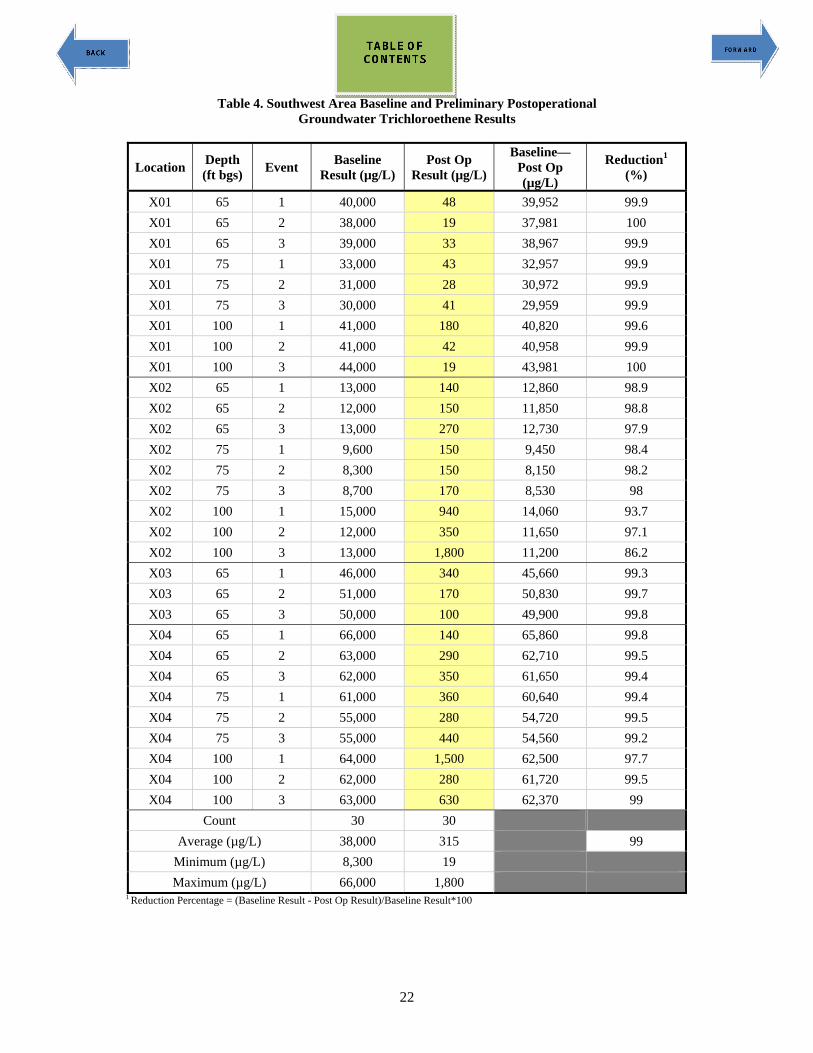
Table 4
Southwest Treatment Area
lists the Preliminary baseline and postoperational results for the southwest area groundwater samples, and Figure 7 shows the southwest area sampling locations and presents the southwest area groundwater data. Based on review of baseline data and preliminary postoperational data, there were significant decreases in TCE concentrations in the southwest area in all locations.
The southwest area average baseline concentration was 38,000 µg/L, and the average postoperational sample was 315 µg/L, which is an average reduction of 99%. Groundwater sample results in the southwest treatment area indicate a significant reduction in TCE concentrations in the RGA. This would seem to confirm that TCE in the UCRS soils was the major contributor to the dissolved concentrations in the RGA in the southwest treatment area.
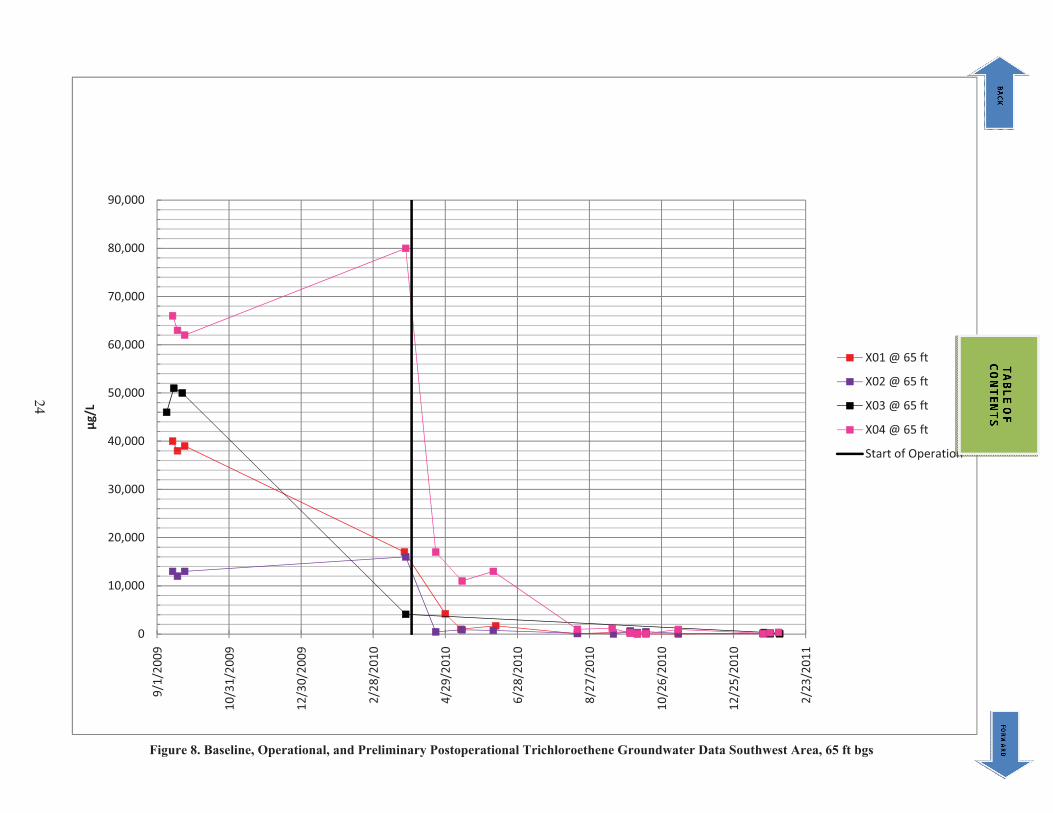
Figures 8, 9, and 10 provide baseline, operational, and postoperational TCE analytical results for 10 monitoring locations at 65 ft bgs, 75 ft bgs, and 100 ft bgs, respectively. These data depict the substantial reductions in groundwater TCE concentrations for the southwest area as a result of ERH operations. Results for the period just prior to the initiation of operations indicate reductions at 9 of 10 locations associated with system testing prior to sustained operations.
3.2 HEATING PERFORMANCE
3.2.1 Target Temperatures
A critical factor in the success of an in situ ERH project is the attainment of target temperatures that are at or above the boiling point of the target VOC(s). The target temperature requirements for the C-400 ERH project were developed to be depth specific for reasons described below. TCE, the target VOC at C-400, has a boiling point of approximately 87ºC (189ºF) at normal atmospheric pressure conditions. A

150,000
200,000
250,000
300,000
�g/L
MW155�@�100�ft
MW156�@�65�ft
X26�@�65�ft
X27�@�65�ft
X28�@�65�ft
0
50,000
100,000
9/1/
2009
10/3
1/20
09
12/3
0/20
09
2/28
/201
0
4/29
/201
0
6/28
/201
0
8/27
/201
0
10/2
6/20
10
12/2
5/20
10
2/23
/201
1
Start�of�Operation
21
Figure 6. Baseline, Operational, and Preliminary Postoperational Trichloroethene Groundwater Data East Area
22
Table 4. Southwest Area Baseline and Preliminary Postoperational Groundwater Trichloroethene Results
Location Depth (ft bgs) Event Baseline
Result (µg/L) Post Op
Result (µg/L)
Baseline—Post Op (µg/L)
Reduction1 (%)
X01 65 1 40,000 48 39,952 99.9
X01 65 2 38,000 19 37,981 100
X01 65 3 39,000 33 38,967 99.9
X01 75 1 33,000 43 32,957 99.9
X01 75 2 31,000 28 30,972 99.9
X01 75 3 30,000 41 29,959 99.9
X01 100 1 41,000 180 40,820 99.6
X01 100 2 41,000 42 40,958 99.9
X01 100 3 44,000 19 43,981 100
X02 65 1 13,000 140 12,860 98.9
X02 65 2 12,000 150 11,850 98.8
X02 65 3 13,000 270 12,730 97.9
X02 75 1 9,600 150 9,450 98.4
X02 75 2 8,300 150 8,150 98.2
X02 75 3 8,700 170 8,530 98
X02 100 1 15,000 940 14,060 93.7
X02 100 2 12,000 350 11,650 97.1
X02 100 3 13,000 1,800 11,200 86.2
X03 65 1 46,000 340 45,660 99.3
X03 65 2 51,000 170 50,830 99.7
X03 65 3 50,000 100 49,900 99.8
X04 65 1 66,000 140 65,860 99.8
X04 65 2 63,000 290 62,710 99.5
X04 65 3 62,000 350 61,650 99.4
X04 75 1 61,000 360 60,640 99.4
X04 75 2 55,000 280 54,720 99.5
X04 75 3 55,000 440 54,560 99.2
X04 100 1 64,000 1,500 62,500 97.7
X04 100 2 62,000 280 61,720 99.5
X04 100 3 63,000 630 62,370 99
Count 30 30
Average (µg/L) 38,000 315 99
Minimum (µg/L) 8,300 19
Maximum (µg/L) 66,000 1,800 1 Reduction Percentage = (Baseline Result - Post Op Result)/Baseline Result*100

23
Figure 7. Southwest Area Groundwater Sample Locations and Preliminary Results
40,000
50,000
60,000
70,000
80,000
90,000
�g/L�
X01�@�65�ft
X02�@�65�ft
X03�@�65�ft
X04�@�65�ft
Start of Operation
0
10,000
20,000
30,000
9/1/
2009
10/3
1/20
09
12/3
0/20
09
2/28
/201
0
4/29
/201
0
6/28
/201
0
8/27
/201
0
10/2
6/20
10
12/2
5/20
10
2/23
/201
1
Start�of�Operation
24
Figure 8. Baseline, Operational, and Preliminary Postoperational Trichloroethene Groundwater Data Southwest Area, 65 ft bgs

40,000
50,000
60,000
70,000
80,000
90,000
�g/L�
X01�@�75�ft
X02�@�75�ft
X04�@�75�ft
Start�of�Operation
0
10,000
20,000
30,000
9/1/
2009
10/3
1/20
09
12/3
0/20
09
2/28
/201
0
4/29
/201
0
6/28
/201
0
8/27
/201
0
10/2
6/20
10
12/2
5/20
10
2/23
/201
1
25
Figure 9. Baseline, Operational, and Preliminary Postoperational Trichloroethene Groundwater Data Southwest Area, 75 ft bgs

40,000
50,000
60,000
70,000
80,000
90,000
�g/L�
X01�@�100�ft
X02�@�100�ft
X03�@�100�ft
X04�@�100�ft
X05�@�100�ft
X06 @ 100 ft
0
10,000
20,000
30,000
9/1/
2009
10/3
1/20
09
12/3
0/20
09
2/28
/201
0
4/29
/201
0
6/28
/201
0
8/27
/201
0
10/2
6/20
10
12/2
5/20
10
2/23
/201
1
X06�@�100�ft
Start�of�Operation
26
Figure 10. Baseline, Operational, and Preliminary Postoperational Trichloroethene Groundwater Data Southwest Area, 100 ft bgs

27
TCE/water mixture will boil at a lower temperature than that of either TCE or water. The boiling point of a TCE/water mixture is approximately 73ºC (189ºF). The boiling temperature of TCE and that of a TCE/water mixture increases with depth below the water level (potentiometric surface) due to increasing pressures. These factors were considered in defining the C-400 IRA target temperatures. Figure 11 shows the relationship between boiling temperature and depth below the potentiometric surface for a TCE/water mixture, for free-phase TCE, and for groundwater.
For the C-400 IRA, a target temperature was established for subsurface soils above the potentiometric surface and for soils below the potentiometric surface. The target temperature established for soils above the potentiometric surface of the RGA (approximately 53 ft bgs) is 90ºC (194ºF) or higher. The target temperature for soils below the potentiometric surface of the RGA was established as the boiling point (or above) of free-phase TCE at the respective depth of treatment [e.g., approximately 87ºC (189ºF) at the potentiometric surface and approximately 115ºC (239ºF) at 98 ft bgs]. The free-phase boiling point of TCE (adjusted for depth below the water level) is a conservative goal since, as described above, a phase change for a TCE/water mixture is achieved at boiling temperature that is lower than that of the solvent itself.
3.2.2 Temperature Monitoring
Temperatures in the treatment zones were monitored by strings of digital temperature acquisition modules (digiTAM™s) installed through the target heated depth. DigiTAM™ strings were generally installed in locations that were between electrode borings and away from vapor extraction wells typically the coolest zones of the treatment volume. DigiTAM™s are digital temperature sensing devices composed of temperature and chemically resistant cable with imbedded sensors placed at 3-ft intervals. There were approximately 25 sensors per string on each digiTAM™ string monitoring temperatures through the RGA. The sensors have an accuracy of ± 0.5°C and can operate in temperatures ranging from -55°C to 125°C. Each sensor on the string is individually addressed so the data can be captured and stored on a data server. During Phase I operations, current and historical temperature data was accessible via a password protected internet site.
In the east treatment area, eight digiTAM™ strings were installed to monitor subsurface temperatures throughout the target treatment volume, which ranged from 20 to 60 ft bgs. East treatment area digiTAM™ locations are shown on Figure 3. They are designated on the figure by the letter “D” followed by a number (e.g., D42). Thirteen digiTAM™ strings were installed in the southwest treatment area to monitor subsurface temperatures throughout the target treatment volume at depths ranging from 20 ft bgs to approximately 93 ft bgs. Southwest treatment area digiTAM™ locations are shown on Figure 4.
Appendix C (included as a CD to this report) contains temperature data plots for all digiTAM™ locations.
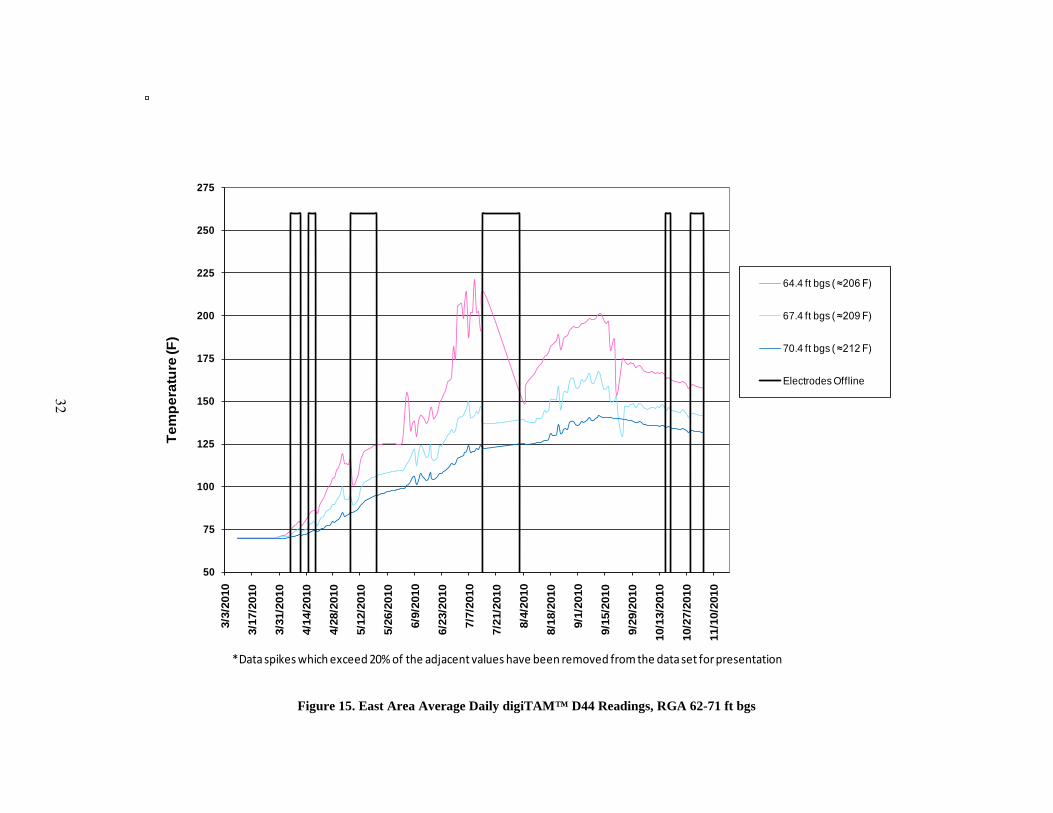
3.2.3 East Treatment Area Heating Performance
Figures 12, 13, and 14 present temperature monitoring results representative of the east treatment area at digiTAM™ locations D44, D43, and D46, respectively. D44 was centrally located in the east area where the target heated depth interval was 40 to 60 ft bgs. Figure 15 presents temperature monitoring results at digiTAM™ D44 from approximately 62-71 ft bgs. DigiTAM™s D43 and D46 were located on the west side of the east treatment area where the target heated depth interval was 20 to 60 ft bgs.
An appreciation of geologic setting and electrode placement is important for understanding the heating performance. In the east treatment area, the UCRS extends to an average depth of 51 ft bgs. The upper RGA (HU4 unit) extends from 51 ft to 57 ft bgs. The lower RGA extends from 57 ft bgs to the top of the McNairy Formation at 91 ft bgs. Heating performance discussed below also will tie into the aquifer being

28
Figure 7. Boiling Temperature Versus Depth
U.S. DEPARTMENT OF ENERGYDOE PORTSMOUTH/PADUCAH PROJECT OFFICE
PADUCAH GASEOUS DIFFUSION PLANT
Figure 6. Boiling Temperature Versus DepthFigure 11. Boiling Temperature Versus Depth

29
Figure 12. East Area Average Daily digiTAM™ D44 Readings, 18-62 ft bgs
50
75
100
125
150
175
200
225
250
275
3/3/
2010
3/17
/201
0
3/31
/201
0
4/14
/201
0
4/28
/201
0
5/12
/201
0
5/26
/201
0
6/9/
2010
6/23
/201
0
7/7/
2010
7/21
/201
0
8/4/
2010
8/18
/201
0
9/1/
2010
9/15
/201
0
9/29
/201
0
10/1
3/20
10
10/2
7/20
10
11/1
0/20
10
Tem
pera
ture
(F)
East Area Average Daily digiTAM™ D44 Readings*, UCRS ≈18-62 ft bgs
19.4 ft bgs ( ≈194 F)
22.4 ft bgs ( ≈194 F)
25.4 ft bgs ( ≈194 F)
28.4 ft bgs ( ≈194 F)
31.4 ft bgs ( ≈194 F)
34.4 ft bgs ( ≈194 F)
37.4 ft bgs ( ≈194 F)
40.4 ft bgs ( ≈194 F)
43.4 ft bgs ( ≈194 F)
46.4 ft bgs ( ≈194 F)
49.4 ft bgs ( ≈194 F)
52.4 ft bgs ( ≈194 F)
55.4 ft bgs ( ≈193 F)
58.4 ft bgs ( ≈197 F)
61.4 ft bgs ( ≈201 F)
Electrodes Offline
*Data spikes which exceed 20% of the adjacent values have been removed from the data set for presentation

30
Figure 13. East Area Average Daily digiTAM™ D43 Readings, 18-62 ft bgs
50
75
100
125
150
175
200
225
250
275
3/3/
2010
3/17
/201
0
3/31
/201
0
4/14
/201
0
4/28
/201
0
5/12
/201
0
5/26
/201
0
6/9/
2010
6/23
/201
0
7/7/
2010
7/21
/201
0
8/4/
2010
8/18
/201
0
9/1/
2010
9/15
/201
0
9/29
/201
0
10/1
3/20
10
10/2
7/20
10
11/1
0/20
10
Tem
pera
ture
(F)
East Area Average Daily digiTAM™ D43 Readings*, UCRS ≈18-62 ft bgs
18.4 ft bgs ( ≈194 F)
21.4 ft bgs ( ≈194 F)
24.4 ft bgs ( ≈194 F)
27.4 ft bgs ( ≈194 F)
30.4 ft bgs ( ≈194 F)
33.4 ft bgs ( ≈194 F)
36.4 ft bgs ( ≈194 F)
39.4 ft bgs ( ≈194 F)
42.4 ft bgs ( ≈194 F)
45.4 ft bgs ( ≈194 F)
48.4 ft bgs ( ≈194 F)
51.4 ft bgs ( ≈194 F)
54.4 ft bgs ( ≈193 F)
57.4 ft bgs ( ≈197 F)
60.4 ft bgs ( ≈201 F)
Electrodes Offline
*Data spikes which exceed 20% of the adjacent values have been removed from the data set for presentation
30

31
Figure 14. East Area Average Daily digiTAM™ D46 Readings, 18-62 ft bgs
50
75
100
125
150
175
200
225
250
275
3/3/
2010
3/17
/201
0
3/31
/201
0
4/14
/201
0
4/28
/201
0
5/12
/201
0
5/26
/201
0
6/9/
2010
6/23
/201
0
7/7/
2010
7/21
/201
0
8/4/
2010
8/18
/201
0
9/1/
2010
9/15
/201
0
9/29
/201
0
10/1
3/20
10
10/2
7/20
10
11/1
0/20
10
Tem
pera
ture
(F)
East Area Average Daily digiTAM™ D46 Readings*, UCRS ≈18-62 ft bgs
18.9 ft bgs ( ≈194 F)
21.9 ft bgs ( ≈194 F)
24.9 ft bgs ( ≈194 F)
27.9 ft bgs ( ≈194 F)
30.9 ft bgs ( ≈194 F)
33.9 ft bgs ( ≈194 F)
36.9 ft bgs ( ≈194 F)
39.9 ft bgs ( ≈194 F)
42.9 ft bgs ( ≈194 F)
45.9 ft bgs ( ≈194 F)
48.9 ft bgs ( ≈194 F)
51.9 ft bgs ( ≈194 F)
51.9 ft bgs ( ≈193 F)
54.9 ft bgs ( ≈197 F)
57.9 ft bgs ( ≈201 F)
60.9 ft bgs ( ≈201 F)
Electrodes Offline
*Data spikes which exceed 20% of the adjacent values have been removed from the data set for presentation
32
Figure 15. East Area Average Daily digiTAM™ D44 Readings, RGA 62-71 ft bgs
50
75
100
125
150
175
200
225
250
275
3/3/
2010
3/17
/201
0
3/31
/201
0
4/14
/201
0
4/28
/201
0
5/12
/201
0
5/26
/201
0
6/9/
2010
6/23
/201
0
7/7/
2010
7/21
/201
0
8/4/
2010
8/18
/201
0
9/1/
2010
9/15
/201
0
9/29
/201
0
10/1
3/20
10
10/2
7/20
10
11/1
0/20
10
Tem
pera
ture
(F)
East Area Average Daily digiTAM™ D44 Readings*, RGA ≈62-71 ft bgs
64.4 ft bgs ( ≈206 F)
67.4 ft bgs ( ≈209 F)
70.4 ft bgs ( ≈212 F)
Electrodes Offline
*Data spikes which exceed 20% of the adjacent values have been removed from the data set for presentation

33
addressed. Due to the lower hydraulic conductivity (resulting in lower groundwater inflow) and lower electrical resistivity, the UCRS is more conducive to heating than the RGA. The heating electrodes in the east area consist of typical 2 interval electrodes with electrodes, placed from 36-46 ft, 53 to 63 ft bgs. The western borings contained a third electrode placed from 18-26 ft bgs. The discussion that follows compares heating performance based on geologic formation, water table, and electrode depth.
All digiTAM™ sensors indicated attainment of target temperatures (194°F) in the targeted heated volumes above the potentiometric surface (≈53 ft bgs) by August 6, 2010, except for the 20 to 35 ft bgs depths at D46. By August 31, 2010, target temperatures was achieved for all depths below 30 ft bgs. The 194°F target temperatures was eventually achieved in all target heated intervals above 53 ft bgs by October 23, 2010. This 53-ft depth is below the UCRS and within the upper RGA. Target temperatures in heated volumes below the potentiometric surface were achieved at all digiTAM™s by July 5, 2010. Target temperatures were attained later in uppermost locations were heat loss was greatest due to the lack of electrodes above these settings; however, upper zone locations also experienced continued rises in temperature during periods of power outage, when vapor extraction was not active and heat was not being extracted from the subsurface.
D44 reached target temperature estimated at ~62 ft (i.e., reached target temperature at 60.4 ft, but did not at 64.4 ft). To put this in context, the target temperature was reached to a depth within a ft of the bottom electrode (63 ft) and extended through the upper RGA and 5 ft into the middle RGA. D44 also displayed differences in the rate of heating prior and subsequent to a period of power outage in mid and late July due to the removal of condensate buildup in extraction hoses and conveyance piping during the outage, resulting in a higher rate of heat removal from the subsurface after the outage.
Electrode downtime is illustrated on the temperature plots by the black outlined bars. It is clear from the temperature plots that the two most significant downtime events in May 2010 and July 2010 had an impact on heating and extended the time needed to reach target temperatures. Refer to Section 3.4.2 for a summary discussion of the downtime events and potential preventative measure for Phase II.
3.2.4 Southwest Treatment Area Heating Performance
Figures 16 and 17 present temperature monitoring results representative of the southwest treatment area at digiTAM™ location D07. D07 was centrally located in the treatment area and monitored temperatures in the depth interval from 20 to 93 ft bgs. Appendix C contains temperature data plots for the other digiTAM™ locations in the southwest treatment area.
The geologic setting and electrode placement are slightly different in the southwest area than the east area. The setting is important to understanding the heating performance. In the southwest treatment area, the UCRS extends deeper to an average depth of 57 ft bgs. The upper RGA (HU4 unit) extends from 57 ft to 67 ft bgs. The middle and lower RGA extend from 67 ft bgs to the top of the McNairy at 95 ft bgs. Heating performance discussed below also will tie into the aquifer being addressed. Recall that the lower hydraulic conductivity (resulting in lower groundwater inflow) and lower electrical resistivity makes the UCRS more conducive to heating than the RGA. The heating electrodes in the southwest area consists of typical 3 interval electrodes with electrodes placed from 18-28 ft, 36-46 ft, and 53-63 ft. For those borings surrounding D07 two additional electrodes were placed in the boreholes from 71-81 ft and 88-98 ft bgs. The discussion that follows compares heating performance based on geologic formation, water table, and electrode settings.
All digiTAM™ sensors in the southwest indicated attainment of target temperature (194°F) in the targeted heated volume above the potentiometric surface (≈ 53 ft bgs) by July 13, 2010, except for the 20 to 26 ft bgs depths at D01 and D04. By September 8, 2010, all sensors indicated that target temperature
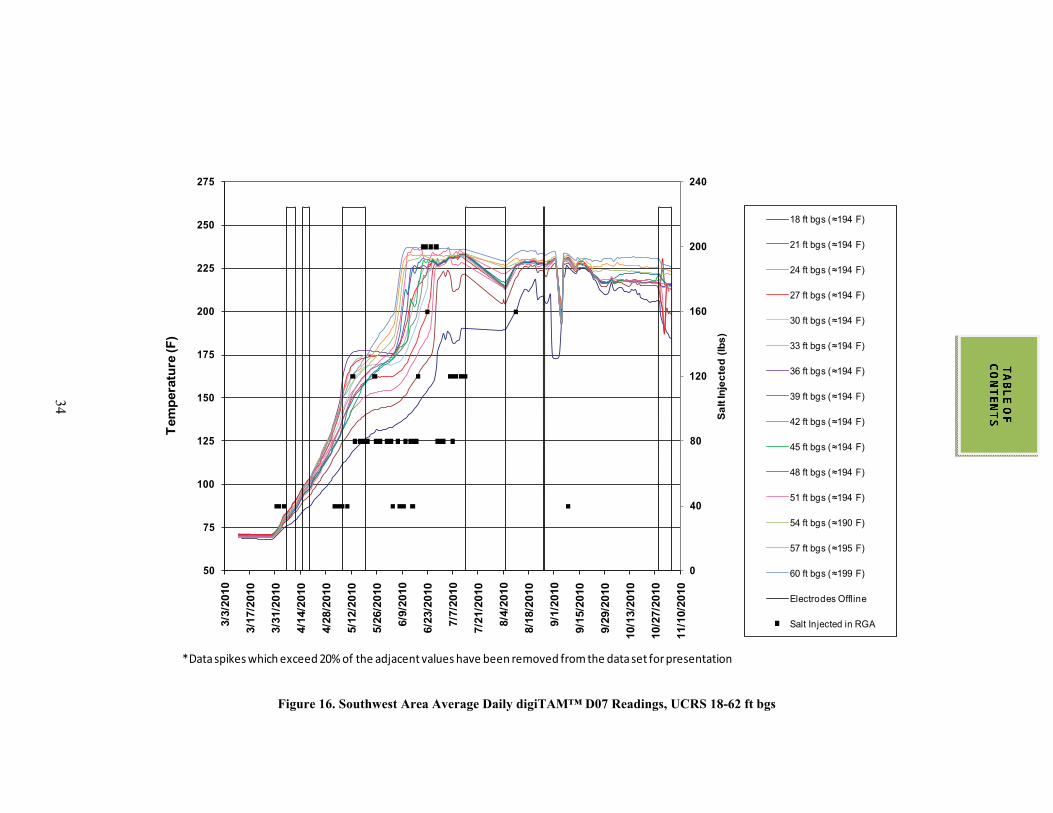
34
Figure 16. Southwest Area Average Daily digiTAM™ D07 Readings, UCRS 18-62 ft bgs
0
40
80
120
160
200
240
50
75
100
125
150
175
200
225
250
275
3/3/
2010
3/17
/201
0
3/31
/201
0
4/14
/201
0
4/28
/201
0
5/12
/201
0
5/26
/201
0
6/9/
2010
6/23
/201
0
7/7/
2010
7/21
/201
0
8/4/
2010
8/18
/201
0
9/1/
2010
9/15
/201
0
9/29
/201
0
10/1
3/20
10
10/2
7/20
10
11/1
0/20
10
Sal
t Inj
ecte
d (lb
s)
Tem
pera
ture
(F)
Southwest Area Average Daily* digiTAM™ D07 Readings, UCRS ���-62 ft bgs
18 ft bgs (�������
21 ft bgs (�������
24 ft bgs (�������
27 ft bgs (�������
30 ft bgs (�������
33 ft bgs (�������
36 ft bgs (�������
39 ft bgs (�������
42 ft bgs (�������
45 ft bgs (�������
48 ft bgs (�������
51 ft bgs (�������
54 ft bgs (������
57 ft bgs (������
60 ft bgs (�������
Electrodes Offline
Salt Injected in RGA
*Data spikes which exceed 20% of the adjacent values have been removed from the data set for presentation
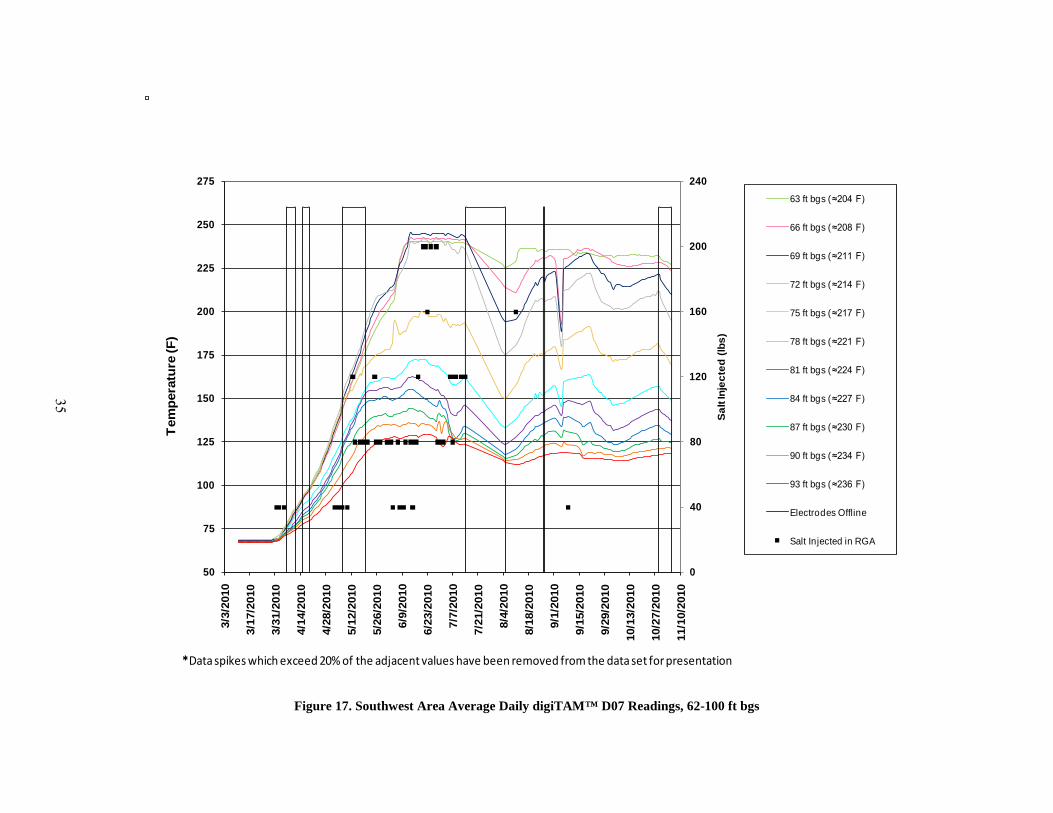
35
Figure 17. Southwest Area Average Daily digiTAM™ D07 Readings, 62-100 ft bgs
0
40
80
120
160
200
240
50
75
100
125
150
175
200
225
250
275
3/3/
2010
3/17
/201
0
3/31
/201
0
4/14
/201
0
4/28
/201
0
5/12
/201
0
5/26
/201
0
6/9/
2010
6/23
/201
0
7/7/
2010
7/21
/201
0
8/4/
2010
8/18
/201
0
9/1/
2010
9/15
/201
0
9/29
/201
0
10/1
3/20
10
10/2
7/20
10
11/1
0/20
10
Sal
t Inj
ecte
d (lb
s)
Tem
pera
ture
(F)
Southwest Area Average Daily* digiTAM™ D07 Readings, RGA ≈62-100 ft bgs
63 ft bgs (≈204 F)
66 ft bgs (≈208 F)
69 ft bgs (≈211 F)
72 ft bgs (≈214 F)
75 ft bgs (≈217 F)
78 ft bgs (≈221 F)
81 ft bgs (≈224 F)
84 ft bgs (≈227 F)
87 ft bgs (≈230 F)
90 ft bgs (≈234 F)
93 ft bgs (≈236 F)
Electrodes Offline
Salt Injected in RGA
*Data spikes which exceed 20% of the adjacent values have been removed from the data set for presentation*

36
had been achieved above the potentiometric surface (see Figure 16). As with the east area, target temperatures were attained later in uppermost locations where heat loss was greatest due to the lack of electrodes above these settings; however, upper zone locations also experienced continued rises in temperature during periods of power outage, when vapor extraction was not active and heat was not being extracted from the subsurface.
The target treatment volume in the southwest area included ERH infrastructure for heating in the RGA as a test of the Phase I design. DigiTAM D07 was installed to 93 ft bgs to measure heating throughout the RGA. As shown on Figure 17, target temperatures were not attained in the lower RGA, below approximately 72 ft bgs. The attainment of target temperature in the interval between 60 and 70 ft bgs in the southwest treatment area is a result of additional layers of electrodes stacked below this depth. This hypothesis is supported by Figure 15, which presents temperature response in the east treatment area from 64.4 ft bgs to 70.4 ft bgs where electrodes extended only to about 63.5 ft bgs. Target temperature was reached at 64.4 ft bgs, about 1 ft below the electrode, but fell off significantly at lower depths. Based on this observed response in the east area, it is clear that without benefit of additional deeper electrodes, the 60 to 70 ft bgs interval would not have been heated adequately in the southwest area. It is unclear from the data whether additional time or energy input to the electrodes would have enabled the east treatment area to reach target temperatures at 70 ft bgs (≈ 212° F) without benefit of deeper electrodes. If one assumes the slope of the heating curve for the 70.4 ft bgs depth was constant and continuous, target temperature may have been reached around January 2011. This analysis does not account, however, for the fact that the rate of energy input may not overcome the cooling effects of RGA groundwater flow and temperature stabilize below the target temperature.
Electrode downtime, due to system problems, is shown on the temperature plots by the black outlined bars. It is clear from the temperature plots that the two most significant downtime events in May 2010 and July 2010 had an impact on heating and extended the time needed to reach target temperatures. Refer to Section 3.4.2 for a summary discussion of the downtime events and potential preventative measure for Phase II.
The following operational contingency actions, as identified in the RAWP, were implemented to the extent practicable to attain target temperatures in the lower RGA of the southwest treatment area:
• Operated the electrodes at maximum voltage (277 volts) in an attempt to overcome the high formation resistivity, to replace energy removed in extracted water and vapor, and to heat cool water entering from the perimeter of the heated volume, and
• Injected salt to RGA electrodes in batches (as much as 200 pounds of salt added on some days) in an attempt to increase conductivity (see Figure 16 for injection dates and amounts).
To increase the rate of temperature rise in the RGA, an increase of power to the electrodes was needed. To achieve an increase in power at an electrode requires either an increase in voltage or injecting saline solution to increase the current. The voltage setting of RGA electrodes was at the maximum, therefore, the decision was made to inject saline solution to increase the electrode power. Power spikes were observed (as high as 17.8 kW in one instance) at the time of a batch injection of saline solution. Power at this same electrode was nominally 12.0 kW when saline was not being injected.
Salt water injection to RGA electrodes intended to maintain and/or increase formation conductivity and enable operation of electrodes at their maximum power was unsuccessful in enabling the system to achieve target temperatures in the deep RGA. Additional contingency actions identified in the RAWP are related to Phase II design and operations and will be evaluated and implemented, as appropriate, in a subsequent phase of the IRA.

37
3.3 VAPOR AND GROUNDWATER EXTRACTION PERFORMANCE
3.3.1 Vapor Extraction
Soil vapor extraction (SVE) as a component of ERH is a technology that is used to extract volatile compounds from unsaturated soil. During SVE, a vacuum is applied to an extraction well to lower the vapor pressure in the vicinity of the well. Lowering the pressure at the extraction well induces an advective flow of soil vapors and flow of groundwater containing VOCs (primarily TCE and its breakdown products) from regions of higher pressure to the extraction point. This process enhances the volatilization of contaminants from within grains of soil and promotes the diffusion of sorbed contaminants into soil pores where they can be swept and extracted along with soil vapors.
Vapor extraction performances is assessed by monitoring mass removal and ensuring that all areas with the treatment area had sufficient induced vacuum to recover the vapors generated by ERH. The latter metric is assessed by determining the radius of influence (ROI) generated by operating a vapor extraction well. The ROI for the individual vacuum points is assessed by measuring the vacuum induced at adjacent monitoring points. These metrics are discussed below.
Vapor extraction well locations are shown on Figures 3 and 4 for the east and southwest areas. Vapor extraction wells are designated on the figure by the letter “X” followed by a number (e.g., X27). A picture of a vapor extraction well is shown in Figure 18. Well field vacuum pressure was monitored at vacuum piezometers installed near the perimeter of the treatment areas. These are designated on the Figures 3 and 4 by the letter “V” followed by a number (e.g., V06) or by the letters “DV” follow by a number (e.g., DV07).
Figure 18. Vapor Extraction Well
Vapor Extraction Well

38
There were three vapor extraction wells and one contingency vapor extraction well (CX08) in the east treatment area. All vapor extraction points were connected to a common header, which transferred the TCE contaminated vapor to the treatment system for recovery.
East Treatment Area
Table 5 provides a summary of flow rates for vapor extraction points in the east area. Vapor extraction flow rates from the primary vapor extraction points, “X##” and “CX##” wells, ranged from 7.0 scfm to just over 26 scfm with average rates ranging from 14 scfm to 17 scfm. Table 6 presents a summary of east treatment area vacuum pressure measurements. Although maximum vacuum pressures of 5.5 and 4.2 inches of mercury were observed at monitoring locations V06 and DV07, respectively, many zero pressure readings were recorded. Pressure gauges installed on these vacuum monitoring locations were not sensitive enough to reliably measure/report operating pressures at levels that may have been as low as 1 or 2 inches of water (1 inch of mercury ≈ 13.6 inches of water). As a result, it was not possible to know for certain whether a zero pressure reading was indicative of no vacuum influence at the monitoring location or if it was just too low for the gauge to register. More sensitive gauges, capable of measuring vacuum pressure in inches of water, will be specified for use at vacuum monitoring locations in Phase II.
Table 5. East Area Weekly Well Field Flow Measurement Summary
Well ID Minimum Flow (scfm)
Maximum Flow (scfm)
Average Flow (scfm)
Count of Measurements
X26 8.7 24.4 14.0 15 X27 7.5 23.6 15.2 14 X28 7.3 26.4 17.0 15
CX08 7.1 22.2 14.1 6 scfm = standard ft3 per minute
Table 6. East Area Vacuum Measurement Summary
Monitoring Location
Minimum Vacuum
(inches Hg)
Maximum Vacuum
(inches Hg)
Average Vacuum
(inches Hg)
Count of Measurements
V06 0 5.5 1.8 91 DV07 0 4.2 0.3 91
inches Hg = inches of mercury
To address the issue of the standard gauges not being sensitive during routine operations, testing was conducted to determine the ROI using gauges rated in inches of water. Both the east area and southwest area were tested. The testing results are included in Table 7. The simple tests include a single vapor extraction well and a single observation point. Any result of measureable vacuum above 0.25 inches of water column is considered and is an indicator that the vacuum extended to that point. Although the distances may vary, this process provides a check to confirm that the system generated sufficient vacuum to recover the vapors generated by ERH. The data in Table 7 indicate that the single well vacuum ROI was variable, with vacuum observed at greater than 16 ft in most cases, however there were several locations where vacuum influence was not observed at 9 ft or less. The design for Phase I used a vapor point spacing of 26 ft or less. Using an expected ROI of 20 ft provides capture with this 26-ft spacing; however, response was not consistent across all datapoints. Some of the points did not have a response. This may be attributable to heterogeneous nature of the UCRS. The spacing of vapor points is being evaluated in Phase II.

39
Table 7. Vacuum Radius of Influence Testing during Pulsed Operation (October 25, 2011)
Area Vapor Point Operating
Observation Point
Vacuum Attained (Inches of
Water Column)
Approximate Distance between
Observation Point and
Closest Extraction
Wells
Comments
East X217 XE099 1 15 ft Confirmed influence
East CX08 XE104 5 8 ft Confirmed influence
Southwest XE006 X01
DV01 1 11 ft Confirmed influence
Southwest X05, XE022, and XE016
V02 1.5 16 ft Confirmed influence
Southwest X02, CX02, X04, CX01, and X03
XE24 XE18
XE007 V01
DV02 XE013 XE012 XE006 XE010 XE011
X01 X05
XE022 XE017 XE023 XE019
X06
1 1.5 1.5 1 0 0 0 0 0 0 0 0 0 0 0 0 0
6 ft 9 ft 6 ft
26 ft 22 ft 11 ft 10 ft 25 ft 10 ft 11 ft 25 ft 30 ft 16 ft 9 ft
12 ft 14 ft 22 ft
Confirmed combined ROI of up to 26 ft in 4 wells and did not observe influence of 1 inches WC at 12 wells. The average confirmed influence was 12 ft and the average not confirmed was 17 ft. Note the instrument was not sensitive enough to read down to 0.25 inches of water column (typical range to confirm ROI).
Southwest XE006 DV01 1 13 ft Confirmed influence
Southwest X05 V02 0.5 16 ft Confirmed influence
Throughout the treatment system start-up, testing, and routine operations, vapor samples were collected and analyzed to assess the progress of the IRA, to monitor the aboveground treatment system effectiveness, and to verify compliance with discharge criteria.
To assess the progress of the C-400 IRA, vapor samples were collected from vapor extraction wells and vapor extraction headers coming from the treatment areas. Vapor samples were collected periodically from various points in the vapor treatment stream to monitor the effectiveness of the treatment units. Samples were collected from the lead vapor phase carbon vessel discharge to determine if and when a carbon change out should be performed. Compliance with discharge criteria was monitored at the vapor treatment system stack. Vapor analyses were performed using photoacoustic analyzers and periodically by a DOECAP laboratory.

40
TCE concentrations in the vapor extraction header were monitored throughout operations using photoacoustic analyses. Figure 19 shows the east area header photoacoustic readings. These data indicate that asymptotic levels were achieved in the well field during August 2010. Pulsed operations commenced in early September 2010 and were stopped at the end of September 2010. The electrodes were turned off at the end of October 2010, while vapor extraction continued for approximately another month to continue mass removal during cool down. These various operational periods are shown graphically on Figure 19.
TCE vapor concentrations also were measured at vapor extraction wells using the photoacoustic analyzer. Figure 20 displays the east area average extraction well photoacoustic readings from the startup and testing through the end of operations (March 2010 to December 2010). Figure 21 shows a more detailed presentation of the results from August to December 2010. Table 8 provides a summary of east area photoacoustic measurements. Note that beginning approximately mid-October 2010, vacuum monitoring locations V06 and DV07 were added to the vapor extraction train to maximize mass recovery during cool down.
Table 8. East Area Photoacoustic Trichloroethene Readings Summary
Location Average (ppmv)
Minimum (ppmv)
Maximum (ppmv)
Count of Measurements
CX08 79.65 2 752 110 DV07 470.16 1.01 1,350 98 E102 569.60 440 755 10
East header 516.47 1.58 7,710 731 V06 599.15 3.73 1,500 100 X26 127.89 0 2,940 161 X27 151.43 1.14 9,280 144 X28 261.85 2.01 7,280 156
ppmv = parts per million by volume
There were six vapor extraction wells and two contingency vapor extraction wells (CX01 and CX02) in the southwest treatment area. All southwest area vapor extraction points were connected to a common header, which transferred the TCE contaminated vapor to the treatment system for recovery.
Southwest Treatment Area
Table 9 provides a summary of flow rates for vapor extraction points in the southwest area. Vapor extraction flow rates ranged from 0 scfm to nearly 46 scfm with average rates ranging from 13.4 scfm to 28.4 scfm. Table 10 presents a summary of southwest treatment area vacuum pressure measurements. Although vacuum pressures of three or more inches of mercury were observed at all of the monitoring points, there were many zero pressure readings recorded by operators during rounds. As was the case in the east area, the pressure gauges installed in the southwest were not sensitive enough to reliably measure/report operating pressures at levels that may have been as low as 1 or 2 inches of water.

41
ppmv – parts per million by volume
Figure 19. East Area Header Average Photoacoustic Readings
0
1000
2000
3000
4000
5000
6000
7000
8000
3/23
/201
03/
30/2
010
4/6/
2010
4/13
/201
04/
20/2
010
4/27
/201
05/
4/20
105/
11/2
010
5/18
/201
05/
25/2
010
6/1/
2010
6/8/
2010
6/15
/201
06/
22/2
010
6/29
/201
07/
6/20
107/
13/2
010
7/20
/201
07/
27/2
010
8/3/
2010
8/10
/201
08/
17/2
010
8/24
/201
08/
31/2
010
9/7/
2010
9/14
/201
09/
21/2
010
9/28
/201
010
/5/2
010
10/1
2/20
1010
/19/
2010
10/2
6/20
1011
/2/2
010
11/9
/201
011
/16/
2010
11/2
3/20
1011
/30/
2010
12/7
/201
012
/14/
2010
12/2
1/20
10
ppm
vEast Area Header Average Photoacoustic Readings
trichloroethene
Electrodes of f
Pulsed Operations

42
ppmv – parts per million by volume
Figure 20. East Area Average Extraction Well Photoacoustic Readings
0
1000
2000
3000
4000
5000
6000
7000
8000
9000
10000
3/23
/201
03/
30/2
010
4/6/
2010
4/13
/201
04/
20/2
010
4/27
/201
05/
4/20
105/
11/2
010
5/18
/201
05/
25/2
010
6/1/
2010
6/8/
2010
6/15
/201
06/
22/2
010
6/29
/201
07/
6/20
107/
13/2
010
7/20
/201
07/
27/2
010
8/3/
2010
8/10
/201
08/
17/2
010
8/24
/201
08/
31/2
010
9/7/
2010
9/14
/201
09/
21/2
010
9/28
/201
010
/5/2
010
10/1
2/20
1010
/19/
2010
10/2
6/20
1011
/2/2
010
11/9
/201
011
/16/
2010
11/2
3/20
1011
/30/
2010
12/7
/201
012
/14/
2010
12/2
1/20
10
ppm
v
East Area Average Extraction WellTrichloroethene Photoacoustic Readings
X26 X27
X28 CX08
DV07 V06
See Figure 17 for detail for August to December

43
ppmv – parts per million by volume
Figure 21. East Area Average Extraction Well Photoacoustic Readings August to December 2010
0
200
400
600
800
1000
1200
1400
1600
1800
2000
7/31
/201
0
8/7/
2010
8/14
/201
0
8/21
/201
0
8/28
/201
0
9/4/
2010
9/11
/201
0
9/18
/201
0
9/25
/201
0
10/2
/201
0
10/9
/201
0
10/1
6/20
10
10/2
3/20
10
10/3
0/20
10
11/6
/201
0
11/1
3/20
10
11/2
0/20
10
11/2
7/20
10
12/4
/201
0
12/1
1/20
10
ppm
v
East Area Average Extraction WellTrichloroethene Photoacoustic Readings
August 2010-December 2010
X26 X27
X28 CX08
DV07 V06
43

44
Table 9. Southwest Area Weekly Well Field Flow Measurement Summary
Well # Minimum Flow (scfm)
Maximum Flow (scfm)
Average Flow (scfm)
Count of Measurements
X01 5.4 33.1 24.9 12 X02 11.1 45.9 28.4 11 X03 7.6 24.9 17.8 13 X04 12.2 27.6 22.5 13 X05 8.6 27.6 17.6 12 X06 13.5 32.4 24.1 12
CX01 5.5 27.9 13.4 10 CX02 0 37.6 17.6 10
scfm = standard ft3 per minute
Table 10. Southwest Area Vacuum Measurement Summary
Monitoring Location
Minimum Vacuum
(inches Hg)
Maximum Vacuum
(inches Hg)
Average Vacuum
(inches Hg)
Count of Measurements
V01 0 13.5 1.043 93 V02 0 3 0.048 93
DV01 0 5 0.679 93 DV02 0 4 .0.579 93
inches Hg = inches of mercury
TCE concentrations in the southwest vapor extraction header were monitored throughout operations using photoacoustic analyses. Figure 22 shows the southwest area header photoacoustic readings.
TCE vapor concentrations also were measured at southwest vapor extraction wells using the photoacoustic analyzer. Figure 23 displays the southwest area average extraction well photoacoustic readings from the startup and testing through the end of operations. Figure 24 shows the southwest area average extraction well photoacoustic readings from August to December 2010. Table 11 provides a summary of southwest area photoacoustic measurements.
Pressure gauges installed for the vacuum wells were scaled in inches of mercury. These gauges were appropriate for the extraction wells operating at a range of 10-12 inches of mercury; however, the same gauges were used at the perimeter vacuum measuring points and were not sensitive enough to accurately measure vacuum less than 1 inch of mercury (13.6 inches of water).
Perimeter vacuum levels were variable and tended to decrease with increasing temperature. Pressure gauges installed at vacuum piezometers displayed pressure in units of inches of mercury. This generally was not an appropriate unit of measure for vacuum pressures that could be less than one inch of water (1 inch of mercury = 13.6 inches of water) at perimeter monitoring locations. As a result, a significant number of zero pressure readings (< 1 inches mercury or 13.6 inches of water) were recorded in inches of mercury during operations; however, there may have, been a vacuum established that was not detectable with the pressure gauges used. This lesson learned will be applied to Phase II.
3.3.2 Groundwater Extraction
Six multiphase extraction wells were installed and equipped with pumps (X001, X002, X003, X004, X005, and X006) in the southwest treatment area, and three multiphase extraction wells were installed and equipped with pumps (X26, X27, and X28) in the east treatment area (see Figures 3 and 4 for well

45
ppmv – parts per million by volume
Figure 22. Southwest Area Header Average Photoacoustic Readings
0
200
400
600
800
1000
1200
1400
3/23
/201
03/
30/2
010
4/6/
2010
4/13
/201
04/
20/2
010
4/27
/201
05/
4/20
105/
11/2
010
5/18
/201
05/
25/2
010
6/1/
2010
6/8/
2010
6/15
/201
06/
22/2
010
6/29
/201
07/
6/20
107/
13/2
010
7/20
/201
07/
27/2
010
8/3/
2010
8/10
/201
08/
17/2
010
8/24
/201
08/
31/2
010
9/7/
2010
9/14
/201
09/
21/2
010
9/28
/201
010
/5/2
010
10/1
2/20
1010
/19/
2010
10/2
6/20
1011
/2/2
010
11/9
/201
011
/16/
2010
11/2
3/20
1011
/30/
2010
12/7
/201
012
/14/
2010
12/2
1/20
10
ppm
vSouthwest Area Header Average Photoacoustic Readings
trichloroetheneElectrodes of fPulsed Operations

46
ppmv – parts per million by volume
Figure 23. Southwest Area Average Extraction Well Photoacoustic Readings
0
200
400
600
800
1000
1200
1400
1600
1800
3/23
/201
03/
30/2
010
4/6/
2010
4/13
/201
04/
20/2
010
4/27
/201
05/
4/20
105/
11/2
010
5/18
/201
05/
25/2
010
6/1/
2010
6/8/
2010
6/15
/201
06/
22/2
010
6/29
/201
07/
6/20
107/
13/2
010
7/20
/201
07/
27/2
010
8/3/
2010
8/10
/201
08/
17/2
010
8/24
/201
08/
31/2
010
9/7/
2010
9/14
/201
09/
21/2
010
9/28
/201
010
/5/2
010
10/1
2/20
1010
/19/
2010
10/2
6/20
1011
/2/2
010
11/9
/201
011
/16/
2010
11/2
3/20
1011
/30/
2010
12/7
/201
012
/14/
2010
12/2
1/20
10
ppm
v
Southwest Area Average Extraction WellTrichloroethene Photoacoustic Readings
CX01 CX02
X01 X02
X03 X04
X05 X06

47
ppmv – parts per million by volume
Figure 24. Southwest Area Average Extraction Well Photoacoustic Readings August to December 2010
0
50
100
150
200
250
300
350
4007/
31/2
010
8/7/
2010
8/14
/201
0
8/21
/201
0
8/28
/201
0
9/4/
2010
9/11
/201
0
9/18
/201
0
9/25
/201
0
10/2
/201
0
10/9
/201
0
10/1
6/20
10
10/2
3/20
10
10/3
0/20
10
11/6
/201
0
11/1
3/20
10
11/2
0/20
10
11/2
7/20
10
12/4
/201
0
12/1
1/20
10
ppm
v
Southwest Area Average Extraction WellTrichloroethene Photoacoustic Readings
August 2010-December 2010
CX01 CX02
X01 X02
X03 X04
X05 X06

48
Table 11. Southwest Area Photoacoustic Trichloroethene Readings Summary
Location Average (ppmv)
Minimum (ppmv)
Maximum (ppmv)
Count of Measurements
CX01 27.52 0 80.40 115 CX02 56.33 3.33 102 140
SW header 169.58 2.77 1,640 734 X01 4.95 0 60.80 135 X02 134.25 0 225 160 X03 62.99 0 454 159 X04 98.35 0 437 160 X05 28.01 0 152 155 X06 3.15 0 9.42 125
ppm = parts per million by volume
locations). Groundwater was extracted via these submersible pneumatic pumps during system operations to maintain hydraulic control in the treatment area and to aid in the transport of VOCs to the multiphase extraction wells. Deep RGA groundwater extraction wells in the southwest treatment area were installed with the bottom of the well screen set at the RGA/McNairy interface and included a 2-ft sump extending into the McNairy Formation to maximize direct DNAPL recovery. Table 12 provides a summary of groundwater extraction data from Phase I operations. One measure of the degree of hydraulic control is the ratio of the amount of water extracted to the amount of water injected. For the southwest well field, 1.7 times more water was extracted from the southwest well field as was injected. In the east, the ratio was 1.6. The average extraction rate for individual southwest treatment area wells was 2.0 gpm, for a total of 11.8 gpm. The average extraction rate for individual wells in the east area was 2.6 gpm, for a total of 7.9 gpm.
Sample ports installed at each groundwater extraction wellhead allowed groundwater samples to be obtained. Groundwater sample analyses results were presented previously in Section 3.1.3.
Table 12. Extracted and Injected Groundwater during Phase I
SW Area East Area Average Flow Rate by Area (gpm) Average Flow Rate per Well (gpm)
≈ 11.8 ≈ 2.0
≈ 7.9 ≈ 2.6
Groundwater Extracted (gal) ≈ 2,790,675 ≈ 1,610,860 Groundwater Injected (gal) ≈ 1,610,860 ≈ 992,260
Ratio of Extracted Groundwater to Injected Groundwater 1.7 1.6
Digital pressure acquisition modules (digiPAM™s) installed to provide information relative to water levels inside and outside of the treatment areas did not provide reliable data. This instrumentation did not have the capability to accurately measure what likely was to be very small drawdown levels in interior monitoring locations. Steam is generated in situ during heating. The presence of steam at the water/vadose zone interface also resulted in steam in the digiPAM™ drop tubes. Because the digiPAM™ works by referring to a liquid phase density, it will not provide reliable data if steam is present in the drop tube. The use of these instruments is under review for Phase II.
During Phase I operations, sand and sediment infiltrated the six groundwater extraction wells located in the southwest treatment area. The southwest extraction wells extended through the RGA to the McNairy interface. The infiltration is believed to have been caused by a combination of the wells being underdeveloped and the well screen slot size being too large. On a few occasions, the buildup of sand and

49
sediment was significant enough to incapacitate the pumps. The pumps had to be removed to be serviced and the wells flushed to remove the sediment build up. The solids also negatively impacted operations at the soil vapor and groundwater treatment system (SVGTS) by plugging and filling the filter bags. This resulted in additional system downtime for replacement of the filter bags. The east area extraction wells were not affected by the infiltration of solids as they did not penetrate the RGA. The design of future groundwater extraction wells will specify a smaller well screen slot size and require a more rigorous well development technique. Figure 25 shows a picture of sediment accumulation in the vapor extraction header pipe during Phase I operations.
Figure 25. Sediment in the Vapor Extraction Header
3.4 INSTALLATION AND OPERATIONS
This section briefly describes the activities and time frames associated with Phase I installation and operations and includes a discussion of observations made during and after these activities.
3.4.1 Installation
Phase I installation in the southwest and east treatment areas began in December of 2008. Installation of the subsurface ERH equipment involved rotosonic drilling of borings within which the electrodes, multiphase extraction wells, temperature monitoring strings, vacuum piezometers, and water level monitoring instruments were installed. Figures 3 and 4 show the locations of the various ERH borings (electrodes, multiphase extraction wells, temperature monitoring strings, vacuum piezometers, and water level monitoring instruments) for the Phase I areas. A total of 83 ERH borings were drilled and completed with ERH equipment within the approximately 9,000 ft2 footprint of the southwest and east treatment areas. Drilling and subsurface completion of ERH components (electrodes, multi-phase extraction wells, temperature monitoring strings, vacuum piezometers, and water-level monitoring instruments) was completed in June 2009. Drilling and subsurface installations were complicated by the following factors:
• The treatment area is located within the footprint of an active United States Enrichment Corporation (USEC) facility requiring careful logistical coordination and planning.
• Space limitations limited the number of drill rigs that could be utilized at one time.

50
• Drilling had to be performed while wearing Level B respiratory protection due to the presence of high levels of TCE and other VOCs in worker breathing zones.
• Drill rig operators had a learning curve to understand the varying subsurface lithology at the Paducah Site.
• Multiple borings required hand clearing due to the presence of numerous subsurface utilities located in the treatment areas.
• Overhead utilities in the treatment areas required the use of a modified short mast drill rig at several boring locations requiring additional labor and time.
• Drilling fluids coming to the surface while drilling the larger electrode borings.
• Extremely cold temperatures in December 2008 and January 2009 caused freezing of drill rig water lines.
• An ice storm delayed construction for approximately two weeks in January 2009.
• A drill rig hoist cable broke and caused a two week delay in May 2009.
A SVGTS to remove VOCs, primarily TCE, from soil vapor and groundwater was constructed on the east side of the C-400 Cleaning Building. Figure 26 shows the arrangement of the aboveground treatment equipment. Figure 27 is a picture of the aboveground treatment system. Surface construction also involved installation of infrastructure for delivery of utilities such as electricity, water, and compressed air to the well field and for conveyance of extracted soil vapor and groundwater from the well field to the SVGTS. Key components of the SVGTS included the following:
• An enclosed groundwater treatment system with solids filtration, DNAPL separation, air stripping, ion exchange, and activated carbon polishing,
• Enclosed vacuum blower system,
• Cryogenic condensation units for removal of TCE from the vapor stream,
• Automated monitoring of stack emissions,
• Integrated programmable logic controller to monitor system operations, and
• A backup generator with automatic transfer switching to power key systems.
Figure 28 is a picture of portions of the SVGTS. New overhead power lines and transformers were installed to deliver electricity to the ERH power delivery systems and to the SVGTS. Water lines, vapor transfer lines, and compressed air lines were installed high on the south face of the C-400 Building to connect the SVGTS on the east side of C-400 to the southwest treatment area. A number of ERH subsurface components were installed south of the active railroad in the southwest area and had to be tied in by lines installed on an overhead pipe rack. In order to provide uninterrupted access to a roll-up door on the southwest corner of the C-400 Cleaning Building, several ERH components were completed in vaults below grade. Connecting lines and pipes were run below grade in concrete filled trenches.

EXISTING ROADWAY
BUILDING C-400M
ATC
H L
INE
P7D
C40
000A
019
MA
TCH
LIN
EP
7DC
4000
0A01
9
CAAS
CAASPROP
PROP
M-A002
A
C-A010
N
R
51
Figure 26. Groundwater/Vapor Treatment System Equipment Layout

THIS PAGE INTENTIONALLY LEFT BLANK

53
Figure 27. Picture of Groundwater/Vapor Treatment System Area
East Treatment Area
Southwest Treatment Area
Power Delivery Systems
Liquid Treatment System
Operations Trailer
Settling Tank
Vapor Treatment SystemCooling Tower
Water Circulation Units

54
Figure 28. Portions of the SVGTS
Phase I construction was considered substantially complete in December 2009, at which time system commissioning and testing began.
3.4.2 Operations
Commissioning and testing began with testing the SVGTS using ambient air and potable water in a logical sequence to ensure that the subsystems worked correctly. Batch treatment operations then were performed to ensure VOC removal by the SVGTS met design criteria.
Prior to commencement of normal operations, extensive step and touch potential testing was implemented in and around the energized well fields to identify and eliminate induced voltages greater than 15 volts (based on the National Electric Code) on conductive surfaces. More than 550 measurements were taken revealing only minor excursions of 3.8–4.4 volts on a section of header pipe and on monitoring well bollards and riser pipe in the east well field. These conductive surfaces were covered by insulating material to eliminate the hazard. Subsequent step and touch potential readings at these locations were approximately 0.2 volts. In addition to the step and touch potential testing performed by the project team, PGDP personnel performed independent step and touch potential testing inside the C-400 Cleaning Building. The threshold criterion used by PGDP was a much more conservative 1-volt limit. No problematic areas were identified during PGDP testing. Throughout normal operations, step and touch potential testing also was performed daily during normal work days and whenever transformer tap changes were initiated. Step and touch potential testing for Phase II will be more extensive than that performed for Phase I due to the larger number of electrodes in close proximity to the C-400 Building and the SVGTS.
System testing was concluded in March 2010 and normal operations began. The following are examples of challenges that were encountered during normal operations.
• Excessive condensate in the vapor header required a 14-day shut down in May to install condensate purge pumps, as shown in Figure 29. Four condensate pumps were installed at various locations in the
Liquid Carbon Cells
Liquid Ion Exchange Cells DNAPL Separation Tanks
Heat Exchanger
Air Strippers
Bag Filters

55
vapor header. Additionally, insulation was added to the vapor header to help with condensation issues as shown in Figure 30.
Figure 29. Condensate Pump
Figure 30. Condensate Pump and Insulated Vapor Header
Condensate Pump
Condensate Pump
Vapor Header Insulation

56
• During an operational day in May 2010, the project operated for a period of approximately 3.5 hours without the effluent vapors being monitored by the installed photoacoustic analyzer. Modifications being performed in the photoacoustic analyzer enclosure coupled with a storm event led to the unmonitored operational period. As a result of this incident, an alarm and interlock was instituted to alert the operational staff if the reading from the photoacoustic analyzer doesn’t change, prompting the operations staff to investigate/inspect the photoacoustic analyzer. If no change in reading occurs in 3 minutes, an interlock shuts down the vapor treatment system to preclude effluent vapors above release limits during unmonitored periods.
• In July 2010, the project experienced a loss of power due to a failed transformer and feeder. This was compounded by the fact that the standby diesel generator failed after only a few minutes of operation. The diesel generator was repaired and made operable the following work day. While the vapor treatment system was designed to operate with one vacuum blower to maintain vapor extraction, the pressure/vacuum control valves are controlled by compressed air. The project’s air compressor is not powered from the emergency buss. A diesel-powered compressor was obtained to pressurize the compressed air header periodically to allow for the modulation of these blower control valves. Normal system operations were restored with the restoration of normal power following a 19-day power outage. A back-up air compressor (Instrument Air Compressor) was installed to allow for modulation of control valves. This compressor is powered from the emergency buss.
• In October 2010, the check valve in the back-flow preventer to the site potable water system failed, allowing a piece of the check valve disc to become lodged in the potable water supply solenoid to the hot groundwater tank. This prevented the solenoid valve from seating properly, and the hot groundwater tank overflowed for a period of time sufficient to overflow the containment berm to the surrounding ground area. When the operations staff arrived on-site, potable water was isolated at the hydrant supply to the project. A strainer was installed in this potable water supply line to prevent a reoccurrence of this problem.
Project team experience utilizing the cryogenic condensation technology revealed that, while this technology was effective at recovering TCE from soil vapors, it presented significant installation and operating challenges. The higher production units specified for the C-400 project were new models and did not appear to be as commercially mature as smaller units provided by the equipment supplier on other VOC recovery projects. As a result, the quality of installation and operation guidance was less than optimal.
Normal operations continued through September 2010 when TCE concentrations in recovered vapor had dropped to asymptotic levels. Pulsed operations then were initiated as detailed in the Paducah C-400 Project Pulsed Operations Plan (McMillan-McGee, September 2010). The strategy for the pulsing operations was intended to maximize removal of the remaining contaminants from the treatment area by maximizing extraction from the wells and by varying the pressure levels within the subsurface. To maximize the extraction from individual wells, a pattern was initiated that consisted of operating half of the wells while the remaining half were shut down. To vary subsurface pressures, the extraction rates were reduced or increased concurrently with varying the power levels to the electrodes. VOC readings then were taken from the wells with maximum extraction continuing at well locations with the highest VOC concentrations. The process was then repeated for two cycles. Pulsed operations ended in October 2010 and power to the electrodes was turned off at the end of October 2010. Vapor extraction continued for approximately five weeks to facilitate subsurface cooling.

57
4. PRELIMINARY DESIGN CONSIDERATIONS
This section is intended to provide a preview of Phase II design considerations that have been identified for the C-400 IRA based on the experience and lessons learned from Phase I. Key Phase II design considerations are presented for soil heating, contaminant recovery, and for SVGTS improvements.
4.1 ELECTRICAL RESISTANCE HEATING
4.1.1 UCRS Heating
The Phase I ERH design, specifically electrode location, electrode spacing, and power delivery, was adequate and achieved target temperatures throughout the 20 to 60 ft bgs target depth interval in the east and southwest treatment areas. No significant design revisions are indicated for heating this 20- to 60-ft bgs depth interval in the Phase II southeast treatment area.
4.1.2 RGA Heating
To test the viability of heating the deep RGA, electrodes were installed through the RGA in the central portion of the southwest treatment area. Target temperatures were not achieved in the RGA below about 70 ft bgs. Target temperatures were achieved in the upper RGA interval between 60 and 70 ft bgs. Heating in this depth interval (the upper RGA) benefitted from resistive and potentially from convective heating provided by a layer of electrodes installed at approximately 70 ft bgs and below.
The Phase I design implemented to test deep RGA heating was insufficient. The highest temperature attained in the lower RGA at 93 ft bgs was more than 100°F lower than the target temperatures for that depth. Numerous contingency responses were implemented as identified in the RAWP, including salt water (electrolyte) injection at RGA electrodes and operation of RGA electrodes at maximum power. However, these additional measures were not effective in assisting the heating operations and attainment of target temperatures in the lower RGA.
Section 4.1.4 presents the results of a numeric simulation exercise performed by ERH subcontractor Mc2 to evaluate a design capable of heating the RGA to target temperatures.
4.1.3 Groundwater Velocity, Soil Resistivity, and Groundwater Conductivity
Likely reasons for poor heating performance in the lower RGA include insufficient heating due to the potential for a higher range of groundwater flow velocities for the lower RGA than assumed in the design, and/or higher soil resistivity than assumed in the design.
The initial C-400 ERH design, as documented in the RDR (DOE 2008b), was based on a numeric simulation using an expected groundwater velocity of 1 ft/day in the RGA. Because of uncertainty as to the groundwater velocity, additional scenarios based on velocities of 3 ft/day and 6 ft/day also were modeled. In the 2008 design, the project team concluded that a groundwater velocity of 3 ft/day would require additional upgradient preheating and upgradient groundwater extraction to achieve target temperatures. A DOE initiated independent technical review team (ITR 2007) reviewed the design. The ITR team commented that the model structure and inputs may not have accurately simulated heating in the RGA. In addition to doubts that the groundwater velocity was limited to 1 ft/day in the RGA, the review team described the phenomena of “large scale convection” that would tend to pull additional cool water into the heated zone near the bottom and discharge warm water from the upper portion of the

58
treatment area. This “large scale convection” and internal flow currents within the heated zone would place an even higher power demand on the electrodes to achieve target temperatures.
The initial simulations included calculations for the required power delivered to the individual electrodes for the different simulations. For the southeast area, the power delivery is summarized in the Table 13 taken from the RDR (DOE 2008b).
Table 13. Power Requirements for Various Simulated Groundwater Velocities
Unit Simulated Groundwater Velocity (ft/day) Power Required to Reach Target Temperature (kW/electrode)
UCRS Assumed stagnant (no contribution from surrounding UCRS water in all simulations)
6.2
RGA Stagnant conditions 6.2 RGA 1 8.1 RGA 3 12.8 RGA 6 18.8
For design planning purposes, the electrode power demand was predicted to be between 8.1–12.8 kW/electrode. The design included the option of saltwater injection as a contingency measure to assist in attainment of target temperatures. Saltwater injection lowers formation electrical resistivity. A lower electrical resistivity allows for more current, hence more power is delivered to the subsurface.
Uncertainty associated with predicted groundwater velocity and the impact of potential large scale convective flow currents, as well as the concern that the numeric simulation may not have accurately simulated heating in the RGA, led to the decision to implement a phased deployment of ERH at C-400 as a means of mitigating the risks associated with thermal performance issues in the lower RGA. The design of the ERH system for the southwest treatment area was revised to include electrodes, extraction wells, and digiTAM™ monitoring borings to evaluate heating through the RGA. Also in response to ITR comments, the extraction well design was revised to have the well screen extend to the RGA/McNairy interface and provide for a sump at the bottom of the well to maximize direct DNAPL recovery. Direct DNAPL recovery from the extraction well sumps was not observed during Phase I. Piezometers and vapor extraction contingency wells also were added to the design in response to input from the ITR to provide vacuum monitoring capabilities and additional vacuum extraction capacity during operations.
The model also considered electrical resistivity of the saturated soil matrix in the simulation of thermal response. Samples of UCRS and RGA material from the C-400 area were tested in the Mc2 electro-thermal laboratory to determine its electrical resistivity. Where necessary, laboratory tap water was added to sample material to replicate saturated conditions. Tap water conductivity ranged from 320 µS/cm to 490 µS/cm. This is comparable to RGA groundwater conductivity, which is approximately 395 µS/cm; therefore the tap water did not negatively affect test results. Electrical resistivity of UCRS samples ranged from 23 ohm meters to 93 ohm meters. A resistivity of 38 ohm meters was used in the simulation for the UCRS because it was representative of the thickest layer of UCRS soils. The RGA material tests yielded results ranging from 50 ohm meters to 134 ohm meters. A value of 103 ohm meters was used in the simulation for the RGA soils because it was determined to be representative of the mid range of the values determined from RGA samples.
As reported previously, the Phase I ERH system was unable to heat the RGA to target temperatures, despite the addition of up to 200 lbs of salt per day during water injection and application of maximum power to electrodes (maximum sustained 12kW/electrode). This suggests that the original design, location and spacing of electrodes, number of electrodes, and power delivery system capacity were insufficient to overcome groundwater flux and high electrical resistivity encountered in the RGA.

59
4.1.4 Phase II Preliminary Design Simulation for ERH in the RGA
At the conclusion of Phase I operations and after having evaluated ERH performance in the RGA, LATA Kentucky tasked Mc2 to develop an ERH layout and demonstrate via numeric simulation the design configuration required to effectively heat the RGA to target temperatures. The complete results of this exercise are included in Appendix A of this document.
The scope required Mc2 to estimate RGA groundwater velocity based on observed temperature response in the RGA in the southwest treatment area. Mc2 estimated the flow velocity to be approximately 3.0 ft/day at 72 ft bgs and at 81 ft bgs and approximately 1.9 ft/day at 93 ft bgs. Mc2 simulated a 3.0 ft/day groundwater velocity and a 6 ft/day scenario. The model also utilized an electrical resistivity value of 106 ohm meters for RGA soils based on Phase I observed conditions. This was an increase from the 103 ohm meters obtained during laboratory testing. The increase is not significant with regard to the incremental impact on heating. The electrical resistivity is key to the amount of power an electrode can successfully deliver to the subsurface. As noted in Appendix A, “Figure 2.6 shows the temperature distribution as shown in figure 2.5, except in this case, the perimeter electrodes are operated at maximum power, which field data to date suggests is approximately 12 kW/electrode.”
Based on review of the ERH design modeling performed by Mc2 (including 2007 design modeling and 2010 simulations for Phase II), delivery of power, even with the closer spacing, will be the key to success for heating the RGA. During Phase I, the maximum sustained power to an electrode was 12kW/electrode even with brine addition. Also note that the operation included system upsets and could not continuously operate without outages. With these system challenges, the maximum power to an electrode needs to have a capacity above the modeled requirement. The Phase II modeling results indicate that 17% more power than was attained during Phase I will be required at each electrode. Experience gained during Phase I suggests that contingency measures identified and implemented in Phase I were not successful in applying sufficient power to heat the subsurface.
Table 14 provides a summary of the modeling simulations by McMillan-McGee (Mc2) for Phase II (Appendix A of this report).
Table 14. Comparison of Numerical Simulations for Phase II
Figure (Appendix A)
RGA Groundwater
Velocity (ft/day)
Upgradient Groundwater
Extraction Wells?
Electrode Power
(kW/electrode)
Meet Target
Temp RGA @ 82–92 ft
bgs?
Comments
2.5 3 No 12 max No Base design power2.6 3 No 12.5 No Scenario includes
perimeter electrodes at 12.5 kW/electrode and 8 kW/electrode for interior locations
2.7/2.8 3 Yes (22 gpm) 14 Yes Simulated electrode power requirement is 17% higher than observed during Phase I (12kW/electrode)
2.9 6 yes 14 No

60
Information and documentation provided by Mc2 appears to convey a sound and reasonable approach for Phase II; however, the modeling results and Phase I operational experience indicate that ether is little room for error in the design if the RGA has a velocity of 3 ft/day.
A telling statistic for the operation of ERH in Phase II is that the total predicted energy used in 180 days of operating Phase II is 7,150 MWhrs equating to an energy density of 870 kW-HR/m3 (see Appendix A). The Mc2 report (Appendix A) states that this is much higher than the normal energy density (200 kW-HR/m3) required for a thermal remediation project (volatilization of TCE in the subsurface). Of the 870 kW-HR/m3 needed to achieve a target temperature, 170 kW-HR/m3 is needed for thermal remediation, and the additional 700 kW-HR/m3 is the energy penalty required to address the cooling effects of groundwater. In other words, the design requires 335% more energy by volume than what typically is required (200 kW-HR/m3) to attain temperatures associated with thermal remediation (volatilization of TCE in the subsurface).
Although this design has significant hurdles, to be complete in the evaluation, LATA Kentucky has prepared a comparison to the original Phase II design and the redesign based on lessons learned in Phase I discussed above.
Table 15 provides a comparison of the ERH design basis presented in the RDR to the preliminary design basis indicated by the most recent Mc2 modeling effort and also presents a comparison of the estimated costs associated with each configuration. Implementation of the original Phase II design for lower RGA heating only was expected to cost approximately $7.2M. The rough order of magnitude cost for implementation of the revised configuration for RGA heating based on the preliminary design basis provided by Mc2, the associated impacts to the UCRS component spacing, additional electrical power, and contingency (12%) is approximately $14.5M. Figure 31 shows a plan view of the RDR ERH layout. For comparison, Figure 32 provides the ERH layout required for heating the RGA, as shown in the preliminary design basis indicated by the most recent Mc2 modeling effort. In summary, results of the simulation indicated the following: • In order to heat the RGA, 239 electrodes in 81 borings would be required. When compared to the
base design, this is an increase of approximately 76% in the number of electrodes required.
• Forty-three additional borings, with two electrodes in each boring, are needed on the perimeter and upgradient of the treatment volume to preheat the groundwater.
• Much higher than normal energy density associated with aggressive heating is needed at the perimeter electrodes.
• Reaching the necessary power levels in the deep RGA will require more closely spaced electrodes, (reduced from 21 ft apart to 18 ft), higher operating voltage to RGA electrodes (347 volts versus–277 volts), and continuous saline injection.
• A mixture of granular graphite and silica sand would need to be placed in the 1-inch annulus between RGA electrodes and the formation wall to boost electrical conductivity.

61
Table 15. Phase IIb Specific Design Revisions and Associated Rough Order of Magnitude Costs
Component Original Phase IIb Design (Lower RGA)
Revised Phase IIb Design (Lower RGA)
Electrode Borings 46 811 Electrodes: 136 239 U-D Electrodes 46 81 R-S Electrodes 46 81 R-D Electrodes 44 77
Extraction Wells 16 25
Vapor Only 0 2
GW Only 0 4
GW & Vapor 16 19
Contingency Extraction Wells 4 3 DigiTAM™ Wells 19 21 Vacuum Monitoring Wells 4 3 DigiTAM™/Vacuum Monitoring Wells
2 2
Peak Power 1,261 kW 2,623 kW U-D Electrodes 7.2 kW/electrode 8.0 kW/electrode R-SD Electrodes 9.3 kW/electrode 12.5 kW/electrode Average Power 1,095 kW 2,242 kW U-D Electrodes 6.2 kW/electrode 7.0 kW/electrode R-SD Electrodes 8.1 kW/electrode 10.6 kW/electrode Total Energy (Nine Months Operations)
7,096 MW-Hr 14,528 MW-Hr (2812 MW-Hr)2
Vapor Extraction Rate 387 scfm 500 scfm Vacuum level at Extraction Wells 10 to 12 inches Hg 12 to 18 inches Hg Groundwater Extraction Rate 51 gpm 79.3 gpm Upgradient Wells 9 gpm
(2 wells @ 4.5 gpm/well) 22 gpm
(4 wells @ 5.5 gpm/well) Other R-SD Wells 42.0 gpm
(14 wells @ 3.0 gpm/well) 57.3 gpm
(19 wells @ 3.0 gpm/well) ROM Cost Estimate3 $7.2M $14.5M
D = deep gpm = gal per minute inches Hg = pressure in inches of mercury kW = kilowatt M = middle MW-Hr = megawatt hours R = RGA ROM = Rough Order of Magnitude S = Shallow scfm = standard ft3 per minute U = UCRS 1 The number of borings was increased from 78 to 81 after the numeric simulation as contingency to provide additional upgradient preheating of groundwater. 2 Electricity for additional UCRS electrodes is required as a result of higher RGA electrode density. 3 Implementation of the original Phase II design for lower RGA heating only was expected to cost approximately $7.2M. The rough order of magnitude cost for implementation of the revised configuration for RGA heating based on the preliminary design basis provided by Mc2, the associated impacts to the UCRS component spacing, additional electrical power, and contingency (12%) is approximately $14.5M.

THIS PAGE INTENTIONALLY LEFT BLANK

U.S
. DEP
ART
MEN
T O
F E
NER
GY
DOE
PORT
SMOU
TH/P
ADUC
AH P
ROJE
CT O
FFIC
EPA
DUCA
H GA
SEOU
S DI
FFUS
ION
PLAN
T
��
Figu
re 3
1. E
RH
Wel
l Fie
ld L
ayof
f fro
m R
DR

U.S
. DE
PAR
TMEN
T O
F E
NER
GY
DOE
PORT
SMOU
TH/P
ADUC
AH P
ROJE
CT O
FFIC
EPA
DUCA
H GA
SEOU
S DI
FFUS
ION
PLAN
T
��
Figu
re 3
2. E
RH
Wel
l Fie
ld L
ayou
t Ind
icat
ed b
y L
ates
t Mod
elin
g

65
• Total power to the electrodes, during normal operations is predicted to increase from 1,095 kW to 2,242 kW, approximately a 100% increase.
• During operations, extraction of groundwater upgradient of the targeted heated volume will be critical to achieving the target temperature. Inclusion of upgradient extraction wells is intended to minimize the effects of ambient groundwater flow into the treatment area to reduce the energy needed to be applied to the treatment area. This upgradient groundwater removal and operation of the perimeter electrodes at maximum power tend to reduce the negative effects of heat loss to groundwater.
• Balancing groundwater extraction and injection from within the treatment volume also will be critical to achieving target temperature. Water must be injected at the electrodes to maintain electrical conductivity of the formation. In order to maintain hydrodynamic control, water then also must be extracted from the heated volume. Extraction of water from inside the treatment volume removes energy and injection of water at temperatures below target temperature requires additional energy to heat to target temperature. The design could attempt to separate the cooler upper extraction water from source area hot water; however, blending these waters is more practical, but incurs an energy waste. The revised Phase II design requires extraction of 79 gpm, reinjecting 54 gpm, discharge of 22 gpm.
Additionally, Mc2 recommends adding hot water injection to gain a higher degree of confidence in reaching target temperature—This component has to be costed in the analysis. The heating would require heating the 30oC injection water to 90oC prior to injection. The simulations required maximum operating voltage of 14 kW/electrode is 17% above the maximum power delivered in Phase I. Also, system operations will need to be continuously to reach target temperatures. Avoidance of power interruptions as experienced in Phase I is critical to the attainment of target temperatures as simulated. In Phase II, the costs for addressing the UCRS (IIa) and the RGA (IIb) have been separated for evaluation purposes. The rough order of magnitude (ROM) cost to implement the model-based Phase II design for the RGA is $14.5M. The ROM cost estimate includes the impacts to the UCRS ERH infrastructure resulting from the higher density of RGA electrode borings predicted by the model. Additionally, the ROM does not include the costs associated with preheating the reinjected water to electrodes.
4.2 CONTAMINANT RECOVERY
Effective contaminant recovery is critical to the success of a thermal remediation project. In a thermal remediation project, the SVE system is the primary contaminant recovery system once subsurface target temperatures have been attained. The SVE system must create a radius of influence that encompasses the target treatment zone. Phase I operating experience indicates that the SVE design should be revised to improve vacuum extraction coverage. Potential design enhancements include the following:
• Upgrading the vacuum blower system to provide increased vacuum levels and vacuum flow rates at the well field;
• Providing closer spacing between vapor extraction wells to provide better coverage;
• Increasing the number of vapor extraction wells;
• Possibly increasing number of piezometers for monitoring of vacuum levels in the well field; and

66
Ensuring use of more sensitive instrumentation at piezometers (i.e., pressure gauges in inches of water versus inches of mercury) for monitoring vacuum levels in the well field.
Groundwater extraction and treatment was shown to be an important contaminant recovery technology during Phase I. Operating experience during Phase I revealed that improvements could be made in this area also. The infiltration of fine sands and silts during groundwater pumping posed significant challenges at times and resulted in shutdown of pumping operations to allow for cleanout of these solids well sumps and piping. Potential changes to the groundwater extraction system that should be evaluated include:
Screen size specifications—The screens will be designed based on formation sieve analysis,
Filter pack design—The filter pack will be selected with uniform sand (high uniformity coefficient of > 1.5), and
Well development process—Well development will continue at appropriate flow rates and surging until the water is free of visible sediment.
4.3 ENHANCEMENTS TO WELL FIELD PIPING SYSTEM AND THE SVGTS
The following enhancements were implemented during Phase I and will be brought forward to Phase II.
Installation of condensation collection and purging systems to minimize build up of condensate in vapor header pipes;
Right sizing of vapor hoses from extraction wells to the header pipe and addition of hose supports to eliminate condensate traps resulting from drooping lines;
Installation of a surge tank at the head of the SVGTS to provide additional solids settling capacity before water is pumped into the air stripper;
Replacement of fittings with dissimilar metals to reduce corrosion problems; and
Addition of a backup compressor, connected to the emergency power supply, to allow continued operation of air actuated control valves in the event power is lost to the primary air compressor.
The following will be included as part of Phase II design development as a result of experience and observations from Phase I installation and operations:
Evaluation of alternative vapor treatment technologies to identify a more implementable and stable technology, such as steam regenerated vapor phase carbon;
Review of system interlocks and installation of additional instrumentation to provide added operational control and/or protection (i.e., addition of high level switches in facility sumps to prevent overflow); and
Addition of carbon dioxide analyses by the photoacoustic analyzer as a means of monitoring the quality of samples collected from SVE wells.

67
5. CONCLUSIONS AND RECOMMENDATIONS
The preceding sections of this report presented a summary of the observations and performance results from Phase I of the C-400 IRA. As stated in Section 1, the purpose of the report is to provide a framework for the evaluation of several questions. The questions and proposed answers are presented below.
Were RAOs met for Phase I?
The following are the RAOs for the C-400 IRA and an assessment of how the RAOs were addressed as a result of Phase I implementation.
• Prevent exposure to contaminated groundwater by on-site industrial workers through institutional controls (e.g., excavation/penetration permit program).
Assessment—This RAO was met for Phase I through implementation of worker protection programs as described in the RAWP.
• Reduce VOC contamination (primarily TCE and its breakdown products) in UCRS soil at the C-400 Cleaning Building area to minimize the migration of these contaminants to RGA groundwater and to off-site POEs.
Assessment—This RAO was met for Phase I through attainment of target temperatures in the UCRS, effective operation of the SVE and SVGTS, and VOC mass volume recovery.
• Reduce the extent and mass of the VOC source (primarily TCE and its breakdown products) in the RGA in the C-400 Cleaning Building area to reduce the migration of the VOC contamination to off-site POEs.
Assessment—This RAO was applicable to the upper RGA for Phase I in the southwest treatment area. One of the goals for Phase I was to determine the viability of heating in the RGA with the intent of applying the resulting information to meet this RAO as part of Phase II. Target temperatures, which are the threshold metric for effective ERH operation, were not attained in the lower RGA below 70 ft bgs. Contingency actions, including application of additional electrical power and injection of electrolytic fluids to enhance conductance, were implemented in accordance with the RAWP. Observed maximum operating temperatures in the lower RGA below 70 ft bgs fell short of target temperature objectives by over 100ºF in the lower RGA.
How effective was the system in removing contaminants?
Baseline and postoperational soil and groundwater sample results indicate that, for areas where target temperatures were attained, contaminant recovery was effective in the southwest and east treatment areas. Soil contaminant concentrations were reduced by an average of 99% in the southwest and by 95% in the east. Groundwater concentrations in the southwest went from an average of 38,000 µg/L to an average of 315 µg/L, and in the east they went from 123,000 to 29,000—reductions of 99% and 76%, respectively.
Were target temperatures achieved in contaminant treatment zones in the east and southwest treatment areas?
Target temperatures were achieved in the UCRS soils of Phase I treatment areas. Target temperatures also were achieved in the targeted upper RGA (≈ 60 to 70 ft bgs) in the southwest treatment area.

68
What was the heating performance of the ERH design through the RGA to the McNairy interface in the southwest treatment area?
Target temperatures were not attained in the deep RGA. Key factors that affected attainment of target temperatures in the deep RGA include groundwater flow velocity and formation resistivity. Both of these parameters have the potential to impact thermal performance significantly. Observed formation temperatures during Phase I operations in the lower RGA fell short of target temperatures by over 100º F. Contingency thermal engineering techniques identified in the RAWP to boost formation heating were implemented during Phase I in attempts to attain target temperatures. These techniques included injection of saline solutions and maximizing the delivery of electrical power to the electrodes in the lower RGA.
What aspects of Phase I installation and construction went as expected or presented more challenges than were expected?
Implementation of the C-400 IRA was expected to be challenging in the footprint of the fully operational C-400 Cleaning Building located in the middle of an active industrial complex. The project team, which at times numbered 35 workers and support personnel, was required to operate safely and work among multiple drill rigs, cranes, forklifts, and other construction equipment, while accommodating pedestrian and vehicle traffic associated with USEC plant operations.
Drilling and trenching operations required particular attention to avoid underground utilities and other subsurface infrastructure. Overhead power and communication lines were a constant consideration during drilling and crane operations.
Phase II implementation is expected to present additional challenges. The southeast C-400 Cleaning Building area has more USEC operations and vehicle and pedestrian traffic requiring changes to surface completions. The well field is located adjacent to the C-400 Cleaning Building administrative offices and the SVGTS. Drilling operations will require that multiple drill rigs operate in closer proximity to one another for longer than required during Phase I. The potential for an increased density of electrodes to address the RGA increases the challenges of adjusting boring locations to avoid utilities.
What design improvements for Phase II implementation are suggested by the results of Phase I installation and operations experiences?
Although the remedy was shown to be effective in removing contaminants, the soil vapor extraction and groundwater extraction systems should be revised to improve performance. Providing higher vapor extraction vacuum levels at the well field and installation of a higher density of soil vapor extraction wells should be evaluated for effectiveness. Also, vacuum gauges at the perimeter should be appropriately scaled to measure the lower vacuums. The design of groundwater extraction wells may be improved to reduce the infiltration of fines during operations. Improvements also can be made to monitoring instrumentation.
What are the major uncertainties associated with moving forward with Phase II of the IRA?
The most significant uncertainty associated with Phase II of the C-400 IRA concerns heating the RGA to target temperature for volatilizing the VOCs. In large part, the challenge posed regarding heating of the RGA is related to the inherent uncertainty regarding characterization of groundwater velocity and the potential for heat-induced velocity (convective flow) in the RGA. The RGA is considered to have the potential for heat-induced convective flow due to the relatively low anisotropy associated with the RGA. Anisotropy in the RGA is principally manifested in the relative value of hydraulic conductivity as measured in the horizontal and vertical directions. Field determinations of hydraulic conductivity in

69
hydrogeologic settings similar to the RGA generally reflect the influence of horizontal hydraulic conductivity. Based on observations of the lithology of the RGA and contaminant distribution in the RGA, the ratio of horizontal to vertical hydraulic conductivity is considered to be relatively low (10 times greater in the horizontal plane than in the vertical plane) compared to other aquifers where anisotrophy is greater due to interbeds and zones of lower hydraulic conductivity that inhibit vertical flow. Because vertical flow in the RGA is not inhibited, the potential for convective flow due to heating of water in the lower RGA is considered to be viable.
A model based calculation of groundwater velocity predicted the velocity to be approximately 3.0 ft per day in the middle and lower RGA. An additional challenge with depth is the fact that the target temperature at the potentiometric surface is 87oC (189oF) ~53 ft bgs, but increases to 115oC (239oF) at 98 ft bgs. The technology relies on vaporization for removal of VOCs; therefore, if the target temperature is not attained, the technology is ineffective.
Phase I operating experience in the southwest treatment area and subsequent modeling results using a groundwater velocity of 3.0 ft per day indicate that in order to achieve target temperatures in the RGA the ERH installation would require significant scale up. This model-based design for heating the RGA calls for 35 additional electrode borings, 103 additional electrodes, an estimated increase in total energy for Phase II operations of almost 5,000 MW-Hr, and associated additional costs of approximately $7.3M. The design also would require upgradient electrode borings for preheating and upgradient groundwater extraction to reduce the flux of groundwater that requires heating through the target volume. Additionally, the ERH subcontractor suggests augmenting the heating by providing hot water injection at the electrodes.
It is noteworthy that the 2010 ITR team, upon review of the Phase II RGA modeling exercise documented in Appendix A of this document, suggested that the approach taken to evaluate the effect of groundwater velocity on attainment of target temperatures using the model was overly simplistic. The approach may be inadequate, resulting in the potential for underestimation of the range of groundwater flow velocity and associated thermally induced velocity effects (convective flow); and that there is “a significant risk of underperformance (in the RGA),” even with the scaled up ERH system. Any recommendation to proceed with design and implementation of an ERH system for the lower RGA will require the execution of additional numeric simulations.
What recommendations can be made regarding Phase II of the IRA?
Based on the Phase I experience and results, ERH should be deployed in the UCRS soils of the southeast treatment area.
Lessons learned during Phase I relative to RGA heating identified the following for consideration as part of the determination of a path forward for Phase II and associated design development:
• The range of groundwater velocity in the formation is considered to be a substantial contributing factor in the inability to attain target temperature in the RGA;
• Utility and building operations avoidance posed more significant coordination challenges than originally assumed, and additional logistical challenges would be posed as part of Phase II based on the greater boring density that would be necessary for heating the RGA;
• RGA formation electrical resistivity characteristics are high, leading to difficulty in attaining target temperatures and requiring contingency actions such as additional power and salt injection to improve conductivity;

70
• The viability of continuous saltwater injection to increase formation electrical conductivity; and
• Attainment of higher target temperatures (up to 50ºF higher in the bottom of the RGA versus the top) when Phase I was more than 100°F below target temperatures in the deep RGA.
Preliminary Phase II thermal design modeling has been conducted to identify a design that potentially accounts for the key formation and performance uncertainties identified here (groundwater flow velocity, formation resistivity, and attainment of target temperatures in the lower RGA). While the revised design suggests that Phase II objectives could be realized using ERH in the RGA, the initial identification of requirements include additional infrastructure, implementation of contingency heating methods, and an associated increases in project costs. Because of the substantial shortfall in attainment of RGA target temperatures during Phase I, despite implementation of contingency actions identified in the RAWP, and because the success of ERH hinges critically on the attainment of target temperatures, it is recommended that implementation of Phase II ERH in the RGA be considered with caution. The time and cost required for Phase II implementation in the RGA would be substantial. Consensus has not been reached regarding the design requirements necessary to ensure attainment of heating objectives and satisfaction of the RAOs for the RGA due to key lessons learned and uncertainties as previously stated. Consequently, it is strongly recommended that alternate technologies or combinations of technologies, be evaluated to take advantage of increased knowledge of RGA characteristics to develop a refined technical strategy for successful attainment of the RAOs for the C-400 IRA.

71
6. REFERENCES
DOE (U.S. Department of Energy) 2005. Record of Decision for Interim Remedial Action for the Groundwater Operable Unit for the Volatile Organic Compound Contamination at the C-400 Cleaning Building at the Paducah Gaseous Diffusion Plant, Paducah, Kentucky, DOE/OR/07-2150&D2/R2, U.S. Department of Energy, Paducah, KY, July.
DOE 2008a Remedial Action Work Plan for the Interim Remedial Action for the Volatile Organic Compound Contamination at the C-400 Cleaning Building at the Paducah Gaseous Diffusion Plant, Paducah, Kentucky, DOE/LX/07-0004&D2/R1.
DOE 2008b. Remedial Design Report, Certified for Construction Design Drawings and Technical Specifications Package, for the Groundwater Operable Unit for the Volatile Organic Compound Contamination at the C-400 Cleaning Building at the Paducah Gaseous Diffusion Plant, Paducah, Kentucky, DOE/LX/07-0005&D2/R1, U.S. Department of Energy, Paducah, KY, July.
DOE 2009. Operations and Maintenance Plan for the Interim Remedial Action for the Volatile Organic Compound Contamination at the C-400 Cleaning Building at the Paducah Gaseous Diffusion Plant, Paducah, Kentucky, DOE/LX/07-0187&D2, U.S. Department of Energy, Paducah, KY, July.
ITR 2007. Review Report: Building C-400 Thermal Treatment 90% Remedial Design Report and Site Investigation, PGDP, Paducah Kentucky, WSRC-STI-2007-00427, U.S. Department of Energy Office of Environmental Management, Savannah River National Laboratory, Aiken, SC, August.
ITR 2010. Independent Technical Review of the C-400 Interim Remedial Project Phase I Results, Paducah, Kentucky, SRNL-STI-2010-00681, Center for Sustainable Groundwater and Soil Solutions, Savannah River National Laboratory, Aiken, SC, October.

THIS PAGE INTENTIONALLY LEFT BLANK

APPENDIX A
NUMERICAL SIMULATION STUDY OF IN SITU HEATING WITH GROUNDWATER FLOW IN THE RGA UNIT

THIS PAGE INTENTIONALLY LEFT BLANK

ET-DSP TM
Electro-ThermalDynamic Stripping Process
Numerical Simulation Study ofIn-situ Heating with GroundWater Flow in the RGA Unit
LATA KentuckyPGDP C-400 Complex
Submitted toLATA Kentucky
Paducah, KentuckySeptember 2010
A-3
ET-DSPTM
Simulation Study
McMillan McGee Corp.4895-35B St. SECalgary, Alberta T2B 3M9
Technical Point of Contact:Dr. Bruce C. W. McGeePh: (403) [email protected]
or
Mr. Randy Juhlin MBA, P.Eng.Ph: (403) [email protected]
Name of study:
Numerical Simulation
Study of In-situ
Heating with Ground
Water Flow in the
RGA Unit
Submitted to:
Mr. Dave BollingLATA Kentucky
761 Veterans Ave.Kevil, KY
42053, USA
September 14, 2010
A-4

���� ������ ���� ��� ����� ���� �� � � �� �
�� �������� � �� � � �� � � �� �� �� ����
�������� �� ��� �� �� ������ �������� �� ��
������ ����� �� � ��� ������� ���� ��� � ��������
�� �������� ���� �� ����� � ���� ���� ��� ��
�������� ��� ��� ��������� � �������
A-5

Contents
1 Summary 2
2 Simulation Study 1��� ��������� � � � � � � � � � � � � � � � � � � � � � � � � � � � � � � � � � � �
��� ����� � � � � � � � � � � � � � � � � � � � � � � � � � � � � � � � � � � � � � �
��� ����� � � � � � � � � � � � � � � � � � � � � � � � � � � � � � � � � � � � �
��� ������ ���� ���� ������ � �� �� � � � � � � � � � � � � � � � � � � �
��� ���������� ������� � � � � � � � � � � � � � � � � � � � � � � � � � � � �
3 Conclusion and Recommendations 1
�
A-6

List of Figures
��� Calculated resistivity base on operating data. � � � � � � � � � � � � � � � �
��� Ground water flow velocity calculation at 21.95 m0 (72 feet BGS). � � � �
��� Vertical grid and dimensions of the deep RGA used in the model. � � � �
��� Horizontal grid of the deep RGA treatment area used in the model. � � � �
�� Temperature distribution between 25.070 m and 28.118 m BGS for aground water flow velocity of three feet per day with no up-gradientextraction. � � � � � � � � � � � � � � � � � � � � � � � � � � � � � � � � � � � �
��� Temperature distribution between 25.070 m and 28.118 m BGS for aground water flow velocity of three feet per day assuming the perime-ter electrodes are operating at approximatley 12 kW and with no up-gradient extraction. � � � � � � � � � � � � � � � � � � � � � � � � � � � � � � ��
��� Temperature distribution between 25.174 m and 28.174 m BGS for aground water flow velocity of three feet per day assuming the perimeterelectrodes are operating at up to 14 kW. � � � � � � � � � � � � � � � � � � ��
��� Temperature distribution at the top of the McNairy. � � � � � � � � � � � � ��
��� Temperature distribution assuming operations to balance a three feetper day ground water flow velocity however with the flow velocity equalto six feet per day. � � � � � � � � � � � � � � � � � � � � � � � � � � � � � � �
A-7

List of Tables
��� ET-DSPTM technical approach and design basis. � � � � � � � � � � � � � �
��� RGA ground water flow velocity calculations at various depths. � � � � � �
��� Water balance for the system with up-gradient control. � � � � � � � � � � ��
�
A-8

Nomenclature
������ ���� ����
��� ����� ������ ������
���� �������� �������� ������������� ��� ������
��� ������ ������� ����
��� ������� ������ ��� ��
�� ���� !��� "�� #�����
��$ �������� ������ �������
�%� ���� %���� �&�� �����
����"�#�� ��'���� "����� �&������� #�����
������#�� ��'���� ��� ������� �&������� #�����
�$�"( ���� $��)�&����)"��� (�&���
�*� ������ ����� �� ������� �� ������
�*� ������ ����� �� ������� �� ����'�
�"� ������ ����� �� ���������� "�������� �'���
�+, �������� +���� � ,�����'
��)��"�� ������)������� ������ ���� ��' "���
-����� -�)���� ������� ���� ����
##�����)
#���
##�����)#��� ��� .
��,' #��������� �� ������
$�"( $��)�&����)"��� (�&���
*# * ������� ��� #���������
+�+� +����� ����� ����� ��� +�� ��� ��
+! +���� !��&����
��� ����� ������� �/�������
�0*� ����) ������� *�'��� ��� ����
��� 1�1�1)��������������
��� ��������������� ����������������
��� ����� ���� �� �����
�", ����� "�������� ,���������
�"� �� �� � ��2��
0*� 0������� *�'��� ��� ����
����� ������� �� ���� ���
3
A-9

C-400 RGA Study LATA Kentucky
��������� �� �� ���� ����
������ ���� ����
��� �� ��������λc ������� ����������� �� ��� ������ � ����◦��λw ������� ����������� �� ��� ����� � ����◦��λr ������� ����������� �� ��� �� � ����◦��λob ������� ����������� �� ��� !��������� � ����◦��λub ������� ����������� �� ��� �����"������ � ����◦��ρ �������� ��������� � Ω��σw �������� ����������� �� ��� ����� � ����Agw #��� $�� �������� �� %����� ����� &��' � �2�he �������� (��)�� � ��Le �������� (��)�� � ��Pi *������ $����� � $��Re �������� �������Sc ������� ���������� � " �Sg %� ���������� � " �Sw ����� ���������� � " �Ti *������ ��� ������� � ◦��vgw %����� ����� &��' +������ � ����
Confidential , McMillan-McGee Corp.
A-10

1 Summary
The objective of this numerical simulation study is to update the subsurface modelof the Regional Ground water Aquifer (RGA) in the South East Area of the project.This model will serve to determine the basis for revisions to design of the ET-DSPTM
system and operating strategy to account for the effects of the high ground water flow.Specifically, the goals of this updated study are to:
1. Use of data from Phase 1 operations to update estimates of electrical resistivityof the subsurface.
2. Use of temperature data from Phase 1 operations to estimate ground water flowvelocities in the RGA.
3. Evaluate closer spacing of the electrodes.
4. Model operating the electrodes at an aggressive power strategy using highervoltage and/or saline injection into the electrodes.
5. Evaluate additional up-gradient electrodes to preheat the ground water before itreaches the treatment volume.
6. Evaluate additional electrodes around the perimeter of the plume area to pre-heat the ground water before it reaches the treatment volume.
7. Evaluate up gradient extraction wells to divert flow from the aquifer before itreaches the treatment volume.
The scope of this updated RGA modelling effort was limited to the areal extent of the24.3 m to 30.5 m (80- to 100-ft) plume and a depth interval of 18.8 m to 29.4 m (61.5ft to 96.5 ft) BGS in the South East Area.
Based on calculations of the ground water flow velocity observed in Phase 1, twodifferent RGA ground water flow velocities were evaluated in this simulation, 3 ft/dayand 6 ft/day.
Although this modelling effort was limited to the zone from 18.8 m to 29.4 m, the treat-ment zone for the South East Area will extend from 6.0 m to 29.4 m (20 ft to 96.5 ft)BGS. The depth interval above 18.8 m was not modelled because this zone is notaffected by high ground water flows and there is a high degree of confidence that thisdepth interval can be heated to temperature.
�
A-11

C-400 RGA Study LATA Kentucky
The study resulted in a technical approach (summarized in Table 1.1) with specificregard to the following design issues:
1. The measured resistivity of the deep RGA is 106 Ωm and this value was usedin the numerical modelling.
2. The groundwater flow velocity was estimated to range between 1.82 to 3.04 feetper day. The lower flow velocity was measured at the RGA / McNairy interface.
3. To thermally treat the deep RGA requires 156 electrodes in 78 boreholes.
4. The electrode spacing needs to be reduced to 5.49 m from 6.40 m. Forty threeadditional borings with two electrodes in each boring are recommended on theperimeter and up-gradient of the treatment volume to pre-heat the ground water.
5. Much higher than normal energy density associated with aggressive heating isneeded at the perimeter electrodes.
6. To achieve the necessary power levels in the deep RGA will require the closerspaced electrodes, maximum operating voltage, and saline injection.
7. Balancing water injection, extraction, and up-gradient extraction during op-erations will be key to achieving the target temperature.
8. Although the modelling showed that the target temperatures can be achievedwithout the use of pre-heating the water to the electrodes, our recommendationis to use hot water injection to the electrodes to provide a higher degree ofconfidence in meeting the target temperature.
Confidential � McMillan-McGee Corp.
A-12

C-400 RGA Study LATA Kentucky
ET-DSPTM Technical Approach for Deep RGAItem Detail
Number of Electrodes 156 Standard Le = 10 ftElectrode Spacing 5.49 m
18.00 ftNumber of XWells 18 In Deep RGA
Depth to Lower RGA Electrode 28.12 m92.25 ft
Average Electrode Input Power 10.61 kWPeak Electrode Input Power 12.50 kW
Input Electrical Energy 870.00 kWh/m3
665.00 kWh/yd3
Electrode Injection Rate 0.10 gal/min varies0.38 l/min
RGA Water Injection Rate 26.30 gal/min99.56 l/min
RGA XWell Liquid Extraction Rate 1.53 gal/min5.83 l/min
Up-Gradient Water Extraction Rate 22.40 gal/min85.20 l/min
Table 1.1: ET-DSPTM technical approach and design basis.
Confidential � McMillan-McGee Corp.
A-13

2 Simulation Study
2.1 Assumptions
Some of the more general project assumptions captured in the simulation are:
1. Only the RGA is modelled and is assumed to extend from 18.74 m to 29.42 m.Below the RGA lies the McNairy aquitard that restricts the flow of groundwaterfrom the RGA due its relatively low hydraulic conductivity.
2. Electrical and hydraulic properties of the soil are variable through several layersin the treatment volume. The lower portion includes the sand and gravel layersof the RGA and silty sand in the upper 1.0-2.5 m of the McNairy formation.
3. The electrical conductivity of the ground water within the RGA was determinedfrom electrode data and is based on an initial electrode resistance of 17.4 Ωm1.The resulting conductivity of the ground water is 0.04298 S/m2.
4. The injection temperature for the base case is 30 ◦C.
5. The bottom of the RGA was found to be 96.5 feet BGS, and varied between 94and 97 feet BGS during installation of the electrodes. The top of the RGA is62.5 feet BGS and two layers of 10 foot electrodes are stacked within the RGAas shown in Figure 2.3.
6. The ratio of produced to injected water is 1.05 to maintain hydrodynamic control.
7. Heat loss cells are placed around the boundaries of the problem except for thetop. This gives a plane of symmetry that approximates the electrodes operatingabove the RAG.
8. We are able to inject saline solution into the electrodes.
9. The input energy estimates are for electrode operations only. Additional energyfor the project will be needed to run the treatment plant and / or for contingencyoperations.
10. To achieve the temperature target early in the project, an aggressive ramp-upwith increased peak power to each electrode is necessary.
������ �� ���� ������ ��� ���� �� �� �������� ����������� ��� � �� ������ ��������� ��� ��� � ����� ���
�
A-14
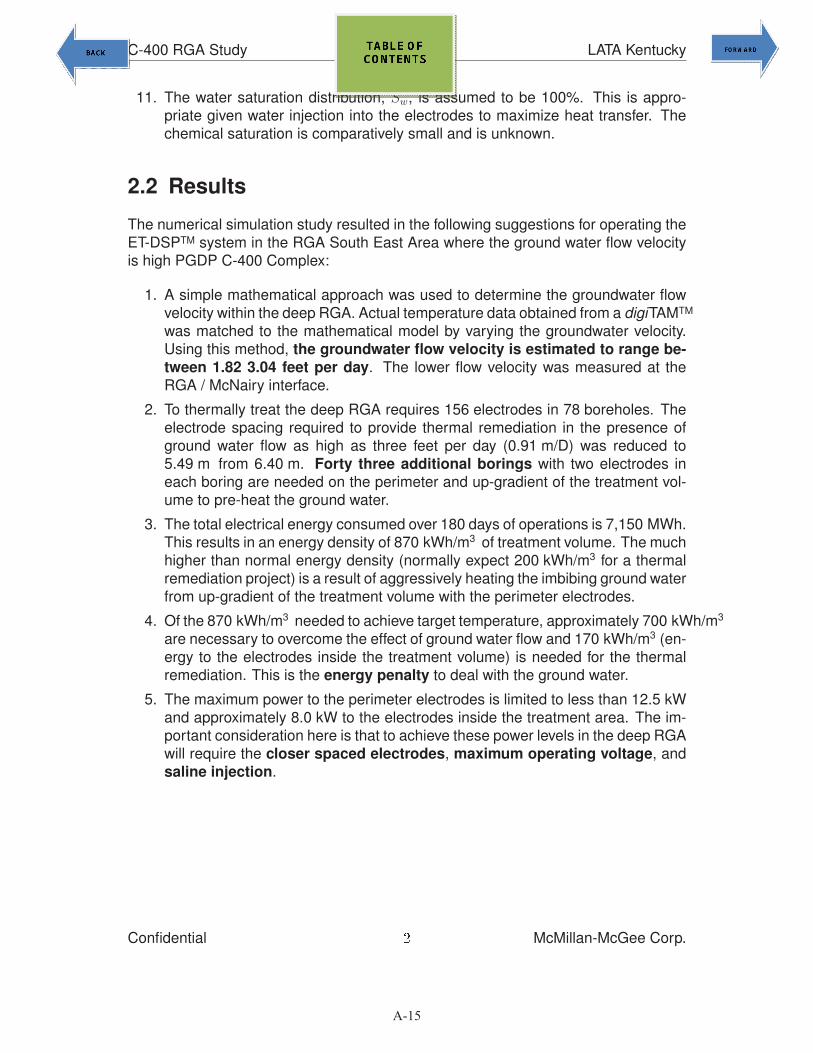
C-400 RGA Study LATA Kentucky
11. The water saturation distribution, Sw, is assumed to be 100%. This is appro-priate given water injection into the electrodes to maximize heat transfer. Thechemical saturation is comparatively small and is unknown.
2.2 Results
The numerical simulation study resulted in the following suggestions for operating theET-DSPTM system in the RGA South East Area where the ground water flow velocityis high PGDP C-400 Complex:
1. A simple mathematical approach was used to determine the groundwater flowvelocity within the deep RGA. Actual temperature data obtained from a digiTAMTM
was matched to the mathematical model by varying the groundwater velocity.Using this method, the groundwater flow velocity is estimated to range be-tween 1.82 3.04 feet per day. The lower flow velocity was measured at theRGA / McNairy interface.
2. To thermally treat the deep RGA requires 156 electrodes in 78 boreholes. Theelectrode spacing required to provide thermal remediation in the presence ofground water flow as high as three feet per day (0.91 m/D) was reduced to5.49 m from 6.40 m. Forty three additional borings with two electrodes ineach boring are needed on the perimeter and up-gradient of the treatment vol-ume to pre-heat the ground water.
3. The total electrical energy consumed over 180 days of operations is 7,150 MWh.This results in an energy density of 870 kWh/m3 of treatment volume. The muchhigher than normal energy density (normally expect 200 kWh/m3 for a thermalremediation project) is a result of aggressively heating the imbibing ground waterfrom up-gradient of the treatment volume with the perimeter electrodes.
4. Of the 870 kWh/m3 needed to achieve target temperature, approximately 700 kWh/m3
are necessary to overcome the effect of ground water flow and 170 kWh/m3 (en-ergy to the electrodes inside the treatment volume) is needed for the thermalremediation. This is the energy penalty to deal with the ground water.
5. The maximum power to the perimeter electrodes is limited to less than 12.5 kWand approximately 8.0 kW to the electrodes inside the treatment area. The im-portant consideration here is that to achieve these power levels in the deep RGAwill require the closer spaced electrodes, maximum operating voltage, andsaline injection.
Confidential � McMillan-McGee Corp.
A-15

C-400 RGA Study LATA Kentucky
6. Balancing water injection, extraction, and up-gradient extraction during oper-ations will be key to achieving the target temperature. The 18 extraction wellsinside the treatment area are recommended to operate at an extraction rateof approximately 8.36 m3/D (1.52 gpm) per well. The four up-gradient extrac-tion wells operate at an extraction rate of 30.54 m3/D (5.6 gpm) per well. Thetreatment system must be designed to handle a water flow rate from the deepRGA of 272.68 m3/D (50 gpm) over and above extraction from other areas inthe South East Area.
7. Although this is an option to the project, we have not modelled the use of a QuickWater system to pre-heat the water to the electrodes to 90 ◦C. This approachcan be used as a contingency to further ensure the target temperatures arereached.
2.3 Resistivity
The purpose of these calculations are to estimate the resistivity in the RGA based onmeasured electrode operating parameters. These data and the results of the resistiv-ity calculations are summarized in Figure 2.1 and used in this study. The resistivity is106.55 Ωm and can be obtained using the following equation.
Re =1
2πσshe
⎡⎣rw
he
+ sinh−1
(he
rw
)−
√1 +
(rw
he
)2⎤⎦ �����
Confidential � McMillan-McGee Corp.
A-16

C-400 RGA Study LATA Kentucky
������ �� Calculated resistivity base on operating data.
Confidential � McMillan-McGee Corp.
A-17

C-400 RGA Study LATA Kentucky
2.4 Ground Water Flow Velocity in the RGA
The purpose of these calculations are to estimate the ground flow velocity in theRGA. Temperature data from a digiTAMTM well located in the South West Area wasmatched to a mathematical model. The mathematical model incorporate heat trans-fer by convection which is driven by the ground water flow velocity. The ground waterflow velocity is varied until the change in absolute temperatures matches our data.
Table 2.1 summarizes our calculations. Based on matching the mathematical modelto the data we estimate that the ground water flow velocity ranges from 1.86 to 3.04feet per day. Figure 2.2 shows the analyses for the temperature data at 72 feet BGSfor digiTAMTM D007.
Confidential � McMillan-McGee Corp.
A-18
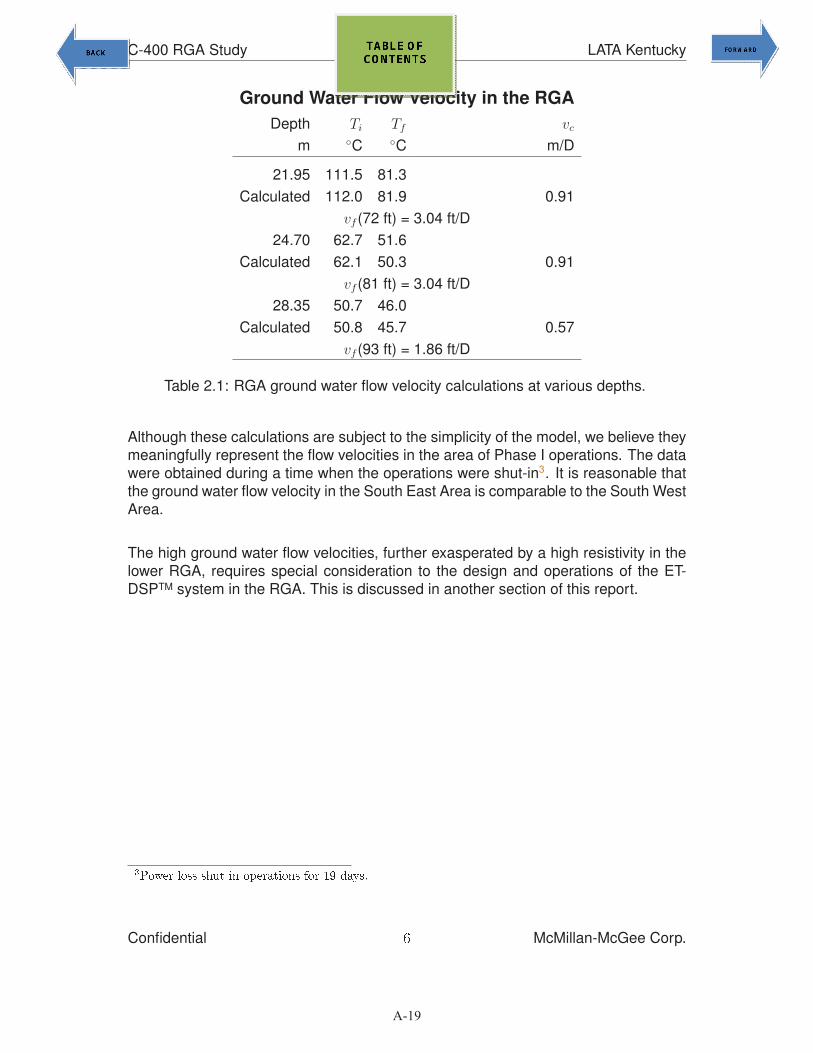
C-400 RGA Study LATA Kentucky
Ground Water Flow Velocity in the RGADepth Ti Tf vc
m ◦C ◦C m/D
21.95 111.5 81.3Calculated 112.0 81.9 0.91
vf (72 ft) = 3.04 ft/D24.70 62.7 51.6
Calculated 62.1 50.3 0.91vf (81 ft) = 3.04 ft/D
28.35 50.7 46.0Calculated 50.8 45.7 0.57
vf (93 ft) = 1.86 ft/D
Table 2.1: RGA ground water flow velocity calculations at various depths.
Although these calculations are subject to the simplicity of the model, we believe theymeaningfully represent the flow velocities in the area of Phase I operations. The datawere obtained during a time when the operations were shut-in3. It is reasonable thatthe ground water flow velocity in the South East Area is comparable to the South WestArea.
The high ground water flow velocities, further exasperated by a high resistivity in thelower RGA, requires special consideration to the design and operations of the ET-DSPTM system in the RGA. This is discussed in another section of this report.
������ ���� �� �� � ������� ��� �� �����
Confidential � McMillan-McGee Corp.
A-19

C-400 RGA Study LATA Kentucky
������ ��� Ground water flow velocity calculation at 21.95 m0 (72 feet BGS).
2.5 Temperature Response
The focus of this section is to determine the temperature distribution in the RGA ata groundwater flow velocity of 3 feet per day. This is supported by the calculationspresented in the previous section. We have also done a simulation of the temperaturedistribution at 6 feet per day.
For a frame of reference, the vertical and horizontal grids used in the model are shownin Figures 2.3 and 2.4 respectively.
Confidential McMillan-McGee Corp.
A-20

C-400 RGA Study LATA Kentucky
������ �� Vertical grid and dimensions of the deep RGA used in the model.
Confidential � McMillan-McGee Corp.
A-21

C-400 RGA Study LATA Kentucky
������ �� Horizontal grid of the deep RGA treatment area used in the model.
Figure 2.5 shows the temperature distribution between 25.070 m and 28.118 m BGSfor a ground water flow velocity of three feet per day. This figure assumes exactlythe same operating conditions on the electrodes as for the one foot per day case andclearly demonstrates the impact of higher the higher ground water flow velocity on theability to meet temperatures in the treatment volume. It is noted that the white cellsshown in the figure are at or exceed the target temperature (115 ◦C). Also, there isno Kriging of the data.
Confidential � McMillan-McGee Corp.
A-22
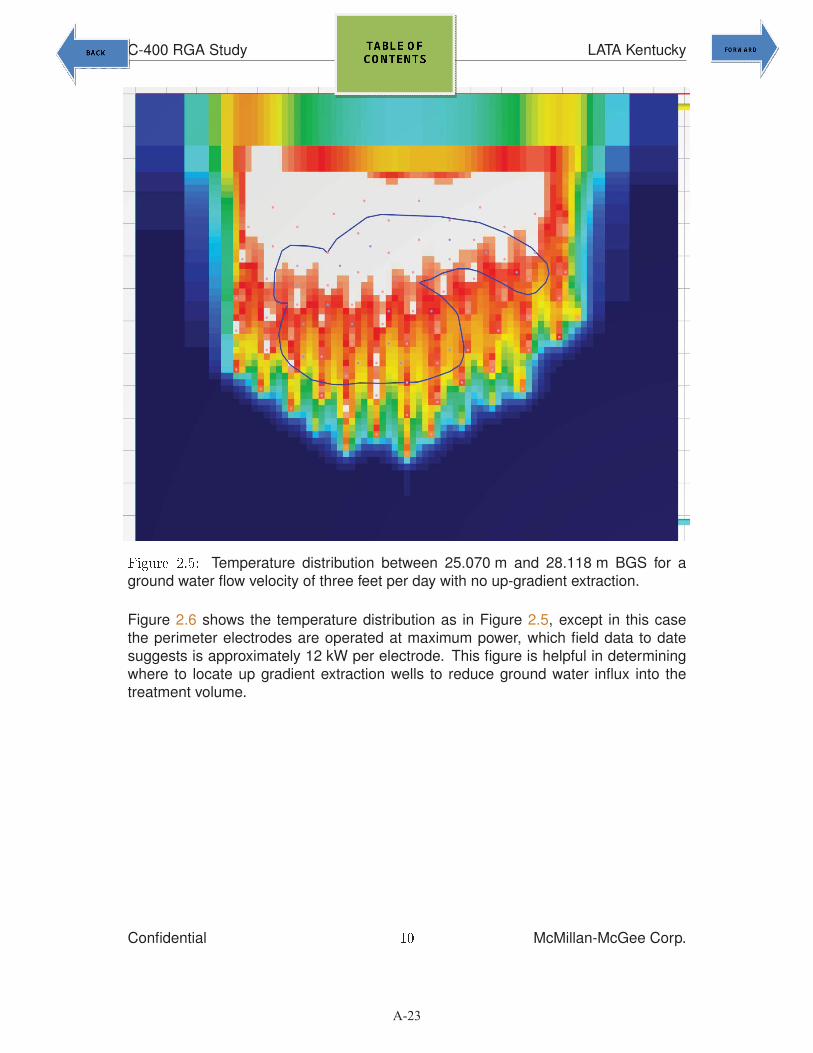
C-400 RGA Study LATA Kentucky
������ �� Temperature distribution between 25.070 m and 28.118 m BGS for aground water flow velocity of three feet per day with no up-gradient extraction.
Figure 2.6 shows the temperature distribution as in Figure 2.5, except in this casethe perimeter electrodes are operated at maximum power, which field data to datesuggests is approximately 12 kW per electrode. This figure is helpful in determiningwhere to locate up gradient extraction wells to reduce ground water influx into thetreatment volume.
Confidential �� McMillan-McGee Corp.
A-23

C-400 RGA Study LATA Kentucky
������ �� Temperature distribution between 25.070 m and 28.118 m BGS for aground water flow velocity of three feet per day assuming the perimeter electrodesare operating at approximatley 12 kW and with no up-gradient extraction.
Figure 2.7 shows the temperature distribution after 180 days of operations as a resultof introducing up-gradient extraction wells, providing for up-gradient control of the flowvelocity, and operating the perimeter electrodes at maximum power 12.5 kW. The ex-traction walls within the treatment volume are operated to extract the water injectedinto the electrodes with a hydrodynamic control factor of 1.05.
The up-gradient extraction wells are operated to extract fluids at a rate equal to thevolumetric flow into the treatment volume assuming a velocity of three feet per day. Atthree feet per day, the volumetric flow rate, Q̇ of ground water into the treatment areais estimated from:
Q̇ =vgw
Agw · φ
The treatment area perpendicular to the direction of ground water flow is derived from
Confidential �� McMillan-McGee Corp.
A-24

C-400 RGA Study LATA Kentucky
a lateral distance of 44 m across and an RGA thickness of 10.67 m. The averageporosity (φ) is 0.32, resulting in Q̇ equal to 122.16 m3 or 22.41 gpm for a ground wa-ter flow velocity of three feet per day. Therefore the extraction rate from each of thefour up-gradient extraction wells is set to approximately 30.54 m3/D (5.60 gpm perwell).
The water balance is shown in Table 2.2. The the data indicates a balance betweeninjected and extracted water with the difference being five percent over extraction ofthe electrode injection and flow from the aquatard (Model results) into the RGA duringoperations. The ground water flow (GWF) boundary conditions (BC) are imposed onthe upper and lower sides of the simulation grid shown in Figure 2.4.
Water Balance With Up-Gradient ControlInput Modelm3/D m3/D
Treatment Area X-Wells 150.52 150.65Up-gradient X-Wells 122.16 122.16
GWF Down-Gradient BC 149.64 149.64
Electrode Injection 143.36 143.36GWF Up-Gradient BC 271.80 271.80
Net Extraction 7.17 6.94
Table 2.2: Water balance for the system with up-gradient control.
Figure 2.7 shows a similar temperature distribution as in Figure 2.6, except in thiscase the perimeter electrodes are also operated at maximum power and there is up-gradient extraction as indicated in Table 2.2. This figure is helpful in determiningwhere to locate up gradient extraction wells to reduce ground water influx into thetreatment volume. These runs do not have hot water injection into the electrodes.The temperature distribution is in the plane of the lower electrode. Figure 2.8 showsthe temperature distribution at the top of the McNairy, and target temperatures areachieved without injection of hot into the electrodes.
Confidential �� McMillan-McGee Corp.
A-25

C-400 RGA Study LATA Kentucky
������ �� Temperature distribution between 25.174 m and 28.174 m BGS for aground water flow velocity of three feet per day assuming the perimeter electrodesare operating at up to 14 kW.
Confidential �� McMillan-McGee Corp.
A-26

C-400 RGA Study LATA Kentucky
������ �� Temperature distribution at the top of the McNairy.
A final numerical simulation run was done to test the assumption of the three feet perday groundwater flow velocity against the possibility of a much higher velocity, in thiscase six feet per day. In this run all the operations of the electrodes and extractionwells are the same as in the previous run (see Figure 2.7) however the groundwaterflow velocity is increased to six feet per day. The results of assuming a three feet perday groundwater flow velocity when it may actually be six feet per day is shown inFigure 2.9.
Confidential �� McMillan-McGee Corp.
A-27

C-400 RGA Study LATA Kentucky
������ �� Temperature distribution assuming operations to balance a three feet perday ground water flow velocity however with the flow velocity equal to six feet per day.
Confidential �� McMillan-McGee Corp.
A-28

3 Conclusion and Recommendations
Based on the results of the numerical simulation study, the following conclusions andrecommendations are put forward for the design of an ET-DSPTM system for the Pad-ucah C-400 Project as it is related to the deep RGA:
1. Using a simple mathematical approach the groundwater flow velocity was esti-mated to range between 1.82 to 3.04 feet per day. The lower flow velocity wasmeasured at the RGA / McNairy interface. The recommendation is that the de-sign basis for the deep RGA be based on a ground water flow velocity of 3 feetper day.
2. To thermally treat the deep RGA requires 156 electrodes in 78 boreholes.
3. The electrode spacing needs to be reduced to 5.49 m from 6.40 m. Forty threeadditional borings with two electrodes in each boring are recommended on theperimeter and up-gradient of the treatment volume to pre-heat the ground water.
4. Much higher than normal energy density associated with aggressive heating isneeded at the perimeter electrodes.
5. To achieve the necessary power levels in the deep RGA will require the closerspaced electrodes, maximum operating voltage, and saline injection.
6. Balancing water injection, extraction, and up-gradient extraction during op-erations will be key to achieving the target temperature.
7. Although the modelling showed that the target temperatures can be achievedwithout the use of pre-heating the water to the electrodes, our recommendationis to use hot water injection to the electrodes to provide a higher degree ofconfidence in meeting the target temperature.
�
A-29

THIS PAGE INTENTIONALLY LEFT BLANK

APPENDIX B
INDEPENDENT TECHNICAL REVIEW TEAM REPORT OF PHASE I PERFORMANCE

THIS PAGE INTENTIONALLY LEFT BLANK

i
SRNL-STI-2010-00681
Independent Technical Review of the C-400 Interim Remedial Project Phase I Results,
Paducah, Kentucky
Prepared for: The U.S. Department of Energy Office of Environmental Management Groundwater and Soil Remediation Technology (EM32), Washington, DC Prepared by: The DOE EM Center for Sustainable Groundwater and Soil Solutions, Savannah River National Laboratory, Aiken SC October 2010
B-3
ii
Cover Photo: Oblique view overhead photograph of the Department of Energy Paducah Gaseous Diffusion Plant near Paducah KY. The TCE source area targeted
for thermal treatment is located near the center of the photograph. .
DISCLAIMER
This work was prepared under an agreement with and funded by the U.S. Government. While the authors have taken care in the preparation of this report, neither the U. S. Government or its employees, nor any of its contractors, subcontractors or their employees, makes any express or implied: 1. warranty or assumes any legal liability for the accuracy, completeness, or for the use or results of such use of any information, product, or process disclosed; or 2. representation that such use or results of such use would not infringe privately owned rights; or 3. endorsement or recommendation of any specifically identified commercial product, process, or service. Any views and opinions of authors expressed in this work do not necessarily state or reflect those of the United States Government, or its contractors, or subcontractors.
Printed in the United States of America
Prepared For
U.S. Department of Energy Office of Engineering and Technology
B-4

iii
SRNL-STI-2010-00681
Independent Technical Review of the C-400 Interim Remedial Project Phase I Results,
Paducah, Kentucky
Authors:
Dr.Brian B Looney (Technical Lead, Savannah River National Laboratory) Dr. Joseph Rossabi (Redox-Tech, LLC)
Dr. Lloyd (Bo)Stewart (Praxis Environmental Technologies, Inc.) Walt Richards (Performance Results Corporation)
Prepared for
Department of Energy (DOE) Office of Groundwater and Soil Remediation Washington, D.C.
October 2010
Technical content and coordination for this effort was provided by the Savannah River National Laboratory in conjunction with Contract No. DE-AC09-08SR22470 with the U.S. Department of Energy.
B-5
iv
{blank page}
B-6

v
Table of Contents
Executive Summary ..........................................................................................................................
1.0 Introduction............................................................................................................................ 1
2.0 Background............................................................................................................................ 1
2.1 Previous Review Activities for Phase I C-400 Thermal Treatment ............................. 1
2.2 Phase I Plans ................................................................................................................ 2
2.3 Phase I Metrics.............................................................................................................. 3
3.0 Review Process ...................................................................................................................... 4
3.1 Objectives ..................................................................................................................... 4
3.2 Lines of Inquiry............................................................................................................. 5
4.0 Review Results....................................................................................................................... 5
4.1 Phase I........................................................................................................................... 5
4.2 Phase II........................................................................................................................ 23
4.0 References............................................................................................................................ 33
A Appendix - Independent Review Team Statement of Work............................................... 35
B Appendix - Independent Review Team Members .............................................................. 38
C Appendix - Synopsis of Predeployment Phase I Recommendations and Responses ......... 46
B-7

vi
Acronyms and Abbreviations AFCEE Air Force Center for Environmental Excellence COC Contaminant of concern Cs Contaminant concentration in soil cu cubic cVOC chlorinated volatile organic compound Cw contaminant concentration in groundwater DNAPL dense nonaqueous phase liquid DOE U.S. Department of Energy EM-30 Environmental Management Office of Groundwater and Soil
Remediation EPA U.S. Environmental Protection Agency ft foot FY fiscal year gal Gallon gpm gallons per minute m meter MCL maximum contaminant level MIP membrane interface probe MnO2 manganese dioxide msl mean sea level NaMnO4 sodium permanganate NAPL nonaqueous phase liquid OEPA Ohio Environmental Protection Agency PGDP Paducah Gaseous Diffusion Plant PPPO Portsmouth Paducah Project Office PRG preliminary remediation goal RCRA Resource Conservation and Recovery Act TCE Trichloroethene TDY temporary duty TOD total oxidant demand VOC volatile organic contaminant wt% percent by weight yd yards µg/kg micrograms per kilogram µg/L micrograms per liter
B-8

vii
Executive Summary The groundwater and soil in the vicinity of the C-400 Building at the Paducah Gaseous Diffusion Plant (PGDP), is contaminated with substantial quantities of industrial solvents, primarily trichoroethene (TCE). This solvent “source” is recognized as a significant challenge and an important remediation target in the overall environmental cleanup strategy for PGDP. Thus, the cleanup of the C-400 TCE Source is a principal focus for the Department of Energy (DOE) and its contractors, and for PGDP regulators and stakeholders. Using a formal investigation, feasibility study and decision process, Electrical Resistance Heating (ERH) was selected for the treatment of the soil and groundwater in the vicinity of C-400. ERH was selected as an interim action to remove “a significant portion of the contaminant mass of TCE at the C-400 Cleaning Building area through treatment…” with the longer term goal of reducing “the period the TCE concentration in groundwater remains above its Maximum Contaminant Level (MCL).” ERH is a thermal treatment that enhances the removal of TCE and related solvents from soil and groundwater. The heterogeneous conditions at PGDP, particularly the high permeability regional gravel aquifer (RGA), are challenging to ERH. Thus, a phased approach is being followed to implement this relatively expensive and complex remediation technology. Conceptually, the phased approach encourages safety and efficiency by providing a “lessons learned” process and allowing appropriate adjustments to be identified and implemented prior to follow-on phase(s) of treatment. More specifically, early deployment targeted portions of the challenging RGA treatment zone with relatively little contamination reducing the risk of adverse collateral impacts from underperformance in terms of heating and capture. Because of the importance and scope of the C-400 TCE source remediation activities, DOE chartered an Independent Technical Review (ITR) in 2007 to assess the C-400 ERH plans prior to deployment and a second ITR to evaluate Phase I performance in September 2010. In this report, these ITR efforts are referenced as the “2007 ITR” and the “current ITR”, respectively. The 2007 ITR document (Looney et al., 2007) provided a detailed technical evaluation that remains relevant and this report builds on that analysis. The primary objective of the current ITR is to provide an expedited assessment of the available Phase I data to assist the PGDP team as they develop the lessons learned from Phase I and prepare plans for Phase II. The current ITR developed the following consensus conclusions, or “lessons learned,” related to Phase I.
• UCRS and uppermost RGA (50 to 70 ft depth) were heated to the target temperature and the gas phase concentration and mass removal decreased over time stabilizing at relatively low levels (i.e., “asymptosis”). If confirmatory borings in the UCRS indicate significant TCE source reduction, then Phase I can be considered successful in achieving the regulatory/technical objectives in this zone. However, additional mass may be removed at relatively low cost by continuing soil vapor and groundwater extraction until the soil cools after terminating the heating.
B-9

viii
• Temperature goals were generally not achieved in the RGA (particularly in the deep RGA from 70 to 100 ft depth) during Phase I. The data confirm that in a high permeability – high flow aquifer, thermal remediation is inefficient as a significant proportion of the applied energy was lost from the target zone. The inefficiencies were exacerbated by periods when the electrodes were not powered due to operation problems. In general, the complex engineering and operational efforts focused on minimizing heat loss and distributing the energy throughout this challenging subzone were ineffective. Analogously, the data indicate the Phase I system did not adequately control contaminant migration from the RGA treatment zone. These topics were specifically identified and discussed in detail in the earlier (2007) review and will not be repeated here.
• Phase I costs, even when generously adjusted/reduced to account for water treatment infrastructure that is available for future remediation activities, were approximately $2500 per cu yd. Based on the literature (e.g., Looney et al., 2007 Appendix E and Baker 2006) and the experience of the ITR panel members, these are the highest unit costs ever reported for a full scale thermal remediation. Such high costs suggest a lack of focus on important project management controls and the need for a renewed commitment to cost effectiveness as the site moves into future phases of clean-up.
The ITR developed the following consensus conclusions related to the potential changes that were “proposed” for meeting a commitment of using ERH exclusively for heating in the RGA during Phase II – the documents provided to the ITR were developed primarily by the Phase I ERH contractor McMillan McGee (Mc2).
• The primary basis for the suggested system changes (required to heat the RGA using ERH) was new modeling runs. The modeling concentrated on improved heating in the RGA and better control/capture of heat and contaminant. Importantly the current ITR concluded that the modeling to support Phase II heating of the RGA is inadequate – the weaknesses and deficiencies identified by the 2007 ITR in the Phase I model were not appropriately evaluated and corrected. Further, the contractor did not avail themselves of the obvious opportunity to convincingly validate and calibrate their model based on the detailed energy, temperature and pressure dataset collected during Phase I.
• Application of a simplified scoping model/calculation to predict ambient groundwater velocities in the RGA from Phase I field temperature data was not valid.
• The modifications for Phase II that were indicated by the modeling (more electrodes, closer spacing, upgradient water extraction, higher voltages, higher water and vapor extraction, injection of preheated water, increased saline injection, etc.) would potentially increase costs dramatically for Phase II.
• The draft plans are indefensibly expensive, not supported by a clear conceptual basis or validated model, and difficult to implement.
B-10

ix
Based on our review, the current ITR team developed the following overarching conclusions/recommendations:
• The ITR recommends discontinuing the Phase I heating operations – the regulatory commitments and objectives appear to be met in the UCRS and continued heating in the RGA is contraindicated. However, as stated below, continued extraction is recommended during cooling to garner benefits afforded by the residual heat in the target soils.
• Plans should be initiated to implement a modified Phase II (see below). In the interim between Phase I and Phase II, vapor and groundwater extraction should be continued, with changes implemented to reduce operating costs and with appropriate allowances for turn-off, as needed, to allow for Phase II mobilization and system alterations.
• Heating of the UCRS appears feasible and we recommend developing plans for efficient and effective Phase II ERH deployment for this zone.
• ERH (or any of the other thermally enhanced removal technologies) is poorly matched to the RGA conditions in the vicinity of the C-400 building – The ITR recommends that heating technology be eliminated from Phase II for this particular zone. Instead, the ITR recommends that the PGDP project team and their regulators and stakeholders, address the TCE source in the RGA using a technology that is better matched to the RGA target zone – one that will lead to better performance, lower costs, reduced collateral impacts (e.g., energy use), reduced drilling, etc.
• Specific technologies that take advantage of high permeability saturated RGA conditions include: oxidation using chemical reagents, solubilization using cosolvents or surfactants, and others. The ITR recommends identification and implementation of a more appropriate technology for addressing the Phase II RGA TCE source material.
• As an interim Phase II support action, the current ITR recommends modifying the existing water treatment infrastructure for Phase II support (to reduce unnecessary costs) and implementing pump and treat of contaminated groundwater from the RGA in the Phase II (southeast) C-400 target zone. Preliminary calculations indicate that performing pump and treat in this zone would remove contamination at rates that are on par with the Phase I RGA system while substantially reducing the potential for adverse impacts.
• Clear plans should be developed and implemented to assure that project management systems are in place to control costs and to identify and correct cost escalation issues. For example, no compelling basis exists for a sole source contract to heat the UCRS in Phase II. The ITR recommends demobilizing the existing heating equipment and performing a competitive rebid process for future work – this should be initiated as soon as possible.
The ITR encourages all parties and employees involved in this cleanup to focus on their important roles in making this difficult project a success – this type of “ownership society” is key to implementing a Phase II in a safe-effective-efficient manner that maximizes the removal of the TCE source while controlling expenditures.
B-11

SRNL-STI-2010-00681
1
1.0 Introduction The U. S. Department of Energy (DOE) is operating an electrical resistance heating (ERH) system in areas near the southwest corner and east of the C-400 Cleaning Building at the Paducah Gaseous Diffusion Plant (Phase I) to enhance the removal of solvent contamination in the underlying soil and groundwater. DOE is using the results of Phase I, the data and “lessons learned,” to develop/refine plans for remediation of the more highly contaminated areas near the southeast corner of the C-400 Cleaning Building (Phase II). Current plans and commitments for this remediation are to use an expanded implementation of the same heating technology. To assist in this effort, DOE assembled an independent team of scientists and engineers with expertise in groundwater remediation and treatment, engineering, design, and treatment system installation and operation to provide an expedited review of Phase I results and Phase II plans. The review team consisted of Dr. Brian Looney (Savannah River National Laboratory), Dr. Lloyd “Bo” Stewart (Praxis Environmental), Dr. Joe Rossabi (RedoxTech LLC), and Mr. Walt Richards (PRC Paducah). Appendix A provides information on the background of the team members. 2.0 Background 2.1 Previous Review Activities for the C-400 Thermal Treatment Several of the current Independent Review Team (ITR) members participated in an earlier review of the then planned thermal treatment for this site, Review Report: Building C-400 Thermal Treatment 90% Remedial Design Report and Site Investigation, PGDP, Paducah Kentucky (Looney et al., 2007). In the earlier review, the team members highlighted a substantial number of key issues and provided specific recommendations. In particular, the earlier review team expressed concern about the ability to heat the deep portion of the highly permeable Regional Gravel Aquifer (RGA) and found the supporting models “unconvincing.” The team also urged the Paducah project team to develop realistic and technically based performance metrics, perform additional characterization, develop more robust and diverse contingencies, reduce costs, and consider numerous engineering and logistics recommendations. One of the most important recommendations from the earlier team was to use a phased approach for the planned C-400 cleanup activities. This would provide an opportunity to assess the performance of ERH in this challenging setting, and to use the performance during Phase I to refine, optimize or alter activities in the follow on phase(s). The Paducah team and their contractors considered the identified issues and recommendations and made some modification (See Appendix C) – most importantly, they structured the project in two phases. The results of the current ITR activities reflect, and are informed by, the 2007 report; the current team members would like to express their recognition of, and appreciation for, the important contributions of all of the members the earlier team and to specifically recognize those individuals who participated in the earlier team, but who are not represented in our current expedited effort: Dr. Eva Davis, US Environmental Protection Agency (EPA), Dr. Jed Costanza (EPA) and Dr. Hans Stroo (HGL, Inc).
B-12

SRNL-STI-2010-00681
2
2.2 Phase I – Plans Thermal treatment, specifically ERH, was selected as an interim action for treating residual TCE sources in the soil and groundwater in the vicinity of C-400 (DOE, 2005a). The plans for ERH deployment were documented in the Remedial Action Work Plan (RAWP) (DOE, 2008a) and the Remedial Design Report (RDR) (DOE, 2008b). These plans were implemented by onsite and contractor personnel. Implementing the remediation in two phases was a key element described in the RAWP:
“A phased deployment of ERH will be implemented. The first phase (Phase I) will implement the design presented in the RDR, referred to as the base design, in the southwest and east treatment areas. In addition to removing VOCs from these areas, another important objective of Phase I will be to evaluate the heating performance of the base design through the Regional Gravel Aquifer down to the McNairy Formation interface in the southwest treatment area. Treatment in the east treatment area involves only the Upper Continental Recharge System.”
The RAWP also describes the role of Phase I in developing contingencies and in evaluating capture of the vapor recovery system and hydraulic containment in the groundwater. Figure 1 provides a graphical overview of the three TCE source areas (southwest, southeast, and east) that were identified using membrane interface probe (MIP) characterization, operational records, and historical data (DOE 2008a and DOE 2008b). Figure 1 also indicates the relative quantities of TCE source mass in the different areas and the allocation of the source areas to the Phase I (southwest and east) and Phase II (southeast) treatment campaigns. Deployment of Phase II was projected to follow Phase I with modifications to be made based on data from Phase I and lessons learned. Because of the significant uncertainties related to heating in the high permeability RGA (Looney et al., 2007), a target RGA treatment zone with relatively low TCE source mass was selected for Phase I (Figure 1). This decision deferred ERH treatment of the southeast treatment area (with substantially higher TCE source mass projected in the RGA) to Phase II, mitigating the potential technical risk associated with underperformance in heating and/or hydraulic containment (i.e., reducing the potential for release and mobilization of large amounts of TCE source to the groundwater). Because a RGA volume with relatively low TCE source mass was targeted, the expected Phase I mass removal from the RGA was relatively small compared to the projected mass removal from the UCRS for Phase I and small compared to the projected mass removal for both the RGA and UCRS for Phase II. Note that the deployment of ERH in the shallower UCRS was considered to pose less technical risk (Looney et al., 2007) and the Phase I UCRS target volume was projected to contain a significant mass of TCE (DOE 2008a and 2008b).
B-13

SRNL-STI-2010-00681
3
TCE sourcesUCRS – significantRGA – small / uncertain Φ I Φ II
Φ I
TCE sourcesUCRS – significantRGA – significant
TCE sourcesUCRS – significantRGA – none documented
Target source zones and ERH treatment sequence
Figure modified from RDR (DOE 2008b)
TCE sourcesUCRS – significantRGA – small / uncertain Φ I Φ II
Φ I
TCE sourcesUCRS – significantRGA – significant
TCE sourcesUCRS – significantRGA – none documented
Target source zones and ERH treatment sequence
Figure modified from RDR (DOE 2008b)
Figure 1. C-400 vicinity DNAPL sources targeted for ERH treatment. The figure documents the planned sequence for Phase I (Φ I) and Phase II (Φ II) and
summarizes the relative quantities of DNAPL source mass in the different zones. 2.3 Phase I – Metrics In working toward risk-based end-state goals for PGDP, actions to mitigate the known contaminant sources around Building C-400 have been identified as a key activity in PGDP environmental management strategy documents (e.g., DOE, 2005b). In response, an interim Record of Decision (ROD) (DOE 2005a) was developed to address TCE, a primary C-400 contaminant. The ROD identified thermal treatment as the selected technology and established the following objectives for treatment:
o It will contribute to the final remediation of the Groundwater OU by removing a significant portion of the contaminant mass of TCE and other VOCs at the C-400 Cleaning Building.
o It will reduce the period of time that TCE concentration in groundwater remains above its Maximum Contaminant Level (MCL), and meets the statutory preference for attaining permanent solutions through treatment.
o It is not expected to meet the MCL in groundwater for TCE, but satisfies the requirements set forth in 40 CFR 300.430(f)(1)(ii) for interim measures that will become part of the total remedial action that will attain applicable requirements (ARARs).
B-14

SRNL-STI-2010-00681
4
o It will be cost-effective based upon the estimates available at the time of the ROD.
o It will permanently remove a significant portion of the TCE near the C-400 Cleaning Building area through treatment, but will result in hazardous substances, pollutants, or contaminants remaining on-site at levels precluding unlimited use and unrestricted exposure.
o It meets the regulatory preference for remedies that employ treatment as a principal element of the remedy that permanently and significantly reduces toxicity, mobility, or volume of hazardous substances, pollutants, or contaminants
Note that these strategic objectives appropriately recognize that ERH will not achieve final cleanup goals for solvent sources at C-400 and, instead, attempt to define an appropriate role for the technology as an interim action intended to remove a significant quantity of source mass within the context of a longer term sequence of remedial activities. The shut off criteria for the Phase I interim action, as stated in the Record of Decision (ROD) (DOE 2005a), are to operate the ERH system “until monitoring indicates that heating has stabilized in the subsurface and that recovery of TCE, as measured in the recovered vapor, diminishes to a point at which further recovery is at a constant rate (i.e., recovery is asymptotic). At asymptosis, continued heating would not be expected to result in any further significant reduction of toxicity, mobility, or volume of the zone of contamination.” Section 3.3 of the Remedial Design Report presents the negotiated criteria for ceasing operations, which address the ROD goals of achieving stabilized heating of the subsurface and asymptotic recovery of TCE. The RAWP further indicated that groundwater TCE concentrations and pulsed (rebound) tests would be used to supplement the temperature and vapor concentration metrics. The RDR (DOE 2008b) defined asymptotic recovery in more detail and provided additional detail regarding criteria for ceasing Phase I ERH operations. 3.0 Review Process 3.1 Objectives The overarching objectives of the ITR are to review C400 thermal treatment Phase I results and Phase II plans. This review was performed in an expedited manner in an attempt to provide independent information and assessment on these topics. The review team was provided available reports and data on Phase I and preliminary plans and modeling related to Phase II. Because of the expedited schedule, the review team focused primarily on overarching issues related to technical performance and project implementation. The team did not perform a detailed scientific or engineering evaluation. The focus of the effort was to provide information to DOE and the PGDP project team, regulators and stakeholders to assist in environmental management decisions and formulating plans for Phase II activities.
B-15

SRNL-STI-2010-00681
5
In summary form, the basis, goals and objectives for this ITR effort were:
• Basis: – The C-400 source zone clean-up is a large-important project to DOE – The unique setting yields a complex and challenging application of the
selected thermal technology • Goals and objectives:
– Provide input to the PGDP team from independent technical experts – Assess the data and performance from Phase I and the plans for Phase II – Support DOE and regulators as plans are being put in place for Phase II – Supplement the 2007 ITR
The team would like to express their appreciation to the DOE PPPO and to the technical and management staff at PGDP for their support and for their responsiveness in providing the data requested (when available). 3.2 Lines of Inquiry To meet the review objectives, the ITR identified the following lines of inquiry.
For Phase I: temperature performance, concentration and mass reduction performance, project implementation, cost and project structure and lessons learned.
For Phase II: summary of proposed activities, ITR review of proposed activities, ITR identified alternatives for consideration
The following section is organized according to these lines of inquiry. 4.0 Review Results 4.1 Phase I: Temperature Performance As shown in Figure 2, the Phase I treatment areas were fitted with ERH electrodes, water and vapor monitoring wells/piezometers, digital temperature monitoring systems (“digiTAMs”), and digital pressure monitoring systems (“digiPAMs”). The digital monitoring systems provided measurements from the base to the top of the targeted treatment zone at regularly spaced depth intervals (e.g., every three feet). Much of the data collected by the monitoring system (as well as information about the status and power levels at the ERH electrodes) was made available to the PGDP project team and others via secure web access (http://www.mcmillan-mcgee-data.com/paducah). The web data portal was provided by the ERH contractor (MC2) and the data were generally updated daily. The IRT found the data portal to be useful, found the interface to be attractive and intuitive, and commends the PGDP project team and MC2 for implementing this relatively useful communication tool (note that the portal focused only on ERH –
B-16

SRNL-STI-2010-00681
6
similar systems were not in place for contaminant concentration and removal data and data related to the vapor and water treatment systems). The primary thermal objective for Phase I was to achieve target temperatures throughout the heated zone. The target temperatures were set at levels that approach the boiling point of water as a function of depth/pressure (achieving this temperature throughout the zone is a surrogate indicator that bulk TCE source solvent has been removed because the presence of such material would stall the temperature below this level). The middle and bottom panels on Figure 2 show snapshots of example temperature distributions in the UCRS and the deep RGA after the temperatures has reached a “steady state.” It is clear from this figure that there was a significant thermal performance difference between the UCRS and the RGA. Heating in the UCRS was relatively effective and the heat was distributed throughout the zone. Conversely, the heating in the SW Area deep RGA was less effective and localized around the electrodes. Note that the contour plot for temperatures in the deep RGA almost certainly overstates the size of the hot areas around the electrodes because there are insufficient numbers of digiTAMs to control for the cool temperatures occurring between the various pairs of adjacent electrodes – everywhere there is a digiTAM between electrodes, the picture cools to green while areas without such control allow the warm colors to coalesce. Further, the extent of the warmest (white and pink) areas around the electrodes is not substantiated by data (these areas were not monitored) and the depiction is a function of the contouring algorithms that may not represent actual conditions. Despite these standard limitations associated with machine contouring (a necessity to allow posting and rapid sharing the data on the project portal), the images provide a generally accurate broad conceptual picture of RGA heating performance. The plots clearly indicate that heating in the lower portion of the RGA was ineffective – with target temperatures extending less than 5 radial feet from the electrodes. The uppermost 3 to 6 feet of the RGA (layer map not shown in Figure 2) exhibited more uniform heat suggesting that the localized heating around the electrodes in the this permeable aquifer resulted in upward convection of hot water and steam and lateral spread at the RGA UCRS interface. These heat distributions and patterns are fundamental to the conditions of the RGA and are consistent with the 2007 ITR predictions and comments (Looney et al., 2007).
Key Points: During Phase I… The UCRS was heated to target temperature Temperature goals were generally not achieved in the RGA.
B-17

SRNL-STI-2010-00681
7
Note that the members of the ITR generally support the use of thermal remediation of source zones in appropriate settings and that our conclusions about the ineffectiveness of heating in the RGA should not should not be interpreted as a general assessment of this important technology. A more detailed review of the temperature data document the delivery of large amounts of energy/heat during Phase I and measurable heating in the RGA. The Phase I temperature data from initial startup and into June 2010 indicated an increase in temperatures in the lower RGA, with saline injection at the electrodes required to maintain power levels at the electrodes (to maintain high power levels at >12 kW/electrode). Saline injection appeared to become ineffective in mid- to late- June, possibly due to saline injection delivery problems to the deeper electrodes. Saline injections were suspended in early July 2010. The system also experienced periods of equipment problems during which the electrodes were not powered. Nonetheless, after extended operation, the temperature distribution reached a “steady state” that closely matched the theoretical pattern predicted from analytical models based only on aquifer properties (van Lookeren, 1983). Thus, even though the Phase I data showed the RGA was being heated to some degree, it also provided convincing information that thermal remediation in this setting may be constrained by fundamental process limitations. Another important aspect of the thermal performance can be assessed by considering the energy balance. How does the energy input to the system balance with the temperatures? If energy (and by analogy mass) is being lost, where is it going? Data and time limitations precluded the current ITR from a comprehensive energy balance analysis, but a screening of the available data provides important information to help understand Phase I temperature performance.
Key Point: The temperature data confirm that thermal remediation technologies such as ERH are not well suited to uniform heating in high permeability and high flow aquifers.
B-18
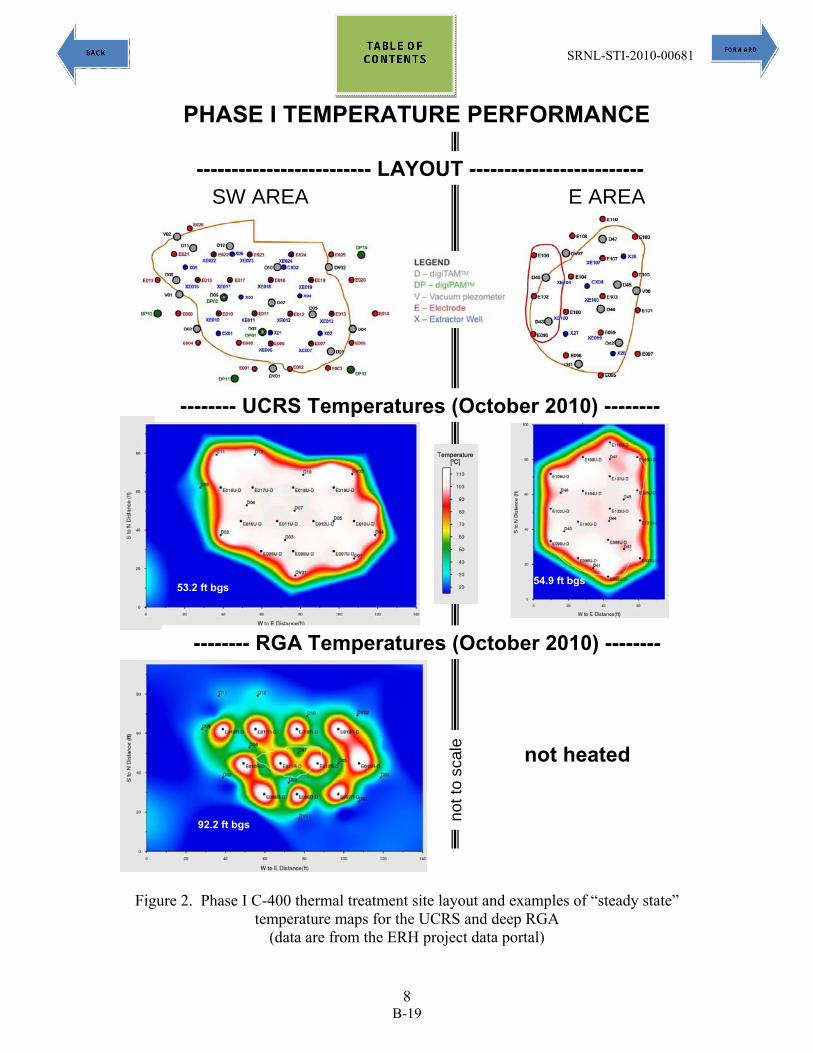
SRNL-STI-2010-00681
8
------------------------- LAYOUT -------------------------SW AREA E AREA
not t
o sc
ale
PHASE I TEMPERATURE PERFORMANCE
-------- UCRS Temperatures (October 2010) --------
-------- RGA Temperatures (October 2010) --------
not heated
54.9 ft bgs53.2 ft bgs
92.2 ft bgs
Figure 2. Phase I C-400 thermal treatment site layout and examples of “steady state” temperature maps for the UCRS and deep RGA
(data are from the ERH project data portal)
B-19
SRNL-STI-2010-00681
9
Energy Balance in the Southwest Area – According to the information provided on the project data portal, the soil volume targeted for heating in the southwest area was 163,401 ft3 in the vadose zone and 15,291 ft3 in the saturated zone. The water table was located at a depth of about 55 feet below the surface and the saturated zone treatment extended to 80 feet. The energy transferred to the Southwest Area during Phase I, as of 1-Oct-10, was ~1,750,000 kWhr into the UCRS and ~670,000 kWhr into the RGA. The energy required to bring a unit of vadose zone soil to saturated steam temperature (i.e., to the boiling point) is approximately 1.5 kWh/ft3. In the saturated zone, the energy value is roughly 2.0 kWh/ft3. Assuming the UCRS roughly corresponds to the vadose zone for screening purposes, the energy transferred per target soil volume was about 10.7 kWh/ft3. This energy input is above the minimum required to bring the vadose zone soil to saturated steam temperature (i.e., to the boiling point). The ITR attributes the excess energy requirement to the power needed to balance water injected into the electrodes, higher energy requirements associated with any saturated UCRS materials, heat loss from steam and water spread, heat loss from conduction, and the associated power needed to hold the zone at temperature over time. Importantly, the UCRS has significantly lower permeability and lower saturated flow compared to the underlying RGA and the UCRS exhibited more effective and even heating. Based on the above assumptions, we can calculate the ratio of energy actually applied to the UCRS to the minimum theoretical value (10.7 / 1.5 7) for a zone that was effectively heated. This ratio, in turn may serve as a rough guide, or scoping value, to assess if significantly more heat loss occurred in the RGA. The energy required to bring a unit of saturated zone soil to saturated steam temperature (i.e., to the boiling point) is approximately 2.0 kWh/ft3 if the water is stagnant. Assuming the saturated zone volume corresponds roughly to the RGA, the energy transferred per target soil volume was about 44 kWh/ft3. This energy input is 22 times the theoretical minimum required to bring the saturated zone soil to saturated steam temperature (i.e., to the boiling point); however, this quantity does not account for the influx of ambient groundwater from natural gradients. Based on the stagnant water energy balance, the energy transfer would appear to be more than sufficient to heat the RGA but temperature monitoring indicated limited heating occurred in the soil below 70 feet bgs near the top of the RGA. While insufficient data were provided on water injection and extraction to fully assess the energy balance, the excess energy applied to the RGA was 22x the theoretical minimum compared to “reference” value of 7x calculated for the UCRS. The data suggest that the majority of the energy introduced to the RGA was lost to flowing groundwater. Energy losses from the heated volume were further exacerbated by operational issues such as power outages and interruptions in groundwater extraction (note that the target extraction to injection ratio was 1.7 (i.e. 70% more fluids were extracted than were injected). Thus, the energy balance indicates that heat (and contaminant to the extent it was present in the lower RGA in the SW area) migrated downgradient and outside beyond the target soil volume during Phase I.
B-20

SRNL-STI-2010-00681
10
Energy Balance in the East Treatment Area – The soil volume targeted for heating in the East Area was 60,494 ft3 in the vadose zone and 15,291 ft3 in the saturated zone. The water table was located at a depth of about 55 feet below the surface and the saturated zone treatment extended to 60 feet. The energy transferred to the East Area during Phase I was ~1,200,000 kWh into the UCRS. The RGA was not treated in the East Area. The total energy transferred per target soil volume was therefore about 16 kWh/ft3. The energy required to bring a unit of vadose zone and saturated zone soil to saturated steam temperature (i.e., to the boiling point) is approximately 1.5 to 2.0 kWh/ft3. The energy applied to the east treatment area is about 10x the minimum theoretical value, similar to ratio calculated for the UCRS in the SW area. Concentration and mass reduction performance Mass Removal during Phase I – At the time of the ITR visit, the cumulative mass removal during phase I operations was approximately 6,548 lbs (535 gallons) of TCE. This source TCE was removed from the subsurface in the East and Southwest Treatment Areas. The solvent was collected in the treatment system in the T-107 tank or sorbed to the activated carbon beds. The PGDP operations teams reported approximately 30 gallons of TCE on the activated carbon (based on concentration measurements in the inlet stream minus the outlet stream) and just over 500 gallons of net TCE in the T-107 tank under a layer of water which is pumped off periodically for reprocessing through the water treatment system. The TCE was sampled and analyzed recently and determined to be primarily TCE. A key co-contaminant, 99Tc, was measured in the collected DNAPL/TCE solvent with an activity near the method detection limit (approximately 12 pCi/L). Data for other potential hydrophobic co-contaminants discussed in Looney et al., (2007) were either not measured in the solvent phase and/or not reported to the ITR. Based on the available information, the solvent may be suitable for recycle instead of disposal/destruction as a hazardous waste. If recycle is viable, such a disposition path represents a relatively benign and more sustainable option. The measured collection of approximately 6,548 lbs of TCE during the Phase I ERH in the SW and E treatment areas was a significant source of concern at the time of the ITR visit. The initial estimates of TCE mass – approximately 285,781 lbs (23,350 gallons) -- were more than 40 times higher than the amount of TCE actually removed during Phase I
Key Points: The energy applied to heat and hold the UCRS at target temperature was about 7 to 10 times the theoretical requirement. The energy applied to the RGA was about 22 times the theoretical requirement while Phase I RGA temperatures stabilized below target values. This suggests that water flowing through the permeable RGA is removing the majority of the applied energy from the treatment zone.
B-21

SRNL-STI-2010-00681
11
– approximately 6,548 lbs (535 gallons). Concerns related to the large discrepancy between the “conservative” original estimates of mass and the actual removal were heightened when a retrospective calculation of mass was generated using limited soil core data – that estimate was approximately 5 lbs (61 gallons). In response to these issues, the ITR examined the estimates and uncertainties. Uncertainty in Initial Mass Estimates – In the August 2007 Review Report (WSRC-STI-2007-00427), the Independent Technical Review (ITR) team recommended collecting enough soil and groundwater concentration data to calibrate the Membrane Interface Probe’s (MIP) response to TCE (Recommendations 5.1.1a and 5.1.1b). Unfortunately, the MIP calibration was not performed so an alternate approach was used to incorporate the extensive MIP data into an estimate of residual TCE at the site. Appendix A in the Remedial Design Report (DOE/LX/07-0005&D2/R1, July 09, 2008) describes the method and calculations used to develop TCE mass estimates for the southwest target area based on MIP data. MIP data were collected from 51 locations and NAPL presence or absence at the MIP location was correlated to specific detector threshold values. The highest MIP values over a five foot interval were assigned to that interval. If these MIP values exceeded the threshold value, TCE NAPL was posited for that interval. The five foot intervals were then combined into 20 foot vertical sections. If soil sample data were available (e.g., for a few 20’ to 40’ and 40’ to 60’ data), these data were evaluated with the MIP data to determine NAPL sections. At each NAPL section, a saturation value was assigned assuming a cylinder of residual NAPL saturation (posited at 30% assuming maximum values from a 1991 document written by B.H. Kueper) which decreased logarithmically with radial distance from the cylinder until reaching a minimum saturation value of 1%. The volume of NAPL was then calculated (Attachment A6 of the Remedial Design Report) based on the assumed TCE saturation values. From this analysis, a volume of 23,100 gallons of TCE was estimated to be in the southwest treatment area. In the east, at the SWMU 11 TCE Leak Site, calculations were based on analyses of soil core from Boring 011-005 resulted in a total estimated volume of 250 gallons (3060 lbs) of TCE. Thus the total TCE solvent volume initially calculated for the Phase I treatment zones (SW and E) was approximately 285,781 lbs (23,350 gallons) From experience with residual DNAPL saturation encountered at other sites, 30% residual TCE saturation (approximately 100 g/kg) is exceptionally high and rarely encountered at sites, making the initial estimates unrealistically high. More commonly found residual saturation values of TCE are between 1% and 2%. Using a value of 1% residual saturation for the target volume in the southwest area calculated in Appendix A of the Remedial Design Report, a residual TCE volume of approximately 2,650 gallons (32,433 lbs) of TCE is calculated. For the east, the measured TCE saturation of 3% occurring between the depths of 28’ and 32’ bgs was used to calculate total TCE mass assuming a radial extent of approximately 15.7 feet around Boring 011-005. This extrapolated mass (3060 lbs) based on the sample
B-22

SRNL-STI-2010-00681
12
data is similar in magnitude to the TCE mass actually removed (3427 lbs from soil vapor extraction data in the east as of 9/26/10). This provides an additional line of evidence that the thermal treatment may be effectively treating the UCRS (particularly since some additional mass removed may originate outside of the target volume). If confirmed by post-treatment soil sampling results, the ITR technical assessment would be that the UCRS was effectively remediated in Phase I. Using the more realistic NAPL saturation based estimate for the SW area and the actual mass removed in the East area, the estimated mass of TCE in the Phase I treatment zone is 35,860 lbs (2,930 gallons). While this lower value represents a more realistic estimate, the available data do not support the development of a defensible estimate of initial TCE mass in the Phase I treatment zones. In response to the poor mass balance, a supplemental calculation was performed based on soil core data. During the 2007 ITR (Looney et al., 2007), the team recommended collecting enough soil and groundwater samples to calibrate MIP values and to refine the treatment volume. On installation of electrodes and monitoring equipment, a limited number of soil samples in the southwest area were collected from the rotasonic drilled boreholes. These samples were insufficient for calibrating the MIP data. The samples were used to independently estimate the mass of TCE in the southwest area. Approximately 5 g samples were collected approximately every 10 to 20 feet using Encore samplers and analyzed by commercial laboratory. Sample selection was guided by screening the collected soil with a portable photo ionization detector (PID). The total volume of TCE estimated by this method was approximately 5 gallons (61 lbs), which is a significant underestimate of the residual contaminant mass. There are several negative biases in collecting samples in this manner. Volatile compounds in Rotasonic core can be lost if a large amount of energy (sonic converted to heat) is required for drilling a particular depth interval. Compounds can also be lost if a large amount of water is used during drilling (from flushing the sediments). In addition to losses incurred by drilling, organic contamination is generally found in discrete, and often small, sections of the subsurface. Collecting approximately 5 g samples every 10 feet or more will rarely be adequate to accurately represent contaminant distribution. Finally, using only measured groundwater concentration values
Key Points: The initial large estimates of TCE mass in the soil and groundwater in the SW treatment area at the C-400 Building were based on unrealistically high DNAPL saturation assumptions and were too high. Later estimates using limited and insufficient soil samples were biased low. The ITR concluded that, despite the large amount of characterization at this site, data do not exist to generate a definitive and fully credible pretreatment mass estimates. However, using more centrist assumptions, the ITR calculated an order of magnitude estimate for Phase I starting mass of 35,860 lbs (2,930 gallons) for the combined SW and East treatment areas. The estimates for the east treatment area were performed using a different approach and appear reasonable.
B-23

SRNL-STI-2010-00681
13
(approximately 50 mg/l) and the volume of the saturated zone in the southwest area (approximately 3254 m3), approximately 10.5 gallons (128.5 lbs) of TCE can be found in the groundwater alone. As described previously, the majority of energy introduced into the RGA in the Southwest Area was lost to groundwater that migrated downgradient from the target volume indicating dissolved contamination was lost with it. While this phenomenon had minimal adverse impact during Phase I (because of the relatively low TCE content in the RGA), such transport has important implications when planning for Phase II in an area that has significantly higher TCE content in the RGA. Application of ERH in the RGA of the Southeast Area would have the potential to mobilize significant contaminant mass and any contaminants mobilized by the heating would tend to migrate beneath the C-400 Building where there is limited capability for extraction and treatment. For example, if the groundwater velocity is six feet per day and heating yields a dissolved phase TCE concentration of 50 mg/L, the rate of TCE transport away from the Southeast Treatment Area would be on the order of 10 to 15 pounds per day. This is an important topic that should be weighed by the PGDP team as they plan for Phase II. This finding suggests that ERH be eliminated as a treatment for the RGA in the SE area or that clear and aggressive design action be implemented to assure that control and capture are maintained in the high permeability RGA. Mass Captured During Initial Soil Vapor Extraction (SVE) – The 2007 ITR review (Looney et al., 2007) recommended operating SVE and pump-and-treat for extended periods prior to energizing the subsurface. The extended operation was to allow equipment shakeout and to provide a baseline of contaminant removal rates without heating. Unfortunately, Phase I operations without heating were performed for only a few days. Nonetheless, the data can be used to suggest the value of heating the subsurface on contaminant removal rates. The TCE removal rates before heating and the maximum rates measured during heating were: Southwest SVE = 12 – 23 lb/day (Maximum during heating = 52 lb/day) East SVE = ~1.5 lb/day (Maximum during heating = 141 lb/day) Groundwater Extraction = 17 lb/day (Maximum during heating = 17 lb/day) If we calculate hypothetical mass recovery for six months of operation at the initial, unheated, SVE and groundwater extraction mass recovery rates (assuming the concentrations remained constant), the performance would be as follows: Hypothetical unheated Southwest SVE = 3,000 pounds (255 gallons) Hypothetical unheated East SVE = 270 pounds (22.5 gallons) Hypothetical unheated Groundwater Extraction = 3,000 pounds (255 gallons) Hence, pump-and-treat in both areas, without heating, had the potential to recover an TCE at rates that were similar in magnitude to the heated Phase I performance. However, the comparison reveals that heating with SVE in the Southwest area was moderately
B-24

SRNL-STI-2010-00681
14
effective and in the East Treatment Area was very effective. The general conclusion is that heating with SVE in the vadose zone was generally effective while pump-and-treat alone may have worked nearly as well as ERH in the saturated zone. ERH is accompanied by water injection at the electrodes such that dilution may have occurred in the extracted groundwater as evidenced by the decrease in mass removal rate via groundwater extraction with the onset of heating and water injection. Response of Soil and Groundwater Concentration/Flux As the Phase I UCRS (SW and E) and RGA (SW) were heated, contaminant removal increased in the vapor phase and then declined as expected (see Figure 3). This general behavior was altered somewhat due to the operational issues that resulted in several extended periods during which the heating was turned off. A complete analysis of the resulting data is beyond the scope of this ITR, but a few key observations are provided below. Importantly, after reaching a peak removal near 165 lbs/day (approximately 140 lbs/day in the East and 25 lbs/day in the SW) the mass removal rate declined and stabilized near 10 lbs/day. At the operating vapor flow rates, the current vapor concentrations are relatively low compared to peak values. Note that the extracted vapor concentration is a function of TCE removal rate divided by vapor flow rate (and is influenced by specific wells pumped and pulsing). In many cases, large increases in vapor flow rate result in relatively modest increases in mass flux (thus vapor concentration decreases as flow rate increases). As a result, the linkage of the extracted vapor concentration to remediation progress is somewhat indirect. Consistent with the 2007 ITR, we believe that mass removal is a more robust metric and recommend its use for assessing progress and “asymptosis.” Another important indicator of performance for the RGA is the impact of remedial system operation on groundwater concentration data. Interpretation of the RGA groundwater data within the treatment zone is complicated by the fact that water is continuously removed at a relatively low flow rate, treated to remove TCE and other contaminants, and then added back in (serving as a limited pump and treat in the high flow high permeability zone). As a result, the contaminant concentration in the RGA treatment zone groundwater would be expected to decrease over the course of an extended treatment operation. In general, this is what was observed. It is perhaps more interesting to follow the impact of the remediation on the downgradient groundwater. If contaminant is being effectively captured, then the downgradient concentrations would also be expected to decrease (after sufficient time for the signal to arrive at the monitoring location). The PGDP project team installed a number of monitoring wells that provide reasonable downgradient monitoring at several elevations within the RGA. While the period of monitoring is insufficient to develop a definitive conclusion, available data from some of the dowgradient wells (Figure 4) provide some initial indications of RGA treatment performance.
B-25

SRNL-STI-2010-00681
15
Sou
thw
est
Tre
atm
ent A
rea
Eas
t Tre
atm
ent
Are
a
Figure 3. Mass removal rate (lbs/day) during Phase I of the C-400 ERH Treatment
(these graphs also indicate average temperature and when the electrodes were offline)
B-26
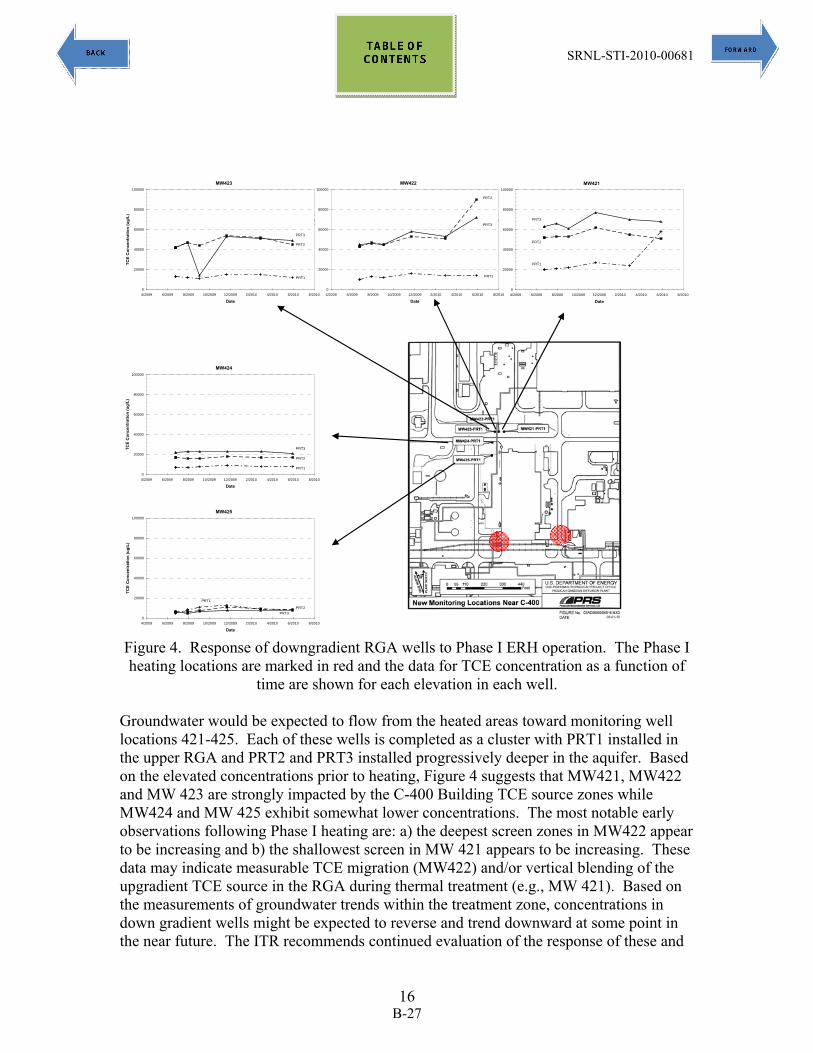
SRNL-STI-2010-00681
16
MW421
0
20000
40000
60000
80000
100000
4/2009 6/2009 8/2009 10/2009 12/2009 2/2010 4/2010 6/2010 8/2010
Date
TC
E C
on
cen
trat
ion
(u
g/L
)
PRT1
PRT2
PRT3
MW422
0
20000
40000
60000
80000
100000
4/2009 6/2009 8/2009 10/2009 12/2009 2/2010 4/2010 6/2010 8/2010
Date
TC
E C
on
cen
trat
ion
(u
g/L
)
PRT1
PRT2
PRT3
MW423
0
20000
40000
60000
80000
100000
4/2009 6/2009 8/2009 10/2009 12/2009 2/2010 4/2010 6/2010 8/2010
Date
TC
E C
on
cen
trat
ion
(u
g/L
)
PRT1
PRT2
PRT3
MW424
0
20000
40000
60000
80000
100000
4/2009 6/2009 8/2009 10/2009 12/2009 2/2010 4/2010 6/2010 8/2010
Date
TC
E C
on
cen
trat
ion
(u
g/L
)
PRT1
PRT2
PRT3
MW425
0
20000
40000
60000
80000
100000
4/2009 6/2009 8/2009 10/2009 12/2009 2/2010 4/2010 6/2010 8/2010
Date
TC
E C
on
cen
tra
tio
n (
ug
/L)
PRT1
PRT2
PRT3
Figure 4. Response of downgradient RGA wells to Phase I ERH operation. The Phase I heating locations are marked in red and the data for TCE concentration as a function of
time are shown for each elevation in each well. Groundwater would be expected to flow from the heated areas toward monitoring well locations 421-425. Each of these wells is completed as a cluster with PRT1 installed in the upper RGA and PRT2 and PRT3 installed progressively deeper in the aquifer. Based on the elevated concentrations prior to heating, Figure 4 suggests that MW421, MW422 and MW 423 are strongly impacted by the C-400 Building TCE source zones while MW424 and MW 425 exhibit somewhat lower concentrations. The most notable early observations following Phase I heating are: a) the deepest screen zones in MW422 appear to be increasing and b) the shallowest screen in MW 421 appears to be increasing. These data may indicate measurable TCE migration (MW422) and/or vertical blending of the upgradient TCE source in the RGA during thermal treatment (e.g., MW 421). Based on the measurements of groundwater trends within the treatment zone, concentrations in down gradient wells might be expected to reverse and trend downward at some point in the near future. The ITR recommends continued evaluation of the response of these and
B-27

SRNL-STI-2010-00681
17
other downgradient wells as important indicators of the performance of the thermal remediation toward the important-overarching ROD goals “to remove a significant portion of the VOCs from the subsurface in the vicinity of the C-400 Cleaning Building …. and to reduce the period of time that TCE contaminates groundwater.” Project Implementation Design and Detailed Response to Earlier Recommendations – An annotated synopsis of the 2007 ITR (Looney et al, 2007) issues and recommendations is provided in Appendix C. Notably, the PGDP team implemented some of the most important recommendations (e.g., a phased approach for the C-400 cleanup activities) but did not implement the bulk of the recommendations including many of the recommendations that were highlighted as “critical” to resolve prior to moving forward with the ERH heating technology. In particular, modeling and simulation issues and recommendations were not addressed and a significant number of the performance metric, characterization and design recommendations were either “not done” or “partially done.” The PGDP team did consider and develop a specific written response to all of the 2007 ITR issues and recommendations, however, and implemented the project in a disciplined and careful manner working through a series of approved deliverables (RAWP, RDR, O&M Plan, etc.). The following discussion documents the general observations that were developed during the current ITR site visit. As with the other portions of the report, this is not a comprehensive audit, but is intended to provide the PGDP team with useful input that will assist in planning and implementing future remedial activities at this site. Overarching Technical Observations from Site Walkdown – Overall, The C-400 thermal remediation site was impressive. The area was neat and well organized, and all employees were aware of the importance of safety and working in a complex multi-use environment. The Phase I ERH effort involved mobilization and operation of a large amount of equipment, training and management of a knowledgeable workforce, and coordination among multiple organizations and agencies. In interviewing site personnel throughout the visit, the theme of “I am doing it this way because I was told to” was repeated many times. In follow up questions (e.g., “have you thought about ways to improve this,” “has this worked for you,” “did … cause you some problems,” “have you informed your manager about what you are seeing,” etc.), the respondents typically did not have any additional response. The ITR believes that careful adherence to plans and procedures is necessary, particularly for large and complex projects, but that each employee must “own” their job, continuously exhibit thoughtful curiosity, and constantly strive to improve operations and efficiencies. The ITR encourages the PGDP team to encourage and increase their emphasis on an “ownership society” for future phases of the remediation. We believe that disciplined operations, controlled by reasonable procedures, can be developed in such a manner that they encourage, and are responsive to, creativity and insights of employees at all levels.
B-28

SRNL-STI-2010-00681
18
Sampling – Observations from Site Walkdown – The Innova model 1312 photoacoustic multigas analyzer is a good choice for monitoring compounds in the gas or vapor phase at the site. The optically filtered IR based system is consistent and accurate over a two to three order dynamic range (set by initial calibration) and can maintain its calibration for months to years with little intervention or need for recalibration. One of the most useful aspects of the instrument for monitoring soil gas is its ability to measure carbon dioxide concurrently with the volatile compound of interest (in this case TCE). Soil gas almost always contains carbon dioxide at a significantly higher concentration (1,000 ppmv to 20,000 ppmv) than surface air (400 to 500 ppmv). If carbon dioxide measurements are lower than average values found in the subsurface at a site it is usually an indication that ambient air is leaking into the sampling and analysis train and therefore diluting the concentration of the target compound. Soil gas measurements using an IR multigas monitor should generally include measurements of carbon dioxide concurrent with the target contaminant. A pitfall of measuring soil gas is condensing water vapor. Although the 1312 uses a measurement cell that is heated above ambient temperatures, liquid water in the cell will interfere with accurate measurement results. In addition, condensed water in the sampling line can occlude the flow of soil gas making concentration measurements inconsistent. Often these issues can be recognized by inconsistent carbon dioxide measurements. Although site personnel have made efforts to reduce the likelihood of condensed water from soil gas affecting measurements, on several occasions they have had to “dry out” the instrument after a day of measurements because liquid water was sucked into the measurement cell. In addition, during their approximate 11 minute measurement interval at a particular well, they often encounter measurement values that differ by two orders of magnitude. This difference is unlikely to indicate actual differences in soil gas over this brief interval and is more likely due to sampling issues. Concurrent carbon dioxide measurements would help to determine if the large change in contaminant concentration represents actual subsurface conditions or is due to sampling problems. The model 1312 instruments are currently configured to analyze a few unnecessary parameters. At a minimum 1,1 DCE analysis should be discontinued and carbon dioxide substituted. This should help reduce uncertainties and discrepancies in soil gas measurements and may also indicate more general characteristics of the treatment system, for example, a consistent low carbon dioxide measurement that increases with depth (in comparison with other areas on site) may indicate the extent to which the soil vapor extraction system is pulling in surface air. It is not clear why the highest frequency measurements are being collected from the least dynamic portion of the system (post treatment gas in which all measurements would be expected to be below detection and any changes would occur gradually). These measurements are being made at the expense of the most dynamic portion of the system (extraction wells). The ITR recommends that measurements of the post treatment gas be reduced to two times per day at maximum while pretreatment gas measurements should be more frequently to provide actionable information about system operations. Further, the concentration data collected for both vapor and water phases at all sampled locations,
B-29

SRNL-STI-2010-00681
19
and key parameters associated with the vapor and liquid treatment system operations should be made available/accessible using a database system similar to the Phase I web portal (this portal provided access to heating and power information). Water Treatment System – Observations from Site Walkdown – The vapor and liquid treatment systems and controls consisted of a variety of unit operations that were combined into a treatment system to address the expected waste stream. In general the system was appropriate for the challenges of a complex feedstream typical of thermal remediation. The team noted, however that significant unit operations within this system were leased or rented and that this arrangement is not consistent with a source zone thermal treatment in which the treatment of vapor and liquid should extend well beyond the operation period of the heating (this topic was strongly emphasized in the 2007 ITR report and the inclusion of leased/rented equipment should have been recognized as a decision that would sharply increase costs). One of the categories of leased equipment was the cryogenic condensation treatment units – according to site personnel, these systems have been difficult to operate and they are not adequately integrated into the treatment system process controls. Based on these statements, and the lower TCE inventory estimates discussed above, the ITR recommends discontinuing the leasing of this equipment and making appropriate design modifications to allow continued treatment operations. Similarly, the ITR recommends removal of other unit operations that are in place to treat contaminants that have not been measured in substantive quantities (e.g., vinyl chloride), particularly those that are incurring charges. Leased/rented equipment that is essential to operations (e.g., surge tanks) should be replaced or purchased if a cost evaluation (assuming several years of operation) indicates that the purchase would reduce lifecycle cost. The following specific operating concerns were identified during the walkdown. These are provided to assist the PGDP as they plan for Phase II cleanup activities. While this is not a comprehensive list, the ITR is providing these observations to help assure that the design for future activities meets standard and peak operating needs.
o The cryogenic condensation and recovery units are independent systems and are difficult to integrate into the process resulting in operating difficulties. The performance of these systems suggests that designers should use caution in selecting and using a large number of small system packages in parallel operation to meet relatively high system flow requirements.
o The original (as designed) un-insulated vapor piping system pipelines allowed condensate formation without adequate provision for condensate removal. Modifications to the system alleviated the problems after several operating issues were encountered, particularly during cold weather operations. This issue contributed to extended periods of no subsurface heating and longer times to reach subsurface temperature goals in the UCRS.
o The initial ERH project was implemented using a sole source to a thermal remediation contractor based on a patented process called ET-DSP™ that uses a proprietary electrode design that was intended to provide unique capabilities to
B-30
SRNL-STI-2010-00681
20
heat in the heterogeneous and challenging subsurface conditions in the vicinity of C-400. The results and lessons-learned from Phase I do not support these claims. As a result, the current ITR recommends that ERH activities for Phase II be awarded based on a best value competitive bid. A secondary benefit of this course of action is that the electrode spacing and power requirements are significantly less stringent for the UCRS, reducing the thermal remediation costs and allowing resources to be preserved to allow alternative technology to be deployed in the RGA.
o Critical data to support performance assessment, such as individual well flowrates and concentrations, are not available during most of the treatment. A header vapor flowrate meter for the East Area combined with the SW Treatment areas was added to the recorded data within the last month of operation. Prior to this only total vapor flowrates were measured just downstream of the air stripper.
o Phase I operational problems have resulted from both mineral precipitation and particulate solids. For example, iron and manganese are present in the RGA groundwater at C-400. Any iron or manganese that is extracted in a dissolved “reduced” state is subject to oxidation in various locations within the treatment system (e.g., the air stripper), forming solid hydroxides/oxides. Designs to avoid and mitigate the resulting plugging in the air stripper and process piping are recommended to avoid performance reduction. The ITR also noted potential problems associated with the screen sizes in some of the RGA pumping/extraction wells that might allow solids to interfere with pump operation and reduce extraction rates and hydraulic control.
o The Pulsed Operation Plan was prepared by Mc2; however, in our teleconference (9-15-10), Mc2 had not reviewed recent measured concentrations of extracted vapors and liquids. Hence, the basis for the pulsed operation was not clear. The plan at the East site was to extract from two of four wells for three days and then switch extraction to the other two wells for three days. At the end of this period, the two initial extraction wells would be opened to extraction for at least two hours and then all four wells would be sampled. More meaningful sampling would be daily concentrations from the operating extraction wells for each of the six days. The plan then specifies extracting from the two wells yielding the highest concentrations. This is better termed as the two wells producing the highest mass extraction rates. This extraction period is followed by extraction in all four wells at a very low extraction rate for four days and then four days at maximum extraction rates. The plan calls for concentration measurements at the end of the maximum flow period. It is recommended that daily measures of concentration from all wells be collected to assess the changes in concentration resulting from the changes in subsurface flow. Justifications for the durations of extraction in varying configurations are not provided. A description of the methods of data interpretation relating the results to remedial objectives is not provided; hence the basis for the pulsed operation is suspect. Similar concerns and recommendations (i.e., measure vapor concentrations in extraction wells daily) apply to the pulsed operation plan for the southwest area. The plans for determining performance vis-à-vis monitoring data, particularly related to shut off criteria should be more carefully and technically developed for Phase II.
B-31

SRNL-STI-2010-00681
21
The ITR urges the PGDP to implement modifications to the vapor and liquid system carefully in a manner that will support mass removal in the period between Phase I and Phase II and in a manner that will support more efficient and effective operations during Phase II. Costs and project structure The Phase I costs were approximately $32.5 million; approximately $13 million associated with construction and approximately $19.5 million associated with operations (Phase I had a complex operating structure/organization. PRS/ LATA was the project manager, Shaw was the process operator on the surface, Mc2 was the subsurface project operator and other organization provided specific categories of logistical support. The operations costs include all of the various organizations). Notably, the Phase I costs significantly exceed the costs provided to the 2007 ITR and are higher than the costs estimated in the RDR. Importantly, based on the previous (lower) cost estimates, the overarching recommendation from the 2007 ITR was:
The ITR team determined that the estimated cost for ERH thermal treatment at the C-400 Building is within the range of thermal treatment costs at other federal sites on a per treatment volume and per electrode basis. Nonetheless, the cost is near the upper end of the historical range and further cost refinement and cost reduction opportunities should be pursued as the project plans are finalized. (Looney et al., 2007)
Based on the higher actual realized costs, the current ITR believes that the PGDP team did not adequately focus on cost refinement and cost reduction opportunities. This is exemplified by the Phase I unitized costs. If we generously assume that about half of the construction costs can be assigned to Phase II (since much of the vapor and water infrastructure is planned for follow-on use), then the adjusted Phase I costs are approximately $25 million (($13 million construction – $7.5 million construction allocated to Phase II + $19.5 million operations). The sum of the treatment volume in the Phase I treatment areas (SW and E) was approximately 10,000 cu yd. Thus, the realized unit costs for the PGDP C-400 thermal treatment Phase I were approximately $2,500 per cu yd and these unit costs substantially exceed the range of previous thermal treatment costs (e.g., $100 to $1,020 per cu yd with a median of approximately $200 per cu yd; see Looney et al., 2007 and Baker, 2006); the phase I unit costs are 2.5x higher than the highest previously documented full scale thermal remediation unit costs. Based on the experience of the current ITR these are the highest unit costs for full scale remediation ever realized. Such high costs suggest a lack of focus on important project management controls and the need for a renewed commitment to cost effectiveness as the site moves into future phases of clean-up.
B-32

SRNL-STI-2010-00681
22
The ITR generated a preliminary list of cost related observations to assist the PGDP team as they plan for Phase II:
o Costs to date do not include waste disposition or ongoing costs while PGDP works with regulators to develop a path forward. It is unclear if power costs have been included in the costs that were provided to the current ITR; based on the energy applied to the electrodes, the power costs for the Phase I effort are approximately $0.75 million.
o Some of the high operating costs were related to the high indirect costs for escorts, foreign national security, long term housing and living costs for temporary duty (TDY) staff, transportation, etc. These and other costs should be avoided by the use of full time, cleared staff from local sources.
o In some cases, the project infrastructure, while impressive, was outside of industry norms in terms of expenditures. A specific example is that redundant state of the art touch screen process control panels were installed for the water treatment process – one in the main equipment enclosure and a second (slave controller) in the adjacent personnel trailer. While this was presented as necessary for safety (to minimize potential danger from lightning strikes), the ITR was not convinced that walking the few feet between the trailer and the equipment enclosure was a significant risk that justified the expenditure of 10s of thousands of dollars. The ITR recommends that Phase II be held to a high standard of safety but that decisions should be based on a more industry standard graded approach that implements systems in a fiscally disciplined frugal manner that safely achieves functional goals.
o A significant contributor to the high costs was the decision to lease or rent significant unit operations within the vapor/water treatment system. The process equipment which has been obtained through continuing leasing agreements has generated project lifecycle costs that far exceed the cost that would have been realized by purchasing the equipment. Replacement and warranty issues are also an operating financial concern.
Lessons learned for Phase II The current ITR assessment of performance and lessons learned are summarized in the various topical sections above. During the September, 2010 ITR visit, the PGDP site contractor (currently LATA) was receptive to alternative designs for Phase II operations. Currently, LATA is exploring a design option generated by the Phase I ERH contractor for the UCRS. Other remediation technologies are being evaluated for treatment of the TCE source in the RGA..
In general, the MC2 assessment and lessons learned from Phase I were that the RGA permeability/flow were higher than assumed in their Phase I models and that significantly more power, more electrodes, and interception of upgradient water are needed to improve performance. They note that at very high flow rates (e.g., 6 feet per day), even this “full throttle” approach may not meet the heating objectives. Note that all of the MC2 conclusions from Phase I and plans for Phase II are based entirely on numerical models which have proven to be inaccurate at this site and which are based on suspect and fragile boundary conditions. Further, these models have not been validated for the RGA in the
B-33

SRNL-STI-2010-00681
23
vicinity of the C-400 Building despite the fact that the entire Phase I database of site configuration, power applied, heating and extraction were available to the contractor. In lieu of this obvious and technically robust approach, a simplistic and flawed analysis of groundwater flow was performed (this calculation serves as a primary basis for assuming that the water flow rates are viable for a beefed up phase II concept).
According to Mc2, a simple mathematical approach was used, with a snapshot of data from Phase I, to estimate the groundwater flow velocity within the deep RGA by matching actual temperature data from D007 (as a pulse of heat moved through the system). Note that the following discussion references the Phase I monitoring locations and graphs that were provided by Mc2 for a modeling-based Phase II conceptual design report. In the modeling, groundwater flow velocity was estimated to range between 1.82 and 3.04 feet per day. The write-up does not describe how the initial temperature distribution was determined (depicted in the Phase II concept report Figure 2.2). Electrode E012 is almost directly upgradient of D007 used for the temperature modeling and is assumed to be at ~25 C for the simulation. Hence, the calculation is not valid as the initial condition has no basis. In addition, temperature at the nearby D005 dropped precipitously at 84.6 ft bgs after the power outage. These observations suggest the groundwater velocity could be significantly higher than 3 ft/day and the interpretation is invalid. According Mc2, the RGA can not be treated by ET-DSP™ (the variant of ERH used in Phase I) if the groundwater velocity is greater than about 6 ft/day. The ITR believes that the simple flow calculation is not useful, that the groundwater velocity may be higher than 3 ft/day, and that Mc2 should have concluded that there is a potential that ERH is not viable for the RGA, even if implemented aggressively. The Mc2 design option is likely to result in a substantial increase in the cost for the phase II construction (originally estimated to be approximately $10 million). The current ITR believes that the available data suggest a significant risk of underperformance, even with the new design. The extreme efforts being proposed to heat the RGA, a zone that Phase I demonstrated is poorly matched to the capabilities of ERH, are principal drivers in increasing project, costs, complexity and risk. 4.2 Phase II ITR review of Mc2 proposal – As noted above, the ITR assessment determined that Phase I results indicate that the UCRS and uppermost RGA were heated to the target temperature and the gas phase concentrations decreased over time and stabilized at relatively low concentrations (i.e., “asymptosis”). If confirmatory borings in the UCRS confirm significant TCE source reduction, then Phase I can be considered successful in achieving the regulatory/technical objectives in this zone. Conversely, the temperature goals were generally not achieved in the RGA (particularly in the deep RGA) during Phase I, substantially validating the concerns expressed in the earlier (Looney et al., 2007) independent review. The data confirm that in a high permeability – high flow aquifer, thermal remediation is inefficient with a significant proportion of the applied energy and/or complex engineering and operational efforts focused on minimizing heat loss and in distributing the energy
B-34

SRNL-STI-2010-00681
24
throughout the target zone. These topics were specifically identified and discussed in detail in the earlier (2007) review and will not be repeated here. In response to the earlier technical review, Mc2 and the project team expressed confidence in their ability to meet temperature objectives throughout the RGA – based on modeling and proprietary electrode and control systems. Actual performance during Phase I clearly document that previous modeling results were inaccurate and that the proprietary electrodes and control systems provide little, or no, unique capabilities in overcoming the challenges of high permeability and high flow in the RGA. In preparing for Phase II, the Mc2 approach was no different than their Phase I strategy in that they ran similar numerical models in a similar manner leading to a similar expression of confidence in their ability to achieve temperature goals throughout the RGA. The resulting Phase II planning was entirely modeling-based with no documentation or critical evaluation of Phase I field data, no exploration of alternative modeling approaches (i.e., utilizing more appropriate boundary conditions and comparison of results to simple analytical models of limiting cases for perspective), and minimal focus on the impacts of the proposed alterations on logistics and costs. The previous ITR team found the initial Mc2 modeling results unconvincing -- the current ITR team found the modeling to support Phase II unconvincing for the same general reasons. Importantly, in preparing for Phase II Mc2 had every opportunity to convincingly validate and calibrate their model based on the detailed energy, temperature and pressure dataset collected during Phase I but did not perform this obvious task. Thus, while the proposed Phase II engineering modifications may represent a plausible scenario, the ITR found the basis for the modifications to be wholly insufficient. Based on the Phase I results, the ITR team determined that ERH (or any of the other thermally enhanced removal technologies) is poorly matched to the RGA conditions in the vicinity of the C-400 building and recommends that heating technology be eliminated from Phase II for this particular zone. Instead, we recommend that the Paducah project team and their regulators and stakeholders, identify a technology that is better matched to the target zone – one that will lead to better performance, lower costs, reduced collateral impacts (e.g., energy use), reduced drilling, etc. These alternatives are described in more detail below. ITR alternatives evaluation – According to the available information, a substantial TCE source is present in both the UCRS and the RGA in the southeast treatment zone that is targeted in Phase II. The ITR recommendation to eliminate thermal remediation the Phase II RGA treatment zone does not imply that this contamination is not important. The ITR advocates treating this target contamination to achieve the ROD commitments and objectives, but using technologies that are better matched to the high flow and high permeability conditions. Moreover, based on the data from Phase I, ERH heating appeared to be relatively effective and efficient in the UCRS and the ITR recommends that deployment of ERH proceed for the UCRS in the southeast treatment zone.
B-35
SRNL-STI-2010-00681
25
In transitioning from Phase I Phase II, the current ITR has the following more specific recommendations:
• Turn off heat (i.e., power to the Phase I electrodes) but continue recovery of vapor and groundwater to the extent practicable.
• Simplify treatment system based on actual concentrations and performance in Phase I – (e.g., use GAC as primary capture system and remove chillers, zeolite systems, etc. unless there is a compelling technical basis to the contrary) .
• Demobilize leased equipment wherever possible – if some of this equipment needs to be replaced, a procurement should be initiated.
• Consider opportunistic reagent addition to RGA in SW C400 if needed to supplement Phase I efforts (e.g., add oxidant to injection ports).
In identifying and implementing technologies the current ITR recommends: a) that the PGDP project team and their regulators and stakeholders, identify a technology that is better matched to the RGA target zone – one that will lead to better performance, lower costs, reduced collateral impacts (e.g., energy use), reduced drilling, etc., and 2) a culture that encourages all personnel to understand the overall goals of the remediation and their important roles in making the project a success – this type of “ownership society” is key to implementing a cost effective Phase II action. The ultimate success for remediation at this site will hinge on making the necessary “give and take” decisions and in implementing the resulting technology portfolio skillfully and efficiently. The remainder of this section addresses the considerations related to defining an appropriate technology for the RGA. In general, the technology classes that should be considered include one or more of the following: pump-and-treat, chemical oxidation, cosolvent/surfactant extraction, and enhanced (reductive) bioremediation. For completeness we have included thermally enhanced remediation in the discussion. We have not included standard isolation/immobilization technologies (e.g., caps or walls) at this juncture because traditional implementations are unlikely to yield reasonable performance – note however that some technologies include isolation/immobilization features (e.g., partitioning into oils). In a general sense, technologies that benefit from the ability to inject and control liquid reagent in the subsurface and that have sufficient longevity to address back diffusion from the underlying McNairy Formation represent the best match for RGA conditions. This discussion presumes that aggressive thermal remediation of the UCRS (as planned for Phase II) will substantially reduce future discharge from the overlying formation into the RGA. The matrix in Table 1 provides a qualitative discussion of some of the key factors related to potential RGA technologies.
B-36

SRNL-STI-2010-00681
26
Table 1. RGA technology matrix for Phase II TCE treatment
Technology Description Reagent injectability and controllability
Reagent longevity to address McNairy
Summary
Extraction Technology Pump and Treat in the RGA – pump highly contaminated groundwater from the RGA Phase II RGA target zone (e.g., beneath UCRS heating zone) to an appropriately modified treatment system
Not applicable (no reagent), however, based on Phase I data, pump and treat is likely to remove TCE from the RGA more effectively than the planned heating system
Does not specifically remove or destroy McNairy contamination and does not provide post operational capability to address back diffusion from the McNairy
Recommended as a prudent action between Phase I and Phase II. Recommended as a Phase II action during UCRS Heating May be useful as a bulk removal activity prior to reagent injection.
Oxidant Permanganate Solution – Inject potassium or sodium permanganate solution in SE RGA target volume
Reagent is well suited to injection and relatively safe. High strength (dense) solutions can be deployed at the McNairy interface. Permanganate results in pink/purple water.
Some diffusive penetration into the McNairy is expected and deployment at the interface will provide limited sustainability (e.g., months to years). High RGA groundwater flow would flush reagent from site after deployment reducing longevity.
Potentially viable for RGA.
B-37

SRNL-STI-2010-00681
27
Table 1. RGA technology matrix for Phase II TCE treatment (continued)
Technology Description Reagent injectability and controllability
Reagent longevity to address McNairy
Summary
Oxidant Technology (continued) Persulfate Solution – Inject persulfate solution in SE RGA target volume
Reagent is well suited to injection and relatively safe. High strength (dense) solutions can be deployed at the McNairy interface. May require activation to achieve desired performance.
Some diffusive penetration into the McNairy is expected and deployment at the interface will provide limited sustainability (e.g., months to years). High RGA groundwater flow would flush reagent from site after deployment reducing longevity.
Potentially Viable for RGA
Peroxide Solution – Inject peroxide solution in SE RGA target volume (along with activation adjunct)
Reagent is well suited to injection and effective in degrading TCE, but generates large volumes of gas. Difficult to deploy at the McNairy Interface.
Peroxide decays rapidly and this chemistry would provide limited penetration into the McNairy and no significant sustainability.
Not recommended for the RGA
Soil blending – blend in permanganate solid from the surface (this would treat both the UCRS and RGA)
Not applicable (viable) at this site because of depth, cultural interferences, safety concerns, etc.
Not viable Not viable. Poor match to the RGA in the vicinity of the C-400 building.
B-38

SRNL-STI-2010-00681
28
Table 1. RGA technology matrix for Phase II TCE treatment (continued)
Technology Description Reagent injectability and controllability
Reagent longevity to address McNairy
Summary
Enhanced Extraction Using Liquid Solutions Cosolvent Solution – Inject cosolvent solution (e.g., high molecular weight alcohol) to mobilize residual DNAPL for collection
Reagent is well suited to injection and might result in a secondary process of transient biological degradation of TCE in anaerobic pockets generated as a result of degradation of residual cosolvent in the formation. Mobilization requires effective capture a has an increased technical risk compared to in situ destruction.
Does not specifically remove or destroy McNairy contamination and does not explicitly provide post operational capability to address back diffusion from the McNairy (except for fortuitous anaerobic degradation)
Potentially viable, but entails has more uncertainty and more technical risk than in situ destruction.
Surfactant Solution – Inject surfactant solution to form microemulsions that mobilize residual DNAPL for collection
Reagent is well suited to injection. Similar advantages/disadvantages to cosolvent but may have higher cost and less potential for secondary biodegradation.
Similar to cosolvent Potentially viable, but entails has more uncertainty and more technical risk than in situ destruction.
B-39

SRNL-STI-2010-00681
29
Table 1. RGA technology matrix for Phase II TCE treatment (continued)
Technology Description Reagent injectability and controllability
Reagent longevity to address McNairy
Summary
Enhanced (Reductive) Bioremediation Emulsified and liquid vegetable oil solutions/liquids – Inject emulsified and liquid oil solutions to generate reductive conditions that encourage destruction. May require supplemental micro-organism addition as well.
Emulsified oil reagent is suited to injection but is less mobile than carbohydrate substrates such as molasses (potentially requiring more wells). Reliably generating anaerobic conditions throughout the RGA would require large amounts of amendment and the high flow rate would flush reagent from the treatment zone relatively rapidly. At this site, emulsified oil could be supplemented with liquid (neat) vegetable oil that would float to the UCRS/RGA interface and provide a partitioning and bioreaction zone at that location.
Little diffusive penetration into the McNairy is expected. Because of reagent flushing and the influx of electron acceptors (oxygen, etc.) from upgradient, this process is not expected to provide limited sustainability (e.g., months).
Potentially viable, but entails has more uncertainty and more technical risk than in situ destruction.
B-40

SRNL-STI-2010-00681
30
Table 1. RGA technology matrix for Phase II TCE treatment (continued)
Technology Description Reagent injectability and controllability
Reagent longevity to address McNairy
Summary
Enhanced (Reductive) Bioremediation (continued) Carbohydrate solutions/liquids – Inject carbohydrate (e.g., molasses, or ethyl lactate) solutions to generate reductive conditions that encourage destruction. May require supplemental micro-organism addition as well.
Most carbohydrate reagent is well suited to injection. Reliably generating anaerobic conditions throughout the RGA would require large amounts of amendment and the high flow rate would flush reagent from the treatment zone relatively rapidly.
Little diffusive penetration into the McNairy is expected. Because of rapid reagent flushing, the influx of electron acceptors (oxygen, etc.), and the labile nature of carbohydrate substrates, this process is expected to provide minimal sustainability (e.g., weeks to months). Requirement for frequent and multiple injections would be probable.
Potentially viable, but entails has more uncertainty and more technical risk than in situ destruction. The need for frequent reinjections makes this technology somewhat analogous to pump and treat in its operations and maintenance profile.
Thermally Enhanced Extraction Electrical Resistance Heating Poorly matched to RGA
conditions based on Phase I performance.
Poorly matched to RGA conditions.
Has not demonstrated viability for these conditions
Steam Flood This technology is subject to the same fundamental limitations as ERH. Poorly matched to RGA conditions
Poorly matched to RGA conditions.
Has not demonstrated viability for these conditions
B-41

SRNL-STI-2010-00681
31
The most promising potential alternatives to remediate TCE contamination in the RGA are the application of oxidant solutions or the application of amendments to enhance biological degradation (reduction). Simple extraction, using pump and treat is also relatively effective in the high flow RGA conditions. Relatively high ORP and dissolved oxygen values in the RGA suggest oxidation as the most appropriate aggressive remediation option but the presence of TCE mass in fine grain zones out of the advective flow path may provide opportunities for enhanced reductive dechlorination. Due to the depth and thickness of the RGA, there are limited options for emplacement and distribution of the amendments. Injection through temporary (e.g., Geoprobe) or permanent (e.g., through wells) points at multiple depths will probably provide the best opportunity for distribution of the amendment. Oxidation There are several oxidants that have effectively remediated TCE in situ including hydrogen peroxide, permanganate, and persulfate, and each have advantages and disadvantages with respect to application at this site. Hydrogen peroxide based methods such as Fenton’s reagent have fast kinetic rates which is appropriate for the limited contact time expected in the fast-flowing RGA. Unfortunately, Fenton’s reagent also creates a great deal of gas and heat which tends to displace contaminant-laden fluids and limit contact of the oxidant with TCE. Sodium persulfate is a strong oxidant which is effective on TCE but has slower oxidation rates which may limit its effectiveness on residual TCE in the RGA. Persulfate’s kinetic rate is dramatically enhanced with increasing temperature, though and may be much more effective if the RGA is at 40 deg C rather than 15 or 20 degrees C. Based on rapidly changing temperature data from the RGA during periods when the electrodes were turned on or off, persulfate would have to be applied soon after heating has ended to take advantage of the short-lived increased temperature in the RGA. A potential disadvantage of the application of persulfate is that sulfate is created when persulfate is consumed in oxidation. Although most of it will be flushed out of the system, remaining sulfate accumulating in low flow zones may impede subsequent reductive dechlorination in the aquifer by acting as a competing electron acceptor when ORP is low enough to promote sulfate reduction. Permanganate (either sodium or potassium) may be the most appropriate oxidant for this site. Permanganate’s reaction rates are relatively fast and permanganate has been successfully used to remediate many TCE contaminated sites. The most critical component in the application of permanganate (or any amendment) is satisfactory distribution. The RGA is wrought with pathways of variable permeability. The permeability contrasts determine where most of the fluid in the system will travel. For effective treatment, it will be imperative for the amendment to be distributed both in the fastest flowing paths and the slowest flowing paths (likely location of most of the residual contamination in the RGA). Injection of amendment at multiple depths (e.g., through direct push, or well clusters) may help provide adequate distribution.
B-42

SRNL-STI-2010-00681
32
Biological (and Enhanced Abiotic) Reduction If remaining TCE is trapped in fine grain pores well away from the advective flow paths, this residual source will feed the advective plume until the residual mass is depleted. Residual mass in fine grain pores may be in the RGA, above it in the UCRS, or below it in the McNairy. Despite high ORP values (> 200mV) and dissolved oxygen (> 2 mg/l), there is some evidence of reductive dechlorination of the TCE (small amounts of cis dichloroethene) which is presumably occurring in the fine grain zones out of the primary advective flow paths. Enhancing reductive dechlorination in these zones may be justified if a substantial amount of contaminant mass remains there. Accessing these zones with amendment is difficult and may only be effectively achieved by diffusion. As with oxidants, to achieve penetration into these zones by diffusion, the amendments must be persistent. If a substantial residual mass is held in fine zones in the McNairy, it may be possible to effectively apply a persistent reductive amendment. A dense organic carbon amendment to encourage bio reductive dechlorination and/or zero valent iron may be effectively distributed at the RGA/McNairy interface by injection. This type of amendment may persist for months to years and will control flux of TCE from the McNairy into the RGA. Applying a reductive amendment in either the RGA or the UCRS will be more difficult but may be considered after an oxidant injection. Pump and Treat Extraction in the Source Area As a scoping calculation for aqueous phase pump and treat: extracting from the Phase I RGA at 5 mg/l and 40 gpm is equivalent to approximately 1.1 kg (~2.5 lbs) of TCE recovered from the aqueous phase per day. If a well in the southeast (Phase II treatment zone) were added at 40 gpm and average aqueous concentration of 150 mg/l, an additional 32.8 kg (~72 lbs) per day of TCE would be recovered.
B-43
SRNL-STI-2010-00681
33
References Baker, R., 2006. In situ remediation of soil contaminated with organic contaminants. Presented at, Prevention and Remediation in Selected Industrial Sectors: Small Sites in Urban Areas, Athens, Greece, June 2006, NATO/CCMS Pilot Study (available at: http://www.clu-in.org/athens/download/Organic_Contaminants/US-Ralph_Baker.pdf ) Butherus, M., Ingle, D.S., Juhlin, R., and Daniel, J. Project Overview: Successful Field-Scale In Situ Thermal NAPL Remediation. Paper presented at the Third International Conference on Oxidation and Reduction Technologies for Soil and Groundwater, San Diego, CA, 24-28 October 2004. DOE 2008a. Remedial Action Work Plan for the Interim Remedial Action for the Volatile Organic Contamination at the c400 Cleaning building at the Paducah Gaseous Diffusion Plant, Paducah Kentucky. DOE/LX/07-0004&D2 Primary Document, U. S. Department of Energy, Lexington KY. DOE 2008b. Remedial Design Report, Certified for Construction Design Drawings and Technical Specifications Package, for the Groundwater Operable Unit for the Volatile Organic Compound Contamination at the C-400 Cleaning Building at the Paducah Gaseous Diffusion Plant, Paducah, Kentucky, DOE/LX/07-0005&D2, U.S. Department of Energy, Paducah, KY, February. DOE 2005a. Record of Decision for Interim Remedial Action for the Groundwater Operable Unit for the Volatile Organic Compound Contamination at the C-400 Cleaning Building at the Paducah Gaseous Diffusion Plant, Paducah, Kentucky, DOE/OR/07-2150&D2/R2, U.S. Department of Energy, Paducah, KY, July. DOE, 2005b. 2005 End State Vision Annual Update for PGDP, DOE/OR/07-2119&D2/R3, U. S. Department of Energy, Lexington KY. Energy Information Administration (EIA). Average retail price of electricity to ultimate customers by end-use sector, by state. Electrical power monthly with data for April 2007. Available at http://www.eia.doe.gov/cneaf/electricity/epm/table5_6_a.html. 11 July 2007. Gavaskar, A., M. Bhargava, and W. Condit. Final Report – Cost and Performance Review of Electrical Resistance Heating (ERH) for Source Treatment. Technical Report TR-2279-ENV. Naval Facilities Engineering Command, Engineering Service Center, Port Hueneme, CA. Johnson, P.C., C.C. Stanley, M.W. Kemblowski, D.L. Byers, and J.D. Colthart, 1990, “A practical approach to the design, operation, and monitoring of in situ soil venting systems,” Ground Water Monitoring and Remediation, Spring, pp. 159-177.
B-44

SRNL-STI-2010-00681
34
Looney, B., J. Costanza, E. Davis, J. Rossabi, L. Stewart, and H. Stroo, 2007. Review Report: Building C-400 Thermal Treatment 90% Remedial Design Report and Site Investigation, PGDP, Paducah Kentucky, WSRC-STI-2007-00427, U.S. Department of Energy Office of Scientific and Technical Information, Oak Ridge TN, publically available through www.osti.gov . Paducah Remediation Services, LLC (PRS). Remedial Design Report, 90% Design Drawings and Technical Specifications Package, for the Groundwater Operable Unit for the Volatile Organic Compound Contamination at the C-400 Cleaning Building at the Paducah Gaseous Diffusion Plant, Paducah, Kentucky (DOE/LX/07-0005&D1). April 2007a. Paducah Remediation Services, LLC (PRS). Remedial Action Work Plan for the Interim Remedial Action for the Volatile Organic Compound Contamination at the C-400 Cleaning Building at the Paducah Gaseous Diffusion Plant Paducah, Kentucky (DOE/LX/07-0004&D1). May 2007b. U.S. Army Corps of Engineers (USACE). Design: In Situ Thermal Remediation. Unified Facilities Criteria (UFC). UFC 3-280-05. 31 July 2006. U.S. Army Corps of Engineers (USACE). Design: In Situ Thermal Remediation. Unified Facilities Criteria (UFC). UFC 3-280-05. 31 July 2006. van Lookeren, J., 1983, “Calculation Methods for Linear and Radial Steam Flow in Oil Reservoirs,” Soc. Pet. Eng. J., vol. 23, pp. 427-439.
B-45

SRNL-STI-2010-00176
35
Appendix A. Independent Technical Review Team
Statement of Work
B-46

SRNL-STI-2010-00176
36
STATEMENT OF WORK For Review of the Paducah C-400 Electrical Resistance Heating Phase 1 Results
and Phase 2 Plans I. PURPOSE: The U. S. Department of Energy (DOE) is currently operating a three-phase electrical resistance heating treatment system at areas near the southwest corner and east of the C-400 Cleaning Building at the Paducah Gaseous Diffusion Plant (Phase 1). DOE is also using the results of Phase 1 to develop plans for implementation of the same technology at areas near the southeast corner of the C-400 Cleaning Building (Phase 2). To better understand the results of Phase 1 and the plans for Phase 2, DOE is soliciting the assistance of a team of experts with expertise in groundwater remediation and treatment, engineering, design, and treatment system installation and operation to review Phase 1 results and Phase 2 plans. II. SCOPE: The selected team of experts will receive electronically and review background materials concerning the C-400 electrical resistance heating implementation at the Paducah site. After reviewing background material, the team will travel to the Paducah Gaseous Diffusion Plant for a five-day visit, consisting of site tours, briefings, and discussions with the vendor and contractors implementing the electrical resistant heating system. The team is expected to help DOE identify issues that are affecting or could affect the successful implementation of both phases of the electrical resistance heating technology and provide cost-effective solutions and alternatives improving technology implementation. At the close of the site visit, the team will brief DOE and contractor staff on the results of their review. Subsequently, the team will provide a written report summarizing the outcome of the review of Phase 1 results and Phase 2 plans. This written report shall be of sufficient quality that it can serve as a technical assessment of the contractor’s progress of the electrical resistance heating treatment at the Paducah site. III. TIME AND COST ELEMENTS
1. Pre-visit document review (estimated 40 hours per team member) 2. Travel to and from the Paducah Gaseous Diffusion Plant 3. Site Visit (estimated 40 hours per team member) 4. Deliverable #1 – Briefing to DOE and contractor staff at the close-out of
the site visit (estimated 4 hours per team member) 5. Deliverable #2 – Draft written report provided for factual accuracy review
(10 to 15 pages maximum; estimated 60 hours per team member) 6. Deliverable #3 – Final written report (10 to 15 pages maximum; estimated
20 hours per team member)
B-47

SRNL-STI-2010-00176
37
IV. ESTIMATED SCHEDULE
Action/Deliverable Start Date Completion Date Contractor Acceptance of Statement of Work
N/A August 20, 2010
Pre-Visit Document Review August 25, 2010 September 8, 2010 Travel and Site Tour and Briefings
September 13, 2010 September 17, 2010
Deliverable #1 – Briefing to DOE and contractor staff
September 17, 2010 September 17, 2010
Deliverable #2 – Draft Report
September 20, 2010 October 4, 2010
Factual Accuracy Review October 4, 2010 October 7, 2010 Deliverable #3 – Final Report
October 8, 2010 October 15, 2010
Note: Based on current knowledge and assumptions, and subject to change by DOE Project Manager in consultation with review team. V. SELECTION CRITERIA
1. Demonstrated experience by the team members in groundwater remediation, engineering (construction) of groundwater treatment systems, and implementation of electrical resistance heating treatment.
2. Extensive experience reviewing operating projects, identifying problems, and providing workable recommendations.
3. Ability to meet schedule and price.
B-48

SRNL-STI-2010-00176
38
Appendix B ITR Team Members
Dr. Brian Looney (technical lead), Savannah River National Laboratory Dr. Joseph Rossabi, Redox-Tech, LLC
Dr. Lloyd (Bo) Stewart, Praxis Environmental, Inc. Short Curriculum Vitae Attached
B-49

SRNL-STI-2010-00176
39
Brian B. Looney Savannah River National Laboratory, Building 773-42A, Aiken SC
phone: (803) 725 3692 or (803) 725 2418 (work); (803) 648 7784 (home) fax: (803) 725 7673
email: [email protected] (work); [email protected] (home)
Summary Information Dr. Brian B. Looney is a senior fellow engineer at the Department of Energy Savannah River National Laboratory (SRNL) in Aiken SC and an adjunct professor in the Environmental Engineering Science Department at Clemson University. Dr. Looney coordinates development and deployment of innovative environmental characterization and clean-up methods at the Savannah River Site, and serves as a technical advisor supporting the DOE Environmental Management Program.
Education:
1984 Ph.D. Environmental Engineering, University of Minnesota 1978 B.S. Environmental Science, Texas Christian University
Selected Research Projects:
2005-2007 Interstate Regulatory and Technology Council (Technical Support to Enhanced Attenuation Team) 2003-2007 Monitored Natural Attenuation and Enhanced Attenuation of Chlorinated Organics (PI) 2003 Aqueous treatment of mercury using chemical reduction and air stripping (PI) 1992-1996 Development of gas phase phosphorus amendment for enhanced bioremediation (PI) 1989-1992 In situ enhanced cometaboloic treatment of TCE using natural gas (PI) 1987-1989 In situ air stripping using horizontal wells (PI) 1986 DOE pilot testing of soil vapor extraction (PI)
Patents: Brian holds nine patents related to environmental remediation and characterization. These include:
4,832,122 & 5,263,795 – various applications of horizontal wells for remediation 5,480,549 & 5,753,109 – various application of gas phase phosphorus to support bioremediation 5,293,931 & 5,339,694 – multilevel sampling system and groundwater flow probe 6,367,563 & 6,280,625 – DNAPL collection system and modified airlift recirculation with deep recharge
Selected Awards:
2006 Citizens for Nuclear Technology Awareness (CNTA) Fred C. Davison Distinguished Scientist of the Year 2005 – National Groundwater Association Technology Award 2004 – American Chemical Society (ACS) Industrial Innovation Award 2004 – World’s Best Technology Award 2000 – Energy 100 Award 1996 & 2000 – Federal Laboratory Consortium Award for Excellence in Technology Transfer 1996 – George Westinghouse Signature Gold Award 1994 & 1995 – R&D 100 Award
Selected Professional Affiliations: American Chemical Society, National Groundwater Association, American Society of Civil Engineers, Association of Applied Geochemists
B-50

SRNL-STI-2010-00176
40
Joseph Rossabi
Redox Tech, LLC 200 Quade Drive Cary, NC 27513
919-678-01407/Fax 919-678-0150 E-mail: [email protected]
Summary Information:
Joe Rossabi is principal scientist and part owner of Redox Tech, LLC where he applies innovative remediation solutions, including steam injection, chemical injection (for oxidation or reduction of contaminants), and metals stabilization, to soil and groundwater contamination. Prior to Redox Tech, he was a fellow engineer in the Environmental Sciences and Technology Division of the Department of Energy’s Savannah River National Laboratory where he performed applied research and development of environmental characterization and remediation technologies and strategies. His research involved field-testing and implementation of cone penetrometer-based characterization and remediation methods, multiphase flow processes including DNAPL fate and transport, and passive and renewable energy powered methods for characterization and remediation of subsurface contaminants. Licensed Professional Engineer, South Carolina, North Carolina
Education:
Ph.D., Environmental Engineering and Science, Clemson University, 1999. MS., Environmental Engineering, University of North Carolina, Chapel Hill, 1991. MS., Physics, State University of New York, Binghamton, 1985. BA., Physics, BA., Philosophy, State University of New York, Binghamton, 1982.
Relevant Experience
Partner: Redox Tech, LLC, Cary, North Carolina, 2004-Present. Chief of operations for soil and groundwater remediation firm specializing in in situ treatment. Redox Tech provides turnkey remediation services. Redox Tech has remediated more than 250 sites with contaminated soils and groundwater using both conventional and innovative technology strategies such as in situ oxidation and reduction with chemical and biological amendments (subsurface injection and blending), steam injection and other strategies. Fellow Engineer: Environmental Sciences and Technology Department, Savannah River National Laboratory, Westinghouse Savannah River Company, Aiken, South Carolina, 1991-2004. Research in the areas of subsurface flow, transport, characterization and remediation of contaminated sites. Development/field testing of innovative environmental characterization and monitoring technologies (particularly for DNAPL investigations and cone penetrometer tests). Research/implementation of barometric pumping for characterization, monitoring, and remediation. Teaching of characterization methods and DNAPL fate and transport. National technical review committees and assistance groups including Navy (Direct Push Wells), Paducah (Remedial technologies), Hanford (DNAPL technologies), Los Alamos (Passive Soil Vapor Extraction). Member of Technical Staff: AT&T Bell Laboratories; Quest Research Corporation, New Jersey, 1985-1990. Research in the areas of spectroscopic analysis of semiconductors, laser propagation/communications through the atmosphere, optical counter measures, and fiber optic spectroscopy techniques for chemical sensing.
B-51

SRNL-STI-2010-00176
41
Licensure, Selected Awards, Patents, Affiliations SRTC Laboratory Director’s Award (2003); Westinghouse Savannah River Company President’s Award (2003) George Westinghouse Signature Award of Excellence –3 (1994, 2001); Innovation Award (1997, 1993) Federal Laboratory Consortium Technology Transfer (1999); Government and Environmental Sciences Company Innovations Award (1998) B.G. Lamme Graduate Scholarship Award (1997) US 6,971,820 - Renewable energy powered, assisted barometric valve. US 5,641,245; CA 2,221,770; US 6,425,298; US 6,591,700 - Various applications for passive removal of subsurface contaminants. US 5,775,424; US 5,922,950 – Various applications of multiple depth discrete sampling ports for installation in a single well. US 5,889,217 - Cone penetrometer process and apparatus for obtaining samples of liquid and gas from soil at discrete depths. US 6,367,563 – Method and Device for removing a non aqueous phase liquid from groundwater. American Geophysical Union, National Groundwater Association, National Society of Professional Engineers, American Water Works Association, Duke University Cancer Protocol Committee
Selected Publications: Rossabi, J., B. D. Riha, J. W. Haas III, C. A. Eddy-Dilek, A. G. Lustig Kreeger, M. Carrabba, W. K. Hyde, and J. Bello 2000. Field tests of a DNAPL characterization system using cone penetrometer-based Raman spectroscopy, Ground Water Monitoring and Remediation, 20 (4), pp 72-81. Rossabi, J., R. W. Falta 2002. Analytical Solution For Subsurface Gas Flow To A Well Induced By Surface Pressure Fluctuations, Ground Water, 40 (1), pp 67-76. Rossabi, J., Analyzing Barometric Pumping to Characterize Subsurface Permeability, in Part 2: Measurement and Monitoring – Gas Transport in Porous Media, eds. C. K. Ho, S. W. Webb, pp 279-290, Springer, The Netherlands, 2006. Rossabi, J., Subsurface Flow Measurements, in Part 2: Measurement and Monitoring – Gas Transport in Porous Media, eds. C. K. Ho, S. W. Webb, pp 291-302, Springer, The Netherlands, 2006. Grimm, R.E., G.R. Olhoeft, K. McKinley, J. Rossabi, and B. D. Riha, Nonlinear Complex-Resistivity Survey for DNAPL at the Savannah River Site A-014 Outfall, Journal of Environmental and Engineering Geophysics,Vol 10 (4) pp. 351-364, 2005. Rossabi, J., B. D. Riha, C. A. Eddy-Dilek, B. B. Looney, and W. K. Hyde, 2003. Recent Advances in Characterization of Vadose Zone Dense Non-Aqueous Phase Liquids (DNAPL) in Heterogeneous Media, Environmental & Engineering Geoscience, 9 (1) pp. 25-36. Rossabi, J., T. R. Jarosch, B. D. Riha, B. B. Looney, D. G. Jackson, C. A. Eddy-Dilek, R. S. Van Pelt, and B. E. Pemberton, Determining contaminant distribution and migration by integrating data from multiple cone penetrometer-based tools, in Proceedings of First International Conference on Site Characterization, (ISC '98), Atlanta, GA, Balkema Press, 1998. Costanza, J., K.D. Pennell, J. Rossabi, and B. Riha. 2002. Effect of Temperature and Pressure on the MIP Sample Collection Process. In Proceedings of the Third International Conference, Remediation of Chlorinated and Recalcitrant Compounds, May 20-23, Monterey, CA. Kram, M. L., A. A. Keller, J. Rossabi, and L. G. Everett, 2001. DNAPL Characterization Methods and Approaches: Part 1: Performance Comparisons, Ground Water Monitoring and Remediation, 21 (4). Kram, M. L., A. A. Keller, J. Rossabi, and L. G. Everett, 2001. DNAPL Characterization Methods and Approaches: Part 2: Cost Comparisons, Ground Water Monitoring and Remediation, 22 (1). Rossabi, J., Barometric Pumping: Passive Soil Vapor Extraction, in Chapter 7: Remediation of Organic Chemicals in the Vadose Zone – Vadose Zone Science and Technology Solutions, eds. B. B. Looney, R. W. Falta, pp 970-979, Battelle Press, Columbus, OH, 2000. Rossabi, J., Cone Penetrometer and Direct Push Tools for Vadose Zone Characterization, in Chapter 3: Vadose Zone Characterization and Monitoring – Vadose Zone Science and Technology Solutions, eds. B. B. Looney, R. W. Falta , pp 186-201, Battelle Press, Columbus, OH, 2000.
B-52

SRNL-STI-2010-00176
42
Rossabi, J., Case Study of Cone Penetrometer (CPT)-Based Soil Moisture Probes, in Chapter 3: Vadose Zone Characterization and Monitoring – Vadose Zone Science and Technology Solutions, eds. B. B. Looney, R. W. Falta, pp 428-430, Battelle Press, Columbus, OH, 2000. Rossabi, J. and R. W. Falta, The behavior of volatile organic contaminants in the vadose zone with respect to barometric pumping and the estimate of residual mass and mass removal using T2VOC, in Proceedings of TOUGH Workshop '98, Lawrence Berkeley National Laboratory, CA, 1998. Rossabi, J., and B. D. Riha, The Savannah River environmental technology field test platform, in Proceedings of the Instrument Society of America, New Orleans, LA, 1995. Rossabi, J., B. B. Looney, C. A. Eddy-Dilek, B. D. Riha, and V. J. Rohay, Passive remediation of chlorinated volatile organic compounds using barometric pumping, in Proceedings of the Water Environment Federation: Innovative Solutions for Contaminated Site Management, Miami, FL, 1994. Rossabi, J., B. W. Jr. Colston, S. B. Brown, F. P. Milanovich, and L.T. Lee, In-situ, subsurface monitoring of vapor phase TCE using fiber optics, in Proceedings of the Third International Symposium-Field Screening Methods for Hazardous Waste and Toxic Chemicals, Las Vegas, Nevada, 1993. Rossabi, J., and J. S. Haselow, Technology status report: off-gas treatment technologies for chlorinated volatile organic compound air emissions. WSRC-RP-92 473, Westinghouse Savannah River Company, Aiken, SC 29808, 1992. Venugopalan, S., and J. Rossabi, Raman study of mesogenic transitions in 4,4'-di-n-pentyloxyazoxybenzene (C5)." J.Chem.Phys. 85(9), 1 November 1986.
B-53

SRNL-STI-2010-00176
43
Lloyd “Bo” Stewart Praxis Environmental Technologies, Inc., 1440 Rollins Road, Burlingame, CA
phone: (650) 224-3067 or (650) 548-9288 (work) fax: (650) 548-9287
email: [email protected]
Summary Information: Dr. Lloyd “Bo” Stewart is Vice President and Principal Engineer of Praxis Environmental Technologies, Inc., an applied R&D company he co-founded in 1992 to bring theoretical concepts into field practice. Dr. Stewart has developed, demonstrated and optimized numerous innovative environmental technologies for characterization and clean-up of chlorinated solvent and petroleum sites at DOD, DOE and industrial sites. Of particular relevance, Dr. Stewart, designed and managed all aspects of the first field demonstration of steam injection below the water table for the cleanup of dense nonaqueous phase liquids (DNAPLs).
Education: 1989 PhD. Mechanical Engineering, University of California Berkeley 1985 M.S. Mechanical Engineering, Georgia Institute of Technology 1983 B.S. Mechanical Engineering, North Carolina State University
Selected Projects:
2001-2006 Corrosion of Unexploded Ordnance in Soil Environments, Army Environmental Center (PI) 2003 Rebound Test Procedures and Data Evaluation in Support of Optimization and Closure of Soil Vapor Extraction Systems, Army Corps of Engineers (PI) 2000-2001 Development of Executable Program and Documentation for Public Domain Software to Evaluate Air Permeability Data Collected from Heterogeneous Vadose Zones, EPA (PI) 2000-2001 Theoretical and Experimental Evaluation of Techniques for Passive Maintenance of a Constant Temperature in a Narrow Annular Space Subjected to Transient Heat Loads, Applied Materials (PI) 1999-2001 Implementation and Evaluation of a Novel Approach for Dynamic Characterization and Remediation of Chlorinated Hydrocarbons in the Vadose Zone at Eight Sites on Castle AFB, CA (PI) 1999-2000 Comparison of Field Techniques for Evaluating Soil Permeability and Heterogeneities in the Vadose Zone, EPA (PI) 1998-2000 Field Demonstrations of Techniques for Evaluating and Optimizing Soil Vapor Extraction Systems at Castle, George, Mather, McClellan and Norton Air Force Bases, Air Force Center for Environmental Excellence (PI) 1997-2000 Field Demonstrations of Combined Characterization and Remediation in the Vadose Zone using Pneumatic Well Logging and Soil Vapor Extraction at Beale, Griffiss, and Nellis Air Force Bases, AFCEE (PI) 1997 Theoretical and Experimental Evaluation of Spray Cooling with Phase Change to Maintain a Constant Temperature on a Domed Surface Subjected to Transient Heat Loads, Applied Materials (PI) 1995-1997 Field Demonstration of Steam Injection as an Enhanced Source Removal Technology for Aquifer Restoration, Air Force Research Laboratory (PI) 1995-1996 Develop Public Domain Software and Documentation for Evaluating Potential Lead Migration Problems at Small Arms Ranges for distribution by the Army Environmental Center (PI) 1995 Develop a Generic Work Plan for Performing Remedial Technology Demonstrations at the National Test Sites, for use by Universities and other Researchers unfamiliar with Regulatory Requirements at Hazardous Waste Sites, Army Environmental Center (PI) 1995 Analyze and Model Field Data from a Test of Steam Injection in an Hydraulically Created Fracture, EPA (co-PI)
B-54
SRNL-STI-2010-00176
44
1994-1998 Field Demonstration of In Situ Thermally Enhanced Extraction for Restoration of Aquifers Contaminated By Dense Nonaqueous Phase Liquids (DNAPLs), Operable Unit Two, Hill Air Force Base, UT, AFRL (PI)
Patents:
5,018,576 – Process for the In Situ Remediation of Subsurface Contamination by Combined Steam Injection and Vacuum Extraction (with K. Udell, J. Hunt, and N. Sitar)
Selected Awards: Switzer Environmental Fellowship Tau Beta Pi Engineering Honor Society
Selected Professional Affiliations:
American Society of Mechanical Engineers, National Groundwater Association, Association of Ground Water Scientists and Engineers, American Institute of Chemical Engineers, American Association for the Advancement of Science
Journal Publications: L. Stewart and B. Packer, 2007. Corrosion rates of Carbon Steel, in Soil in Corrosion Science, accepted for publication June 2007. L. Stewart, 2006. Steady, axisymmetric airflow in a multi-layered vadose zone, under revision for Water Resources Research. M. Chendorain, L. Stewart and B. Packer, 2005. Corrosion of Unexploded Ordnance in Soil - Field Results, Environmental Science & Technology, Vol. 39(8), pp. 2442-2447. R.A. Hodges, R. Falta and l. Stewart, 2004. Controlling steam flood migration using air injection, Environmental Geosciences, Vol. 11, No. 4, pp. 221-238. L. Stewart, 2003. Overview of Rebound Test Procedures and Data Evaluation, included as Appendix F to the Army Corp of Engineer’s Soil Vapor Extraction and Bioventing Engineer’s Manual, Omaha, NE L. Stewart and K. Udell, 1988. Mechanisms of Residual Oil Displacement by Steam Injection, SPE Reservoir Engineering, Vol. 3, pp. 1233-1242, November 1988. Selected Conference Proceedings: “Field Demonstrations of Thermally Enhanced Extraction,” Proceedings, Abiotic In Situ Technologies for Groundwater Remediation Conference, August 31 – Sept 2, 1999, Dallas, TX, EPA/625/R-99/012, August 2000. "Field Demonstration of Thermally Enhanced Extraction for DNAPL Source Removal," with J. Ginn and S. Hicken, in Nonaqueous-Phase Liquids: Remediation of Chlorinated and Recalcitrant Compounds, Wickramanayake and Hinchee (Eds.), Battelle Press, Columbus, OH, 256 pp., 1998. "Combined Steam Injection and Vacuum Extraction for Aquifer Cleanup," with K.S. Udell, presented at the Annual Meeting of the International Association of Hydrogeologists, Calgary, April 1990. "The Effects of Gravity and Multiphase Flow on the Stability of Steam Condensation Fronts in Porous Media," with K.S. Udell, Multiphase Transport in Porous Media, ASME HTD Vol. 127, December 1989. "Mechanisms of In Situ Remediation of Soil and Groundwater Contamination by Combined Steam Injection and Vacuum Extraction," with K.S. Udell, Paper No. 119d presented at the Symposium on Thermal Treatment of Radioactive and Hazardous Waste at the AIChE Annual Meeting, San Francisco, November 1989. "The Effect of Gravity on Steam Propagation in Porous Media," with K.S. Udell and M.D. Basel, Multiphase Transport in Porous Media, ASME HTD Vol. 91, December, 1987.
B-55

SRNL-STI-2010-00176
45
Walter L. Richards Performance Results Corporation (PRC) – Paducah Site
phone: (270) 441-6839 fax: (270) 441-6801
email: [email protected]
Mr. Richards has over thirty years of engineering experience with Environmental and Chemical Engineering projects. He has been responsible for the management, assessment, design and construction of various chemical, industrial and environmental remediation projects. Some of these include chemical engineering projects, natural gas drilling, production and development projects, and environmental remediation projects in air water and wastewater treatment. Some of these projects include radionuclide capture and treatment in the component and process designs. He is a licensed Professional Chemical Engineer in the states of California, Florida and South Carolina. Mr. Richards has both a Master of Science in Engineering degree and Bachelor of Science in Engineering degree from Southern Illinois University in Carbondale, Illinois.
B-56

SRNL-STI-2010-00176
46
Appendix C Synopsis of Pre-Deployment Recommendations from the DOE Independent
Technical Review (Looney et al., 2007) and PGDP Resolutions
B-57

SRNL-STI-2010-00176
47
Review of Consolidated List of Recommendations The consolidated list of recommendations from the ITR report of August 2007 is presented below with an assessment of the response to the recommendations. The assessment of the response is provided in italicized red font. The list of consolidated recommendations provided a snapshot of the various recommendations in a single listing to assist PPPO and their contractors in implementing TCE source removal near the C-400 Building. While all of the recommendations were important, the 2007 ITR team considered the recommendations that are marked with a bold number to be critical. They noted that: “These should be adequately addressed and resolved prior to moving forward with the full scale implementation (for those recommendations with multiple subsidiary recommendations, all of the subsidiary recommendations are considered critical if the overarching number is bold).” Many of the critical recommendations were “Partially done” in implementing the Phase I implementation and a few were “Not done.” The poor heating performance in the high permeability RGA, one of the key lessons learned from Phase I, is tracable to the lack of adequate response to the critical recommendations from the 2007 ITR. Several of these critical topics (most importantly weaknesses in the modeling and simulation and cost control) have not been adequately addressed and, thus, have the continued potential to adversely impact discussions and decisions related to Phase II. Site investigation and target zone delineation 5.1.1 The ITR team determined that the target zone delineation should be modified based on data collected during system installation and based on key data from the 90%RDSI. The target zone was modified (but insufficient data were collected to adequately support the effort) --Partially done. 5.1.1a Collect soil and groundwater samples during the installation of the ERH boreholes with the specific goals of evaluating the MIP dataset and refining the treatment volume. Once the dataset is validated, then the treatment volume can be refined to address areas where TCE DNAPL may be present. This may involve an increase in the lateral and vertical extent of the thermal treatment volume in the Southeast source zone area, and possibly in the source zone area to the east. Although some soil samples were collected when installing the ERH boreholes, they were inadequate (too few samples with unrepresentative spacing) for evaluating the MIP data set and refining the treatment volume. This has led to serious challenges in refining and improving estimates of initial target TCE mass – Partially Done.
B-58

SRNL-STI-2010-00176
48
5.1.1b Increase the vertical extent of the thermal treatment volume in the Southwest source zone area into the low permeability McNairy. Data collection should be integrated into the installation with the contingency to expand both the treatment target zone (e.g., up to 15%) by adding electrodes either below or laterally, and the associated recovery systems. Some boreholes should be extended through the RGA to the McNairy interface in each treatment area. No electrodes were placed into the McNairy despite the strong recommendations of the ITR team. Electrodes were installed to the bottom of the RGA. - Partially done. 5.1.2 Install additional ground water monitoring wells (multiple depths and locations) to provide the basis for assessing the broader impacts of the Building C-400 remediation on the overall PGDP groundwater plume(s). Consider monitoring well clusters closer to the C-400 building on both the east side and northwest corner and multiple screened intervals (at least two screen intervals in the RGA and a screen in the UCRS). Several additional well clusters were installed. – Done. 5.1.3 Additional characterization beneath and to the north of the C-400 Building is needed to determine if the high concentrations that have been measured are due to the “known” upgradient sources or if substantive TCE DNAPL is beneath the footprint of the building. If substantive TCE DNAPL is identified beneath the building, then additional response actions to remove source may be needed to further mitigate contaminant mass transferred to the groundwater plume(s). Characterization and response actions will require coordination with Building C-400 activities and plans. This activity was deferred to the future – Not Done. 5.1.4 PGDP should assess the potential for co-contaminants by reviewing process records and analytical results and, if necessary, develop a conceptual model for their behavior during heating. The ITR team supports basing the remediation system design and operation, as well as the waste handling, primarily on the TCE DNAPL and the mass reduction. Trace levels of 99Tc were encountered in the condensed DNAPL but were determined to be below regulatory criteria for additional treatment. PCB analyses have been performed on some groundwater samples but not on the recovered DNAPL where it is most likely to occur in higher concentrations. – Partially Done. Performance objectives 5.2.1 The temperature criteria above the water table should be based on exceeding the boiling point of the TCE DNAPL. The temperature criteria below the water table should be based on the boiling point of water at the nominal local conditions (approximately 100oC at the water table, 125oC at a depth of 50 feet below the water table, etc). The criteria appeared to be set according to recommendations but were not met in the RGA –Done.
B-59

SRNL-STI-2010-00176
49
5.2.2 The operational monitoring and stopping criteria for this project should be technically based and developed to assure that performance objectives are met and that the system is operated efficiently. –Partially Done 5.2.2a Do not tie the shut down criteria to any particular vapor phase concentration (rather develop an integrated approach as described in 5.2.3b and 5.2.3c). The 400 ppmv criterion in the vapor phase was not changed but additional performance objectives were used to develop shut down criteria. –Partially Done. 5.2.2b Use asymptotic behavior as an indicator of the status of the C-400 source cleanup but use the “weight of evidence” of additional criteria to specify operational actions. Additional criteria could be mass removal rate, cost of removal comparison (i.e., $/lb daily continued operation ERH/SVE versus $/lb for P&T or cut off wall, or another potential future remedial action), mass of TCE remaining in the C-400 source area compared with the mass already in the plume or from other sources, or mass release rate from residual source balanced against separately measured attenuation rates within the downgradient plume. Some additional criteria were used but a comprehensive analysis of the benefit of continued operation in comparison with other methods was not performed. –Partially Done. 5.2.2c Identify and use site wide remedial goals to permit bounding calculations and a context for C-400 specific stopping criteria. A comprehensive analysis of the benefit of continued operation in the context of site wide goals was not performed. –Not Done. 5.2.3 Individual termination criteria should be developed for key target zones in the UCRS and RGA and applied to operations in each of the three treatment areas. –Partially Done 5.2.3a Individual termination criteria should be developed for the UCRS and RGA in each of the three treatment areas. –Not Done 5.2.3b Performance metrics should include groundwater concentrations and groundwater concentration trends/behaviors within the treatment area to indicate the extent of treatment that has been achieved and to aid in determining when the system should be shut down. We are awaiting the latest data but have not seen analyses of groundwater concentration trends. –Partially Done 5.2.3c The performance criteria for the ERH, the SVE and the water extraction should be decoupled (and necessary monitoring added to the system). Continued operation of the SVE system in the vadose zone should be considered even after the site cools if a cost-effective mass removal rate is achieved. Current plans call for continued operation of SVE and groundwater recovery and termination of power to electrodes. –Partially Done
B-60

SRNL-STI-2010-00176
50
5.2.4 Include vacuum and temperature monitoring around the treatment areas to aid in determining that hydraulic and pneumatic capture is being achieved and maintained during the remediation. Multilevel temperature and pressure monitoring devices were installed but there were insufficient locations to accurately assess heating extent. In contour plots of temperature, the temperature contributions of the electrode points are over-weighted and provide an unrealistic depiction of the extent of heating. –Partially Done 5.2.5 Measure effluent contaminant levels coming from the near surface areas that are being treated by SVE only separately from effluent vapors coming from the heated zone. –Not Done Project and design topics 5.3.1 The risk of full scale implementation should be mitigated by phasing or by assuring acceptable operational responsiveness and flexibility. Although the heating was broken into two phases, no electrodes were installed specifically in the McNairy so deep heating of that lower permeability zone was not tested . –Partially Done 5.3.2 The separate steam injection in the area of the ERH treatability study site should be eliminated from design. Steam heating was eliminated from the design for phase 1 but was incongruously suggested by the contractors for phase 2. –Done 5.3.2a The separate steam injection in the area of the ERH treatability study site should be eliminated from design. The team believes that the primary ERH grid should be expanded and that the former electrodes should be removed by overdrilling if necessary. –Done 5.3.2b If the steam injection well remains in the system, extraction wells for hydraulic and pneumatic control must be included around the entire injection well to avoid a redistribution of contaminants to outside of the treatment area. –N/A 5.3.3 The design modeling need to be revised and additional assurances provided that the heating objectives will be met. –Not Done 5.3.3a Revise design model and use the soil permeability values provided by the site geologist. Although a value of permeability from previous site documents was used, an appropriate range of permeability values (including high values suggested by the ITR) was not used. This led to poor heating performance in the RGA explicitly predicted by the ITR. –Not Done 5.3.3b Revise the model boundary conditions in the saturated zone and use a specified head boundary. –Not Done
B-61

SRNL-STI-2010-00176
51
5.3.3c Provide water and contaminant mass balances to assure that the model is conforming to the PGDP consensus conceptual model for the site. For uncertain inputs and issues such as heterogeneity, perform more sensitivity studies to help design sufficient flexibility in to the design and reduce project risks. Although water mass balances were performed, the model was not sufficiently revised to conform to the PGDP consensus conceptual model of the site. –Not Done 5.3.3d Revise the vadose zone boundary conditions to be more realistic (see also separate SVE issue). –Not Done 5.3.3e The detailed soil electrical conductivity data collected by the MIP during the RDSI should be used to ether confirm or refine the assumed values and perhaps to better incorporate heterogeneity (e.g., low electrical conductivity measured in samples from the lower RGA) into the model. We saw no evidence that the extensive electrical resistivity data set was used to either refine the operations or predict performance. However, the post test temperature and power data appear to conform to the electrical resistivity data collected with Geoprobe tool . –Not Done 5.3.3f Significant uncertainty remains related to the electrode spacing and design for this high permeability setting. Since the primary basis for documenting the design and the projected ability to reach temperature is the numerical modeling by the contractor team, the ITR team recommends that the contractor team stand behind the heating performance predictions (i.e., guarantee that temperature requirements will be met and make adjustments and modifications as necessary without additional cost to DOE). The uncertainty in the numerical modeling was not reduced, no performance guarantee was provided, and the contractor has provided the same unsuccessful basis (with a slight modification increasing groundwater flow to a value that may be too low) for phase 2 . –Not Done 5.3.4 The ITR team advocates a staged system startup and shut down. An insufficient time was allowed for SVE and groundwater extraction prior to powering the electrodes so an adequate baseline for extraction could not be determined . – Partially Done 5.3.4a Once the heating of the RGA has been initiated, every effort should be made to keep that system running until the remediation of the RGA is complete. Although there were some problems with equipment, it appears that efforts were made maintain system operations until shutoff was determined. The remediation of the RGA was not complete, however. – Partially Done 5.3.5 The system should be designed with sufficient flexibility to respond to field conditions. – Partially Done 5.3.5a Final placement of electrodes and other infrastructure should be based on field measurements (e.g. of lithological contacts at the installation location) rather than on predetermined depths on drawings. We saw minimal efforts to adapt electrode and sensor emplacement to field observations. – Partially Done
B-62

SRNL-STI-2010-00176
52
5.3.5b Add electrodes to address target TCE DNAPL contamination that is beyond the current design boundaries. Additional electrodes were installed but since additional characterization (both to calibrate MIP data and to refine contaminant extent) was not adequately performed, targeting of heating to the extent of TCE DNAPL could not be determined. – Partially Done 5.3.6 The basis for the SVE design should be improved and documented. We saw no substantive efforts to improve and document the SVE design. – Not Done 5.3.6a Perform a combined SVE pilot test (e.g., 48 hours) and air permeability test to allow proper design of a vapor extraction and treatment system. – Not Done 5.3.6b Design for operation of the SVE system in the vadose zone for the periods both before and after the operation of the ERH system in the deeper soils and groundwater. SVE operation was not sufficiently performed before ERH but will be continued after ERH. – Partially Done 5.3.7 Develop a detailed monitoring plan that is linked to the performance metrics. This plan should describe what media are to be sampled, where the samples will be collected and how the samples will be used to assess performance. The location and deign of the sampling ports and access points should be specified in the design and construction documents. Information that was provided contained minimal information on how the collected data would provide a compelling assessment of performance. As a result, the assessment of the performance of Phase I may be subject to ambiguity and controversy. – Partially Done 5.3.8 Modify the design and implementation, as appropriate, based on the ITR team observations. We saw little evidence that the most relevant observations of the ITR team were incorporated into a modified design and implementation (e.g. related to heating the deep portion of the RGA). – Not Done 5.3.9 Expand and improve contingencies by considering a broader array of technologies and responses. During this process, encourage the engineers, regulators and managers involved to develop diverse and creative options. Consider the ITR team observations and suggestions in developing the expanded contingencies. Additional contingencies were developed as a part of the O&M Plan and the RAWP – note that the contingencies lacked the diversity recommended in the initial ITR report and many of these consisted of increasing power. – Partially Done
B-63

SRNL-STI-2010-00176
53
Health and safety 5.4.1 Trained ERH personnel with significant experience should be onsite to install electrodes and infrastructure (construction), and to oversee operations throughout the duration of the project. Contractor personnel have not been onsite to oversee operations throughout the duration of the project. – Partially Done 5.4.2 Monitor 99Tc and incorporate contingencies in the equipment operations and waste handling. Although monitoring of the 99TC was performed, no contingencies in operation were developed prior to operation. – Partially Done 5.4.3 Monitor for radon and other hydrophobic contaminants that might be present and incorporate contingencies in the equipment operations and waste handling, if necessary. 99Tc was measured in the groundwater and DNAPL. PCBs were measured in groundwater but not in DNAPL. Radon was not monitored. – Partially Done 5.4.4 Develop documentation and descriptions of process system interlocks and a more complete evaluation of failure scenarios (i.e., how systems and components interact in a variety of failure modes). This was provided in the O&M Plans and RAWP. –Done Cost, contracting, and cross cutting 5.5.1 Further refine and reduce costs, where possible, as design is finalized. The ITR team determined that the estimated cost for ERH thermal treatment at the C-400 Building is within the range of thermal treatment costs at other federal sites on a per treatment volume and per electrode basis. Nonetheless, the cost is near the upper end of the historical range and further cost refinement and cost reduction opportunities should be pursued as the project plans are finalized. Current costs for this project significantly above initial estimates and all other heating projects to date. While some of the specific recommended actions were implemented (e.g., getting drilling costs closer to industry norms) other aspects of the work were allowed to expand (i.e., further cost reduction opportunities were not vigorously pursued) – Not Done 5.5.1a The costs for waste management and disposition are a significant fraction of the overall estimated project costs. With a treatment and disposal cost on the order of $1,000 per 55-gallon drum of solid waste, the importance of properly labeling, tracking, and categorizing each of the anticipated 1,400 drums should be a priority. Because the recovery of DNAPL and other waste has been significantly less than anticipated, this has not been a major issue. –Done
B-64
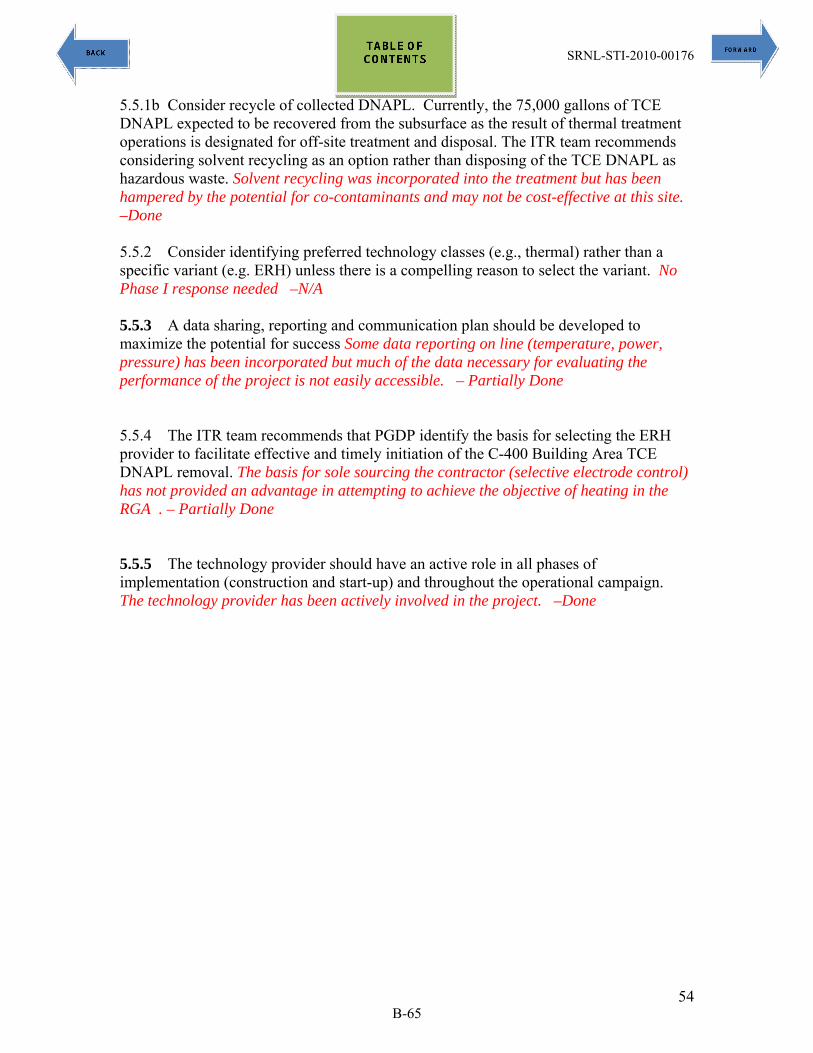
SRNL-STI-2010-00176
54
5.5.1b Consider recycle of collected DNAPL. Currently, the 75,000 gallons of TCE DNAPL expected to be recovered from the subsurface as the result of thermal treatment operations is designated for off-site treatment and disposal. The ITR team recommends considering solvent recycling as an option rather than disposing of the TCE DNAPL as hazardous waste. Solvent recycling was incorporated into the treatment but has been hampered by the potential for co-contaminants and may not be cost-effective at this site. –Done 5.5.2 Consider identifying preferred technology classes (e.g., thermal) rather than a specific variant (e.g. ERH) unless there is a compelling reason to select the variant. No Phase I response needed –N/A 5.5.3 A data sharing, reporting and communication plan should be developed to maximize the potential for success Some data reporting on line (temperature, power, pressure) has been incorporated but much of the data necessary for evaluating the performance of the project is not easily accessible. – Partially Done 5.5.4 The ITR team recommends that PGDP identify the basis for selecting the ERH provider to facilitate effective and timely initiation of the C-400 Building Area TCE DNAPL removal. The basis for sole sourcing the contractor (selective electrode control) has not provided an advantage in attempting to achieve the objective of heating in the RGA . – Partially Done 5.5.5 The technology provider should have an active role in all phases of implementation (construction and start-up) and throughout the operational campaign. The technology provider has been actively involved in the project. –Done
B-65

THIS PAGE INTENTIONALLY LEFT BLANK

APPENDIX C
TEMPERATURE DATA PLOTS FOR ALL DIGITAM™ LOCATIONS

THIS PAGE INTENTIONALLY LEFT BLANK

C-3
APPENDIX C
TEMPERATURE DATA PLOTS FOR ALL DIGITAM™ LOCATIONS (CD)

THIS PAGE INTENTIONALLY LEFT BLANK