technical report and resource estimate on …€¦ · technical report and resource estimate on the...
TRANSCRIPT

TECHNICAL REPORT AND
RESOURCE ESTIMATE ON THE
GLOVER ISLAND GOLD PROPERTY,
GRAND LAKE AREA
WEST-CENTRAL NEWFOUNDLAND, CANADA
Latitude: 48° 42' 32" N
Longitude: 57° 49' 45" W
FOR
Mountain Lake Resources Inc.
By
P&E Mining Consultants Inc.
NI-43-101 & 43-101F1
TECHNICAL REPORT
Dr. Wayne Ewert, P.Geo.
Mr. Eugene Puritch, P.Eng.
Report No. 244
Effective Date: May 01, 2012
Signing Date: May 29, 2012

TABLE OF CONTENTS
1.0 SUMMARY .........................................................................................................................1
2.0 INTRODUCTION ...............................................................................................................3 2.1 TERMS OF REFERENCE ......................................................................................3 2.2 SITE VISITS ............................................................................................................3 2.3 UNITS AND CURRENCY .....................................................................................3 2.4 SOURCES OF INFORMATION ............................................................................4
2.5 GLOSSARY OF TERMS ........................................................................................4 3.0 RELIANCE ON OTHER EXPERTS ..................................................................................7 4.0 PROPERTY DESCRIPTION AND LOCATION ...............................................................8
4.1 LOCATION .............................................................................................................8 4.2 LICENCE DETAILS ...............................................................................................9
4.3 MINERAL RIGHTS, LAND USE STATUS AND PERMITS ............................10 4.4 INTEREST IN THE PROPERTY .........................................................................11
4.5 ENVIRONMENTAL LIABILITIES .....................................................................11 5.0 ACCESSIBILITY, CLIMATE, LOCAL RESOURCES, INFRASTRUCTURE .............12
5.1 ACCESSIBILITY AND LOCAL RESOURCES ..................................................12 5.2 CLIMATE AND PHYSIOGRAPHY ....................................................................13
5.3 INFRASTRUCTURE ............................................................................................13 6.0 HISTORY AND PREVIOUS EXPLORATION ...............................................................15
6.1 GLOVER ISLAND EXPLORATION GENERAL ...............................................15 6.2 HISTORY OF GOLD EXPLORATION ...............................................................15 6.3 QUANTITY AND QUALITY OF HISTORIC DATA .........................................16
7.0 GEOLOGICAL SETTING AND MINERALIZATION ...................................................18 7.1 REGIONAL GEOLOGICAL SETTING ...............................................................18
7.2 GEOLOGY OF NEWFOUNDLAND ...................................................................18
7.3 GEOLOGY OF GLOVER ISLAND .....................................................................21
7.4 STRUCTURE ........................................................................................................24 7.5 MINERALIZATION .............................................................................................29
7.6 KETTLE POND HOSTED ....................................................................................29 7.7 TUCKAMORE HOSTED .....................................................................................31 7.8 BASE METAL PROSPECTS................................................................................35
8.0 DEPOSIT TYPES ..............................................................................................................36 9.0 EXPLORATION................................................................................................................37 10.0 DRILLING .........................................................................................................................38
10.1 PROCEDURES AND SURVEYS .........................................................................38
10.2 HISTORICAL DRILL HOLES .............................................................................38 10.3 MOUNTAIN LAKE DRILL HOLES ...................................................................40 10.4 SPECIFIC GRAVITY ...........................................................................................41
10.5 SIGNIFICANT RESULTS ....................................................................................45 11.0 SAMPLE PREPARATION, ANALYSES AND SECURITY ..........................................48 12.0 DATA VERIFICATIONS .................................................................................................49
12.1 SITE VISIT AND INDEPENDENT SAMPLING ................................................49
12.2 MOUNTAIN LAKE QUALITY ASSURANCE/QUALITY CONTROL
REVIEW ................................................................................................................50 12.3 PERFORMANCE OF CERTIFIED REFERENCE MATERIALS .......................50
12.4 PERFORMANCE OF DUPLICATES ..................................................................50 12.5 PERFORMANCE OF BLANK MATERIAL .......................................................50
13.0 MINERAL PROCESSING AND METALLURGICAL TESTING .................................51
14.0 2012 RESOURCE ESTIMATE .........................................................................................52
14.1 INTRODUCTION .................................................................................................52
14.2 DATABASE ..........................................................................................................52
14.3 DATA VERIFICATION .......................................................................................52 14.4 DOMAIN INTERPRETATION ............................................................................52 14.5 ROCK CODE DETERMINATION ......................................................................53 14.6 COMPOSITES .......................................................................................................53 14.7 GRADE CAPPING ................................................................................................53
14.8 VARIOGRAPHY ..................................................................................................54 14.9 BULK DENSITY...................................................................................................54 14.10 BLOCK MODELING ............................................................................................54 14.11 RESOURCE CLASSIFICATION .........................................................................55 14.12 RESOURCE ESTIMATE ......................................................................................55
14.13 CONFIRMATION OF ESTIMATE ......................................................................56 15.0 MINERAL RESERVE ESTIMATES................................................................................58
16.0 MINING METHODS ........................................................................................................59 17.0 RECOVERY METHODS ..................................................................................................60 18.0 PROJECT INFRASTRUCTURE ......................................................................................61 19.0 MARKET STUDIES AND CONTRACTS .......................................................................62
20.0 ENVIRONMENTAL STUDIES, PERMITTING AND SOCIAL OR COMMUNITY
IMPACT ............................................................................................................................63
21.0 CAPITAL AND OPERATING COSTS ............................................................................64 22.0 ECONOMIC ANALYSIS .................................................................................................65 23.0 ADJACENT PROPERTIES ..............................................................................................66
24.0 OTHER RELEVANT DATA AND INFORMATION .....................................................67 25.0 INTERPRETATION AND CONCLUSIONS ...................................................................68
25.1 DRILL PROGRAMS .............................................................................................68
25.2 MINERAL RESOURCE ESTIMATION ..............................................................68
26.0 RECOMMENDATIONS ...................................................................................................71 26.1 GEOLOGY AND RESOURCES ..........................................................................71
26.2 LUNCH POND SOUTH EXTENSION ................................................................71 26.3 ADJACENT PROSPECTS ....................................................................................71 26.4 BUDGET ...............................................................................................................71
27.0 REFERENCES ..................................................................................................................73 28.0 CERTIFICATES ................................................................................................................79 APPENDIX I. DRILL HOLE PLAN .................................................................................81 APPENDIX II. 3D DOMAINS ...........................................................................................83
APPENDIX III. LOG NORMAL HISTOGRAMS ..............................................................85 APPENDIX IV. VARIOGRAMS .........................................................................................91 APPENDIX V. AU BLOCK MODEL CROSS SECTIONS AND PLANS .......................93
APPENDIX VI. CLASSIFICATION BLOCK MODEL CROSS SECTIONS AND
PLANS ...................................................................................................101 APPENDIX VII. OPTIMIZED PIT SHELL........................................................................109

LIST OF TABLES
Table 1.1 Global Resource Sensitivity .................................................................................... 1
Table 1.2 Budget for Proposed Program ................................................................................. 2 Table 4.1 Licenses and Lease ................................................................................................ 10 Table 10.1 Historical Drill Holes ............................................................................................ 39 Table 10.2 Mountain Lake Drill Holes for 2011 and 2012 ..................................................... 40 Table 10.3 Specific Gravity Data ............................................................................................ 42
Table 10.4 Summary of Mountain Lake Drill results reported in news releases,
2011 and 2012 ....................................................................................................... 45 Table 14.1 Au Grade Capping Values ..................................................................................... 54 Table 14.2 Au Block Model Interpolation Parameters ............................................................ 55 Table 14.3 In Pit Resource Estimate
(1)(2)(3) ............................................................................. 56
Table 14.4 In Pit Resource Estimate Cut-Off Sensitivity ....................................................... 56 Table 14.5 Global Sensitivity To Resource Estimate .............................................................. 56
Table 14.6 Comparison of Capped Weighted Average Grade of Assays and
Composites with Total Block Model Average Grades .......................................... 57 Table 25.1 Global Mineralized Inventory LPSE In-Pit Resource Estimate ............................ 69 Table 26.1 Budget for Proposed Program ............................................................................... 72

LIST OF FIGURES
Figure 4.1 General Location Map ............................................................................................ 8
Figure 4.2 NTS Sheet Location with Place Names .................................................................. 9 Figure 4.3 Glover Island Claim Map...................................................................................... 10 Figure 5.1 1:50,000 Topographical Map showing Barge Route ............................................ 12 Figure 5.2 Mountain Lake Camp on Kettle Pond .................................................................. 14 Figure 7.1 Canadian Appalachian Mountains ........................................................................ 18
Figure 7.2 Tectonic Architecture of Newfoundland .............................................................. 19 Figure 7.3 Tectonostratigraphic Subdivisions of Newfoundland ........................................... 20 Figure 7.4 LPSE Cross Section .............................................................................................. 22 Figure 7.5 General Geology of Glover Island ........................................................................ 23 Figure 7.6 F2 Folds – Note Interference on Fold Limb ......................................................... 25
Figure 7.7 F2 Folds in Tuckamore Formation ....................................................................... 26 Figure 7.8 Geology and Mineral Prospects of Central Glover Island .................................... 27
Figure 7.9 Tight Chevron Folds ............................................................................................. 28 Figure 7.10 Discovery Vein showing highly irregular outcrop pattern ................................... 29 Figure 7.11 Large Pyrite Aggregate in Lunch Pond Vein ........................................................ 30 Figure 7.12 Lunch Pond North Vein ........................................................................................ 31
Figure 7.13 Silicified and brecciated auriferous LPSE Zone ................................................... 32 Figure 7.14 Polished thin section of gold in pyrite (x20 magnification) ................................. 33
Figure 10.1 Distribution of Historical and Mountain Lake Drill Holes ................................... 39 Figure 12.1 Glover Island Deposit Site Visit Sample Results for Gold ................................... 49

P&E Mining Consultants Inc. Page 1 of 110
Mountain Lake Resources Inc. Glover Island Gold Property Report No. 244
1.0 SUMMARY
P & E Mining Consultants Inc. (P&E) has been retained by Mountain Lake Resources Inc.
(Mountain Lake or the Company) to provide a mineral resource estimate for the Lunch Pond
South Extension (LPSE) deposit on Glover Island, and to prepare an independent Technical
Report in accordance with the reporting requirements of Canadian National Instrument 43-101
(NI 43-101). The property is located in western Newfoundland.
This resource estimation is based on 41 diamond drill holes by Mountain Lake and 35 historical
holes for a combined total of 76 holes. The Company drilled a total of 10,139 meters while
historical drilling at LPSE totalled 5,312 meters. The total combined meters drilled at LPSE is
15,452 meters. The total number of core sample analyses used in this resource estimation totals
6,598 (5,156 from Mountain Lake and 1,442 from historical data).
The LPSE deposit is located at the south-western portion of an 11 km long mineralized corridor
known as the Glover Island Trend (GI Trend). This prospective GI Trend is host to 17 gold, base
metal, nickel and polymetallic minerals prospects in addition to numerous gold anomalies that
cross several rock types adjacent to a major structural break known as the Cabot Fault which
separates the Humber Zone terrain to the west from the Dunnage Zone to the east. Remnant
slivers of the Humber Zone are recognized on Glover Island in addition to Dunnage Zone
lithofacies.
The Glover Island property is owned 100% by Mountain Lake. On October 8, 2010, the
Company acquired an undivided 100% interest in the Glover Island Property from New Island
Resources. The Glover Island Property is a gold exploration property situated approximately
70 kilometres northwest from the Company’s Valentine Lake gold project and consists of two
mineral licenses and one mining lease covering a total of 5,100 hectares.
New Island retains a net smelter returns royalty of 1% of commercial production, which reduces
to 0.5% after the payment of the first $1.0 million.
The 2012 Lunch Pond global resource sensitivity compared with the combined historical
resources for the Lunch Pond area indicates a 27.8% decrease in grade, a 57.4% increase in
tonnage resulting in a 14.1% increase in contained gold ounces as detailed in Table 1.1.
TABLE 1.1
GLOBAL RESOURCE SENSITIVITY
Lunch Pond Global Resource Sensitivity
2012(1)
(0.5 g/t Au Cut-Off)
Historical Resource(2)
Tonnes Grade
(g/t)
Ounces
(Au) Tonnes
Grade
(g/t)
Ounces
(Au)
Indicated 1,281,000 1.61 66,400 LP Main
Zone 2,730,000 2.10 184,300
Inferred 4,434,000 1.38 196,900 LP West
Zone 900,000 1.60 46,300
(1) Mineral Resources are not mineral Reserves and do not have demonstrated economic viability. There is no
certainty that all or any part of the mineral Resource will be converted into mineral Reserves.
(2) The reader is cautioned that the above referenced “Historical Resource” is considered historical in nature
and as such is based on prior data and reports prepared by previous property owners. The work necessary to

P&E Mining Consultants Inc. Page 2 of 110
Mountain Lake Resources Inc. Glover Island Gold Property Report No. 244
verify the classification of this mineral resources estimate has not been completed and the resource estimate
therefore, cannot be treated as NI 43-101 compliant resources verified by a Qualified Person. The historical
estimate should not be relied upon and there can be no assurance that any of the historical resources, in
whole or in part, will ever become economically viable.
The ~50 meter spaced drilling by Mountain Lake in 2011 and 2012 confirmed the general
geometry of the LPSE zone and expended the limits for the resource down dip and markedly
increased the size and understanding of the historical resource. The silicified and brecciated
nature of the mineralization is remarkably consistent across the extent of the zone. In addition,
this work delineated the nature of the faulted hanging wall into un-mineralized Glover
Formation, broad scale carbonate alteration and the presence of a potentially significant quartz-
feldspar-porphyry (QFP) or crystal tuff along the southern footwall.
For the immediate future, P&E recommends further work be focused on follow-up activities of
other prospects on Glover Island with the intent of adding additional resources to the current
resource estimation, notably Kettle Pond and Lucky Smoke Zones.
The proposed budget for the upcoming work program amounts to CAN$528,000 and is presented
in Table 1.2.
TABLE 1.2
BUDGET FOR PROPOSED PROGRAM
Item Cost (Cdn$)
Environmental Studies 5,000
Diamond Drilling 240,000
Assays 30,000
Labour 80,000
Helicopter 55,000
Camp and trail 18,000
Exploration 100,000
Total 528,000
P&E considers that the budget for the proposed work program is reasonable and recommends
that it is implemented by Mountain Lake.

P&E Mining Consultants Inc. Page 3 of 110
Mountain Lake Resources Inc. Glover Island Gold Property Report No. 244
2.0 INTRODUCTION
2.1 TERMS OF REFERENCE
The following Technical Report (the “Report”) presents the resource estimate prepared by P&E
Mining Consultants Inc. (“P&E”) regarding the Glover Island Gold Property in west-central
Newfoundland, Canada (the “Property”). This Technical Report was prepared pursuant to the
requirements of Canadian National Instrument (“NI”) 43-101. The Mineral Resources contained
within this report were prepared in accordance with the guidelines of the Canadian Institute of
Mining, Metallurgy and Petroleum (“CIM”) Standards on Mineral Resources and Reserves,
Definitions and Guidelines prepared by the CIM Standing Committee on Reserve Definitions
and in force as of the effective date of this report.
This Report was prepared at the request of Mr. Allen Sheito President and CEO of Mountain
Lake Resources Inc., (the “Company” or “Mountain Lake”). Mountain Lake is a Canadian based
publicly held company trading on the TSX-V under the symbol MOA with its corporate office
at:
Purdy’s Wharf, Tower 1
1700-1959 Upper Water Street
Halifax, NS, B3J 3N2
Tel.: 604.839.6946
Email: [email protected]
www.mountain-lake.com
This Report is current as of May 01, 2012.
The purpose of the current Report is to provide an independent, NI 43-101 compliant, technical
report that includes a mineral resource on the Glover Island Gold Property. P&E understands that
this Report will support the public disclosure requirements of the Company and will be filed on
SEDAR as required under NI 43-101 disclosure regulations.
Mountain Lake has accepted that the qualifications, expertise, experience, competence and
professional reputation of P&E’s Principals and Associate Geologists and Engineers are
appropriate and relevant for the preparation of this Report. The Company has also accepted that
P&E’s Principals are members of professional bodies that are appropriate and relevant for the
preparation of this Report.
2.2 SITE VISITS
Mr. Eugene Puritch, P.Eng., of P&E, a qualified person under the terms of the NI 43-101, who
has provided specific input to this Report, has carried out a site visit to the Property on
November 14-15, 2011. An independent verification sampling program was conducted at that
time.
2.3 UNITS AND CURRENCY
Metal values are reported in percentage (“%”), grams per metric tonne (“g/t”) and parts per
billion (“ppb”). Costs are reported in Canadian dollars (“CDN$”) unless otherwise stated.

P&E Mining Consultants Inc. Page 4 of 110
Mountain Lake Resources Inc. Glover Island Gold Property Report No. 244
Grid coordinates are given in the UTM NAD 83 (Zone 14), latitude/longitude system or local
mine grid; maps are either in UTM coordinate, latitude/longitude or local mine grid.
2.4 SOURCES OF INFORMATION
This Report is based, in part, on internal company technical reports, and maps, published
government reports, company letters and memoranda, and public information as listed in Section
27 at the conclusion of this Report. Several sections from reports authored by other consultants
have been directly quoted or summarized in this Report, and are so indicated where appropriate.
2.5 GLOSSARY OF TERMS
Abbreviation Description
$ Canadian Dollars
° Degree(s)
°C Degrees Celsius
< Less than
> Greater than
% Percent
2791341 2791341 Manitoba Ltd.
3-D Three dimensional
AA Atomic absorption (spectrometry)
Ag Silver
Au Gold
AuEq Gold equivalent
Az Azimuth
CIM Canadian Institute of Mining, Metallurgy and Petroleum
CIP Carbon-in-pulp (process)
cm Centimetre
CND Canadian
CND$ Canadian dollar
Cr Chromium
D1/D2 Deformation phase 1/phase 2
DD Diamond drill
DDH Diamond drill hole
DNR Department of Natural Resources Newfoundland and
Labrador E East
EM Electromagnetic
FA Fire assay
FA/Grav Fire assay with a gravimetric finish
Ft Foot/feet

P&E Mining Consultants Inc. Page 5 of 110
Mountain Lake Resources Inc. Glover Island Gold Property Report No. 244
Abbreviation Description
g Gram (s)
g Ag/t Grams silver per tonne
g Au/t Grams gold per tonne
g/t grams per tonne
g/cm3 Grams per cubic centimetre
g/mL Grams per mililitre
ha Hectares
HLEM Horizontal loop electromagnetic (geophysics)
ICP Inductively coupled plasma
ID2 Inverse distance squared
in Inches
IP Induced polarization
kg kilograms
km Kilometres
km2 Squared kilometres
L Litres
LPSE Lunch Pond South Extension
m Metres
m3 Cubic metres
m/s Metres per second
Ma Million years (old)
Mg Magnesium
mm Millimetres
Mm/y Millimetres per year
Mt Million tonnes
N North
Ni Nickel
NE Northeast
NI National Instrument (43-101)
NSR Net Smelter Return
NSZ North Shear Zone
NW Northwest
oz Ounce
P&E P&E Mining Consultants Inc.
Pb Lead
PEA Preliminary economic assessment
ppb Parts per billion
ppm Parts per million
QA Quality assurance

P&E Mining Consultants Inc. Page 6 of 110
Mountain Lake Resources Inc. Glover Island Gold Property Report No. 244
Abbreviation Description
QC Quality control
S Southeast
SE Southeast
SEDAR System for Electronic Document Analysis and Retrieval
SW Southwest
t Tonnes (metric)
t/m3 Tonnes per cubic metre
tpd Tonnes per day
US$ United States dollars
UTM Universal Transverse Mercator
VLM-EM Very low frequency electromagnetic survey (geophysics)
W West

P&E Mining Consultants Inc. Page 7 of 110
Mountain Lake Resources Inc. Glover Island Gold Property Report No. 244
3.0 RELIANCE ON OTHER EXPERTS
P&E has assumed, and relied on the fact, that all the information and existing technical
documents listed in the References (Section 27) of this report are accurate and complete in all
material aspects. While we carefully reviewed all the available information presented to us, we
cannot guarantee its accuracy and completeness. We reserve the right, but will not be obligated
to revise our report and conclusions if additional information becomes known to us subsequent to
the date of this report.
Copies of the tenure documents were reviewed by P&E and an independent but cursory
verification of claim title was performed using the Mineral Rights Inquiry form found on the
Newfoundland and Labrador Department of Natural Resources’ website
(http://gis.gov.nl.ca/mrinquiry/mrinquiry.asp). Operating permits and licenses, and work
contracts were not reviewed. P&E has not verified the legality of any underlying agreement(s)
that may exist concerning the licenses or other agreement(s) between third parties but has relied
on the and believes it has a reasonable basis to rely upon Paul Bowes - Secretary & Corporate
Lawyer, Director to have conducted the proper legal due diligence in this regard.
Select technical data, as noted in the report, were provided by Mountain Lake, and P&E has
relied on the integrity of such data.
A draft copy of the report has been reviewed for factual errors by the clients and P&E has relied
on Mountain Lake’s knowledge of the Property in this regard. All statements and opinions
expressed in this document are given in good faith and in the belief that such statements and
opinions are not false and misleading at the date of this report.
P&E Mining Consultants Inc. Page 8 of 110
Mountain Lake Resources Inc. Glover Island Gold Property Report No. 244
4.0 PROPERTY DESCRIPTION AND LOCATION
4.1 LOCATION
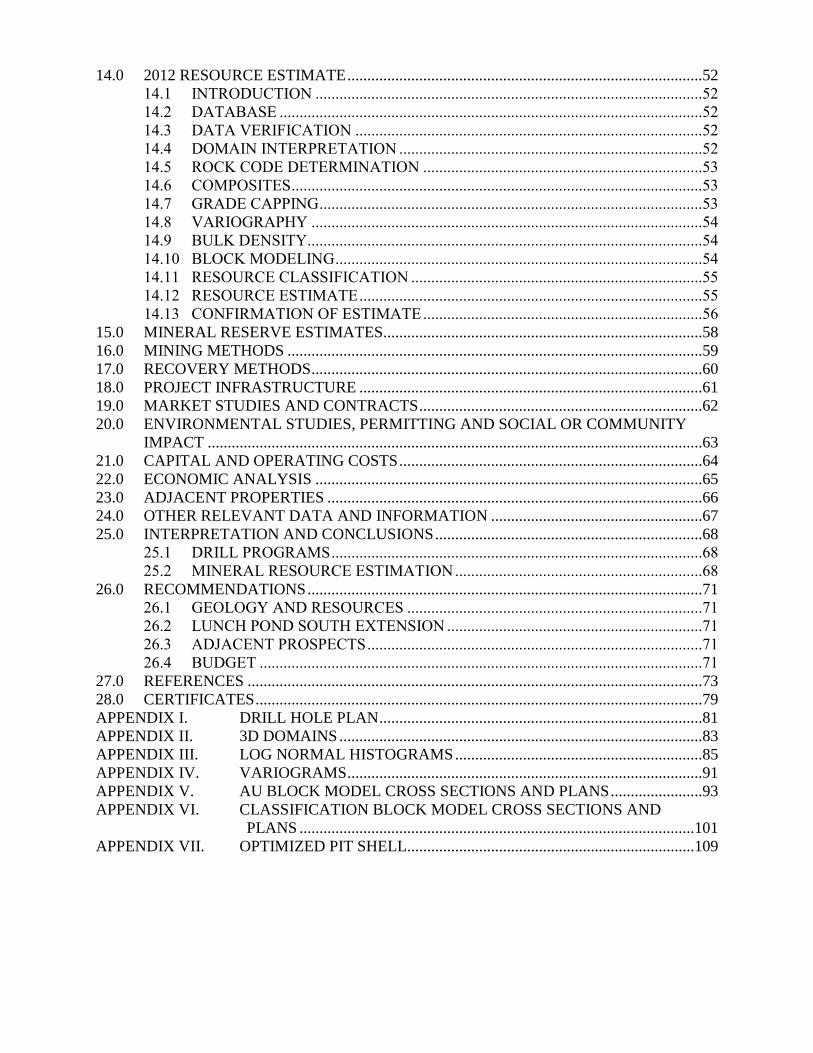
Figure 4.1 General Location Map
The Glover Island Property is located in west-central Newfoundland (Figure 4.1), approximately
30 kilometres southeast from the city of Corner Brook (NTS 12A/12 & 12A/13, Figure 4.2).
Glover Island itself is situated towards the south end of Grand Lake, the largest lake in
Newfoundland. The island is elongated, northeast-southwest trending, 39 kilometres long by an
average of 5 kilometres wide. Grand Lake is 135 kilometres long and forms the major watershed
for the west-flowing Humber River. The south half and west side of the island rises 200-442
metres from the lake level along steep cliffs to form a plateau with moderate to gentle
topography. The north and northeast shoreline is low-lying with common pebble beaches.
Vegetation on Glover Island is dominated by mature fir with sparse birch trees and spruce forest
on hummocky bedrock ridges and boggy terrain. Numerous bog areas are covered with grass and
several varieties of low bush and commonly have small shallow ponds.

P&E Mining Consultants Inc. Page 9 of 110
Mountain Lake Resources Inc. Glover Island Gold Property Report No. 244
Figure 4.2 NTS Sheet Location with Place Names
4.2 LICENCE DETAILS
The Glover Island Property comprises two exploration licences and one mining lease covering a
13-kilometre by 5-kilometre area on the south end of Glover Island (Figure 4.3, Table 4.1). On
October 8, 2010 the Company acquired an undivided 100% interest in the Glover Island Property
from New Island Minerals. The reader is referred to filings on SEDAR for specific details of the
transaction.

P&E Mining Consultants Inc. Page 10 of 110
Mountain Lake Resources Inc. Glover Island Gold Property Report No. 244
Figure 4.3 Glover Island Claim Map
TABLE 4.1
LICENSES AND LEASE
Licence Number of
Claims
Area
(ha)
Renewal
Date
Report
Date
Expenditures
Required ($)
007584M 102 2,550 21/07/2015 19/09/2012 44,603.29
015583M 25 625 04/12/2013 04/02/2013 7,523.00
7588M 77 1,925 05/20/2012
154,000
Total 204 5,100
Although Lease 7588M has expired, Mountain Lake have filed an application to extend the
license with the DNR. DNR personnel have confirmed that Lease 7588M is in good standing.
Licence descriptions are available via the Mineral Rights Database System Reports,
Newfoundland and Labrador Department of Mines and Energy website
(http://gis.geosurv.gov.nl.ca).
4.3 MINERAL RIGHTS, LAND USE STATUS AND PERMITS
The Glover Island Property is situated on crown lands. Mineral licence holders have the right to
explore for, and ultimately exploit minerals, as per legislation as defined in the Public Reserve

P&E Mining Consultants Inc. Page 11 of 110
Mountain Lake Resources Inc. Glover Island Gold Property Report No. 244
Regulations of the Land Act. Exploration and exploitation activities may also be subject to an
Environmental Impact Assessment (EIA) and compliance with other regulatory requirements.
Glover Island is part of a Provisional Ecological Reserve (the Glover Island Public Reserve),
established in 2002 and subject to review in 2012. The reserve was established to protect pine
marten habitat, and covers the whole island. Mineral exploration and all related activities are
allowed within the Reserve with government permits. Permits are required for exploration
activities, stream crossings, forest cutting, trail construction, ATV use, fuel storage, and for camp
construction, occupancy and related water use. The various permits are obtained from the
Mineral Land Division of the Newfoundland and Labrador Department of Natural Resources, the
Lands Branch of the Department of Government Services and Lands, the Department of
Environment and Conservation, the Department of Parks and Natural Areas, the Department of
Forestry, and the federal Department of Fisheries and Oceans.
4.4 INTEREST IN THE PROPERTY
The Glover Island Property was acquired by Mountain Lake Resources Inc. from New Island
Resources Inc. in October 8, 2010 for a purchase price of $1,819,806 comprised of $500,000
cash, the issuance of one million common shares at a fair value of $900,000, the issuance of
share purchase warrants to acquire 500,000 common shares of the Company at an exercise price
of $1.20 per share on or before October 8, 2012 with a fair value $249,000, forfeiture of
repayment of a loan and interest receivable from New Island of $164,331 and purchase costs of
$6,475. New Island retains a net smelter returns royalty of 1% of commercial production, which
reduces to 0.5% after the payment of the first $1.0 million.
Exploration licence 007584M and mining licence 007588M are subject to a 3% NSR payable to
Charles Dearin of St. John’s, NL. The original claims on the Glover Island Project were staked
by South Coast Resources Inc., of which Mr. Dearin was the principal owner. The NSR was
originally part of an option agreement with Varna Gold Resources Inc., and has been transferred
down to all subsequent holders of the property.
4.5 ENVIRONMENTAL LIABILITIES
There are no known environmental liabilities associated with the Glover Island property.
No mining or other potentially disruptive work has been carried out on the property beyond that
described in this report. Mountain Lake reports that they have fully complied with the permitting
requirements for all exploration activities.
Glover Island is a 178 sq. km Public Reserve which is administered under the Crown Lands Act.
Mineral exploration and development is allowed to continue within this Public Reserve.
Guidelines to minimize the impact on threatened Pine Marten are provided through the Wildlife
Division and Parks and Natural Areas Division of the Department of Environment and
Conservation. In 2010 a Pine Marten Recover Plan was prepared by the Newfoundland Marten
Recovery Team and is implemented by the Wildlife Division. In addition, there are two rare
plants (Carex pseudocyperus and Dryopteris fragrans) located on the island. At least two
federally and provincially-protected species of birds have been recognized in the Reserve (Olive-
sided Flycatcher, Contopus cooperi; and Rusty Blackbird, Euphagus carolinus). Special care
must be exercised so as not to adversely affect any of these species or disrupt their habitat.

P&E Mining Consultants Inc. Page 12 of 110
Mountain Lake Resources Inc. Glover Island Gold Property Report No. 244
5.0 ACCESSIBILITY, CLIMATE, LOCAL RESOURCES, INFRASTRUCTURE
5.1 ACCESSIBILITY AND LOCAL RESOURCES
Access to the Glover Island Property is most easily achieved via helicopter from bases in the
community of Pasadena, 40 km to the north-northeast. Float plane access is also possible to
Kettle Pond, where the Mountain Lake exploration camp is located. The Lady Slipper Lake
forest resource access road extends from Corner Brook to the west shoreline of Grand Lake,
9 km west of Kettle Pond. This point can be used as a staging area for helicopter transport of
supplies to the exploration site.
A second forest resource access road extends 16 km southward from Pasadena to North Harbour
on Grand Lake, near the northwest end of Glover Island. This road can be used for barge access
to the northeast side of the island. Earlier work programs used a barge stationed at the
community of Howley on the north shoreline of Grand Lake. This barge is no longer serviceable.
In 2011 Mountain Lake Resources Inc. contracted a barge and transported it along the North
Harbour road in order to move heavy equipment onto the island (Figure 5.1).
Figure 5.1 1:50,000 Topographical Map showing Barge Route
The north half of Glover Island has been previously logged and a number of old logging roads
and skidder trails exist in this area. These roads can be utilized to move heavy equipment from
the barge offload point, approximately 20 km south to the Glover Island Property boundary. In
2011 Mountain Lake Resources Inc. established an access trail from the end of this road 7 km
south to the exploration camp on Kettle Pond.
Exploration supplies and contract services can be obtained in Corner Brook or Pasadena. Skilled
and experienced exploration crews are also available there, as well as in adjacent communities. A
major hydroelectric power transmission line utilizes the north end of the island as a bridging

P&E Mining Consultants Inc. Page 13 of 110
Mountain Lake Resources Inc. Glover Island Gold Property Report No. 244
point to cross Grand Lake. This line is located 24.5 km to northeast (in a straight line) from the
Mountain Lake camp.
5.2 CLIMATE AND PHYSIOGRAPHY
Climate is temperate with warm to hot summers extending from mid-May to mid-September, and
temperatures ranging from 10o to 30
oC. Winter temperatures vary from 0
o to -30
oC, with snow
cover normal from December to April. Winter storms may be frequent, and annual snowfall
amount varies from 3 to in excess of 5 m. Winter exploration activities are not significantly
impacted unless maximum snowfall amounts are recorded or in persistent blizzard conditions.
Grand Lake freezes only during the coldest winters, and cannot be used for ice transport of
supplies. Exploration can be carried out throughout most of the year depending on specific
activities although Spring breakup conditions and environmental considerations for denning
marten, flowering plants and nesting birds is a consideration.
Glover Island is characterized by a hummocky, elevated plateau bounded by steep cliffs up to
350 m high giving rise to fjord-like topography. Water depth in Grand Lake locally exceeds
475 m making it one of the deepest lakes in Newfoundland. Only the northeast side of the island
offers lower elevations and local relief. Local relief at LPSE is in the order of 50 m.
The upper plateaus consist of tree covered hills and ridges with thin till/soil cover or exposed
bedrock. Adjacent areas consist of bogs, fens and small open ponds (with locally abundant
aquatic plants and fauna). Transitional zones into bedrock ridges can be less than 10 m wide and
may range up to several hundred meters. These transitional areas are typically covered in stunted
spruce, sycamore and low scrub. Ridges are typically treed with fir and lesser amounts of white
& yellow birch.
5.3 INFRASTRUCTURE
Infrastructure on the Glover Island property includes a 24-person all season exploration camp
situated at the southwest end of Kettle Pond. The camp, consisting of 8 structures was
constructed by Mountain Lake in 2011. It is of wooden construction, with steel roofing and
electric heating. Power is supplied by a 60 kw diesel generator. The camp includes a large core
logging/sampling/cutting facility, two bunk houses, cook house, storage unit, generator building
and outhouse. Both phone and internet is provided through two satellite communication dishes
located on a high point at the edge of camp. Two bermed fuel cache facilities are present on the
property, a small one at camp (3m x 3m) and a larger one (6 m x 7 m) near the Lunch Pond
South Extension drilling area.

P&E Mining Consultants Inc. Page 14 of 110
Mountain Lake Resources Inc. Glover Island Gold Property Report No. 244
Figure 5.2 Mountain Lake Camp on Kettle Pond
Also based at the campsite are a Cat 315 excavator and a rubber-tracked Morooka 800 carrier.
A small log cabin, built by New Island Minerals circa 1988, is situated at the northeast end of
Meadow Brook Pond. The cabin is in modest condition and could be refurbished for future use.
All other structures at the Meadow Brook site have been removed.
Corner Brook, Pasadena and Deer Lake are the nearest population centers located 30 km north-
northwest, 40 km north-northeast and 60 km northeast, respectively, from Mountain Lake’s
camp at Kettle Pond.

P&E Mining Consultants Inc. Page 15 of 110
Mountain Lake Resources Inc. Glover Island Gold Property Report No. 244
6.0 HISTORY AND PREVIOUS EXPLORATION
6.1 GLOVER ISLAND EXPLORATION GENERAL
The earliest recorded mineral exploration on Glover Island was by Brinco Inc. in 1953, targeting
copper bearing massive sulfides in Glover Group volcanic rocks. At this time the island formed
part of a long-term mineral concession area. Subsequent base metal exploration was carried out
on the concession area in the late 1970’s by Hudson’s Bay Oil and Gas Ltd. (Lassila, 1979).
Work included a fixed-wing AEM survey, and ground follow-up, including three diamond drill
holes, on resultant EM anomalies. The Brinco mineral concession area was surrendered to the
crown on February 26, 1985, under terms of the 1982 Mineral Act.
Geological mapping on Glover Island has been done by a number of workers. The area was
covered by G.C. Riley in 1957 as part of a regional GSC mapping program. A major geological
mapping/compilation of the whole island was done by Douglas Knapp in 1982 as part of a
doctoral thesis. A major portion of the island was covered by Cawood and van Gool in 1993 as
part of a GSC mapping initiative. Mapping coverage of the island under this initiative was
completed in 1995 by Szybinski et al. Mapping of the south part of the island was carried out by
Barbour in 1994-1995 as part of a MSc. program.
6.2 HISTORY OF GOLD EXPLORATION
The property was first staked in 1985 by South Coast Resources Inc. Systematic exploration for
gold in 1985/1986 consisted of prospecting, geological mapping, and rock, soil and stream
sediment sampling, resulting in discovery of the Kettle Pond South auriferous zone Figure 7.8.
Title to the property was transferred to Varna Gold Inc in 1987. They continued the program of
grid cutting, stream-sediment sampling, b-horizon soil and till sampling, rock-chip sampling and
prospecting (Wallace 1988). In 1989 Newfoundland Goldbar Resources Inc. signed a deal with
Varna Gold Inc. to acquire a 50% interest in the property in return for exploration expenditures.
Subsequent exploration to 1993 included approximately 100 kilometres of linegrid, which was
covered with b-horizon soil sampling, and partially with VLF-EM and magnetics surveying, and
lesser IP surveying. Some backhoe and hand trenching and sampling was done, and several
diamond drill holes were completed on auriferous showings (French 1989, 1990, 1992, 1993).
Over the period of 1986-1992 several new auriferous zones were discovered. These include the
Discovery, Lunch Pond and Lunch Pond North veins, and the Tomahawk, 2700 Zone, Meadow
Brook, Rusty Vein, Line 1500, and Lunch Pond South Extension prospects.
From 1987 to 1990 exploration was conducted by Noranda Inc. in an area north of the property
held by Varna Gold Inc. (Collins 1987, Walker 1988, MacDougal 1990, Andrews 1990). They
carried out prospecting, geological mapping, b-horizon soil sampling, and backhoe trenching and
sampling, resulting in discovery of the Keystone and Jacamar gold prospects. Three diamond
drill holes were drilled on the auriferous showings
In 1993 Varna Gold Inc. underwent a name change to New Island Minerals Ltd. and the property
reverted 100% to New Island Minerals Ltd. The property was enlarged in 1994, by new staking,
to include the area of the Keystone and Jacamar gold prospects. Exploration consisted of
additional line cutting, prospecting, geological mapping, backhoe trenching and diamond drilling
(French, 1995). A new auriferous zone was identified at the Lucky Smoke prospect. Up to this
time 70 diamond drill holes had been drilled by Varna/New Island.

P&E Mining Consultants Inc. Page 16 of 110
Mountain Lake Resources Inc. Glover Island Gold Property Report No. 244
In 1996 the property was optioned to International Northair Mines. They conducted geological
mapping, soil sampling, MAG/VLF-EM ground surveys, and minor trenching. International
Northair Mines did not complete their earn-in agreement, and the property returned 100% to
New Island Minerals Inc.
From 1998 to 2003 sporadic exploration was continued on the property by New Island Resources
Inc. (formerly New Island Minerals Inc.). Work in 1998 consisted of line cutting, b-horizon soil
sampling, geological mapping and prospecting, and resulted in discovery of the Rusty Trickle
VMS prospect (Barbour and Hodge, 1998). Subsequent work in 1999 and 2000 consisted of IP
geophysical surveys, a helicopter supported AEM survey by Fugro Airborne Surveys, magnetic,
VLF-EM, TEM and HLEM ground surveys, prospecting, soil sampling and geological mapping
(Woods 2000, Basha and Frew 2001). In 2003 New Island Resources drilled 6 holes at the Lunch
Pond Extension Zone, and 2 holes at the Lucky Smoke Prospect.
In 2006 the property was optioned to Crew Gold Corporation. Their exploration program in 2007
and 2008 consisted of linecutting, b-horizon soil sampling, geological mapping, re-sampling of
historic trenches, base-station GPS capture of historic drill collars, trenches and grid lines, and a
helicopter-borne VTEM and magnetics survey contracted to Geotech Limited (Wilson et al,
2008). Crew returned the property 100% to New Island Resources Inc.
Mountain Lake acquired the property from New Island in October, 2010.
6.3 QUANTITY AND QUALITY OF HISTORIC DATA
The historic exploration data is available mainly as hard format maps, drill sections, summary
reports and drill logs. Digital files include some Word and Excel files containing drill logs and
soil, trench and drill sample locations and assays, and a Lunch Pond South Extension-Kettle
Pond South database compiled by New Island Resources for a previous resource modelling
program.
Historic trenches on the property were left open and some are still in reasonable condition.
Original channel sample cuts are visible, and although sample ID was not permanently affixed to
the channels it can be re-established by comparing sample maps to the existing channels.
Twenty-five of the earliest diamond drill holes are stored in the NL government core storage
facility at Pasadena. Core from three or four drill holes was lost during transport off island
because of a barge sinking. The remainder of the historic drill core was left on the island and is
no longer in useable condition because boxes have rotted and are no longer identifiable.
In 2008 Exploration Alliance Ltd. (for Crew Gold) re-sampled some of the trenches using NI-43-
101 compliant protocols. They report that “overall there was reasonable correlation between the
gold assay results of the 2008 resampling programme and historic gold assay results” (Wilson et
al., 2008). They completed a base station GPS survey to capture a number of historic drill collars
and line grid coordinates in Nad 27 format. They also scanned and registered in Map Info some
of the soil sampling maps, trench sampling maps and drill collar data for holes not located and
re-surveyed. However, the Nad 27 projection carries an inherent positioning error; Nad 83
format is required for accurate positioning.
In 2010 Mountain Lake Resources resampled the remaining half of sawed core from the
mineralized intervals in drill holes LPSE.28-03, 29-03, 30, 31, 32, and 33, and drill holes LS.07

P&E Mining Consultants Inc. Page 17 of 110
Mountain Lake Resources Inc. Glover Island Gold Property Report No. 244
(LS is used to designate the Lucky Smoke prospect at Quartz Pond near the northeast end of the
GI Trend) and 08 using NI.43-101 compliant protocols. There was reasonable correlation
between the gold values in the new versus historic sampling. One of the authors (D. Barbour)
was involved in much of the exploration on the property from 1991 to 1998. In his estimation
exploration was done in accordance with “exploration best practices”. However, historic
assaying protocols did not utilize the insertion of standards, blanks and quarter-split duplicates,
and all analytical results are therefore not NI 43-101 compliant.
There has been no mining or mineral production of any kind on Glover Island.

P&E Mining Consultants Inc. Page 18 of 110
Mountain Lake Resources Inc. Glover Island Gold Property Report No. 244
7.0 GEOLOGICAL SETTING AND MINERALIZATION
7.1 REGIONAL GEOLOGICAL SETTING
Newfoundland represents the north-eastern-most expression of the Canadian Appalachian
Mountains (Figure 7.1). The Appalachians consist of a complex collage of Early Palaeozoic peri-
Laurentian and peri-Gondwanan oceanic suprasubduction zone and ribbon-shaped
microcontinental terranes. The suprasubduction zone terranes include infant arc, extensional arc
and back-arc settings. The microcontinental terranes were rifted off from the Laurentian and
Gondwanan margins. Sequential accretion of these terranes to one another, and to Laurentia,
occurred during closure of the Iapetus and Rheic oceans between the Late Cambrian and
Permian. Various styles of mineral deposits occur in different tectonic settings related to the
complex tectonic architecture and evolution of the Canadian Appalachians (Figure 7.2 and
Figure 7.3). Orogenic and epithermal mineralization formed mainly in the tectonically active part
of the orogen (central mobile belt) during post-Ordovician orogenic and collisional events. These
events are related to the accretion of the peri-Gondwanan microcontinents to Laurentia during
the Silurian Salinian orogeny and the Devonian Acadian orogeny. Mineralization is spatially
associated with major accretionary faults, although it generally occurs in second order structures.
Figure 7.1 Canadian Appalachian Mountains
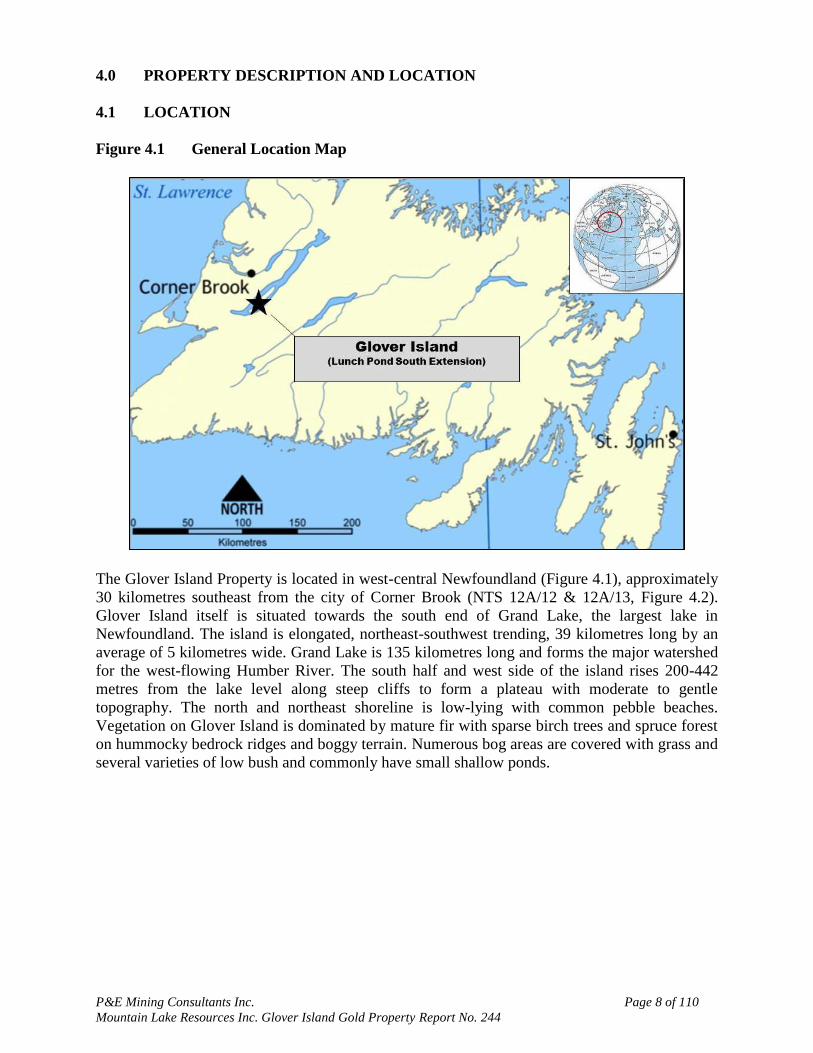
7.2 GEOLOGY OF NEWFOUNDLAND
The island of Newfoundland is comprised of four northeast-southwest trending
tectonostratigraphic zones that are separated by major crustal fault zones (Figure 7.2; Hibbard
1983, van Staal 2007).

P&E Mining Consultants Inc. Page 19 of 110
Mountain Lake Resources Inc. Glover Island Gold Property Report No. 244
Figure 7.2 Tectonic Architecture of Newfoundland
The Humber Zone comprises the western-most part of Newfoundland. This zone consists of a
Precambrian (Laurentian) crystalline basement inlier. This is overlain by Late Proterozoic to
Paleozoic Humber Margin allochthonous oceanic sedimentary and ophiolitic rocks, and by
sedimentary shelf facies. Metamorphic grade reaches amphibolite to locally migmatitic facies.
Several Mississippi Valley type deposits occur within shelf facies rocks; e.g. Daniels Harbour
mine: 6.6 million tonnes at 7.9% Zn (Swinden and Dunsworth, 1995), and the Round Pond
deposit; 400,000 tonnes at 2% Zn (van Staal, 2007). Ophiolitic rocks of the Humber Arm
allochthons host numerous copper, zinc and gold showings, including the York Harbour Mine:
production of 90,000 tonnes of 3-12% Cu, 7% Zn; reserves of 200,000 tonnes of 2.68% Cu,
8.25% Zn, and 1 g/t Au (MacDougal et al., 1991). Orogenic gold deposits occur along the
eastern edge of the Humber Zone (e.g. the Viking and Rattling Brook deposits).
The Humber Zone is separated from the Dunnage Zone to the east by the Baie Verte-Brompton
Line and the Cabot Fault. The Baie Verte-Brompton Line is traceable a distance of 1,500 km,
from northeast Newfoundland to the Quebec Eastern Townships. It is marked by a zone of
steeply dipping, east facing Ordovician ophiolite complexes overlain by shaly
metaconglomerates and olistostromal melanges, and is thought to be the root zone for the
obducted Humber Arm ophiolitic complexes. The Cabot Fault is a major crustal structure
extending from the south coast of Newfoundland, through Grand Lake to the north coast of the
Baie Verte Peninsula. Latest activity on the fault is probably Carboniferous normal movements.
P&E Mining Consultants Inc. Page 20 of 110
Mountain Lake Resources Inc. Glover Island Gold Property Report No. 244
Figure 7.3 Tectonostratigraphic Subdivisions of Newfoundland
The Dunnage Zone contains the vestiges of Cambro-Ordovician continental and intra-oceanic
arcs, back-arcs, and ophiolites that formed in the Iapetus Ocean (Williams, 1995; Zagorevski et
al., 2007; van Staal et al., 2009). The Dunnage Zone is subdivided into the western peri-
Laurentian Notre Dame Subzone, and the eastern peri-Gondwanan Exploits Subzone. A major
crustal-scale fault zone, the Red Indian Line, marks the fundamental Iapetus suture zone between
the two subzones. The Notre Dame Subzone contains three distinct Cambrian to Middle
Ordovician (507-462 Ma) oceanic terranes and a continental magmatic arc (the Notre Dame arc),
overlain by non-marine Silurian sediments. The Exploits Subzone consists of Cambrian to mid-
Ordovician marine sedimentary and intercalated volcanic rocks, overlain by mid to late
Ordovician black shales that pass upwards through turbidites into shallow marine and terrestrial
Silurian sediments.
Numerous syngenetic VMS deposits occur within the Dunnage Zone, including the Duck Pond
Mine (4.1 Mt at 3.3% Cu, 5.7% ZN, 0.9% Pb and 0.9 g/t Au: Aur Resources, 2007), and the past
producing Buchans Mines (16.2 Mt at 14.515 Zn, 7.56% Pb, 1.33% Cu, 126 g/t Ag and 1.37 g/t
Au: Kirkham et al., 1987).
The Gander River Ultrabasic Belt-Day Cove fault system separates the Dunnage Zone from the
Gander Zone to the east. The Gander Zone comprises a metamorphosed sequence of Lower
Cambrian to Lower Ordovician (~520-480 Ma) arenites, siltstones and shales, which are
considered to represent the outboard part of a passive margin (van Staal, 1994). The Gander
Zone is bounded to the east by the Dover-Hermitage Bay crustal suture.

P&E Mining Consultants Inc. Page 21 of 110
Mountain Lake Resources Inc. Glover Island Gold Property Report No. 244
The Dunnage and Gander Zones host numerous orogenic gold deposits. The deposits are
spatially associated with larger crustal structures that define terrane boundaries, and that have
been active repeatedly through the Early to Mid Paleozoic. Structures along the western margin
of the Dunnage Zone are particularly proficient in gold deposits (Isle aux Morts, Glover Island,
Pine Cove, Deer Cove, Stog’er Tight, Nugget Pond, Hammer Down). The Gander Zone and the
eastern part of the Dunnage zone also host epithermal gold deposits.
The eastern-most part of Newfoundland comprises the Avalon Zone. This zone consists of Late
Proterozoic, largely juvenile, arc-related submarine and terrestrial volcano-sedimentary
sequences and turbidite, deltaic and fluvialtile sedimentary rocks. The Avalon Zone hosts
numerous Late Proterozoic epithermal gold deposits, and several VMS deposits associated with
Neoproterozoic volcanics.
7.3 GEOLOGY OF GLOVER ISLAND
The Cabot Fault forms a major structural boundary along the west side of Grand Lake that
separates Glover Island from the Humber Zone (Knapp, 1982). In the Glover Island area the fault
is mostly concealed by Grand Lake, but where exposed to the south it consists of a 20-metre
thick vertical zone of extensive mylonitization and brecciation. However, Glover Island does
preserve a part of the lithologies found in the boundary between the Dunnage and Humber zones.
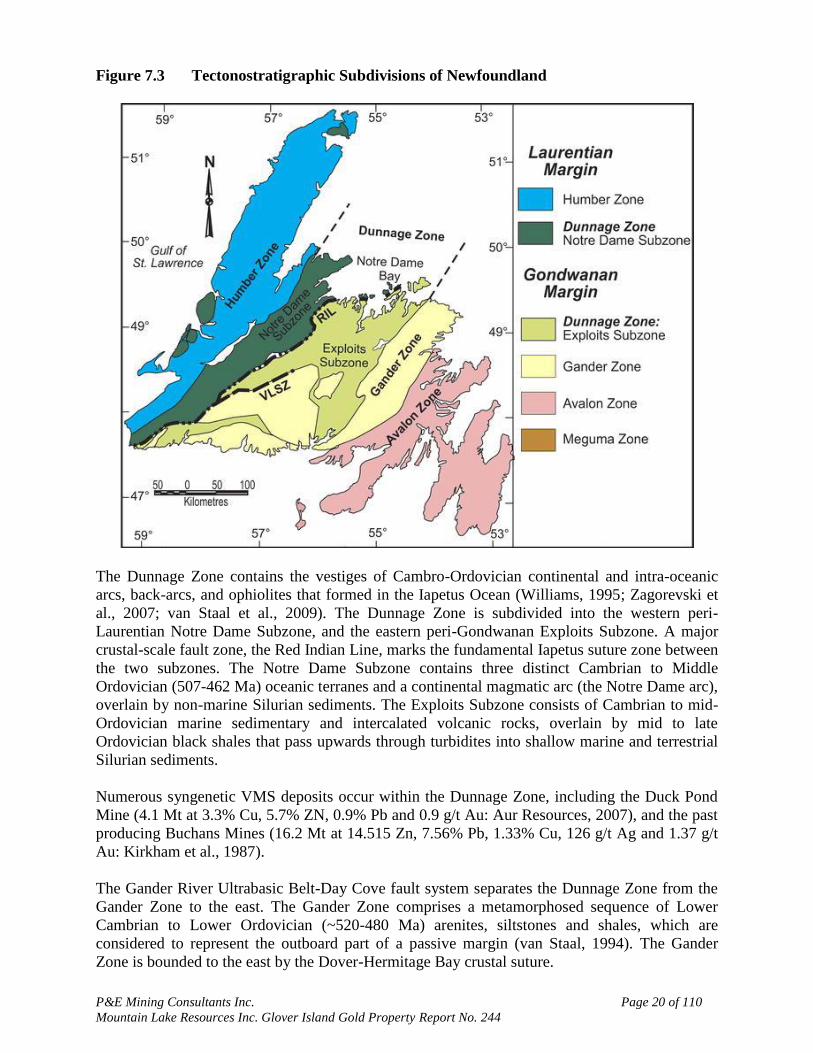
Glover Island is characterized by a large number of contrasting rock types located in a relatively
small area; nine distinct lithostratigraphic units are recognized. A cross section of the property is
presented in Figure 7.4. Contacts are generally structural boundaries and unconformities.
Metamorphism ranges from greenschist to amphibolite facies, which along with local intense
deformation obscures many primary features and structures. Minor remnants of blueschist facies
metamorphism are preserved in rocks of the Grand Lake Complex.
Two lithostratigraphic units of the Humber Zone crop out on the northwest side of Glover Island.
The structurally/stratigraphically lowest unit is the Cobble Cove gneiss, a sequence of strongly
foliated quartzo-feldspathic orthogneisses containing metasomatized mafic dikes (Knapp, 1982;
Cawood and van Gool, 1993). This unit is interpreted to represent a fragment of Grenvillian
basement.
The Cobble Cove gneiss is structurally overlain by a sequence of polydeformed and
metamorphosed clastic rocks termed the Keystone schist. This sequence comprises interbanded
psammite, quartz pebble conglomerate, pelite, and minor amphibolite, marble, quartzite, biotite
schist and graphitic schist. The contact with the underlying gneiss is a 10-metre thick high strain
zone consisting of quartzo-feldspathic gneiss and highly deformed mafic schist, containing
rounded tectonic clasts of undeformed gneiss and vein quartz (Knapp, 1982). The Keystone
schist is interpreted to represent a basal clastic unit overlying Grenvillian basement, and is
inferred to be of Cambrian or Upper Precambrian age.
The Keystone schist is structurally overlain by the Grand Lake Complex, the oldest unit of the
Dunnage Zone exposed on Glover Island. The Grand Lake Complex consists of a basal
greenschist overlain by talc-carbonate schists, serpentinized peridotite, cumulate layered gabbro,
massive mafic to leucocratic gabbro, fine-grained vari-textured gabbro, and an upper greenschist.
All of the units are intruded by mafic dikes while medium-grained equigranular trondhjemite
intrudes only the upper part of the complex. A sample of trondhjemite was dated at 490 +/- 4 Ma
(U-Pb zircon; Cawood and van Gool, 1996). The complex is interpreted to represent part of a
Lower Ordovician ophiolite suite. At the south end of Glover Island is a fault-bounded block
P&E Mining Consultants Inc. Page 22 of 110
Mountain Lake Resources Inc. Glover Island Gold Property Report No. 244
comprised of sheeted dikes and basaltic pillow lavas and breccias termed the Otter Neck Group
(Knapp, 1982). Geochemical analyses of these rocks suggest that they are related to the Grand
Lake Complex, and represent the upper levels of an ophiolite suite. However, they are only
weakly deformed as opposed to strongly deformed within the latter.
Figure 7.4 LPSE Cross Section

P&E Mining Consultants Inc. Page 23 of 110
Mountain Lake Resources Inc. Glover Island Gold Property Report No. 244
Figure 7.5 General Geology of Glover Island
The Grand Lake Complex is overlain by the Kettle Pond Formation. This formation consists of
clast-supported polymictic pebble to cobble conglomerate, and matrix-rich polymictic
conglomerates that grade into arenaceous schists. Clast lithologies include gabbro, leucogabbro,
trondhjemite, basalt, rhyodacite, rhyolite, quartz, jasper and minor fine-grained sediments and
orthoquartzite. The conglomerate matrix consists of a green volcaniclastic metasediment, with
more deformed sections rich in talc and fuchsite. The similarity of gabbro and trondhjemite
clasts to the underlying ophiolitic rocks, and the talc and fuchsite component, suggest that the
Kettle Pond Formation was largely derived from the Grand Lake Complex. The contact between
the two is interpreted to be a nonconformity.
The Kettle Pond Formation is overlain by a mixed mafic and felsic volcanic sequence termed the
Tuckamore Formation. At the south end of Kettle Pond the contact between the two is a thin
schistose zone developed in rocks of the Kettle Pond Formation, and is interpreted as a D1 thrust.
Here the base of the Tuckamore Formation consists of thinly intercalated bands of very fine-
grained mafic and felsic water-lain tuffs, and/or epiclastic material. This grades upward into
more coarsely interlayered bands of mafic and felsic tuffs, interspersed with thicker units of
mafic volcanics. The top of the sequence is a thin unit of distinctive quartz-feldspar crystal tuff.
To the southeast and north of Kettle Pond the Tuckamore Formation is bounded on both sides by
high-angle late faults (the Meadow Brook and Tuckamore faults). This block contains significant
units of fine quartz and feldspar phyric rhyolite and of aphanitic, cherty aphyric rhyolite, as well
as the mafic volcanic and interlayered mafic-felsic volcanic units. Minor thin graphitic shale
units and massive pyrite-pyrrhotite beds occur locally.

P&E Mining Consultants Inc. Page 24 of 110
Mountain Lake Resources Inc. Glover Island Gold Property Report No. 244
The Tuckamore Formation is overlain by mafic volcanics of the Glover Formation. At the south
end of Kettle Pond this contact is conformable, and is defined by the disappearance of felsic
volcanic units. The formation is composed mainly of a massive plagioclase phyric mafic rock
that contains up to 5mm sized strongly saussuritized plagioclase. This unit could be sub-volcanic
or a massive flow. Massive fine-grained amygdaloidal mafic volcanics and pillow lavas are
subordinate in this area, but volumetrically more important north of Kettle Pond and on the south
end of Glover Island. Rocks of the Glover Formation are generally much less deformed than
those of the Tuckamore and Kettle Pond formations. In the Lunch Pond to Meadow Brook area,
the Tuckamore Fault juxtaposes very strongly deformed rocks of the Tuckamore Formation
against essentially undeformed rocks of the Glover Formation. The Tuckamore and Glover
formations are of calc-alkaline affinity, and are interpreted as extrusive products of island arc
volcanism (Knapp, 1982).
Parallochthonous metaclastic rocks of the Red Point Formation unconformably overlie
trondhjemite of the Otter Neck Group along the southwest shoreline of Glover Island (Knapp,
1982). These consist of purple phyllite, metagreywacke, gray sandstone and metaconglomerate.
An area of similar metaclastic rocks unconformably overlies Glover Formation lithologies at
Corner Pond on the western mainland. These rocks are correlated with the Red Point Formation.
They contain graptolite fauna that indicate a mid-Arenig age. The Corner Pond Formation
includes purple pillow lavas, massive felsic volcanic rocks and tan sandstones in its upper
stratigraphy. Graded bedding in both formations indicates that stratigraphy is right side up.
On the east side of Glover Island, the Glover Formation is intruded by the Glover Island
granodiorite. This intrusion comprises medium-grained equigranular quartz-diorite to quartz-
monzonite. U/Pb age dating on titanites and zircon yielded respective ages of 439 +/- 2, 439 +/- 3
Ma, and 440 +/- 2 Ma (Cawood et al., 1996).
Carboniferous rocks of the Deer Lake Group are exposed on the north end of Glover Island
(Hyde, 1982). These consist of red-brown pebble conglomerate with interstratified sandstone,
siltstone and minor limestone. On the mainland these strata unconformably overlie Dunnage
Zone rocks or contacts are faulted.
7.4 STRUCTURE
Four deformation events are recorded in the Dunnage Zone lithologies on Glover Island. An
earlier, possibly Grenvillian event, is recorded in the Cobble Cove gneiss and Keystone schist
lithologies of the Humber Zone (Knapp, 1982). This event is represented by a well-developed,
penetrative, regional schistosity. Related folds or other structures are not recognized due to
transposition and high strain associated with subsequent deformational events. This foliation is
distinguished based on overprinting by post-tectonic porphyroblasts. Deformation events
affecting Dunnage Zone rocks are listed below:
D1: D1 is a folding and thrusting event that affected both Humber and Dunnage
zone lithologies on Glover Island. It is interpreted to be related to initial assembly
of the oceanic terranes against Laurentia during the Ordovician Taconic orogeny.
The most prominent expression of D1 deformation is a regionally penetrative
foliation, S1, which is the main fabric seen in the map area. It overprints the
porphyroblasts that cut the earlier foliation in the Humber Zone. Because of
transposition the main fabric is generally a composite S1/S0 fabric in the Dunnage
Zone lithologies. S1 is associated with a well-developed L1 lineation defined by
P&E Mining Consultants Inc. Page 25 of 110
Mountain Lake Resources Inc. Glover Island Gold Property Report No. 244
clast and mineral elongation, and by a pressure shadow lineation. F1 folds are not
recognized due to the intensity of the transposition in D1. An exception is a major
isoclinal F1 fold in the Keystone schist (Knapp, 1982). The fold is defined by a
reversal of stratigraphic facing of the lithologic units. The presence of D1
thrusting is suggested at two locales. The geometric distribution of the Cobble
Cove gneiss and the Keystone schist on the northwest side of Glover Island forms
a pattern which strongly resembles that of a thrust duplex. Farther to the east, the
contact between the Tuckamore and Kettle Pond formations is a schistose zone
that is pre-D2, and thus interpreted as a D1 thrust.
D2: D2 deformation consists of an asymmetric fold-thrust system which affects all
lithostratigraphic units, and is consistent with peak metamorphic conditions. The
deformation affects the Glover Island granodiorite, suggesting that it correlates
with the Silurian Salinic orogeny. Major F2 folds are kilometric scale fold nappes
contained within D2 thrust sheets. These thrust sheets comprise an antiformal
stack built upon a D1 duplex in the basement lithologies. Transport of the thrust
sheets over the edge of the antiformal stack may be the cause of the steep S1 dips
and the steep plunges of F2 fold axes. This may also explain the change in the dip
direction of thrusts in the Lunch Pond area from southeast to southwest, and why
the thrusts cut significantly across stratigraphy.
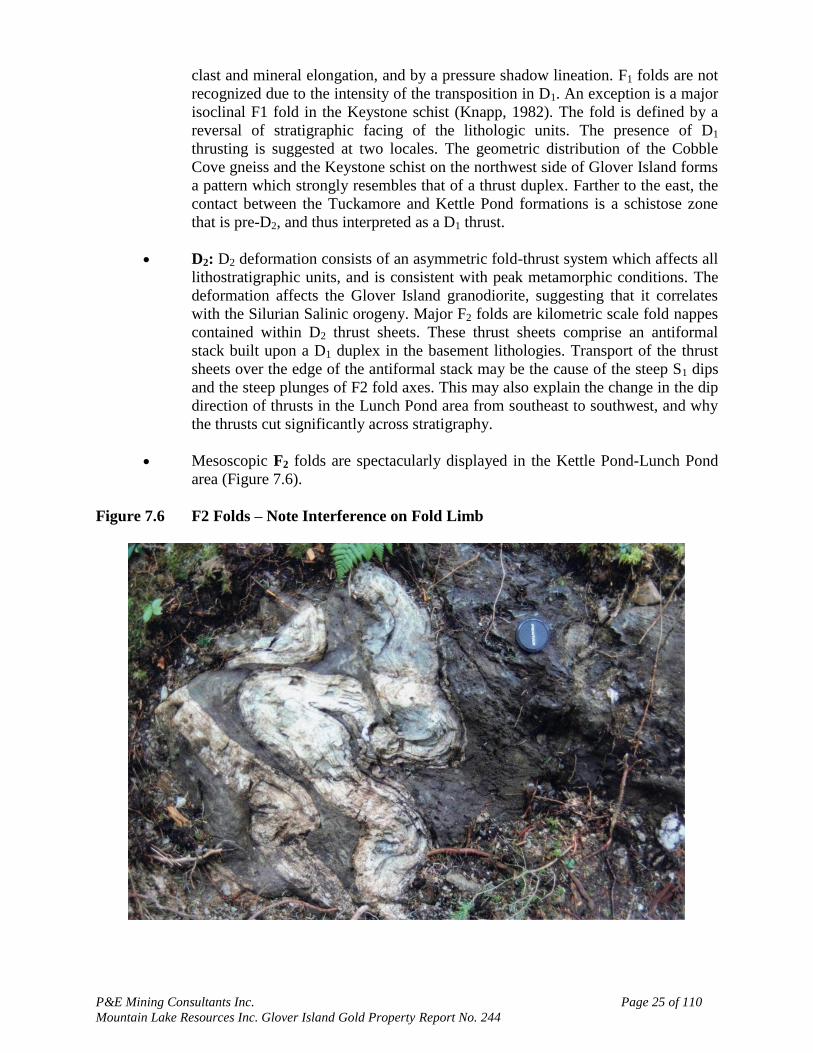
Mesoscopic F2 folds are spectacularly displayed in the Kettle Pond-Lunch Pond
area (Figure 7.6).
Figure 7.6 F2 Folds – Note Interference on Fold Limb

P&E Mining Consultants Inc. Page 26 of 110
Mountain Lake Resources Inc. Glover Island Gold Property Report No. 244
In the Tuckamore and Glover formations these are open to close, polyharmonic to
disharmonic similar folds displaying chevron, cuspate-lobate and ptygmatic styles
Figure 7.7).
Figure 7.7 F2 Folds in Tuckamore Formation
These folds lack an axial planar cleavage, except in more homogeneous
lithologies where a spaced differentiated crenulation cleavage is variably
developed. In more schistose lithologies, in particular within the Kettle Pond
Formation, the folds are close to isoclinal. In these areas a S2 axial planar
cleavage is well developed, with the earlier S1/S0 cleavage variably transposed
into parallelism with S2. In areas of strong S2 foliation F2 folds are preserved as
isolated tiny rootless intrafolial isoclinal folds oriented along the fabric. Quartz
veins in the Kettle Pond Formation are commonly folded into “fish-hook” style
folds. The mesoscopic folds are parasitic on decametric to kilometric scale F2
folds. Fold asymmetries indicate a kilometric scale antiform in the Lunch Pond
area; the hinge domain of this fold has been removed by a thrust running through
Lunch Pond (Figure 7.8).

P&E Mining Consultants Inc. Page 27 of 110
Mountain Lake Resources Inc. Glover Island Gold Property Report No. 244
Figure 7.8 Geology and Mineral Prospects of Central Glover Island
D3: D3 deformation consisted of a northwest-southeast oriented compressional
event which preferentially folded lithostratigraphic units that were suitably
oriented by D2. In areas where lithostratigraphic units trend northeast, the only
obvious effects of D3 deformation are isolated highly asymmetric microscopic to
mesoscopic folds.
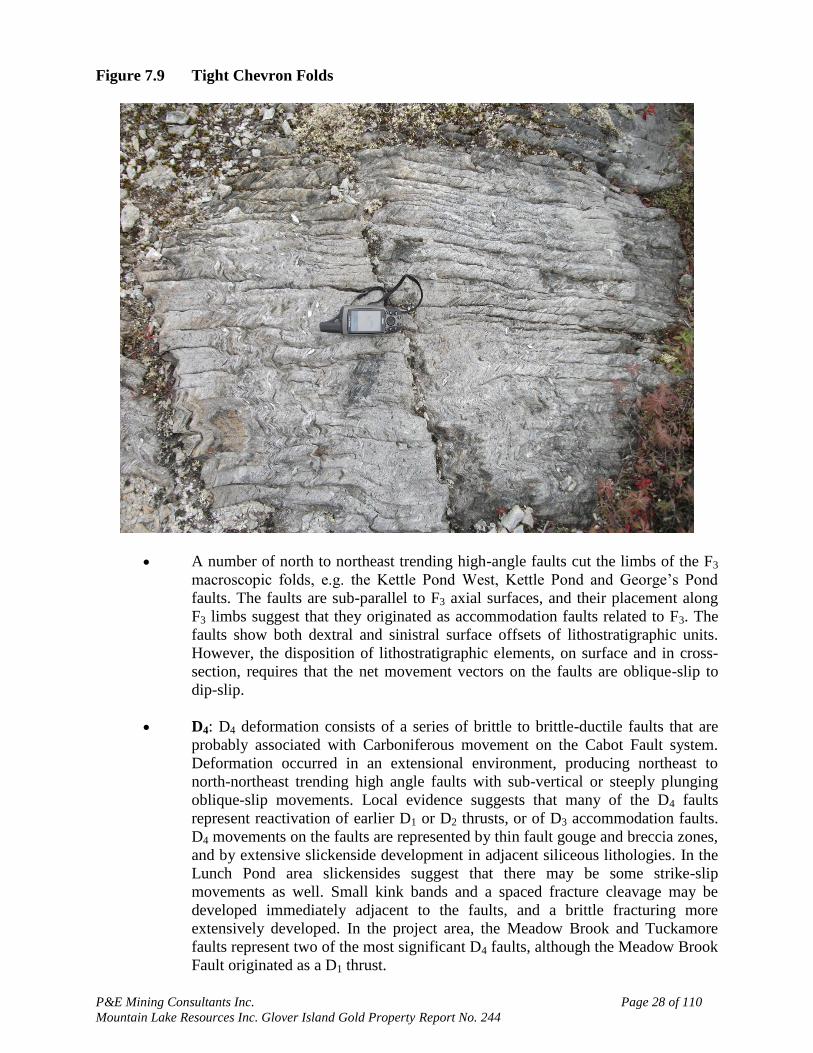
F3 folds occur on all scales. The largest order of folds is the hectametric to
kilometric scale Kettle Pond antiform-synform pair, located south and west of
Kettle Pond (Figure 7.9). F3 folds vary from gentle to close, are dominantly
chevron or cuspate-lobate style, and are frequently polyharmonic and occasionally
disharmonic. Axial surfaces of the folds dip very steeply both to the west-
northwest and the east-southeast. Because of the variable attitudes of foliation and
layering caused by earlier F2 folds and D2 thrusts, the F3 folds have a range of
plunges from steep southerly to steep northerly; steep southerly plunges are
dominant. A S3 axial planar cleavage is developed only in fine-grained schistose
facies of the Kettle Pond Formation, and to a lesser extent in chloritic schists of
the Glover Formation. The S3 foliation is generally a differentiated crenulation
cleavage, and locally a spaced cleavage defining the axial surfaces of tiny F3
chevron folds.
P&E Mining Consultants Inc. Page 28 of 110
Mountain Lake Resources Inc. Glover Island Gold Property Report No. 244
Figure 7.9 Tight Chevron Folds
A number of north to northeast trending high-angle faults cut the limbs of the F3
macroscopic folds, e.g. the Kettle Pond West, Kettle Pond and George’s Pond
faults. The faults are sub-parallel to F3 axial surfaces, and their placement along
F3 limbs suggest that they originated as accommodation faults related to F3. The
faults show both dextral and sinistral surface offsets of lithostratigraphic units.
However, the disposition of lithostratigraphic elements, on surface and in cross-
section, requires that the net movement vectors on the faults are oblique-slip to
dip-slip.
D4: D4 deformation consists of a series of brittle to brittle-ductile faults that are
probably associated with Carboniferous movement on the Cabot Fault system.
Deformation occurred in an extensional environment, producing northeast to
north-northeast trending high angle faults with sub-vertical or steeply plunging
oblique-slip movements. Local evidence suggests that many of the D4 faults
represent reactivation of earlier D1 or D2 thrusts, or of D3 accommodation faults.
D4 movements on the faults are represented by thin fault gouge and breccia zones,
and by extensive slickenside development in adjacent siliceous lithologies. In the
Lunch Pond area slickensides suggest that there may be some strike-slip
movements as well. Small kink bands and a spaced fracture cleavage may be
developed immediately adjacent to the faults, and a brittle fracturing more
extensively developed. In the project area, the Meadow Brook and Tuckamore
faults represent two of the most significant D4 faults, although the Meadow Brook
Fault originated as a D1 thrust.

P&E Mining Consultants Inc. Page 29 of 110
Mountain Lake Resources Inc. Glover Island Gold Property Report No. 244
7.5 MINERALIZATION
Sixteen (excluding the Clyde Cu-Ni-Pd-Pt occurrence) gold prospects or deposits have been
identified on the Glover Island property (Figure 7.8). These are listed below, firstly the Kettle
Pond hosted deposits, and secondly, the Tuckamore hosted deposits. In addition to gold, the
property hosts volcanogenic base metal prospects.
7.6 KETTLE POND HOSTED
i) Discovery Vein: This prospect consists of a series of up to 40-centimetre thick
quartz veins hosted in a decametric scale asymmetric F2 antiform. A single large
trench exposes a 5-metre width of veins that occur as a stacked series along the
hinge line of the fold (Figure 7.10). A concise gold anomaly in b-horizon soils
tracks the hinge line for a distance of 800 metres to the northeast. Channel
sampling of the vein returned a best value of 30.8 g/t gold over 1.7 metres
(historic unverified value, New Island Minerals). No drilling has been done on
this prospect.
Figure 7.10 Discovery Vein showing highly irregular outcrop pattern
ii) Lunch Pond Vein: The Lunch Pond vein is also hosted in a decametric scale
asymmetric F2 antiform. Two trenches were excavated 25 metres apart, exposing
a white massive quartz vein up to 2 metres thick. Minor very fine-grained visible
gold occurs in the milky quartz, and in millimetre scale late cross-cutting clear
quartz veinlets. Finer-grained gold is associated with disseminated pyrite,
commonly occurring along black pressure dissolution seams. Large aggregates of
fine-grained auriferous pyrite are locally present in the vein. The best reported
channel sample value is 1.5 metres of 150 g/t gold (unverified historic value).

P&E Mining Consultants Inc. Page 30 of 110
Mountain Lake Resources Inc. Glover Island Gold Property Report No. 244
This channel sample included a 15-centimetre thickness of a large pyrite
aggregate (Figure 7.11). Three short diamond drill holes were drilled on the
prospect. LPQ.1 and 2 were drilled across the vein. LPQ.2 intersected quartz vein
from 4.88-10.67m and from 24.38 to 28.65m (end of hole). The drill hole assayed
0.73 g/t gold over its 23.62m length, with best values contained in altered rock
between the two vein zones (unverified historic value). LPQ.3 was drilled in the
opposite direction between the two trenches, and down-plunge of the vein, and
did not cut significant mineralization. The prospect is open in all directions.
Figure 7.11 Large Pyrite Aggregate in Lunch Pond Vein
iii) Lunch Pond North veins: The main prospect consists of a very irregularly shaped
vein exposed in a large trench over a length of 26 metres and a thickness of up to
4.5 metres. Numerous other smaller veins occur within a northeast trending iron
carbonate-talc-fuchsite alteration zone measuring at least 400 metres by
50 metres. Veining is again spatially associated with a F2 antiformal closure. Best
channel sampling on the main vein returned 4.92 g/t gold over 0.7 metres
(unverified historic value). Drill hole LPN.1 on the main vein intersected up to 9-
metre thick veined zones in altered conglomerate, with gold values of 1.2 g/t over
7.9 metres, and 0.85 g/t over 6.9 metres (unverified historic values). LPN.2,
drilled 100 metres to the northeast, intersected altered conglomerate with sporadic
gold values up to 0.85 g/t (unverified historic values). This prospect is also open
in all directions.

P&E Mining Consultants Inc. Page 31 of 110
Mountain Lake Resources Inc. Glover Island Gold Property Report No. 244
Figure 7.12 Lunch Pond North Vein
7.7 TUCKAMORE HOSTED
i) Kettle Pond Brook: Mineralization consists of a number of quartz vein boulders
distributed over a small area in Kettle Pond brook. The boulders consistently
assayed gold values up to 20 g/t (unverified historic values). Four hundred metres
upslope to the east, drill hole KPB.1 intersected 5.4 metres of “typical mineralized
felsite”; no assays are available for this zone. The hole was lost at 23.77 metres
before reaching its intended target.
ii) Kettle Pond South: The mineralized zone is located in Tuckamore Formation
lithologies directly above the contact with the underlying Kettle Pond Formation
(Figure 7.8). It is situated in the broad hinge zone of a hectometric scale F3
antiform. Mineralization consists of quartz-iron carbonate veining, up to 2 metres
thick, with associated silicification and iron carbonate alteration that is semi-
concordant to lithostratigraphy. Gold occurs with disseminated pyrite in both
quartz vein and silicified host rock, but appears to be richest within pyrite
concentrations adjacent to vein margins. The deposit has been outlined over 200
metres of strike and to a depth of 97 metres by 11 diamond drill holes. The best

P&E Mining Consultants Inc. Page 32 of 110
Mountain Lake Resources Inc. Glover Island Gold Property Report No. 244
drill intersection assayed 4.8 g/t gold over 18.5 metres (unverified historic
values). The zone averages 10 metres true thickness. Mineralization is open in all
directions.
iii) LPC: Seven diamond drill holes were drilled in Tuckamore Formation lithologies
in an area of high gold values in b-horizon soils. Unfortunately the holes were
drilled parallel to lithostratigraphy and to mineralization trends. Drill hole LPC.2
intersected 54.6 g/t gold over 1.22m, and LPC.3 intersected 3.72 g/t gold over 1.1
metres (unverified historic values). Holes GP.1 and 2 were drilled across
lithostratigraphy 250 metres to the northwest. GP.2 intersected sporadic
mineralization with best value of 3.6 g/t gold over 1 metre (unverified historic
value).
iv) Lunch Pond South Extension: Gold mineralization occurs adjacent to the LPSE
thrust, which brings older Tuckamore Formation lithologies over younger rocks
of the Glover Formation (Figure 7.8). Gold is associated with widespread
silicification located directly above the thrust. The silicified zones are tabular and
extensive, and are conformable (or at least semi-conformable) with
lithostratigraphy. Silicification is normally pale gray colored, and massive with
common “chicken wire” textured in-situ brecciation. A pale gray-green
amorphous silicification, associated with anomalous chalcopyrite, is prominent at
the east end of the deposit, adjacent to the Lunch Pond Thrust.
Figure 7.13 Silicified and brecciated auriferous LPSE Zone
Mineralization in the Main Zone has been identified over an along-strike distance
of 1250 metres and to a vertical depth of 270 metres, with maximum true
thickness of 80 metres. The Main Zone is comprised of several closely spaced and
parallel silicified sheets that locally coalesce into a single unit. Some of the better
drill intercepts include 2.3 g/t gold over 53.7 metres in LPSE.4 (including 5 g/t
gold over 18.5 metres) (unverified historic values). A second, less strongly
mineralized zone is located 50 metres above the Main Zone. The Upper Zone has
been traced for a distance of 500 metres and to 200 metres vertical depth, and is
up to 35 metres thick. Typical drill intersections of this zone include 0.24 g/t gold
over 38.65 metres in drill hole LPSE.21 (unverified historic value). Gold has also
been noted in association with thin pyrite-bearing quartz veins cutting a quartz-
feldspar crystal tuff marker horizon approximately 100 metres above the Main
Zone. This mineralization is sporadic, with values of up to 3.05 g/t gold over
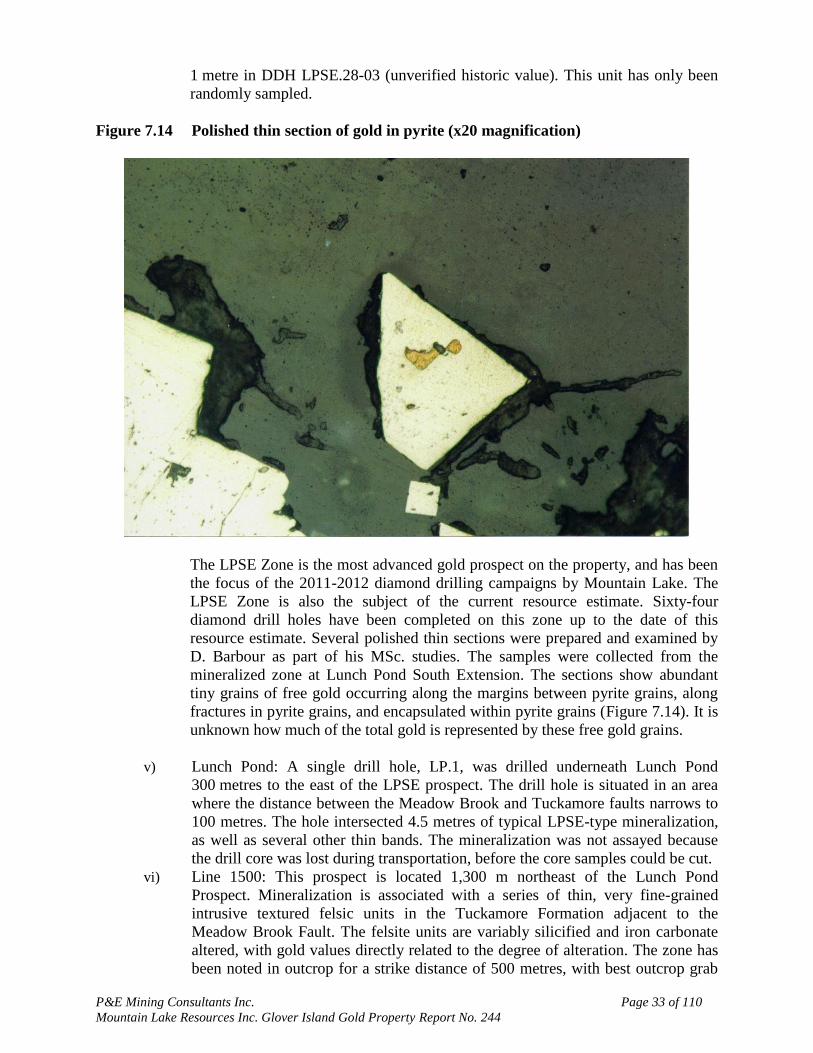
P&E Mining Consultants Inc. Page 33 of 110
Mountain Lake Resources Inc. Glover Island Gold Property Report No. 244
1 metre in DDH LPSE.28-03 (unverified historic value). This unit has only been
randomly sampled.
Figure 7.14 Polished thin section of gold in pyrite (x20 magnification)
The LPSE Zone is the most advanced gold prospect on the property, and has been
the focus of the 2011-2012 diamond drilling campaigns by Mountain Lake. The
LPSE Zone is also the subject of the current resource estimate. Sixty-four
diamond drill holes have been completed on this zone up to the date of this
resource estimate. Several polished thin sections were prepared and examined by
D. Barbour as part of his MSc. studies. The samples were collected from the
mineralized zone at Lunch Pond South Extension. The sections show abundant
tiny grains of free gold occurring along the margins between pyrite grains, along
fractures in pyrite grains, and encapsulated within pyrite grains (Figure 7.14). It is
unknown how much of the total gold is represented by these free gold grains.
v) Lunch Pond: A single drill hole, LP.1, was drilled underneath Lunch Pond
300 metres to the east of the LPSE prospect. The drill hole is situated in an area
where the distance between the Meadow Brook and Tuckamore faults narrows to
100 metres. The hole intersected 4.5 metres of typical LPSE-type mineralization,
as well as several other thin bands. The mineralization was not assayed because
the drill core was lost during transportation, before the core samples could be cut.
vi) Line 1500: This prospect is located 1,300 m northeast of the Lunch Pond
Prospect. Mineralization is associated with a series of thin, very fine-grained
intrusive textured felsic units in the Tuckamore Formation adjacent to the
Meadow Brook Fault. The felsite units are variably silicified and iron carbonate
altered, with gold values directly related to the degree of alteration. The zone has
been noted in outcrop for a strike distance of 500 metres, with best outcrop grab

P&E Mining Consultants Inc. Page 34 of 110
Mountain Lake Resources Inc. Glover Island Gold Property Report No. 244
values of 4.1 g/t gold (unverified historic value). A single short drill hole was
drilled underneath the original outcrop showing. It intersected widespread weakly
anomalous gold values, with a best value of 1 metre of 3.46 g/t gold (unverified
historic value). The mineralization is open in all directions.
vii) Rusty Vein: This showing straddles the Meadow Brook Fault, and is located 900
metres northeast along strike from Line 1500. Mineralization is associated with
quartz-iron carbonate alteration in felsic lithologies of the Tuckamore Formation,
and with iron carbonate-quartz-talc-fuchsite alteration of Kettle Pond Formation
lithologies on the other side of the fault. The zone is exposed in six backhoe
trenches over a 170-metre distance. Chip-channel sampling of the trenches
returned best values of 11.3 g/t gold over 2 metres, and 6.8 g/t gold over 2 metres
(unverified historic values). Two short diamond drill holes were drilled on the
zone. Drill hole RV.1 was drilled in the conglomerates west of the fault and
intersected 0.5 g/t gold over 3 metres. RV.2 was drilled east of the fault and
intersected 0.95 g/t gold over 4.5 metres; best value 1.79 g/t gold over 1.5 metres
(unverified historic values). Mineralization remains open in all directions.
viii) Meadow Brook: The showing is located 800 metres northeast along strike from
Rusty Vein. Mineralization is associated with silicified and iron carbonate altered
felsite of the Tuckamore Formation, immediately east of the Meadow Brook
Fault. Seven backhoe trenches expose the zone over a width of 50 metres.
Channel sampling of trenches returned a best value of 3.08 g/t gold over 5.1
metres (unverified historic value). Two short diamond drill holes were drilled in
the trenched area. MBZ.1 intersected weak sporadic gold values over a 20-metre
interval, with best value of 1.93 g/t gold over 0.4 m (unverified historic value).
MBZ.2 was collared near the Meadow Brook Fault and encountered mainly
conglomerates west of the fault. The prospect is open in all directions.
ix) 2700 Zone: The 2700 Zone is located a further 1,600 m along strike to the
northeast. Mineralization occurs in typical silicified and iron carbonate altered
Tuckamore Formation lithologies immediately east of the Meadow Brook Fault;
some stockwork quartz veining is also associated with the alteration. Seven
backhoe trenches expose mineralization over a distance of 230 metres and over
widths from 15 to 30 metres. Channel sample values include 4.93 g/t gold over
1.9 metres and 1.47 g/t gold over 11.6 metres (unverified historic values). Three
diamond drill holes were completed over a 90-metre strike length of the deposit.
All intersected a thick zone of low gold values (up to 36 metres), with best
intervals of 1.1 g/t gold over 20 metres in DDH.2700-1; and 5.47 g/t gold over 2.8
m in DDH.2700-3 (unverified historic values). The 2700 Zone mineralization
remains open in all directions.
x) Tomahawk: The prospect consists of two mineralized areas separated by 350
metres of strike, and starting 450 metres northeast along strike from the 2,700
Zone. Gold mineralization occurs in typical altered Tuckamore Formation
adjacent to the Meadow Brook fault. Five backhoe trenches expose a 50-metre
length and 30-metre width of mineralization at the southwest area. The best trench
channel sample assayed 2.9 g/t gold over 2.3 metres (unverified historic value).
The northeast area consists of a number of mineralized outcrops; no trenching has
been done in this area. No diamond drilling has been done on either area.
xi) Lucky Smoke: The Lucky Smoke deposit is located 800 metres northeast along
strike from Tomahawk, and is situated in the same relative position immediately
east of the Meadow Brook Fault. Mineralization is similar to the LPSE zone in
that massive aphanitic silicification is volumetrically significant, although

P&E Mining Consultants Inc. Page 35 of 110
Mountain Lake Resources Inc. Glover Island Gold Property Report No. 244
“chicken-wire” style in-situ brecciation has not been noted. Fine-grained
“felsites” are also present, locally with silicification and iron carbonate alteration
and related elevated gold values. Very fine-grained visible gold has been noted in
the mineralized zones. Backhoe trenching and eight diamond drill holes expose
mineralization over a 100 metre length, a 50-metre width, and to 120 metres
vertical depth; mineralization is open in all directions. All drill holes intersected
gold mineralization. The intersections include 10.18 g/t gold over 8 metres in
LS.1, 25 metres below a surface trench intersection of 5.9 g/t gold over 9 metres.
Drill hole LS.8 cut the thickest intersection at 42.45 metres of 0.95 g/t gold,
including 1.48 g/t over 7 metres and 2.17 g/t over 11 m (all unverified historic
values). A number of trenches expose visibly mineralized felsite northward
toward the Keystone Prospect, suggesting that these zones may be contiguous.
Assay data for these trenches is not available, although channel sample cuts are
visible in the trenches.
xii) Keystone: The Keystone prospect is located 300-400 m northeast along strike
from Lucky Smoke. It was discovered by Noranda Exploration Company, Limited
in the late 1980’s. Mineralization is typical of all the prospects north of Lunch
Pond. A channel sample across the showing assayed 3.74 g/t gold over 4 metres.
A single diamond drill hole underneath the showing intersected a best zone of
1.65 g/t gold over 4 metres (all values unverified historic values).
xiii) Jacamar: This prospect was also discovered by Noranda, and is situated
approximately 60 m east across strike from Keystone. Two parallel zones of
mineralization was exposed by trenching, with channel sample values of 3.34 g/t
gold over 3.5 metres, and 8.96 g/t gold over 3 metres respectively (unverified
historic values). Two short diamond drill holes were drilled 50 metres apart,
intersecting several low grade zones, with best value of 3.29 g/t gold over 1.1
metres (unverified historic values).
7.8 BASE METAL PROSPECTS
i) Rusty Trickle: Felsic volcanics at the south end of the property host a major
VMS-style alteration zone characterized by strong silica-sericite-pyrite-chlorite
alteration, with sodium depletion and barium enrichment (Barbour, 1998, Basha,
2001). The alteration zone has been traced over a length of 800 metres and a
thickness up to 160 m. It contains up to 20% stringers of pyrite-sphalerite-
chalcopyrite-galena.
ii) Grab samples of mineralization assayed as high as 12.9% zinc, 1.58% copper,
1.16% lead and 15.6 g/t silver (unverified historic values). A number of untested
EM conductors are spatially associated with the alteration zone. No diamond
drilling has been done on this prospect.
iii) Other Mineralization: Massive aphanitic felsic volcanics at the north end of the
property, north of Jacamar, host frequent stringers and pods of massive pyrite.
Grab samples of this mineralization contained only traces of base metals. Seven
hundred metres northeast of Meadow Brook is a conformable metre-thick band of
massive pyrrhotite-pyrite-graphite. Grab samples of this zone also contained only
traces of base metals.
P&E Mining Consultants Inc. Page 36 of 110
Mountain Lake Resources Inc. Glover Island Gold Property Report No. 244
8.0 DEPOSIT TYPES
Gold mineralization on Glover Island resembles typical orogenic (shear-hosted mesothermal)
deposits. The mineralization can be divided into two classifications based on host lithology and
style of mineralization. These are: (i) Kettle Pond hosted; historically “quartz vein type”, and (ii)
Tuckamore hosted; historically “felsite type”. Both classifications show a spatial association with
F2 folds, share some similar alteration features, and have an association of gold with pyrite that
occurs along late fractures that commonly contain black residua seams resulting from pressure
dissolution. The two types of mineralization are considered to be cogenetic, with their
differences resulting from the contrasting competencies of the host lithologies.
i) Kettle Pond hosted: Gold mineralization hosted by the Kettle Pond Formation
occurs in massive white quartz vein bodies that are highly irregular in shape and
variable in strike extent and width (Discovery, Lunch Pond and Lunch Pond
North veins; Figure 7.8). The quartz is ubiquitously fractured, with a mosaic of
irregular black pressure dissolution lines and seams that are partly stylolitic.
Visible free gold occurs in late, clear, very thin (1-3 mm) parallel veins that
postdate the main quartz phase. Gold is also associated with minor pyrite within
the veins. Very high gold values occur in larger aggregates or masses of fine
grained pyrite hosted by the veins. The overall pyrite content of the veins is less
than 0.5%; other sulphide minerals occur only in trace amounts. The quartz veins
occur broadly within the foliation, and are commonly folded and boudinaged.
Asymmetries of parasitic mesocopic F2 folds in the area of the veins indicate a
spatial association between veins and decametric scale F2 fold closures. While the
observed strike extent of the main veins does not exceed 25 metres, soil
geochemical gold anomalies suggest that veins may be stacked in narrow zones
that extend for hundreds of metres. The veins are associated with extensive Fe-
carbonate, talc and fuchsite alteration in the host lithologies.
ii) Tuckamore hosted: Gold mineralization hosted by the Tuckamore Formation is
more variable in character, but is generally characterized by silicification with
volumetrically less quartz vein component (Kettle Pond Brook, Kettle Pond
South, LPC, Lunch Pond South Extension, Lunch Pond, Line 1500, Rusty Vein,
Meadow Brook, Tomahawk, 2700 Zone, Lucky Smoke, Keystone, and Jacamar;
Figure 7.8). A common feature of all prospects is that they occur near the base of
the Tuckamore Formation, immediately overlying a D1 or D2 thrust surface.
Mineralization is mainly hosted by the sequence of thinly intercalated to
laminated felsic and mafic tuffs. Thin units of very fine-grained, intrusive-
textured quartzo-feldspathic rocks (aplites) are common within the mineralized
sequence northeast of Lunch Pond; hence the historical “felsite type”
classification. Silicification occurs as fragments in D2 fault breccias, is not folded
by F2, but is folded by F3, suggesting that it occurred late during the D2 event.
Massive silicification is generally cut by black pressure dissolution lines and
seams, which locally produce a “chicken wire” style in-situ breccia. A spatially
more extensive iron-carbonate alteration predates the silicification. Gold is
associated with pyrite that fills late fractures in the silicified rock. The gold occurs
as tiny grains within pyrite crystals or along crystal margins; coarser visible gold
is rare. Pyrite content of the mineralized zones rarely exceeds 1%, and is
generally less than 0.5%. Chalcopyrite occurs in trace amounts; other sulfides are
very rare or absent.

P&E Mining Consultants Inc. Page 37 of 110
Mountain Lake Resources Inc. Glover Island Gold Property Report No. 244
9.0 EXPLORATION
Mountain Lake conducted two drilling programs on the property, one in 2010 and one in 2011.
This work is summarized in Section 10. No other work was carried out during this stage of
exploration.
P&E Mining Consultants Inc. Page 38 of 110
Mountain Lake Resources Inc. Glover Island Gold Property Report No. 244
10.0 DRILLING
During 2011 and 2012 Mountain Lake engaged in two drilling campaigns (Summer & Fall,
2011, and Winter, 2012) and a location survey for both historical and Mountain Lake drill hole
collars (excluding historical drill holes where the collars had been removed or covered and holes
LPSE-12-63 to LPSE-12-74 which were completed after the survey). The survey results were
provided to Mountain Lake in UTM Nad 83 coordinates.
10.1 PROCEDURES AND SURVEYS
The track-mounted, self-propelled, Duralite 800 diamond drill and motorized track carrier were
flown in pieces from Lady Slipper Road to the LPSE drill site on August 20th and 21st, 2011 and
reassembled on Glover Island. The first drill hole (LPSE-11-34) was collared on August 25th,
2011. Angled drill holes on the east grid were drilled at an azimuth of 350˚ true north while those
on the west grid were drilled at a 020˚ azimuth. Slight adjustments were made where necessary
in these azimuth directions to allow hole deviation such that the intersected mineralized sections
would lie as close to the section lines as possible. Dips ranged from a low of 45˚ for shallow
holes to a high of 68˚ for deeper holes. Down hole directional measurements were taken at
regular ~50 m intervals using a Reflex survey instrument.
During the 2011 Summer and Fall drilling all core was strapped in lots of 15-25 boxes each and
flown via helicopter (Universal Helicopters based in Pasadena) from each drill hole site back to
the Kettle Pond camp where it was prepared for logging and sampling. Subsequently, the core
was cross piled for stability and then transferred to core racks constructed at the camp site.
Approximately 70% of all Mountain Lake core has currently been transferred to the core racks.
Thirty-five historic diamond drill holes were drilled on the Lunch Pond South Extension deposit
(LPSE-1 to 33, plus LPSE-28-03 and 29-03) in addition to Mountain Lake drilling and combined
are the focus of this report and the current resource estimate (Figure 10.1).
10.2 HISTORICAL DRILL HOLES
The historical holes identified mineralization along 1 kilometre of strike. Drill holes were
primarily focused along 300 m of strike, from 9950E to 10250E on current drill grid coordinates.
This section represents the thickest and most continuous area of mineralization. Mineralization
continues eastward to 10500E and westward to 9300W, but is not as thick and individual zones
appear less continuous. Historical hole locations at LPSE are indicated below in Table 10.1.

P&E Mining Consultants Inc. Page 39 of 110
Mountain Lake Resources Inc. Glover Island Gold Property Report No. 244
Figure 10.1 Distribution of Historical and Mountain Lake Drill Holes
TABLE 10.1
HISTORICAL DRILL HOLES
Drill Hole Easting (Nad 83) Northing (Nad 83) Elevation (m) Depth (m)
LPSE-01 441435.3 5394738.6 414.76 127.71
LPSE-02 441562.521 5394579.618 417.949 129.84
LPSE-03 441382.7 5394738.6 412.2 106.68
LPSE-04 441324.446 5394734.033 411.892 124.05
LPSE-05 441283.3 5394704.0 413.8 87.78
LPSE-06 441347.243 5394533.035 421.559 221.59
LPSE-07 441455.218 5394549.502 415.995 227.69
LPSE-08 441608.2 5394607.2 419.4 265.18
LPSE-09 441632.3 5394709.9 424.1 122.83
LPSE-10 441248.2 5394590.1 418 102.72
LPSE-11 441195.646 5394577.559 422.005 117.35
LPSE-12 441150.416 5394543.061 425.869 174.04
LPSE-13 440953.247 5394652.556 431.634 89.00
LPSE-14 440881.471 5394633.634 440.805 135.64
LPSE-15 440670.4 5394832.1 441.1 75.29
LPSE-16 441590.7 5394632.9 419.4 291.69
LPSE-17 441820.7 5394781.9 424 100.28
LPSE-18 441712.3 5394838.8 429.2 142.34
LPSE-19 441521.372 5394768.239 421.627 64.01
LPSE-20 441512.6 5394823.5 417.9 156.36

P&E Mining Consultants Inc. Page 40 of 110
Mountain Lake Resources Inc. Glover Island Gold Property Report No. 244
TABLE 10.1
HISTORICAL DRILL HOLES
Drill Hole Easting (Nad 83) Northing (Nad 83) Elevation (m) Depth (m)
LPSE-21 441458.653 5394523.052 419.101 314.86
LPSE-22 441473.342 5394753.853 419.826 114.30
LPSE-23 441545.1 5394753.9 421.9 57.61
LPSE-24 441570.52 5394706.702 439.868 80.47
LPSE-25 441568.715 5394703.953 440.267 77.11
LPSE-26 441535.5 5394588.0 419.7 107.29
LPSE-27 441506.533 5394603.322 421.603 68.28
LPSE-28 441010.341 5394619.719 429.427 88.70
LPSE-28-03 441327.601 5394518.999 424.208 281.33
LPSE-29 441066.762 5394586.681 426.104 106.68
LPSE-29-03 441447.6 5394751.2 414.8 135.62
LPSE-30 441306.21 5394529.213 423.451 231.34
LPSE-31 441410.491 5394502.474 425.167 398.37
LPSE-32 440969.362 5394555.049 437.147 196.29
LPSE-33 440667.6 5394664.7 443.6 192.94
10.3 MOUNTAIN LAKE DRILL HOLES
Diamond drilling on the deposit was continued by Mountain Lake Resources Inc. in 2011-12.
Results from all of these drill holes, LPSE.11-34 to LPSE.12-74 are included in the resource
estimate. Drilling was concentrated in the main area of mineralization from 9800E to 10250E,
with planned intercepts on 50-metre centers throughout the zone. The zone was delineated down
to 230 m vertical depth; deepest intersection at 270 metres vertical depth. Several holes were
drilled west of 9800E to improve the continuity of mineralization in that direction, and to see if
some of it could be pulled into the resource estimate.
TABLE 10.2
MOUNTAIN LAKE DRILL HOLES FOR 2011 AND 2012
Drill Hole Easting (Nad 83) Northing (Nad 83) Elevation (m) Depth (m)
LPSE-11-34 441542.223 5394627.269 426.408 311
LPSE-11-35 441531.642 5394684.557 438.973 124
LPSE-11-36 441493.684 5394624.54 423.268 205
LPSE-11-37 441498.102 5394589.438 419.28 213.5
LPSE-11-38 441442.544 5394603.984 418.389 189
LPSE-11-39 441400.59 5394572.067 415.816 200
LPSE-11-40 441407.24 5394531.179 419.735 269
LPSE-11-41 441396.256 5394596.994 417.087 164
LPSE-11-42 441334.469 5394638.568 416.618 116
LPSE-11-43 441342.838 5394567.733 417.306 239
LPSE-11-44 441352.933 5394484.532 430.348 337
LPSE-11-45 440982.416 5394554.618 435.223 173
LPSE-11-46 440896.657 5394623.601 439.947 171
LPSE-11-47 441302.362 5394553.439 419.744 188
LPSE-11-48 441313.251 5394482.587 430.94 293
LPSE-11-49 441265.05 5394478.682 431.506 315

P&E Mining Consultants Inc. Page 41 of 110
Mountain Lake Resources Inc. Glover Island Gold Property Report No. 244
LPSE-11-50 441253.807 5394542.856 423.686 205
LPSE-11-51 441202.076 5394533.367 426.646 176
LPSE-11-52 441156.179 5394528.411 428.314 206
LPSE-11-53 441417.222 5394462.139 436.495 367
LPSE-11-54 441095.9 5394546.764 427.705 170
LPSE-11-55 441388.663 5394645.537 418.272 95
LPSE-11-56 441552.849 5394556.858 415.449 338
LPSE-11-57 441417.282 5394461.764 436.507 463
LPSE-11-58 441595.994 5394569.335 415.506 449
LPSE-11-59 441212.2 5394473.926 434.291 319
LPSE-11-60 441504.661 5394541.431 414.095 331
LPSE-11-61 441212.313 5394473.317 434.31 364
LPSE-11-62 441518.841 5394498.246 417.383 410
LPSE-12-63* 441163 5394471 443 338.8
LPSE-12-64* 441105 5394490 437 245
LPSE-12-65* 440892 5394514 461 275
LPSE-12-66* 440861 5394562 455 251
LPSE-12-67* 440813 5394581 457 212.47
LPSE-12-68* 441024 5394541 432 226
LPSE-12-69* 441010 5394489 436 290.3
LPSE-12-70* 440795 5394648 451 154
LPSE-12-71* 440746 5394664 451 139.19
LPSE-12-72* 440782 5394603 454 212
LPSE-12-73* 440734 5394619 453 184
LPSE-12-74* 441725 5394778 411 154
*Indicated Nad 83 UTM coordinated were taken with a Garmin handheld GPS and may be limited to accuracies in
the order of +/- 4m.
The gold grades and intersection widths of the current drilling correlated very well with those of
the adjacent historic drill holes. For this reason Mountain Lake Resources Inc. did not twin any
of the historic drill holes.
10.4 SPECIFIC GRAVITY
Specific gravity measurements were carried out at Mountain Lake’s core logging facility using
an A&D GF6100 scale with a readability of 0.01g. A table of 2012 specific gravity
measurements is shown in Table 10.3 below.

P&E Mining Consultants Inc. Page 42 of 110
Mountain Lake Resources Inc. Glover Island Gold Property Report No. 244
TABLE 10.3
SPECIFIC GRAVITY DATA
Drill Hole From
(m)
To
(m) SG
%
Sulfide Rock Type
LPSE-11-39A 157.65 157.76 2.664
Silicified Mafic Volcanic
LPSE-11-39A 160.00 160.11 2.705
Silicified Mafic/Breccia
LPSE-11-39A 162.80 162.97 2.693
Tuckamore banded Felsic
LPSE-11-39A 165.50 165.66 2.773
Mafic Volcanic
LPSE-11-39A 169.50 169.60 2.677
Breccia w/ ~1% Py
LPSE-11-39A 170.00 170.13 2.643
Silicified Mafic/Breccia
LPSE-11-39A 189.88 190.03 2.799
Mafic/Diabase
LPSE-11-39A 191.50 191.65 2.758
Glover Fm - Mafic Volcanic
LPSE-11-60 280.00 280.16 2.719
Carbonitized Mafic micro breccia
LPSE-11-60 299.30 299.48 2.798
Tuckamore Mafic Volcanic
LPSE-11-62 6.00 6.12 2.659
Qtz-Feld Crystal Tuff
LPSE-11-62 89.10 89.24 2.770
Tuckamore Mafic Volcanic
LPSE-11-62 133.50 133.62 2.636
Intermediate to Felsic Flow
LPSE-11-62 153.85 153.98 2.809
Mafic Volcanic Tuff
LPSE-11-62 163.05 163.14 2.713 tr Quartz Breccia
LPSE-11-62 170.65 170.78 2.675 tr Quartz Breccia
LPSE-11-62 197.50 197.67 2.658 tr Alteration Zone
LPSE-11-62 208.90 209.03 2.673 tr Alteration Zone
LPSE-11-62 219.70 219.83 2.654
Alteration Zone/ Silicified Zone
LPSE-11-62 249.90 250.03 2.697
Felsic Tuff
LPSE-11-62 272.05 272.17 2.747
Mafic Volcanic Tuff
LPSE-11-62 293.55 293.70 2.766
Mafic Volcanic Tuff
LPSE-12-63 94.21 94.30 2.697
Mafic Volcanic Tuff
LPSE-12-63 96.52 96.64 2.645
Felsic Tuff
LPSE-12-63 145.08 145.16 2.809
Diabase Dike
LPSE-12-63 158.30 158.47 2.673
Felsic Volcanic Flow
LPSE-12-63 191.25 191.36 2.684
Felsic Tuff
LPSE-12-63 200.00 200.12 2.785
Mafic Volcanic Tuff
LPSE-12-63 241.11 241.21 2.670 3 Felsic Volcanic Flow
LPSE-12-63 229.15 229.43 2.787
Mafic Volcanic Tuff
LPSE-12-63 242.15 242.24 2.658
Felsic Volcanic Flow
LPSE-12-63 265.59 265.72 2.652 tr Quartz Breccia
LPSE-12-63 289.89 290.00 2.752 tr Quartz Breccia
LPSE-12-63 307.88 308.00 2.665
Quartz Breccia
LPSE-12-63 329.03 329.13 2.803 tr Mafic Volcanic
LPSE-12-63 338.54 338.65 2.972
High Level Mafic Intrusive
LPSE-12-64 17.63 17.78 2.703
Mafic Tuff
LPSE-12-64 28.47 28.58 2.832 5 Mafic Tuff
LPSE-12-64 34.44 34.56 2.665
Felsic Tuff
LPSE-12-64 44.57 44.69 2.654
Felsic Tuff
LPSE-12-64 53.20 53.32 2.658
Felsic Tuff
LPSE-12-64 62.20 62.35 2.662 2 Felsic Tuff
LPSE-12-64 81.62 81.73 2.621
Silicified Felsic Intrusive

P&E Mining Consultants Inc. Page 43 of 110
Mountain Lake Resources Inc. Glover Island Gold Property Report No. 244
TABLE 10.3
SPECIFIC GRAVITY DATA
Drill Hole From
(m)
To
(m) SG
%
Sulfide Rock Type
LPSE-12-64 89.06 89.17 2.792
Diabase Dike
LPSE-12-64 106.22 106.38 2.603
Silicified Felsic Intrusive
LPSE-12-64 122.10 122.22 2.642
Silicified Felsic Tuff
LPSE-12-64 130.47 130.60 2.784
Mafic Tuff
LPSE-12-64 155.48 155.63 2.645 tr Felsic Tuff
LPSE-12-64 177.29 177.42 2.775
Carbonatized Mafic Tuff
LPSE-12-64 190.68 190.79 2.672 tr Silicified/Brecciated Felsic Volcanic
LPSE-12-64 205.02 205.14 2.700
Silicified/Brecciated Felsic Volcanic
LPSE-12-64 212.00 212.14 2.800 tr Silicified/Brecciated Mafic Volcanic
LPSE-12-64 217.78 217.94 2.658 1 Quartz Breccia
LPSE-12-64 225.86 225.96 2.829 1 Silicified/Brecciated Mafic Volcanic
LPSE-12-64 227.97 228.10 2.716 tr Quartz Breccia
LPSE-12-64 232.87 233.00 2.808
Mafic Volcanic
LPSE-12-64 243.17 243.31 2.875
Mafic Volcanic
LPSE-12-65 17.13 17.28 2.815
Mafic Tuff
LPSE-12-65 28.80 28.93 2.936
Mafic Flow
LPSE-12-65 39.53 39.65 2.888 tr Mafic Tuff
LPSE-12-65 50.00 50.14 2.796
Mafic Tuff
LPSE-12-65 62.00 62.12 2.754
Silicified Mafic Volcanic
LPSE-12-65 80.57 80.67 2.828
Diabase Dike
LPSE-12-65 88.86 88.98 2.781
Mixed Mafic/Felsic Volcanic
LPSE-12-65 94.89 95.00 2.636
Laminated Felsic Tuff
LPSE-12-65 108.49 108.61 2.806 tr Silicified Mafic Volcanic
LPSE-12-65 113.71 113.86 2.648 1 Quartz Breccia
LPSE-12-65 120.81 120.93 2.722 1 Silicified Mafic Volcanic
LPSE-12-65 127.21 127.31 2.689 4 Quartz Breccia
LPSE-12-65 137.12 137.26 2.842 3 Silicified Mafic Volcanic
LPSE-12-65 144.20 144.33 2.640
Felsic Tuff
LPSE-12-65 158.95 159.07 2.727 1 Silicified Mafic Volcanic
LPSE-12-65 162.21 162.31 2.676 3 Quartz Breccia
LPSE-12-65 169.90 170.00 2.636
Quartz Breccia
LPSE-12-65 177.29 177.42 2.788 tr Diabase Dike
LPSE-12-65 182.00 182.14 2.772 tr Silicified Mafic Volcanic
LPSE-12-65 192.25 192.36 2.654
Silicified Zone - Breccia
LPSE-12-65 200.00 200.18 2.694
Silicified Zone - Breccia
LPSE-12-65 210.08 210.20 2.650 1 Silicified Zone - Breccia
LPSE-12-65 222.06 222.18 2.673
Silicified Zone - Breccia
LPSE-12-65 236.04 236.14 2.678
Silicified Mafic Volcanic (Felsic Bnd)
LPSE-12-65 239.16 239.28 2.722 1 Silicified Mafic Volcanic
LPSE-12-65 258.71 258.85 2.804
Mafic Volcanic
LPSE-12-65 274.49 274.63 2.800
Mafic Volcanic
LPSE-12-66 9.45 9.58 2.728
Mafic Flow
LPSE-12-66 20.37 20.49 2.786
Mafic Flow
LPSE-12-66 32.91 33.02 2.748
Silicified Mafic Volcanic

P&E Mining Consultants Inc. Page 44 of 110
Mountain Lake Resources Inc. Glover Island Gold Property Report No. 244
TABLE 10.3
SPECIFIC GRAVITY DATA
Drill Hole From
(m)
To
(m) SG
%
Sulfide Rock Type
LPSE-12-66 40.05 40.17 2.640
Silicified Felsic Intrusive
LPSE-12-66 53.81 53.94 2.660
Felsic/Intermediate Tuff
LPSE-12-66 71.11 71.21 2.713
Silicified Mafic Volcanic
LPSE-12-66 91.66 91.78 2.784 tr Silicified Mafic Volcanic
LPSE-12-66 120.13 120.27 2.800
Silicified Mafic Volcanic
LPSE-12-66 131.76 131.89 2.696 tr Silicified Zone - Mafic Breccia
LPSE-12-66 133.55 133.68 2.688 3 Silicified Zone - Felsic Breccia
LPSE-12-66 141.41 141.51 2.841
Diabase Dike
LPSE-12-66 144.81 144.92 2.662 tr Silicified Zone - Felsic Breccia
LPSE-12-66 158.39 158.50 2.825
Diabase Dike
LPSE-12-66 169.73 169.84 2.727 tr Silicified Mafic Volcanic
LPSE-12-66 179.55 179.66 2.657 tr Silicified Zone - Felsic Breccia
LPSE-12-66 188.55 188.66 2.652 tr Silicified Zone - Felsic Breccia
LPSE-12-66 202.26 202.39 2.645 tr Silicified Zone - Felsic Breccia
LPSE-12-66 209.00 209.11 2.654 tr Silicified Zone - Felsic Breccia
LPSE-12-66 212.67 212.78 2.817 tr Silicified Mafic Tuff
LPSE-12-66 223.38 223.49 2.777 tr Silicified Mafic Tuff
LPSE-12-66 231.74 231.86 2.800 1 Laminated Mafic Tuff
LPSE-12-66 238.89 239.00 2.913 tr Plagioclase Porphyritic Mafic Flow
LPSE-12-66 247.89 248.00 2.912 tr Laminated Mafic Tuff
LPSE-12-66 250.07 250.19 2.958 tr Plagioclase Porphyritic Mafic Flow
LPSE-12-67 17.35 17.46 2.758
Silicified Mafic Volcanic
LPSE-12-67 32.48 32.58 2.789
Mixed Mafic/Felsic Volcanic
LPSE-12-67 51.32 51.44 2.682
Laminated Felsic Tuff
LPSE-12-67 58.97 59.10 2.797
Diabase Dike
LPSE-12-67 71.43 71.56 2.704
Epidotized Fault Breccia
LPSE-12-67 79.67 79.79 2.780
Mixed Mafic/Felsic Volcanic
LPSE-12-67 83.39 83.55 2.724
Felsic Volcanic
LPSE-12-67 89.00 89.11 2.677
Carbonate Felsic Breccia
LPSE-12-67 90.39 90.52 2.650
Silicified Zone - Felsic Breccia
LPSE-12-67 107.79 107.91 2.843 1 Silicified Mafic Volcanic
LPSE-12-67 118.19 118.32 2.669 tr Mixed Mafic/Felsic Volcanic
LPSE-12-67 123.11 123.22 2.661 2 Silicified Zone - Felsic Breccia
LPSE-12-67 130.73 130.86 2.683 3 Silicified Zone - Felsic Breccia
LPSE-12-67 139.00 139.10 2.699 tr Mixed Mafic/Felsic Volcanic
LPSE-12-67 152.33 152.43 2.656 tr Silicified Zone - Felsic Breccia
LPSE-12-67 159.50 159.66 2.773
Mixed Mafic/Felsic Volcanic
LPSE-12-67 171.07 171.18 2.654
Silicified Zone - Felsic Breccia
LPSE-12-67 179.92 180.04 2.667 1 Silicified Zone - Felsic Breccia
LPSE-12-67 184.49 184.67 2.726 5 Mixed Mafic/Felsic Volcanic
LPSE-12-67 208.01 208.14 2.756
Glover Formation Mafic Tuff
LPSE-12-67 211.00 211.10 2.778
Glover Formation Mafic Tuff
LPSE-12-67 212.36 212.46 2.870
Glover Formation Mafic Flow

P&E Mining Consultants Inc. Page 45 of 110
Mountain Lake Resources Inc. Glover Island Gold Property Report No. 244
10.5 SIGNIFICANT RESULTS
Drilling indicates that there are several continuous, possibly interconnecting lenses constituting
the LPSE mineralization. The Mountain Lake drill quickly recognized the presence of the
George’s Pond Fault forming the northern hanging wall boundary that juxtaposes the silicified
breccia mineralization against the barren mafic volcanics of the Glover Formation. Irrespective
of the degree of silicification, brecciation and overprint potassic and carbonate alteration (that are
all observed in the mineralized zones) it appears that the structurally lower zones have slightly
higher and more consistent grades. One aspect of the assay results is the relative uniformity and
consistency of gold grade with no large spikes prevalent in nugget vein style mineralization.
TABLE 10.4
SUMMARY OF MOUNTAIN LAKE DRILL RESULTS REPORTED IN NEWS RELEASES, 2011 AND
2012
DDH Section Grid From(m) To(m) Core Width True Width (m) Gold g/t
LPSE-11-34 10200E East 167.0 170.0 3.0 2.0 1.37
and
179.0 182.0 3.0 2.0 5.05
and
202.0 208.0 6.0 4.1 0.70
LPSE-11-36 10150E East 7.0 9.0 2.0 2.0 0.84
and
92.0 118.0 26.0 17.9 1.48
including
92.0 101.0 9.0 6.2 1.84
including
106.0 118.0 12.0 8.3 1.81
and
131.0 136.0 5.0 3.5 1.56
LPSE-11-37 10150E East 166.0 169.0 3.0 2.1 3.41
and
174.0 178.3 4.3 3.7 1.49
and
192.0 198.6 6.3 5.0 1.45
LPSE-11-38 10100E East 42.0 44.0 2.0 1.8 2.19
and
104.0 109.0 5.0 3.7 1.21
LPSE-11-39 10050E East 115.0 125.0 10.0 7.1 1.79
and
129.0 133.0 4.0 2.8 1.48
LPSE-11-
39A 10050E East 169.50 187.5 18 9.5 2.35
LPSE-11-40 10050E East 121.5 124.5 3 2.8 0.8
and
163.7 167.0 3.4 2.4 1.55
and
174.5 192.0 16.5 11.7 2.03
and
199.0 202.0 3 2.5 0.73
and
232.5 237.5 5.0 3.6 1.34
and
251.5 262.0 10.5 7.5 1.99
LPSE-11-41 10050E East 85.5 89.5 4 3.9 1.78
and
113.0 124.5 11.3 8.1 1.54
and
129.0 134.0 5 3.8 1.24
and
137.0 145.0 8.0 5.8 2.26
LPSE-11-42 10000E East 2.0 5.3 3.3 2.2 1.77
and
13.5 16.5 3.0 2.4 0.95
and
55.0 59.0 4.0 2.8 2.19

P&E Mining Consultants Inc. Page 46 of 110
Mountain Lake Resources Inc. Glover Island Gold Property Report No. 244
TABLE 10.4
SUMMARY OF MOUNTAIN LAKE DRILL RESULTS REPORTED IN NEWS RELEASES, 2011 AND
2012
DDH Section Grid From(m) To(m) Core Width True Width (m) Gold g/t
and
67.2 77.0 9.8 6.8 1.35
and
83.0 87.0 4.0 2.8 1.46
LPSE-11-43 10000E East 92.7 96.0 3.3 2.9 1.42
and
99.3 101.7 2.4 2.0 1.13
and
140.6 148.3 7.7 5.3 2.18
and
154.7 171.4 16.7 11.5 1.77
LPSE-11-44 10000E East 192.3 323.1 130.9 89.0 0.70
LPSE-11-45 9700E West 72.7 74.7 2.0 1.4 3.76
and
85.4 90.4 5.0 3.6 1.42
LPSE-11-46 9600W West 66.0 74.0 8.0 6.7 1.40
LPSE-11-47 9950E East 145.7 155.5 9.8 8.8 0.76
and
165.5 175.2 9.7 9.5 0.89
LPSE-11-48 9950E East 182.0 283.4 101.4 81.7 1.34
including
226 241 15 12 4.1
LPSE-11-49 9900E East 204.1 244.8 40.7 33.0 0.54
and
262.0 265.6 3.6 2.9 1.68
and
273.5 281 7.5 6.7 1.53
LPSE-11-50 9900E East 103.0 108.0 5.0 4.4 1.08
and
162.3 188.9 26.6 20.0 1.76
LPSE-11-52 9800E East 67.0 78.7 11.7 10.8 1.39
and
100.5 108.5 8.0 6.8 1.53
LPSE-11-53 10050E East 200.0 208.0 8.0 6.9 0.55
and
327.0 343.0 16.0 14.7 1.27
LPSE-11-54 9750E East 43.0 50.0 7.0 5.7 1.08
and
103.0 106.0 3.0 2.5 1.61
and
114.6 119.5 4.9 4.1 2.1
LPSE-11-55 10050E East 38.5 92.0 53.5 42.0 1.74
LPSE-11-56 10200E East 85.0 88.0 3.0 2.9 0.76
and
264.0 268.0 4.0 3.7 0.93
LPSE-11-57 10050E East 116.0 118.0 2.0 1.8 0.94
and
334.9 389.0 54.1 42.1 1.51
and
404.8 408.0 3.2 2.8 2.06
LPSE-11-58 10250E East 171.7 175.9 4.2 3.8 1.06
and
206.9 208.9 2 1.8 1.12
LPSE-11-59 9850E East 163.0 166.8 3.8 3.3 0.9
and
234.6 247.0 12.4 10.8 1.03
and
East 265.0 270.0 5.0 4.4 1.56
LPSE-11-60 10150E East 81.8 89.0 7.2 5.4 0.5
and
93.0 96.0 3.0 2.4 0.86
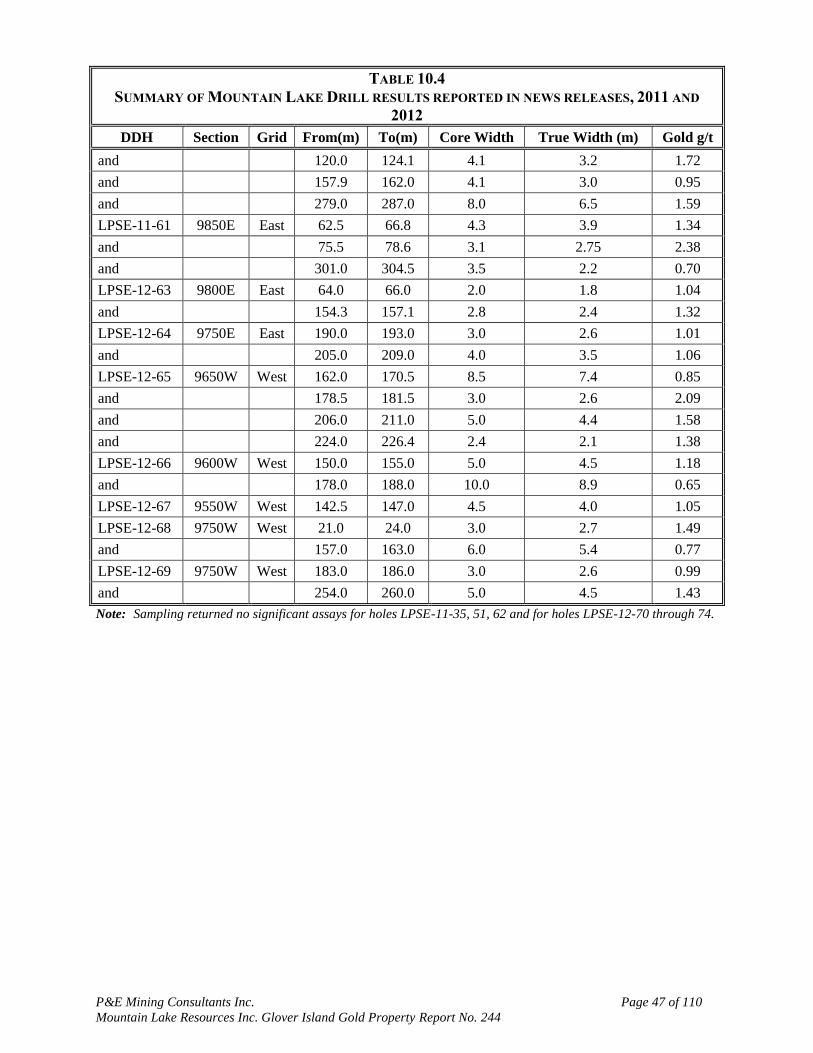
P&E Mining Consultants Inc. Page 47 of 110
Mountain Lake Resources Inc. Glover Island Gold Property Report No. 244
TABLE 10.4
SUMMARY OF MOUNTAIN LAKE DRILL RESULTS REPORTED IN NEWS RELEASES, 2011 AND
2012
DDH Section Grid From(m) To(m) Core Width True Width (m) Gold g/t
and
120.0 124.1 4.1 3.2 1.72
and
157.9 162.0 4.1 3.0 0.95
and
279.0 287.0 8.0 6.5 1.59
LPSE-11-61 9850E East 62.5 66.8 4.3 3.9 1.34
and
75.5 78.6 3.1 2.75 2.38
and
301.0 304.5 3.5 2.2 0.70
LPSE-12-63 9800E East 64.0 66.0 2.0 1.8 1.04
and
154.3 157.1 2.8 2.4 1.32
LPSE-12-64 9750E East 190.0 193.0 3.0 2.6 1.01
and
205.0 209.0 4.0 3.5 1.06
LPSE-12-65 9650W West 162.0 170.5 8.5 7.4 0.85
and
178.5 181.5 3.0 2.6 2.09
and
206.0 211.0 5.0 4.4 1.58
and
224.0 226.4 2.4 2.1 1.38
LPSE-12-66 9600W West 150.0 155.0 5.0 4.5 1.18
and
178.0 188.0 10.0 8.9 0.65
LPSE-12-67 9550W West 142.5 147.0 4.5 4.0 1.05
LPSE-12-68 9750W West 21.0 24.0 3.0 2.7 1.49
and
157.0 163.0 6.0 5.4 0.77
LPSE-12-69 9750W West 183.0 186.0 3.0 2.6 0.99
and
254.0 260.0 5.0 4.5 1.43
Note: Sampling returned no significant assays for holes LPSE-11-35, 51, 62 and for holes LPSE-12-70 through 74.

P&E Mining Consultants Inc. Page 48 of 110
Mountain Lake Resources Inc. Glover Island Gold Property Report No. 244
11.0 SAMPLE PREPARATION, ANALYSES AND SECURITY
All drill core was brought into the core logging facility and laid out on racks capable of handling
up to 24 boxes at once. All core was cleaned of dirt and reoriented so that the dominant regional
cleavage had a consistent orientation so as to facilitate measurement of lithology, alteration,
structures and mineralization. Core was then scribed with a wax pencil at 1 meter intervals with
top and bottom of box intervals noted. Logging, RQD measurements and selective specific
gravity measurements were then carried out. The geologist then clearly marked the sample
intervals for cutting, placing a sample tag at the top of the interval and writing the sample
number on the drill core. Each sample tag was placed in a plastic bag and stapled to the box at
the beginning of each sample interval.
The core boxes were then moved to the cutting room where each sample was cut in half with the
top half of the core placed in a plastic sample bag containing a duplicate tag. Each sample bag
was sealed to avoid subsequent potential of contamination. Lots of 10 samples (including blanks
and standards) were placed in rice bags, labelled and secured for transportation to the lab.
Specifics of each sample batch were recorded in a sample submission log book with a unique
tracking number that was also marked on the rice bag. Samples were flown from the camp, by
helicopter, to the airbase in Pasadena. The samples were then delivered to the laboratory, by
truck, by Mountain Lake employees.
Mountain Lake retained Eastern Analytical Limited (Eastern) as the principal lab.
Mountain Lake’s Quality Assurance / Quality Control (“QAQC”) program included the
submission of standards and blanks approximately every 25 samples.
Eastern is an independent minerals testing laboratory located in Springdale, Newfoundland. The
lab has implemented and maintains a Quality Management System (QMS) and is in the process
of obtaining ISO 17025 accreditation.

P&E Mining Consultants Inc. Page 49 of 110
Mountain Lake Resources Inc. Glover Island Gold Property Report No. 244
12.0 DATA VERIFICATIONS
12.1 SITE VISIT AND INDEPENDENT SAMPLING
Mr. Eugene Puritch, P. Eng., visited the Glover Island Property on November 14-15, 2011 for
the purpose of doing the site visit and completing an independent verification sampling program.
Twelve samples were collected from three diamond drill holes by taking a quarter split of the
half core remaining in the box. An effort was made to sample a range of grades.
At no time were any employees of Mountain Lake advised as to the identification of the samples
to be chosen during the visit.
The samples were selected by Mr. Puritch, and placed into sample bags which were sealed with
tape and placed in a larger bag.
The samples were brought by Mr. Puritch back to the P&E office in Brampton, ON. From there
they were sent by courier to AGAT Laboratories, (“AGAT”) in Mississauga for analysis.
AGAT has implemented a Quality Management System (QMS) designed to ensure the
production of consistently reliable data. The system covers all laboratory activities and takes into
consideration the requirements of ISO standards. AGAT maintains ISO registrations and
accreditations, which provide independent verification that a QMS is in operation at the location
in question. Most AGAT laboratories are registered or are pending registration to ISO
9001:2000.
Samples were analysed for gold using lead-collection fire assay with an AAS finish.
A comparison of the results is presented in Figure 12.1.
Figure 12.1 Glover Island Deposit Site Visit Sample Results for Gold
0.000
1.000
2.000
3.000
4.000
5.000
6.000
7.000
8.000
9.000
LPSE
-11
-41
LPSE
-11
-42
LPSE
-11
-41
LPSE
-11
-41
LPSE
-11
-40
LPSE
-11
-40
LPSE
-11
-40
LPSE
-11
-40
LPSE
-11
-40
LPSE
-11
-40
LPSE
-11
-40
LPSE
-11
-40
Glover Island Au Client
P&E Site Visit Au

P&E Mining Consultants Inc. Page 50 of 110
Mountain Lake Resources Inc. Glover Island Gold Property Report No. 244
12.2 MOUNTAIN LAKE QUALITY ASSURANCE/QUALITY CONTROL REVIEW
In 2010, Mountain Lake began drilling the Glover Island Project, and maintained Eastern
Analytical Limited as the principal lab.
Mountain Lake’s Quality Assurance / Quality Control (“QAQC”) program included the
submission of standards and blanks approximately every 25 samples.
Eastern Analytical is located in Springdale, Newfoundland. The lab has implemented and
maintains a Quality Management System (QMS) and is in the process of obtaining ISO 17025
accreditation.
12.3 PERFORMANCE OF CERTIFIED REFERENCE MATERIALS
Mountain Lake purchased four certified reference materials from Canadian Resources
Laboratories Ltd., of Langley, B.C., and inserted one or the other into the samples stream at a
rate of approximately 1:25. Standard CDN-GS-1F had a mean grade of 1.16 g/t Au, standard
CDN-GS-4B had a mean grade of 3.77 g/t Au, standard CDN-GS-8A had a mean grade of 8.25
g/t Au and standard CDN-GS-3E had a mean grade of 2.97 g/t Au.
There were a total of 116 values for standard CDN-GS-1F, 46 values for standard CDN-GS-4B,
17 values for standard CDN-GS-8A and 29 values for the standard CDN-GS-3E. Mountain Lake
monitored the results on a real-time basis as they were received from the lab.
P&E reviewed the results of all quality control samples inserted by Mountain Lake, as well as all
Lab internal quality control results. The data reported low as the majority of the standards
reported below the mean, although most data were within the warning limits of -2 standard
deviations. There were approximately 6 failures, all on the low side. These failures were isolated
and do not reflect the data as a whole. It is recommended that the performance of the standards
be reported to the laboratory so they can verify the calibration of the equipment used to measure
the lower Au values.
12.4 PERFORMANCE OF DUPLICATES
An evaluation of the field (1/4 core) was completed using a simple scatter plot. For the field
duplicates the precision was poor, which is completely consistent for a gold deposit and
particularly since the comparison is between ½ core and ¼ core.
12.5 PERFORMANCE OF BLANK MATERIAL
The blank material used by Mountain Lake was obtained locally from a barren granodiorite,
known locally as Bald Mountain. This material passed through all the prep and analytical stages
at the lab. There were 156 blank samples analyzed. All but one value was at the detection limit of
5 ppb. The sample in question was explained by a mix-up with standard CDN GS-4B being
mistakenly submitted in place of a blank. The gold value of this sample, 3458 ppb, is in line with
the mean value of standard CDN GS-4B.
P&E declares the data acquired and analyzed by Mountain Lake to be satisfactory for use in a
resource estimate.

P&E Mining Consultants Inc. Page 51 of 110
Mountain Lake Resources Inc. Glover Island Gold Property Report No. 244
13.0 MINERAL PROCESSING AND METALLURGICAL TESTING
No mineral processing or metallurgical testing has been done on the Glover Island property.

P&E Mining Consultants Inc. Page 52 of 110
Mountain Lake Resources Inc. Glover Island Gold Property Report No. 244
14.0 2012 RESOURCE ESTIMATE
14.1 INTRODUCTION
The purpose of this report section is to estimate the Mineral Resources of the Glover Island Gold
Project Lunch Pond Deposit in compliance with NI 43-101 and CIM standards. This resource
estimate was undertaken by Eugene Puritch, P.Eng. and Antoine Yassa, P.Geo. of P&E Mining
Consultants Inc. of Brampton Ontario. The effective date of this resource estimate is
April 3, 2012.
14.2 DATABASE
All drilling data were provided by Mountain Lake Resources Inc. in the form of Excel data files.
Thirty-three (33) drill cross sections were developed on two local grids, one looking Southeast
on a 105o azimuth on a 50 metre spacing named from 9,350-SE to 9,750-SE (9 sections) and the
other looking Northeast on an 80o azimuth on a 25 metre spacing named from 9,750-NE to
10,325 NE (24 sections).
The Gemcom database for this estimate was constructed from 66 surface drill holes of which
61 were utilized in the Lunch Pond resource calculation. All remaining data were not in the area
that was modeled for the resource estimate. A surface drill hole plan is shown in Appendix-I.
The database was verified in Gemcom with minor corrections made to bring it to an error free
status. The Assay Table of the database contained 3,781 Au assays. All drillhole survey and
assay values are expressed in metric units and grid coordinates are in a UTM system.
14.3 DATA VERIFICATION
Verification of assay database values was performed with original laboratory and electronically
issued certificates from the Eastern Analytical Ltd. laboratory in Springdale, Newfoundland.
Some minor errors were detected and corrected in the Gemcom database. The checked assays
represent 100% of the constrained data used in the resource estimate and 99% of the entire
database.
14.4 DOMAIN INTERPRETATION
The Lunch Pond Deposit mineralized constraining domain boundaries were determined from
lithology, structure and grade boundary interpretation from visual inspection of drill hole
sections. Nine domains were created named N1, N2, N3, N4, N5, N6, N7, N8 and QFP. These
domains were created with computer screen digitizing on drillhole sections in Gemcom by the
authors of this report. The domain outlines were influenced by the selection of mineralized
material above 0.5 g/t Au that demonstrated a lithological and structural zonal continuity along
strike and down dip. In some cases mineralization below 0.5 g/t Au was included for the purpose
of maintaining zonal continuity. Smoothing was utilized to remove obvious jogs and dips in the
domains and incorporated a minor addition of inferred mineralization. This exercise allowed for
easier domain creation without triangulation errors from solids validation.
On each section, polyline interpretations were digitized from drill hole to drill hole but not
typically extended more than 25 metres into untested territory. Minimum constrained true width
for interpretation was approximately 2 metres. Interpreted polylines from each section were

P&E Mining Consultants Inc. Page 53 of 110
Mountain Lake Resources Inc. Glover Island Gold Property Report No. 244
“wireframed” in Gemcom into 3-D domains. The resulting solids (domains) were used for
statistical analysis, grade interpolation, rock coding and resource reporting purposes. See
Appendix-II.
14.5 ROCK CODE DETERMINATION
The rock codes used for the resource model were derived from the mineralized domain solids.
The list of rock codes used is as follows:
Rock Code Description
0 Air 60 N6 Domain
10 N1 Domain 70 N7 Domain
20 N2 Domain 80 N8 Domain
30 N3 Domain 90 QFP Domain
40 N4 Domain 99 Waste Rock
50 N5 Domain
14.6 COMPOSITES
Length weighted composites were generated for the drill hole data that fell within the constraints
of the above-mentioned domains. These composites were calculated for Au over 1.0 m lengths
starting at the first point of intersection between assay data hole and hanging wall of the 3-D
zonal constraint. The compositing process was halted upon exit from the footwall of the
aforementioned constraint. Un-assayed intervals were set to ½ assay detection limit Au which
was deemed to represent the prolific low grade background gold value in the deposit, but at the
same time not introduce any mineralization above the open pit resource cut-off grade. Any
composites that were less than 0.25 m in length were discarded so as not to introduce any short
sample bias in the interpolation process. The constrained composite data were transferred to
Gemcom extraction files for the grade interpolation as X, Y, Z, Au, files.
14.7 GRADE CAPPING
Grade capping was investigated on the raw assay values in the database within the constraining
domains to ensure that the possible influence of erratic high values did not bias the database.
Extraction files were created for the constrained Au data. From these extraction files, log-normal
histograms were generated. See graphs in Appendix-III.

P&E Mining Consultants Inc. Page 54 of 110
Mountain Lake Resources Inc. Glover Island Gold Property Report No. 244
TABLE 14.1
AU GRADE CAPPING VALUES
Domain Capping Value Au g/t Number of Assays
Capped
Cumulative
% for
Capping
Raw Coefficient
of Variation
Capped
Coefficient of
Variation
N1 No Cap 0 100 0.64 0.64
N2 No Cap 0 100 1.06 1.06
N3 No Cap 0 100 0.85 0.85
N4 5.0 1 99.5 1.34 1.01
N5 No Cap 0 100 1.31 1.31
N6 12.5 5 99.3 1.73 1.31
N7 8.0 1 99.1 1.55 1.16
N8 No Cap 0 100 0.16 0.16
QFP No Cap 0 100 1.04 1.04
14.8 VARIOGRAPHY
A reasonable omnivariogram was developed for the combined constrained composites. See
omnivariogram in Appendix-IV.
14.9 BULK DENSITY
The bulk density used for the creation of a density block models was derived from site visit
samples taken by, Eugene Puritch, P.Eng. and analysed at Agat Laboratories in Mississauga,
Ontario. The average bulk density for the Lunch Pond Deposit resource was derived from
12 samples and determined to be 2.70 tonnes per cubic metre. Mountain Lake Resources Inc.
conducted their own on site wet immersion bulk density determination and arrived at an average
value of 2.72 tonnes per cubic metre from 12 samples.
14.10 BLOCK MODELING
The Lunch Pond Deposit resource model was divided into a block model framework containing
2,361,456 blocks that were 10m in X direction, 2.5 m in Y direction and 10 m in Z direction.
There were 138 columns (X), 342 rows (Y) and 46 levels (Z). The block model was not rotated.
Separate block models were created for rock type, density, percent, class and Au.
A percent block model was set up to accurately represent the volume and subsequent tonnage
that was occupied by each block inside the constraining domain. As a result, the domain
boundary was properly represented by the percent model ability to measure individual infinitely
variable block inclusion percentages within that domain.
The Au composites were extracted from the Microsoft Access database composite table into
separate files. Inverse distance cubed (ID3) grade interpolation was utilized. The first grade
interpolation pass was utilized for the Indicated classification and the second for Inferred. The
resulting Au grade blocks can be seen on the block model cross-sections and plans in Appendix-
V. Grade blocks were interpolated using the following parameters:
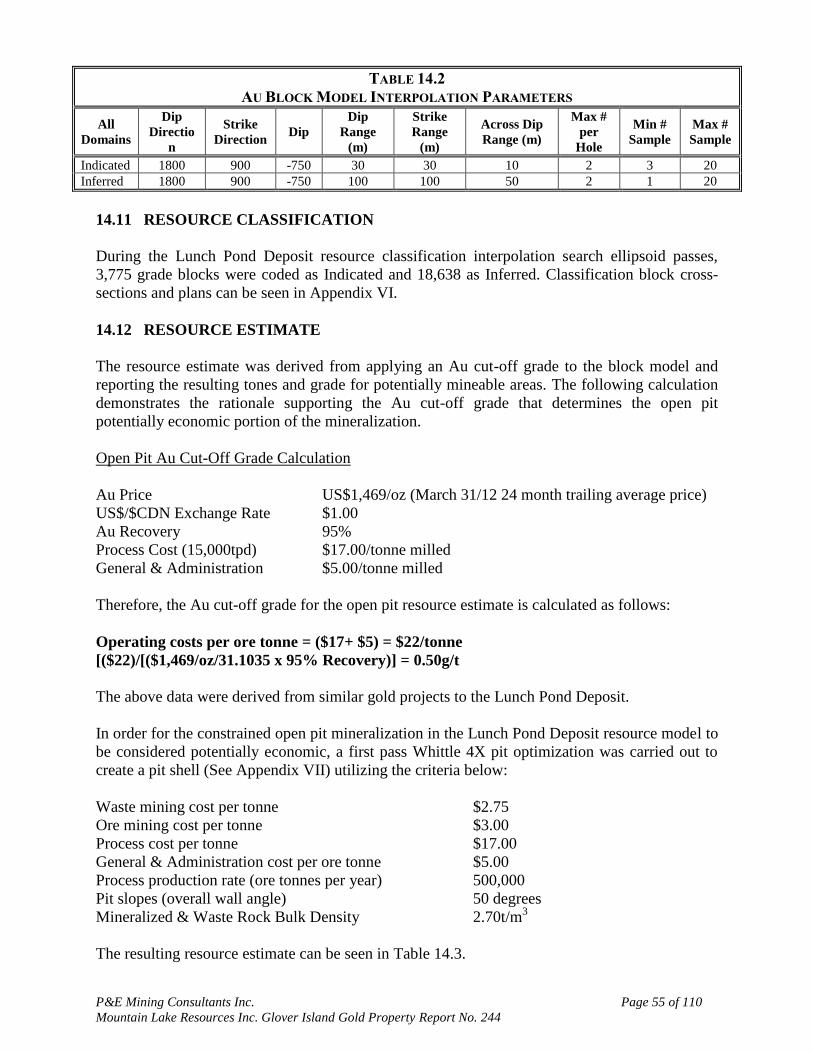
P&E Mining Consultants Inc. Page 55 of 110
Mountain Lake Resources Inc. Glover Island Gold Property Report No. 244
TABLE 14.2
AU BLOCK MODEL INTERPOLATION PARAMETERS
All
Domains
Dip
Directio
n
Strike
Direction Dip
Dip
Range
(m)
Strike
Range
(m)
Across Dip
Range (m)
Max #
per
Hole
Min #
Sample
Max #
Sample
Indicated 1800 900 -750 30 30 10 2 3 20
Inferred 1800 900 -750 100 100 50 2 1 20
14.11 RESOURCE CLASSIFICATION
During the Lunch Pond Deposit resource classification interpolation search ellipsoid passes,
3,775 grade blocks were coded as Indicated and 18,638 as Inferred. Classification block cross-
sections and plans can be seen in Appendix VI.
14.12 RESOURCE ESTIMATE
The resource estimate was derived from applying an Au cut-off grade to the block model and
reporting the resulting tones and grade for potentially mineable areas. The following calculation
demonstrates the rationale supporting the Au cut-off grade that determines the open pit
potentially economic portion of the mineralization.
Open Pit Au Cut-Off Grade Calculation
Au Price US$1,469/oz (March 31/12 24 month trailing average price)
US$/$CDN Exchange Rate $1.00
Au Recovery 95%
Process Cost (15,000tpd) $17.00/tonne milled
General & Administration $5.00/tonne milled
Therefore, the Au cut-off grade for the open pit resource estimate is calculated as follows:
Operating costs per ore tonne = ($17+ $5) = $22/tonne
[($22)/[($1,469/oz/31.1035 x 95% Recovery)] = 0.50g/t
The above data were derived from similar gold projects to the Lunch Pond Deposit.
In order for the constrained open pit mineralization in the Lunch Pond Deposit resource model to
be considered potentially economic, a first pass Whittle 4X pit optimization was carried out to
create a pit shell (See Appendix VII) utilizing the criteria below:
Waste mining cost per tonne $2.75
Ore mining cost per tonne $3.00
Process cost per tonne $17.00
General & Administration cost per ore tonne $5.00
Process production rate (ore tonnes per year) 500,000
Pit slopes (overall wall angle) 50 degrees
Mineralized & Waste Rock Bulk Density 2.70t/m3
The resulting resource estimate can be seen in Table 14.3.

P&E Mining Consultants Inc. Page 56 of 110
Mountain Lake Resources Inc. Glover Island Gold Property Report No. 244
TABLE 14.3
IN PIT RESOURCE ESTIMATE(1)(2)(3)
Classification Indicated Inferred
Cut-Off Au g/t Tonnes Au g/t Au oz Tonnes Au g/t Au oz
In Pit 0.50 g/t 993,000 1.72 54,700 1,703,000 1.59 87,300
(1) Mineral resources which are not mineral reserves do not have demonstrated economic viability. The estimate
of mineral resources may be materially affected by environmental, permitting, legal, title, taxation, socio-
political, marketing, or other relevant issues.
(2) The quantity and grade of reported Inferred resources in this estimation are uncertain in nature and there
has been insufficient exploration to define these Inferred resources as an Indicated or Measured mineral
resource and it is uncertain if further exploration will result in upgrading them to an Indicated or Measured
mineral resource category.
(3) Mineral resources were estimated using the Canadian Institute of Mining, Metallurgy and Petroleum (CIM),
CIM Standards on Mineral Resources and Reserves, Definitions and Guidelines prepared by the CIM
Standing Committee on Reserve Definitions and adopted by CIM Council
TABLE 14.4
IN PIT RESOURCE ESTIMATE CUT-OFF SENSITIVITY
Classification Indicated Inferred
In Pit Cut-Off Au g/t Tonnes Au g/t Au oz Tonnes Au g/t Au oz
1.0 691,601 2.14 47,473 1,158,319 1.99 74,035
0.9 758,703 2.03 49,518 1,274,620 1.89 77,575
0.8 815,008 1.95 51,044 1,396,936 1.80 80,933
0.7 863,149 1.88 52,200 1,493,615 1.73 83,268
0.6 935,466 1.79 53,716 1,598,884 1.66 85,487
0.5 992,710 1.72 54,737 1,703,456 1.59 87,299
0.4 1,028,670 1.67 55,264 1,788,157 1.54 88,536
0.3 1,061,659 1.63 55,637 1,835,938 1.51 89,072
0.2 1,096,868 1.59 55,895 1,870,737 1.49 89,377
0.1 1,113,976 1.56 55,979 1,889,223 1.47 89,470
TABLE 14.5
GLOBAL SENSITIVITY TO RESOURCE ESTIMATE
Classification Indicated Inferred
Cut-Off Au g/t Tonnes Au g/t Au oz Tonnes Au g/t Au oz
In Pit 0.50 g/t 1,281,000 1.61 66,400 4,434,000 1.38 196,900
14.13 CONFIRMATION OF ESTIMATE
As a test of the reasonableness of the resource estimates, the block models were queried at a 0.1
g/t Au cut-off grade with blocks in all classifications summed and their grades weight averaged.
This average is the average grade of all blocks within the mineralized domain. The values of the
interpolated grades for the block model were compared to the length weighted capped average
grades and average grade of composites of all samples from within the domains. See below.

P&E Mining Consultants Inc. Page 57 of 110
Mountain Lake Resources Inc. Glover Island Gold Property Report No. 244
TABLE 14.6
COMPARISON OF CAPPED WEIGHTED AVERAGE GRADE OF ASSAYS AND COMPOSITES
WITH TOTAL BLOCK MODEL AVERAGE GRADES
Data Type Au (g/t)
Capped Assays 1.28
Composites 1.21
Block Model 1.13
The comparison above shows the average grade of all the Au blocks in the constraining domains
to be similar to the weighted average of all capped assays and composites used for grade
estimation. The block model Au values will be more representative than the capped assays or
composites due to the block model’s 3D spatial distribution characteristics.
In addition, a volumetric comparison was performed with the block model volume of the model
blocks versus the geometric calculated volume of the domain solids.
Block Model Volume =2,572,732 m3
Geometric Domain Volume =2,581,164 m3
Difference = 0.33 %

P&E Mining Consultants Inc. Page 58 of 110
Mountain Lake Resources Inc. Glover Island Gold Property Report No. 244
15.0 MINERAL RESERVE ESTIMATES
This section is not applicable to this report.

P&E Mining Consultants Inc. Page 59 of 110
Mountain Lake Resources Inc. Glover Island Gold Property Report No. 244
16.0 MINING METHODS
This section is not applicable to this report.

P&E Mining Consultants Inc. Page 60 of 110
Mountain Lake Resources Inc. Glover Island Gold Property Report No. 244
17.0 RECOVERY METHODS
This section is not applicable to this report.

P&E Mining Consultants Inc. Page 61 of 110
Mountain Lake Resources Inc. Glover Island Gold Property Report No. 244
18.0 PROJECT INFRASTRUCTURE
This section is not applicable to this report.

P&E Mining Consultants Inc. Page 62 of 110
Mountain Lake Resources Inc. Glover Island Gold Property Report No. 244
19.0 MARKET STUDIES AND CONTRACTS
This section is not applicable to this report.

P&E Mining Consultants Inc. Page 63 of 110
Mountain Lake Resources Inc. Glover Island Gold Property Report No. 244
20.0 ENVIRONMENTAL STUDIES, PERMITTING AND SOCIAL OR COMMUNITY
IMPACT
This section is not applicable to this report.

P&E Mining Consultants Inc. Page 64 of 110
Mountain Lake Resources Inc. Glover Island Gold Property Report No. 244
21.0 CAPITAL AND OPERATING COSTS
This section is not applicable to this report.

P&E Mining Consultants Inc. Page 65 of 110
Mountain Lake Resources Inc. Glover Island Gold Property Report No. 244
22.0 ECONOMIC ANALYSIS
This section is not applicable to this report.

P&E Mining Consultants Inc. Page 66 of 110
Mountain Lake Resources Inc. Glover Island Gold Property Report No. 244
23.0 ADJACENT PROPERTIES
Mineral claims on Glover Island immediately north of the property are held by Buchans Minerals
Inc. Very little exploration has been done on this claim area and no gold showings are known.
No mineral claims are held immediately south of the property.
Gold showings in closest proximity to Glover Island are situated in similar geologic settings at
Young’s Pond and Corner Pond, about 20 kilometres along strike to the southwest. The showings
were discovered by Noranda Exploration in the late 1980’s. Gold grades in grab samples are
reported up to 20 g/t. Minimal exploration has been done in this area.
Numerous gold deposits and showings occur in analogous geologic settings on the Baie Verte
Peninsula, northeast of Glover Island. The most significant of these include The Pine Cove
deposit (2.63 mt at 2.93 g/t gold indicated and 0.25 mt at 2.11 g/t inferred; currently producing),
the Nugget Pond Mine (488,000 tonnes at 12.2 g/t gold; past producer), the Stog’er Tight deposit
(600,000 tonnes at 4.5 g/t gold; partially mined), and the Hammer Down deposit (403,000 tonnes
at 12.5 g/t gold; past producer).
Other structurally controlled orogenic gold deposits within the Dunnage Zone include the
Valentine Lake and Cape Ray deposits. The Valentine Lake Deposit is located 50 kilometres
southeast of Glover Island. The deposit contains NI 43-101 compliant measured reserves of
1,378,000 tonnes at 1.90 g/t Au, indicated reserves of 5,068,000 tonnes at 2.09 g/t Au, and an
inferred resource of 5,742,000 tonnes at 1.65 g/t Au (Mountain Lake press release,
Mar.29, 2012). The property is held by Mountain Lake Resources Inc. and Marathon Gold Inc.
The Cape Ray property is located 250 kilometres southwest of Glover Island. It hosts the
Windowglass Hill and 51 Zone prospects, with diamond drill intersections of 5.8 metres of 13.7
g/t gold and 10.2 metres of 5.3 g/t gold respectively (www.cornerstoneresources.com, 2004).

P&E Mining Consultants Inc. Page 67 of 110
Mountain Lake Resources Inc. Glover Island Gold Property Report No. 244
24.0 OTHER RELEVANT DATA AND INFORMATION
There are no other data considered relevant to this Report that have not previously been included.

P&E Mining Consultants Inc. Page 68 of 110
Mountain Lake Resources Inc. Glover Island Gold Property Report No. 244
25.0 INTERPRETATION AND CONCLUSIONS
25.1 DRILL PROGRAMS
The results from the 2011 and 2012 drilling programs validate the presence of a gold resource at
LPSE and also provide reliable confidence in earlier historical assay data. It also confirms that
that the mineralization extends further down dip and that the silicified breccia is open further to
the west along strike. Mountain Lake’s drilling has further confirmed that the northern hanging
wall is controlled by the steeply oriented, approximately strike parallel, George’s Pond Fault
which truncates the mineralization against barren mafic volcanics of the Glover Formation.
The 2011 and 2012 drill programs also identified that the silicified breccia mineralization exists
as a series of separate and interconnecting lenses rather than as a complexly folded body.
Drilling further identified the presence of quartz-carbonate vein type gold mineralization in
association with finely disseminated and aggregate pyrite clots hosted in quartz-feldspar crystal
tuff and quartz-feldspar porphyry in the footwall volcanics.
No drilling, sampling or recovery factors have been identified that could result in sampling bias
or otherwise materially impact the accuracy and reliability of the assays, and hence, the resource
database.
25.2 MINERAL RESOURCE ESTIMATION
The mineral resource, at a break even cut-off of 0.5 g/t Au, is summarized in Table 25.1. The
effective date of the estimate is April 3, 2012.
This Resource Estimate, based on the Lunch Pond Global Resource Sensitivity compared with
the combined Historical Resources for Lunch Pond indicates a 27.8% decrease in grade, offset
by a 57.4% increase in tonnage and resulting in a 14.1% increase in contained gold ounces.
The resources in this report were estimated in accordance with the definitions contained in the
Canadian Institute of Mining, Metallurgy and Petroleum (CIM) Standards on Mineral Resources
and Reserves Definitions and Guidelines that were prepared by the CIM Standing Committee on
Reserve Definitions and adopted by the CIM Council on November 27, 2010.

P&E Mining Consultants Inc. Page 69 of 110
Mountain Lake Resources Inc. Glover Island Gold Property Report No. 244
TABLE 25.1
GLOBAL MINERALIZED INVENTORY LPSE IN-PIT RESOURCE ESTIMATE
Cut-Off Au g/t Indicated Inferred Indicated & Inferred
Tonnes Au g/t Au oz. Tonnes Au g/t Au oz. Tonnes Tonnes Au oz.
1.00 691,601 2.14 47,473 1,158,319 1.99 74,035 1,849,920 2.04 121,508
0.90 758,703 2.03 49,518 1,274,620 1.89 77,575 2,033,323 1.94 127,093
0.80 815,008 1.95 51,044 1,396,936 1.8 80,933 2,211,944 1.86 131,976
0.70 863,149 1.88 52,200 1,493,615 1.73 83,268 2,356,764 1.79 135,468
0.60 935,466 1.79 53,716 1,598,884 1.66 85,487 2,534,350 1.71 139,203
0.50 992,710 1.72 54,737 1,703,456 1.59 87,299 2,696,166 1.64 142,036
0.40 1,028,670 1.67 55,264 1,788,157 1.54 88,536 2,816,827 1.59 143,800
0.30 1,061,659 1.63 55,637 1,835,938 1.51 89,072 2,897,597 1.55 144,709
0.20 1,096,868 1.59 55,895 1,870,737 1.49 89,377 2,967,605 1.52 145,272
0.10 1,113,976 1.56 55,979 1,889,223 1.47 89,470 3,003,199 1.51 145,449
0.01 1,124,626 1.55 56,008 1,903,951 1.46 89,494 3,028,577 1.49 145,502
This is further defined by an in pit resource estimate based on a 0.5 g/t Au Cut-off grade(1)(2)(3)
as
follows:
Indicated (In Pit) – 993,000 tonnes @ 1.72 g/t Au for 54,700 ounces gold
Inferred (In Pit) – 1,703,000 tonnes @ 1.59 g/t Au for 87,300 ounces gold
(1) Mineral resources which are not mineral reserves do not have demonstrated economic viability. The estimate
of mineral resources may be materially affected by environmental, permitting, legal, title, taxation, socio-
political, marketing, or other relevant issues.
(2) The quantity and grade of reported Inferred resources in this estimation are uncertain in nature and there
has been insufficient exploration to define these Inferred resources as an Indicated or Measured mineral
resource and it is uncertain if further exploration will result in upgrading them to an Indicated or Measured
mineral resource category.
(3) The mineral resources in this news release were estimated using the Canadian Institute of Mining,
Metallurgy and Petroleum (CIM), CIM Standards on Mineral Resources and Reserves, Definitions and
Guidelines prepared by the CIM Standing Committee on Reserve Definitions and adopted by CIM Council.
Further in pit mineral resource estimation parameters for LPSE are as follows:
Grade estimation is based on assay samples composited to 1 meter (m). Grade
capping thresholds were determined following a detailed statistical analysis of the
data for the entire mineralized domains varied from 5 to 12.5 grams per tonne
(g/t) gold (Au).
Resource model grade blocks were estimated using Gemcom modeling software
based on cross sectional interpretation and inverse distance cubed (1/d3) grade
estimation.
The database for the Lunch Pond Deposit model consisted of 76 diamond drill
holes totalling 15,452 meters of drilling. A total of 6,598 analyses were
considered for use in the resource estimate of which 1,689 were used for grade
estimation.
The mineralized zones at the Lunch Pond Deposit have been modeled
approximately 950 meters along strike and 375 meters down dip.
A bulk density value of 2.7 tonnes per cubic meter was used which was derived
from 12 site visit samples collected by Eugene Puritch, P.Eng., an independent
Qualified Person.

P&E Mining Consultants Inc. Page 70 of 110
Mountain Lake Resources Inc. Glover Island Gold Property Report No. 244
Mineral resources were reported within an optimized pit shell using a March 31,
2012 two year trailing average gold price of US$1,469/oz with a process recovery
of 95% and a US$ exchange rate of $1.00.
Process costs used were C$17/tonne and G&A was C$5/tonne. Open pit mining
costs were C$3.00/tonne for mineralized material and C$2.75/tonne for waste
with open pit slopes of 50 degrees.
P&E believes that at present there are no known environmental, permitting, legal, title, taxation,
socio-economic, marketing or political issues which could adversely affect the mineral resources
estimated above.

P&E Mining Consultants Inc. Page 71 of 110
Mountain Lake Resources Inc. Glover Island Gold Property Report No. 244
26.0 RECOMMENDATIONS
26.1 GEOLOGY AND RESOURCES
For the immediate future, P&E recommends that the next phase of drilling be conducted at other
prospects along the GI Trend with the intent of building additional resources to supplement
LPSE, specifically at both Kettle Pond and Lucky Smoke prospects where historical drilling has
identified high potential for increasing additional resources. Secondly, P&E would further
recommend that follow up exploration be carried out along the GI Trend to delineate the sources
for numerous gold geochemical anomalies that remain unexplained. Lastly, P&E recommends
that Mountain Lake conduct follow up exploration of the massive and polymetallic mineral
prospects adjacent to the GI Trend, specifically at the Clyde (Cu-Ni-Pd-Pt) and Rusty Trickle
VMS occurrences.
26.2 LUNCH POND SOUTH EXTENSION
Based on the existing information P&E would recommend that a series of drill holes be
conducted at the western end of the west grid to test for the strike continuation of LPSE
mineralization. Drilling should be restricted to shallow holes (~200 m) and should be completed
during a winter program due to the large underlying boggy topography. In addition, there are
several soil anomalies at the east end of the LPSE grid that remain unexplained and require
additional soil delineation to determine if drilling is warranted. Lastly, in regard to the LPSE
grid, the remainders of the un-surveyed Mountain Lake and historical drill holes should be
surveyed. The above work is all predicated on further data compilation of historical information
into the currently used Nad 83 UTM coordinate system.
26.3 ADJACENT PROSPECTS
The GI Trend is believed to be a highly prospective gold trend that warrants a considerable
systematic exploration approach to evaluate the near surface potential for gold mineralization.
P&E recommends that a thorough review and interpretation of the existing information for each
of the remaining prospects be undertaken prior to embarking on expensive delineation drilling
programs. The review/interpretative stage should necessarily be accompanied by other work
including prospecting, mapping, limited geophysics, trenching and reconnaissance drilling.
Particular attention should first be given to Kettle Pond, Quartz Pond area, Lunch Pond North,
Lunch Pond C, Discovery Vein and Rusty Vein.
26.4 BUDGET
In P&E’s opinion the Glover Island property associated with the GI Trend warrants further
exploration. Mountain Lake has proposed a budget of $528,000 for the next phase of work as
shown in Table 26.1.
P&E believes that the proposed budget is reasonable and recommends that Mountain Lake
proceed with the proposed work program.

P&E Mining Consultants Inc. Page 72 of 110
Mountain Lake Resources Inc. Glover Island Gold Property Report No. 244
TABLE 26.1
BUDGET FOR PROPOSED PROGRAM
Item Cost (Cdn$)
Environmental studies 5,000
Diamond Drilling 240,000
Assays 30,000
Labour 80,000
Helicopter 55,000
Camp and trail 18,000
Exploration 100,000
Total 528,000

P&E Mining Consultants Inc. Page 73 of 110
Mountain Lake Resources Inc. Glover Island Gold Property Report No. 244
27.0 REFERENCES
Andrews, P.W., 1990: Fourth year assessment report on Diamond Drilling Exploration, Glover
Island Project (4652), Licence 3963, NTS 12A/12, 13. Noranda Exploration Company Limited;
Newfoundland Department of Natural Resources, File 12A/580, 39 pages.
Ash, C. and Dearin, C., 1987: Preliminary summary report on exploration activities for the
Glover Island project, Ground Staked Licences 2672, 3036, 3037, 3090 and 3121. Varna Gold
Inc.; Newfoundland Department of Natural Resources.
Barbour, D.M. and French, V.A., 1993: Geology and Gold Mineralization of the Glover Island
Property, western Newfoundland; in Ore Horizons, Volume 2 Newfoundland Department of
Natural Resources, pages 101-118.
Barbour, D.M., 1996: Geological report on the Glover Island Property, west-central
Newfoundland. Unpublished Report International Northair Ltd., 35 pages.
Barbour, D.M. and Hodge, R., 1998: Assessment report on the Glover Island Property, west-
central Newfoundland, Licences 3688, 4391, 4518 & 4527 NTS Map Sheet 12A/12 & 12A/13 on
Detailed mapping, prospecting, line cutting and geophysical surveys. Unpublished Report New
Island Resources Inc., 42 pages.
Basha, M., 2001: Summary Report on Rusty Trickle VMS Prospect, Glover Island Property,
west-central Newfoundland, NTS Map Sheet 12A/12, 12A/13. Unpublished Report New Island
Minerals Inc., 33 pages.
Basha, M. and Frew, A., 2001: Geology, geochemistry, geophysics, trenching and prospecting
report – Glover Island Property licences 7584M (1st year), 7585M (1st year), 7588M (15th year),
7589M (7th year) and 7590M (7th year), west-central Newfoundland, NTS Mapsheet 12A/12
and 12A/13, three volumes. Unpublished Report New Island Resources Ltd., 52 pages.
Calon, T. and Barbour, D., 1995: Structural controls on gold along the Baie Verte Suture,
western Newfoundland Appalachains; Abstract for Geological Association of Canada, Spring
Meeting 1995, Halifax.
Cawood, P.A. and Van Gool, J.A.M., 1992: Stratigraphic, structural and metamorphic relations
along the eastern margin of the Humber Zone, Corner Brook map area, western Newfoundland;
in Current Research, Part E; Geological Survey of Canada, Paper 92-1E, pages 239-247.
Cawood, P.A. and Van Gool, J.A.M., 1993: Stratigraphic and structural relations within the
western Dunnage Zone, Glover Island region, western Newfoundland; in Current Research, Part
D; Geological Survey of Canada, Paper 93-1D, pages 29-37.
Cawood, P.A. and Van Gool, J.A.M., 1994: Geology of the Corner Brook – Grand Lake region,
Newfoundland. Geological Survey of Canada, Open File Map 2830.
Cawood, P.A. and Van Gool, J.A.M., 1996: Geology of the Corner Brook – Grand Lake region,
Newfoundland. Geological Survey of Canada, Bulletin 427.

P&E Mining Consultants Inc. Page 74 of 110
Mountain Lake Resources Inc. Glover Island Gold Property Report No. 244
Cawood, P.A., Dunning, G.R., Lux, D. and Van Gool, J.A.M., 1994: Timing of peak
metamorphism and deformation along the Appalachian margin of Laurentia in Newfoundland:
Silurian not Ordovician. Geology, volume 22, pages 399-402.
Cawood, P.A. and Van Gool, J.A.M., and Dunning, G.R., 1996: Geological development of
Eastern Humber and Western Dunnage zones: Corner Brook – Glover Island region,
Newfoundland. Canadian Journal of Earth Sciences, volume 33, pages 182-198.
Christie, B.J., 1986: Geological report on the Economic Potential of the Glover Island Claim
Group, Grand Lake, Newfoundland. Unpublished Report Varna Resources Inc. and South Coast
Resources Inc., Newfoundland Department of Natural Resources, File 12A/12/514, 33 pages.
Christie, B.J., 1986, and, Dearin, C.: Geological report on Phase One and recommended Phase
Two Exploration Programs for the Glover Island Claim Group, Grand Lake, Newfoundland,
Ground Staked Licence # 2676. Unpublished Report Varna Resources Inc. and South Coast
Resources Inc., Newfoundland Department of Natural Resources, File 12A/12/462, 69 pages.
Collins, C.J., 1987: Geology and Prospecting on the Glover Island Claim Group (Licences 2907,
3027 and 3206); Noranda Exploration Company Limited; Newfoundland Department of Natural
Resources, File 12A/486, 85 pages.
Coleman-Sadd, S.P., Hayes, J.P., and Knight, I., 1990: Geology of the Island of Newfoundland.
Newfoundland Geological of Mines and Energy, Map 90-01.
Cooper, J.R., 1936: Geology of the southern half of the Bay of Islands Complex...,
Newfoundland. Newfoundland Geological Survey Bulletin 4, 66 pages.
Dean, P. L., 1977: Report on the Spruce brook Area, Newfoundland NTS 12A/12, 12A/13.
Unpublished Report Hudson’s Bay Oil and Gas Company Limited, Newfoundland Department
of Natural Resources, File 12A/209, 7 pages.
Evans, D.T.W., 1996: Epigenetic gold occurrences, eastern and central Dunnage Zone,
Newfoundland. Newfoundland Department of Mines and Energy, Mineral Resources Report 9,
135 pages.
Evans, D.T.W., 2004: Epigenetic gold occurrences, 12H/9 and 12H/16 – Baie Verte Peninsula,
Newfoundland. Newfoundland Department of Natural Resources, Mineral Resources Report 11,
159 pages.
French, V.A., 1988: First year assessment report on prospecting and geochemical exploration for
Licence 2882 on claim block 3070 in the Liverpool Brook area, Newfoundland. Unpublished
Report Lucero Resource Corporation, 18 pages.
French, V.A., 1989: Report on Geochemistry, Geophysics and Prospecting, Glover Island
Property, Licence 3688, Claim Blocks: 4267, 4268, 4589, 4702, 4797, 4708, 4768, 4769 and
4770, NTS 12A/12. Unpublished Report Varna Gold Inc., Newfoundland Department of Natural
Resources, File 12A/12/550, 199 pages.
French, V.A., 1990: Report on Prospecting, Trenching, Geochemistry and Geology, Glover
Island Property, Licence 3688, Claim Blocks: 4267, 4268, 4589, 4702, 4797, 4708, 4768, 4769

P&E Mining Consultants Inc. Page 75 of 110
Mountain Lake Resources Inc. Glover Island Gold Property Report No. 244
and 4770. Unpublished Report Newfoundland Goldbar Resources Inc., Newfoundland
Department of Natural Resources, File 12A/12/590, 144 pages.
French, V.A., 1992: Report on Trenching, Prospecting, Geochemistry, Geophysics and Diamond
Drilling, Licence 3688, Claim Blocks: 4267, 4268, 4589, 4702, 4797, 4708, 4768, 4769 and
4770. Unpublished Report Newfoundland Goldbar Resources Inc., 25 pages.
French, V.A., 1993: Report on Geology, Prospecting, Geochemistry, Geophysics and Diamond
Drilling, Licence 3688, Claim Blocks: 4267, 4268, 4589, 4702, 4797, 4708, 4768, 4769 and
4770. Unpublished Report Newfoundland Goldbar Resources Inc., 27 pages.
French, V.A., 1995: Report on Trenching, Prospecting, Geochemistry and Geophysics, Licence
4518, Claim Blocks: 17141, 17142 and 17143; NTS 12A/12 and 12A/13; New Island Minerals
Ltd.; Newfoundland Department of Natural Resources.
French, V.A., 1995: Report on Geology, Prospecting, Geochemistry, Geophysics and Diamond
Drilling, Licence 3688, Claim Blocks: 4267, 4268, 4589, 4702, 4797, 4708, 4768, 4769 and
4770. Unpublished Report New Island Minerals Ltd., 23 pages.
French, V.A., 1997: The Exploration and Development Potential of the Glover Island Property,
western Newfoundland. Unpublished Report New Island Minerals Ltd., 11 pages.
French, V.A., 2003: A report on Diamond Drilling and Geology on Mineral Licences 7584M and
7588M forming a part of the Glover Island Property, western Newfoundland NTS 12A/12 (ref.
JCEAP Agreement #265-192-03). Unpublished Report New Island Minerals Ltd., 37 pages.
French, V.A., 2004: A report on Diamond Drilling and Geology at the Lunch Pond South
Extension and Lucky Smoke Zones, forming a part of the Glover Island Property, western
Newfoundland NTS 12A/12 and 12A/13 – to satisfy the 18th year work requirement – Licence
7588M & to satisfy the 4th year work requirement – Licence 7584M. Unpublished Report New
Island Minerals Ltd., 29 pages.
Hodge, R.G., and French, V.A., 1997: 1997 Assessment Report on Mineral Licence 4391 Glover
Island – Claim Blocks: 8229, 8230, 8231, 8232, NTS 12A/12 and 12A/13. Unpublished Report
New Island Minerals Ltd., 16 pages.
Jackson, S.L., Barbour, D., and Dearin, C., 1997: Report on geological mapping, gold
geochemistry and geophysics on the Glover Island Property, Licences 3688, 4391, 4518 and
4527. Unpublished Report Northair Group, 24 pages.
Knapp, D.A., 1982: Ophiolite Emplacement along the Baie Verte–Brompton Line at Glover
Island, western Newfoundland; Ph.D. Thesis, Memorial University of Newfoundland, St. John’s,
Newfoundland, 338 pages.
Knapp, D., Kennedy, D. and Martineau, Y., 1978: Stratigraphy, structure and regional
correlation of rocks at Grand Lake, western Newfoundland; Geological Survey of Canada, Paper
79-1A, pages 317-325.
Lassila, P., 1979a: Report on 1978 Geological, Geophysical, Geochemical, Trenching and
Diamond Drilling Program, Brinco Glover Island Lot. Unpublished Report Hudson’s Bay Oil

P&E Mining Consultants Inc. Page 76 of 110
Mountain Lake Resources Inc. Glover Island Gold Property Report No. 244
and Gas Company Limited, Newfoundland Department of Natural Resources, File 12A/220, 13
pages.
Lassila, P., 1979b: Report on 1979 Geochemical Soil Survey Program, Brinco Glover Island Lot.
Unpublished Report Hudson’s Bay Oil and Gas Company Limited, Newfoundland Department
of Natural Resources, File 12A/246, 10 pages.
Lassila, P., 1979c: Report on 1978 Geological, Geophysical, Geochemical, Trenching and
Diamond Drilling Program, Reid Lot 223. Unpublished Report Hudson’s Bay Oil and Gas
Company Limited, Newfoundland Department of Natural Resources, File 12A/225, 15 pages.
Lassila, P., 1981: Report on 1980 Investigation of Airborne Electromagnetic Anomaly Zone II,
Brinco Lot, Glover Island. Unpublished Report Hudson’s Bay Oil and Gas Company Limited,
Newfoundland Department of Natural Resources, File 12A/294, 9 pages.
MacDougal, C., 1990: Third year assessment report; Prospecting, geology, geochemistry,
trenching and geophysics; Glover Island Project (4652), Licences 3457 and 3527: NTS 12A/12
and 12A/13. Noranda Exploration Company Limited; Newfoundland Department of Natural
Resources.
Martineau, Y.A., 1980: The relationship among rock groups between the Grand lake thrust and
Cabot fault, western Newfoundland; MSc thesis, Memorial University of Newfoundland, St.
John’s, Newfoundland, 150 pages.
McHale, K.B., 1983: Summary report on re-examination of Glover Island Drill Core, Grand
Lake area, southwest Newfoundland. Brinco Principal Concession Area, NTS 12A/12.
Unpublished Report Brinco Ltd., Newfoundland Department of Natural Resources, File
12A/348, 6 pages.
Pilgrim, L., 2005: Technical report: Valentine Lake Gold Project. A report prepared for
Richmont Mines Inc., 39 pages.
Ralph, M., and French, V.A., 2002: Geology, geochemistry and prospecting report - Glover
Island Property, West-central Newfoundland, NTS Mapsheets 12A/12 and 12A/13, Mineral
Licences 7585M & 7590M. Unpublished Report New Island Minerals Inc., 20 pages.
Riccio, L., 1988: Second year assessment report on geological and geochemical exploration for
Licence 2882 on claim block 3070 in the Liverpool Brook area, Newfoundland. Unpublished
Report Lucero resource Corp., 25 pages.
Riley, G.C., 1957: Geology of the Red Indian Lake Sheet, NTS 12A (west half), Geological
Survey of Canada, Map 8-1957, 1:250,000.
Swinden, H.S., 1991: Paleotectonic settings of volcanogenic massive sulphide deposits in the
Dunnage Zone, Newfoundland Appalachians. CIM Bulletin: 84, pages 59-69.
Swinden, H.S., and Dunsworth, S.M., 1995: Metallogeny, in Williams, H., ed., The
Appalachian/Caledonian Orogen: Canada and Greenland: Geological Survey of Canada,
Geology of Canada, No. 6, p. 681-814.

P&E Mining Consultants Inc. Page 77 of 110
Mountain Lake Resources Inc. Glover Island Gold Property Report No. 244
Szybinski, A., House, S. and Jenner, G.A., 1995: Stratigraphy and structure of the Glover Group,
Grand Lake-Little Grand Lake area, Newfoundland; in Current Research 1995-E; Geological
Survey of Canada, pages 245-251.
Thurlow, J.G., 1990: Geology of the Buchans orebodies – A 1990 summary. 8th IAGOD
Symposium, Field Trip No.1, Guidebook; Geological Survey of Canada Open File 2156, pages
84-91.
Tuach, J., 1990: Summary report: The Glover Island Property, Licence 3688, (western
Newfoundland) NTS 12A/12). Unpublished Report Newfoundland Goldbar Resources Inc., 26
pages.
Tuach, J., Dean, P.L., Swinden, H.S., O’Driscoll, C.F., Kean, B.F. and Evans, D.T.W., 1988:
Gold Mineralization in Newfoundland: A 1988 Review. Current Research (1988);
Newfoundland Department of Mines, Mineral development Division, Report 88-1, pages 279-
306.
Van Staal, C.R., 2007: Pre-Carboniferous tectonic evolution and metallogeny of the Canadian
Appalachians; in Goodfellow, W.D. ed., Mineral Deposits of Canada. Special Publication No. 5,
pp 793-818.
Walker, S., 1988: Second year assessment report, Glover Island Project, licence 3457, NTS
12A/12 and 12A/13. Unpublished Report Noranda Exploration Company Limited.
Newfoundland Department of Natural Resources, File 12A/494, 12 pages.
Wallace, W., 1988: Geological report on the Glover Island claims, Grand Lake, Newfoundland;
Ground staked Licences 2676, 3036, 3089, 3090 and 3121. Unpublished report for Varna Gold
Inc. Newfoundland Department of Mines and Energy.
Wardell, R.J. and Pollock, J., 2000: Mineral Commodities of Newfoundland and Labrador:
Copper. Geological Survey of Canada: Mineral Commodities Series No 3, 12 pages.
Whalen, J.B., 1989: The Topsails igneous suite, western Newfoundland: an early Silurian
subduction-related magmatic suite? Canadian Journal of earth Sciences, Vol. 26, pages 2421-
2434.
Williams, H., 1979: Appalachian Orogen in Canada. Canadian Journal of Earth Sciences, Vol 16,
pages 792-807.
Williams, H. (Editor), 1995: Geology of the Appalachian-Caledonian Orogen in Canada and
Greenland. Geology Survey of Canada, Geology of Canada,, No. 6.
Williams, H. and St-Julien, P., 1982: The Baie Verte-Brompton Line: Early Paleozoic continent-
ocean interface in the Appalachians. In Major Structural Zones and Faults of the Northern
Appalachians, 1982. Edited by P. St-Julien and J. Béland, Geological Association of Canada
Special Paper 24, 1982.
Wilson, C., Worsley, M., Atkinson, B., Seers, D. and Jackson, M., 2008: Independent Technical
Report Of The Glover Island Gold deposits Newfoundland, Canada. A report prepared for Crew
Gold Corporation, 82 pages.

P&E Mining Consultants Inc. Page 78 of 110
Mountain Lake Resources Inc. Glover Island Gold Property Report No. 244
Woods, D.V., 2000: Geophysical report on an induced polarization and resistivity survey –
Glover Island project; Discovery Geophysics Inc. Unpublished report for New Island Resources
Inc., ## pages.
Woods, D.V. and Kubo, W.K., 2000: Geophysical report on a magnetic/VLF-EM, horizontal
loop EM and large-loop transient EM survey – Glover Island project, Rusty Trickle, Wedge
Pond and Clyde grids; Discovery Geophysics Inc. Unpublished report for New Island Resources
Inc., 25 pages.

P&E Mining Consultants Inc. Page 79 of 110
Mountain Lake Resources Inc. Glover Island Gold Property Report No. 244
28.0 CERTIFICATES
CERTIFICATE OF QUALIFIED PERSON
WAYNE D. EWERT, P.GEO.
I, Wayne D. Ewert, P. Geo., residing at 10 Langford Court, Brampton, Ontario, L6W 4K4, do hereby certify that:
1. I am a principal of P & E Mining Consultants Inc.
2. This certificate applies to the technical report titled “Technical Report and Resource Estimate on the Glover
Island Gold Property, Grand Lake Area West-Central Newfoundland, Canada” (the “Technical Report”), with
an effective of May 1, 2012.
3. I graduated with an Honours Bachelor of Science degree in Geology from the University of Waterloo in 1970
and with a PhD degree in Geology from Carleton University in 1977. I have worked as a geologist for a total of
42 years since obtaining my B.Sc. degree. I am a P. Geo., registered in the Province of Saskatchewan (APEGS
No. 16217), the Province of British Columbia (APEGBC No. 18965), the Province of Ontario (APGO No.
0866) and the Province of Newfoundland and Labrador (PEG No. 06005).
I have read the definition of “qualified person” set out in National Instrument 43-101 (“NI 43-101”) and certify
that by reason of my education, affiliation with a professional association (as defined in NI 43-101) and past
relevant work experience, I fulfill the requirements to be a “qualified person” for the purposes of NI 43-101.
My relevant experience for the purpose of the Technical Report is:
Principal, P&E Mining Consultants Inc. ..............................................................................2004 – Present
Vice-President, A.C.A. Howe International Limited ............................................................... 1992 – 2004
Canadian Manager, New Projects, Gold Fields Canadian Mining Limited ............................. 1987 – 1992
Regional Manager, Gold Fields Canadian Mining Limited ..................................................... 1986 – 1987
Supervising Project Geologist, Getty Mines Ltd. .................................................................... 1982 – 1986
Supervising Project Geologist III, Cominco Ltd. .................................................................... 1976 – 1982
4. I have not visited the Property that is the subject of this Technical Report.
5. I am responsible for authoring Sections 1 through 10, 15 through 24 and Section 27 as well as co-authoring
Sections 25 and 26 of this Technical Report.
6. I am independent of the Issuer applying all of the tests in section 1.5 of National Instrument 43-101.
7. I have not had prior involvement with the project that is the subject of this Technical Report.
8. I have read NI 43-101 and Form 43-101F1 and the Technical Report has been prepared in compliance
therewith.
9. As of the date of this certificate, to the best of my knowledge, information and belief, the Technical Report
contains all scientific and technical information that is required to be disclosed to make the Technical Report
not misleading.
Effective Date: May 1, 2012
Signed Date: May 29, 2012
{SIGNED AND SEALED} [Wayne Ewert]
________________________________
Dr. Wayne D. Ewert P. Geo.

P&E Mining Consultants Inc. Page 80 of 110
Mountain Lake Resources Inc. Glover Island Gold Property Report No. 244
CERTIFICATE OF QUALIFIED PERSON
EUGENE J. PURITCH, P. ENG.
I, Eugene J. Puritch, P. Eng., residing at 44 Turtlecreek Blvd., Brampton, Ontario, L6W 3X7, do hereby certify that:
1. I am an independent mining consultant and President of P & E Mining Consultants Inc.
2. This certificate applies to the technical report titled “Technical Report and Resource Estimate on the Glover
Island Gold Property, Grand Lake Area West-Central Newfoundland, Canada” (the “Technical Report”), with
an effective of May 1, 2012.
3. I am a graduate of The Haileybury School of Mines, with a Technologist Diploma in Mining, as well as
obtaining an additional year of undergraduate education in Mine Engineering at Queen’s University. In addition
I have also met the Professional Engineers of Ontario Academic Requirement Committee’s Examination
requirement for Bachelor’s Degree in Engineering Equivalency. I am a mining consultant currently licensed by
the Professional Engineers of Ontario (License No. 100014010) and registered with the Ontario Association of
Certified Engineering Technicians and Technologists as a Senior Engineering Technologist. I am also a member
of the National and Toronto Canadian Institute of Mining and Metallurgy.
I have read the definition of “qualified person” set out in National Instrument 43-101 (“NI 43-101”) and certify
that, by reason of my education, affiliation with a professional association (as defined in NI 43-101) and past
relevant work experience, I fulfill the requirements to be a “qualified person” for the purposes of NI 43-101.
I have practiced my profession continuously since 1978. My summarized career experience is as follows:
Mining Technologist - H.B.M.& S. and Inco Ltd., ..................................................................... 1978-1980
Open Pit Mine Engineer – Cassiar Asbestos/Brinco Ltd., .......................................................... 1981-1983
Pit Engineer/Drill & Blast Supervisor – Detour Lake Mine, ...................................................... 1984-1986
Self-Employed Mining Consultant – Timmins Area, ................................................................. 1987-1988
Mine Designer/Resource Estimator – Dynatec/CMD/Bharti, .................................................... 1989-1995
Self-Employed Mining Consultant/Resource-Reserve Estimator,.............................................. 1995-2004
President – P & E Mining Consultants Inc, ............................................................................ 2004-Present
4. I have visited the Property that is the subject of this report on November 14, 2011-November 15, 2011.
5. I am responsible for authoring Sections 11 through 14 as well as coauthoring Sections 25 and 26 of the
Technical Report.
6. I am independent of the Issuer applying the test in Section 1.5 of NI 43-101.
7. I have had prior involvement with the project that is the subject of this Technical Report.
8. I have read NI 43-101 and Form 43-101F1. This Technical Report has been prepared in compliance therewith.
9. As of the date of this certificate, to the best of my knowledge, information and belief, the Technical Report
contains all scientific and technical information that is required to be disclosed to make the Technical Report
not misleading.
Effective Date: May 1, 2012
Signed Date: May 29, 2012
{SIGNED AND SEALED} [Eugene Puritch]
Eugene J. Puritch, P. Eng

P&E Mining Consultants Inc. Page 81 of 110
Mountain Lake Resources Inc. Glover Island Gold Property Report No. 244
APPENDIX I. DRILL HOLE PLAN

P&E Mining Consultants Inc. Page 82 of 110
Mountain Lake Resources Inc. Glover Island Gold Property Report No. 244
MINERALIZED DOMAINS
PROJECTED TO SURFACE
QFP
N6
N5
N8
N7
N4
N3
N1
N2
0
METRES
50 100
P & E Mining Consultants Inc.
150 200
LUNCH POND DEPOSIT
May 2012SURFACE DRILL PLAN
Scale 1:4,000
GLOVER ISLAND PROJECT

P&E Mining Consultants Inc. Page 83 of 110
Mountain Lake Resources Inc. Glover Island Gold Property Report No. 244
APPENDIX II. 3D DOMAINS

P&E Mining Consultants Inc. Page 84 of 110
Mountain Lake Resources Inc. Glover Island Gold Property Report No. 244

P&E Mining Consultants Inc. Page 85 of 110
Mountain Lake Resources Inc. Glover Island Gold Property Report No. 244
APPENDIX III. LOG NORMAL HISTOGRAMS

P&E Mining Consultants Inc. Page 86 of 110
Mountain Lake Resources Inc. Glover Island Gold Property Report No. 244

P&E Mining Consultants Inc. Page 87 of 110
Mountain Lake Resources Inc. Glover Island Gold Property Report No. 244

P&E Mining Consultants Inc. Page 88 of 110
Mountain Lake Resources Inc. Glover Island Gold Property Report No. 244

P&E Mining Consultants Inc. Page 89 of 110
Mountain Lake Resources Inc. Glover Island Gold Property Report No. 244

P&E Mining Consultants Inc. Page 90 of 110
Mountain Lake Resources Inc. Glover Island Gold Property Report No. 244

P&E Mining Consultants Inc. Page 91 of 110
Mountain Lake Resources Inc. Glover Island Gold Property Report No. 244
APPENDIX IV. VARIOGRAMS

P&E Mining Consultants Inc. Page 92 of 110
Mountain Lake Resources Inc. Glover Island Gold Property Report No. 244

P&E Mining Consultants Inc. Page 93 of 110
Mountain Lake Resources Inc. Glover Island Gold Property Report No. 244
APPENDIX V. AU BLOCK MODEL CROSS SECTIONS AND PLANS

P&E Mining Consultants Inc. Page 94 of 110
Mountain Lake Resources Inc. Glover Island Gold Property Report No. 244
GLOVER ISLAND PROJECT
Scale 1:2,000Au BLOCK MODEL SECTION 9900 NE
May 2012
LUNCH POND DEPOSIT
10075
P & E Mining Consultants Inc.
5025
METRES
0
N2
N1
N3
N4
N7
N8
N5
N6
QFP
PROJECTED TO SECTION
MINERALIZED DOMAINS
Au g/t
+ 5.0
2.0 - 5.0
1.0 - 2.0
0.5 - 1.0
0.01 - 0.5
PIT OUTLINE
SURFACE
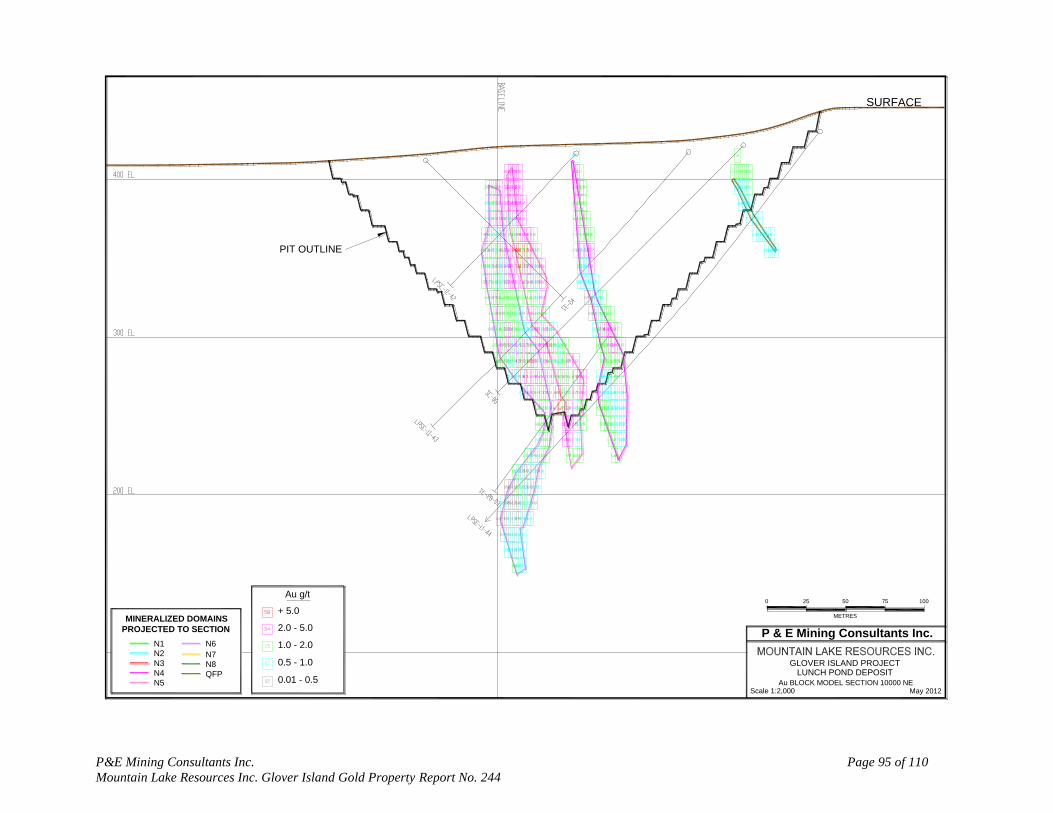
P&E Mining Consultants Inc. Page 95 of 110
Mountain Lake Resources Inc. Glover Island Gold Property Report No. 244
GLOVER ISLAND PROJECT
Scale 1:2,000Au BLOCK MODEL SECTION 10000 NE
May 2012
LUNCH POND DEPOSIT
10075
P & E Mining Consultants Inc.
5025
METRES
0
N2N1
N3
N4
N7
N8
N5
N6
QFP
PROJECTED TO SECTION
MINERALIZED DOMAINS
Au g/t
+ 5.0
2.0 - 5.0
1.0 - 2.0
0.5 - 1.0
0.01 - 0.5
PIT OUTLINE
SURFACE

P&E Mining Consultants Inc. Page 96 of 110
Mountain Lake Resources Inc. Glover Island Gold Property Report No. 244
GLOVER ISLAND PROJECT
Scale 1:2,000Au BLOCK MODEL SECTION 10100 NE
May 2012
LUNCH POND DEPOSIT
10075
P & E Mining Consultants Inc.
5025
METRES
0
N2
N1
N3
N4
N7N8
N5
N6
QFP
PROJECTED TO SECTION
MINERALIZED DOMAINS
Au g/t
+ 5.0
2.0 - 5.0
1.0 - 2.0
0.5 - 1.0
0.01 - 0.5
PIT OUTLINE
SURFACE

P&E Mining Consultants Inc. Page 97 of 110
Mountain Lake Resources Inc. Glover Island Gold Property Report No. 244
GLOVER ISLAND PROJECT
Scale 1:2,000Au BLOCK MODEL SECTION 10200 NE
May 2012
LUNCH POND DEPOSIT
10075
P & E Mining Consultants Inc.
5025
METRES
0
N2
N1
N3
N4
N7
N8
N5
N6
QFP
PROJECTED TO SECTION
MINERALIZED DOMAINS
Au g/t
+ 5.0
2.0 - 5.0
1.0 - 2.0
0.5 - 1.0
0.01 - 0.5
PIT OUTLINE
SURFACE

P&E Mining Consultants Inc. Page 98 of 110
Mountain Lake Resources Inc. Glover Island Gold Property Report No. 244
MINERALIZED DOMAINS
PROJECTED TO PLAN
QFP
N6
N5
N8
N7
N4
N3
N1
N2
0
METRES
50 100
P & E Mining Consultants Inc.
150 200
LUNCH POND DEPOSIT
May 2012Au BLOCK MODEL PLAN 400 EL
Scale 1:4,000
GLOVER ISLAND PROJECT
0.01 - 0.5
0.5 - 1.0
1.0 - 2.0
2.0 - 5.0
+ 5.0
Au g/t
PIT OUTLINE

P&E Mining Consultants Inc. Page 99 of 110
Mountain Lake Resources Inc. Glover Island Gold Property Report No. 244
MINERALIZED DOMAINS
PROJECTED TO PLAN
QFP
N6
N5
N8
N7
N4
N3
N1N2
0
METRES
50 100
P & E Mining Consultants Inc.
150 200
LUNCH POND DEPOSIT
May 2012Au BLOCK MODEL PLAN 350 EL
Scale 1:4,000
GLOVER ISLAND PROJECT
0.01 - 0.5
0.5 - 1.0
1.0 - 2.0
2.0 - 5.0
+ 5.0
Au g/t
PIT OUTLINE
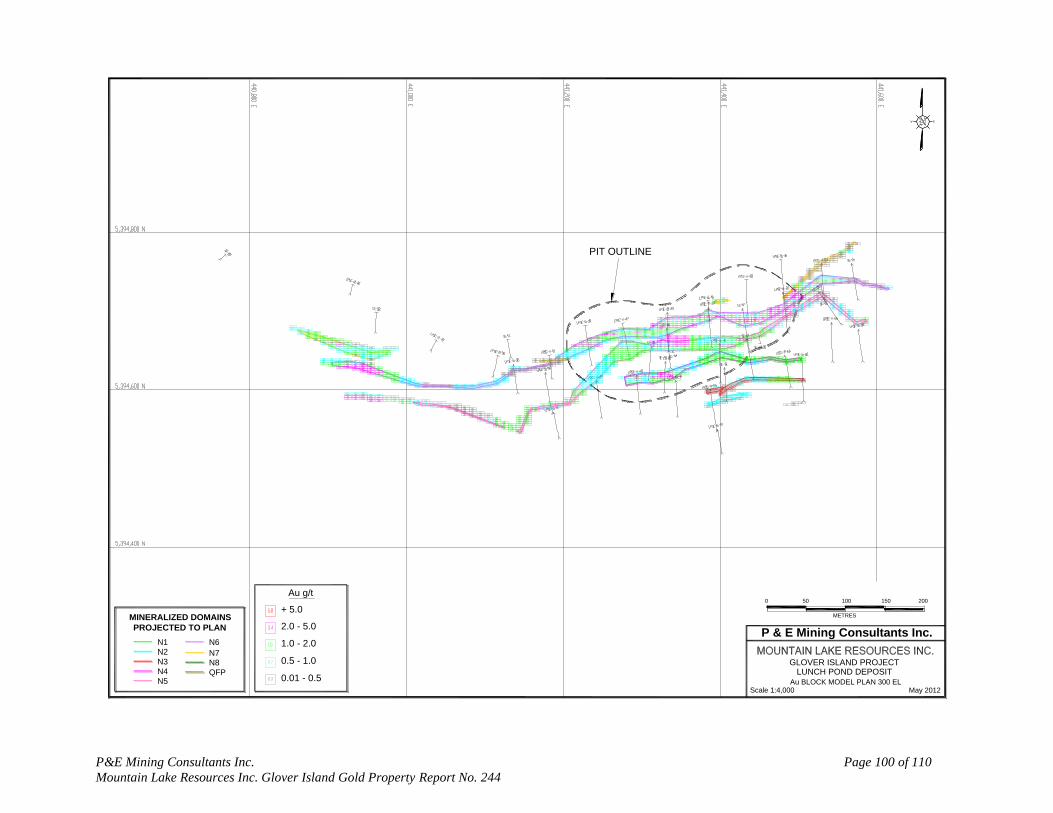
P&E Mining Consultants Inc. Page 100 of 110
Mountain Lake Resources Inc. Glover Island Gold Property Report No. 244
MINERALIZED DOMAINS
PROJECTED TO PLAN
QFP
N6
N5
N8N7
N4
N3
N1
N2
0
METRES
50 100
P & E Mining Consultants Inc.
150 200
LUNCH POND DEPOSIT
May 2012Au BLOCK MODEL PLAN 300 EL
Scale 1:4,000
GLOVER ISLAND PROJECT
0.01 - 0.5
0.5 - 1.0
1.0 - 2.0
2.0 - 5.0
+ 5.0
Au g/t
PIT OUTLINE

P&E Mining Consultants Inc. Page 101 of 110
Mountain Lake Resources Inc. Glover Island Gold Property Report No. 244
APPENDIX VI. CLASSIFICATION BLOCK MODEL CROSS SECTIONS AND
PLANS
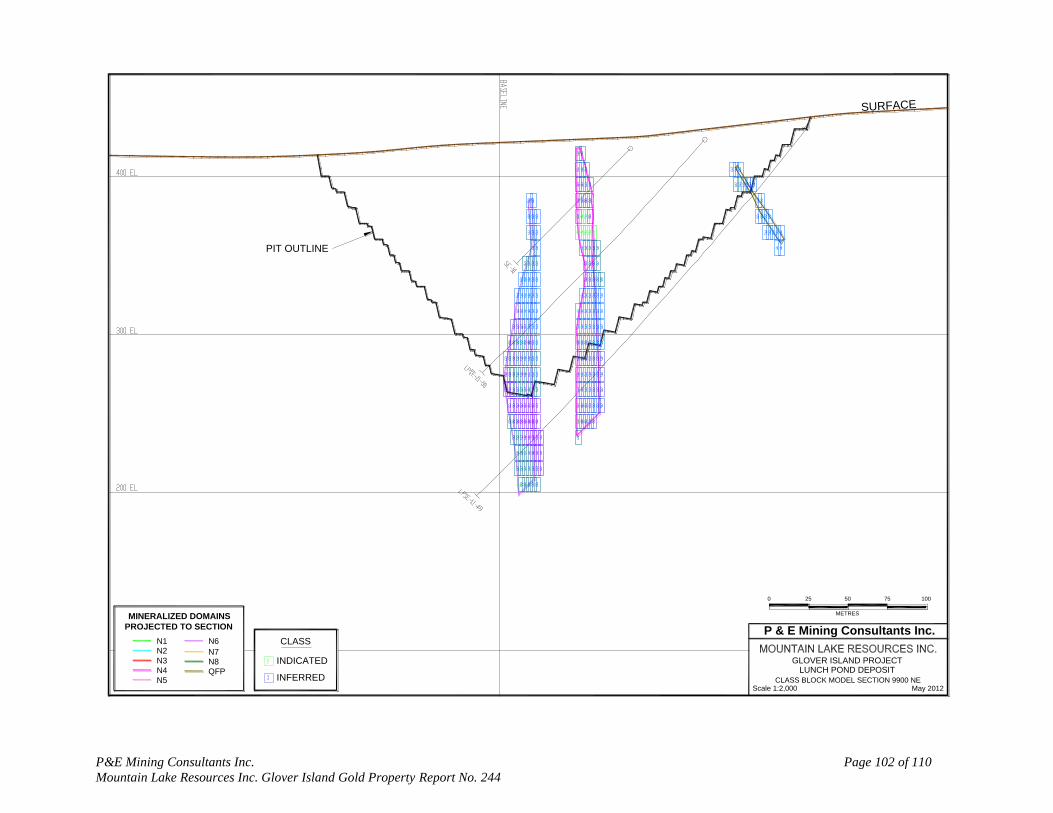
P&E Mining Consultants Inc. Page 102 of 110
Mountain Lake Resources Inc. Glover Island Gold Property Report No. 244
GLOVER ISLAND PROJECT
Scale 1:2,000CLASS BLOCK MODEL SECTION 9900 NE
May 2012
LUNCH POND DEPOSIT
10075
P & E Mining Consultants Inc.
5025
METRES
0
N2N1
N3
N4
N7
N8
N5
N6
QFP
PROJECTED TO SECTION
MINERALIZED DOMAINS
PIT OUTLINE
SURFACE
INFERRED
INDICATED
CLASS

P&E Mining Consultants Inc. Page 103 of 110
Mountain Lake Resources Inc. Glover Island Gold Property Report No. 244
GLOVER ISLAND PROJECT
Scale 1:2,000CLASS BLOCK MODEL SECTION 10000 NE
May 2012
LUNCH POND DEPOSIT
10075
P & E Mining Consultants Inc.
5025
METRES
0
N2
N1
N3
N4
N7
N8
N5
N6
QFP
PROJECTED TO SECTION
MINERALIZED DOMAINS
PIT OUTLINE
SURFACE
INFERRED
INDICATED
CLASS

P&E Mining Consultants Inc. Page 104 of 110
Mountain Lake Resources Inc. Glover Island Gold Property Report No. 244
GLOVER ISLAND PROJECT
Scale 1:2,000CLASS BLOCK MODEL SECTION 10100 NE
May 2012
LUNCH POND DEPOSIT
10075
P & E Mining Consultants Inc.
5025
METRES
0
N2
N1
N3
N4
N7
N8
N5
N6
QFP
PROJECTED TO SECTION
MINERALIZED DOMAINS
PIT OUTLINE
SURFACE
INFERRED
INDICATED
CLASS
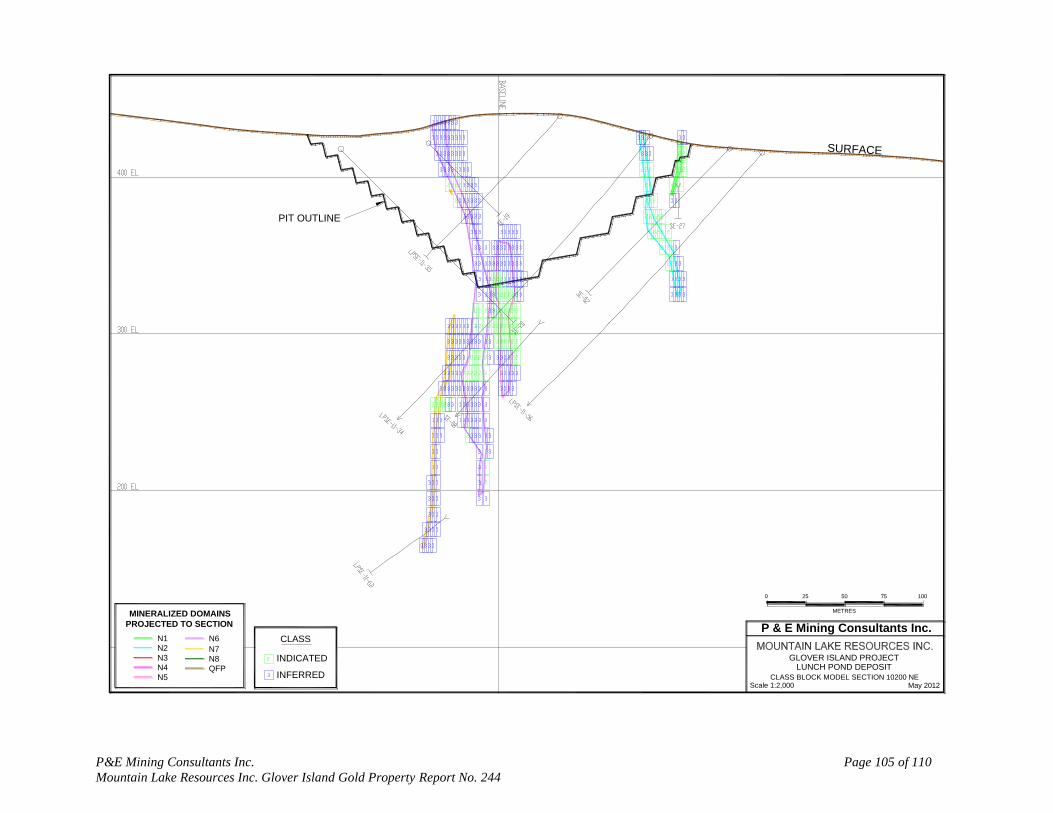
P&E Mining Consultants Inc. Page 105 of 110
Mountain Lake Resources Inc. Glover Island Gold Property Report No. 244
GLOVER ISLAND PROJECT
Scale 1:2,000CLASS BLOCK MODEL SECTION 10200 NE
May 2012
LUNCH POND DEPOSIT
10075
P & E Mining Consultants Inc.
5025
METRES
0
N2
N1
N3
N4
N7
N8
N5
N6
QFP
PROJECTED TO SECTION
MINERALIZED DOMAINS
PIT OUTLINE
SURFACE
INFERRED
INDICATED
CLASS

P&E Mining Consultants Inc. Page 106 of 110
Mountain Lake Resources Inc. Glover Island Gold Property Report No. 244
MINERALIZED DOMAINS
PROJECTED TO PLAN
QFP
N6
N5
N8
N7
N4
N3
N1N2
0
METRES
50 100
P & E Mining Consultants Inc.
150 200
LUNCH POND DEPOSIT
May 2012CLASS BLOCK MODEL PLAN 400 EL
Scale 1:4,000
GLOVER ISLAND PROJECT
PIT OUTLINE
INFERRED
INDICATED
CLASS

P&E Mining Consultants Inc. Page 107 of 110
Mountain Lake Resources Inc. Glover Island Gold Property Report No. 244
MINERALIZED DOMAINS
PROJECTED TO PLAN
QFP
N6
N5
N8
N7
N4
N3
N1
N2
0
METRES
50 100
P & E Mining Consultants Inc.
150 200
LUNCH POND DEPOSIT
May 2012CLASS BLOCK MODEL PLAN 350 EL
Scale 1:4,000
GLOVER ISLAND PROJECT
PIT OUTLINE
INFERRED
INDICATED
CLASS

P&E Mining Consultants Inc. Page 108 of 110
Mountain Lake Resources Inc. Glover Island Gold Property Report No. 244
MINERALIZED DOMAINS
PROJECTED TO PLAN
QFP
N6
N5
N8
N7
N4
N3
N1
N2
0
METRES
50 100
P & E Mining Consultants Inc.
150 200
LUNCH POND DEPOSIT
May 2012CLASS BLOCK MODEL PLAN 300 EL
Scale 1:4,000
GLOVER ISLAND PROJECT
PIT OUTLINE
CLASS
INDICATED
INFERRED

P&E Mining Consultants Inc. Page 109 of 110
Mountain Lake Resources Inc. Glover Island Gold Property Report No. 244
APPENDIX VII. OPTIMIZED PIT SHELL

P&E Mining Consultants Inc. Page 110 of 110
Mountain Lake Resources Inc. Glover Island Gold Property Report No. 244