updated mineral resource estimate technical · pdf fileupdated mineral resource estimate...
TRANSCRIPT

UPDATED MINERAL RESOURCE ESTIMATE TECHNICAL REPORT
FOR THE PULACAYO SILVER-LEAD-ZINC DEPOSIT PULACAYO TOWNSHIP, POTOSÍ DISTRICT, QUIJARRO
PROVINCE, BOLIVIA
For Apogee Silver Ltd.
Located at 740450mE
7744695mN WGS84, Zone 19
South Datum
Prepared by Peter Webster, P.Geo.
Michael Cullen, P.Geo. Mercator Geological Services Limited
and Eugene Puritch, P. Eng.
P&E Mining Consultants Inc.
Effective Date: September 28th, 2012
Pulacayo Silver-Lead-Zinc Deposit Technical Report November 2012
65 Queen St. • Dartmouth, NS B2Y 1G4 • Ph.: (902) 463-1440 • Fax: (902) 463-1419
E-mail: [email protected] • Web: www.mercatorgeo.com
ii
Table of Contents
Summary ........................................................................................................................................ x 1 Introduction and Terms of Reference ................................................................................. 1 2 Reliance on Other Experts .................................................................................................... 3
2.1 General ............................................................................................................................. 3 3 Property Description and Location...................................................................................... 5
3.1 General ............................................................................................................................. 5 3.2 Summary of Mineral Title ................................................................................................ 5
3.2.1 Overview of Bolivian Mining Law ........................................................................... 5 3.3 Property Ownership .......................................................................................................... 8 3.4 Environmental Considerations ....................................................................................... 15 3.5 Access To Property For Work Recommended Work Programs .................................... 15
4 Accessibility, Climate, Local Resources, Infrastructure and Physiography .................. 16
4.1 Accessibility ................................................................................................................... 16 4.2 Climate and Physiography ............................................................................................. 16 4.3 Local Resources and Infrastructure ................................................................................ 18
5 History .................................................................................................................................. 20
5.1 Introduction .................................................................................................................... 20 5.2 Summarized Exploration History ................................................................................... 20
6 Geological Setting ................................................................................................................ 22
6.1 Regional Geology ........................................................................................................... 22 6.2 Local Geology ................................................................................................................ 24 6.3 Structure ......................................................................................................................... 26 6.4 Alteration ........................................................................................................................ 27 6.5 Mineralization ................................................................................................................ 27
7 Deposit Type ......................................................................................................................... 31 8 Exploration ........................................................................................................................... 33
8.1 Introduction .................................................................................................................... 33 8.2 Work Programs During 2006 to 2011 Period................................................................. 33
8.2.1 Introduction ............................................................................................................. 33

Pulacayo Silver-Lead-Zinc Deposit Technical Report November 2012
65 Queen St. • Dartmouth, NS B2Y 1G4 • Ph.: (902) 463-1440 • Fax: (902) 463-1419
E-mail: [email protected] • Web: www.mercatorgeo.com
iii
8.2.2 Topographic Survey ................................................................................................ 33 8.2.3 Geological Mapping and Sampling ........................................................................ 34 8.2.4 Geophysical Surveys ............................................................................................... 34 8.2.5 Diamond Drilling .................................................................................................... 39 8.2.6 Mineral Resource Estimates and Preliminary Economic Assessment By Micon ... 39 8.2.7 Preliminary Economic Assessment ......................................................................... 40 8.2.8 Mineral Resource Estimate by Mercator ................................................................ 41
9 Drilling .................................................................................................................................. 44
9.1 Introduction .................................................................................................................... 44 9.2 ASC Bolivia LDC Drilling (2002-2005) ........................................................................ 44 9.3 Apogee Drilling (Jan 2006 – May 2008) ....................................................................... 44 9.4 Apogee Drilling (Jan 2010 – Present) ............................................................................ 46 9.5 Apogee Drilling Logistics .............................................................................................. 48
10 Sample Preparation, Analysis and Security ...................................................................... 50
10.1 Sample Preparation for 2006-2012 Apogee Programs ................................................... 50 10.2 Sample Preparation for 2002-2003 ASC Programs ....................................................... 51 10.3 Drill Core Analysis for 2006-2012 Apogee Programs ................................................... 52 10.4 Drill Core Analysis for 2002-2003 ASC Programs ....................................................... 52 10.5 Quality Assurance and Control for 2006-2012 Apogee Programs ................................ 52 10.6 Quality Control and Assurance for ASC 2002-2003 Programs ..................................... 53
11 Data Verification.................................................................................................................. 54
11.1 Review and Validation of Project Data Sets .................................................................. 54 11.2 Site Visits by Mercator ................................................................................................... 55
11.2.1 August 3rd to August 10th, 2011 ............................................................................ 55 11.2.2 April 26th to April 28th, 2012 .................................................................................. 55
11.3 Quality Control and Quality Assurance (QAQC) .......................................................... 59 11.3.1 Apogee Programs 2006 – 2012 ............................................................................... 59 11.3.2 Apogee Programs 2006 – 2012 ............................................................................... 59 11.3.3 Certified Reference Material Programs .................................................................. 60 11.3.4 Quarter and Half Core Duplicate Split Check Sample Programs ........................... 74 11.3.5 Mercator Program ................................................................................................... 81
12 Mineral Processing and Metallurgical Testing ................................................................. 90
12.1 Pre-2012 Programs ......................................................................................................... 90 12.2 Programs During 2012 ................................................................................................... 90
12.2.1 Introduction ............................................................................................................. 90

Pulacayo Silver-Lead-Zinc Deposit Technical Report November 2012
65 Queen St. • Dartmouth, NS B2Y 1G4 • Ph.: (902) 463-1440 • Fax: (902) 463-1419
E-mail: [email protected] • Web: www.mercatorgeo.com
iv
12.2.2 Bulk Sample Testing Programs .............................................................................. 91 13 Mineral Resource Estimate................................................................................................. 93
13.1 General ........................................................................................................................... 93 13.2 Geological Interpretation Used In Resource Estimation ................................................ 93 13.3 Methodology of Resource Estimation ............................................................................ 94
13.3.1 Overview of Estimation Procedure ......................................................................... 94 13.3.2 Data Validation ....................................................................................................... 96 13.3.3 Metal Pricing and Net Smelter Return (NSR) Calculation ..................................... 97 13.3.4 Data Domains and Solid Modelling ........................................................................ 98 13.3.5 Drill Core Assay Composites and Statistics ......................................................... 105 13.3.6 High Grade Capping Of Assay Composite Values ............................................... 106 13.3.7 Variography .......................................................................................................... 107 13.3.8 Setup of Three Dimensional Block Model ........................................................... 113 13.3.9 Resource Estimation ............................................................................................. 113 13.3.10 Bulk Density ...................................................................................................... 114 13.3.11 Resource Category Definitions ......................................................................... 116 13.3.12 Resource Category Parameters Used in Current Estimate ................................ 116 13.3.13 Pit Optimization and Cutoff Values .................................................................. 119 13.3.14 Statement of Mineral Resource Estimate .......................................................... 120 13.3.15 Model Validation ............................................................................................... 124 13.3.16 Comment on Previous Resource Estimates ....................................................... 126
14 Adjacent Properties ........................................................................................................... 128 15 Other Relevant Data and Information ............................................................................ 129 16 Interpretation and Conclusions ........................................................................................ 130 17 Recommendations and Proposed Budget ........................................................................ 133
17.1 Recommendations ........................................................................................................ 133 17.2 Proposed Budget .......................................................................................................... 134
18 Date and Signature Page ..................................................................................................... 135
19 Certificates of Qualification ................................................................................................. 136 20 References Cited .................................................................................................................. 137
Pulacayo Silver-Lead-Zinc Deposit Technical Report November 2012
65 Queen St. • Dartmouth, NS B2Y 1G4 • Ph.: (902) 463-1440 • Fax: (902) 463-1419
E-mail: [email protected] • Web: www.mercatorgeo.com
v
Appendix 1: Drilling Related Documents Appendix 2: Resource Estimate Support Documents
Appendix 3: Plans and Sections

Pulacayo Silver-Lead-Zinc Deposit Technical Report November 2012
65 Queen St. • Dartmouth, NS B2Y 1G4 • Ph.: (902) 463-1440 • Fax: (902) 463-1419
E-mail: [email protected] • Web: www.mercatorgeo.com
vi
List of Figures
Figure 3.1: Location map, Pulacayo Project ................................................................................... 6 Figure 3.2: Property concessions .................................................................................................. 14 Figure 4.1: Major routes and physiographic regions in Bolivia ................................................... 17 Figure 4.2: Pulacayo COMIBOL facility used by Apogee ........................................................... 19 Figure 6.1 Structural units of Bolivia ........................................................................................... 23 Figure 6.2: Regional geology map (From Iriondo et al., 2009) .................................................... 24 Figure 6.3: Local geology of Pulacayo property .......................................................................... 25 Figure 6.4: Structural interpretation for TVS at Pulacayo (Iriondo et al.,2009) ........................... 26 Figure 6.5: Section PY-740200..................................................................................................... 29 Figure 6.6: Crustiform texture in NQ core (~47.6 mm width) ..................................................... 30 Figure 6.7: Vuggy texture with quartz and barite infilling in NQ core (~47.6 mm width) .......... 30 Figure 7.1: Genesis of epithermal mineral deposits (From White and Hedenquist, 1994) .......... 32 Figure 8.1: Property geology map ................................................................................................ 36 Figure 8.2: IP survey coverage ..................................................................................................... 37 Figure 8.3: Representative IP responses line LPY-5 .................................................................... 38 Figure 9.1: Plan and longsection of Pulacayo drilling ................................................................. 47 Figure 9.2: Typical Apogee drill collar after completion of hole ................................................. 49 Figure 9.3: View of Apogee drill collar description plate ............................................................ 49 Figure 10.1: Apogee core logging facility ................................................................................... 51 Figure11.1: Oxide zone exposure – April, 2012 ........................................................................... 57 Figure11.2: View of Pulacayo town site – April, 2012 ................................................................ 57 Figure11.3: Bulk sample stockpile area – April, 2012 ................................................................. 58 Figure11.4: Core facility staff assisting with check sampling – April, 2012 ............................... 58 Figure 11.5: Certified Standard CDN-SE-1 Results - Ag g/t (N=82) ........................................... 61 Figure 11.6: Certified Standard CDN-SE-1 Results - Pb % (N=82) ............................................ 62 Figure 11.7: Certified Standard CDN-SE-1 Results - Zn % (N=82) ............................................ 62 Figure 11.8: Certified Standard PB128 Results - Ag g/t (N=89) .................................................. 63 Figure 11.9: Certified Standard PB128 Results - Pb % (N=91) ................................................... 63 Figure 11.10: Certified Standard PB128 Results - Zn % (N=91) ................................................. 64 Figure 11.11: Certified Standard PB138 Results - Ag g/t (N=5) .................................................. 65 Figure 11.12: Certified Standard PB138 Results - Pb % (N=5) ................................................... 65 Figure 11.13: Certified Standard PB138 Results - Zn % (N=5) ................................................... 66 Figure 11.14: Certified Standard CDN-SE-1 Results - Ag g/t (N=25) ......................................... 66 Figure 11.15: Certified Standard CDN-SE-1 Results - Pb % (N=25) .......................................... 67 Figure 11.16: Certified Standard CDN-SE-1 Results - Zn % (N=25) .......................................... 67 Figure 11.17: Certified Standard PB138 Results - Ag g/t (N=54) ................................................ 68 Figure 11.18: Certified Standard PB138 Results - Pb % (N=5) ................................................... 68

Pulacayo Silver-Lead-Zinc Deposit Technical Report November 2012
65 Queen St. • Dartmouth, NS B2Y 1G4 • Ph.: (902) 463-1440 • Fax: (902) 463-1419
E-mail: [email protected] • Web: www.mercatorgeo.com
vii
Figure 11.19: Certified Standard PB138 Results - Zn % (N=54) ................................................. 69 Figure 11.20: Blank Samples Values Ag g/t (N=174) .................................................................. 70 Figure 11.21: Blank Sample Values Pb % (N=174) ..................................................................... 71 Figure 11.22: Blank Sample Values Pb % (N=174) ..................................................................... 71 Figure 11.23: Blank Sample Values Ag g/t (N=102) ................................................................... 72 Figure 11.24: Blank Sample Values Pb % (N=102) ..................................................................... 73 Figure 11.25: Blank Sample Values Zn % (N=10) ....................................................................... 73 Figure 11.26: 1/2 Core Duplicate Samples - Ag g/t (N=42) ......................................................... 74 Figure 11.27: 1/4 Core Duplicate Samples - Ag g/t (N=107) ....................................................... 75 Figure 11.28: 1/2 Core Duplicate Samples - Pb % (=N42) .......................................................... 75 Figure 11.29: 1/4 Core Duplicate Samples - Pb % (N=107) ........................................................ 76 Figure 11.30: 1/2 Core Duplicate Samples - Zn % (N=42) .......................................................... 76 Figure 11.31: 1/4 Core Duplicate Samples - Zn % (N=107) ........................................................ 77 Figure 11.32: Pulp Splits and Reject Duplicate Samples - Ag g/t (N=442) ................................. 78 Figure 11.33: Pulp Splits and Reject Duplicate Samples - Pb % (N=442) ................................... 78 Figure 11.34: Pulp Splits and Reject Duplicate Samples - Zn % (N=442) .................................. 79 Figure 11.35: Pulp Splits and Reject Duplicate Samples - Ag (N=524) ...................................... 80 Figure 11.36: Pulp Splits and Reject Duplicate Samples – Pb (N=524) ..................................... 80 Figure 11.37: Pulp Splits and Reject Duplicate Samples – Zn (N=524) ..................................... 81 Figure 11.38: Mercator 1/4 Core Check Samples - Ag g/t (N=9) ................................................ 83 Figure 11.39: Mercator 1/4 Core Check Samples - Pb % (N=9) .................................................. 83 Figure 11.40: Mercator 1/4 Core Check Sample - Zn % (N=9) ................................................... 84 Figure 11.41: Mercator Reject Check Samples - Ag g/t (N=4) .................................................... 84 Figure 11.42: Mercator reject Check Samples - Pb% (N=4) ........................................................ 85 Figure 11.43: Mercator Reject Check Samples - Zn % (N=4) ..................................................... 85 Figure 11.44: Photo of Mercator April 2012 core sample interval ............................................... 87 Figure 11.45: Mercator 1/4 Core Check Samples 2012 - Ag g/t (N=24) ..................................... 87 Figure 11.46: Mercator 1/4 Core Check Samples 2012 - Pb % (N=24) ....................................... 87 Figure 11.47: Mercator 1/4 Core Check Samples 2012 - Zn % (N=24) ....................................... 88 Figure 13.1: Isometric view of the surpac topographic surface dtm – view to nw ....................... 99 Figure 13.2: Isometric view of the oxide-sulphide transition surface dtm – view to nw ........... 100 Figure 13.3a: Longitudinal and plan view of the silver domain solid models ............................ 101 Figure 13.3b: Longitudinal and plan view of the silver domain solid models ........................... 102 Figure 13.3c: Longitudinal and plan view of the silver domain solid models ............................ 102 Figure 13.4: Isometric view of the previous Surpac $40nsr domain solid model – view to NW 103 Figure 13.5: Longitudinal view of the current workings solid model (View to N) .................... 103 Figure 13.6: Isometric view of the current workings solid model (View to NW) ...................... 104 Figure 13.7: Isometric view of the void blocks in the block model (View to NW) ................... 105 Figure 13.8: Downhole variograms of silver, lead and zinc ....................................................... 109

Pulacayo Silver-Lead-Zinc Deposit Technical Report November 2012
65 Queen St. • Dartmouth, NS B2Y 1G4 • Ph.: (902) 463-1440 • Fax: (902) 463-1419
E-mail: [email protected] • Web: www.mercatorgeo.com
viii
Figure 13.9: Anisotropic variograms for silver capped composite values .................................. 110 Figure 13.10: Anisotropic variograms for lead capped composite values .................................. 111 Figure 13.11: Anisotropic variograms for zinc capped composite values .................................. 112 Figure 13.12: Cumulative frequency and distribution histogram of density results in peripheral domain sulphide zone ................................................................................................................. 115 Figure 13.13a: Isometric view of the mineral resource categories – view to NW ...................... 117 Figure 13.13b: Isometric view of the Indicated mineral resource .............................................. 118 Figure 13.13c: Isometric view of the Indicated mineral resource .............................................. 118 Figure 13.13d: Isometric view of Whittle pit shell developed by P&E – view to NW………… 121 Figure 13.14: Resource sensitivity - block Ag g/t grade and tonnage ........................................ 123 Figure 13.15: Resource sensitivity - Oxide Zone block Ag (g/t) grade and tonnage ................. 123 Figure 13.16: Isometric view of the sulphide zone block NSR value distribution .................... 124 Figure 13.17: Isometric view of the oxide zone block silver grade distribution ........................ 125
Pulacayo Silver-Lead-Zinc Deposit Technical Report November 2012
65 Queen St. • Dartmouth, NS B2Y 1G4 • Ph.: (902) 463-1440 • Fax: (902) 463-1419
E-mail: [email protected] • Web: www.mercatorgeo.com
ix
List of Tables
Table 2.1: Listing of Abbreviations and Conversions .................................................................... 4 Table 3.1: Summary of Apogee’s Pulacayo-Paca exploration holdings ..................................... 13 Table 8.1a: Historic Micon 2008 Mineral Resource Estimate - Effective October 28th, 2008 ... 40 Table 8.1b: Micon PEA Mineral Resource Estimate – Effective October 14th, 2009………… 40 Table 8.2: Historic Pulacayo Deposit Mineral Resource – October 19, 2011 .............................. 41 Table 11.1: Certified Reference Materials Data for January 2010 to October 2011 Period ......... 60 Table 11.2: Collar Coordinate Check Program Results ............................................................... 89 Table 12.1: FEDOCOMIN Bulk Metallurgical Test, Concentrate Grades and Recovery ........... 91 Table 13.1: Silver, Lead and Zinc Statistics for Uncapped 1.0 m Composites .......................... 106 Table 13.2: Silver, Lead and Zinc Statistics for Capped 1.0 m Composites ............................. 106 Table 13.3: Summary of Pulacayo Deposit Block Model Parameters ........................................ 113 Table 13.4a: Density Statistics for 1 m Composites in Peripheral Domain Sulphide Zone ....... 114 Table 13.4b: Density Statistics for 1 m Composites in Peripheral Domain Oxide Zone……... 112 Table 13.5a: Pulacayo Deposit Mineral Resource – Effective September 28th, 2012 ............... 122 Table 13.5b: Pulacayo Uncapped Underground Mineral Resource – September 26, 2012*…..122 Table 13.6: Comparison of Drill Hole Composite Grades and Block Model Grades ................ 126 Table 13.7: Additional Resource Parameters For Ordinary Kriging Check Model ................... 126 Table 16.1:Pulacayo Deposit Mineral Resource – Effective September 28th, 2012 ................... 131 Table 17.1: Proposed Budget ...................................................................................................... 134

Pulacayo Silver-Lead-Zinc Deposit Technical Report November 2012
65 Queen St. • Dartmouth, NS B2Y 1G4 • Ph.: (902) 463-1440 • Fax: (902) 463-1419
E-mail: [email protected] • Web: www.mercatorgeo.com
x
Summary This report on updating of mineral resources for the Pulacayo silver-lead-zinc deposit, located in Pulacayo, Bolivia, was prepared by Mercator Geological Services Limited (Mercator) on behalf of Apogee Silver Limited (Apogee) and has an effective date of September 28th, 2012. It updates a previous mineral resource estimate prepared by Mercator with an effective date of October 19th, 2011. The current and previous mineral resource estimates were prepared in accordance with disclosure requirements set out under National Instrument 43-101 (NI 43-101) and with Canadian Institute of Mining, Metallurgy and Petroleum Standards for Mineral Resources and Reserves Definitions and Guidelines (CIM Standards). Apogee controls 100% of the Pulacayo deposit that is located 18 km east of the city of Uyuni in the Department of Potosi in southwestern Bolivia. The site is 460 km south southeast of the national capital, La Paz, and 130 km southwest of Potosi, the department capital. The Pulacayo mine is the second largest silver producing mine in the history of Bolivia with over 600 million ounces of past production. The Pulacayo deposit is interpreted as a low sulphidation epithermal deposit that hosts both precious and base metal mineralization within Tertiary sediments of the Quenhua Formation and intruding andesitic volcanic rocks of the Rotchild and Megacristal units. Of the 1000 m vertical extent of sulphide mineralization, the top 450 m section is hosted within the intruding volcanic unit and the bottom 550 m is hosted in the underlying sedimentary unit. Mineralization hosted by volcanic rocks occurs over tens of meters in thickness as a stockwork of narrow veins and veinlets accompanied by disseminations in associated argillicly-altered marginal areas. The intruded sedimentary rocks host spatially constrained, bonanza style high grade veins that locally measure up to several meters in width. These typically bifurcate into the wider stockwork and disseminated zones that characterize the overlying volcanic sequence. Veins are commonly banded in texture and can contain semi-massive to massive sulphides, with the primary minerals of economic importance being galena, sphalerite, tetrahedrite and other silver sulfosalts. In combination, these comprise the Tajo Vein System (TVS) that constitutes the Pulacayo deposit of this report. TVS mineralization is controlled by an east-west oriented normal fault system that links two northeast trending, steeply dipping, regional strike slip faults. This updated mineral resource estimate is based on a three dimensional block model developed using Gemcom Surpac ® Version 6.2.1 modeling software. It incorporates validated results of 69,739 m of combined diamond drilling from 226 surface drill holes and 42 underground drill holes plus 6 surface trenches completed by Apogee and ASC Bolivia LDC between 2002 and the end of 2011. A total of 28,807 core samples have been assayed from these programs and 24,367 of these occur within the limits of the current deposit model. A total of 627 trench samples are similarly included. The updated mineral resource for the Pulacayo deposit is tabulated below and has an effective date of September 28th, 2012.
Pulacayo Silver-Lead-Zinc Deposit Technical Report November 2012
65 Queen St. • Dartmouth, NS B2Y 1G4 • Ph.: (902) 463-1440 • Fax: (902) 463-1419
E-mail: [email protected] • Web: www.mercatorgeo.com
xi
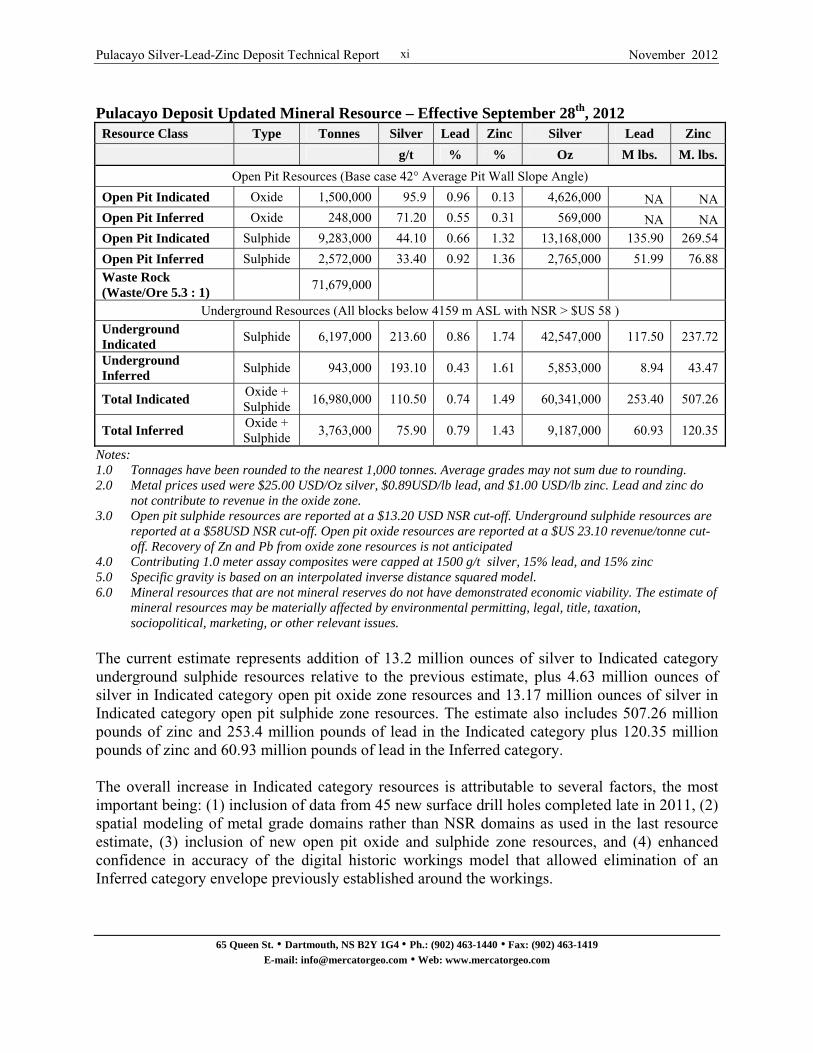
Pulacayo Deposit Updated Mineral Resource – Effective September 28th, 2012
Resource Class Type Tonnes Silver Lead Zinc Silver Lead Zinc
g/t % % Oz M lbs. M. lbs.
Open Pit Resources (Base case 42° Average Pit Wall Slope Angle)
Open Pit Indicated Oxide 1,500,000 95.9 0.96 0.13 4,626,000 NA NAOpen Pit Inferred Oxide 248,000 71.20 0.55 0.31 569,000 NA NAOpen Pit Indicated Sulphide 9,283,000 44.10 0.66 1.32 13,168,000 135.90 269.54
Open Pit Inferred Sulphide 2,572,000 33.40 0.92 1.36 2,765,000 51.99 76.88Waste Rock (Waste/Ore 5.3 : 1)
71,679,000
Underground Resources (All blocks below 4159 m ASL with NSR > $US 58 ) Underground Indicated
Sulphide 6,197,000 213.60 0.86 1.74 42,547,000 117.50 237.72
Underground Inferred
Sulphide 943,000 193.10 0.43 1.61 5,853,000 8.94 43.47
Total Indicated Oxide + Sulphide
16,980,000 110.50 0.74 1.49 60,341,000 253.40 507.26
Total Inferred Oxide + Sulphide
3,763,000 75.90 0.79 1.43 9,187,000 60.93 120.35
Notes: 1.0 Tonnages have been rounded to the nearest 1,000 tonnes. Average grades may not sum due to rounding. 2.0 Metal prices used were $25.00 USD/Oz silver, $0.89USD/lb lead, and $1.00 USD/lb zinc. Lead and zinc do
not contribute to revenue in the oxide zone. 3.0 Open pit sulphide resources are reported at a $13.20 USD NSR cut-off. Underground sulphide resources are
reported at a $58USD NSR cut-off. Open pit oxide resources are reported at a $US 23.10 revenue/tonne cut-off. Recovery of Zn and Pb from oxide zone resources is not anticipated
4.0 Contributing 1.0 meter assay composites were capped at 1500 g/t silver, 15% lead, and 15% zinc 5.0 Specific gravity is based on an interpolated inverse distance squared model. 6.0 Mineral resources that are not mineral reserves do not have demonstrated economic viability. The estimate of
mineral resources may be materially affected by environmental permitting, legal, title, taxation, sociopolitical, marketing, or other relevant issues.
The current estimate represents addition of 13.2 million ounces of silver to Indicated category underground sulphide resources relative to the previous estimate, plus 4.63 million ounces of silver in Indicated category open pit oxide zone resources and 13.17 million ounces of silver in Indicated category open pit sulphide zone resources. The estimate also includes 507.26 million pounds of zinc and 253.4 million pounds of lead in the Indicated category plus 120.35 million pounds of zinc and 60.93 million pounds of lead in the Inferred category. The overall increase in Indicated category resources is attributable to several factors, the most important being: (1) inclusion of data from 45 new surface drill holes completed late in 2011, (2) spatial modeling of metal grade domains rather than NSR domains as used in the last resource estimate, (3) inclusion of new open pit oxide and sulphide zone resources, and (4) enhanced confidence in accuracy of the digital historic workings model that allowed elimination of an Inferred category envelope previously established around the workings.

Pulacayo Silver-Lead-Zinc Deposit Technical Report November 2012
65 Queen St. • Dartmouth, NS B2Y 1G4 • Ph.: (902) 463-1440 • Fax: (902) 463-1419
E-mail: [email protected] • Web: www.mercatorgeo.com
xii
Based on the findings of this report, the following recommendations are presented with respect to upgrading of existing mineral resources at Pulacayo and exploration for extensions to the currently defined deposit. The proposed budget for recommended programs is $2,330,000.
1. 5,000 m of surface diamond drilling to upgrade existing Inferred resources to Indicated status, substantively focused within the open pit shell
2. 5,000 m of surface diamond drilling to evaluate deposit extension areas defined in this report
3. 1,000 m of surface and/or underground diamond drilling to determine Measured mineral resource category drilling density requirements
4. Upgrading and expansion of the current digital mine workings model, with assay data inclusion
5. Updating of the mineral resource estimate after completion of above drilling programs 6. 1000 m of underground drilling to support Indicated resource area bulk sampling in the
main TVS Indicated resource area 7. Planning, engineering and geological studies to support an TVS Indicated resource area
bulk sampling program Apogee has already committed to completion of an independent feasibility study managed by the consulting firm TWP Sudamerica S.A. It is recognized that recommendations arising from the TWP feasibility study may supercede in priority some, or all, of those arising from this report.

Pulacayo Silver-Lead-Zinc Deposit Technical Report November 2012
65 Queen St. • Dartmouth, NS B2Y 1G4 • Ph.: (902) 463-1440 • Fax: (902) 463-1419
E-mail: [email protected] • Web: www.mercatorgeo.com
1
1 Introduction and Terms of Reference This report on the estimation of updated mineral resources for the Pulacayo silver-lead-zinc deposit located in Pulacayo, Bolivia was prepared by Mercator Geological Services Limited (Mercator) on behalf of Apogee Silver Limited (Apogee) with an Effective Date of September 28th, 2012. It updates a previous mineral resource estimate prepared by Mercator with an effective date of October 19th, 2011. The current and previous mineral resource estimates were prepared in accordance with disclosure requirements set out under National Instrument 43-101 (NI 43-101) and with Canadian Institute of Mining, Metallurgy and Petroleum Standards for Mineral Resources and Reserves Definitions and Guidelines (CIM Standards). The terms of reference for the current resource estimate were established through discussion with Apogee in July of 2012. At that time it was determined that the estimate would be based upon validated results for all core drilling completed by Apogee and ASC Bolivia LDC (ASC) in the 2002 to 2009 period, additional drill holes completed by Apogee during 2010 and 2011, and results for 6 Apogee surface trenches. Author Webster and Mercator resource geologist M. Harrington carried out a site visit to the Pulacayo deposit during the period August 2nd, 2011 to August 10th, 2011 and completed a review of Apogee drill program components, including protocols for drill core logging, storage, handling, sampling and security. An independent core check sampling program was completed by the authors, drill sites were visited and various trenched and channel sampled bedrock exposures were examined. Author Cullen carried out a site visit during the period April 26th to April 28th, 2012 and completed similar technical reviews plus a core check sampling program with respect to the 2011 oxide zone drilling by Apogee. In both cases, Mercator staff were accompanied by Mr. Chris Collins, Apogee President, and met with Apogee Exploration Manager, Mr. Hernán Uribe Zeballos, both of whom provided technical and professional insight with respect to the project. Site professional and technical staff provided additional assistance during the visits, under supervision of Senior Geologist, Mr. Freddy Mayta Quispe. Hard copy project records were examined while in Bolivia and company digital records for all property drilling were delivered to Mercator by Apogee for purposes of the previous and current resource estimation programs. This included complete drill logs, drill plans, assay records and laboratory records for drilling completed by the company, as well as for historic exploration in the property area by other explorers. Based on the preceding, Mercator assembled and validated a digital drilling database upon which the three-dimensional resource estimate block model for the Pulacayo deposit was developed using Surpac® Version 6.01 modeling software. The updated database used for the current resource estimate includes all new 2011 drilling program data. All authors of this report are Independent Qualified Persons (IQP) as defined by NI43-101. Authors Cullen and Webster are responsible for all sections of this report except 13.3.13 for which author Puritch is responsible. Mercator staff resource geologist, Matthew Harrington, is a graduate geologist with extensive deposit modeling and resource estimation experience and participated extensively in development of the current deposit model and resource estimate under
Pulacayo Silver-Lead-Zinc Deposit Technical Report November 2012
65 Queen St. • Dartmouth, NS B2Y 1G4 • Ph.: (902) 463-1440 • Fax: (902) 463-1419
E-mail: [email protected] • Web: www.mercatorgeo.com
2
supervision of the two Mercator authors. Both Mercator and P&E worked strictly on a fee for service basis. The authors have specific experience in the geology and mineralization types detailed in this report that reflects participation in exploration and development projects in Mexico, South America, the southwest United States and Canada.
Pulacayo Silver-Lead-Zinc Deposit Technical Report November 2012
65 Queen St. • Dartmouth, NS B2Y 1G4 • Ph.: (902) 463-1440 • Fax: (902) 463-1419
E-mail: [email protected] • Web: www.mercatorgeo.com
3
2 Reliance on Other Experts
2.1 General This report was prepared by Mercator for Apogee and the information, conclusions and recommendations contained herein are based upon information available to Mercator at the time of report preparation. This includes data made available by Apogee from internal reports, previous resources estimates, and from government and public record sources. Information contained in this report is believed reliable but in part the report is based upon information not within Mercator’s control. Mercator has no reason, however, to question the quality or validity of data used in this report. Comments and conclusions presented herein reflect the authors’ best judgment at the time of report preparation and are based upon information available at that time. Mercator relied upon Apogee with respect to provision of an opinion with respect to environmental liabilities. The details of such that are expressed herein were confirmed by Apogee President, Mr. C. Collins on September 26th, 2012. Mercator relied upon Apogee with respect to provision of legal opinions regarding mineral titles, surface titles and mineral agreements that pertain to the Pulacayo property. More specifically, Mercator relied upon information pertaining to these topics that was provided by Mr. Gustavo A. Miranda Pinaya, Executive President and in-house legal counsel for Apogee Minerals Bolivia SA. The opinions expressed in this report were confirmed by Mr. Gustavo A. Miranda Pinaya on September 26th, 2012. This report also expresses opinions regarding exploration and development potential for the Pulacayo project and recommendations for further analysis. These opinions and recommendations are intended to serve as guidance for future development of the property, but should not be construed as a guarantee of success.
2.2 Abbreviations Used in this Report
The following abbreviations and factors have been used in this report and certain others are individually defined where they initially appear in the text. Currency references in this report reflect Canadian funds unless otherwise indicated.
Pulacayo Silver-Lead-Zinc Deposit Technical Report November 2012
65 Queen St. • Dartmouth, NS B2Y 1G4 • Ph.: (902) 463-1440 • Fax: (902) 463-1419
E-mail: [email protected] • Web: www.mercatorgeo.com
4
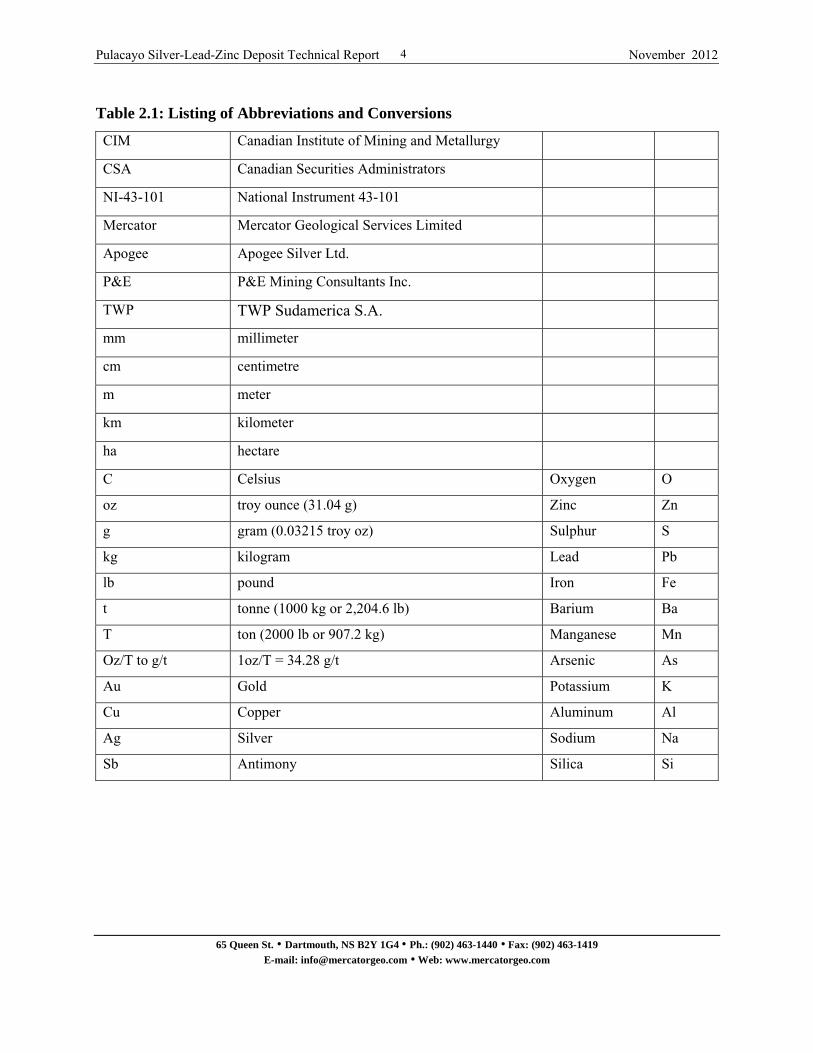
Table 2.1: Listing of Abbreviations and Conversions
CIM Canadian Institute of Mining and Metallurgy
CSA Canadian Securities Administrators
NI-43-101 National Instrument 43-101
Mercator Mercator Geological Services Limited
Apogee Apogee Silver Ltd.
P&E P&E Mining Consultants Inc.
TWP TWP Sudamerica S.A.
mm millimeter
cm centimetre
m meter
km kilometer
ha hectare
C Celsius Oxygen O
oz troy ounce (31.04 g) Zinc Zn
g gram (0.03215 troy oz) Sulphur S
kg kilogram Lead Pb
lb pound Iron Fe
t tonne (1000 kg or 2,204.6 lb) Barium Ba
T ton (2000 lb or 907.2 kg) Manganese Mn
Oz/T to g/t 1oz/T = 34.28 g/t Arsenic As
Au Gold Potassium K
Cu Copper Aluminum Al
Ag Silver Sodium Na
Sb Antimony Silica Si

Pulacayo Silver-Lead-Zinc Deposit Technical Report November 2012
65 Queen St. • Dartmouth, NS B2Y 1G4 • Ph.: (902) 463-1440 • Fax: (902) 463-1419
E-mail: [email protected] • Web: www.mercatorgeo.com
5
3 Property Description and Location
3.1 General The Pulacayo-Paca property currently comprises approximately 22,828 hectares of contiguous mining concessions centered on the historic Pulacayo mine and town site. The property is located in southwest Bolivia, approximately 460 km from the capital city of La Paz, 130 km southwest of the town of Potosi and 18 km east of the city of Uyuni (Figure 3.1). It is accessible by good roads from La Paz which are now paved to the town of Uyuni and beyond. The property is centered at approximately 740450mE and 7744695mN WGS84 Zone 19, south datum, and at an elevation of 4305 m ASL (Figure 3.1). Unpaved road sections are generally passable during the whole year, although they may present some level of difficulty during the rainy season. The tourist town of Uyuni, on the edge of the large Salar de Uyuni (salt lake), provides limited local services. The town has railway connections with the cities of Oruro, Potosí and Villazon and also to the borders with Argentina and Chile. Uyuni has a newly developed airport with asphalt strip which can now accommodate turbo props and regional jet service. There are also several small hotels, hostels, restaurants, schools, medical and dental facilities and internet cafes. The San Cristóbal Mining Company has constructed a gravel road from San Cristóbal, approximately 100 km southwest of Uyuni, to the border with Chile.
3.2 Summary of Mineral Title The following is an excerpt from Pressacco et al. (2010), as presented in Cullen and Webster (2011), that outlines the mineral title position and governance regime applicable to the Pulacayo property.
3.2.1 Overview of Bolivian Mining Law The granting of mining concessions in Bolivia is governed by the Constitution (Constitución Política del Estado), the Mining Code (Código de Minería) enacted by Law No. 1777 of March 17, 1997, supplemented by certain Supreme Decrees that rules taxation, environmental policies, and administrative matters, etc. Ground and underground resources are from original domain of the Bolivian state and the resources can be granted for its exploitation; but the Bolivian state is prohibited to transfer them, according to the Article 349.I of the Constitution. Bolivian or foreign companies or individual persons may have mining concessions; with the exception of minors, governments agents, armed forces member, policemen, as well as relatives of the mentioned persons, etc., according to the Second Chapter of the First Title of the First Book of the Mining Code (Articles 16 to 23). Foreigners, according to the Article 262.I of the Constitution and Article 17 of the Mining Code are not authorized to own mining concessions or real estate property within a buffer zone of 50m

Location MapPulacayo, Bolivia
Date: May, 2012
Figure 3.1
BOLIVIASouth America
Pacific
Ocean
ProjectArea
PULACAYO PROJECT
LA PAZ
Uyuni
San Cristobal
San Vincent
San Bartolome
ORURO
COCHABAMBA
POTOSI
50
Kilometres
1000
Taken from Iriondo et al, 2009.
Pulacayo Silver-Lead-Zinc Deposit Technical Report November 2012
65 Queen St. • Dartmouth, NS B2Y 1G4 • Ph.: (902) 463-1440 • Fax: (902) 463-1419
E-mail: [email protected] • Web: www.mercatorgeo.com
7
surrounding the Bolivian international borders, but they are authorized to enter into Joint Venture agreements on the frontier regions. Once the mining concession has been obtained, the title holder is able to explore and exploit the minerals within the mining concession including tailings and residual material. To retain the rights to the concession, the title holder must maintain the concession in good standing through the annual “patentes payment”, the cost of the “patentes” per “cuadrícula” being about US$ 40.00 per year (US$ 80.00 if the concession has more than five years). If the title holder continues to make the “patentes payment” on time the mining concession is indefinite, according to current legislation. “Cuadrícula” is the mining measure unit, which is an inverted pyramid with the inferior vertex pointing the earth’s core, with an exterior perimeter equal to 25 hectares. Some existing mining concessions have been applied for and granted according to the system governed by the old Mining Code, which has not been in effect since 1997. However the concessions are totally legal. The measure unit of the mining concessions obtained according to the old Mining Code system is the “pertenencia minera”, which is an inverted pyramid with the inferior vertex pointing the earth’s core, with an exterior perimeter equal to one hectare. Mining concessions cannot be transferred, sold or mortgaged. Joint Venture agreements are permitted. The Bolivian Constitution passed and enacted in February 2009, on its article 8th section 3, of the Transitory Provisions Chapter, establishes that all the mining concessions must be adapted to the new constitutional regime and then must be converted to “mining contracts” in a term of one year from December 6th 2009. Since in December 6th 2010, a new Mining Law compliant with the Constitution enacted in Februray 2009 was not in effect, the Bolivian government issued the Supreme Decree No. 726/2010. The mentioned Decree on its first article establishes that all the mining concessions (while the new Mining Law is being prepared and then enacted) will have the category of “Autorizaciones Transitorias Especiales” or Special Transitory Authorizations. The second article of the Supreme Decree No. 726/2010 also establishes that the pre-established rights of the Special Transitory Authorizations are guaranteed. The Codigo de Mineria (1997) is available in an official Spanish-English side-by-side version which facilitates understanding the Bolivian mining code. Key features are:
There is only one type of mining license, a “La Concesion Minera” (currently known as “Special Transitory Authorization STA”), which is comprised of 25 ha units, named “cuadricula minera”. A maximum of 2,500 units is allowed for a mining concession. There is no limitation to the number of concessions that can be held by a company or an individual.
Field staking is not required; concessions are applied for on 1:50,000 scale base maps.
Pulacayo Silver-Lead-Zinc Deposit Technical Report November 2012
65 Queen St. • Dartmouth, NS B2Y 1G4 • Ph.: (902) 463-1440 • Fax: (902) 463-1419
E-mail: [email protected] • Web: www.mercatorgeo.com
8
The concessionaire has exclusive rights to all minerals within the STA. If the title holder continues to make the “patentes payment” on time the term of the
mining concession is indefinite. Mining concessions cannot be transferred, sold or mortgaged. Provision is made for surface access, compensation and arbitration with private land
owners, if any. (NB: private ownership of surface lands outside of major cities is limited). Mining concessions, both “cuadrículas” and “pertenencias” must have their “Título
Ejecutorial” registered with the “Mining Registry” that is part of the SERGEOTECMIN and before the Real State Registration Office.
Simultaneous with the introduction of the new mining code in 1997 were a number of taxation reforms. Bolivian taxes are now fully deductible by foreign mining companies under US corporate income tax regulations.
Taxes applicable are:
Mining Royalty (Regalía Minera) equivalent to 1-7% of the gross sales value of the mineral. The tax is paid before the mineral is exported or sold in the local market (in this case only 60% of the tax is paid).
Profits tax of 25% on net profits [Gross income – (expenses+costs)]; losses can be carried forward indefinitely. An additional 12.5% is paid when metals/minerals reach extraordinary market prices.
Mineral production is subject to a Value Added Tax of 13%.
The Ministry of Mining and Metallurgy is responsible for mining policy. Servicio Geologico Tecnico Minero de Bolivia (SERGEOTECMIN) – the Bolivian Geological Survey, a branch of the Ministry, is responsible for management of the mineral titles system. SERGEOTECMIN also provides geological and technical information and maintains a USGS-donated geological library and publications distribution centre. Also, tenement maps are available from SERGEOTECMIN, which has a GIS based, computerized map system. Exploration and subsequent development activities require various degrees of environmental permits, which various company representatives have advised are within normal international standards. Permits for drill road construction, drilling and other ground disturbing activities can be readily obtained in 2 – 4 months, or less, upon submission of a simple declaration of intent and plan of activities.”
3.3 Property Ownership Details of property ownership of the Pulacayo-Paca project properties are complicated by multi-layered option and joint venture agreements. Apogee Minerals Ltd. (renamed Apogee Silver Ltd. in March 2011) currently controls 100% of the Pulacayo deposit through an agreement with Golden Minerals Company (GMC), the successor of Apex Silver Company. Golden Minerals Company’s Bolivian subsidiary, ASC Bolivia LDC, holds the mining rights to the concessions
Pulacayo Silver-Lead-Zinc Deposit Technical Report November 2012
65 Queen St. • Dartmouth, NS B2Y 1G4 • Ph.: (902) 463-1440 • Fax: (902) 463-1419
E-mail: [email protected] • Web: www.mercatorgeo.com
9
through a series of option and lease agreements with the Pulacayo Mining Cooperative and COMIBOL, The Mining Corporation of Bolivia. On January 21, 2011 Apogee entered into a definitive agreement with GMC to acquire all of the issued and outstanding shares of an indirectly held subsidiary of GMC known as ASC, which holds a 100% interest in the Pulacayo-Paca Project.
Pursuant to the agreement, Apogee subsequently acquired all of the issued and outstanding shares of the subsidiary by issuing a total of 8,000,000 common shares of the company to GMC and paying GMC a cash fee in the amount of $500,000 eighteen. .
Mr. Gustavo A. Miranda Pinaya, Executive President and in-house legal counsel for Apogee Minerals Bolivia SA. provided Mercator with the following property ownership report, dated September 26th, 2012, that details Concession, Lease and Joint Venture agreements that pertain to the company’s involvement with the Pulacayo and Paca properties. On September 26th, 2012 Mr. Miranda Pinaya also confirmed that conditions described in this report remained in place at the effective date of this report. Mercator has relied upon this information for report purposes and has not independently verified related content. 1) Comibol / Pulacayo Ltda. Lease Agreement
The Bolivian Mining Corporation (COMIBOL) and the Pulacayo Ltda. Mining Cooperative have executed a Lease Agreement (Contrato de Arrendamiento) according to the “Testimonio” No. 235/97 dated 08/01/1997 granted by the Mining and Petroleum Special Notary from La Paz (María Esther Vallejos). The Testimonio was registered before Mining Registry under the No. 253 Book “B” dated 09/05/1997. There is no reference on the “Testimonio” about the registration before the Potosí Real State Office. However, the amendment referred ahead was duly registered which implies that the Lease Agreement was registered.
The Lease Contract includes the following Special Transitory Authorizations ( “STA” and
formerly known as “mining concessions”): Pulacayo Group: Pulacayo (1,031 hectares), Porvenir (1,099), Huanchaca (460 hectares), Galería General (76 hectares) and Rochschild (3 hectares). Ubina Group: Santa Bárbara (149 hectares), La Esperanza (148 hectares), Flora (60 hectares) and Victoria (40 hectares). Cholita Chaquiri Group: Cholita (10 hectares) and Tolentino (220 hectares). All the concessions (a total of 3,296 hectares) are owned by the COMIBOL.
As described on the agreement, contained on the Testimonio 65/2002 dated May 13, 2002,
granted by Notary Public No. 003, executed between the Pulacayo Cooperative and COMIBOL the STA (property of COMIBOL) “Real del Monte” and “Temeridad” have been included on the agreement mentioned on previous paragraphs. Both STA are located on the main area of PACA (where most of the drilling was performed).
The term of the Lease Agreement is 15 years, starting June 1997, there is no “day”
Pulacayo Silver-Lead-Zinc Deposit Technical Report November 2012
65 Queen St. • Dartmouth, NS B2Y 1G4 • Ph.: (902) 463-1440 • Fax: (902) 463-1419
E-mail: [email protected] • Web: www.mercatorgeo.com
10
mentioned on the Testimonio, only the month and the year are described. The contract is valid until June 2012. The term could be extended.
The Lease establishes a rent equal to 1% of the net production value. If the payment has a 3
month delay then the contract is terminated.
The Scope of the Lease Agreement is the Mining, Development, Milling and Marketing of ore from Pulacayo, Ubina and Cholita Chaquiri areas in the Province Quijarro, Potosí District. Exploration is permitted under the Lease Agreement.
An amendment to the aforementioned contract was executed between COMIBOL and the
Pulacayo Ltda. Mining Cooperative according to the “Testimonio” No. 115/2002 dated 07/30/2002 granted by Public Notary from La Paz No. 003 (Nelly Alfaro de Maldonado). The Testimonio was registered before Mining Registry under the No. PT-195 File No. 195 dated 08/02/2002, and finally registered before the Potosí Real State Office under the Partida No. 61-26 File No. 50vta.– 20 Book No. 8-49, dated 08/08/2002.
The amendment extends the term of the Lease Contract until June 23rd, 2025 under the
condition to execute a Joint Venture Agreement with a “strategic partner”. If the Joint Venture is not executed or is terminated then the term of the Lease Contract will return to the original term (June 2012).
An exploration period of five years is allowed. During this period the “strategic partner”
must pay U$. 1,000 per month to COMIBOL as rent fee. A minimum investment of U$. 300,000 in exploration costs is compromised, a U$. 30,000 bond (Boleta de Garantía Bancaria) must be granted on behalf of COMIBOL to guarantee the investment during the exploration period.
A third party could be part of the ”Pulacayo/Strategic Partner” Joint Venture Agreement, but
under permission from COMIBOL’s Board, previous written request. COMIBOL’s Board may deny permission. The third party must have a renowned name and capacity on the mining industry.
2) Pulacayo Ltda. / ASC Bolivia LDC (Sucursal Bolivia) Joint Venture Agreement
The Pulacayo Ltda. Mining Cooperative and ASC BOLIVIA LDC (Sucursal Bolivia)(a subsidiary of APEX) have executed a Joint Venture Agreement (Contrato de Riesgo Compartido) according to the “Testimonio” No. 116/2002 dated 07/30/2002 granted by Public Notary from La Paz No. 003 (Nelly Alfaro de Maldonado). The Testimonio was registered before Mining Registry under the No. PT-197 File No. 144 dated 08/02/2002, and finally registered before the Potosí Real State Office under the Partida No. 62-27 File No. 54vta.– 24 Book No. 8-49, dated 08/12/2002.
COMIBOL’s Board through Board’s Resolution No. 2594/2002 dated July 25th 2002 has

Pulacayo Silver-Lead-Zinc Deposit Technical Report November 2012
65 Queen St. • Dartmouth, NS B2Y 1G4 • Ph.: (902) 463-1440 • Fax: (902) 463-1419
E-mail: [email protected] • Web: www.mercatorgeo.com
11
authorized the execution of the Joint Venture Agreement.
The Joint Venture Agreement only includes the Pulacayo Group of mining concessions: Pulacayo (1,031 hectares), Porvenir (1,099), Huanchaca (460 hectares), Galería General (76 hectares), Roschild (3 hectares), Temeridad (10 hectares) and Real del Monte (24 hectares).
The term of the Joint Venture Agreement is 23 years starting July 30th, 2002. The first five
years are for the exploration period.
The Joint Venture Agreement could be terminated at any time if results from exploration are not satisfactory to ASC Bolivia LDC.
ASC Bolivia LDC is committed to pay to COMIBOL U$. 1,000 during the exploration
period.
During the mining period ASC Bolivia LDC will pay to COMIBOL the equivalent of 2.5% of the Net Smelter Return (NSR) and 1,5% of the Net Smelter Return (NSR) to the Pulacayo Cooperative.
The First Stage of Exploration implies the investment of U$. 500,000 or at least a minimum
of U$. 300,000 during the sixth to eighth month.
As defined on the clause 21st of the Joint Venture Agreement a third party could be integrated to the Joint Venture under permission of COMIBOL’s Board.
3) ASC Bolivia LDC (Sucursal Bolivia) /Apogee Minerals Bolivia S.A. Option Agreement
to Be Part of a “Joint Venture Agreement”
Apogee Minerals Bolivia S.A. and ASC BOLIVIA LDC (Sucursal Bolivia) have executed an Option Agreement to be Part of a “Joint Venture Agreement” (Contrato de Opción para la Incorporación a un Contrato de Riesgo Compartido) according to the “Testimonio” No. 68/2006 dated 03/08/2006 granted by Public Notary from La Paz No. 038 (Daysi Benito Pozzo). The contract establishes the conditions that Apogee Minerals Bolivia S.A. must fulfill to vest 60% participation on the Pulacayo Cooperative / ASC Bolivia LDC Joint Venture Agreement and also to have 60% participation on the Paca Group of mining properties through a Joint Venture Agreement.
The inclusion of Apogee Minerals Bolivia S.A. to the Pulacayo Cooperative / ASC Bolivia
LDC Joint Venture Agreement was authorized by the Board of COMIBOL according to the Board Resolution dated November 8th, 2005.
The inclusion of Apogee Minerals Bolivia S.A. to the Pulacayo Cooperative / ASC Bolivia
LDC Joint Venture Agreement was also approved by the Board of the Cooperative according to the letter dated August 17th, 2005.
Pulacayo Silver-Lead-Zinc Deposit Technical Report November 2012
65 Queen St. • Dartmouth, NS B2Y 1G4 • Ph.: (902) 463-1440 • Fax: (902) 463-1419
E-mail: [email protected] • Web: www.mercatorgeo.com
12
The agreement includes the Pulacayo and the Paca Group of STA. The Paca Group of STA
is property or is under the control of ASC Bolivia LDC.
On October 23rd 2007 an amendment to the Option Agreement to be Part of a “Joint Venture Agreement” was executed, extending the term of the mentioned agreement until July 30th 2009, and in consequence extending the deadline to prepare a Feasibility Study until such date.
On May 19th 2009, COMIBOL approved Apogee’s request to extend the deadline to deliver
a Feasibility Study until November 30th 2009. In consequence the deadline mentioned on previous paragraph was extended to November 30th 2009.
If the Feasibility Study establishes the existence of a critical mass of resources, ASC will
have the chance to dilute Apogee’s participation from 60% to 40% if ASC in a term of 90 days notifies to Apogee that will develop Pulacayo to production.
However, in order to avoid the disclosure of the commitments between Apogee Minerals
Bolivia and ASC Bolivia LDC on regard of the incorporation of Apogee Minerals Bolivia S.A. to the Joint Venture Agreement, a simply separate agreement was executed by Apogee Minerals Bolivia S.A. and ASC Bolivia LDC. The mentioned agreement just details the incorporation of Apogee Minerals Bolivia S.A. to the Joint Venture Agreement and specifies the approval given by COMIBOL and the Pulacayo Cooperative. The mentioned agreement is detailed on the “Testimonio” No. 21/2006 dated 01/24/2006 granted by Public Notary from La Paz No. 038 (Daysi Benito Pozzo) and registered before the Mining Registry under No. PT-16 dated 06/22/2006.
On January 20, 2011, Golden Minerals Company ("Golden") entered into a Purchase and Sale Agreement (the "Purchase Agreement") with Apex Silver Mines. Apex Mining Partners Limited and Apogee Silver Ltd. ("Apogee") pursuant to which Apogee purchased through other Golden subsidiaries, all of Golden's interest in ASC Bolivia LDC, which holds a 100% interest in the Pulacayo Cooperative / ASC Bolivia LDC Joint Venture Agreement through ASC Bolivia LDC Sucursal Bolivia, the Bolivian branch of ASC Bolivia LDC.
As consequence of the aforementioned and as described on the “Testimonio” No. 438/2011 dated 07/15/2011 granted by Public Notary from La Paz No. 051 (Katherine Ramirez Calderon) on January 31st 2011, Apogee Minerals Bolivia S.A. and ASC Bolivia LDC Sucursal Bolivia have executed an agreement separating Apogee Minerals Bolivia S.A. from the Pulacayo Cooperative / ASC Bolivia LDC Joint Venture Agreement. On the third clause of the mentioned agreement it has been established that Apogee Minerals Bolivia S.A. will continue with the exploration duties, even a small scale pilot production, until all the environmental permits have been issued on behalf of ASC Bolivia LDC Sucursal Bolivia. Current environmental permits are under the name of Apogee Minerals Bolivia

Pulacayo Silver-Lead-Zinc Deposit Technical Report November 2012
65 Queen St. • Dartmouth, NS B2Y 1G4 • Ph.: (902) 463-1440 • Fax: (902) 463-1419
E-mail: [email protected] • Web: www.mercatorgeo.com
13
S.A.
And also as consequence of the aforementioned, the Pulacayo Cooperative / ASC Bolivia LDC Joint Venture Agreement has returned to its original scheme with the Pulacayo Cooperative and ASC Bolivia LDC Sucursal Bolivia as parties.
Figure 3.2 shows the distribution of Apogee licences on the property and Table 3.1 lists the individual holdings that comprise Apogee’s Pulacayo-Paca portfolio. Table 3.1: Summary of Apogee’s Pulacayo-Paca Exploration Holdings Pulacayo Group
Concession Owner Size (ha) Patentes Payment Registration Number
Pulacayo COMIBOL 1031 Payment is not required 512-01015
Porvenir COMIBOL 1199 Payment is not required 512-01165
Huanchaca COMIBOL 460 Payment is not required 512-03903
Galería General COMIBOL 76 Payment is not required 512-01160
Roschild COMIBOL 3 Payment is not required 512-03908
Temeridad COMIBOL 10 Payment is not required 512-00992
Real del Monte COMIBOL 24 Payment is not required 512-00994
Paca Group
Concession Owner Size (has) Patentes Payment Registration Number
Apuradita ASC Bolivia LDC 750 2012 512-03652
Apuradita II ASC Bolivia LDC 1275 2012 512-03773
Sally ASC Bolivia LDC 125 2012 512-04318
Tatoe ASC Bolivia LDC 875 2012 512-04319
Khullku ASC Bolivia LDC 2775 2012 512-04784
Lupitaca ASC Bolivia LDC 675 2012 512-04778
Phico Grande Jaime Rubín de Celis / ASC
Bolivia LDC 9400 2012 512-04779
Khasa Pampa ASC Bolivia LDC 4150 2012 512-05015
TOTAL SIZE 22828

MSLINK NROFOR PADRON NOMBRE PROPIETARIO CULAS SOLICCUADRICULAS
ASIGNADAS16464 16464 512-03652 APURADITA ASC BOLIVIA LDC (SUCURSAL BOLIVIA) 30 3016856 16856 512-03773 APURADITA-II ASC BOLIVIA LDC (SUCURSAL BOLIVIA) 51 5118086 18086 512-04318 SALLY ASC BOLIVIA LDC (SUCURSAL BOLIVIA) 5 518167 18167 512-04319 TATOE ASC BOLIVIA LDC (SUCURSAL BOLIVIA) 35 3519716 19716 512-04779 PHICO GRANDE JAIME ARSENIO RUBIN DE CELIS NAVARRO 376 37619717 19717 512-04784 KHULLKU ASC BOLIVIA LDC (SUCURSAL BOLIVIA) 111 11119718 19718 512-04778 LUPITACA ASC BOLIVIA LDC (SUCURSAL BOLIVIA) 27 2721005 21005 512-05015 KHASA PAMPA ASC BOLIVIA LDC (SUCURSAL BOLIVIA) 167 16622494 22494 512-05746 EL ENCANTO SILEX BOLIVIA S.A. 446 446
MSLINK NOMCON TIPCON NROPERT UNIPERT PROPIE CANTON394 GALERIA GENERAL EXPLOTACION 76 HAS CORPORACION MINERA DE BOLIVIA UBINA608 PULACAYO EXPLOTACION 1031 HAS CORPORACION MINERA DE BOLIVIA YURA609 PORVENIR EXPLOTACION 1199 HAS CORPORACION MINERA DE BOLIVIA YURA
1281 TEMERIDAD EXPLOTACION 10 HAS CORPORACION MINERA DE BOLIVIA THOLA PAMPA1312 REAL DEL MONTE EXPLOTACION 24 HAS CORPORACION MINERA DE BOLIVIA HUANCHACA
21755 HUANCHACA EXPLOTACION 470 HAS CORPORACION MINERA DE BOLIVIA UBINA21762 ROSCHILD EXPLOTACION 3 HAS CORPORACION MINERA DE BOLIVIA YURA
14
ASC Properties
Comibol Properties
Comibol Other Properties

Pulacayo Silver-Lead-Zinc Deposit Technical Report November 2012
65 Queen St. • Dartmouth, NS B2Y 1G4 • Ph.: (902) 463-1440 • Fax: (902) 463-1419
E-mail: [email protected] • Web: www.mercatorgeo.com
15
3.4 Environmental Considerations Apogee President, Mr. C. Collins, P. Geo., provided Mercator with the following summary discussion of environmental considerations that pertain to the Pulacayo property. On September 26th, 2012 Mr. Collins also confirmed that conditions described below remained in place at the effective date of this report. Mercator has relied upon this information from Apogee for report purposes and has not independently verified such content. The project’s current environmental operating requirements are set out in compliance with the Environment Law (Law Nº 1333) and the Environmental Regulation for Mining Activities. A certificate of exemption has been obtained for the exploration phase and an audit of the Environmental Base Line (ALBA) was carried out between December, 2007 and July, 2008 by Mining Consulting & Engineering “MINCO S.R.L.”, a Bolivian based professional consulting firm with broad exposure to the mining industry. Its audit report summarizes the work carried out during the Environmental Assessment by Apogee and includes 1) a compilation of information on the local vegetation, animals, soil, water, air, etc., including collection of more than 500 samples in the area of interest to support the conclusions and recommendations of the report; 2) an evaluation of the social impact of the project; 3) an evaluation of the area contaminated during previous mining activities, including tailings, abandoned facilities, acid waters, scrap, etc; 4) an evaluation of other environmental liabilities.
On May 25, 2011 Apogee was awarded an environmental licence by the Bolivian authorities sanctioning mining operations at its Pulacayo project. The permit (Certificado de Ispensación Categoria 3 Para Exploración y Actividades Mineras Menores/EMAP) allows for the extraction of up to 200 tonnes per day from underground for stockpiling and transporting for off-site processing.
3.5 Access To Property For Recommended Work Programs Apogee advised Mercator that all permits necessary to carry out the work programs recommended in this report are currently in place. Apogee President, Mr. C. Collins, P. Geo., confirmed this on September 26th, 2012 and Mercator has relied upon this information for report purposes. Independent verification of permits and agreements was not carried out by Mercator..
Pulacayo Silver-Lead-Zinc Deposit Technical Report November 2012
65 Queen St. • Dartmouth, NS B2Y 1G4 • Ph.: (902) 463-1440 • Fax: (902) 463-1419
E-mail: [email protected] • Web: www.mercatorgeo.com
16
4 Accessibility, Climate, Local Resources, Infrastructure and Physiography
The discussions presented in report sections 4.1 through 4.4 are modified after those presented by Pressacco et al. (2010) and are otherwise directly based on an internal Apogee report referenced for current purposes as Iriondo et al. (2009). These report sections are presented below without change from Cullen and Webster (2011).
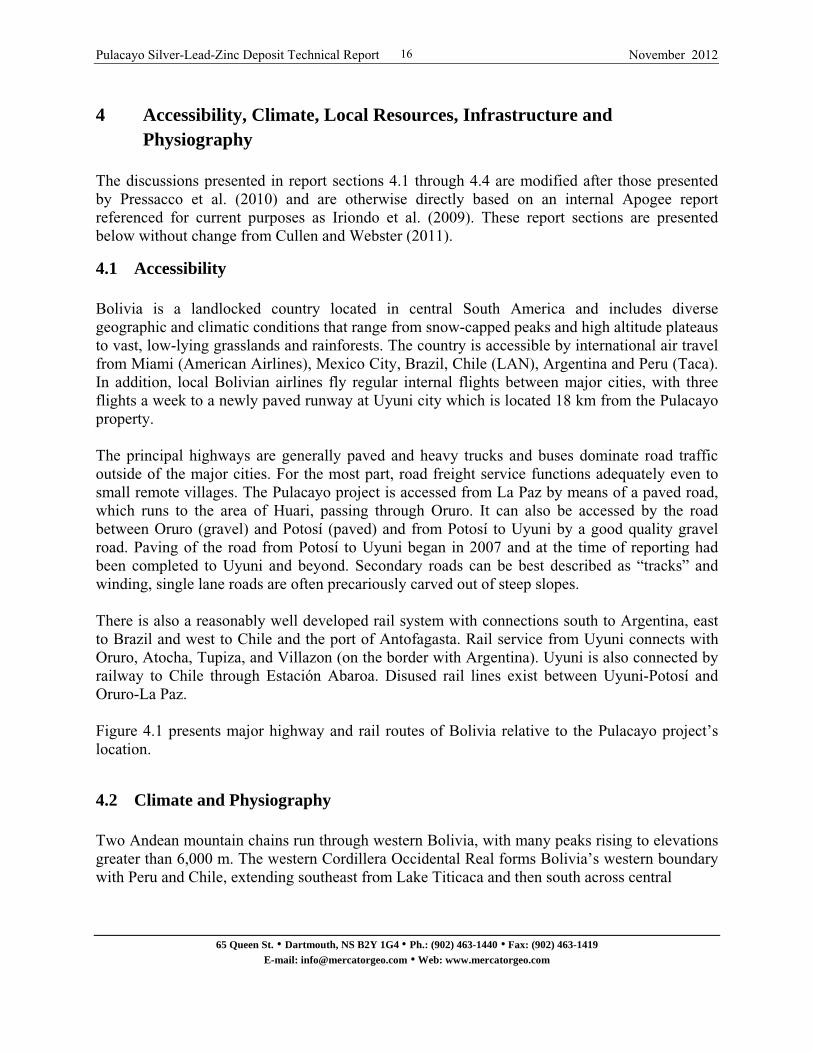
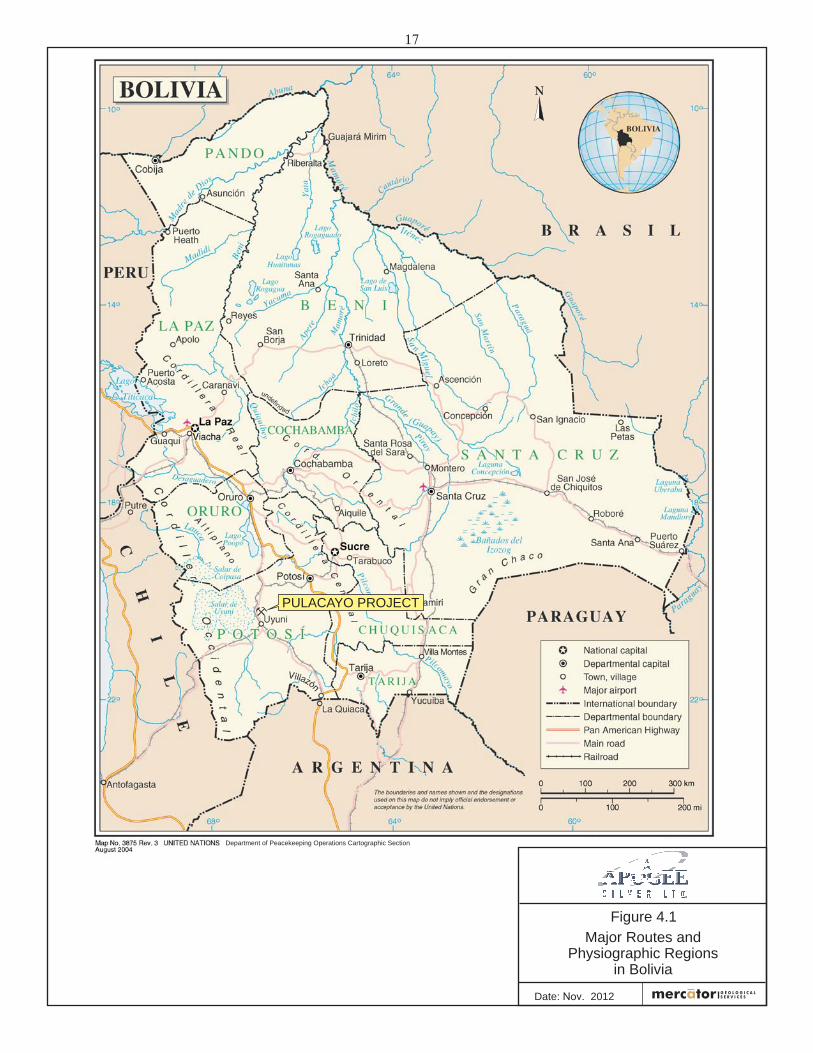
4.1 Accessibility Bolivia is a landlocked country located in central South America and includes diverse geographic and climatic conditions that range from snow-capped peaks and high altitude plateaus to vast, low-lying grasslands and rainforests. The country is accessible by international air travel from Miami (American Airlines), Mexico City, Brazil, Chile (LAN), Argentina and Peru (Taca). In addition, local Bolivian airlines fly regular internal flights between major cities, with three flights a week to a newly paved runway at Uyuni city which is located 18 km from the Pulacayo property. The principal highways are generally paved and heavy trucks and buses dominate road traffic outside of the major cities. For the most part, road freight service functions adequately even to small remote villages. The Pulacayo project is accessed from La Paz by means of a paved road, which runs to the area of Huari, passing through Oruro. It can also be accessed by the road between Oruro (gravel) and Potosí (paved) and from Potosí to Uyuni by a good quality gravel road. Paving of the road from Potosí to Uyuni began in 2007 and at the time of reporting had been completed to Uyuni and beyond. Secondary roads can be best described as “tracks” and winding, single lane roads are often precariously carved out of steep slopes. There is also a reasonably well developed rail system with connections south to Argentina, east to Brazil and west to Chile and the port of Antofagasta. Rail service from Uyuni connects with Oruro, Atocha, Tupiza, and Villazon (on the border with Argentina). Uyuni is also connected by railway to Chile through Estación Abaroa. Disused rail lines exist between Uyuni-Potosí and Oruro-La Paz. Figure 4.1 presents major highway and rail routes of Bolivia relative to the Pulacayo project’s location.
4.2 Climate and Physiography Two Andean mountain chains run through western Bolivia, with many peaks rising to elevations greater than 6,000 m. The western Cordillera Occidental Real forms Bolivia’s western boundary with Peru and Chile, extending southeast from Lake Titicaca and then south across central
Department of Peacekeeping Operations Cartographic Section
Major Routes andPhysiographic Regions
in Bolivia
Date: Nov. 2012
Figure 4.1
17
PULACAYO PROJECT
N
Pulacayo Silver-Lead-Zinc Deposit Technical Report November 2012
65 Queen St. • Dartmouth, NS B2Y 1G4 • Ph.: (902) 463-1440 • Fax: (902) 463-1419
E-mail: [email protected] • Web: www.mercatorgeo.com
18
Bolivia to join with the Cordillera Central along the country’s southern border with Argentina. Between these two mountain chains is the Altiplano, a high flat plain system at elevations between 3,500 m and 4,000 m above sea level. East of the Cordillera Central a lower altitude region of rolling hills and fertile basins having a tropical climate occurs between elevations of 300 m and 400 m above sea level. To the north, the Andes adjoin tropical lowlands of Brazil’s Amazon Basin (Figure 4.1). Climate within Bolivia is altitude related. The rainy period lasts from November to March and corresponds with the southern hemisphere’s summer season. Of the major cities, only Potosí receives regular snowfalls, with these typically occurring between February and April at the end of the rainy season. La Paz and Oruro occasionally receive light snow. On the Altiplano and in higher altitude areas, sub-zero temperatures are frequent at night throughout the year. Snow capped peaks are present year round at elevations greater than approximately 5,200 m. The Pulacayo project area is located immediately southwest of the Cosuño Caldera and local topographic relief is gentle to moderate, with elevations ranging between 4,000 m and 4,500 m above sea level. The Paca and Pulacayo Domes are volcanic structures that exist as prominent topographic highs in this area. Pulacayo has a semi-arid climate, with annual rainfall of approximately 100 mm and a mean summer temperature of 12°C between October and March. During winter, minimum temperatures reach the -20 to -25 degree C range and summer maximums in the 18 to 20°C range occur in June and July. Yearly mean temperature is 5.5°C. Vegetation is sparse to non-existent and consists of only local low bushes.
4.3 Local Resources and Infrastructure Bolivia has a long history as a significant primary producer of silver and tin, with associated secondary production of gold, copper, antimony, bismuth, tungsten, sulphur and iron. The country also contains sizeable reserves of natural gas that have not been fully developed to date due to export issues and limited access to required infrastructure. The country has an abundance of hydroelectric power and transmission lines which parallel the road system provide service to most major settlements. Remote villages generally have diesel generators which run infrequently during evening hours. Transmission lines from the hydroelectric plants of Landara, Punutuma, and Yura that were reconditioned by a joint venture between COMIBOL and the Valle Hermoso Electrical Company pass within a few kilometres of Pulacayo. Telephone service and internet access are available in most areas and cellular telephone service is widespread. However, coverage is not complete and international connectivity is not ensured. Local communication services in the area are good and consist of an ENTEL-based long-distance telephone service, a GSM signal for cell phones and two antennae for reception and transmission of signals from national television stations. Apogee has installed a satellite receiver to provide internet access for its operation and this service is shared with the Cooperative Social del Riesgo Compartido (Shared Risk Cooperative). An adequate supply of potable water for the

Pulacayo Silver-Lead-Zinc Deposit Technical Report November 2012
65 Queen St. • Dartmouth, NS B2Y 1G4 • Ph.: (902) 463-1440 • Fax: (902) 463-1419
E-mail: [email protected] • Web: www.mercatorgeo.com
19
town is supplied by pipeline from a dam and reservoir (Yana Pollera) facility located 28 km from Pulacayo in the Cerro Cosuño. Exploration in Bolivia by international companies has been minimal in recent years and Coeur d’Alene Mines Corporation (San Bartolome), Pan American Silver Ltd. (San Vicente), Glencore International plc (AR Zinc, Sinchi Wayra) and Apex Silver Mines Ltd - now Golden Minerals Company (San Cristóbal) have been the most significant international companies present in recent years. To a substantial degree this reflects political instability and threatened changes to mining taxation. Basic exploration services are available in Bolivia and include several small diamond core drilling contractors, ALS Group, which operates a sample preparation facility in Oruro, SGS Group which has operations in La Paz, and several locally owned assay facilities. The Bolivian National School of Engineering operates a technical college in Oruro (Universidad Técnica de Oruro) that includes a mineral processing department and laboratory facilities that provide commercial services to the mining industry. In general, an adequate supply of junior to intermediate level geologists, metallurgists, mining engineers and chemists is currently considered to be present in the country. Approximately 600 people currently live in Pulacayo on a permanent basis and many are associated with the Cooperativa Minera Pulacayo Ltda. (Pulacayo Mining Cooperative). The village has a state-run school and medical services are provided by the state’s Caja Nacional de Seguros (National Insurance Fund). A hospital and clinic function independently. Numerous dwellings and mining related buildings in Pulacayo are owned by COMIBOL some of these have been donated to the Pulacayo Mining Cooperative. Under the Shared Risk Contract, COMIBOL makes some mining infrastructure available for use by Apogee (Figure 4.2).
Figure 4.2: Pulacayo COMIBOL facility used by Apogee
Pulacayo Silver-Lead-Zinc Deposit Technical Report November 2012
65 Queen St. • Dartmouth, NS B2Y 1G4 • Ph.: (902) 463-1440 • Fax: (902) 463-1419
E-mail: [email protected] • Web: www.mercatorgeo.com
20
5 History
5.1 Introduction The following description of mining history is modified after Pressacco et al. (2010) and is directly based on an internal Apogee report written in Spanish. A more detailed description of exploration history is presented in Spanish by Iriondo et al. (2009). Report section 5.2 is presented without substantive change from Cullen and Webster (2012).
5.2 Summarized Exploration History Mining of silver deposits at Pulacayo began in the Spanish Colonial Period (c. 1545) but production details do not exist. The first work formally recorded on the property was carried out in 1833 when Mariano Ramírez rediscovered the Pulacayo deposit. In 1857 Aniceto Arce founded the Huanchaca Mining Company of Bolivia with support of French investors and subsequently pursued development and production at Pulacayo. Revenue from the mine funded the first railway line in Bolivia which in 1888 connected Pulacayo to the port of Antofagasta, Chile. In 1891 reported annual silver production reached 5.7 million ounces and mining operations at Pulacayo at that time were the second largest in Bolivia. Highest production is attributed to the nearby Cerro Rico de Potosi deposit. Pulacayo production was predominantly from the rich Veta Tajo (Tajo Vein System) which had been defined along a strike length of 2.5 km and to a depth of more than 1000 meters. In 1923 mining operation ceased due to flooding of the main working levels. In 1927, Mauricio Hochschild bought the property and re-started mine development. The Veta Cuatro vein was the focus of this work and was intersected at a mine elevation of approximately -266 m. It was proven to continue down-dip to the -776 m elevation where it showed a strike length of 750 m. During this time the 2.8 km long San Leon access tunnel was developed to facilitate ore haulage and the first recorded exploration work in the area was undertaken. Work continued through intervening years and in 1952 the Bolivian government nationalized the mines and administration of the Pulacayo deposit and management was assumed by the state mining enterprise COMIBOL. Operations continued under COMIBOL until closure in 1959 due to exhaustion of reserves and rising costs. COMIBOL also imposed cutbacks on exploration at this time. The total production from the Pulacayo mine during this period as estimated by the National Geological and Mineral Service of Bolivia (SERGEOTECHMIN) is 678 million ounces of
Pulacayo Silver-Lead-Zinc Deposit Technical Report November 2012
65 Queen St. • Dartmouth, NS B2Y 1G4 • Ph.: (902) 463-1440 • Fax: (902) 463-1419
E-mail: [email protected] • Web: www.mercatorgeo.com
21
silver, 200,000 tons of zinc and 200,000 tons of lead (SERGEOTECHMIN Bulletin No. 30, 2002, after Mignon 1989). In 1962 a local cooperative group named Cooperativa Minera Pulacayo (the “Cooperative”) was founded and this group leased the Pulacayo mine from COMIBOL. The Cooperative has operated small scale mining in the district since that time and continues to do so at present. Efforts are directed toward exploitation of narrow, very high grade silver mineralization in upper levels of the old mining workings, above the San Leon tunnel level. Modern exploration of the Pulacayo area began to a limited degree in the 1980’s when various mining and exploration companies targeted epithermal Ag and Au mineralization within the volcanic-intrusive system of the Pulacayo area. In 2001, ASC initiated an exploration program in the district, signed agreements with the Cooperative and completed regional and detailed geological mapping, topographic surveying and sampling of historical workings. Subsequently ASC completed 3 drill campaigns at Pulacayo, totalling 3,130 m of diamond drilling, and concluded that silver-lead—zinc mineralization and hydrothermal alteration in the district are controlled by a strong east-west fracturing system developed in the andesitic rocks hosting the Tajo Vein. Apogee acquired the property in 2006 under option from ASC and since that time has actively pursued exploration and economic assessment of the property. Details of Apogee programs carried out since 2006 are presented in chapter 8.0 of this report.
Pulacayo Silver-Lead-Zinc Deposit Technical Report November 2012
65 Queen St. • Dartmouth, NS B2Y 1G4 • Ph.: (902) 463-1440 • Fax: (902) 463-1419
E-mail: [email protected] • Web: www.mercatorgeo.com
22
6 Geological Setting
6.1 Regional Geology The regional geology of Bolivia is well described in various Bolivian government reports and is well summarized in technical reports completed for Apogee by Micon in 2008, 2009, and 2010. The following regional geology description was extracted from the 2010 Micon report (Pressacco et al., 2010) that in turn is based on translated content from an Apogee company report (Iriondo et al. 2009) and US Geological Survey Bulletin 1975. The following text is presented without substantive change from Cullen and Webster (2012). “In southwestern Bolivia, the Andes Mountains consist of three contiguous morphotectonic provinces, which are, from west to east, the Cordillera Occidental, the Altiplano, and the Cordillera Oriental. The basement beneath the area, which is as thick as 70 km, is believed to be similar to the rocks exposed immediately to the east, in the Cordillera Oriental, where a polygenic Phanerozoic fold and thrust belt consists largely of Paleozoic and Mesozoic marine shales and sandstones (Figure 6.1). Deposited mostly on Precambrian basement, the rocks of the Cordillera Oriental were deformed during at least three tectonic-orogenic cycles, the Caledonian (Ordovician), the Hercynian (Devonian to Triassic), and the Andean (Cretaceous to Cenozoic). The Altiplano is a series of high, intermontane basins that formed primarily during the Andean cycle, apparently in response to folding and thrusting. Its formation involved the eastward underthrusting of the Proterozoic and Paleozoic basement of the Cordillera Occidental, concurrent with the westward overthrusting of the Paleozoic miogeosynclinal rocks of the Cordillera Oriental. These thrusts resulted in continental foreland basins that received as much as 15,000 m of sediment and interlayered volcanic rocks during the Cenozoic. Igneous activity accompanying early Andean deformation was primarily focused further west, in Chile. During the main (Incaico) pulse of Andean deformation, beginning in the Oligocene and continuing at least until the middle Miocene, a number of volcano plutonic complexes were emplaced at several localities on the Altiplano, particularly along its eastern margin with the Cordillera Oriental, and to the south. In Pleistocene time, most of the Altiplano was covered by large glacial lakes. The great salars of Uyuni and Coipasa are Holocene remnants of these lakes. The Cordillera Occidental consists of late Miocene to Recent volcanic rocks, both lava flows and ashflow tuffs, primarily of andesitic to dacitic composition, that have been erupted in response to the subduction of the Nazca plate beneath the continent of South America. This underthrusting continues, and many of the volcanoes that form the crest of the Andes and mark the international border with Chile are presently active”.
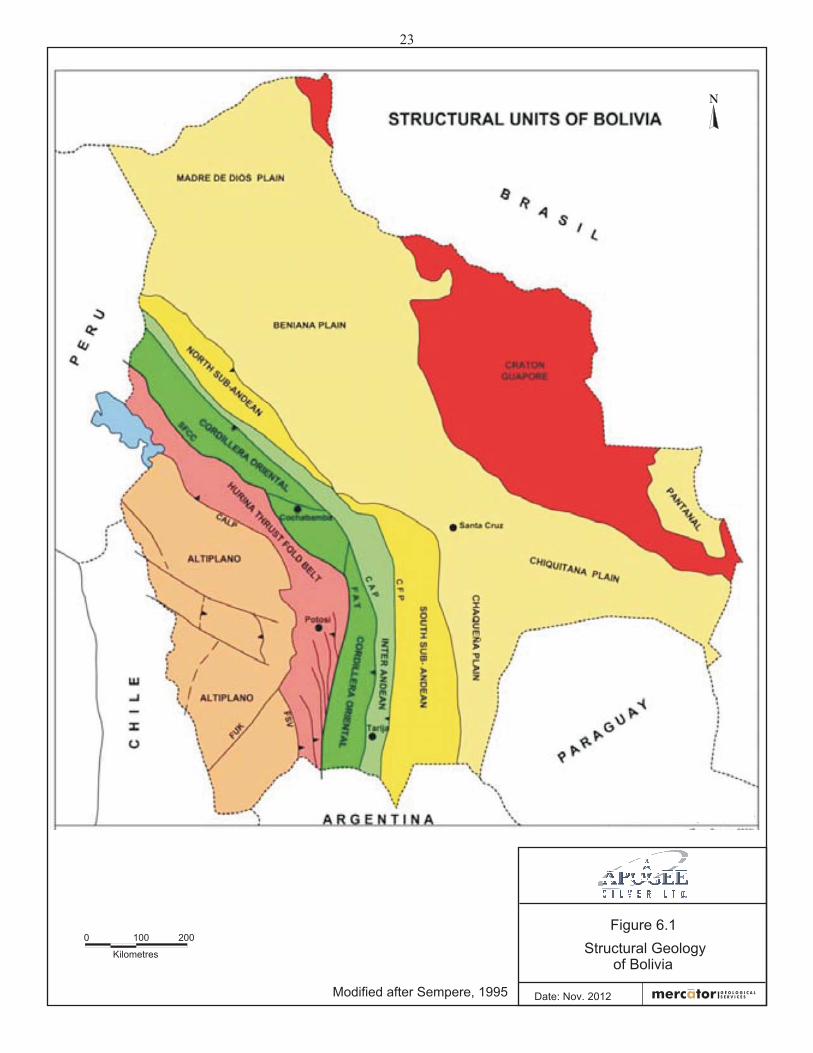
Structural Geologyof Bolivia
Date: Nov. 2012
Figure 6.1
23
Modified after Sempere, 1995
100
Kilometres
2000
N

Pulacayo Silver-Lead-Zinc Deposit Technical Report November 2012
65 Queen St. • Dartmouth, NS B2Y 1G4 • Ph.: (902) 463-1440 • Fax: (902) 463-1419
E-mail: [email protected] • Web: www.mercatorgeo.com
24
6.2 Local Geology As described earlier, Pulacayo is a low sulphidation epithermal polymetallic deposit hosted by sedimentary and igneous rocks of Silurian and Neocene age (Pressacco et al., 2010). The Silurian sediments underlie the volcanic rocks and include diamictites, sandstones and shales. The Neocene rocks are predominantly volcano-sedimentary in origin and include conglomerates, sandstones, rhyolitic tuffs, dacitic-rhyolitic domes, andesitic porphyries and andesitic flows. The following more detailed description is based on Iriondo et al (2009) as summarized by Pressaco et al. (2010).
The Pulacayo project is located on the western flank of a regional anticline that affects sedimentary and igneous rocks of Silurian, Tertiary and Quaternary ages on the western side of the Cordillera Oriental, near the Cordillera-Altiplano boundary. Figure 6.2 presents an interpretation of local geology and the structures and features discussed below are considered to be particularly important with respect to localization of mineralization in the Pulacayo district. The Uyuni-Khenayani Fault is a reverse fault which is believed to have controlled localization of volcanic center complexes at Cuzco, Cosuño, Pulacayo and San Cristóbal and related mineralized areas at Pulacayo, Cosuño, El Asiento, Carguaycollu and San Cristóbal. This fault brings Tertiary sediments in contact with Paleozoic formations at surface and is located about 4 km west of Pulacayo (Figure 6.2 and 6.3).
Figure 6.2: Regional geology map (From Iriondo et al., 2009)
N

Local GeologyPulacayo Project
Date: Nov. 2012
Figure 6.3
25
LAVA FLOW
DOMES, DACITE &
ANDESITE
TERTIARY SILTS
PALEOZOIC SILTS
BRECCIA ZONE
VEINS
FAULT
ANTICLINE
SAN LEON GALLERY
MINE ENTRANCE
PRINCIPAL PROJECT
POTENTIAL ZONE
SILICIFICATION
LEGEND
Taken from Iriondo et al. (2009)
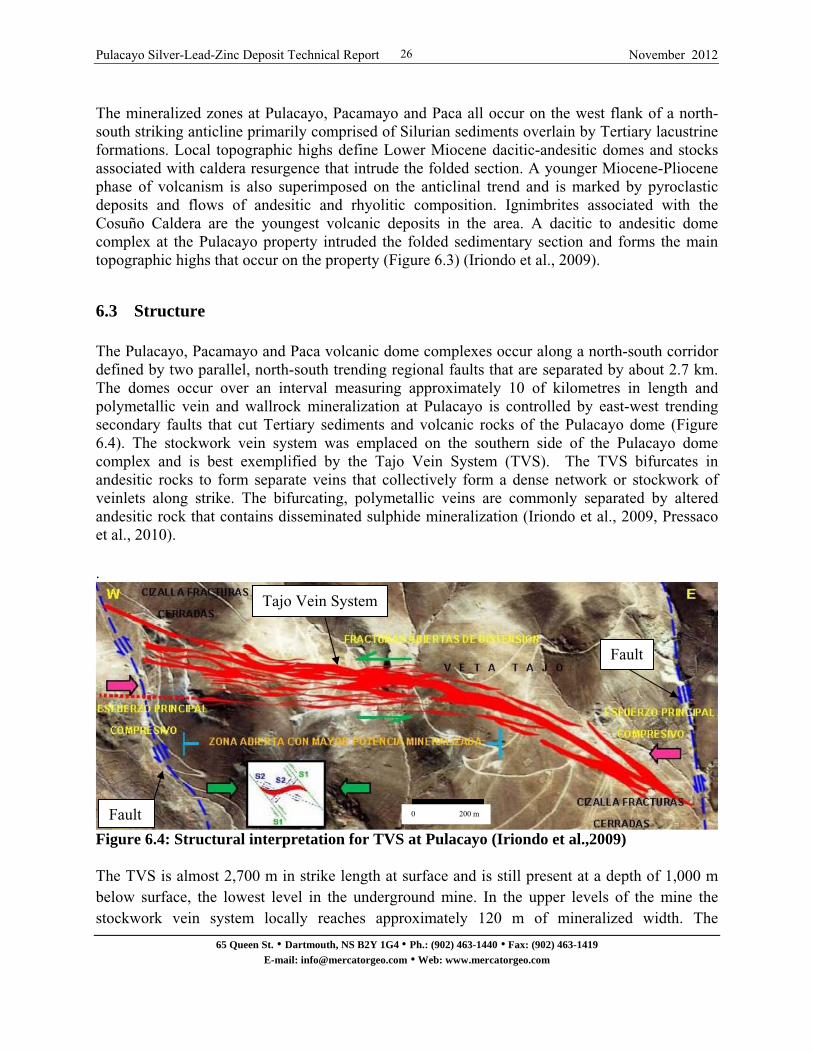
Pulacayo Silver-Lead-Zinc Deposit Technical Report November 2012
65 Queen St. • Dartmouth, NS B2Y 1G4 • Ph.: (902) 463-1440 • Fax: (902) 463-1419
E-mail: [email protected] • Web: www.mercatorgeo.com
26
The mineralized zones at Pulacayo, Pacamayo and Paca all occur on the west flank of a north-south striking anticline primarily comprised of Silurian sediments overlain by Tertiary lacustrine formations. Local topographic highs define Lower Miocene dacitic-andesitic domes and stocks associated with caldera resurgence that intrude the folded section. A younger Miocene-Pliocene phase of volcanism is also superimposed on the anticlinal trend and is marked by pyroclastic deposits and flows of andesitic and rhyolitic composition. Ignimbrites associated with the Cosuño Caldera are the youngest volcanic deposits in the area. A dacitic to andesitic dome complex at the Pulacayo property intruded the folded sedimentary section and forms the main topographic highs that occur on the property (Figure 6.3) (Iriondo et al., 2009).
6.3 Structure The Pulacayo, Pacamayo and Paca volcanic dome complexes occur along a north-south corridor defined by two parallel, north-south trending regional faults that are separated by about 2.7 km. The domes occur over an interval measuring approximately 10 of kilometres in length and polymetallic vein and wallrock mineralization at Pulacayo is controlled by east-west trending secondary faults that cut Tertiary sediments and volcanic rocks of the Pulacayo dome (Figure 6.4). The stockwork vein system was emplaced on the southern side of the Pulacayo dome complex and is best exemplified by the Tajo Vein System (TVS). The TVS bifurcates in andesitic rocks to form separate veins that collectively form a dense network or stockwork of veinlets along strike. The bifurcating, polymetallic veins are commonly separated by altered andesitic rock that contains disseminated sulphide mineralization (Iriondo et al., 2009, Pressaco et al., 2010).
.
Figure 6.4: Structural interpretation for TVS at Pulacayo (Iriondo et al.,2009) The TVS is almost 2,700 m in strike length at surface and is still present at a depth of 1,000 m below surface, the lowest level in the underground mine. In the upper levels of the mine the stockwork vein system locally reaches approximately 120 m of mineralized width. The
0 200 m
Tajo Vein System
Fault
Fault

Pulacayo Silver-Lead-Zinc Deposit Technical Report November 2012
65 Queen St. • Dartmouth, NS B2Y 1G4 • Ph.: (902) 463-1440 • Fax: (902) 463-1419
E-mail: [email protected] • Web: www.mercatorgeo.com
27
polymetallic veins exhibit a sigmoidal geometry along strike, which is generally interpreted to be the result of sinistral movement along the 2 north-south oriented bounding faults mentioned earlier (Figure 6.4) (Iriondo et al. (2009).
6.4 Alteration Wall rock alteration is spatially associated with the main vein system trends at Pulacayo and includes propylitic, sericitic, moderate-advanced argillic, and siliceous assemblages. Host rock composition exerts a strong local influence on both the nature of alteration assemblages present and their relative intensity of development. On this basis, spatial distribution of hydrothermal alteration assemblages in the district is a useful indicator of proximity to mineralized structures. Moderate argillic alteration is observed throughout the Pulacayo area and transitions to intense argillic alteration in close proximity to veins and disseminated-stockwork zones. Haloes of silicification are developed around vein contacts and measure up to several cm in width in some cases. Silicification grades into advanced argillic alteration as distance into the wall rock increases from the vein contact and this gradually grades to argillic and propylitic zones with greater distance from the contact (Pressacco et al., 2010).
6.5 Mineralization As referenced by Pressacco et al. (2010) the Pulacayo deposit is considered an example of a sub-volcanic epithermal mineralization system showing well developed vertical metal zonation. The main mineralized vein and stockwork system developed on the southern flank of a dacitic intrusive dome and shows a surface strike dimension of 2700 m. At Pulacayo east-west striking faults are interpreted to have acted as a conduit system for mineralizing fluids, with sulphide precipitation in open spaces to form veins and along fractures or by replacement to form zones of disseminated mineralization. Changes in temperature, pressure and redox state between the wall rock and fluid are thought to have influenced the style and intensity of mineralization. As such, silver lead and zinc mineralization at Pulacayo is typical of a high level epithermal system that in this case is hosted by sedimentary and intrusive rocks of Silurian and Neocene age repectively. The principal mineralized structure at Pulacayo is the TVS which has historically been the main silver producer of the mine. The TVS is a large structural stockwork system that trends east-west and dips 75° to 90° to the south (Figure 6.4). The high grade parts of the TVS were historically mined as single veins over widths of 1 m to 3 m but transitions from this setting into zones of complex quartz-sulphide or sulphide vein arrays that include conjugate veins, veinlets, stockworks and disseminated sulphides that occur over widths ranging from less than a meter up to 120 m. Mineralization of economic interest at Pulacayo is predominantly comprised of sphalerite, galena and tetrahedrite in sulphide-rich veins that are accompanied by locally abundant quartz, barite and pyrite. These veins range from a few cm to greater than 1 m in thickness and disseminated
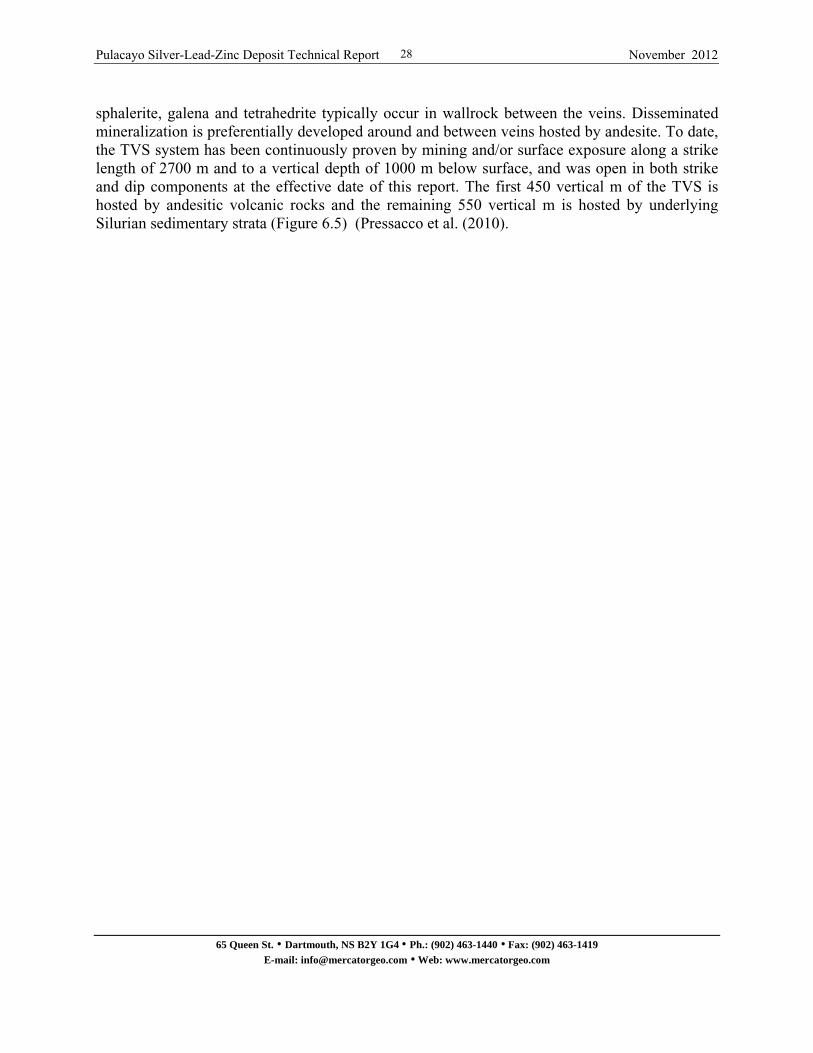
Pulacayo Silver-Lead-Zinc Deposit Technical Report November 2012
65 Queen St. • Dartmouth, NS B2Y 1G4 • Ph.: (902) 463-1440 • Fax: (902) 463-1419
E-mail: [email protected] • Web: www.mercatorgeo.com
28
sphalerite, galena and tetrahedrite typically occur in wallrock between the veins. Disseminated mineralization is preferentially developed around and between veins hosted by andesite. To date, the TVS system has been continuously proven by mining and/or surface exposure along a strike length of 2700 m and to a vertical depth of 1000 m below surface, and was open in both strike and dip components at the effective date of this report. The first 450 vertical m of the TVS is hosted by andesitic volcanic rocks and the remaining 550 vertical m is hosted by underlying Silurian sedimentary strata (Figure 6.5) (Pressacco et al. (2010).

Section Looking West
Taken from Apogee files.
Section PY-740200Pulacayo Project
Date: Nov. 2012
Figure 6.5
29
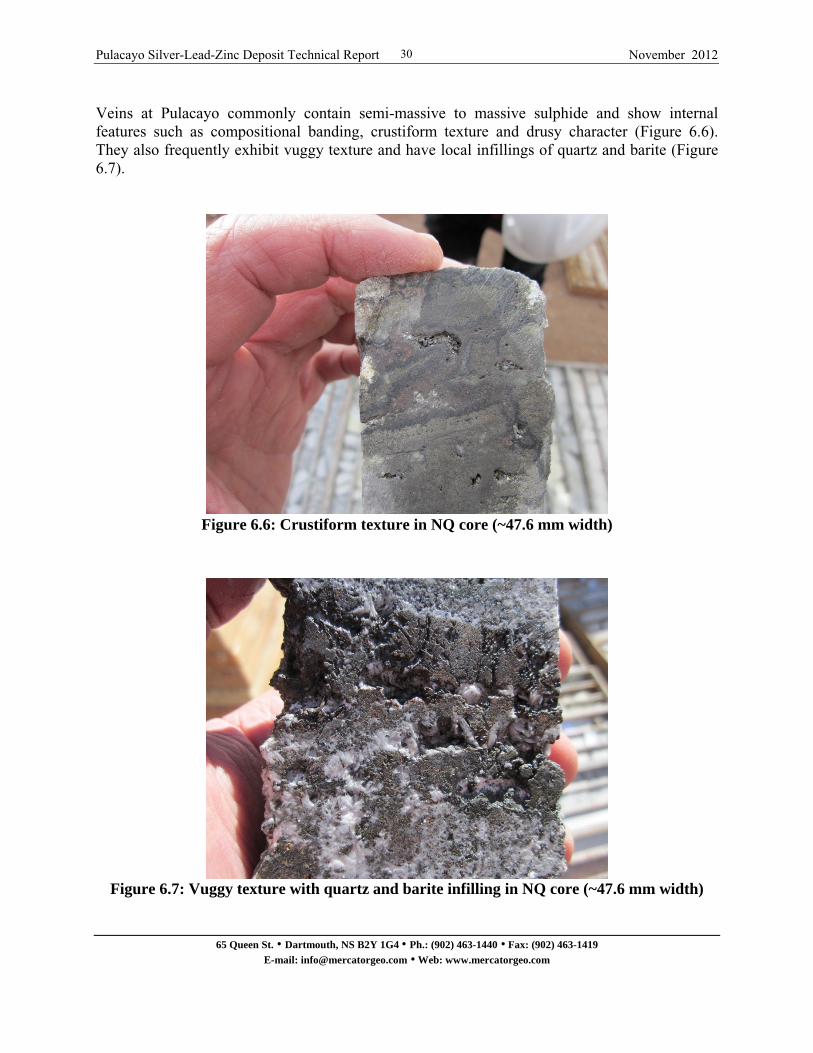
Pulacayo Silver-Lead-Zinc Deposit Technical Report November 2012
65 Queen St. • Dartmouth, NS B2Y 1G4 • Ph.: (902) 463-1440 • Fax: (902) 463-1419
E-mail: [email protected] • Web: www.mercatorgeo.com
30
Veins at Pulacayo commonly contain semi-massive to massive sulphide and show internal features such as compositional banding, crustiform texture and drusy character (Figure 6.6). They also frequently exhibit vuggy texture and have local infillings of quartz and barite (Figure 6.7).
Figure 6.6: Crustiform texture in NQ core (~47.6 mm width)
Figure 6.7: Vuggy texture with quartz and barite infilling in NQ core (~47.6 mm width)

Pulacayo Silver-Lead-Zinc Deposit Technical Report November 2012
65 Queen St. • Dartmouth, NS B2Y 1G4 • Ph.: (902) 463-1440 • Fax: (902) 463-1419
E-mail: [email protected] • Web: www.mercatorgeo.com
31
7 Deposit Type
The Pulacayo deposit has been classified as an epithermal deposit of low to intermediate sulphidation state association. Deposits of this type have been extensively researched and various summary publications that document specifics of the association are available. Examples of these include Lindgren (1922), White and Hedenquist (1994), Corbett and Leach, (1998) and Corbett, G.J., (2002). The following discussion of this deposit type is presented without change from Cullen and Weebster (2012), who cited the work completed earlier by Pressacco et al. (2010). Pressacco et al. (2010) highlighted the following key geological characteristics of Pulacayo that support classification as a low to intermediate sulphidation epithermal deposit and Figure 7.1 provides a schematic summary of the general deposit model:
The vein and disseminated sulphide mineralization is hosted by Tertiary volcanic rocks of intermediate composition that form part of an outcropping dome complex.
The mineralized body is composed of narrow veins, veinlets, stockworks and disseminations in argillicly-altered host rock that are controlled by an east-west oriented fault system. Width of the mineralized zone varies from a few m or less to 120 m.
Sedimentary rocks intruded by the dome complex host high grade veins such as TVS that
are typically less than 3 m in width but transition to stockwork and disseminated zones in overlying andesitic volcanic rocks that reach as much as 120 m in width.
The sulphide mineralization has been proven to continuously occur along strike for 2,700
m and to a depth of approximately 100 m below surface.
The vein system mineral assemblages are relatively simple and in combination are diagnostic of an epithermal setting. They consist of galena, sphalerite, tetrahedrite, and other silver sulfo-salts that form the main assemblage of economic interest and barite, quartz, pyrite and calcite that are present as gangue phases. Chalcopyrite and jamesonite are present in minor amounts locally.
Internal texture of veins is typically banded and drusy with segments containing almost massive sulphides. This is typical of epizonal veins that have been subjected to multiple pulses of mineralizing fluid.
Vertical metal zonation exists within the deposit that includes a mid-elevation zone of highest silver values that transition with depth to progressively increasing total base metal concentrations.

Pulacayo Silver-Lead-Zinc Deposit Technical Report November 2012
65 Queen St. • Dartmouth, NS B2Y 1G4 • Ph.: (902) 463-1440 • Fax: (902) 463-1419
E-mail: [email protected] • Web: www.mercatorgeo.com
32
Figure 7.1: Genesis of epithermal mineral deposits (From White and Hedenquist, 1994)
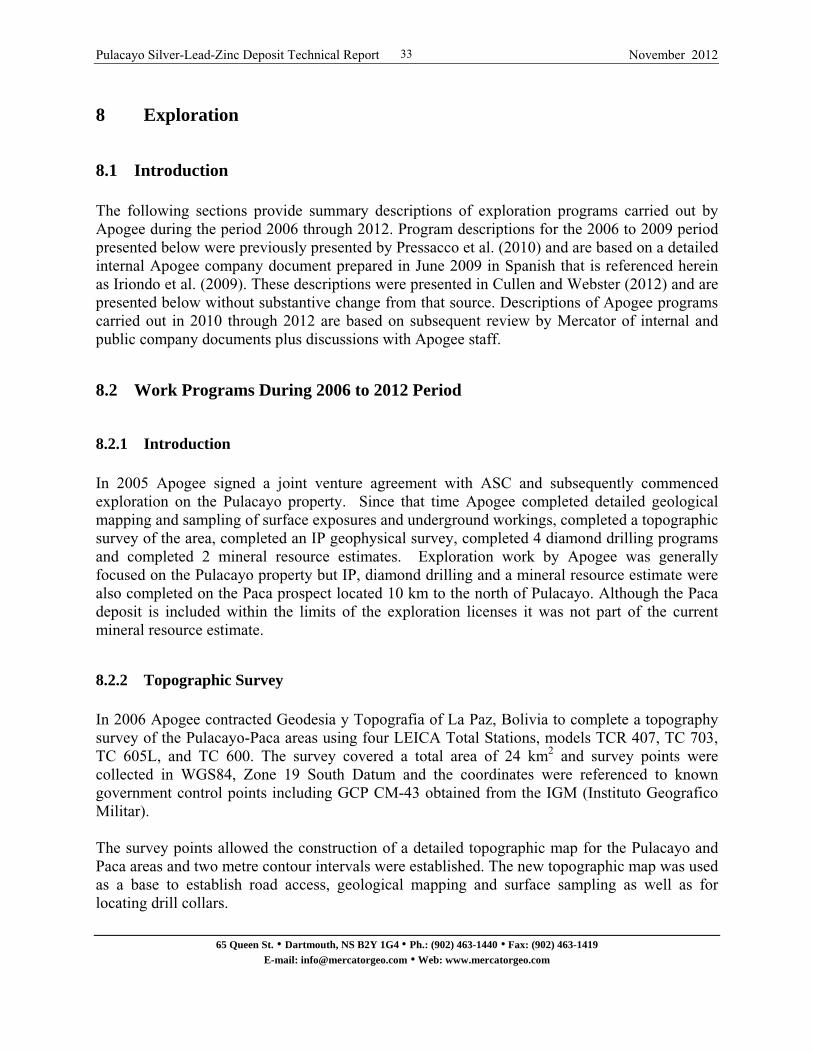
Pulacayo Silver-Lead-Zinc Deposit Technical Report November 2012
65 Queen St. • Dartmouth, NS B2Y 1G4 • Ph.: (902) 463-1440 • Fax: (902) 463-1419
E-mail: [email protected] • Web: www.mercatorgeo.com
33
8 Exploration
8.1 Introduction The following sections provide summary descriptions of exploration programs carried out by Apogee during the period 2006 through 2012. Program descriptions for the 2006 to 2009 period presented below were previously presented by Pressacco et al. (2010) and are based on a detailed internal Apogee company document prepared in June 2009 in Spanish that is referenced herein as Iriondo et al. (2009). These descriptions were presented in Cullen and Webster (2012) and are presented below without substantive change from that source. Descriptions of Apogee programs carried out in 2010 through 2012 are based on subsequent review by Mercator of internal and public company documents plus discussions with Apogee staff.
8.2 Work Programs During 2006 to 2012 Period
8.2.1 Introduction In 2005 Apogee signed a joint venture agreement with ASC and subsequently commenced exploration on the Pulacayo property. Since that time Apogee completed detailed geological mapping and sampling of surface exposures and underground workings, completed a topographic survey of the area, completed an IP geophysical survey, completed 4 diamond drilling programs and completed 2 mineral resource estimates. Exploration work by Apogee was generally focused on the Pulacayo property but IP, diamond drilling and a mineral resource estimate were also completed on the Paca prospect located 10 km to the north of Pulacayo. Although the Paca deposit is included within the limits of the exploration licenses it was not part of the current mineral resource estimate.
8.2.2 Topographic Survey In 2006 Apogee contracted Geodesia y Topografia of La Paz, Bolivia to complete a topography survey of the Pulacayo-Paca areas using four LEICA Total Stations, models TCR 407, TC 703, TC 605L, and TC 600. The survey covered a total area of 24 km2 and survey points were collected in WGS84, Zone 19 South Datum and the coordinates were referenced to known government control points including GCP CM-43 obtained from the IGM (Instituto Geografico Militar). The survey points allowed the construction of a detailed topographic map for the Pulacayo and Paca areas and two metre contour intervals were established. The new topographic map was used as a base to establish road access, geological mapping and surface sampling as well as for locating drill collars.
Pulacayo Silver-Lead-Zinc Deposit Technical Report November 2012
65 Queen St. • Dartmouth, NS B2Y 1G4 • Ph.: (902) 463-1440 • Fax: (902) 463-1419
E-mail: [email protected] • Web: www.mercatorgeo.com
34
As part of the field work, Eliezer Geodesia y Topografia also surveyed the collars of all completed drill-holes and established 12 surveyed grid lines for an Induced Polarization survey. Seven IP survey lines were located in the Pulacayo area and 5 were located in the Paca area. Surveyed stations were established at 50 m intervals along each line. A description and topographic surface is presented in section 13.3.4.1 and Figure 13.1.
8.2.3 Geological Mapping and Sampling Apogee initiated a surface mapping and sampling program at Pulacayo in 2005 and initially utilized preliminary geological maps completed by ASC in 2003. The company completed detailed 1:1,000 scale surface mapping that covered all exploration licenses, including both the Pulacayo and Paca areas. The sampling consisted mostly of rock chip samples taken from outcrops and the objective of the mapping program was to characterize the alteration patterns and locate sulphide mineralization both at surface and also within accessible underground mine workings. A total of 549 samples were collected from Andesita, Ramales, Paisano, TVS and Veta Cuatro. The Andesitas and Ramales areas are located to the east of the TVS and the Paisano area is located to the south of the TVS. Summary results of the geological mapping program appear in Figure 8.1. During 2006 Apogee also initiated development of a detailed, three dimensional digital model of the historic underground mine workings based on available historic records. The workings solid model was completed by EPCM Consultores S.R.L. (EPCM) and was subsequently modified by Apogee through transformation of the model from the historic mine grid to the current datum plus adjustment to include a +1% incline grade of the San Leon tunnel.
8.2.4 Geophysical Surveys An Induced Polarization geophysical survey was carried out by Apogee between November and December 2007. The survey covered grid lines on both the Pulacayo and Paca areas and the IP survey was completed by Fractal S.R.L (Fractal), a geophysical consulting company based in San Cruz, Bolivia and independent of Apogee. The survey used a dipole-dipole electrode configuration along 400 m spaced lines. A total of 29 line km of IP surveying was completed on the Pulacayo and Paca properties and data were recovered using a 50 m dipole spacing to n=6. Results are summarized by Iriondo et al. (2009). Seven geophysical survey lines oriented north-south were completed in the Pulacayo area and these were oriented approximately perpendicular to the east-west strike of the TVS (Figure 8.2). At Paca a total of 5 similarly oriented survey lines were completed. The IP survey was successful in outlining several areas of anomalously low apparent resistivity that, based on correlation in an area of known bedrock geology, were interpreted to represent weakly altered rocks. On the same basis high apparent resistivity zones were interpreted to represent zones of siliceous alteration.
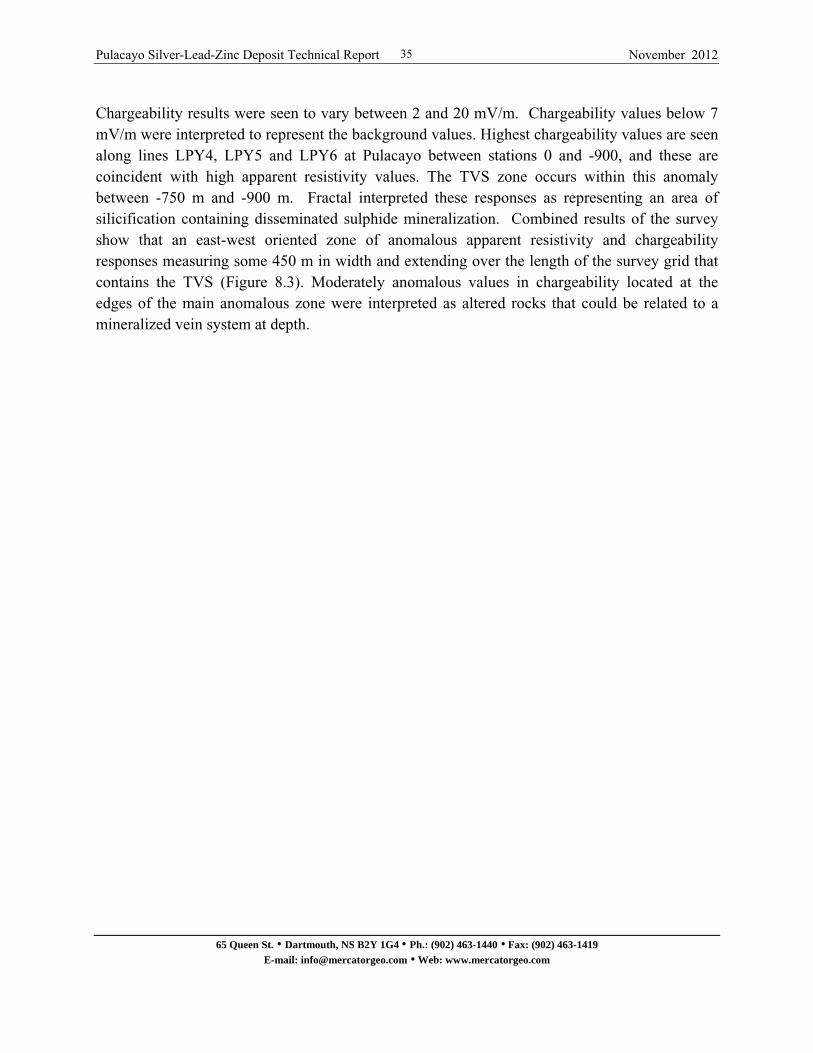
Pulacayo Silver-Lead-Zinc Deposit Technical Report November 2012
65 Queen St. • Dartmouth, NS B2Y 1G4 • Ph.: (902) 463-1440 • Fax: (902) 463-1419
E-mail: [email protected] • Web: www.mercatorgeo.com
35
Chargeability results were seen to vary between 2 and 20 mV/m. Chargeability values below 7 mV/m were interpreted to represent the background values. Highest chargeability values are seen along lines LPY4, LPY5 and LPY6 at Pulacayo between stations 0 and -900, and these are coincident with high apparent resistivity values. The TVS zone occurs within this anomaly between -750 m and -900 m. Fractal interpreted these responses as representing an area of silicification containing disseminated sulphide mineralization. Combined results of the survey show that an east-west oriented zone of anomalous apparent resistivity and chargeability responses measuring some 450 m in width and extending over the length of the survey grid that contains the TVS (Figure 8.3). Moderately anomalous values in chargeability located at the edges of the main anomalous zone were interpreted as altered rocks that could be related to a mineralized vein system at depth.
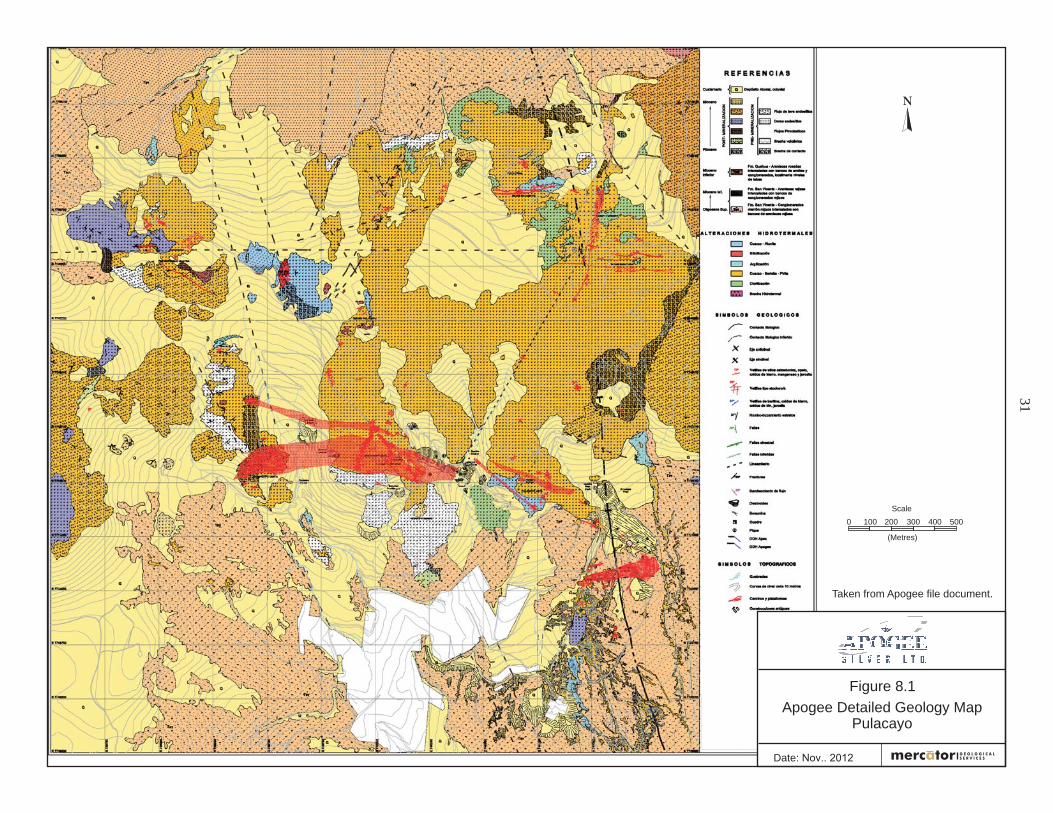
0 500
(Metres)
100 200 300 400
Scale
N
Taken from Apogee file document.
Apogee Detailed Geology MapPulacayo
Date: Nov.. 2012
Figure 8.1
31
Location of IP SurveyPulacayo Project
Date: Nov. 2012
Figure 8.2
37
L-PY5
Modified after Apogee file document. (2009)

RepresentativeIP Survey Responses
Date: May, 2012
Figure 8.3
33
L-PY5 - Apparent Resistivity
L-PY5 - Chargeability
TVS
TVS
See figure 8.2 for line locationModified after Iriondo et al. (2009)
NORTHSOUTH
Pulacayo Silver-Lead-Zinc Deposit Technical Report November 2012
65 Queen St. • Dartmouth, NS B2Y 1G4 • Ph.: (902) 463-1440 • Fax: (902) 463-1419
E-mail: [email protected] • Web: www.mercatorgeo.com
39
8.2.5 Diamond Drilling Details of diamond drilling carried out by Apogee on the Pulacayo property are reported in detail in Section 9.0 of this report and are summarized below. Since originally accessing the property in 2002, until the effective date of this report, ASC and Apogee have completed 69,739.15 m of drilling from surface and underground on the Pulacayo property. ASC drilling totaled 5009.2 m between 2002 and 2006 in 24 holes and Apogee drilling was completed in 4 subsequent phases. Phase I was undertaken between January and June of 2006 and included 19 holes totaling approximately 4,718 m. Phase II drilling was initiated in November, 2007 and consisted of 14 holes totaling 3,442.18 m. Phase III drilling was carried out between January and August of 2008 and included 84 drill holes totaling approximately 20,758.91m. Phase IV drilling that was carried out between January, 2010 and December 2011 and consisted of 35,810.81 m in 149 holes. The last 45 holes (6254m) of Phase IV were focused on oxide zone definition. Between June, 2006 and February, 2007, Apogee also completed 13,631.2 m of diamond drilling on the Paca deposit that is located approximately 10 km north of Pulacayo. Results of the program are reported in a mineral resource estimate for the Paca deposit completed in 2007 by Micon and reported by Pressacco and Gowans (2007). This drilling program is not material to the current Pulacayo resource estimate and is mentioned here for information purposes only.
8.2.6 Mineral Resource Estimates By Micon Two mineral resource estimates for the Pulacayo property were prepared on behalf of Apogee by Micon, with the first having an effective date of October 28, 2008 and the second having an effective date of October 14th, 2009. Pressacco and Shoemaker (2009) reported on the first estimate and Pressacco et al. (2010) presented results of the second. In 2007 Micon also prepared a resource estimate for the nearby Paca deposit, also held by Apogee, but, as noted above, that deposit is not included in the current or past Pulacayo estimates. Both Pulacyo estimates are now historic in nature and should not be relied upon. They were superceded by subsequent estimates prepared by Mercator and should not be relied upon. Tabulated results of the 2008 and 2009 Micon resource estimates are presented below in Table 8.1a and Table 8.1b and both were prepared in accordance with Canadian Institute of Mining, Metallurgy and Petroleum Standards on Mineral Resources and Reserves: Definitions and Guidelines (the CIM Standards) and disclosure requirements of National Instrument 43-101. Technical reports for each have been filed on SEDAR. Both Micon estimates were based on geostatistical block models developed using Gemcom-Surpac Version 6.1.1 software with metal grade interpolation carried out using Ordinary Kriging (OK) methods checked by Nearest Neighbour (NN) and Inverse Distance Squared (ID2) methods The deposit was modelled using a wireframed solid developed from drilling cross section interpretations of calculated Net Smelter Return (NSR) values. Resource reporting included all

Pulacayo Silver-Lead-Zinc Deposit Technical Report November 2012
65 Queen St. • Dartmouth, NS B2Y 1G4 • Ph.: (902) 463-1440 • Fax: (902) 463-1419
E-mail: [email protected] • Web: www.mercatorgeo.com
40
blocks within the respective wireframed solids and metal capping values of 1800 g/ for Ag, 11.5% Zn and 15% Pb were applied. Table 8.1a: Historic Micon 2008 Mineral Resource Estimate - Effective October 28th, 2008 Class Rounded Tonnes Ag g/t Pb % Zn % Inferred 9,556,000 75 0.61 1.46
Indicated 7,003,000 53 0.63 1.42 (1) Tonnages have been rounded to the nearest 1,000 tonnes. Average grades may not sum due to rounding. (2) Mineral resources which are not mineral reserves do not have demonstrated economic viability. The estimate of
mineral resources may be materially affected by environmental, permitting, legal, title, taxation, sociopolitical, marketing, or other relevant issues.
(3) The quantity and grade of reported inferred resources in this estimation are conceptual in nature and there has been insufficient exploration to define these inferred resources as an indicated or measured mineral resource.
(4) And it is uncertain if further exploration will result in upgrading them to an indicated or measured mineral resource category.
(5) Metal prices for the estimate are US$14.38/oz Ag, US$0.86/lb Zn and US$0.92/lb Pb. (6) Grade capping of Ag at 1800 g/t, Zn at 11.5% and Pb at 15% was applied.
Table 8.1b: Historic Micon Mineral Resource Estimate – Effective October 14th, 2009
Class Rounded Tonnes Ag g/t Pb % Zn % Inferred 6,026,000 98.26 0.78 1.68 Indicated 4,892,000 79.96 0.79 1.64
(1) Tonnages have been rounded to the nearest 1,000 tonnes. Average grades may not sum due to rounding. (2) Mineral resources which are not mineral reserves do not have demonstrated economic viability. The estimate of
mineral resources may be materially affected by environmental, permitting, legal, title, taxation, sociopolitical, marketing, or other relevant issues.
(3) The quantity and grade of reported inferred resources in this estimation are conceptual in nature and there has been insufficient exploration to define these inferred resources as an indicated or measured mineral resource.
(4) And it is uncertain if further exploration will result in upgrading them to an indicated or measured mineral resource category.
(5) Metal prices for the estimate are US$13.81/oz Ag, US$0.86/lb Zn and US$0.86/lb Pb (6) Grade capping of Ag at 1800 g/t, Zn at 11.5% and Pb at 15% was applied
8.2.7 Preliminary Economic Assessment A Preliminary Economic Assessment (PEA) dated June 25th, 2010 was completed by Micon for Apogee and reported by Pressaco et al. (2010). The assessment forms part of Apogee’s continuous public disclosure record and is available on SEDAR. However, as disclosed in the revised Mercator resource estimate Technical Report dated May 9th, 2012 (Cullen and Webster, 2012a the conclusions and analysis presented in the Micon PEA are no longer considered to be current with respect to the Pulacayo project. This reflects Apogee’s initiation of project feasibility study programs under direction of TWP Sudamerica S.A., a division of The Basil Read Group of South Africa, that includes changes in project scope and approach. Since Apogee

Pulacayo Silver-Lead-Zinc Deposit Technical Report November 2012
65 Queen St. • Dartmouth, NS B2Y 1G4 • Ph.: (902) 463-1440 • Fax: (902) 463-1419
E-mail: [email protected] • Web: www.mercatorgeo.com
41
no longer considers the Micon 2010 PA to be current, details of that analysis are not presented in this report and were not used to support the current revised resource statement.
8.2.8 Mineral Resource Estimate by Mercator
Mercator prepared a mineral resource estimate for the Pulacayo deposit in 2011 after completion of additional diamond drilling on the property. Table 8.2 presents details of this estimate, which has an effective date of October 19th, 2011. The current estimate supercedes this resource statement, which is now considered historic and should not be relied upon. Table 8.2: Historic Pulacayo Deposit Mineral Resource – October 19, 2011 Class Rounded Tonnes Ag g/t Pb % Zn % Inferred 5,420,000 150.61 0.83 2.07 Indicated 5,960,000 153.14 0.91 2.04
1) Mineral Resources are reported above a $40USD NSR cut-off 2) Metal prices used were $24.78USD/oz Ag, $1.19USD/lb Pb, and $1.09USD/’b Zn 3) Tonnages have been rounded to the nearest 10,000 4) Contributing 1m composites were capped at 1500g/t Ag, 15% Pb, and 15% Zn 5) Specific gravity is based on an interpolated ID2 model 6) Mineral resources that are not mineral reserves do not have demonstrated economic viability. The estimate
of mineral resources may be materially affected by environmental, permitting, legal, title, taxation, sociopolitical, marketing, or other relevant issues.
The Mercator estimate was based on validated results of 59,352 meters of diamond drilling from 174 surface drill holes and 41 underground drill holes carried out by ASC Bolivia and Apogee through various drill programs between 2002 and 2011. Modeling was performed using Gemcom Surpac(R) 6.2.1 modeling software with silver, lead and zinc grades estimated by inverse distance squared (ID2) interpolation from 1.0 meter down hole assay composites. Block size was 5 meters (x) by 3 meters (y) by 3 meters (z) with no sub- blocking. Block model results were checked using ordinary Kriging and Nearest Neighbour interpolation methods. The polymetallic nature of the mineralization was evaluated by a Net Smelter Return (NSR) value considering an underground mining scenario below the oxide surface, constrained by a minimum operating cost of $40NSR/t. The $40NSR/t peripheral constraining solid was created from 50 meter spaced interpreted sections of assay sample NSR values. NSR values were determined from a calculator developed by John Starkey, P. Eng., of Starkey & Associates Inc., Consulting Metallurgical Engineers. The modeling used a 24 month trailing average silver price and a 27 month forward seller contract price for both lead and zinc as of August 31 2011, which correspond to prices of $24.87USD/oz silver, $1.19USD/lb lead, and $1.09USD/lb zinc respectively. The $40NSR solid model has a 25 to 30 meter average thickness with a 1,100 meter strike length oriented at 280 degrees and a 425 meter average sub-vertical dip extent. This
Pulacayo Silver-Lead-Zinc Deposit Technical Report November 2012
65 Queen St. • Dartmouth, NS B2Y 1G4 • Ph.: (902) 463-1440 • Fax: (902) 463-1419
E-mail: [email protected] • Web: www.mercatorgeo.com
42
reflects the orientation and geometry of the principal TVS mineralized structure and associated secondary structures. Grade interpolation was peripherally constrained by the $40NSR solid and carried out using multiple independent search ellipsoid passes for silver, lead and zinc. Contributing silver values were capped at 1,500 g/t and interpolated using an ellipsoid oriented at 280 degrees with a 30 degrees major axis plunge and 80 degrees N dip, contributing lead values were capped at 13.5 % and interpolated using an ellipsoid oriented at 280 degrees with a 45 degrees major axis plunge and a 75 degrees N dip, and contributing zinc values were capped at 13.5 % and interpolated using an ellipsoid oriented at 280 degrees with a 45 degrees major axis plunge and an 80 degrees N dip. A 60 meter ellipsoid major axis, 30 meter semi-major axis and 5 meter minor axis were applied for all primary interpolation passes, with secondary and tertiary passes applied at 2 times and 3 times these ranges to completely fill the peripheral wireframe model. A specific gravity model was interpolated by ID2 methodology from 1.0 meter down hole specific gravity composites using an ellipsoid oriented at 280 degrees with a 45 degrees major axis plunge, 80 degrees N dip and the ranges specified above. A solid model of historic underground mining and stoping was used to remove previously mined blocks and an interpolated 5 meter marginal envelope to historic workings was applied to assign intersecting resource blocks to the Inferred category. This reflects uncertainty in local accuracy of the underground solid model. Indicated resources occur outside this envelop and have an interpolated grade for each metal derived from primary interpolation ellipsoid passes and have at least 2 or more contributing drill holes within at least one of the passes. All other interpolated blocks were categorized as Inferred resource blocks. The Mercator deposit model included additional new Apogee drilling results and differed from previous Micon models in its use of a specific block grade cutoff value for statement of resources rather than inclusion of all blocks within an interpreted assay-based peripheral constraint, as carried out by Micon. This difference manifests as inclusion of sub-cutoff grade blocks using the Micon approach.
8.2.9 Bulk sampling and metallurgical testing
Apogee carried out a trial mining program during the first half of 2012 that was focused on two hangingwall veins accessed at the 4275 m level of the mine. This program produced approximately 7000 tonnes of mineralized material that was stockpiled at the Pulacayo site. Both veins targeted for trial mining occur within the limits of the current mineral resource estimate. Apogee holds the necessary environmental permits issued by the Bolivian authorities to conduct
Pulacayo Silver-Lead-Zinc Deposit Technical Report November 2012
65 Queen St. • Dartmouth, NS B2Y 1G4 • Ph.: (902) 463-1440 • Fax: (902) 463-1419
E-mail: [email protected] • Web: www.mercatorgeo.com
43
mining and processing operations of up to 200 tonnes per day, which includes the transport of mineralized material to an established concentrator outside the project area. During the second half of 2012 Apogee processed two bulk samples from the trial mining at separate toll milling operations in the district. The first was carried out at Tatasi and the second was carried out at facilities operated in Potosi by the Federación de Cooperativas Mineras de Potosí (FEDECOMIN) and located approximately 180 road kilometers from the Pulacayo site. Results of testing at both sites are discussed below in report section 12. In addition, a series of controlled laboratory bench and pilot scale tests in support of the ongoing feasibility study (Apogee Press Release dated May 29, 2012) are underway at Maelgwyn Minerals Services Africa (Pty) Ltd. in South Africa in order to replicate the process flow and optimizing reagent recipes utilized during the FEDECOMIN bulk test (Apogee Press Release dated September 13, 2012).
8.2.10 Commissioning of Project Feasibility Study On May 29th, 2012 Apogee announced that a contract for completion of a feasibility study of an underground mine and concentrator plant at its 100% controlled Pulacayo Project had been awarded to TWP. TWP is a member of the Basil Read Group, a leading engineering and construction company in the world, with offices across South Africa, Australia, and Peru. Feasibility study programs began in mid-2012 and are were ongoing at the effective date of this report. A technical report in compliance with the NI43-101 that deals with the feasibility study will be prepared and disclosed at the completion of the study. In light of initiation of the feasibility study programs, Apogee also disclosed by press release on May 29th, 2012 that it was no longer relying on results of the previously completed PEA carried out by Micon.
Pulacayo Silver-Lead-Zinc Deposit Technical Report November 2012
65 Queen St. • Dartmouth, NS B2Y 1G4 • Ph.: (902) 463-1440 • Fax: (902) 463-1419
E-mail: [email protected] • Web: www.mercatorgeo.com
44
9 Drilling
9.1 Introduction The first modern era drilling program at Pulacayo was initiated in 2002 by ASC and subsequent drilling programs were undertaken by Apogee between 2006 and 2012. Data from all programs is used in the current resource estimate and details of each program are present below under separate headings.
9.2 ASC Bolivia LDC Drilling (2002-2005) ASC completed 14 diamond holes totalling 3,095 m in length between July, 2002 and November, 2003 (holes PUD001-PUD017). Eleven holes were drilled from surface and another three from drill stations located in the Pulacayo underground workings. Drilling was completed by Leduc Drilling S.R.L. of La Paz, Bolivia, using two Longyear LF-140 and LY-44 drill rigs and HQ (63.5 mm diameter) core was recovered. A second phase of drilling was initiated in February, 2003 and although 10 holes were planned only 2 underground drill holes were subsequently completed for a total of 554 m (holes PUD025 and PUD026). Drilling was performed by Drilling Bolivia Ltd. and HQ core was recovered. ASC continued the drilling program in September, 2003 and completed eight additional holes totalling 1,302 m (holes PUD018 to PUD024 and PUD027). Six holes were completed from surface and two holes were completed from drill stations located in the Pulacayo underground workings. Drilling was contracted to Maldonado Exploraciones S.R.L. of La Paz, Bolivia and they used Longyear model LY-44 and LF-70 drilling rigs recovering HQ size core. The 2002 though 2005 drilling programs outlined disseminated, veinlet and stockwork style mineralization occurring between previously mined high grade veins and a tabulation of selected significant drill intercepts appears Appendix 1. A location plan for the ASC drill holes is also included in Appendix 1 along with a tabulation of collar coordination, hole orientation and length data.
9.3 Apogee Drilling (Jan 2006 – May 2008) Following the acquisition of the Pulacayo property in 2005 Apogee initiated a Phase I drill program that consisted of 19 holes totalling 4,150 m in length (PUD028 to PUD042). Four of the holes were completed from drill stations located in the Pulacayo underground workings and 15 were completed from surface locations. The Apogee program objective was to confirm mineralization defined by earlier ASC drilling results and the program was successful in demonstrating the presence of significant amounts of disseminated, veinlet, and stockwork sulphide mineralization located between the high grade veins that were exploited by historic,
Pulacayo Silver-Lead-Zinc Deposit Technical Report November 2012
65 Queen St. • Dartmouth, NS B2Y 1G4 • Ph.: (902) 463-1440 • Fax: (902) 463-1419
E-mail: [email protected] • Web: www.mercatorgeo.com
45
narrow underground mine workings (Pressacco et al., 2010). A tabulation of significant 2006 drilling intercepts appears in Appendix 1 along with drill hole locations and a tabulation of associated collar coordination, hole orientation and length data. Apogee switched their focus to the Paca deposit, located approximately 10 km north of Pulacayo, in 2006 and completed approximately 13,631.2 m of diamond drilling in three drill programs. Between February 2006 and April 2006, Apogee completed a total of 2,301.5 m in 23 drill holes (PND031 to PND053). A second phase of diamond drilling was carried out from June 2006 to November 2006 and a total of 10,443.70 m were completed in 46 drill holes (PND054 to PND099). Seven additional holes totalling 886 m were drilled in a third phase of drilling completed late in 2006 (PND100 to PND106). The results of this exploration drilling program formed the basis of a 2007 mineral resource estimate on the Paca deposit completed by Micon and are described in detail by Pressacco and Gowans (2007). As noted earlier in this report, the Paca deposit is not included in the current resource estimate and the preceding description has been included for completeness. In November, 2007 Apogee started Phase II drilling at Pulacayo and completed 14 holes totalling 3,745 m (PUD043 to PUD056). All holes were drilled from surface locations and results showed that the TVS consisted of disseminated, veinlet, and stockwork sulphide mineralized material measuring up to 120 m in width within which high grade mineralized shoots were present that had not been exploited by previous operators of the mine Phase III drilling was undertaken by Apogee between January and May, 2008 at which time 54 holes totalling 14,096 m were completed (PUD057 to PUD110). Of these, 8 holes were drilled from underground and the balance from surface. A tabulation of significant 2007 and 2008 drilling intercepts, drill hole locations and associated collar coordination, hole orientation and length data appear in Appendix 1. Phase I drilling was completed by the Leduc Drilling S.R.L of La Paz, Bolivia and subsequent Phase II and III programs were completed by the Fujita Core Drilling Company of Bolivia. The companies used Longyear model LF44, LM-55, LF-90 and LM-90 drilling rigs for the surface and underground programs and core size was generally HQ (65.3 mm diameter). In certain instances, ground conditions around old workings or other issues required reduction in core size to NQ (47.6 mm diameter).
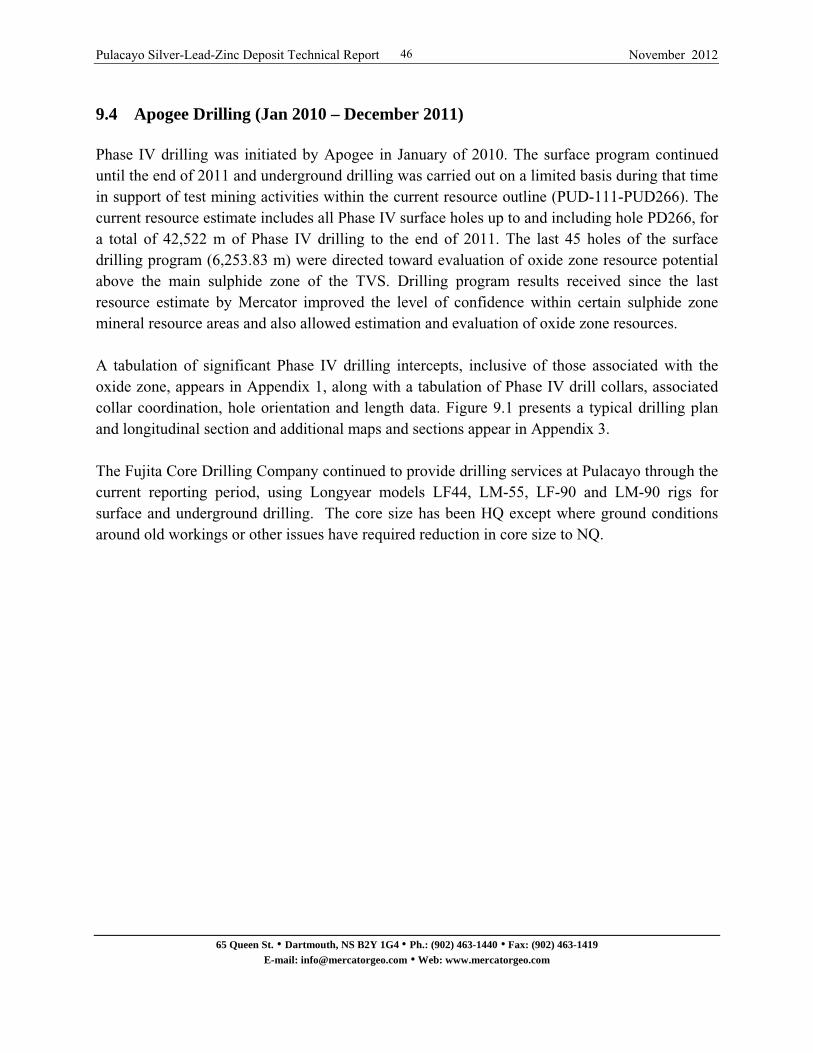
Pulacayo Silver-Lead-Zinc Deposit Technical Report November 2012
65 Queen St. • Dartmouth, NS B2Y 1G4 • Ph.: (902) 463-1440 • Fax: (902) 463-1419
E-mail: [email protected] • Web: www.mercatorgeo.com
46
9.4 Apogee Drilling (Jan 2010 – December 2011) Phase IV drilling was initiated by Apogee in January of 2010. The surface program continued until the end of 2011 and underground drilling was carried out on a limited basis during that time in support of test mining activities within the current resource outline (PUD-111-PUD266). The current resource estimate includes all Phase IV surface holes up to and including hole PD266, for a total of 42,522 m of Phase IV drilling to the end of 2011. The last 45 holes of the surface drilling program (6,253.83 m) were directed toward evaluation of oxide zone resource potential above the main sulphide zone of the TVS. Drilling program results received since the last resource estimate by Mercator improved the level of confidence within certain sulphide zone mineral resource areas and also allowed estimation and evaluation of oxide zone resources. A tabulation of significant Phase IV drilling intercepts, inclusive of those associated with the oxide zone, appears in Appendix 1, along with a tabulation of Phase IV drill collars, associated collar coordination, hole orientation and length data. Figure 9.1 presents a typical drilling plan and longitudinal section and additional maps and sections appear in Appendix 3. The Fujita Core Drilling Company continued to provide drilling services at Pulacayo through the current reporting period, using Longyear models LF44, LM-55, LF-90 and LM-90 rigs for surface and underground drilling. The core size has been HQ except where ground conditions around old workings or other issues have required reduction in core size to NQ.
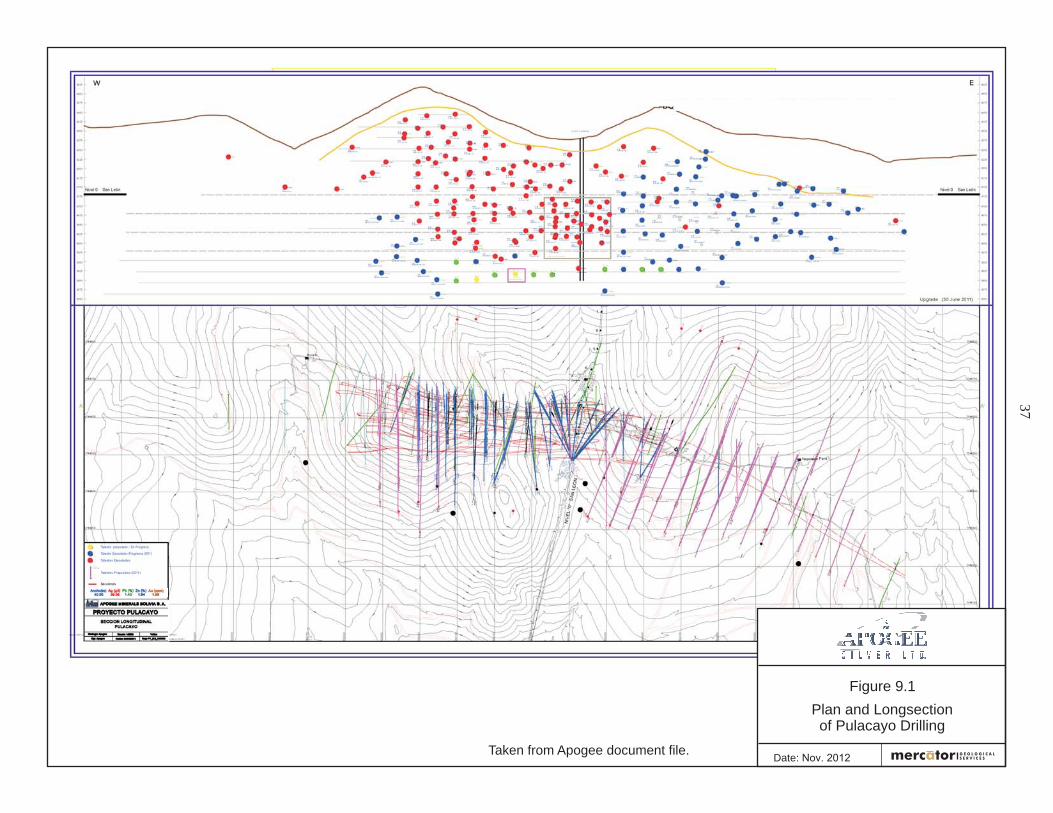
Plan and Longsectionof Pulacayo Drilling
Date: Nov. 2012
Figure 9.1
37
Taken from Apogee document file.
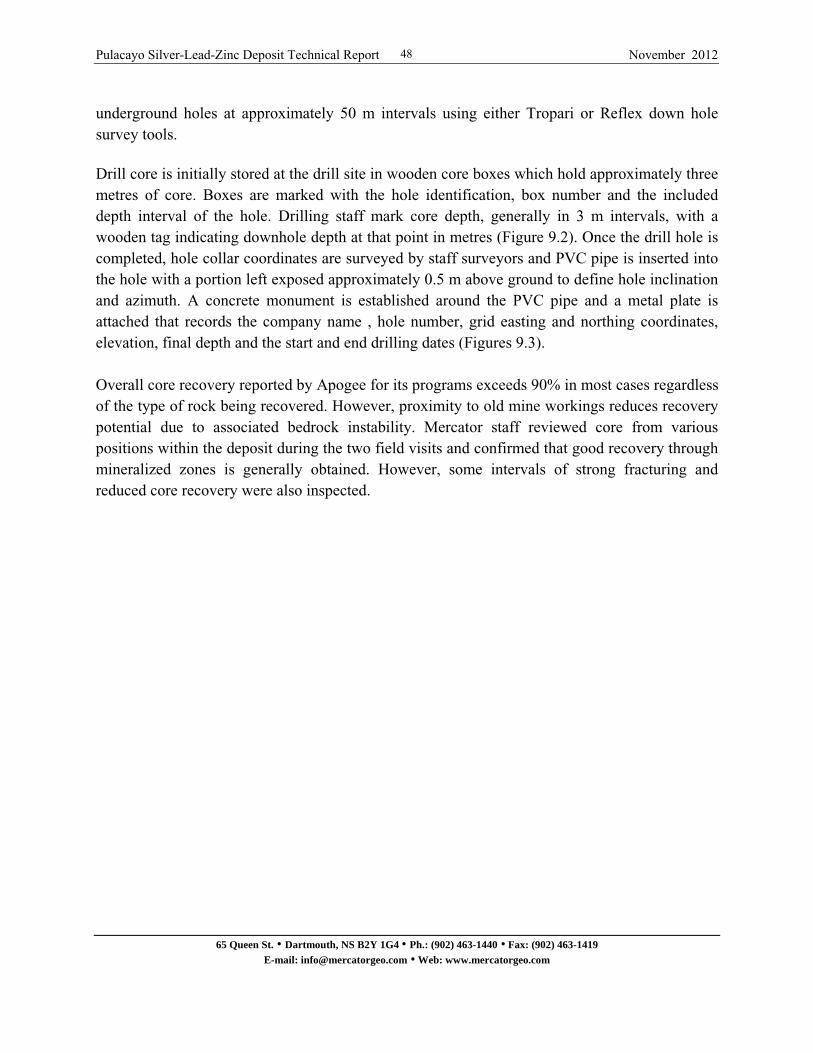
Pulacayo Silver-Lead-Zinc Deposit Technical Report November 2012
65 Queen St. • Dartmouth, NS B2Y 1G4 • Ph.: (902) 463-1440 • Fax: (902) 463-1419
E-mail: [email protected] • Web: www.mercatorgeo.com
48
underground holes at approximately 50 m intervals using either Tropari or Reflex down hole survey tools. Drill core is initially stored at the drill site in wooden core boxes which hold approximately three metres of core. Boxes are marked with the hole identification, box number and the included depth interval of the hole. Drilling staff mark core depth, generally in 3 m intervals, with a wooden tag indicating downhole depth at that point in metres (Figure 9.2). Once the drill hole is completed, hole collar coordinates are surveyed by staff surveyors and PVC pipe is inserted into the hole with a portion left exposed approximately 0.5 m above ground to define hole inclination and azimuth. A concrete monument is established around the PVC pipe and a metal plate is attached that records the company name , hole number, grid easting and northing coordinates, elevation, final depth and the start and end drilling dates (Figures 9.3). Overall core recovery reported by Apogee for its programs exceeds 90% in most cases regardless of the type of rock being recovered. However, proximity to old mine workings reduces recovery potential due to associated bedrock instability. Mercator staff reviewed core from various positions within the deposit during the two field visits and confirmed that good recovery through mineralized zones is generally obtained. However, some intervals of strong fracturing and reduced core recovery were also inspected.
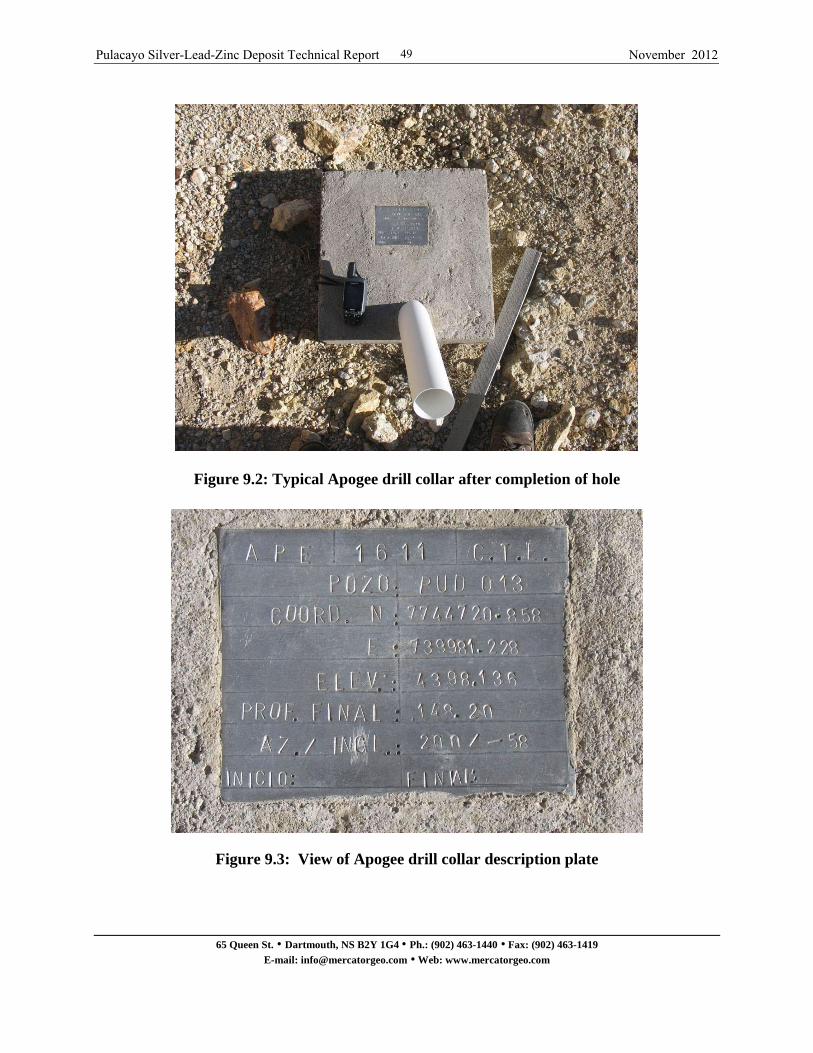
Pulacayo Silver-Lead-Zinc Deposit Technical Report November 2012
65 Queen St. • Dartmouth, NS B2Y 1G4 • Ph.: (902) 463-1440 • Fax: (902) 463-1419
E-mail: [email protected] • Web: www.mercatorgeo.com
49
Figure 9.2: Typical Apogee drill collar after completion of hole
Figure 9.3: View of Apogee drill collar description plate
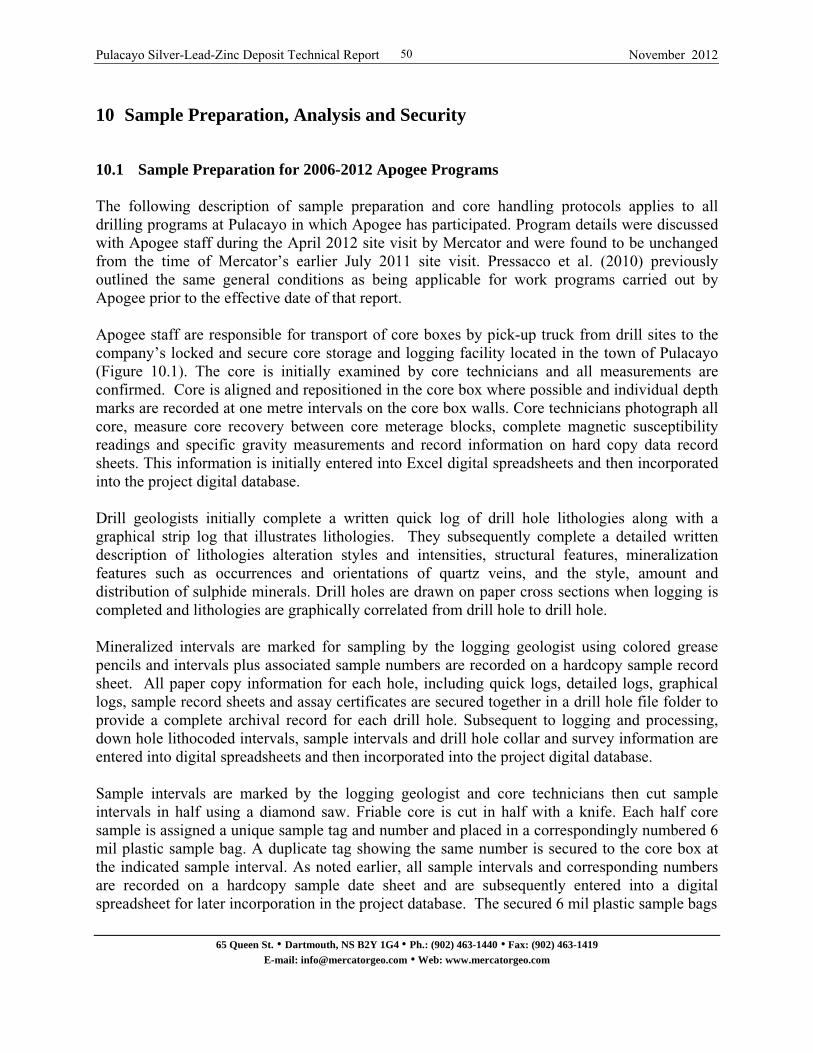
Pulacayo Silver-Lead-Zinc Deposit Technical Report November 2012
65 Queen St. • Dartmouth, NS B2Y 1G4 • Ph.: (902) 463-1440 • Fax: (902) 463-1419
E-mail: [email protected] • Web: www.mercatorgeo.com
50
10 Sample Preparation, Analysis and Security
10.1 Sample Preparation for 2006-2012 Apogee Programs The following description of sample preparation and core handling protocols applies to all drilling programs at Pulacayo in which Apogee has participated. Program details were discussed with Apogee staff during the April 2012 site visit by Mercator and were found to be unchanged from the time of Mercator’s earlier July 2011 site visit. Pressacco et al. (2010) previously outlined the same general conditions as being applicable for work programs carried out by Apogee prior to the effective date of that report. Apogee staff are responsible for transport of core boxes by pick-up truck from drill sites to the company’s locked and secure core storage and logging facility located in the town of Pulacayo (Figure 10.1). The core is initially examined by core technicians and all measurements are confirmed. Core is aligned and repositioned in the core box where possible and individual depth marks are recorded at one metre intervals on the core box walls. Core technicians photograph all core, measure core recovery between core meterage blocks, complete magnetic susceptibility readings and specific gravity measurements and record information on hard copy data record sheets. This information is initially entered into Excel digital spreadsheets and then incorporated into the project digital database. Drill geologists initially complete a written quick log of drill hole lithologies along with a graphical strip log that illustrates lithologies. They subsequently complete a detailed written description of lithologies alteration styles and intensities, structural features, mineralization features such as occurrences and orientations of quartz veins, and the style, amount and distribution of sulphide minerals. Drill holes are drawn on paper cross sections when logging is completed and lithologies are graphically correlated from drill hole to drill hole. Mineralized intervals are marked for sampling by the logging geologist using colored grease pencils and intervals plus associated sample numbers are recorded on a hardcopy sample record sheet. All paper copy information for each hole, including quick logs, detailed logs, graphical logs, sample record sheets and assay certificates are secured together in a drill hole file folder to provide a complete archival record for each drill hole. Subsequent to logging and processing, down hole lithocoded intervals, sample intervals and drill hole collar and survey information are entered into digital spreadsheets and then incorporated into the project digital database. Sample intervals are marked by the logging geologist and core technicians then cut sample intervals in half using a diamond saw. Friable core is cut in half with a knife. Each half core sample is assigned a unique sample tag and number and placed in a correspondingly numbered 6 mil plastic sample bag. A duplicate tag showing the same number is secured to the core box at the indicated sample interval. As noted earlier, all sample intervals and corresponding numbers are recorded on a hardcopy sample date sheet and are subsequently entered into a digital spreadsheet for later incorporation in the project database. The secured 6 mil plastic sample bags
Pulacayo Silver-Lead-Zinc Deposit Technical Report November 2012
65 Queen St. • Dartmouth, NS B2Y 1G4 • Ph.: (902) 463-1440 • Fax: (902) 463-1419
E-mail: [email protected] • Web: www.mercatorgeo.com
51
Figure 10.1: Apogee core logging facility are grouped in batches of 6-10 samples and secured in a larger plastic mesh bag in preparation for shipment to the ALS Chemex (ALS) preparation laboratory located in Oruro, Bolivia. All bagged samples remain in a locked storage facility until shipment to the laboratory. Samples are transported from the core storage area to the ALS facility by either Apogee personnel or a reputable commercial carrier. Sample shipment forms are used to list all samples in each shipment and laboratory personnel crosscheck samples received against this list and reported any irregularities by fax or email to Apogee. Apogee advised Mercator that it has not encountered any substantial issues to date with respect to sample processing, delivery or security for Pulacayo programs.
10.2 Sample Preparation for 2002-2003 ASC Programs Site procedures pertinent to ASC were not documented in support information reviewed by Mercator. However, Apogee staff familiar with the earlier program indicated that procedures were generally similar to those employed by Apogee with respect to core logging, sampling, transport of samples and security. All ASC drill core samples were processed at the Oruro, Bolivia laboratory of ALS Chemex, with those from the first phase of drilling being analysed at ALS Chemex (formally Bondar-Clegg) facilities in Vancouver, BC, Canada. In both instances, standard core preparation methods were used prior to elemental analysis.
Pulacayo Silver-Lead-Zinc Deposit Technical Report November 2012
65 Queen St. • Dartmouth, NS B2Y 1G4 • Ph.: (902) 463-1440 • Fax: (902) 463-1419
E-mail: [email protected] • Web: www.mercatorgeo.com
52
10.3 Drill Core Analysis for 2006-2012 Apogee Programs Apogee staff log and sample drill core and carry out immersion method specific gravity determinations but do not carry out any form of direct sample preparation or analytical work on project samples. Project analytical work has been completed by ALS at its analytical facility in Lima, Peru after completion of sample preparation procedures at the ALS facility located in Oruro Bolivia. ALS is an internationally accredited laboratory with National Association of Testing Authorities (NATA) certification and also complies with standards of ISO 9001:2000 and ISO 17025:1999. The laboratory utilizes industry standard analytical methodology and utilizes rigorous internal Quality Assurance and Quality Control (QAQC) procedures for self-testing. All samples are weighed upon receipt at the lab and prepared using ALS preparation procedure PREP-31B that consists of crushing the entire sample to >70% -2 mm, then splitting off 1 kg and pulverizing it to better than 85% passing 75 micron. The coarse reject materials from this processing are returned to Apogee for storage on site at Pulacayo. Similar processing was used by ASC. Silver, lead and zinc concentrations for Apogee programs were analyzed by ALS using an Aqua Regia digestion and Atomic Absorption Spectroscopy (AAS) following ALS method codes AA46 and AA62. Samples returning assay values greater than 300 g/t Ag were further analyzed using quantitative method Ag-GRAV22, which uses a Fire Assay pre-concentration and Gravimetric Finish on a 50g sample aliquot. Gold values were determined using the Au-AA26 analytical method provided by ALS that employs a Fire Assay pre-concentration followed by Atomic Absorption finish on a 50 g sample aliquot. A 35 element multi-element analysis was also completed on samples using method code ME-ICP41 which uses Aqua Regia digestion and ICP-AES analysis. 10.4 Drill Core Analysis for 2002-2003 ASC Programs Samples from the ASC drilling programs carried out in 2002 and 2003 were also prepared and analyzed by ALS. However, after preparation at the facility in Oruro, Bolivia under the same protocols as noted above for Apogee, analytical work was carried out at the company`s laboratory in Vancouver, BC, Canada. This facility is fully accredited as described earlier and analytical protocols were the same as those described above for Apogee.
10.5 Quality Assurance and Control for 2006-2012 Apogee Programs Apogee developed an internal QAQC program that includes blind insertion of reference standards, blanks and duplicates in each analytical shipment. A blank is inserted at the beginning of each sample batch, standards are inserted at random intervals throughout each batch of 50 samples and duplicates are analyzed at the end of each batch. All data gathered for QAQC purposes is captured, sorted and retained in the QAQC database. Apogee purchased two commercial reference standards from Western Canadian Minerals Ltd. (WCM), these being PB-
Pulacayo Silver-Lead-Zinc Deposit Technical Report November 2012
65 Queen St. • Dartmouth, NS B2Y 1G4 • Ph.: (902) 463-1440 • Fax: (902) 463-1419
E-mail: [email protected] • Web: www.mercatorgeo.com
53
128 and PB-124, created an in-house standard and also purchased commercial prepared blank materials. Coarse field blanks were prepared by Apogee from locally sourced un-mineralized quartzite outcropping near Pulacayo. Three quality control samples that include a field or commercial blank, a commercial standard and a duplicate sample are inserted with a minimum frequency of 1 in every 50 samples. Review by Mercator showed that in practise, an analytical standard typically occurs within every 20 samples submitted for analysis. Analysis of duplicate samples of ¼ core is accommodated through their blind inclusion in the sample stream and analysis of duplicate prepared pulp splits are also requested for each batch. Apogee`s protocol also includes a check sampling program based on analysis of sample splits at a second accredited laboratory. Check samples submitted to the check laboratory are processed using the same preparation and analytical techniques as used by ALS in Lima. The ALS laboratory in La Serena, Chile provided initial second laboratory analytical services for the Apogee programs, results of which are discussed in report Section 13. Since January 2010, starting with drill hole PUD 140 samples, all check analyses are done at SGS in Lima, Peru. In addition to chemical analysis, bulk density measurements (specific gravity) were systematically collected by Apogee staff using standard water emersion methods and unsealed core samples. Micon (Pressacco and Shoemaker, 2009) reviewed ASC and early Apogee density determination methods and recommended that these be modified to include more representative sampling methods in non-mineralized areas and be carried out continuously through mineralized zones. Procedures were subsequently modified and measurements thereafter were collected for continuous 10 m sampled intervals where no observed sulphide mineralization was present and for all sampled intervals within recognized mineralized zones. Micon also noted that samples were not being wax sealed and advised that sealing would be advisable for some samples due to higher porosity and low permeability seen in some samples. Characteristics of lithology and alteration were also recorded as part of the density program and all information was assembled in digital spreadsheets. Results of the density measurement programs appear in report section 13. The authors are satisfied that Apogee’s sample preparation, analysis and security methodologies are sufficient for a project of this size and that suitable precautions are being taken to identify irregularities in sample analytical results.
10.6 Quality Control and Assurance for ASC 2002-2003 Programs QAQC procedures pertinent to the ASC programs were not documented in support information reviewed by Mercator for this report. However, the first drilling program carried out by Apogee in 2006 consisted of 19 holes totaling approximately 4,150 meters drilled to confirm earlier ASC analytical data. Full QAQC protocols instituted by Apogee were applied to this program and, as further detailed in report section 13.0, results of the re-drill program correlate well with those of ASC. Such correlation suggests that acceptable standards were being met by ASC.
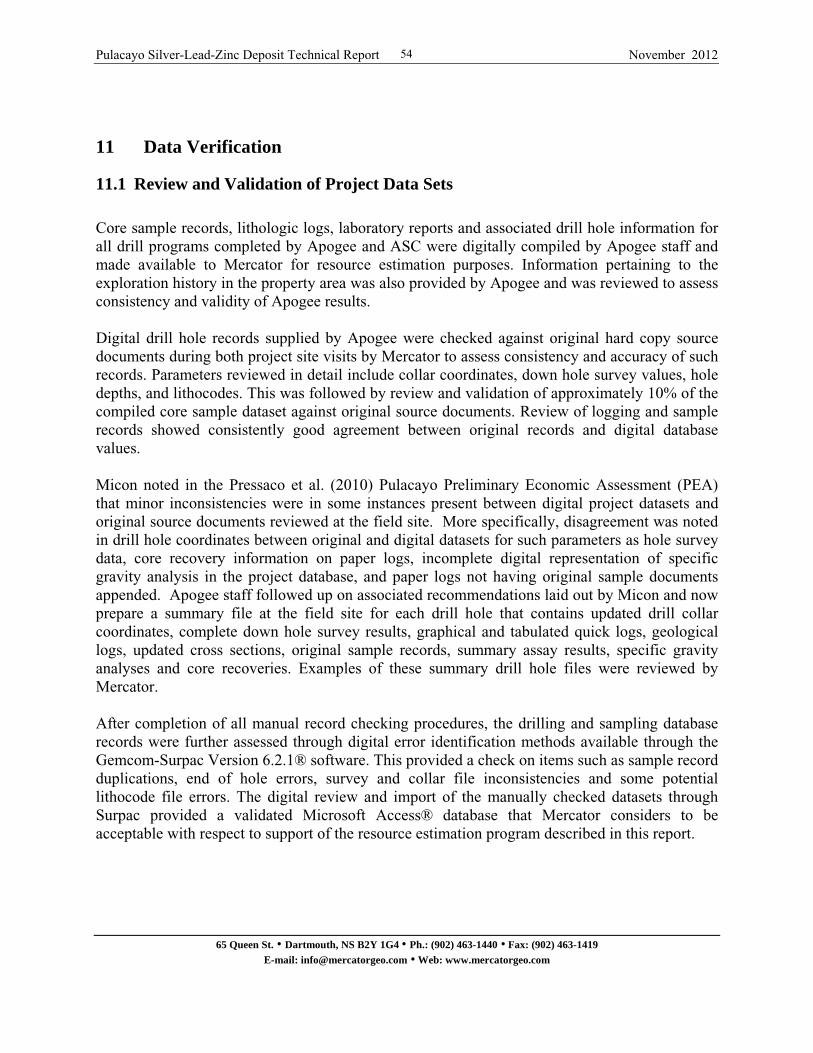
Pulacayo Silver-Lead-Zinc Deposit Technical Report November 2012
65 Queen St. • Dartmouth, NS B2Y 1G4 • Ph.: (902) 463-1440 • Fax: (902) 463-1419
E-mail: [email protected] • Web: www.mercatorgeo.com
54
11 Data Verification
11.1 Review and Validation of Project Data Sets Core sample records, lithologic logs, laboratory reports and associated drill hole information for all drill programs completed by Apogee and ASC were digitally compiled by Apogee staff and made available to Mercator for resource estimation purposes. Information pertaining to the exploration history in the property area was also provided by Apogee and was reviewed to assess consistency and validity of Apogee results. Digital drill hole records supplied by Apogee were checked against original hard copy source documents during both project site visits by Mercator to assess consistency and accuracy of such records. Parameters reviewed in detail include collar coordinates, down hole survey values, hole depths, and lithocodes. This was followed by review and validation of approximately 10% of the compiled core sample dataset against original source documents. Review of logging and sample records showed consistently good agreement between original records and digital database values. Micon noted in the Pressaco et al. (2010) Pulacayo Preliminary Economic Assessment (PEA) that minor inconsistencies were in some instances present between digital project datasets and original source documents reviewed at the field site. More specifically, disagreement was noted in drill hole coordinates between original and digital datasets for such parameters as hole survey data, core recovery information on paper logs, incomplete digital representation of specific gravity analysis in the project database, and paper logs not having original sample documents appended. Apogee staff followed up on associated recommendations laid out by Micon and now prepare a summary file at the field site for each drill hole that contains updated drill collar coordinates, complete down hole survey results, graphical and tabulated quick logs, geological logs, updated cross sections, original sample records, summary assay results, specific gravity analyses and core recoveries. Examples of these summary drill hole files were reviewed by Mercator. After completion of all manual record checking procedures, the drilling and sampling database records were further assessed through digital error identification methods available through the Gemcom-Surpac Version 6.2.1® software. This provided a check on items such as sample record duplications, end of hole errors, survey and collar file inconsistencies and some potential lithocode file errors. The digital review and import of the manually checked datasets through Surpac provided a validated Microsoft Access® database that Mercator considers to be acceptable with respect to support of the resource estimation program described in this report.
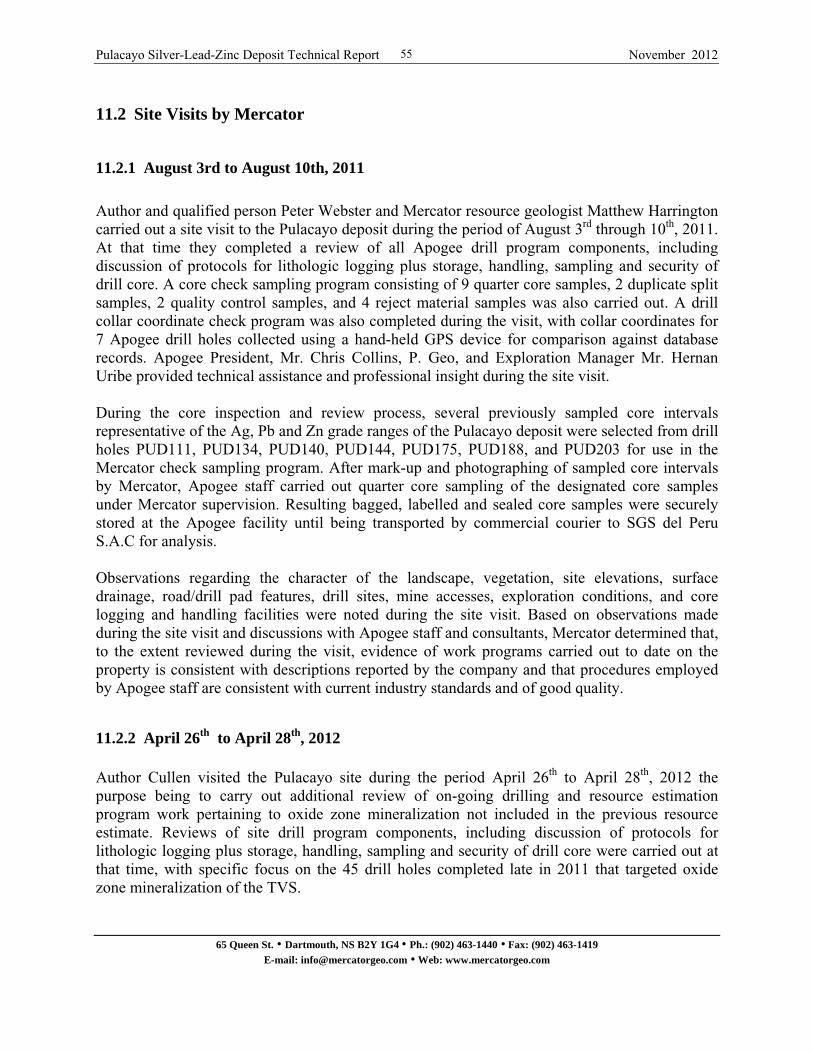
Pulacayo Silver-Lead-Zinc Deposit Technical Report November 2012
65 Queen St. • Dartmouth, NS B2Y 1G4 • Ph.: (902) 463-1440 • Fax: (902) 463-1419
E-mail: [email protected] • Web: www.mercatorgeo.com
55
11.2 Site Visits by Mercator
11.2.1 August 3rd to August 10th, 2011 Author and qualified person Peter Webster and Mercator resource geologist Matthew Harrington carried out a site visit to the Pulacayo deposit during the period of August 3rd through 10th, 2011. At that time they completed a review of all Apogee drill program components, including discussion of protocols for lithologic logging plus storage, handling, sampling and security of drill core. A core check sampling program consisting of 9 quarter core samples, 2 duplicate split samples, 2 quality control samples, and 4 reject material samples was also carried out. A drill collar coordinate check program was also completed during the visit, with collar coordinates for 7 Apogee drill holes collected using a hand-held GPS device for comparison against database records. Apogee President, Mr. Chris Collins, P. Geo, and Exploration Manager Mr. Hernan Uribe provided technical assistance and professional insight during the site visit. During the core inspection and review process, several previously sampled core intervals representative of the Ag, Pb and Zn grade ranges of the Pulacayo deposit were selected from drill holes PUD111, PUD134, PUD140, PUD144, PUD175, PUD188, and PUD203 for use in the Mercator check sampling program. After mark-up and photographing of sampled core intervals by Mercator, Apogee staff carried out quarter core sampling of the designated core samples under Mercator supervision. Resulting bagged, labelled and sealed core samples were securely stored at the Apogee facility until being transported by commercial courier to SGS del Peru S.A.C for analysis. Observations regarding the character of the landscape, vegetation, site elevations, surface drainage, road/drill pad features, drill sites, mine accesses, exploration conditions, and core logging and handling facilities were noted during the site visit. Based on observations made during the site visit and discussions with Apogee staff and consultants, Mercator determined that, to the extent reviewed during the visit, evidence of work programs carried out to date on the property is consistent with descriptions reported by the company and that procedures employed by Apogee staff are consistent with current industry standards and of good quality.
11.2.2 April 26th to April 28th, 2012 Author Cullen visited the Pulacayo site during the period April 26th to April 28th, 2012 the purpose being to carry out additional review of on-going drilling and resource estimation program work pertaining to oxide zone mineralization not included in the previous resource estimate. Reviews of site drill program components, including discussion of protocols for lithologic logging plus storage, handling, sampling and security of drill core were carried out at that time, with specific focus on the 45 drill holes completed late in 2011 that targeted oxide zone mineralization of the TVS.
Pulacayo Silver-Lead-Zinc Deposit Technical Report November 2012
65 Queen St. • Dartmouth, NS B2Y 1G4 • Ph.: (902) 463-1440 • Fax: (902) 463-1419
E-mail: [email protected] • Web: www.mercatorgeo.com
56
Trenched areas, TVS surface exposures and drilling locations associated with assessment of the oxide zone were visited and a general overview of the site and facilities was obtained (Figures 11.1 and 11.2). A core check sampling program consisting of 24 quarter core samples, 1 quality control reference material sample, and 1 blank sample was also carried out, along with field location checking of drill collar coordinates for 14 oxide zone drill holes. Collar locations were checked using a hand-held GPS device for comparison against database records and acceptable results were returned from both programs. Details of these are presented below in report sections 11.3.5 and 11.4 An active test mining area developed by Apogee on a subsidiary hanging-wall vein (ramale) interval of the TVS near the San Leon tunnel was also visited during the April 2012 trip. Stoping of the vein was being carried out at that time over a horizontal width of approximately 1.5 m to 2.0 m and stoped material was being stockpiled on surface for use in future metallurgical testing programs (Figure 11.3). Apogee President, Mr. Chris Collins, P. Geo. accompanied the author throughout the visit and Exploration Manager, Mr. Hernan Uribe, discussed the project during meetings held on April 24th at Apogee’s La Pz office. Discussions on site were held with Apogee mine staff and mine manager, Mr. Wouter Erasmus, led an underground tour of the test mining area and adjacent historic workings (Figure 11.4). Apogee site geological staff under direction of Mr. Freddy Mayta, Senior Geologist, plus core facility technicians facilitated review and sampling of the oxide zone drill core that was a primary focus of this site visit (Figure 11.4).
Pulacayo Silver-Lead-Zinc Deposit Technical Report November 2012
65 Queen St. • Dartmouth, NS B2Y 1G4 • Ph.: (902) 463-1440 • Fax: (902) 463-1419
E-mail: [email protected] • Web: www.mercatorgeo.com
57
Figure 11.1: Oxide zone exposure – April, 2012
Figure 11.2: View of Pulacayo town site – April, 2012
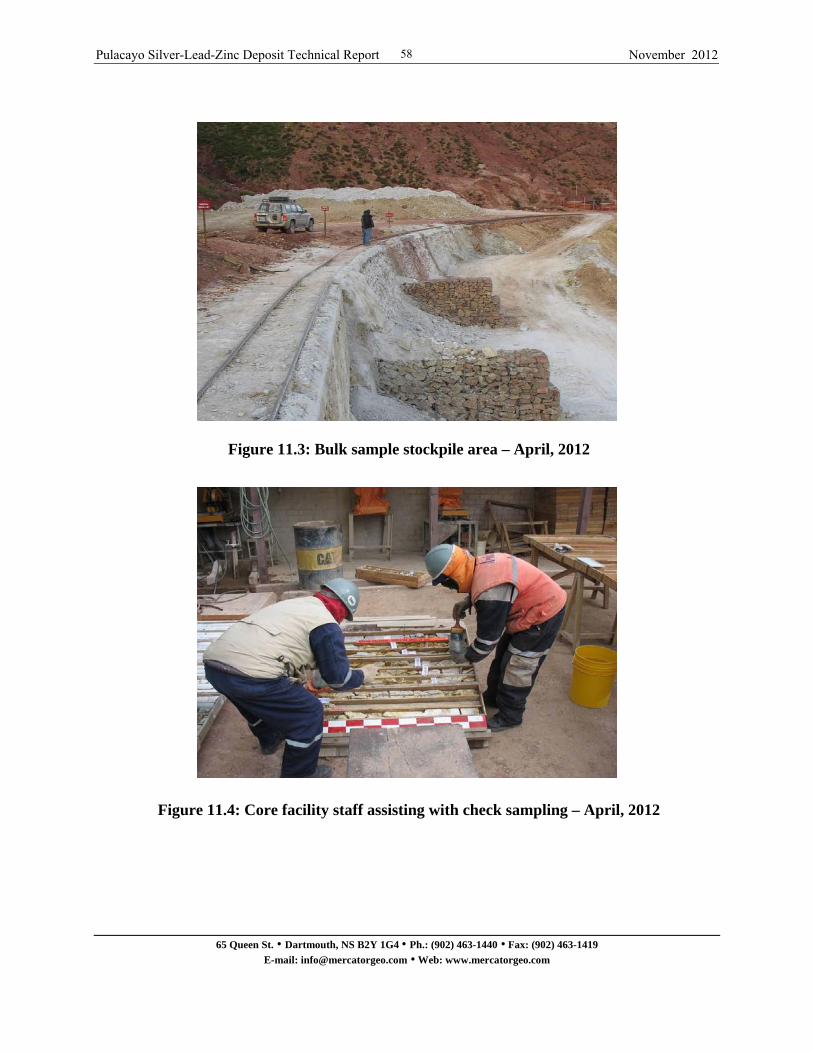
Pulacayo Silver-Lead-Zinc Deposit Technical Report November 2012
65 Queen St. • Dartmouth, NS B2Y 1G4 • Ph.: (902) 463-1440 • Fax: (902) 463-1419
E-mail: [email protected] • Web: www.mercatorgeo.com
58
Figure 11.3: Bulk sample stockpile area – April, 2012
Figure 11.4: Core facility staff assisting with check sampling – April, 2012

Pulacayo Silver-Lead-Zinc Deposit Technical Report November 2012
65 Queen St. • Dartmouth, NS B2Y 1G4 • Ph.: (902) 463-1440 • Fax: (902) 463-1419
E-mail: [email protected] • Web: www.mercatorgeo.com
59
11.3 Quality Control and Quality Assurance (QAQC)
11.3.1 Apogee Programs 2006 – 2012
The Apogee drilling programs covered in the October 2011 mineral resource estimate by Mercator occurred between 2006 and July of 2011, with the last drill hole included in that resource being PUD214. QAQC results for the Apogee programs that contributed to the previous estimate were presented by Cullen and Webster (2012) and the discussions presented below that pertain to these programs are taken directly from that source with a minimum of modification. QAQC results that pertain to oxide zone drilling carried out between July 2011 and December 2011 by Apogee are also described below.
11.3.2 Apogee Programs 2006 – 2012
Drill core sampling carried out by Apogee during the 2006 through 2012 programs on the Pulacayo property were subject to a QAQC program administered by the company. This included submissions of blank samples, duplicate split samples of quarter core and half core, certified analytical standards, Apogee field standards and analysis of check samples at a third party commercial laboratory. Additionally, internal laboratory reporting of quality control and assurance sampling was monitored by Apogee on an on-going basis during the course of the project. Details of the various components are discussed below under separate headings. QAQC discussions for certified and in-house standards, blanks and duplicate splits pertaining to Apogee programs completed prior to January, 2010 were previously disclosed in the Micon PEA (Pressacco et al. 2010) for Pulacayo. After review of these results, Mercator concurs with the opinion expressed by Micon that drill core sample data associated with the earlier Apogee QAQC programs is of quality acceptable for resource estimation use. The Micon report should be consulted if access to more detailed information pertaining to drilling programs carried out by Apogee prior to January, 2010 is required. QAQC discussions presented below in this report pertain only to drilling carried out by Apogee since January, 2010.

Pulacayo Silver-Lead-Zinc Deposit Technical Report November 2012
65 Queen St. • Dartmouth, NS B2Y 1G4 • Ph.: (902) 463-1440 • Fax: (902) 463-1419
E-mail: [email protected] • Web: www.mercatorgeo.com
60
11.3.3 Certified Reference Material Programs
January 2010 to July 2011 The following description of certified reference material program results is taken from Cullen and Webster (2012) with only minor local modification of text to match the current reporting context. Apogee has used three certified reference standards since the Phase IV drilling program commenced in January of 2010. These are CDN-SE-1, obtained from CDN Resource Laboratories (CDN) of Burnaby, BC and PB128 and PB138, obtained from WCM Minerals Ltd. (WCM) of Burnaby, BC. CDN-SE-1 has been used since the start of the Phase IV drill program, beginning with drill hole PUD141, and remained in use at the effective date of this report. PB128 was used in pre-January 2010 programs, beginning with drill hole PUD061, and was replaced by PB138 at drill hole PUD207. Descriptions for all three certified standards appear in Appendix 1 and Table 11.1 presents their certified mean values. In total, results for 178 certified reference samples submitted for analysis were reviewed for this project period. This includes all certified reference samples used during the Apogee Phase IV drilling program during the period plus those pertaining to Phase III drill holes PUD134 through PUD138 for which assay results had not be received at the time of the Micon PEA in 2010. Reference samples were systematically inserted into the laboratory sample shipment sequence by Apogee staff that ensured that at least one standard was submitted for every 50 samples. Records of reference standard insertion were maintained as part of the core sampling and logging protocols. Table 11.1: Certified Reference Materials Data for January 2010 to October 2011 Period Certified Mean Value ± 2 Standard Deviations Reference Material Ag g/t Pb % Zn % Number CDN-SE-1 712 ± 57 1.92 ± 0.09 2.65 ± 0.20 82 PB128 181 ± 16.41 4.43 ± 0.342 2.25 ± 0.18 91 PB138 199 ± 8.958 2.04 ± 0.149 2.08 ± 0.124 5
The CDN-SE-1 standard was used exclusively during the Phase IV drill program initiated in January 2010 and is still in use by Apogee. In total, 82 samples of the material were analyzed during the drilling period covered in this report section, with samples submitted in association with drill holes PUD141 through PUD214. Returned Ag values fall within a +15g/t and -55g/t range of the 95% confidence interval certified mean range and the average value of 698.75g/t falls within the mean ±2 standard deviations control limits. One sample value falls below the control limits (Figure 11.5). A total of 12 Pb values fall below the ±2 standard deviations control limits for that metal, with returned values within a +0.025% and -0.135% range of the certified mean. However the average Pb value of 1.87% falls within the control limits (Figure 11.6).
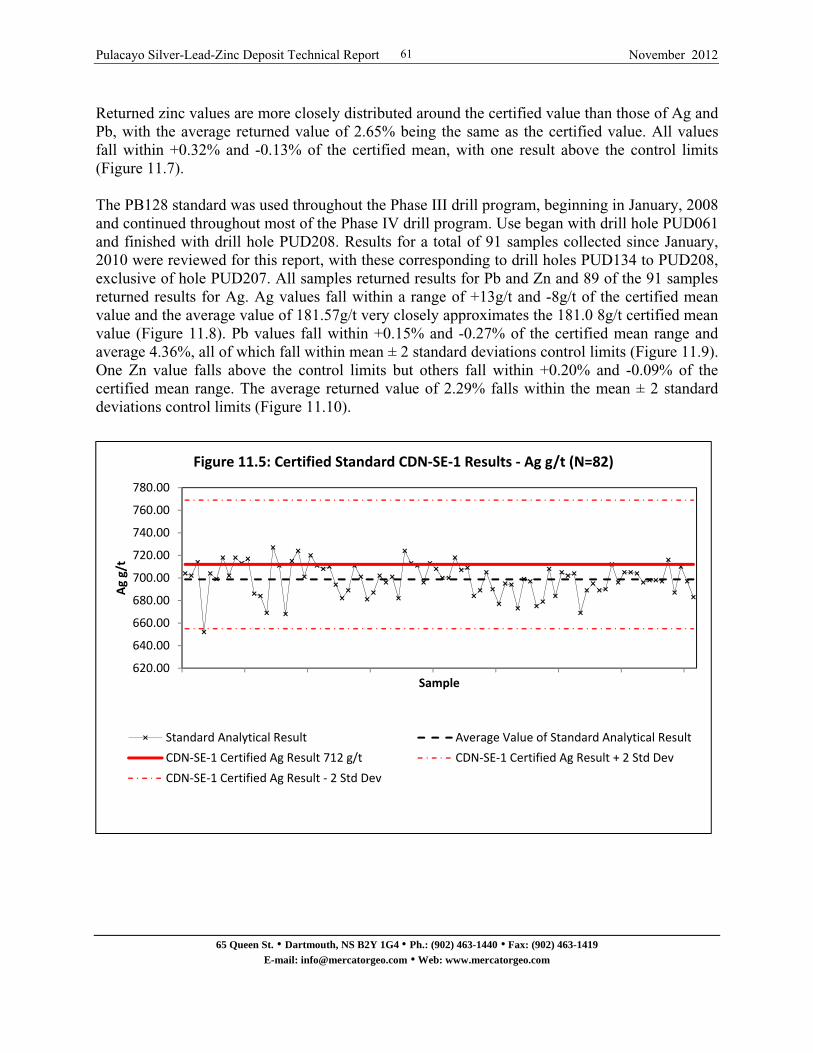
Pulacayo Silver-Lead-Zinc Deposit Technical Report November 2012
65 Queen St. • Dartmouth, NS B2Y 1G4 • Ph.: (902) 463-1440 • Fax: (902) 463-1419
E-mail: [email protected] • Web: www.mercatorgeo.com
61
Returned zinc values are more closely distributed around the certified value than those of Ag and Pb, with the average returned value of 2.65% being the same as the certified value. All values fall within +0.32% and -0.13% of the certified mean, with one result above the control limits (Figure 11.7). The PB128 standard was used throughout the Phase III drill program, beginning in January, 2008 and continued throughout most of the Phase IV drill program. Use began with drill hole PUD061 and finished with drill hole PUD208. Results for a total of 91 samples collected since January, 2010 were reviewed for this report, with these corresponding to drill holes PUD134 to PUD208, exclusive of hole PUD207. All samples returned results for Pb and Zn and 89 of the 91 samples returned results for Ag. Ag values fall within a range of +13g/t and -8g/t of the certified mean value and the average value of 181.57g/t very closely approximates the 181.0 8g/t certified mean value (Figure 11.8). Pb values fall within +0.15% and -0.27% of the certified mean range and average 4.36%, all of which fall within mean ± 2 standard deviations control limits (Figure 11.9). One Zn value falls above the control limits but others fall within +0.20% and -0.09% of the certified mean range. The average returned value of 2.29% falls within the mean ± 2 standard deviations control limits (Figure 11.10). Figure 11.5: Certified Standard CDN-SE-1 Results - Ag g/t (N=82)
620.00
640.00
660.00
680.00
700.00
720.00
740.00
760.00
780.00
Ag g/t
Sample
Figure 11.5: Certified Standard CDN‐SE‐1 Results ‐ Ag g/t (N=82)
Standard Analytical Result Average Value of Standard Analytical Result
CDN‐SE‐1 Certified Ag Result 712 g/t CDN‐SE‐1 Certified Ag Result + 2 Std Dev
CDN‐SE‐1 Certified Ag Result ‐ 2 Std Dev
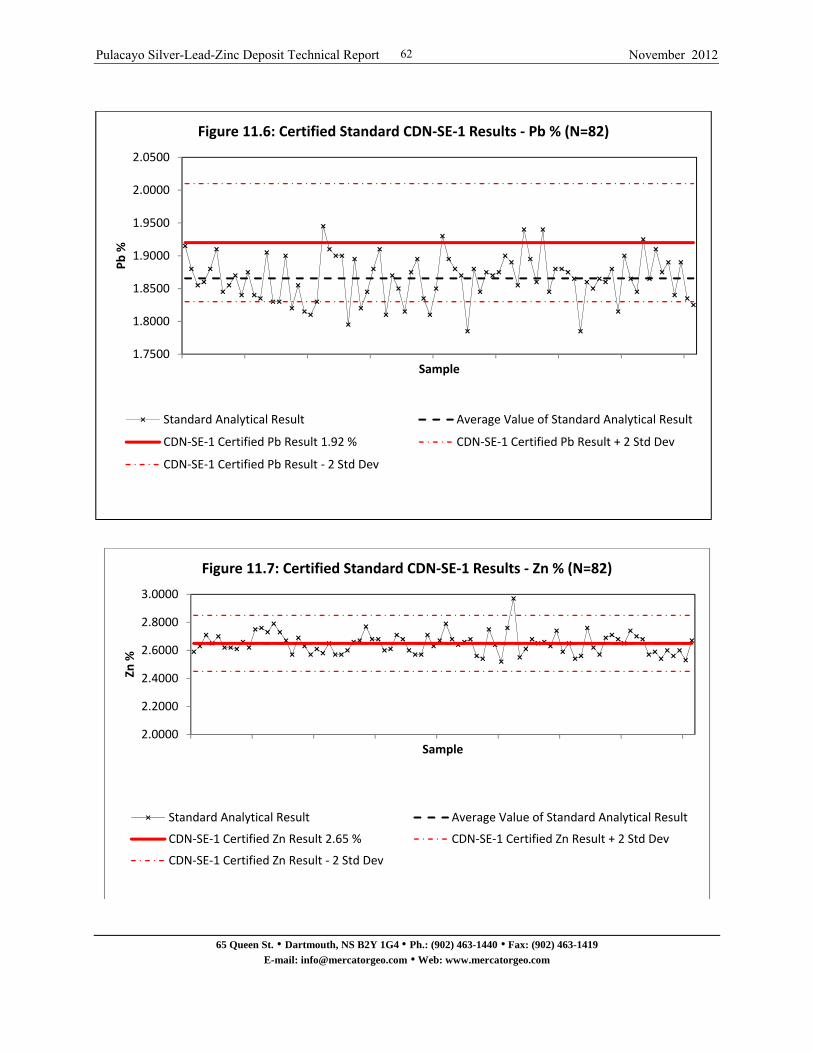
Pulacayo Silver-Lead-Zinc Deposit Technical Report November 2012
65 Queen St. • Dartmouth, NS B2Y 1G4 • Ph.: (902) 463-1440 • Fax: (902) 463-1419
E-mail: [email protected] • Web: www.mercatorgeo.com
62
Figure 11.6: Certified Standard CDN-SE-1 Results - Pb % (N=82)
Figure 11.7: Certified Standard CDN-SE-1 Results - Zn % (N=82)
1.7500
1.8000
1.8500
1.9000
1.9500
2.0000
2.0500
Pb %
Sample
Figure 11.6: Certified Standard CDN‐SE‐1 Results ‐ Pb % (N=82)
Standard Analytical Result Average Value of Standard Analytical Result
CDN‐SE‐1 Certified Pb Result 1.92 % CDN‐SE‐1 Certified Pb Result + 2 Std Dev
CDN‐SE‐1 Certified Pb Result ‐ 2 Std Dev
2.0000
2.2000
2.4000
2.6000
2.8000
3.0000
Zn %
Sample
Figure 11.7: Certified Standard CDN‐SE‐1 Results ‐ Zn % (N=82)
Standard Analytical Result Average Value of Standard Analytical Result
CDN‐SE‐1 Certified Zn Result 2.65 % CDN‐SE‐1 Certified Zn Result + 2 Std Dev
CDN‐SE‐1 Certified Zn Result ‐ 2 Std Dev
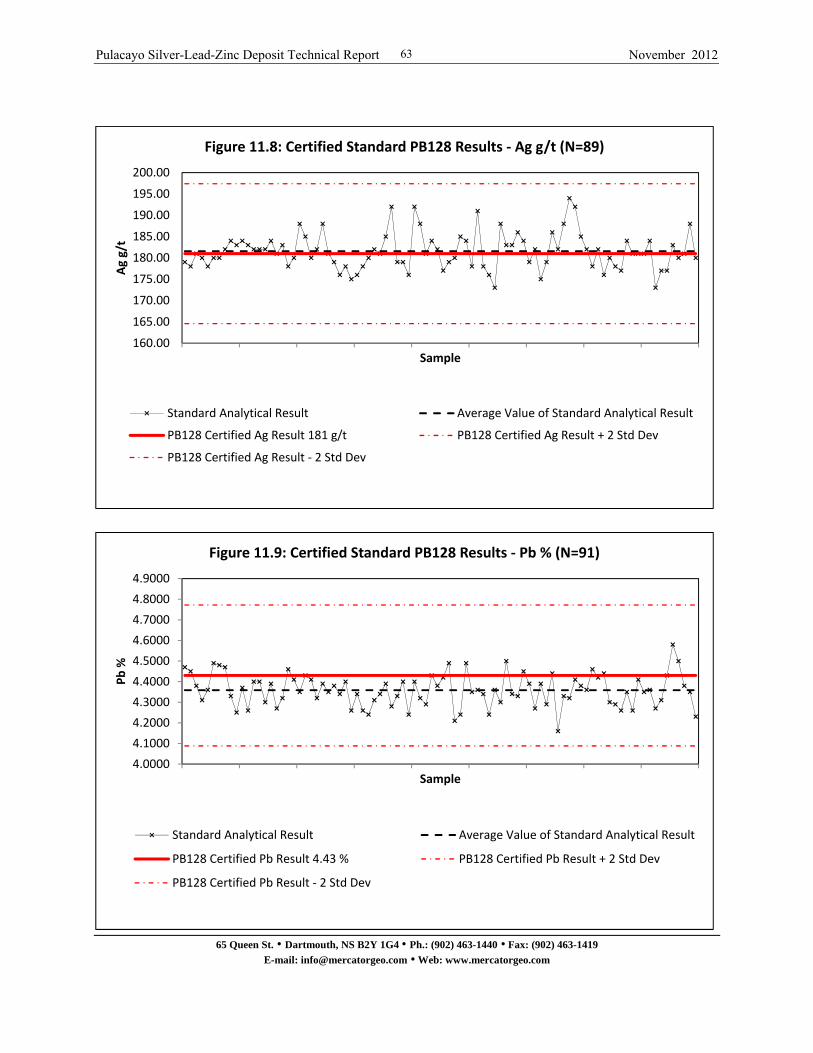
Pulacayo Silver-Lead-Zinc Deposit Technical Report November 2012
65 Queen St. • Dartmouth, NS B2Y 1G4 • Ph.: (902) 463-1440 • Fax: (902) 463-1419
E-mail: [email protected] • Web: www.mercatorgeo.com
63
Figure 11.8: Certified Standard PB128 Results - Ag g/t (N=89)
Figure 11.9: Certified Standard PB128 Results - Pb % (N=91)
160.00
165.00
170.00
175.00
180.00
185.00
190.00
195.00
200.00
Ag g/t
Sample
Figure 11.8: Certified Standard PB128 Results ‐ Ag g/t (N=89)
Standard Analytical Result Average Value of Standard Analytical Result
PB128 Certified Ag Result 181 g/t PB128 Certified Ag Result + 2 Std Dev
PB128 Certified Ag Result ‐ 2 Std Dev
4.0000
4.1000
4.2000
4.3000
4.4000
4.5000
4.6000
4.7000
4.8000
4.9000
Pb %
Sample
Figure 11.9: Certified Standard PB128 Results ‐ Pb % (N=91)
Standard Analytical Result Average Value of Standard Analytical Result
PB128 Certified Pb Result 4.43 % PB128 Certified Pb Result + 2 Std Dev
PB128 Certified Pb Result ‐ 2 Std Dev
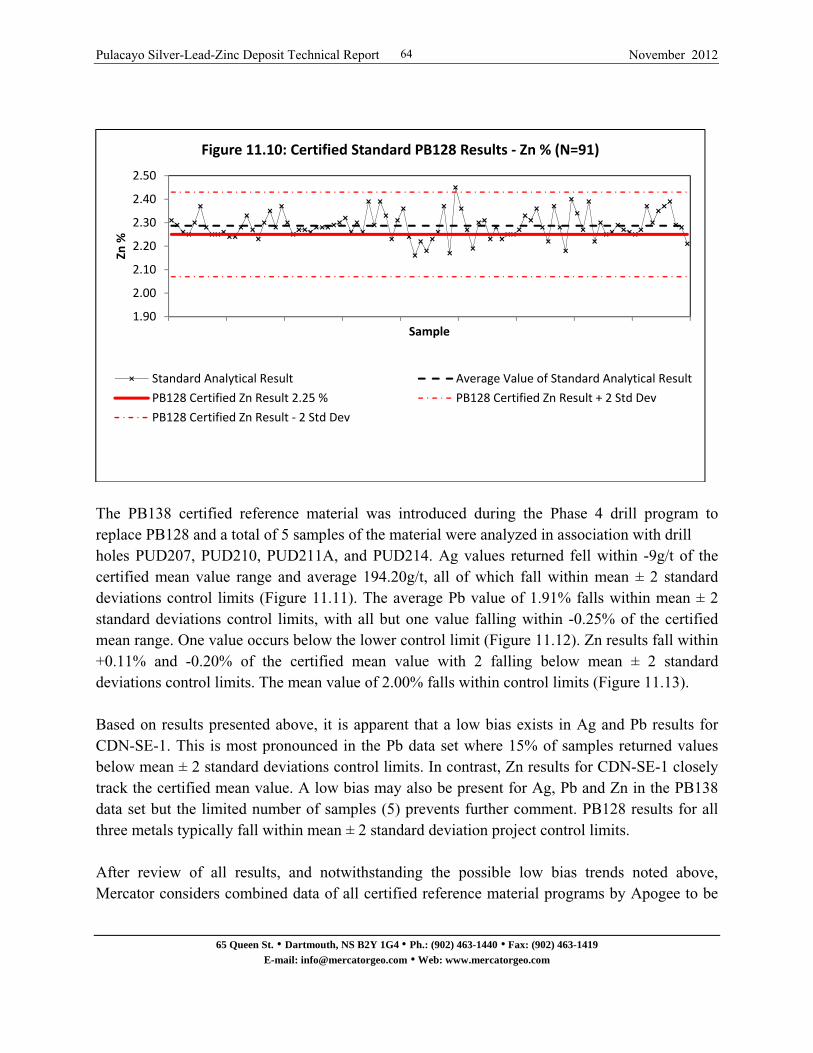
Pulacayo Silver-Lead-Zinc Deposit Technical Report November 2012
65 Queen St. • Dartmouth, NS B2Y 1G4 • Ph.: (902) 463-1440 • Fax: (902) 463-1419
E-mail: [email protected] • Web: www.mercatorgeo.com
64
Figure 11.10: Certifindard PB128 Results - Zn % (N=91)
The PB138 certified reference material was introduced during the Phase 4 drill program to replace PB128 and a total of 5 samples of the material were analyzed in association with drill holes PUD207, PUD210, PUD211A, and PUD214. Ag values returned fell within -9g/t of the certified mean value range and average 194.20g/t, all of which fall within mean ± 2 standard deviations control limits (Figure 11.11). The average Pb value of 1.91% falls within mean ± 2 standard deviations control limits, with all but one value falling within -0.25% of the certified mean range. One value occurs below the lower control limit (Figure 11.12). Zn results fall within +0.11% and -0.20% of the certified mean value with 2 falling below mean ± 2 standard deviations control limits. The mean value of 2.00% falls within control limits (Figure 11.13). Based on results presented above, it is apparent that a low bias exists in Ag and Pb results for CDN-SE-1. This is most pronounced in the Pb data set where 15% of samples returned values below mean ± 2 standard deviations control limits. In contrast, Zn results for CDN-SE-1 closely track the certified mean value. A low bias may also be present for Ag, Pb and Zn in the PB138 data set but the limited number of samples (5) prevents further comment. PB128 results for all three metals typically fall within mean ± 2 standard deviation project control limits. After review of all results, and notwithstanding the possible low bias trends noted above, Mercator considers combined data of all certified reference material programs by Apogee to be
1.90
2.00
2.10
2.20
2.30
2.40
2.50
Zn %
Sample
Figure 11.10: Certified Standard PB128 Results ‐ Zn % (N=91)
Standard Analytical Result Average Value of Standard Analytical Result
PB128 Certified Zn Result 2.25 % PB128 Certified Zn Result + 2 Std Dev
PB128 Certified Zn Result ‐ 2 Std Dev
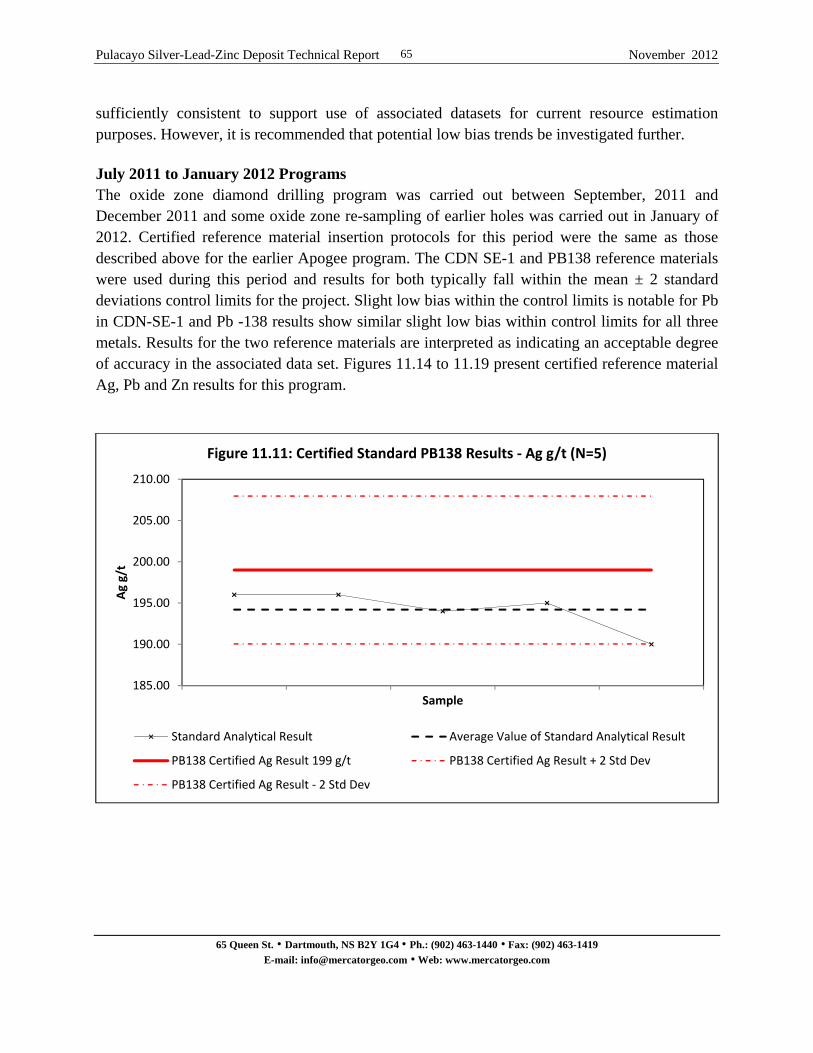
Pulacayo Silver-Lead-Zinc Deposit Technical Report November 2012
65 Queen St. • Dartmouth, NS B2Y 1G4 • Ph.: (902) 463-1440 • Fax: (902) 463-1419
E-mail: [email protected] • Web: www.mercatorgeo.com
65
sufficiently consistent to support use of associated datasets for current resource estimation purposes. However, it is recommended that potential low bias trends be investigated further. July 2011 to January 2012 Programs The oxide zone diamond drilling program was carried out between September, 2011 and December 2011 and some oxide zone re-sampling of earlier holes was carried out in January of 2012. Certified reference material insertion protocols for this period were the same as those described above for the earlier Apogee program. The CDN SE-1 and PB138 reference materials were used during this period and results for both typically fall within the mean ± 2 standard deviations control limits for the project. Slight low bias within the control limits is notable for Pb in CDN-SE-1 and Pb -138 results show similar slight low bias within control limits for all three metals. Results for the two reference materials are interpreted as indicating an acceptable degree of accuracy in the associated data set. Figures 11.14 to 11.19 present certified reference material Ag, Pb and Zn results for this program. Figure 11.11: Certified Standard PB138 Results ‐ Ag g/t (N=5)
Figure 11.12: Certified Standard PB138 Results - Pb % (N=5)
185.00
190.00
195.00
200.00
205.00
210.00
Ag g/t
Sample
Figure 11.11: Certified Standard PB138 Results ‐ Ag g/t (N=5)
Standard Analytical Result Average Value of Standard Analytical Result
PB138 Certified Ag Result 199 g/t PB138 Certified Ag Result + 2 Std Dev
PB138 Certified Ag Result ‐ 2 Std Dev

Pulacayo Silver-Lead-Zinc Deposit Technical Report November 2012
65 Queen St. • Dartmouth, NS B2Y 1G4 • Ph.: (902) 463-1440 • Fax: (902) 463-1419
E-mail: [email protected] • Web: www.mercatorgeo.com
66
Figure 11.13: Certified Standard PB138 Results - Zn % (N=5)
Figure 11.14: Certified Standard CDN‐SE‐1 Results ‐ Ag g/t (N=25)
1.70
1.80
1.90
2.00
2.10
2.20
2.30
Pb %
Sample
Figure 11.12: Certified Standard PB138 Results ‐ Pb % (N=5)
Standard Analytical Result Average Value of Standard Analytical Results
PB138 Certified Pb Result 2.04 % PB138 Certified Pb Result + 2 Std Dev
PB138 Certified Pb Result ‐ 2 Std Dev
1.80
1.85
1.90
1.95
2.00
2.05
2.10
2.15
2.20
2.25
Zn %
Sample
Figure 11.13: Certified Standard PB138 Results ‐ Zn % (N=5)
Standard Analytical Result Average Value of Standard Analytical Results
PB138 Certified Zn Result 2.08 % PB138 Certified Zn Result + 2 Std Dev
PB138 Certified Zn Result ‐ 2 Std Dev
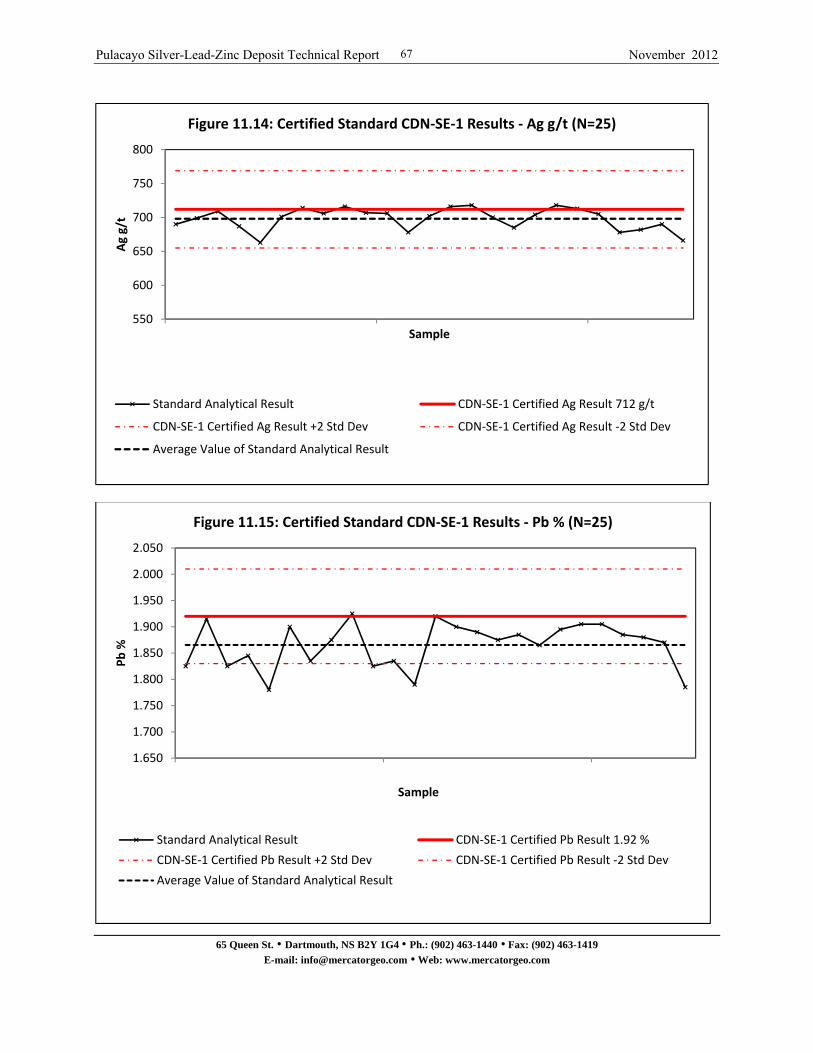
Pulacayo Silver-Lead-Zinc Deposit Technical Report November 2012
65 Queen St. • Dartmouth, NS B2Y 1G4 • Ph.: (902) 463-1440 • Fax: (902) 463-1419
E-mail: [email protected] • Web: www.mercatorgeo.com
67
Figure 11.15: Certified Standard CDN-SE-1 Results - Pb % (N=25)
Figure 11.16: Certified Standard CDN-SE-1 Results - Zn % (N=25)
550
600
650
700
750
800
Ag g/t
Sample
Figure 11.14: Certified Standard CDN‐SE‐1 Results ‐ Ag g/t (N=25)
Standard Analytical Result CDN‐SE‐1 Certified Ag Result 712 g/t
CDN‐SE‐1 Certified Ag Result +2 Std Dev CDN‐SE‐1 Certified Ag Result ‐2 Std Dev
Average Value of Standard Analytical Result
1.650
1.700
1.750
1.800
1.850
1.900
1.950
2.000
2.050
Pb %
Sample
Figure 11.15: Certified Standard CDN‐SE‐1 Results ‐ Pb % (N=25)
Standard Analytical Result CDN‐SE‐1 Certified Pb Result 1.92 %
CDN‐SE‐1 Certified Pb Result +2 Std Dev CDN‐SE‐1 Certified Pb Result ‐2 Std Dev
Average Value of Standard Analytical Result
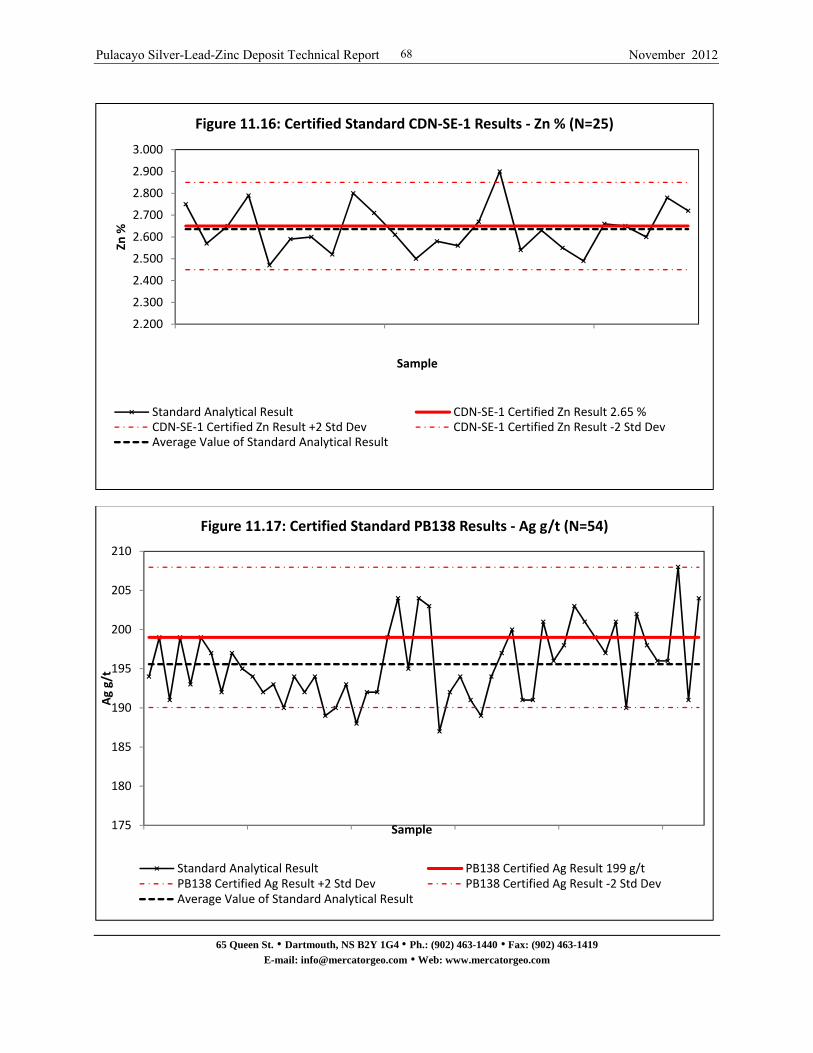
Pulacayo Silver-Lead-Zinc Deposit Technical Report November 2012
65 Queen St. • Dartmouth, NS B2Y 1G4 • Ph.: (902) 463-1440 • Fax: (902) 463-1419
E-mail: [email protected] • Web: www.mercatorgeo.com
68
Figure 11.17: Certified Standard PB138 Results - Ag g/t (N=54)
Figure 11.18: Certified Standard PB138 Results - Pb % (N=5)
2.200
2.300
2.400
2.500
2.600
2.700
2.800
2.900
3.000
Zn %
Sample
Figure 11.16: Certified Standard CDN‐SE‐1 Results ‐ Zn % (N=25)
Standard Analytical Result CDN‐SE‐1 Certified Zn Result 2.65 %CDN‐SE‐1 Certified Zn Result +2 Std Dev CDN‐SE‐1 Certified Zn Result ‐2 Std DevAverage Value of Standard Analytical Result
175
180
185
190
195
200
205
210
Ag g/t
Sample
Figure 11.17: Certified Standard PB138 Results ‐ Ag g/t (N=54)
Standard Analytical Result PB138 Certified Ag Result 199 g/tPB138 Certified Ag Result +2 Std Dev PB138 Certified Ag Result ‐2 Std DevAverage Value of Standard Analytical Result
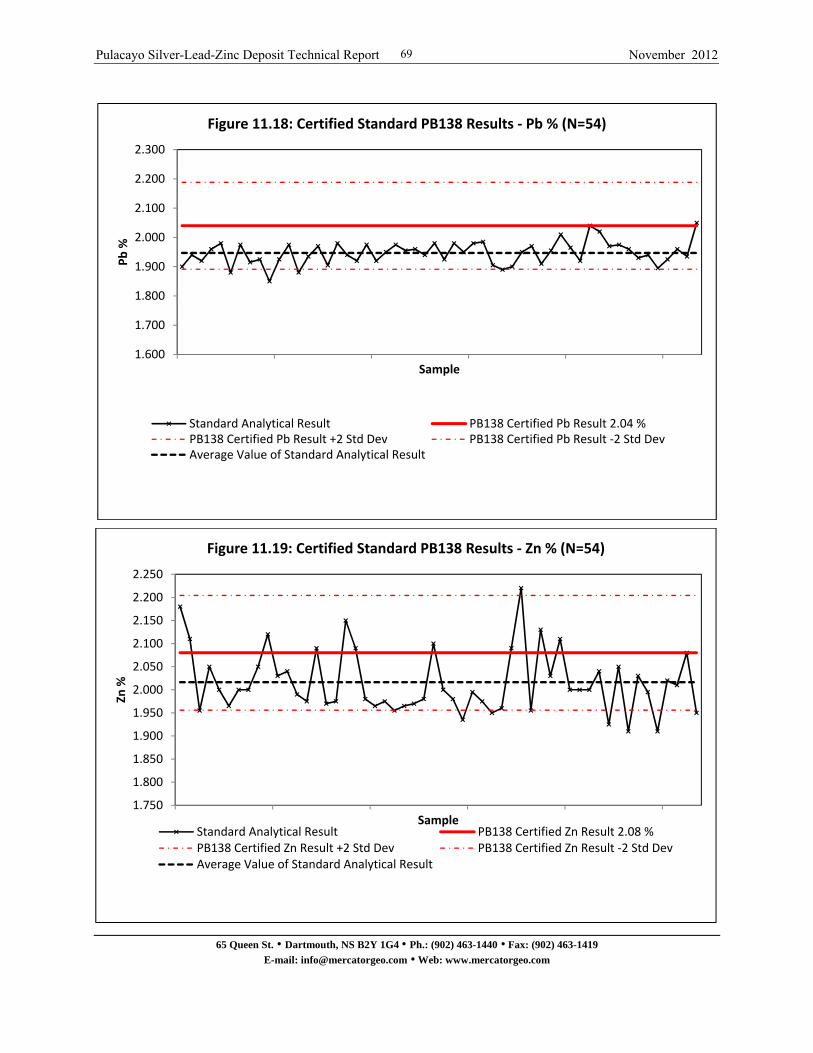
Pulacayo Silver-Lead-Zinc Deposit Technical Report November 2012
65 Queen St. • Dartmouth, NS B2Y 1G4 • Ph.: (902) 463-1440 • Fax: (902) 463-1419
E-mail: [email protected] • Web: www.mercatorgeo.com
69
Figure 11.19: Certified Standard PB138 Results - Zn % (N=54)
1.600
1.700
1.800
1.900
2.000
2.100
2.200
2.300
Pb %
Sample
Figure 11.18: Certified Standard PB138 Results ‐ Pb % (N=54)
Standard Analytical Result PB138 Certified Pb Result 2.04 %PB138 Certified Pb Result +2 Std Dev PB138 Certified Pb Result ‐2 Std DevAverage Value of Standard Analytical Result
1.750
1.800
1.850
1.900
1.950
2.000
2.050
2.100
2.150
2.200
2.250
Zn %
Sample
Figure 11.19: Certified Standard PB138 Results ‐ Zn % (N=54)
Standard Analytical Result PB138 Certified Zn Result 2.08 %PB138 Certified Zn Result +2 Std Dev PB138 Certified Zn Result ‐2 Std DevAverage Value of Standard Analytical Result

Pulacayo Silver-Lead-Zinc Deposit Technical Report November 2012
65 Queen St. • Dartmouth, NS B2Y 1G4 • Ph.: (902) 463-1440 • Fax: (902) 463-1419
E-mail: [email protected] • Web: www.mercatorgeo.com
70
Blank Sample Programs January 2010 to July 2011 Both field and commercial blank materials were systematically inserted into the laboratory sample stream by Apogee staff during this reporting period and total 174 associated samples. The insertion rate was at least 1 blank per 50 samples submitted. Blank samples used by Apogee consisted of blank reference material BL107 obtained from WCM, standard reference material CDN-BL-7 obtained from CDN and a field “coarse blank” that was prepared from a source of barren quartzite outcropping near the Pulacayo deposit. Details for the two commercial blanks appear in Appendix 1. Blank results from all three blank materials are reviewed together and pertain to drill holes PUD134 through PUD214. The blank results reviewed are deemed acceptable and no significant or systematic cross-contamination effect is interpreted to be present. Average blank values of 0.879g/t Ag, 0.0014% Pb, and 0.0053% Zn are below expected values for both the field and commercial blanks. Returned blank Ag results are consistently near expected values, with 4 results greater than 2g/t and a maximum value of 4g/t (Figure 11.20). Pb blank results are more variable, with 8 results greater than 0.003% and a maximum value of 0.007% (Figure 11.21). A total of 6 Zn blank samples returned a value greater than 0.010%, with three results returning values of 0.018%, 0.021%, and 0.021% (Figure 11.22). The majority of the blank sample anomalies are associated with field blanks prepared by Apogee and may reflect heterogeneity of such material. Figure 11.20: Blank Samples Values Ag g/t (N=174)
0.00
0.50
1.00
1.50
2.00
2.50
3.00
3.50
4.00
4.50
Ag g/t
Sample
Figure 11.20: Blank Samples Values Ag g/t (N=174)
Blank Values Ag (g/t) Average Blank Value
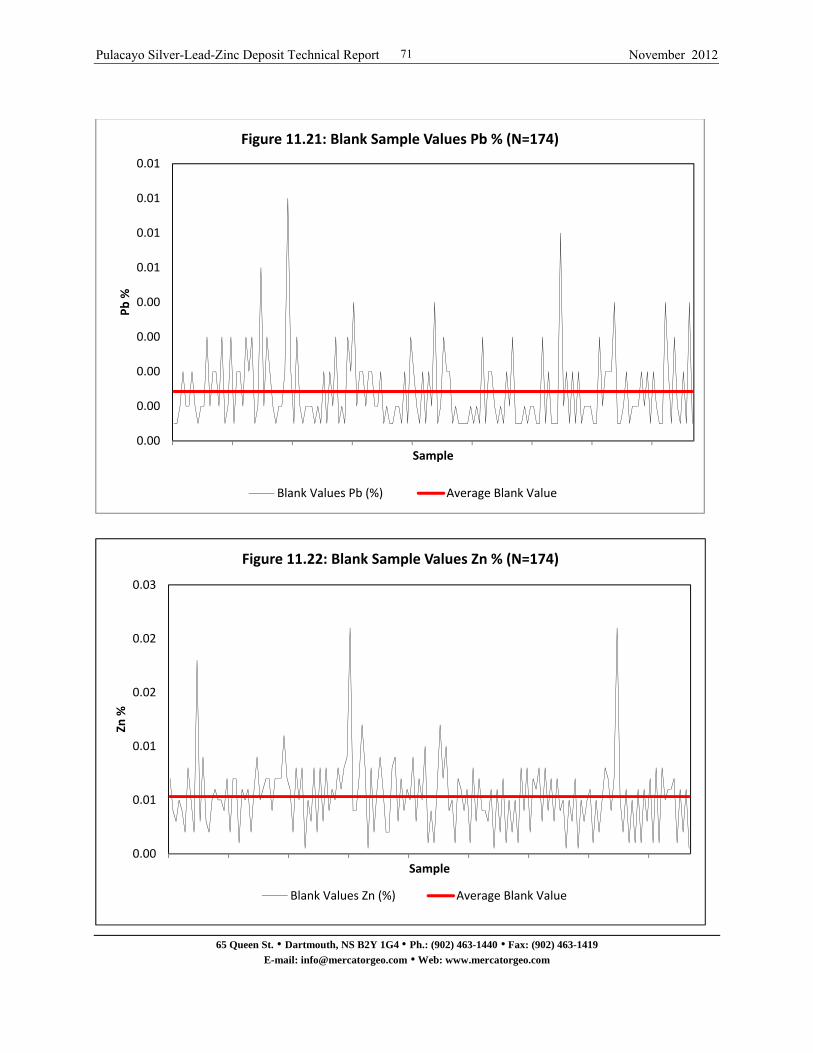
Pulacayo Silver-Lead-Zinc Deposit Technical Report November 2012
65 Queen St. • Dartmouth, NS B2Y 1G4 • Ph.: (902) 463-1440 • Fax: (902) 463-1419
E-mail: [email protected] • Web: www.mercatorgeo.com
71
Figure 11.21: Blank Sample Values Pb % (N=174)
Figure 11.22: Blank Sample Values Pb % (N=174)
0.00
0.00
0.00
0.00
0.00
0.01
0.01
0.01
0.01
Pb %
Sample
Figure 11.21: Blank Sample Values Pb % (N=174)
Blank Values Pb (%) Average Blank Value
0.00
0.01
0.01
0.02
0.02
0.03
Zn %
Sample
Figure 11.22: Blank Sample Values Zn % (N=174)
Blank Values Zn (%) Average Blank Value
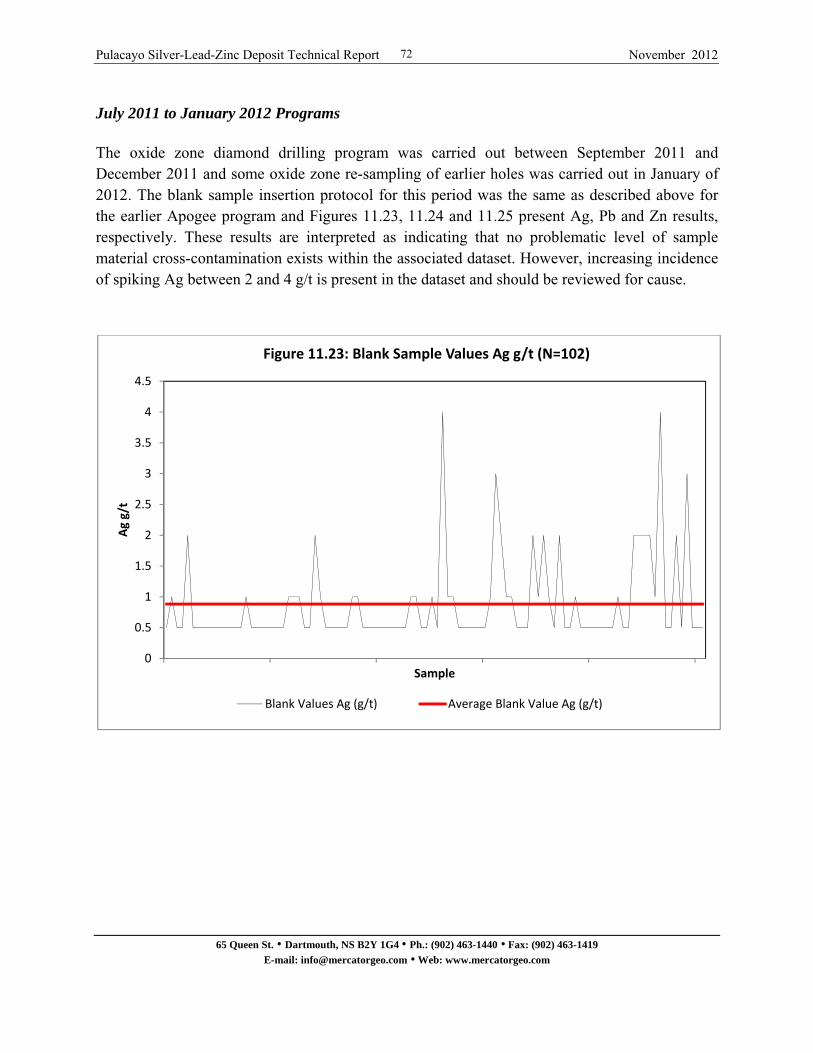
Pulacayo Silver-Lead-Zinc Deposit Technical Report November 2012
65 Queen St. • Dartmouth, NS B2Y 1G4 • Ph.: (902) 463-1440 • Fax: (902) 463-1419
E-mail: [email protected] • Web: www.mercatorgeo.com
72
July 2011 to January 2012 Programs The oxide zone diamond drilling program was carried out between September 2011 and December 2011 and some oxide zone re-sampling of earlier holes was carried out in January of 2012. The blank sample insertion protocol for this period was the same as described above for the earlier Apogee program and Figures 11.23, 11.24 and 11.25 present Ag, Pb and Zn results, respectively. These results are interpreted as indicating that no problematic level of sample material cross-contamination exists within the associated dataset. However, increasing incidence of spiking Ag between 2 and 4 g/t is present in the dataset and should be reviewed for cause. Figure 11.23: Blank Sample Values Ag g/t (N=102)
0
0.5
1
1.5
2
2.5
3
3.5
4
4.5
Ag g/t
Sample
Figure 11.23: Blank Sample Values Ag g/t (N=102)
Blank Values Ag (g/t) Average Blank Value Ag (g/t)

Pulacayo Silver-Lead-Zinc Deposit Technical Report November 2012
65 Queen St. • Dartmouth, NS B2Y 1G4 • Ph.: (902) 463-1440 • Fax: (902) 463-1419
E-mail: [email protected] • Web: www.mercatorgeo.com
73
Figure 11.24: Blank Sample Values Pb % (N=102)
Figure 11.25: Blank Sample Values Zn % (N=10)
0.000
0.001
0.002
0.003
0.004
0.005
0.006
0.007
Pb %
Sample
Figure 11.24: Blank Sample Values Pb % (N=102)
Blank Values Pb (%) Average Value Pb (%)
0.000
0.005
0.010
0.015
0.020
0.025
Zn %
Sample
Figure 11.25: Blank Sample Values Zn % (N=102)
Blank Values Zn (%) Average Value Zn (%)

Pulacayo Silver-Lead-Zinc Deposit Technical Report November 2012
65 Queen St. • Dartmouth, NS B2Y 1G4 • Ph.: (902) 463-1440 • Fax: (902) 463-1419
E-mail: [email protected] • Web: www.mercatorgeo.com
74
11.3.4 Quarter and Half Core Duplicate Split Check Sample Programs
January 2010 to July 2011 In addition to scheduled analysis of duplicate splits of core sample pulps by the laboratories, Apogee carried out a program of quarter core and half core sampling to check on sample variability and lab consistency during this report period. A total of 149 duplicate samples were processed by ALS in Lima, Peru, during the period, including 107 quarter core samples associated with drill holes PUD134 through PUD211A and 42 half core samples associated with drill holes PUD176 through PUD214. Ag results are presented in Figure 11.26 for half core duplicates and in Figure 11.27 for quarter core duplicates and have correlation coefficients of 0.84 and 0.83 respectively. Although the duplicate samples in both cases returned higher values in general than the original results, duplicates of high grade original samples show greater variability. Pb and Zn results of duplicate samples show a higher degree of correlation with the original result. Pb half core duplicate samples (Figure 11.28) and quarter core duplicate samples (Figure 11.29) have correlation coefficients of 0.97 and 0.94 respectively and Zn half core duplicate samples (Figure 11.30) and quarter core duplicate samples (Figure 11.28) have correlation coefficients of 0.96 and 0.95 respectively. Figure 11.26: 1/2 Core Duplicate Samples - Ag g/t (N=42)
0.00
20.00
40.00
60.00
80.00
100.00
120.00
140.00
160.00
180.00
0.00 20.00 40.00 60.00 80.00 100.00 120.00 140.00 160.00 180.00
Original Sam
ple
Duplicate Sample
Figure: 11.26: 1/2 Core Duplicate Samples ‐ Ag g/t (N=42)
1/2 Core Duplicate Samples ‐ Ag g/t Linear (1/2 Core Duplicate Samples ‐ Ag g/t)

Pulacayo Silver-Lead-Zinc Deposit Technical Report November 2012
65 Queen St. • Dartmouth, NS B2Y 1G4 • Ph.: (902) 463-1440 • Fax: (902) 463-1419
E-mail: [email protected] • Web: www.mercatorgeo.com
75
Figure 11.27: 1/4 Core Duplicate Samples - Ag g/t (N=107)
Figure 11.28: 1/2 Core Duplicate Samples - Pb % (=N42)
0.00
100.00
200.00
300.00
400.00
500.00
600.00
700.00
0.00 100.00 200.00 300.00 400.00 500.00 600.00 700.00
Original Sam
ple
Duplicate Sample
Figure 11.27: 1/4 Core Duplicate Samples ‐ Ag g/t (N=107)
1/4 Core Duplicate Samples ‐ Ag ppm Linear (1/4 Core Duplicate Samples ‐ Ag ppm)
0.00
0.20
0.40
0.60
0.80
1.00
1.20
0.00 0.20 0.40 0.60 0.80 1.00 1.20
Original Sam
ple
Duplicate Sample
Figure 11.28: 1/2 Core Duplicate Samples ‐ Pb % (=N42)
1/2 Core Duplicate Samples ‐ Pb % Linear (1/2 Core Duplicate Samples ‐ Pb %)

Pulacayo Silver-Lead-Zinc Deposit Technical Report November 2012
65 Queen St. • Dartmouth, NS B2Y 1G4 • Ph.: (902) 463-1440 • Fax: (902) 463-1419
E-mail: [email protected] • Web: www.mercatorgeo.com
76
Figure 11.29: 1/4 Core Duplicate Samples - Pb % (N=107)
Figure 11.30: 1/2 Core Duplicate Samples - Zn % (N=42)
0.00
0.50
1.00
1.50
2.00
2.50
3.00
3.50
4.00
0.00 0.50 1.00 1.50 2.00 2.50 3.00 3.50 4.00
Original Sam
ple
Duplicate Sample
Figure 11.29: 1/4 Core Duplicate Samples ‐ Pb % (N=107)
1/4 Core Duplicate Samples ‐ Pb % Linear (1/4 Core Duplicate Samples ‐ Pb %)
0.00
0.50
1.00
1.50
2.00
2.50
3.00
3.50
4.00
4.50
5.00
0.00 0.50 1.00 1.50 2.00 2.50 3.00 3.50 4.00 4.50 5.00
Original Sam
ple
Duplicate Sample
Figure 11.30: 1/2 Core Duplicate Samples ‐ Zn % (N=42)
1/2 Core Duplicate Samples ‐ Zn % Linear (1/2 Core Duplicate Samples ‐ Zn %)
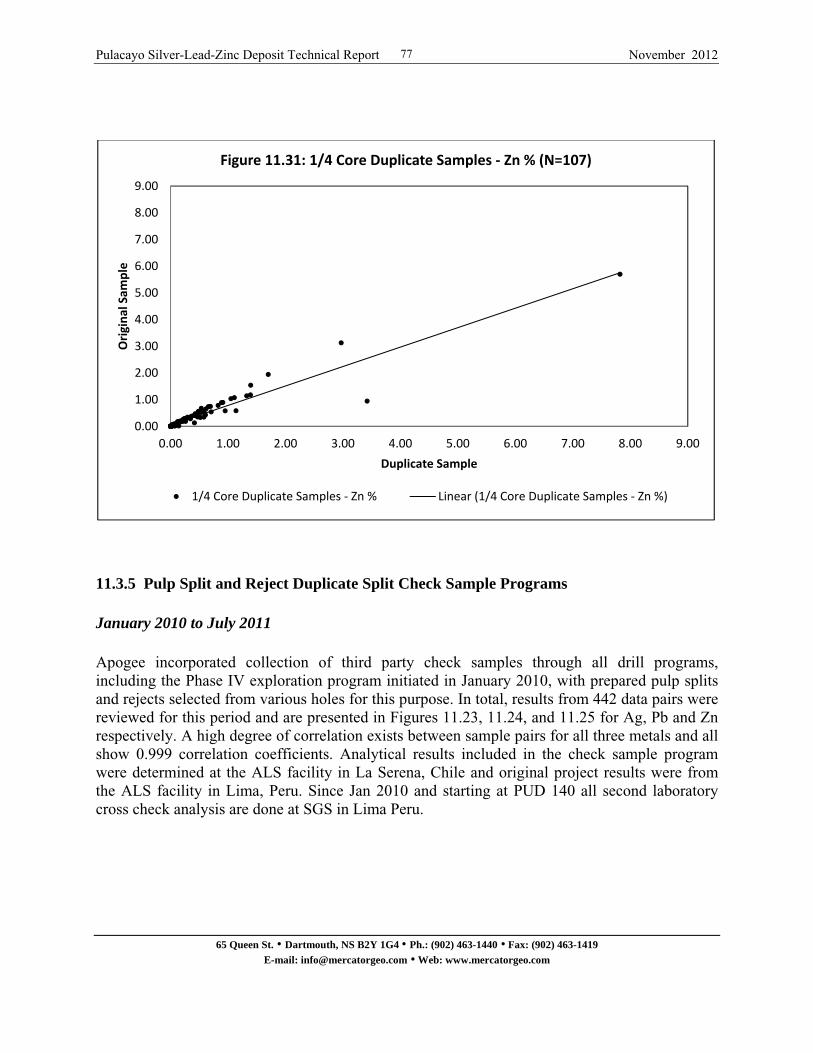
Pulacayo Silver-Lead-Zinc Deposit Technical Report November 2012
65 Queen St. • Dartmouth, NS B2Y 1G4 • Ph.: (902) 463-1440 • Fax: (902) 463-1419
E-mail: [email protected] • Web: www.mercatorgeo.com
77
Figure 11.31: 1/4 Core Duplicate Samples - Zn % (N=107)
11.3.5 Pulp Split and Reject Duplicate Split Check Sample Programs January 2010 to July 2011 Apogee incorporated collection of third party check samples through all drill programs, including the Phase IV exploration program initiated in January 2010, with prepared pulp splits and rejects selected from various holes for this purpose. In total, results from 442 data pairs were reviewed for this period and are presented in Figures 11.23, 11.24, and 11.25 for Ag, Pb and Zn respectively. A high degree of correlation exists between sample pairs for all three metals and all show 0.999 correlation coefficients. Analytical results included in the check sample program were determined at the ALS facility in La Serena, Chile and original project results were from the ALS facility in Lima, Peru. Since Jan 2010 and starting at PUD 140 all second laboratory cross check analysis are done at SGS in Lima Peru.
0.00
1.00
2.00
3.00
4.00
5.00
6.00
7.00
8.00
9.00
0.00 1.00 2.00 3.00 4.00 5.00 6.00 7.00 8.00 9.00
Original Sam
ple
Duplicate Sample
Figure 11.31: 1/4 Core Duplicate Samples ‐ Zn % (N=107)
1/4 Core Duplicate Samples ‐ Zn % Linear (1/4 Core Duplicate Samples ‐ Zn %)

Pulacayo Silver-Lead-Zinc Deposit Technical Report November 2012
65 Queen St. • Dartmouth, NS B2Y 1G4 • Ph.: (902) 463-1440 • Fax: (902) 463-1419
E-mail: [email protected] • Web: www.mercatorgeo.com
78
Figure 11.32: Pulp Splits and Reject Duplicate Samples - Pb % (N=442)
0.00
200.00
400.00
600.00
800.00
1000.00
1200.00
1400.00
0.00 200.00 400.00 600.00 800.00 1000.00 1200.00 1400.00
Original Sam
ple
Duplicate Sample
Figure 11.32: Pulp Splits and Reject Duplicate Samples ‐ Ag g/t (N=442)
Reject Duplicate Samples ‐ Ag g/t Pulp Duplicate Samples ‐ Ag g/t
Linear (Reject Duplicate Samples ‐ Ag g/t) Linear (Pulp Duplicate Samples ‐ Ag g/t)
0.00
1.00
2.00
3.00
4.00
5.00
6.00
7.00
8.00
0.00 1.00 2.00 3.00 4.00 5.00 6.00 7.00 8.00
Original Sam
ple
Duplicate Sample
Figure 11.33: Pulp Splits and Reject Duplicate Samples ‐ Pb % (N=442)
Reject Duplicate Samples ‐ Pb % Pulp Duplicate Samples ‐ Pb %
Linear (Reject Duplicate Samples ‐ Pb %) Linear (Pulp Duplicate Samples ‐ Pb %)
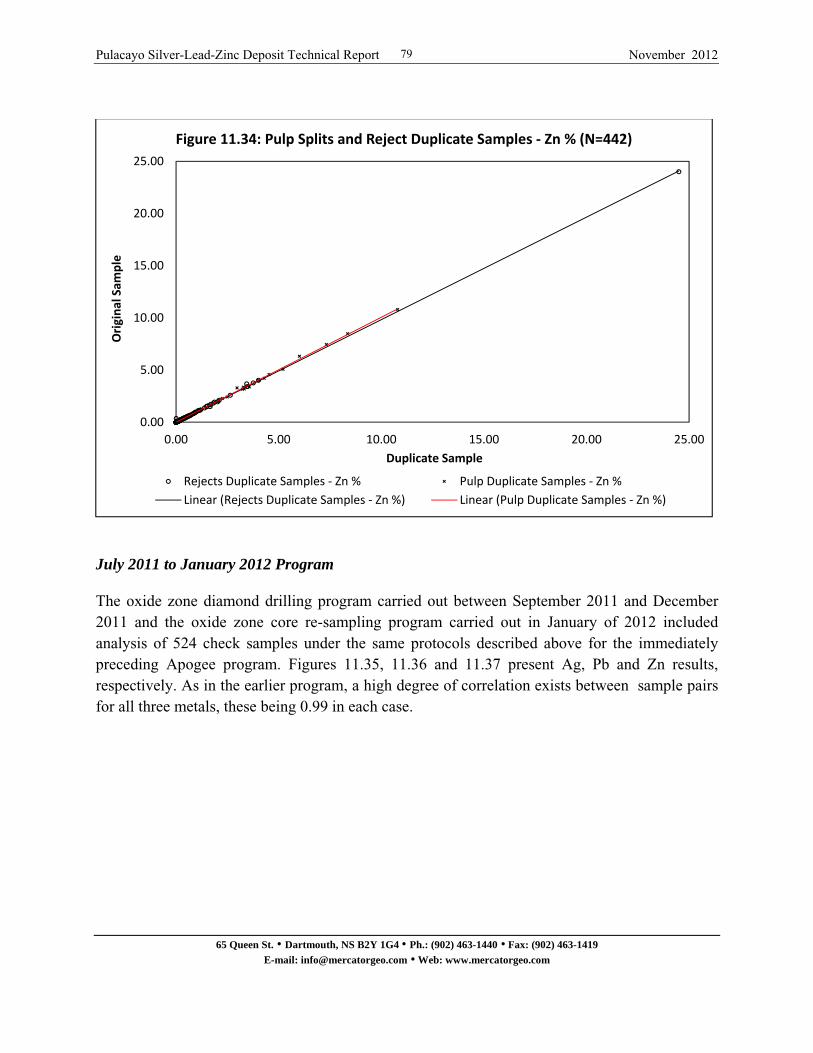
Pulacayo Silver-Lead-Zinc Deposit Technical Report November 2012
65 Queen St. • Dartmouth, NS B2Y 1G4 • Ph.: (902) 463-1440 • Fax: (902) 463-1419
E-mail: [email protected] • Web: www.mercatorgeo.com
79
Figure 11.33: Pulp Splits and Reject Duplicate Samples - Zn % (N=442)
July 2011 to January 2012 Program The oxide zone diamond drilling program carried out between September 2011 and December 2011 and the oxide zone core re-sampling program carried out in January of 2012 included analysis of 524 check samples under the same protocols described above for the immediately preceding Apogee program. Figures 11.35, 11.36 and 11.37 present Ag, Pb and Zn results, respectively. As in the earlier program, a high degree of correlation exists between sample pairs for all three metals, these being 0.99 in each case.
0.00
5.00
10.00
15.00
20.00
25.00
0.00 5.00 10.00 15.00 20.00 25.00
Original Sam
ple
Duplicate Sample
Figure 11.34: Pulp Splits and Reject Duplicate Samples ‐ Zn % (N=442)
Rejects Duplicate Samples ‐ Zn % Pulp Duplicate Samples ‐ Zn %
Linear (Rejects Duplicate Samples ‐ Zn %) Linear (Pulp Duplicate Samples ‐ Zn %)

Pulacayo Silver-Lead-Zinc Deposit Technical Report November 2012
65 Queen St. • Dartmouth, NS B2Y 1G4 • Ph.: (902) 463-1440 • Fax: (902) 463-1419
E-mail: [email protected] • Web: www.mercatorgeo.com
80
Figure 11.345: Pulp Splits and Reject Duplicate Samples - Ag (N=524)
Figure 11.356: Pulp Splits and Reject Duplicate Samples – Pb (N=524)
0.00
50.00
100.00
150.00
200.00
250.00
0.00 50.00 100.00 150.00 200.00 250.00
Original Sam
ple
Duplicate Sample
Figure 11.35: Pulp Splits (N=290) Reject Duplicate Samples (N=233) ‐ Ag g/t
Pulp Duplicate Samples ‐ Ag g/t Reject Duplicate Samples ‐ Ag g/t
Linear (Pulp Duplicate Samples ‐ Ag g/t) Linear (Reject Duplicate Samples ‐ Ag g/t)
0.000
0.500
1.000
1.500
2.000
2.500
3.000
3.500
4.000
4.500
5.000
0.000 0.500 1.000 1.500 2.000 2.500 3.000 3.500 4.000 4.500 5.000
Original Sam
ple
Duplicate Sample
Figure 11.36: Pulp Splits (N=290) Reject Duplicate Samples (N=233) ‐ Pb %
Pulp Duplicate Samples ‐ Pb % Reject Duplicate Samples ‐ Pb %
Linear (Pulp Duplicate Samples ‐ Pb %) Linear (Reject Duplicate Samples ‐ Pb %)

Pulacayo Silver-Lead-Zinc Deposit Technical Report November 2012
65 Queen St. • Dartmouth, NS B2Y 1G4 • Ph.: (902) 463-1440 • Fax: (902) 463-1419
E-mail: [email protected] • Web: www.mercatorgeo.com
81
Figure 11.367: Pulp Splits and Reject Duplicate Samples – Zn (N=524)
11.3.6 Mercator Program
August 2011 Site Visit Program During the August, 2011 site visit by Mercator, quarter core samples were obtained from Apogee drill core for purposes of independent check sample analysis. In total, 9 quarter core samples were collected to provide sample coverage across the Ag, Pb and Zn grade ranges represented in the deposit. Sample record details pertaining to the program appear in Appendix 1. The quarter core samples were collected from drill holes PUD111, PUD134, PUD140, PUD144, PUD175, PUD188, and PUD203 and were submitted for analysis to SGS del Peru S.A.C.. A sample of certified reference material CDN-SE-1, a commercial blank sample, and 4 reject samples were added to the batch of core samples submitted by Mercator for quality control and quality assurance purposes. Sample intervals of archived drill core were selected and marked by Mercator and then photographed prior to being placed in labelled plastic bags for shipment to the laboratory. Core intervals taken for check sample purposes were clearly identified by explanatory tags secured in the core boxes for archival reference purposes. All core sampling work was carried out at the Apogee core logging facility on the Pulacayo property by Mercator and Apogee field staff carried out sample cutting and bagging activities under Mercator supervision.
0.000
1.000
2.000
3.000
4.000
5.000
6.000
7.000
8.000
9.000
10.000
0.000 1.000 2.000 3.000 4.000 5.000 6.000 7.000 8.000 9.000 10.000
Original Sam
ple
Duplicate Sample
Figure 11.37: Pulp Splits (N=290) Reject Duplicate Samples (N=233) ‐ Zn %
Pulp Duplicate Samples ‐ Zn % Reject Duplicate Samples ‐ Zn %
Linear (Pulp Duplicate Samples ‐ Zn %) Linear (Reject Duplicate Samples ‐ Zn %)
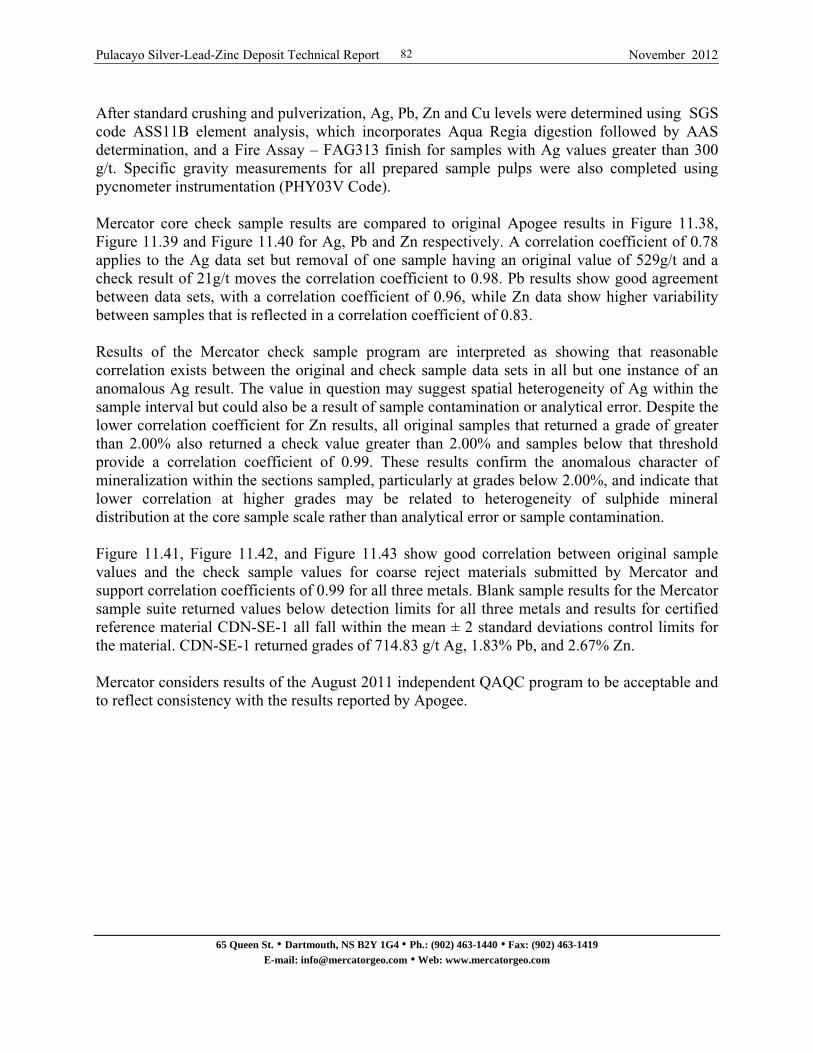
Pulacayo Silver-Lead-Zinc Deposit Technical Report November 2012
65 Queen St. • Dartmouth, NS B2Y 1G4 • Ph.: (902) 463-1440 • Fax: (902) 463-1419
E-mail: [email protected] • Web: www.mercatorgeo.com
82
After standard crushing and pulverization, Ag, Pb, Zn and Cu levels were determined using SGS code ASS11B element analysis, which incorporates Aqua Regia digestion followed by AAS determination, and a Fire Assay – FAG313 finish for samples with Ag values greater than 300 g/t. Specific gravity measurements for all prepared sample pulps were also completed using pycnometer instrumentation (PHY03V Code). Mercator core check sample results are compared to original Apogee results in Figure 11.38, Figure 11.39 and Figure 11.40 for Ag, Pb and Zn respectively. A correlation coefficient of 0.78 applies to the Ag data set but removal of one sample having an original value of 529g/t and a check result of 21g/t moves the correlation coefficient to 0.98. Pb results show good agreement between data sets, with a correlation coefficient of 0.96, while Zn data show higher variability between samples that is reflected in a correlation coefficient of 0.83. Results of the Mercator check sample program are interpreted as showing that reasonable correlation exists between the original and check sample data sets in all but one instance of an anomalous Ag result. The value in question may suggest spatial heterogeneity of Ag within the sample interval but could also be a result of sample contamination or analytical error. Despite the lower correlation coefficient for Zn results, all original samples that returned a grade of greater than 2.00% also returned a check value greater than 2.00% and samples below that threshold provide a correlation coefficient of 0.99. These results confirm the anomalous character of mineralization within the sections sampled, particularly at grades below 2.00%, and indicate that lower correlation at higher grades may be related to heterogeneity of sulphide mineral distribution at the core sample scale rather than analytical error or sample contamination. Figure 11.41, Figure 11.42, and Figure 11.43 show good correlation between original sample values and the check sample values for coarse reject materials submitted by Mercator and support correlation coefficients of 0.99 for all three metals. Blank sample results for the Mercator sample suite returned values below detection limits for all three metals and results for certified reference material CDN-SE-1 all fall within the mean ± 2 standard deviations control limits for the material. CDN-SE-1 returned grades of 714.83 g/t Ag, 1.83% Pb, and 2.67% Zn. Mercator considers results of the August 2011 independent QAQC program to be acceptable and to reflect consistency with the results reported by Apogee.
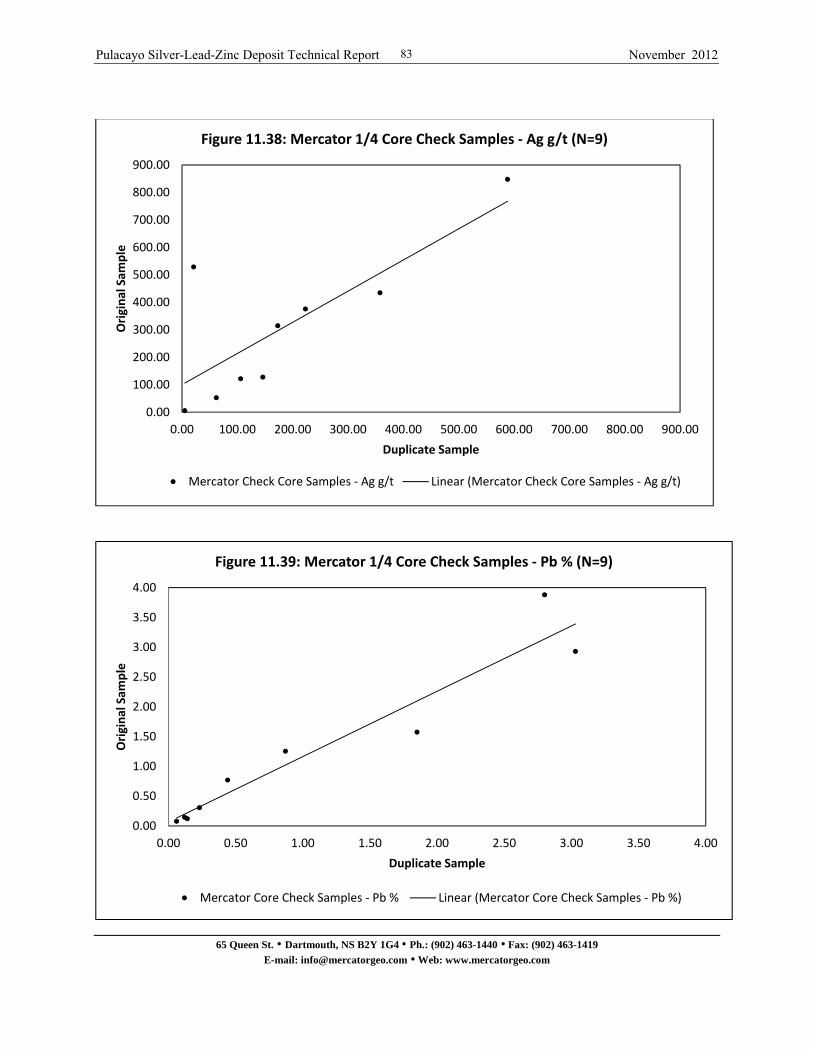
Pulacayo Silver-Lead-Zinc Deposit Technical Report November 2012
65 Queen St. • Dartmouth, NS B2Y 1G4 • Ph.: (902) 463-1440 • Fax: (902) 463-1419
E-mail: [email protected] • Web: www.mercatorgeo.com
83
Figure 11.378: Mercator ¼ Core Check Samples - Ag g/t (N=9)
Figure 11.389: Mercator 1/4 Core Check Samples - Pb % (N=9)
0.00
100.00
200.00
300.00
400.00
500.00
600.00
700.00
800.00
900.00
0.00 100.00 200.00 300.00 400.00 500.00 600.00 700.00 800.00 900.00
Original Sam
ple
Duplicate Sample
Figure 11.38: Mercator 1/4 Core Check Samples ‐ Ag g/t (N=9)
Mercator Check Core Samples ‐ Ag g/t Linear (Mercator Check Core Samples ‐ Ag g/t)
0.00
0.50
1.00
1.50
2.00
2.50
3.00
3.50
4.00
0.00 0.50 1.00 1.50 2.00 2.50 3.00 3.50 4.00
Original Sam
ple
Duplicate Sample
Figure 11.39: Mercator 1/4 Core Check Samples ‐ Pb % (N=9)
Mercator Core Check Samples ‐ Pb % Linear (Mercator Core Check Samples ‐ Pb %)
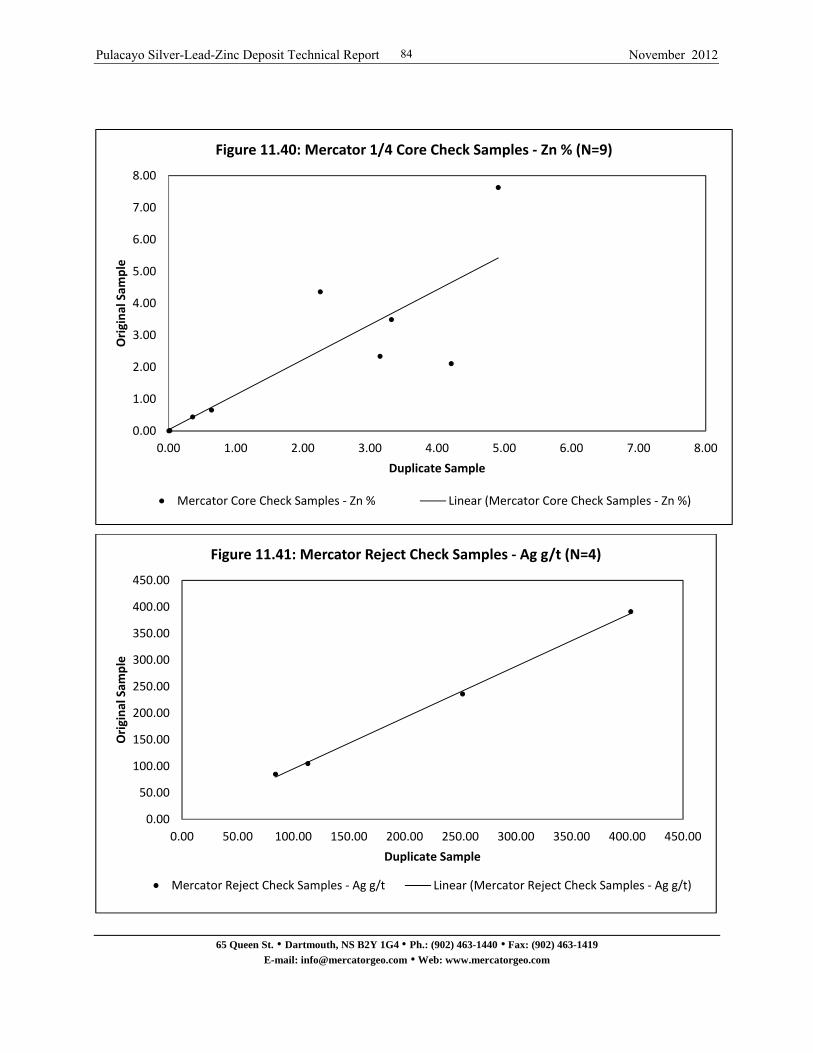
Pulacayo Silver-Lead-Zinc Deposit Technical Report November 2012
65 Queen St. • Dartmouth, NS B2Y 1G4 • Ph.: (902) 463-1440 • Fax: (902) 463-1419
E-mail: [email protected] • Web: www.mercatorgeo.com
84
Figure 11.40: Mercator 1/4 Core Check Samples - Zn % (N=9)
Figure 11.41: Mercator Reject Check Samples - Ag g/t (N=4)
0.00
1.00
2.00
3.00
4.00
5.00
6.00
7.00
8.00
0.00 1.00 2.00 3.00 4.00 5.00 6.00 7.00 8.00
Original Sam
ple
Duplicate Sample
Figure 11.40: Mercator 1/4 Core Check Samples ‐ Zn % (N=9)
Mercator Core Check Samples ‐ Zn % Linear (Mercator Core Check Samples ‐ Zn %)
0.00
50.00
100.00
150.00
200.00
250.00
300.00
350.00
400.00
450.00
0.00 50.00 100.00 150.00 200.00 250.00 300.00 350.00 400.00 450.00
Original Sam
ple
Duplicate Sample
Figure 11.41: Mercator Reject Check Samples ‐ Ag g/t (N=4)
Mercator Reject Check Samples ‐ Ag g/t Linear (Mercator Reject Check Samples ‐ Ag g/t)

Pulacayo Silver-Lead-Zinc Deposit Technical Report November 2012
65 Queen St. • Dartmouth, NS B2Y 1G4 • Ph.: (902) 463-1440 • Fax: (902) 463-1419
E-mail: [email protected] • Web: www.mercatorgeo.com
85
Figure 11.42: Mercator Reject Check Samples – Pb % (N=4)
Figure 11.393: Mercator Reject Check Samples - Zn % (N=4)
0.00
1.00
2.00
3.00
4.00
5.00
6.00
0.00 1.00 2.00 3.00 4.00 5.00 6.00
Original Sam
ple
Duplicate Sample
Figure 11.42: Mercator Reject Check Samples ‐ Pb % (N=4)
Mercator Reject Check Samples ‐ Pb %
0.00
0.50
1.00
1.50
2.00
2.50
3.00
3.50
4.00
4.50
0.00 0.50 1.00 1.50 2.00 2.50 3.00 3.50 4.00 4.50
Original Sam
ple
Duplicate Sample
Figure 11.43: Mercator Reject Check Samples ‐ Zn % (N=4)
Mercator Reject Check Samples ‐ Zn % Linear (Mercator Reject Check Samples ‐ Zn %)
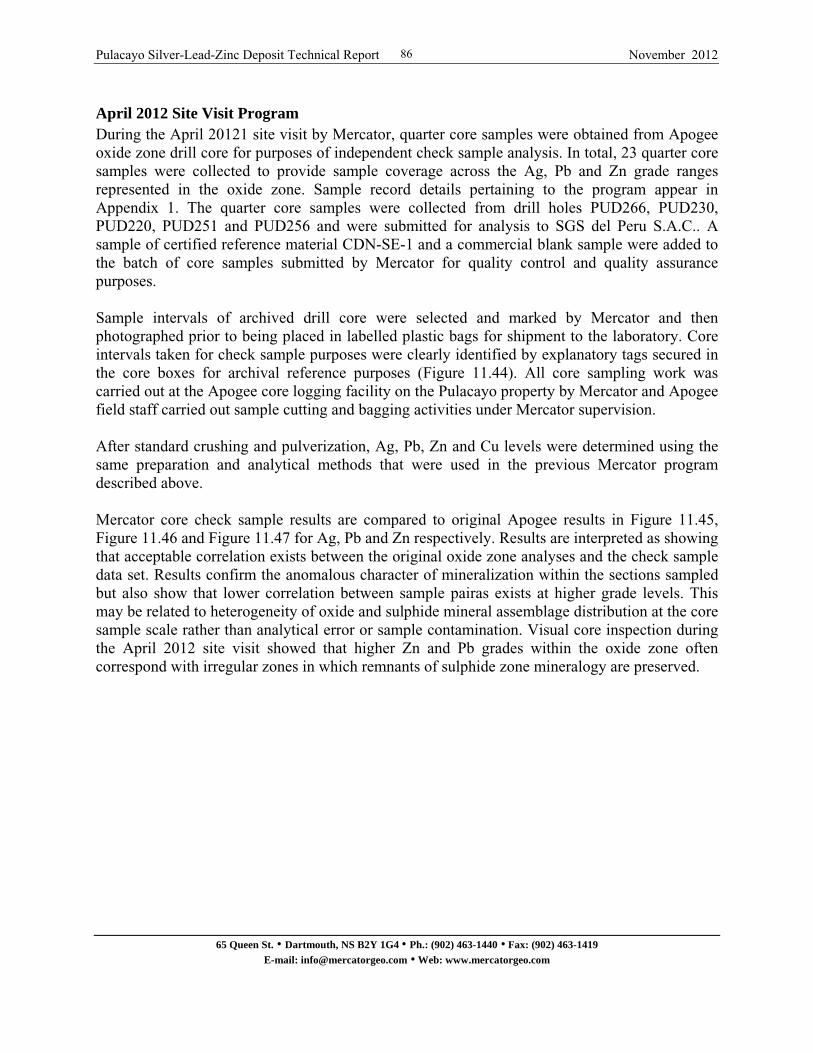
Pulacayo Silver-Lead-Zinc Deposit Technical Report November 2012
65 Queen St. • Dartmouth, NS B2Y 1G4 • Ph.: (902) 463-1440 • Fax: (902) 463-1419
E-mail: [email protected] • Web: www.mercatorgeo.com
86
April 2012 Site Visit Program During the April 20121 site visit by Mercator, quarter core samples were obtained from Apogee oxide zone drill core for purposes of independent check sample analysis. In total, 23 quarter core samples were collected to provide sample coverage across the Ag, Pb and Zn grade ranges represented in the oxide zone. Sample record details pertaining to the program appear in Appendix 1. The quarter core samples were collected from drill holes PUD266, PUD230, PUD220, PUD251 and PUD256 and were submitted for analysis to SGS del Peru S.A.C.. A sample of certified reference material CDN-SE-1 and a commercial blank sample were added to the batch of core samples submitted by Mercator for quality control and quality assurance purposes. Sample intervals of archived drill core were selected and marked by Mercator and then photographed prior to being placed in labelled plastic bags for shipment to the laboratory. Core intervals taken for check sample purposes were clearly identified by explanatory tags secured in the core boxes for archival reference purposes (Figure 11.44). All core sampling work was carried out at the Apogee core logging facility on the Pulacayo property by Mercator and Apogee field staff carried out sample cutting and bagging activities under Mercator supervision. After standard crushing and pulverization, Ag, Pb, Zn and Cu levels were determined using the same preparation and analytical methods that were used in the previous Mercator program described above. Mercator core check sample results are compared to original Apogee results in Figure 11.45, Figure 11.46 and Figure 11.47 for Ag, Pb and Zn respectively. Results are interpreted as showing that acceptable correlation exists between the original oxide zone analyses and the check sample data set. Results confirm the anomalous character of mineralization within the sections sampled but also show that lower correlation between sample pairas exists at higher grade levels. This may be related to heterogeneity of oxide and sulphide mineral assemblage distribution at the core sample scale rather than analytical error or sample contamination. Visual core inspection during the April 2012 site visit showed that higher Zn and Pb grades within the oxide zone often correspond with irregular zones in which remnants of sulphide zone mineralogy are preserved.
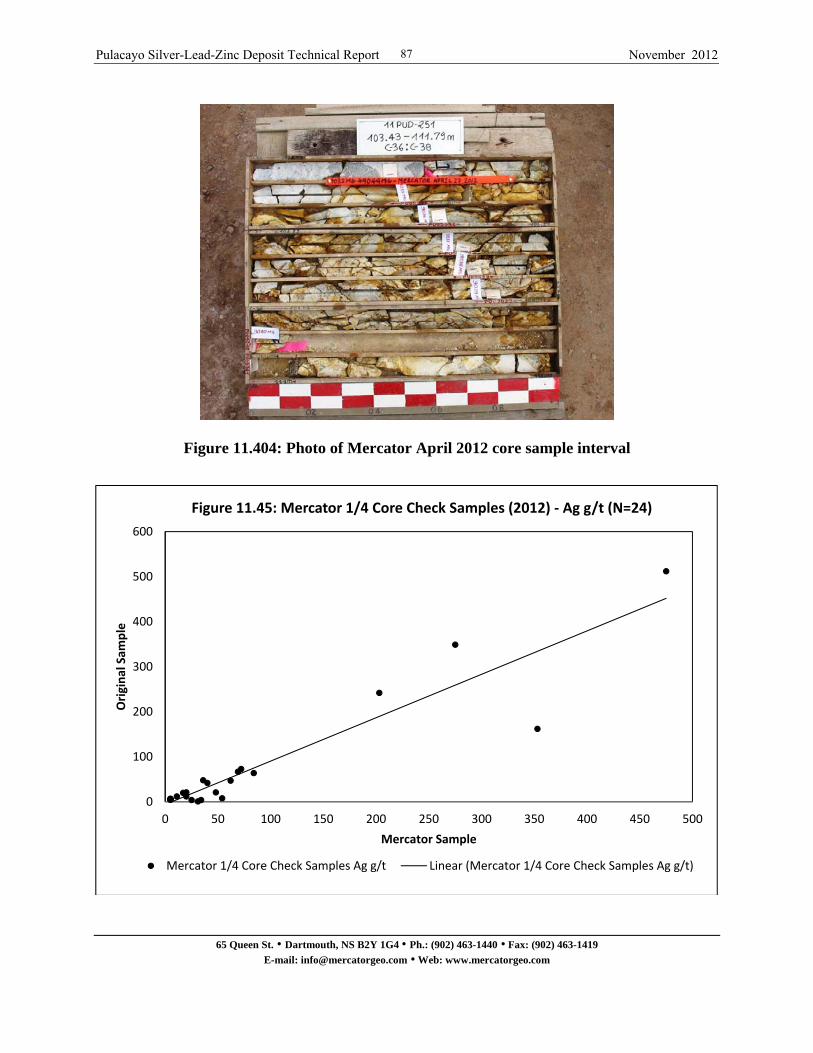
Pulacayo Silver-Lead-Zinc Deposit Technical Report November 2012
65 Queen St. • Dartmouth, NS B2Y 1G4 • Ph.: (902) 463-1440 • Fax: (902) 463-1419
E-mail: [email protected] • Web: www.mercatorgeo.com
87
Figure 11.404: Photo of Mercator April 2012 core sample interval Figure 11.415: Mercator 1/4 Core Check Samples 2012 - Ag g/t (N=24)
Figure 11.426: Mercator 1/4 Core Check Samples 2012 - Pb % (N=24)
0
100
200
300
400
500
600
0 50 100 150 200 250 300 350 400 450 500
Original Sam
ple
Mercator Sample
Figure 11.45: Mercator 1/4 Core Check Samples (2012) ‐ Ag g/t (N=24)
Mercator 1/4 Core Check Samples Ag g/t Linear (Mercator 1/4 Core Check Samples Ag g/t)

Pulacayo Silver-Lead-Zinc Deposit Technical Report November 2012
65 Queen St. • Dartmouth, NS B2Y 1G4 • Ph.: (902) 463-1440 • Fax: (902) 463-1419
E-mail: [email protected] • Web: www.mercatorgeo.com
88
Figure 11.437: Mercator 1/4 Core Check Samples 2012 - Zn % (N=24)
0
1
2
3
4
5
6
7
8
0 1 2 3 4 5 6 7 8
Original Sam
ple
Mercator Sample
Figure 11.46: Mercator 1/4 Core Check Samples (2012) ‐ Pb % (N=24)
Mercator 1/4 Core Check Samples Pb % Linear (Mercator 1/4 Core Check Samples Pb %)
0
0.5
1
1.5
2
2.5
3
3.5
4
0 0.5 1 1.5 2 2.5 3
Original Sam
ple
Mercator Sample
Figure 11.47: Mercator 1/4 Core Check Samples (2012) ‐ Zn % (N=24)
Mercator 1/4 Core Check Samples Zn %

Pulacayo Silver-Lead-Zinc Deposit Technical Report November 2012
65 Queen St. • Dartmouth, NS B2Y 1G4 • Ph.: (902) 463-1440 • Fax: (902) 463-1419
E-mail: [email protected] • Web: www.mercatorgeo.com
89
Collar coordinates for 14 drill holes completed during the 2011 oxide zone drilling program were checked by Mercator during the April 2012 site visit. A Garmin Map 60 handheld GPS unit was used to collect collar coordinate check values and these were then compared to validated resource database collar file values. Excellent correlation exists between the two data sets with respect to UTM easting and Northing values, with the total range in Easting variation being -2.1m to +2.9 m and the total range for Northing being -4.5 m to +1.8 m. Values in the site visit elevation data set range between +7.9 m and +14.5 m above corresponding database collar values. This variation is systematic and project database values acquired using differential GPS equipment are considered to be more accurate than hand held GPS values obtained during the site visit. Tabulated results of the drill collar checking program are presented in Table 11.2 and Mercator is of the opinion these results adequately confirm database collar locations. Table 11.2: Collar Coordinate Check Program Results
Drill Hole ID
GPS East (m)
GPS North
(m)
GPS Elev. (m)
Database East (m)
Database North
(m)
Database Elev. (m)
East Change
(m)
North Change
(m)
Elev. Change
(m)
11PUD232 740001.5 7744735.7 4416.9 740000.6 7744734.7 4402.4 1.0 1.0 14.5
11PUD231 739999.0 7744589.3 4414.7 739999.7 7744587.5 4403.3 -0.7 1.8 11.4
11PUD239 740047.9 7744595.6 4409.7 740048.6 7744596.8 4394.0 -0.8 -1.2 15.7
PUD224 740098.6 7744858.2 4383.5 740100.0 7744862.1 4376.0 -1.4 -3.9 7.5
11PUD241 740197.2 7744580.3 4344.5 740199.3 7744583.1 4333.0 -2.1 -2.8 11.5
PUD217 740248.2 7744349.9 4345.3 740250.0 7744350.0 4335.4 -1.8 -0.1 9.9
PUD045 740094.7 7744434.1 4313.5 740094.3 7744435.7 4305.6 0.4 -1.6 7.9
11PUD226 740190.7 7744472.6 4331.8 740189.3 7744472.2 4318.9 1.5 0.4 12.9
11PUD249 740647.5 7744387.0 4294.3 740644.6 7744388.6 4282.8 2.9 -1.6 11.5
11PUD247 740701.4 7744397.1 4294.8 740699.6 7744396.9 4283.1 1.8 0.2 11.7
11PUD250 740794.4 7744452.0 4298.4 740794.8 7744452.8 4285.6 -0.4 -0.7 12.8
11PUD257 740901.8 7744320.2 4260.9 740900.6 7744321.7 4248.1 1.2 -1.5 12.8
11PUD260 740951.2 7744301.3 4250.1 740951.8 7744302.0 4239.0 -0.6 -0.7 11.1
11PUD261 740949.8 7744257.9 4245.5 740949.1 7744262.4 4234.5 0.8 -4.5 11.0

Pulacayo Silver-Lead-Zinc Deposit Technical Report November 2012
65 Queen St. • Dartmouth, NS B2Y 1G4 • Ph.: (902) 463-1440 • Fax: (902) 463-1419
E-mail: [email protected] • Web: www.mercatorgeo.com
90
12 Mineral Processing and Metallurgical Testing
12.1 Pre-2012 Programs No mineral processing or metallurgical tests were completed as part of this report. However, Micon did report on complete metallurgical testing as part of their 2010 PA, in which Pressacco et al. (2010) stated: “Preliminary metallurgical test work has been carried out which suggests that, based on conventional flowsheet, an average mill feed grade of 199 g/t Ag, 1.21% Pb and 2.13% Zn will yield a lead concentrate assaying 47% Pb and containing 70.3% of the silver , 87.4% of the lead and 3.9% of the zinc. The zinc concentrate will assay 58.3% Zn and recover 13.6% of the silver, 2.2% of the lead and 85.2% of the zinc.” As noted earlier in this report, Apogee no longer considers the Micon PA to be current and has initiated project feasibility programs under direction of TWP Sudamerica S.A.
12.2 Programs During 2012
12.2.1 Introduction Apogee processed two bulk samples during the second half of 2012 at separate toll milling operations in the region. The first was carried out at a facility operated by Tatasi Cooperative in nearby Tatasi and consisted of 268 tonnes taken from a 600 tonne shipment of mineralized material. Processing was carried out in three runs. The tests at the Tatasi plant did not produce satisfactory results for a variety of reasons, including issues relating to acidic water being used in the plant and issues relating to effectively controlling mixing reagents in the proper quantities. The second test consisted of 128 tonnes of mineralized material and was carried out at facilities operated by the Federación de Cooperativas Mineras de Potosí, (FEDECOMIN), located approximately 180 road kilometers from the Pulacayo site. Mineralized material for both tests came from a trial mining program carried out earlier in the year by Apogee on two veins accessed at the 4275 m level of the mine. This program produced approximately 7000 tonnes of mineralized material that was stockpiled at the Pulacayo site. Both veins targeted for trial mining occur within limits of the current mineral resource estimate. Apogee holds the necessary environmental permits issued by the Bolivian authorities to conduct mining and processing operations of up to 200 tonnes per day, which includes the transport of mineralized material to an established concentrator outside the project area.

Pulacayo Silver-Lead-Zinc Deposit Technical Report November 2012
65 Queen St. • Dartmouth, NS B2Y 1G4 • Ph.: (902) 463-1440 • Fax: (902) 463-1419
E-mail: [email protected] • Web: www.mercatorgeo.com
91
Apogee is currently in negotiations with FEDOCOMIN to process an additional 4,000 tonnes of the stockpiled mineralization from the Pulacayo stockpiles later in 2012. In addition to this, a series of controlled laboratory bench and pilot scale tests in support of the ongoing feasibility study (See Apogee Press Release dated May 29, 2012) are underway at Maelgwyn Minerals Services Africa (Pty) Ltd. in South Africa in order to replicate the process flow and optimizing reagent recipes utilized during the FEDECOMIN bulk test (Apogee Press Release dated September 13, 2012).
12.2.2 Bulk Sample Testing Program The following discussion of bulk sample processing test results is taken directly from the September 13, 2012 Apogee Press Release cited above. “The FEDECOMIN flotation mill uses a conventional grinding and differential flotation process. It consists of two identical crushing, milling and differential flotation modules with jaw crushers feeding directly into the mill feed bins and the milled pulp directed to a cyclone with the overflow first reporting to the lead flotation circuit to produce lead concentrate and then to the zinc flotation circuit to produce zinc concentrate. The processing was completed under the supervision of John Grewar, MSAIMM, the Company's consulting Metallurgical Engineer. The calculated metallurgical balance resulting from the processing is summarized in the table below: Table 12.1: FEDOCOMIN Bulk Metallurgical Test - Concentrate Grades and Recovery
Product Mass Yield (dmt)
% Pb
% Zn
Ag g/t
Metal Content % Recovery
Pb (tonnes)
Zn (tonnes)
Ag (grams)
Pb Zn Ag
Mill Feed
123.84
1.88
2.09 168.00 2.33 2.59
20,805
100
100
100
Lead Concentrate
2.35
68.86
5.62
5,801.20 1.62 0.13
13,612
69.40
5.09
64.27
Zinc Concentrate
3.59
8.03
53.37
1,288.30 0.29 1.91
4,620
12.37
73.95
21.81
Tailings
117.91
0.36
0.46 25.00 0.42 0.54
2,948
18.23
20.96
13.92
Calculated Grade
123.85
1.88
2.09
171.03 2.33 2.58
21,180
100
100
100
% Variance 0 0 -1.80% Total Recovery 81.77 79.04 86.08

Pulacayo Silver-Lead-Zinc Deposit Technical Report November 2012
65 Queen St. • Dartmouth, NS B2Y 1G4 • Ph.: (902) 463-1440 • Fax: (902) 463-1419
E-mail: [email protected] • Web: www.mercatorgeo.com
92
A suite analyses for potential deleterious elements in the concentrate products was undertaken including iron, sulphur, silica oxide, cadmium, manganese, bismuth, arsenic, tin and copper, all of which returned values that are within acceptable limits for most smelting and refining companies. The reagent suite and floatation regime used is not yet fully optimised, and further work is planned where it is hoped lead, zinc and silver recoveries can be further improved. In July 2012, Apogee transported over 600 tonnes of mineralized material to the Tatasi concentrator from the medium and high grade stockpiles at Pulacayo for test work and toll milling (Apogee Press Release dated July 16th 2012). This concentrator is also situated in the Department of Potosi and has the capacity to process up to 200 tonnes per day.
In late July 2012, the Company processed a 48 tonne, medium grade bulk sample under the supervision of John Grewar, MSAIMM, Apogee's consulting metallurgist with mixed results.
Two additional bulk sample tests were completed at the Tatasi plant during late August 2012 and early September 2012. The tests at the Tatasi plant to date were delayed and did not produce satisfactory results for a variety of reasons, including issues relating to acidic water being used in the plant and issues relating to effectively controlling mixing reagents in the proper quantities. Apogee is continuing to work with the Tatasi plant operators to modify the process based upon the parameters from the very successful FEDECOMIN bulk test. The Company expects to process additional material from the Pulacayo stockpiles in the fourth quarter of 2012.”
Mercator has relied upon Apogee’s public disclosure with respect to results of bulk sampling and metallurgical testing programs described above, and Mr. Chris Collins, P. Geo., President of Apogee, confirmed on November 1, 2012 that report content quoted above accurately describes results received by the company to date.”

Pulacayo Silver-Lead-Zinc Deposit Technical Report November 2012
65 Queen St. • Dartmouth, NS B2Y 1G4 • Ph.: (902) 463-1440 • Fax: (902) 463-1419
E-mail: [email protected] • Web: www.mercatorgeo.com
93
13 Mineral Resource Estimate
13.1 General The definition of mineral resource and associated mineral resource categories used in this report are those recognized under National Instrument 43-101 and set out in the Canadian Institute of Mining, Metallurgy and Petroleum Standards on Mineral Resources and Reserves Definitions and Guidelines (the CIMM Standards). Assumptions, metal threshold parameters and deposit modeling methodologies associated with the current Pulacayo resource estimate are discussed
13.2 Geological Interpretation Used In Resource Estimation The Pulacayo deposit is considered a low sulphidation epithermal deposit hosting both precious and base metals, of which silver, lead and zinc are of economic significance. Mineralization included in the current resource is associated with the TVS that was emplaced on the southern side of the Pulacayo dome complex that contains Silurian sediments of the Quenhua Formation and Miocene intrusive andesitic volcanic rocks of the Rotchild and Megacristal units. The dome complex is tens of kilometers in length and commonly hosts polymetallic sulphide mineralization within east-west trending fault systems. The TVS is the most prominent mineralized structure on the property and portions of the trend have been mined for several hundred years. The structure strikes east-west and has near vertical dip in most areas. TVS mineralization is hosted by both volcanic and sedimentary host rocks, with stockworks of narrow veins and veinlets plus disseminations that aggregate up to 120 m in width being typical of volcanic hosted sections. Sections hosted by sedimentary rocks show much narrower high grade vein structures that typically measure a few meters or less in width. These generally bifurcate transitionally upward into the stockwork style systems and zones of dissemination seen in the overlying volcanic rocks. Mineralization is known to extend along the TVS strike for 2,700 m and to a depth of almost 1,000 m below surface. The latter reflects the depth of historic mining, of which approximately 450 m occur within overlying volcanic host rocks and 550 m occur within the sedimentary sequence. The portion of the TVS defined by Apogee drilling and considered in this resource estimate extends along strike for approximately 1500 m and to an average depth of 450 m below surface. As a result, most of the resource area is hosted by andesitic volcanic lithologies. Contributing minerals of economic significance include galena, sphalerite, tetrahedrite and other silver sulfosalts, along with minor occurrences of chalcopyrite and jamesonite. These minerals are accompanied by barite, quartz, pyrite, and calcite. Local occurrences of Au have also been
Pulacayo Silver-Lead-Zinc Deposit Technical Report November 2012
65 Queen St. • Dartmouth, NS B2Y 1G4 • Ph.: (902) 463-1440 • Fax: (902) 463-1419
E-mail: [email protected] • Web: www.mercatorgeo.com
94
noted but not extensively assessed to date. Veins generally have a banded texture, with segments containing semi-massive to massive sulphides. The TVS shows vertical metal zonation with increasing base metal concentrations with depth and higher Ag content at middle elevations (350 m to 450 m depth).
13.3 Methodology of Resource Estimation
13.3.1 Overview of Estimation Procedure This updated Pulacayo deposit mineral resource estimate is based on a three dimensional block model developed using Gemcom Surpac ® Version 6.3.1 modeling software. The estimate is based on validated results of 69,739 meters of diamond drilling from 226 surface drill holes and 42 underground drill holes completed by Apogee and ASC through various drill programs between 2002 and the end of 2011. The final drill hole completed and included in the resource is 11PUD266. A total of 28,807 drill core samples have been assayed from these programs with 24,367 samples occurring within the limits of the current resource model. In addition, 627 trench samples completed in 2011 were included in the resource estimate. Prior to deposit modeling, a complete set of vertical cross sections through the deposit were produced from the project database and used to develop north-south geological section interpretations at a nominal section spacing of 50 m. Raw analytical results were represented on the interpreted sections to understand TVS geometry and grade distribution trends, along with corresponding calculated Net Smelter Return (NSR) values determined using a calculator developed for Apogee by Starkey & Associates Inc., Consulting Metallurgical Engineers. The NSR calculator is discussed in more detail in report section 13.3.3 below. To better represent the individual grade trends and distribution of silver, lead and zinc, each metal was modeled independently for the current resource estimate. On this basis, 9 domain solid models defining zones of veining and higher grade mineralization were created for silver, lead and zinc from the sectional interpretation of drill core assays and geological data. The resulting 27 metal domain solid models range from a few meters to tens of meters in thickness and have varying continuity over a 1500 meter strike length oriented at Az. 280°, and a 600 meter sub-vertical total dip extent. This reflects the orientation and geometry of the principal mineralized TVS structure plus associated secondary structures. A peripheral constraining wireframe was developed to include all the metal domains and digital terrain models were created for both the oxide-sulphide zone boundary and the topographic surface.
Pulacayo Silver-Lead-Zinc Deposit Technical Report November 2012
65 Queen St. • Dartmouth, NS B2Y 1G4 • Ph.: (902) 463-1440 • Fax: (902) 463-1419
E-mail: [email protected] • Web: www.mercatorgeo.com
95
Inverse distance squared (ID2) grade interpolation was first constrained within the interpreted metal domain wireframes for silver, lead and zinc using multiple independent search ellipsoid passes and independent 1 meter down hole assay composites. Search ellipsoid orientations for the interpolation passes conformed to the general trend of Az. 280° with a 30° major axis plunge and sub-vertical dip, but were modified to accommodate local variations in the distribution of mineralization. Contributing 1 meter assay composites were capped at 1500 g/t silver, 15 % lead, and 15 % zinc. ID2 grade interpolations for each metal were subsequently carried out and constrained within the peripheral wireframe envelop, outside the interpreted metal domain wireframes. A 150 meter ellipsoid major axis, 75 meter ellipsoid semi-major axis and 25 meter ellipsoid minor axis were applied for all interpolation passes with the exception of a restricted range pass using 30 meter major and semi-major axes and a 5 meter minor axis for all values greater than 50 g/t silver, 5 % lead, or 5 % zinc within the peripheral domain and external to the main metal wireframes. Contributing 1 meter down-hole composites were constrained to a minimum of 2 and a maximum of 9 with no more than 3 from a single drill hole. The oxide-sulphide zone digital terrain model functioned as a hard boundary in all interpolation passes. A specific gravity model was interpolated by ID2 methodology from 18,236 sulphide zone and 3,131 oxide zone specific gravity values normalized to 1.0 meter down hole composites. Interpolation procedures were the same as those used for metal grade assignment and the highest interpolated specific gravity value calculated for each block was selected as the valid block value. The Pulacayo deposit has an extensive history of mining activity represented by shafts, winzes, level development, and stoping. Digital modeling of stopes and underground development by EPCM Consultores S.R.L (EPCM) for Apogee was upgraded and validated by TWP by digitally adding historic underground mining and stoping from archived mine engineering plans. The revised digital model of underground development and stopes shows good visual correlation with the drill hole database. Indicated Resources are all interpolated blocks with at least 7 contributing assay composites with a maximum average distance of 70 meters from the block centroid, and having h the nearest contributing composite at 60 meters or less. Inferred Resources are all other interpolated blocks within the peripheral constraint or blocks that otherwise meet Indicated Resources parameter but are interpolated through drill hole intersections that lack sampling. Net Smelter Return (NSR) values for the blocks occurring within the sulphide zone were determined by means of a net smelter return calculator developed for the deposit by John Starkey, P. Eng., of Starkey & Associates Inc., Consulting Metallurgical Engineers of Oakville Ontario. The modeling used a 36 month trailing average silver price of $25.00 USD/oz. The base
Pulacayo Silver-Lead-Zinc Deposit Technical Report November 2012
65 Queen St. • Dartmouth, NS B2Y 1G4 • Ph.: (902) 463-1440 • Fax: (902) 463-1419
E-mail: [email protected] • Web: www.mercatorgeo.com
96
metal prices used in the modeling were $0.89 USD/lb lead and $1.00 USD/lb zinc. The base metal prices were supplied by Exen Consulting Ltd. of Oakville, Ontario and are based upon the average long-term analyst lead and zinc price projections from a number of metal broker and mining investment banking sources. Exen Consulting Ltd. is a commercial concentrate marketing business providing consulting services to producers, metal traders and smelters around the world. Open pit resources to an elevation of 4159m ASL (top of crown pillar) were determined within a Whittle optimized maximum NPV pit shell utilizing $1.80 USD/tonne mining cost, $1.60 USD/tonne surface haulage cost, $2.50 USD /tonne G&A, and $19.0 USD/tonne and $9.10 USD/tonne respectively for oxide and sulphide processing costs. Pit slopes varied from 42 to 43 degrees. In the pit optimization process, only silver derived NSR values were used in the oxide zone, while silver, lead and zinc derived NSR values were used in the sulphide zone. P&E Mining Consultants Inc. of Brampton, Ontario completed the Whittle open pit optimization program and provided statements of associated oxide and sulphide zone mineral resources. Resource block model results were validated through comparison with separate deposit models based on grade interpolation using Ordinary Kriging (OK) and Nearest Neighbour (NN) methodologies. Statistical results of the ID2 interpolation were determined as most appropriately representing contributing assay populations and associated sectional deposit interpretations.
13.3.2 Data Validation Results from 268 surface and underground drill holes completed by Apogee and ASC between 2002 and 2011, totaling 69,739 meters of diamond drilling and 28,807 core samples, were received by Mercator in digital spreadsheet format from Apogee and were subsequently complied and imported into Gemcom Surpac ® Version 6.3.1 software. The final drill hole accepted for the current resource estimate from the 2011 drill programs by Apogee was 11PUD266. Validation checks on overlapping intervals, inconsistent drill hole identifiers, improper lithological assignment, unreasonable assay value assignment, and missing interval data were performed. Checking of database analytical entries was also carried out against laboratory records supplied by Apogee. Of the 28,807 assay results in the drilling data set for the property 24,366 occur within the current resource outline and associated peripheral interpolation domain.
Pulacayo Silver-Lead-Zinc Deposit Technical Report November 2012
65 Queen St. • Dartmouth, NS B2Y 1G4 • Ph.: (902) 463-1440 • Fax: (902) 463-1419
E-mail: [email protected] • Web: www.mercatorgeo.com
97
13.3.3 Metal Pricing and Net Smelter Return (NSR) Calculation The previous resource estimate by Mercator completed in October, 2011 used a NSR factor and NSR shell wireframe to evaluate the polymetallic nature of mineralization at Pulacayo. This was consistent with methods used in preceding historical resources estimates for the deposit prepared by Micon. For the purpose of the current resource, silver, lead and zinc grades were interpreted and modeled independently to better assess individual grade distribution and continuity and to improve overall spatial confidence in grade interpolation. A NSR factor was subsequently calculated from interpolated block grades within the sulphide zone for reporting purposes. NSR incorporates consideration of metallurgical, milling, and mining inputs. More specifically, NSR is the calculated potential revenue which is returned from the smelter for the sale of concentrate products. The NSR method recognizes that more than 1 metal, in this circumstance Ag, Pb and Zn, can contribute to a potential revenue stream. It derives a potential revenue value that accounts for such items as recovery to concentrate, metal prices, payable fractions of the metals treatment, and refining charges, penalties, freight and handling. By this means, in situ metal grades can be converted to potential revenues and a cut-off grade can be identified as the estimated cost of all activities related to mining, mineral processing and general administration. John Starkey, P. Eng., of Starkey & Associates Inc., Consulting Metallurgical Engineers, was retained by Apogee to develop a digital spreadsheet-based NSR calculator for the current Pulacayo resource estimate. This calculator was reviewed by Mercator and accepted for use in the resource estimation program. The following description of the NSR calculator is a direct excerpt from the Starkey (2010) report to Apogee. “The NSR calculation method used for Apogee Minerals’ Pulacayo Project was done using basic principles and standard concepts taken from typical smelter contracts in the silver lead zinc industry, to calculate the value of one tonne of lead or zinc concentrate, shipped to either a lead or a zinc smelter respectively. To do this in a meaningful way, a metallurgical balance, based on the grade of ore in the mine and metallurgical research to determine mill recoveries, was first done in order to calculate the ratios of concentration for the lead and zinc concentrates respectively. In this way, the value for each concentrate could be related to a value per tonne of ore, based on the grade of the ore being evaluated and the current price of the metals deemed to be appropriate for this evaluation. Standard deductions were made from the metal content in each concentrate to represent what payment a smelter would calculate in a concentrate purchase transaction. Penalties for deleterious elements were not deducted because it was not possible to predict the exact amount
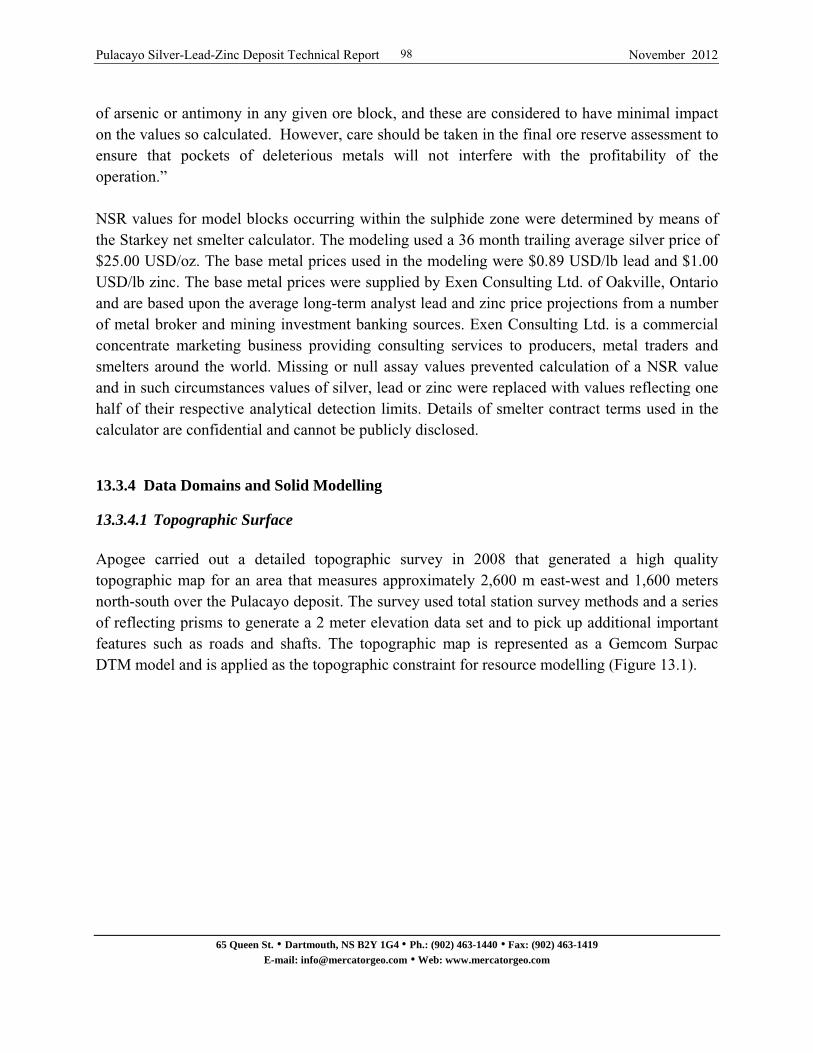
Pulacayo Silver-Lead-Zinc Deposit Technical Report November 2012
65 Queen St. • Dartmouth, NS B2Y 1G4 • Ph.: (902) 463-1440 • Fax: (902) 463-1419
E-mail: [email protected] • Web: www.mercatorgeo.com
98
of arsenic or antimony in any given ore block, and these are considered to have minimal impact on the values so calculated. However, care should be taken in the final ore reserve assessment to ensure that pockets of deleterious metals will not interfere with the profitability of the operation.” NSR values for model blocks occurring within the sulphide zone were determined by means of the Starkey net smelter calculator. The modeling used a 36 month trailing average silver price of $25.00 USD/oz. The base metal prices used in the modeling were $0.89 USD/lb lead and $1.00 USD/lb zinc. The base metal prices were supplied by Exen Consulting Ltd. of Oakville, Ontario and are based upon the average long-term analyst lead and zinc price projections from a number of metal broker and mining investment banking sources. Exen Consulting Ltd. is a commercial concentrate marketing business providing consulting services to producers, metal traders and smelters around the world. Missing or null assay values prevented calculation of a NSR value and in such circumstances values of silver, lead or zinc were replaced with values reflecting one half of their respective analytical detection limits. Details of smelter contract terms used in the calculator are confidential and cannot be publicly disclosed.
13.3.4 Data Domains and Solid Modelling
13.3.4.1 Topographic Surface Apogee carried out a detailed topographic survey in 2008 that generated a high quality topographic map for an area that measures approximately 2,600 m east-west and 1,600 meters north-south over the Pulacayo deposit. The survey used total station survey methods and a series of reflecting prisms to generate a 2 meter elevation data set and to pick up additional important features such as roads and shafts. The topographic map is represented as a Gemcom Surpac DTM model and is applied as the topographic constraint for resource modelling (Figure 13.1).
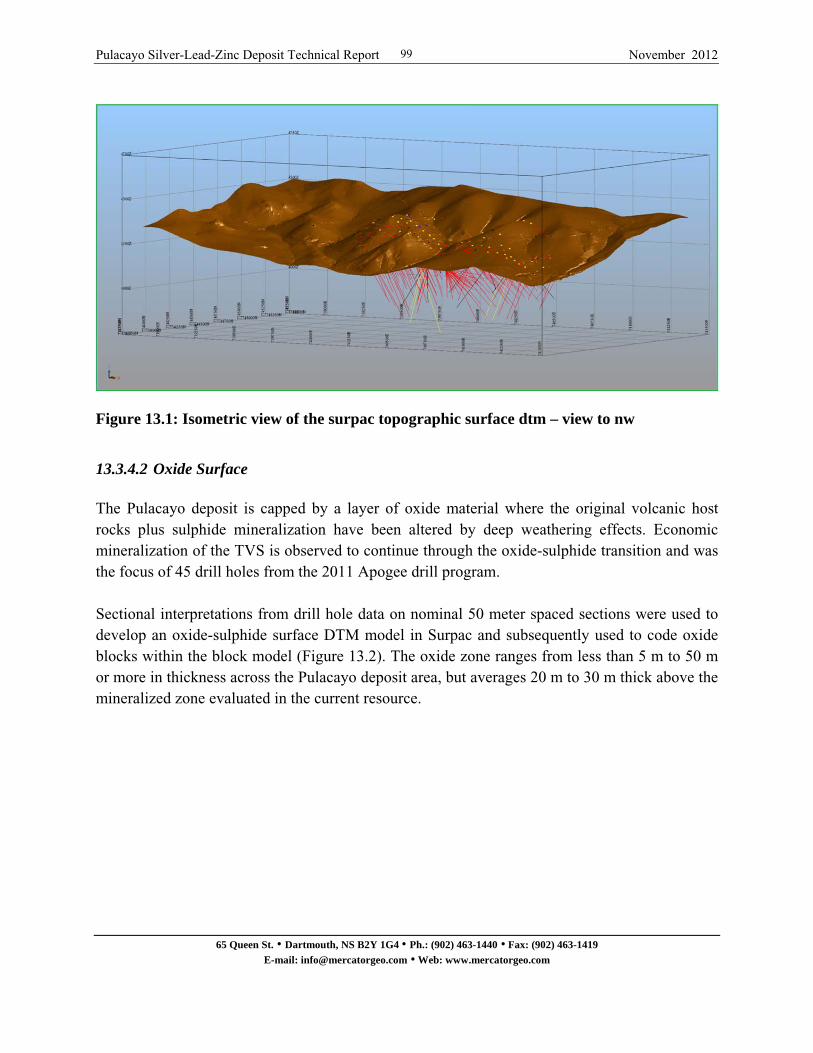
Pulacayo Silver-Lead-Zinc Deposit Technical Report November 2012
65 Queen St. • Dartmouth, NS B2Y 1G4 • Ph.: (902) 463-1440 • Fax: (902) 463-1419
E-mail: [email protected] • Web: www.mercatorgeo.com
99
Figure 13.1: Isometric view of the surpac topographic surface dtm – view to nw
13.3.4.2 Oxide Surface The Pulacayo deposit is capped by a layer of oxide material where the original volcanic host rocks plus sulphide mineralization have been altered by deep weathering effects. Economic mineralization of the TVS is observed to continue through the oxide-sulphide transition and was the focus of 45 drill holes from the 2011 Apogee drill program. Sectional interpretations from drill hole data on nominal 50 meter spaced sections were used to develop an oxide-sulphide surface DTM model in Surpac and subsequently used to code oxide blocks within the block model (Figure 13.2). The oxide zone ranges from less than 5 m to 50 m or more in thickness across the Pulacayo deposit area, but averages 20 m to 30 m thick above the mineralized zone evaluated in the current resource.

Pulacayo Silver-Lead-Zinc Deposit Technical Report November 2012
65 Queen St. • Dartmouth, NS B2Y 1G4 • Ph.: (902) 463-1440 • Fax: (902) 463-1419
E-mail: [email protected] • Web: www.mercatorgeo.com
100
Figure 13.2: Isometric view of the oxide-sulphide transition surface dtm – view to nw Sectional interpretation showed that although silver and lead grade continues across the oxide-sulphide boundary, the metals show depletion in the oxide zone. Zinc assay core results are low to anomalous within the oxide zone and are interpreted to be almost completely depleted. On this basis, the oxide-sulphide surface DTM model was used as a hard boundary in grade interpolation, with assay composites unable to contribute to the interpolation of blocks on opposite sides of the surface.
13.3.4.3 Domain Modeling The spatial distribution of volcanic host rocks and sulphide-silver mineralization contributes directly to variability in grade distribution within the Pulacayo deposit as defined by Apogee drilling. Stringer and disseminated style mineralization with locally massive to semi-massive zones are typical of the TVS within the intruding andesitic volcanics. Despite observed deposit scale zonation of all three metals throughout the history of mining, with higher grade silver occurring at middle elevations and increasing base metal values with depth, the TVS can locally be defined by any one metal or various combinations of the three. The previous resource estimate by Mercator used an NSR-based spatial domain model to define that portion of the TVS having the greatest economic potential. Although this method accommodates spatial grade variability within the deposit and adequately constrains interpolation, a smearing effect of each metal can potentially occur by diluting higher-grade vein based mineralization into lower-grade adjacent tonnes from the lack of hard individual grade boundaries for high grade structures. Detailed sectional geological modelling subsequent to the
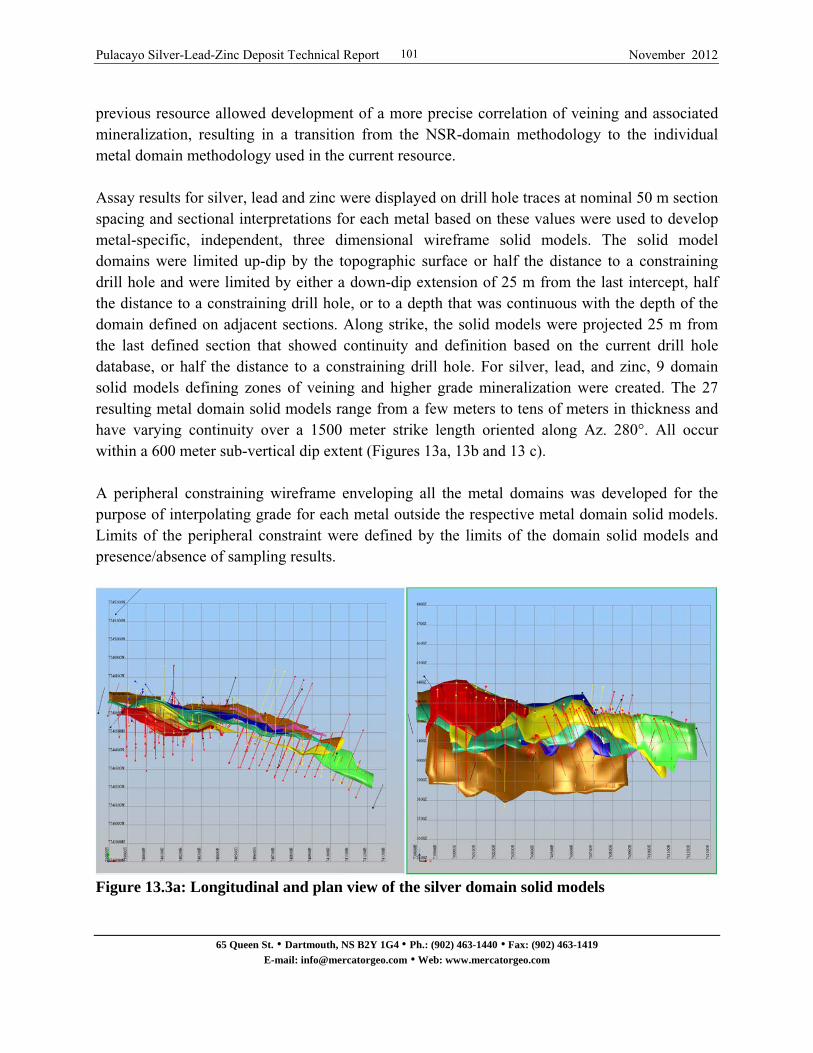
Pulacayo Silver-Lead-Zinc Deposit Technical Report November 2012
65 Queen St. • Dartmouth, NS B2Y 1G4 • Ph.: (902) 463-1440 • Fax: (902) 463-1419
E-mail: [email protected] • Web: www.mercatorgeo.com
101
previous resource allowed development of a more precise correlation of veining and associated mineralization, resulting in a transition from the NSR-domain methodology to the individual metal domain methodology used in the current resource. Assay results for silver, lead and zinc were displayed on drill hole traces at nominal 50 m section spacing and sectional interpretations for each metal based on these values were used to develop metal-specific, independent, three dimensional wireframe solid models. The solid model domains were limited up-dip by the topographic surface or half the distance to a constraining drill hole and were limited by either a down-dip extension of 25 m from the last intercept, half the distance to a constraining drill hole, or to a depth that was continuous with the depth of the domain defined on adjacent sections. Along strike, the solid models were projected 25 m from the last defined section that showed continuity and definition based on the current drill hole database, or half the distance to a constraining drill hole. For silver, lead, and zinc, 9 domain solid models defining zones of veining and higher grade mineralization were created. The 27 resulting metal domain solid models range from a few meters to tens of meters in thickness and have varying continuity over a 1500 meter strike length oriented along Az. 280°. All occur within a 600 meter sub-vertical dip extent (Figures 13a, 13b and 13 c). A peripheral constraining wireframe enveloping all the metal domains was developed for the purpose of interpolating grade for each metal outside the respective metal domain solid models. Limits of the peripheral constraint were defined by the limits of the domain solid models and presence/absence of sampling results.
Figure 13.3a: Longitudinal and plan view of the silver domain solid models
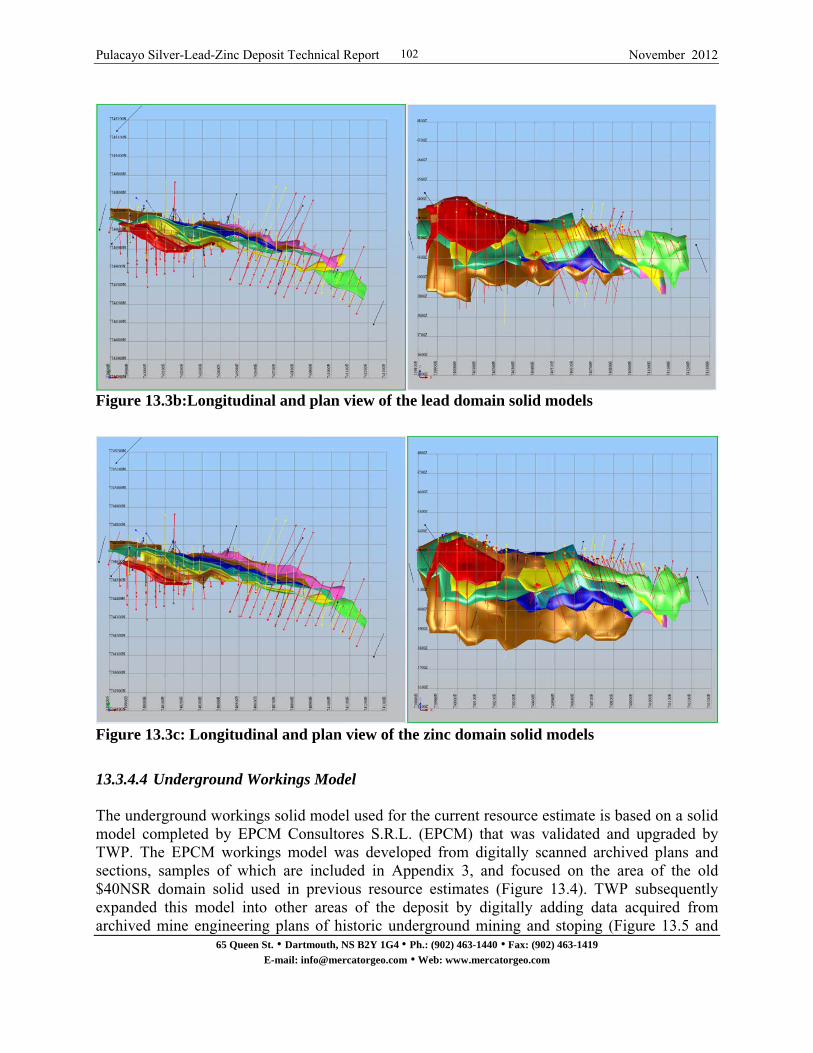
Pulacayo Silver-Lead-Zinc Deposit Technical Report November 2012
65 Queen St. • Dartmouth, NS B2Y 1G4 • Ph.: (902) 463-1440 • Fax: (902) 463-1419
E-mail: [email protected] • Web: www.mercatorgeo.com
102
Figure 13.3b:Longitudinal and plan view of the lead domain solid models
Figure 13.3c: Longitudinal and plan view of the zinc domain solid models
13.3.4.4 Underground Workings Model The underground workings solid model used for the current resource estimate is based on a solid model completed by EPCM Consultores S.R.L. (EPCM) that was validated and upgraded by TWP. The EPCM workings model was developed from digitally scanned archived plans and sections, samples of which are included in Appendix 3, and focused on the area of the old $40NSR domain solid used in previous resource estimates (Figure 13.4). TWP subsequently expanded this model into other areas of the deposit by digitally adding data acquired from archived mine engineering plans of historic underground mining and stoping (Figure 13.5 and

Pulacayo Silver-Lead-Zinc Deposit Technical Report November 2012
65 Queen St. • Dartmouth, NS B2Y 1G4 • Ph.: (902) 463-1440 • Fax: (902) 463-1419
E-mail: [email protected] • Web: www.mercatorgeo.com
103
Figure 13.6). Mercator validated the upgraded workings model against the drill hole database and found acceptable correlation between the two.
Figure 13.4:Isometric view of the previous Surpac $40nsr domain solid model – view to NW (This model is no longer current and is included for comparative purposes only)
Figure 13.5: Longitudinal view of the current workings solid model (View to N)
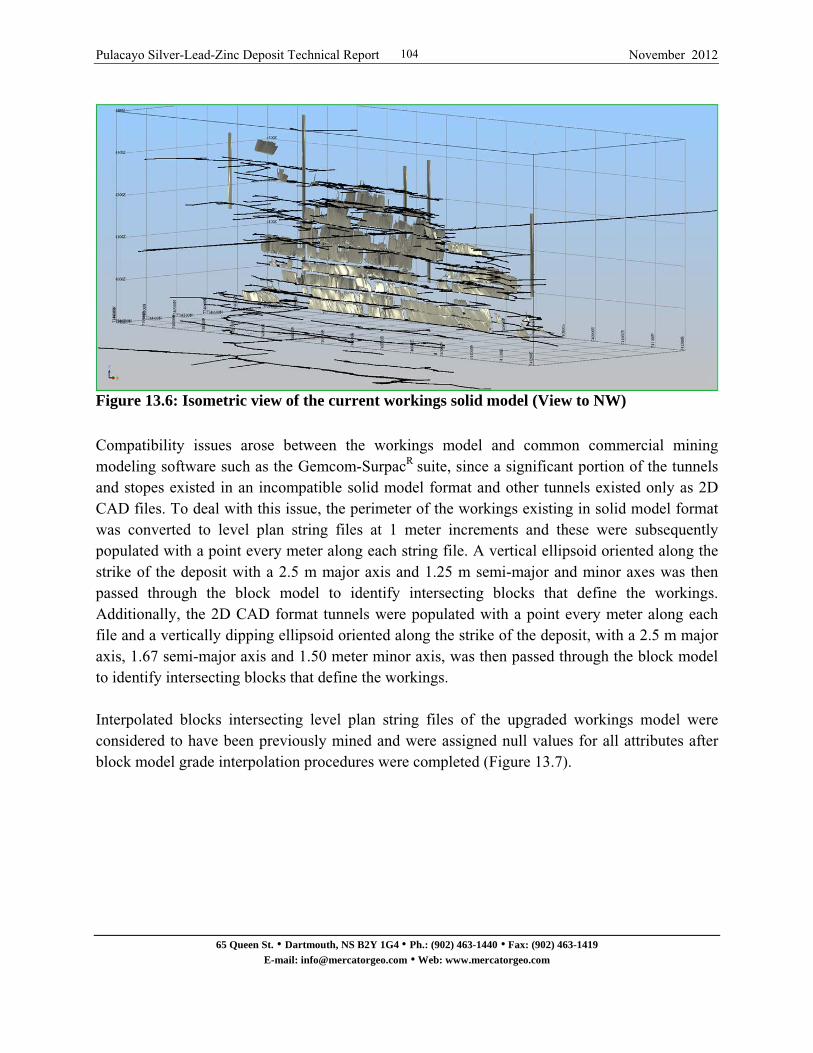
Pulacayo Silver-Lead-Zinc Deposit Technical Report November 2012
65 Queen St. • Dartmouth, NS B2Y 1G4 • Ph.: (902) 463-1440 • Fax: (902) 463-1419
E-mail: [email protected] • Web: www.mercatorgeo.com
104
Figure 13.6: Isometric view of the current workings solid model (View to NW)
Compatibility issues arose between the workings model and common commercial mining modeling software such as the Gemcom-SurpacR suite, since a significant portion of the tunnels and stopes existed in an incompatible solid model format and other tunnels existed only as 2D CAD files. To deal with this issue, the perimeter of the workings existing in solid model format was converted to level plan string files at 1 meter increments and these were subsequently populated with a point every meter along each string file. A vertical ellipsoid oriented along the strike of the deposit with a 2.5 m major axis and 1.25 m semi-major and minor axes was then passed through the block model to identify intersecting blocks that define the workings. Additionally, the 2D CAD format tunnels were populated with a point every meter along each file and a vertically dipping ellipsoid oriented along the strike of the deposit, with a 2.5 m major axis, 1.67 semi-major axis and 1.50 meter minor axis, was then passed through the block model to identify intersecting blocks that define the workings. Interpolated blocks intersecting level plan string files of the upgraded workings model were considered to have been previously mined and were assigned null values for all attributes after block model grade interpolation procedures were completed (Figure 13.7).
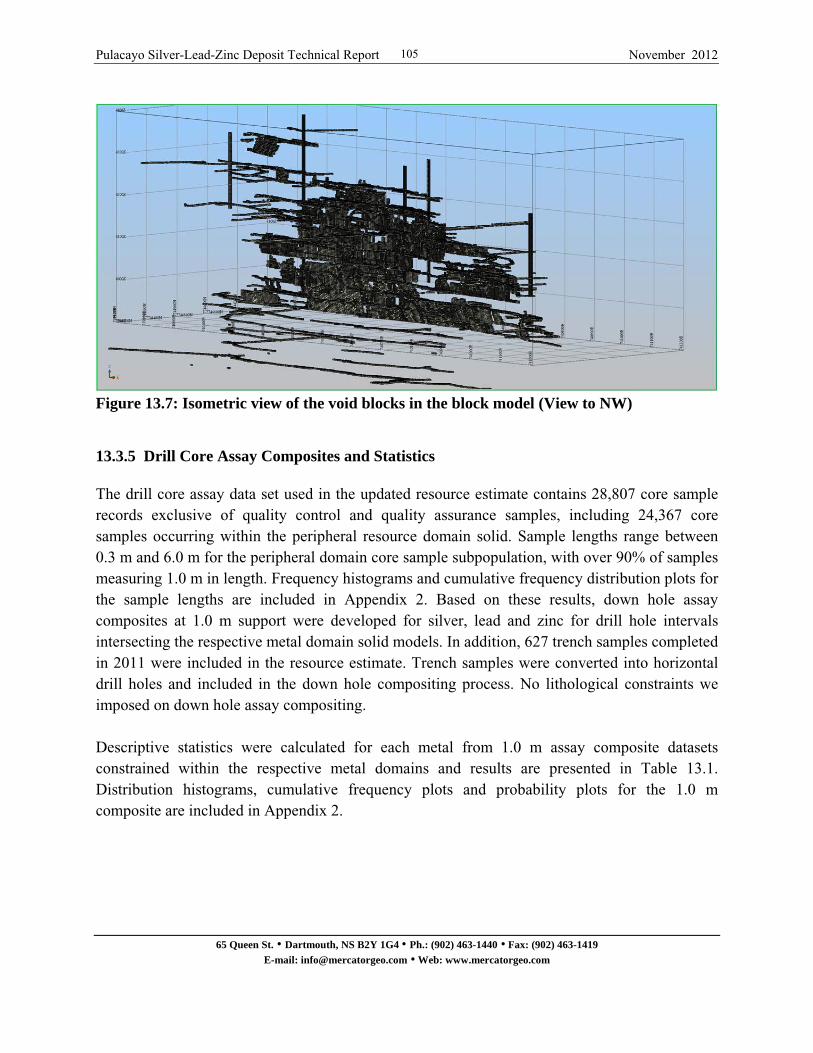
Pulacayo Silver-Lead-Zinc Deposit Technical Report November 2012
65 Queen St. • Dartmouth, NS B2Y 1G4 • Ph.: (902) 463-1440 • Fax: (902) 463-1419
E-mail: [email protected] • Web: www.mercatorgeo.com
105
Figure 13.7: Isometric view of the void blocks in the block model (View to NW)
13.3.5 Drill Core Assay Composites and Statistics The drill core assay data set used in the updated resource estimate contains 28,807 core sample records exclusive of quality control and quality assurance samples, including 24,367 core samples occurring within the peripheral resource domain solid. Sample lengths range between 0.3 m and 6.0 m for the peripheral domain core sample subpopulation, with over 90% of samples measuring 1.0 m in length. Frequency histograms and cumulative frequency distribution plots for the sample lengths are included in Appendix 2. Based on these results, down hole assay composites at 1.0 m support were developed for silver, lead and zinc for drill hole intervals intersecting the respective metal domain solid models. In addition, 627 trench samples completed in 2011 were included in the resource estimate. Trench samples were converted into horizontal drill holes and included in the down hole compositing process. No lithological constraints we imposed on down hole assay compositing. Descriptive statistics were calculated for each metal from 1.0 m assay composite datasets constrained within the respective metal domains and results are presented in Table 13.1. Distribution histograms, cumulative frequency plots and probability plots for the 1.0 m composite are included in Appendix 2.

Pulacayo Silver-Lead-Zinc Deposit Technical Report November 2012
65 Queen St. • Dartmouth, NS B2Y 1G4 • Ph.: (902) 463-1440 • Fax: (902) 463-1419
E-mail: [email protected] • Web: www.mercatorgeo.com
106
Table 13.1: Silver, Lead and Zinc Statistics for Uncapped 1.0 m Composites Parameter Ag Metal Domains Pb Metal Domains Zn Metal Domains Mean Grade 122.10 (g/t) 1.04 (%) 1.54 (%) Maximum Grade 8,279.2 (g/t) 26.7 (%) 28.5 (%) Minimum Grade 0.14 (g/t) 0.01 (%) 0.01 (%) Variance 90,402.59 2.53 3.49 Standard Deviation 300.67 1.59 1.86 Coefficient of Variation 2.46 1.52 1.21 Number of Composites 8068 6952 11398
13.3.6 High Grade Capping Of Assay Composite Values A grade cap for each metal was applied to 1.0 meter assay composites to limit influence of high grade anomalous results having limited demonstrated continuity. Composites were capped at levels of 1500 g/t for silver and 15 % for both lead and zinc that correspond with the 99.3, 99.9, and 99.8 percentiles for each metal respectively. A subjective check on applicability of capping factors was carried out on the basis of logged geology and mineralization styles and it was concluded that the presence of 1.0 m intervals of mineralization at the selected capping grades were geologically reasonable, with local potential for both strike and dip continuity at such levels. Descriptive statistics were calculated for the 1.0 m capped assay composites and are presented in Table 13.2. As expected, mean composite grades for each metal decrease relative to the mean grades of the raw composite values presented above. The Coefficient of Variation for capped datasets is also lower, indicating that they are more statistically acceptable for resource estimation purposes. Distribution histograms, cumulative frequency plots and probability plots for capped 1.0 m composites for all metals are included in Appendix 2.
Table 13.2: Silver, Lead and Zinc Statistics for Capped 1.0 m Composites Parameter Ag Metal Domains Pb Metal Domains Zn Metal Domains Mean Grade 114.87 (g/t) 1.04 (%) 1.53 (%) Maximum Grade 1,500 (g/t) 15.00 (%) 15 (%) Minimum Grade 0.14 (g/t) 0.01 (%) 0.01 (%) Variance 47,015.29 2.41 3.12 Standard Deviation 216.83 1.55 1.77 Coefficient of Variation 1.89 1.49 1.15 Number of Composites 8068 6952 11398
Pulacayo Silver-Lead-Zinc Deposit Technical Report November 2012
65 Queen St. • Dartmouth, NS B2Y 1G4 • Ph.: (902) 463-1440 • Fax: (902) 463-1419
E-mail: [email protected] • Web: www.mercatorgeo.com
107
13.3.7 Variography Manually derived models of geology and grade distribution provided definition of the primary east-west sub-vertical trend associated with the TVS. Mineralization is characterized by narrow vein style occurrences in tuffaceous sandstone host rocks at depth that bifurcate into stockwork vein arrays and disseminated mineralization in overlying andesitic volcanics. To assess spatial aspects of grade distribution within this recognized orientation corridor, experimental variograms for silver, lead and zinc were individually created based on the capped 1.0 m down hole composite data set from the respective metal domain. Experimental down hole variograms were developed to assess the global nugget value for each metal (Figure 13.8) with good spherical model results obtained. Experimental directional variograms were developed for several Pulacayo data sets, including individual metal domains and the global deposit defined by limits of the peripheral domain solid. The experimental directional variogram results presented below were developed from a global dataset consisting of all 1.00 meter grade-capped assay composites occurring within the peripheral domain, including all composites within contained individual metal domain solids. Data were assessed within a vertical, east-west oriented plane defined in the modelling software by a 90° plunge towards 0° azimuth. Experimental variogram results for silver were fitted with spherical model attributes that define a primary axis (major axis) of continuity of 150 m along an azimuth of 270° and a plunge of 40°, a secondary axis (semi-major) of continuity of 75 m along an azimuth of 90° and a plunge of 40°, and a third axis (minor axis) of continuity of 25 m along an azimuth of 0° and a plunge of 0° (Figure 13.9). The anisotropic variogram results for silver combined with sectional interpretations of geology and grade distributions contributed to development of interpolation ellipsoids that can generally be defined as plunging 30° along a strike of 280° and dipping 90°, with a 150 m major axis, 75 m semi-major axis, and a 25 m minor axis. Interpolation ellipsoid orientation was modified along dip and strike to better fit local trends and geometries of the deposit. Experimental variogram results for lead were fitted with spherical model attributes that define a primary axis of continuity of 150 m along an azimuth of 280° and a plunge of 35°, a secondary axis of continuity of 100 m along an azimuth of 90° and a plunge of 55°, and a third axis of continuity of 25 m along an azimuth of 0° and a plunge of 0° (Figure 13.10). The anisotropic variogram results for lead, combined with sectional interpretations of geology and grade distributions contributed to the development of interpolation ellipsoids that can generally be defined as plunging 30° along a strike of 280° and dipping 90°, with a 150 m major axis, 75 m semi-major axis, and a 25 m minor axis. As in the case for silver noted above, interpolation

Pulacayo Silver-Lead-Zinc Deposit Technical Report November 2012
65 Queen St. • Dartmouth, NS B2Y 1G4 • Ph.: (902) 463-1440 • Fax: (902) 463-1419
E-mail: [email protected] • Web: www.mercatorgeo.com
108
ellipsoid orientation was modified along dip and strike to better fit local trends and geometries of the deposit. Experimental variogram results for zinc were fitted with spherical model attributes that define a primary axis of continuity of 150 m along an azimuth of 280° and a plunge of 35°, a secondary axis of continuity of 100 m along an azimuth of 90° and a plunge of 56°, and a third axis of continuity of 25 m along an azimuth of 0° and a plunge of 0° (Figure 13.12). The anisotropic variogram results for zinc, combined with sectional interpretations of geology and grade distributions contributed to the development of interpolation ellipsoids that can generally be defined as plunging 30° along a strike of 280° and dipping 90°, with a 150 m major axis, 75 m semi-major axis, and a 25 m minor axis. As in the cases for silver and lead noted above, interpolation ellipsoid orientation was modified along dip and strike to better fit local trends and geometries of the deposit.
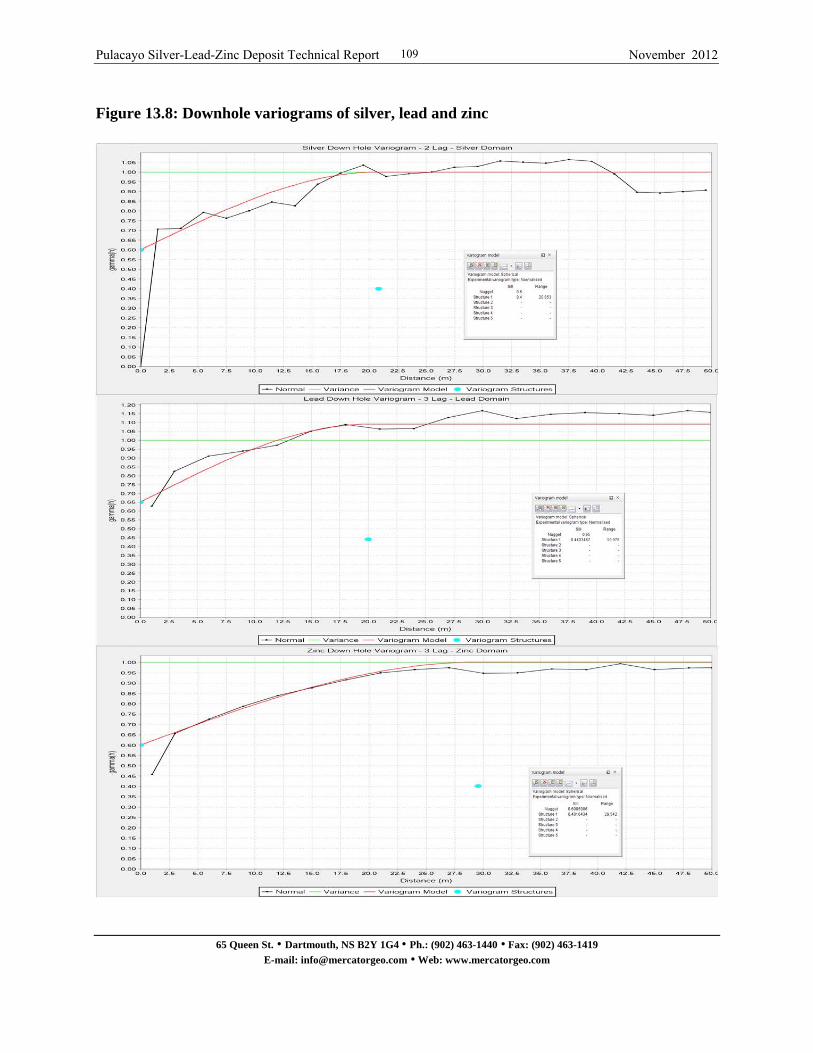
Pulacayo Silver-Lead-Zinc Deposit Technical Report November 2012
65 Queen St. • Dartmouth, NS B2Y 1G4 • Ph.: (902) 463-1440 • Fax: (902) 463-1419
E-mail: [email protected] • Web: www.mercatorgeo.com
109
Figure 13.8: Downhole variograms of silver, lead and zinc

Pulacayo Silver-Lead-Zinc Deposit Technical Report November 2012
65 Queen St. • Dartmouth, NS B2Y 1G4 • Ph.: (902) 463-1440 • Fax: (902) 463-1419
E-mail: [email protected] • Web: www.mercatorgeo.com
110
Figure 13.9: Anisotropic variograms for silver capped composite values

Pulacayo Silver-Lead-Zinc Deposit Technical Report November 2012
65 Queen St. • Dartmouth, NS B2Y 1G4 • Ph.: (902) 463-1440 • Fax: (902) 463-1419
E-mail: [email protected] • Web: www.mercatorgeo.com
111
Figure 13.10: Anisotropic variograms for lead capped composite values
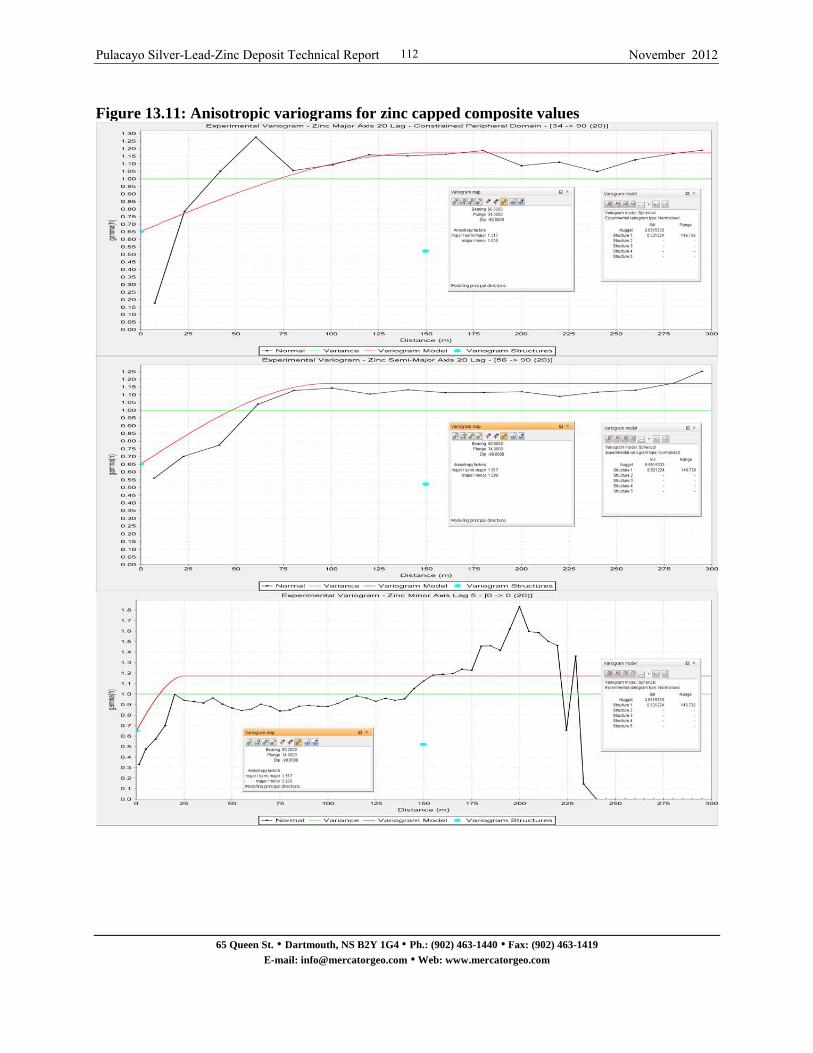
Pulacayo Silver-Lead-Zinc Deposit Technical Report November 2012
65 Queen St. • Dartmouth, NS B2Y 1G4 • Ph.: (902) 463-1440 • Fax: (902) 463-1419
E-mail: [email protected] • Web: www.mercatorgeo.com
112
Figure 13.11: Anisotropic variograms for zinc capped composite values

Pulacayo Silver-Lead-Zinc Deposit Technical Report November 2012
65 Queen St. • Dartmouth, NS B2Y 1G4 • Ph.: (902) 463-1440 • Fax: (902) 463-1419
E-mail: [email protected] • Web: www.mercatorgeo.com
113
13.3.8 Setup of Three Dimensional Block Model The Pulacayo block model was developed using WGS84 (Zone 19, South Datum) grid coordination and a sea level elevation datum. The block model is oriented along Az. 100° with no dip rotation applied and model extents are further defined in Table 13.3. Standard block size for the model is 5 m x 3 m x 3 m (X, Y, Z), with one unit of sub-blocking to a minimum block size of 2.5 m x 1.5 m x 1.5 m allowed. As discussed above in Section 13.3.3, the nominal topographic surface as defined by a digital terrain model functions as the upper deposit constraint. Table 13.3: Summary of Pulacayo Deposit Block Model Parameters Type Y (Northing m) X (Easting m) Z (Elevation m) Minimum Coordinates 7744400 739350 3775 Maximum Coordinates 7745150 741350 4501 User Block Size 3 5 3 Min. Block Size 1.5 2.5 1.5 Rotation 10 0 0
*UTM WGS 84 – Zone 19 South and sea level datum
13.3.9 Resource Estimation Inverse distance squared (ID2) grade interpolation was used to assign block grades within the Pulacayo block model. As reviewed earlier, interpolation ellipsoid orientation and range values used in the estimation reflect a combination of trends determined from the variography and sectional interpretations of geology and grade distributions for the deposit. The trends and ranges of the major, semi-major, and minor axes of grade interpolation ellipsoids used to estimate silver, lead and zinc grades were described previously in report section 13.3.7. All three metals were evaluated independently using respective assay composite data sets. Block model grade interpolation was a multiphase process for each metal that consisted of sequential interpolation within (1) the interpreted metal domain solids below the oxide surface DTM, (2) the interpreted metal domain solids above the oxide surface DTM, (3) below the topographic surface DTM within the peripheral domain solid and below the oxide surface DTM, and (4) within the peripheral domain solid above the oxide surface DTM and below the topographic surface DTM. Individual metal domain solids, 9 for each metal for a total of 27, required multiple interpolation passes to accommodate minor orientation adjustments to the azimuth and dip of ellipsoids. This was done to better accommodate local variations in orientation and geometry of respective domains. The minimum number of contributing assay composites used to estimate a block grade for all metal domains was set at 2 and the maximum number of contributing composites was set at 9, with no more than 3 contributing assay composites allowed
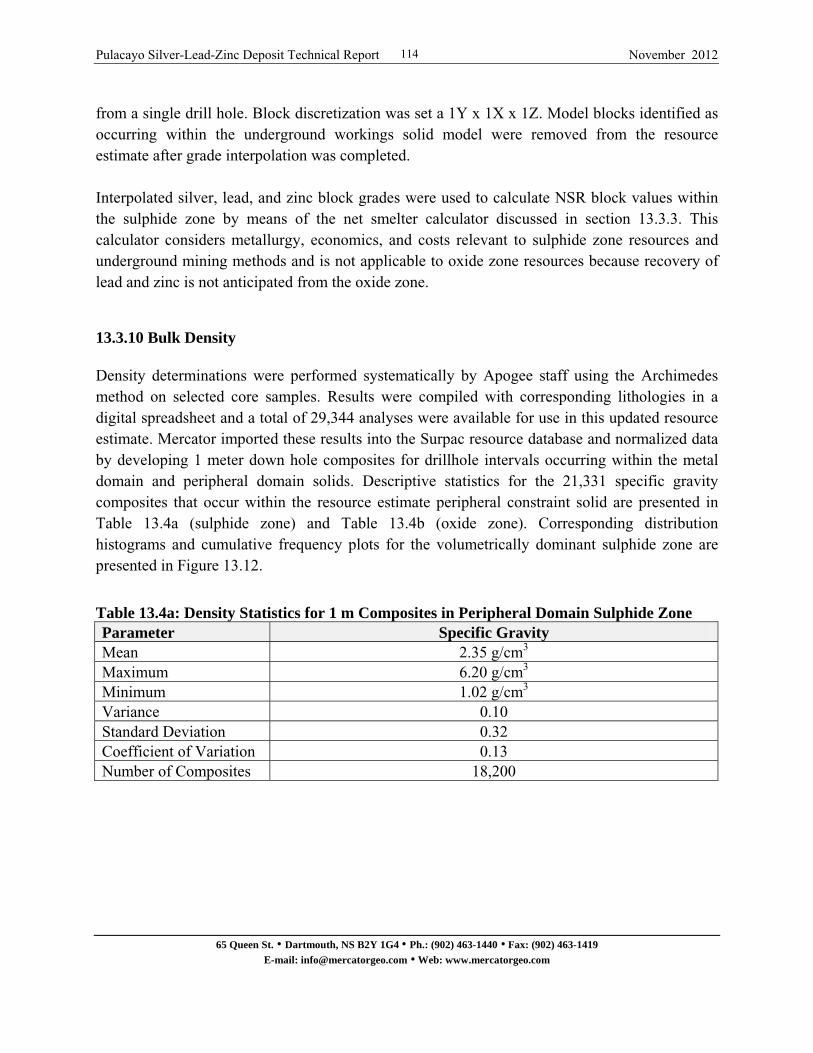
Pulacayo Silver-Lead-Zinc Deposit Technical Report November 2012
65 Queen St. • Dartmouth, NS B2Y 1G4 • Ph.: (902) 463-1440 • Fax: (902) 463-1419
E-mail: [email protected] • Web: www.mercatorgeo.com
114
from a single drill hole. Block discretization was set a 1Y x 1X x 1Z. Model blocks identified as occurring within the underground workings solid model were removed from the resource estimate after grade interpolation was completed. Interpolated silver, lead, and zinc block grades were used to calculate NSR block values within the sulphide zone by means of the net smelter calculator discussed in section 13.3.3. This calculator considers metallurgy, economics, and costs relevant to sulphide zone resources and underground mining methods and is not applicable to oxide zone resources because recovery of lead and zinc is not anticipated from the oxide zone.
13.3.10 Bulk Density Density determinations were performed systematically by Apogee staff using the Archimedes method on selected core samples. Results were compiled with corresponding lithologies in a digital spreadsheet and a total of 29,344 analyses were available for use in this updated resource estimate. Mercator imported these results into the Surpac resource database and normalized data by developing 1 meter down hole composites for drillhole intervals occurring within the metal domain and peripheral domain solids. Descriptive statistics for the 21,331 specific gravity composites that occur within the resource estimate peripheral constraint solid are presented in Table 13.4a (sulphide zone) and Table 13.4b (oxide zone). Corresponding distribution histograms and cumulative frequency plots for the volumetrically dominant sulphide zone are presented in Figure 13.12.
Table 13.4a: Density Statistics for 1 m Composites in Peripheral Domain Sulphide Zone Parameter Specific Gravity Mean 2.35 g/cm3
Maximum 6.20 g/cm3
Minimum 1.02 g/cm3
Variance 0.10 Standard Deviation 0.32 Coefficient of Variation 0.13 Number of Composites 18,200

Pulacayo Silver-Lead-Zinc Deposit Technical Report November 2012
65 Queen St. • Dartmouth, NS B2Y 1G4 • Ph.: (902) 463-1440 • Fax: (902) 463-1419
E-mail: [email protected] • Web: www.mercatorgeo.com
115
Table 13.4b: Density Statistics for 1 m Composites in Peripheral Domain Oxide Zone
Parameter Specific Gravity Mean 2.16 g/cm3
Maximum 5.54 g/cm3
Minimum 1.00 g/cm3
Variance 0.07 Standard Deviation 0.27 Coefficient of Variation 0.13 Number of Composites 3131
Mercator considers variation in model space bulk densities to be primarily dependent on variation of contained sulphide levels in core samples. Sulphide content is also closely related to overall metal grades within the resource peripheral constraint. Assignment of the average specific gravities of 2.35 g/cm3 and 2.16 g/cm3 for the sulphide and oxide zone, respectively, across the entire deposit was not considered appropriate, due to these recognized spatial density inhomogeneities. Density values were therefore interpolated into block model space using ID2 methodology and constant parameters for each metal. This produced three independently interpolated density values for each block derived from separate interpolations based on the three metal sets and interpolation routines. The highest interpolated density value for each block was selected as the database block density attribute. Figure 13.12: Cumulative Frequency and Distribution Histogram of Density Results in Peripheral Domain Sulphide Zone
Pulacayo Silver-Lead-Zinc Deposit Technical Report November 2012
65 Queen St. • Dartmouth, NS B2Y 1G4 • Ph.: (902) 463-1440 • Fax: (902) 463-1419
E-mail: [email protected] • Web: www.mercatorgeo.com
116
Extremely low density values in the database were flagged and plotted on the drill hole traces along with geology and drill hole assay grades to assess their validity. Values less than 1.50 g/cm3 were found to most commonly occur in samples from drill hole PUD005. Core from this hole is characterised by competent lithologies that would be expected to have density values more closely approximating the data set mean. This issue was further assessed by comparing PUD005 density values for core intervals for similar metal grades in similar rocks in adjacent drill holes. These intervals showed values close to or greater than the mean data set value and it was concluded that results below 1.50 g/cm3 were erroneous where no logged physical core attribute could explain the low value present. These suspect results were excluded from the density interpolation process for the resource block model.
13.3.11 Resource Category Definitions Definitions of mineral resource and associated mineral resource categories used in this report are those recognized under National Instrument 43-101 (NI 43-101) and set out in the Canadian Institute of Mining, Metallurgy and Petroleum Standards On Mineral Resources and Reserves Definitions and Guidelines (the CIM Standards).
13.3.12 Resource Category Parameters Used in Current Estimate Mineral resources presented in the current updated estimate have been assigned to Inferred and Indicated resource categories that reflect increasing levels of confidence with respect to spatial configuration of resources and corresponding grade assignment within the deposit. Several factors were considered in defining resource category assignments, including drill hole spacing, geological interpretations, and number and range of informing composites. Apogee has significantly improved the quality of the underground workings model since the previous resource estimate by Mercator that incorporated an Inferred category buffer zone around the digital workings model. A similar Inferred category envelope was not included in the current estimate Additional specific definition parameters for each resource category applied in the current estimate are set out below and Figures 13.13a through 13.13c illustrate spatial distribution of these categories and the underground workings within the block model. Measured Resource: There are no interpolated resource blocks with the certainty of definition suitable for classification in this category present in the current estimate.

Pulacayo Silver-Lead-Zinc Deposit Technical Report November 2012
65 Queen St. • Dartmouth, NS B2Y 1G4 • Ph.: (902) 463-1440 • Fax: (902) 463-1419
E-mail: [email protected] • Web: www.mercatorgeo.com
117
Indicated Resources: All interpolated blocks that occur within the peripheral deposit constraint with one or more of the interpolated metals qualifying to have at least 7 contributing assay composites with a maximum average distance of 70 m to a block centroid and the nearest contributing composite at 60 m or less from a block centroid are categorized as Indicated mineral resources.
Inferred Resources: All interpolated blocks that occur within the peripheral deposit constraint that do not meet Indicated resource category requirements, or for which grades were interpolated through drill intervals without sampling are categorized as Inferred mineral resources.
Figure 13.13a: Isometric view of the mineral resource categories – view to NW
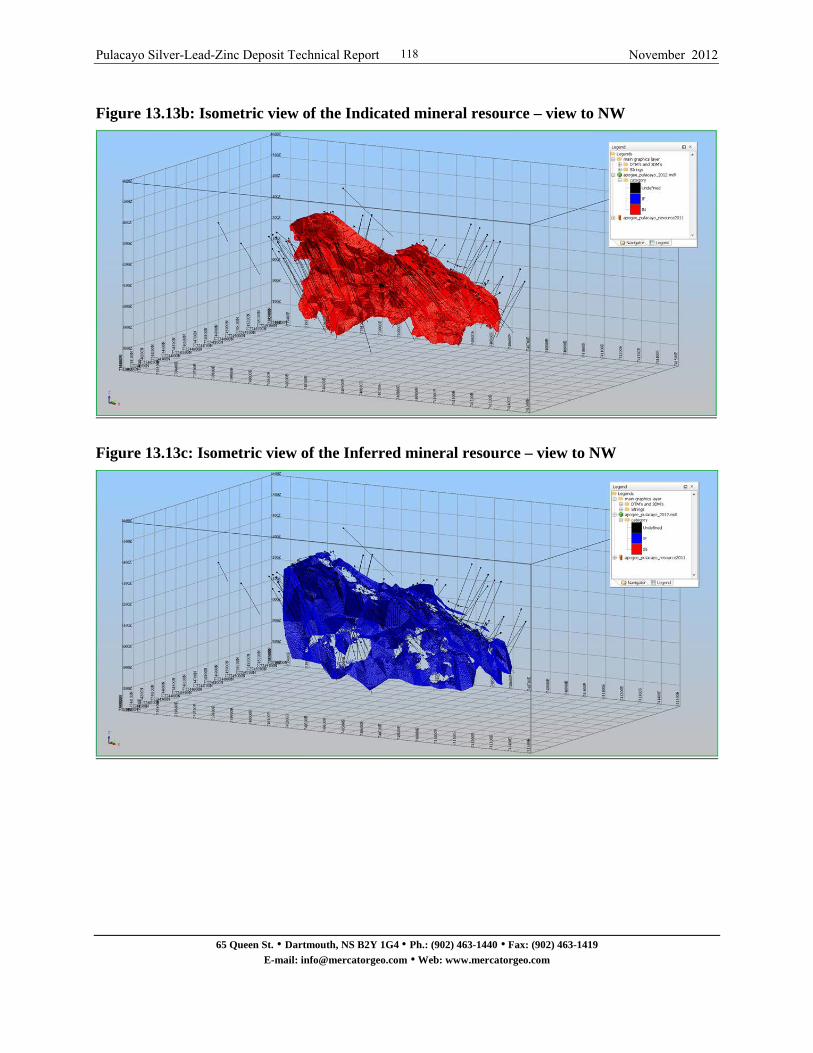
Pulacayo Silver-Lead-Zinc Deposit Technical Report November 2012
65 Queen St. • Dartmouth, NS B2Y 1G4 • Ph.: (902) 463-1440 • Fax: (902) 463-1419
E-mail: [email protected] • Web: www.mercatorgeo.com
118
Figure 13.13b: Isometric view of the Indicated mineral resource – view to NW
Figure 13.13c: Isometric view of the Inferred mineral resource – view to NW
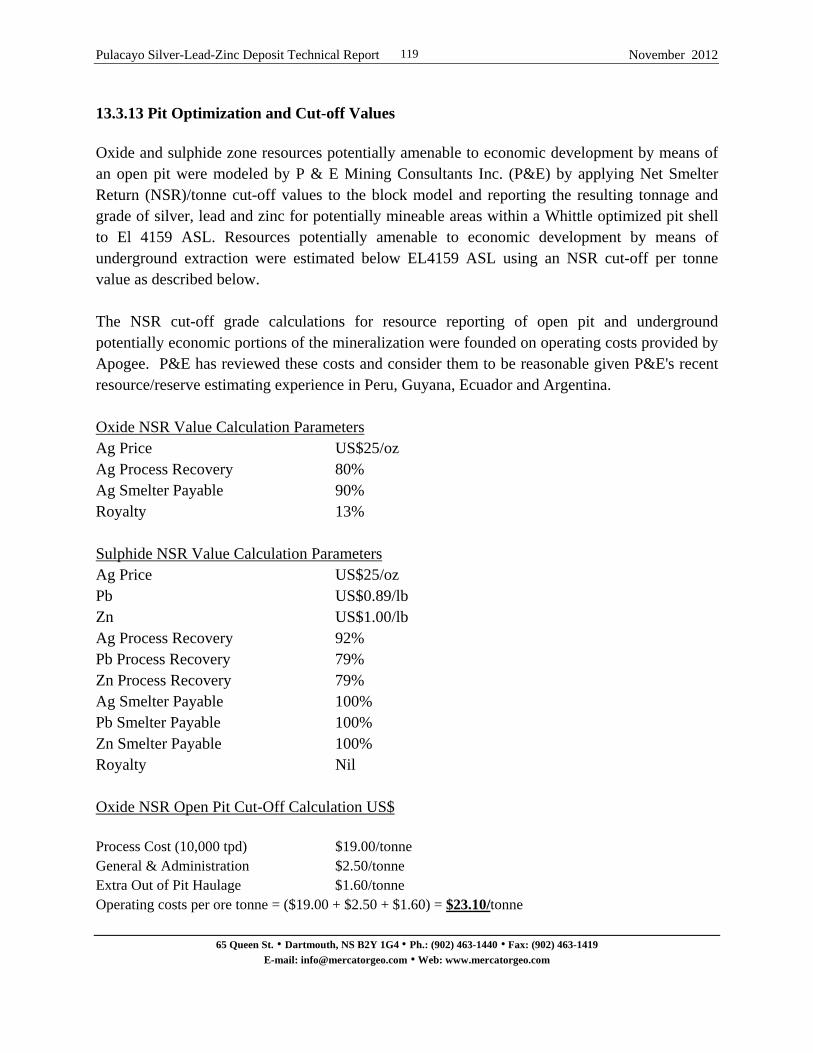
Pulacayo Silver-Lead-Zinc Deposit Technical Report November 2012
65 Queen St. • Dartmouth, NS B2Y 1G4 • Ph.: (902) 463-1440 • Fax: (902) 463-1419
E-mail: [email protected] • Web: www.mercatorgeo.com
119
13.3.13 Pit Optimization and Cut-off Values Oxide and sulphide zone resources potentially amenable to economic development by means of an open pit were modeled by P & E Mining Consultants Inc. (P&E) by applying Net Smelter Return (NSR)/tonne cut-off values to the block model and reporting the resulting tonnage and grade of silver, lead and zinc for potentially mineable areas within a Whittle optimized pit shell to El 4159 ASL. Resources potentially amenable to economic development by means of underground extraction were estimated below EL4159 ASL using an NSR cut-off per tonne value as described below. The NSR cut-off grade calculations for resource reporting of open pit and underground potentially economic portions of the mineralization were founded on operating costs provided by Apogee. P&E has reviewed these costs and consider them to be reasonable given P&E's recent resource/reserve estimating experience in Peru, Guyana, Ecuador and Argentina. Oxide NSR Value Calculation Parameters Ag Price US$25/oz Ag Process Recovery 80% Ag Smelter Payable 90% Royalty 13% Sulphide NSR Value Calculation Parameters Ag Price US$25/oz Pb US$0.89/lb Zn US$1.00/lb Ag Process Recovery 92% Pb Process Recovery 79% Zn Process Recovery 79% Ag Smelter Payable 100% Pb Smelter Payable 100% Zn Smelter Payable 100% Royalty Nil Oxide NSR Open Pit Cut-Off Calculation US$ Process Cost (10,000 tpd) $19.00/tonne General & Administration $2.50/tonne Extra Out of Pit Haulage $1.60/tonne Operating costs per ore tonne = ($19.00 + $2.50 + $1.60) = $23.10/tonne
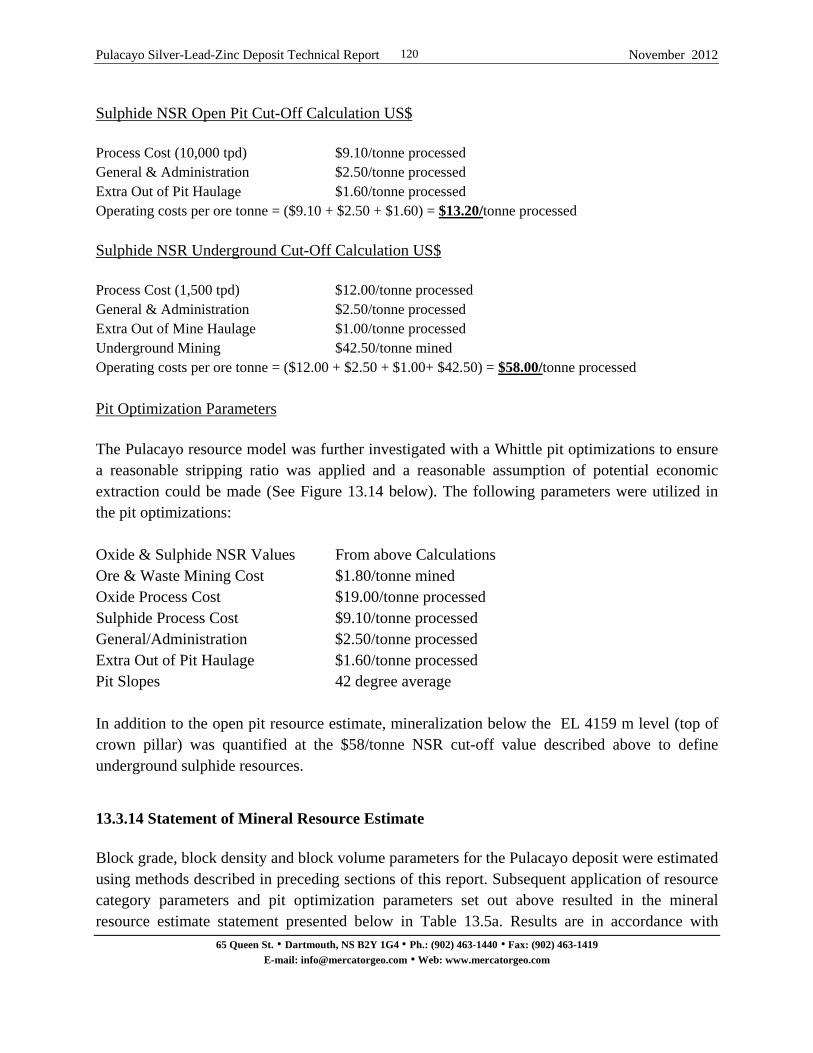
Pulacayo Silver-Lead-Zinc Deposit Technical Report November 2012
65 Queen St. • Dartmouth, NS B2Y 1G4 • Ph.: (902) 463-1440 • Fax: (902) 463-1419
E-mail: [email protected] • Web: www.mercatorgeo.com
120
Sulphide NSR Open Pit Cut-Off Calculation US$ Process Cost (10,000 tpd) $9.10/tonne processed General & Administration $2.50/tonne processed Extra Out of Pit Haulage $1.60/tonne processed Operating costs per ore tonne = ($9.10 + $2.50 + $1.60) = $13.20/tonne processed
Sulphide NSR Underground Cut-Off Calculation US$ Process Cost (1,500 tpd) $12.00/tonne processed General & Administration $2.50/tonne processed Extra Out of Mine Haulage $1.00/tonne processed Underground Mining $42.50/tonne mined Operating costs per ore tonne = ($12.00 + $2.50 + $1.00+ $42.50) = $58.00/tonne processed
Pit Optimization Parameters
The Pulacayo resource model was further investigated with a Whittle pit optimizations to ensure a reasonable stripping ratio was applied and a reasonable assumption of potential economic extraction could be made (See Figure 13.14 below). The following parameters were utilized in the pit optimizations: Oxide & Sulphide NSR Values From above Calculations Ore & Waste Mining Cost $1.80/tonne mined Oxide Process Cost $19.00/tonne processed Sulphide Process Cost $9.10/tonne processed General/Administration $2.50/tonne processed Extra Out of Pit Haulage $1.60/tonne processed Pit Slopes 42 degree average In addition to the open pit resource estimate, mineralization below the EL 4159 m level (top of crown pillar) was quantified at the $58/tonne NSR cut-off value described above to define underground sulphide resources.
13.3.14 Statement of Mineral Resource Estimate Block grade, block density and block volume parameters for the Pulacayo deposit were estimated using methods described in preceding sections of this report. Subsequent application of resource category parameters and pit optimization parameters set out above resulted in the mineral resource estimate statement presented below in Table 13.5a. Results are in accordance with

Pulacayo Silver-Lead-Zinc Deposit Technical Report November 2012
65 Queen St. • Dartmouth, NS B2Y 1G4 • Ph.: (902) 463-1440 • Fax: (902) 463-1419
E-mail: [email protected] • Web: www.mercatorgeo.com
121
Canadian Institute of Mining, Metallurgy and Petroleum Standards on Mineral Resources and Reserves: Definitions and Guidelines (the CIM Standards) as well as disclosure requirements of National Instrument 43-101. Table 13.5b presents a re-statement of the underground resource calculated on the basis of uncapped drill core assay composites and shows an increase of approximately 22% in contained Inferred category Ag ounces and 10% in contained Indicated category Ag ounces at the $58NSR cut-off value. Open pit resources remained essentially unchanged between capped and uncapped drill core assay composite methodologies. The relationship between deposit silver grade and tonnage at various cutoff values is presented in sensitivity charts for blocks within the sulphide zone (Figure 13.14) and within the oxide zone (Figure 13.15).
Figure 13.13d: Isometric view of Whittle pit shell developed by P&E – view to NW
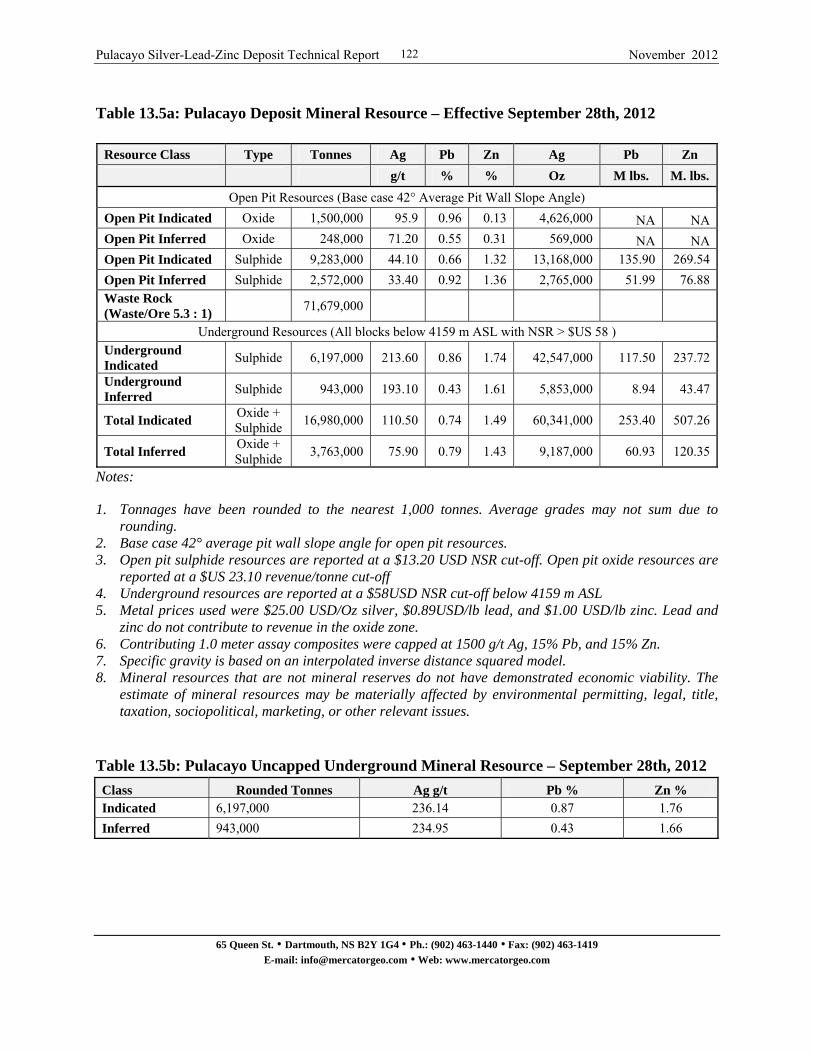
Pulacayo Silver-Lead-Zinc Deposit Technical Report November 2012
65 Queen St. • Dartmouth, NS B2Y 1G4 • Ph.: (902) 463-1440 • Fax: (902) 463-1419
E-mail: [email protected] • Web: www.mercatorgeo.com
122
Table 13.5a: Pulacayo Deposit Mineral Resource – Effective September 28th, 2012
Resource Class Type Tonnes Ag Pb Zn Ag Pb Zn
g/t % % Oz M lbs. M. lbs.
Open Pit Resources (Base case 42° Average Pit Wall Slope Angle)
Open Pit Indicated Oxide 1,500,000 95.9 0.96 0.13 4,626,000 NA NAOpen Pit Inferred Oxide 248,000 71.20 0.55 0.31 569,000 NA NAOpen Pit Indicated Sulphide 9,283,000 44.10 0.66 1.32 13,168,000 135.90 269.54
Open Pit Inferred Sulphide 2,572,000 33.40 0.92 1.36 2,765,000 51.99 76.88Waste Rock (Waste/Ore 5.3 : 1)
71,679,000
Underground Resources (All blocks below 4159 m ASL with NSR > $US 58 ) Underground Indicated
Sulphide 6,197,000 213.60 0.86 1.74 42,547,000 117.50 237.72
Underground Inferred
Sulphide 943,000 193.10 0.43 1.61 5,853,000 8.94 43.47
Total Indicated Oxide + Sulphide
16,980,000 110.50 0.74 1.49 60,341,000 253.40 507.26
Total Inferred Oxide + Sulphide
3,763,000 75.90 0.79 1.43 9,187,000 60.93 120.35
Notes:
1. Tonnages have been rounded to the nearest 1,000 tonnes. Average grades may not sum due to rounding.
2. Base case 42° average pit wall slope angle for open pit resources. 3. Open pit sulphide resources are reported at a $13.20 USD NSR cut-off. Open pit oxide resources are
reported at a $US 23.10 revenue/tonne cut-off 4. Underground resources are reported at a $58USD NSR cut-off below 4159 m ASL 5. Metal prices used were $25.00 USD/Oz silver, $0.89USD/lb lead, and $1.00 USD/lb zinc. Lead and
zinc do not contribute to revenue in the oxide zone. 6. Contributing 1.0 meter assay composites were capped at 1500 g/t Ag, 15% Pb, and 15% Zn. 7. Specific gravity is based on an interpolated inverse distance squared model. 8. Mineral resources that are not mineral reserves do not have demonstrated economic viability. The
estimate of mineral resources may be materially affected by environmental permitting, legal, title, taxation, sociopolitical, marketing, or other relevant issues.
Table 13.5b: Pulacayo Uncapped Underground Mineral Resource – September 28th, 2012
Class Rounded Tonnes Ag g/t Pb % Zn % Indicated 6,197,000 236.14 0.87 1.76
Inferred 943,000 234.95 0.43 1.66
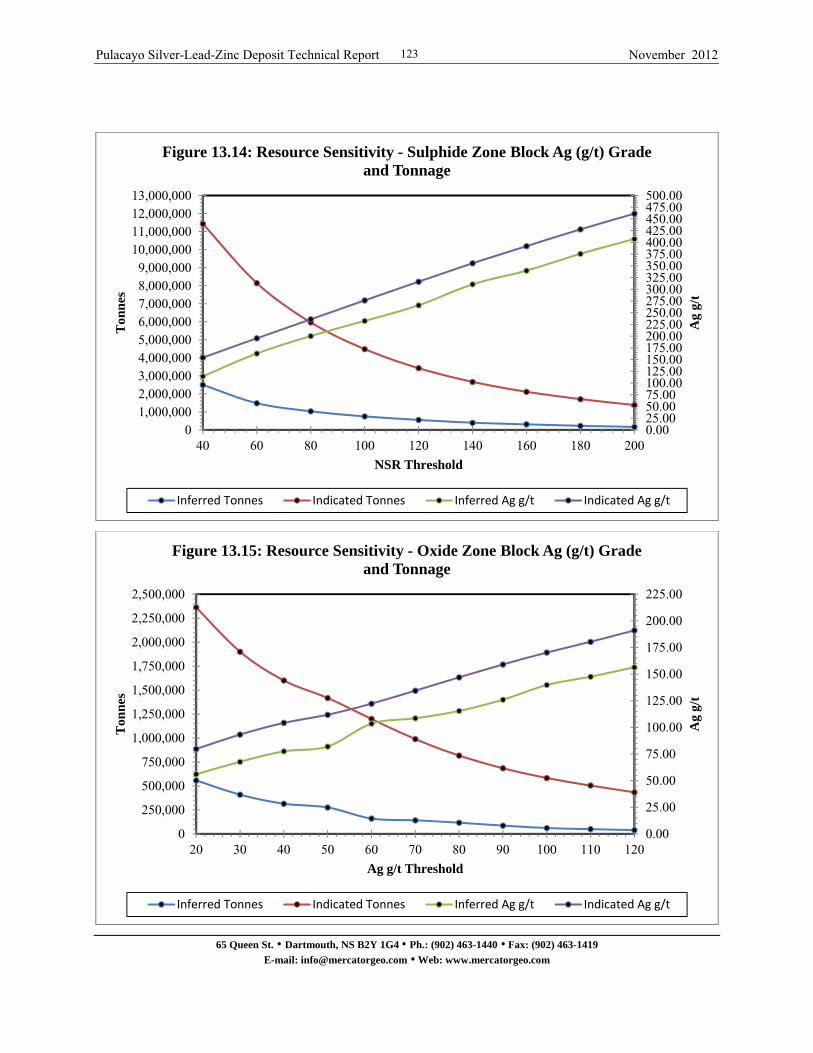
Pulacayo Silver-Lead-Zinc Deposit Technical Report November 2012
65 Queen St. • Dartmouth, NS B2Y 1G4 • Ph.: (902) 463-1440 • Fax: (902) 463-1419
E-mail: [email protected] • Web: www.mercatorgeo.com
123
Figure 13.14: Resource Sensitivity - Block Ag g/t Grade and Tonnage
Figure 13.15: Resource Sensitivity - Oxide Zone Block Ag (g/t) Grade and Tonnage
0.0025.0050.0075.00100.00125.00150.00175.00200.00225.00250.00275.00300.00325.00350.00375.00400.00425.00450.00475.00500.00
01,000,0002,000,0003,000,0004,000,0005,000,0006,000,0007,000,0008,000,0009,000,000
10,000,00011,000,00012,000,00013,000,000
40 60 80 100 120 140 160 180 200
Ag
g/t
Ton
nes
NSR Threshold
Figure 13.14: Resource Sensitivity - Sulphide Zone Block Ag (g/t) Grade and Tonnage
Inferred Tonnes Indicated Tonnes Inferred Ag g/t Indicated Ag g/t
0.00
25.00
50.00
75.00
100.00
125.00
150.00
175.00
200.00
225.00
0
250,000
500,000
750,000
1,000,000
1,250,000
1,500,000
1,750,000
2,000,000
2,250,000
2,500,000
20 30 40 50 60 70 80 90 100 110 120
Ag
g/t
Ton
nes
Ag g/t Threshold
Figure 13.15: Resource Sensitivity - Oxide Zone Block Ag (g/t) Grade and Tonnage
Inferred Tonnes Indicated Tonnes Inferred Ag g/t Indicated Ag g/t
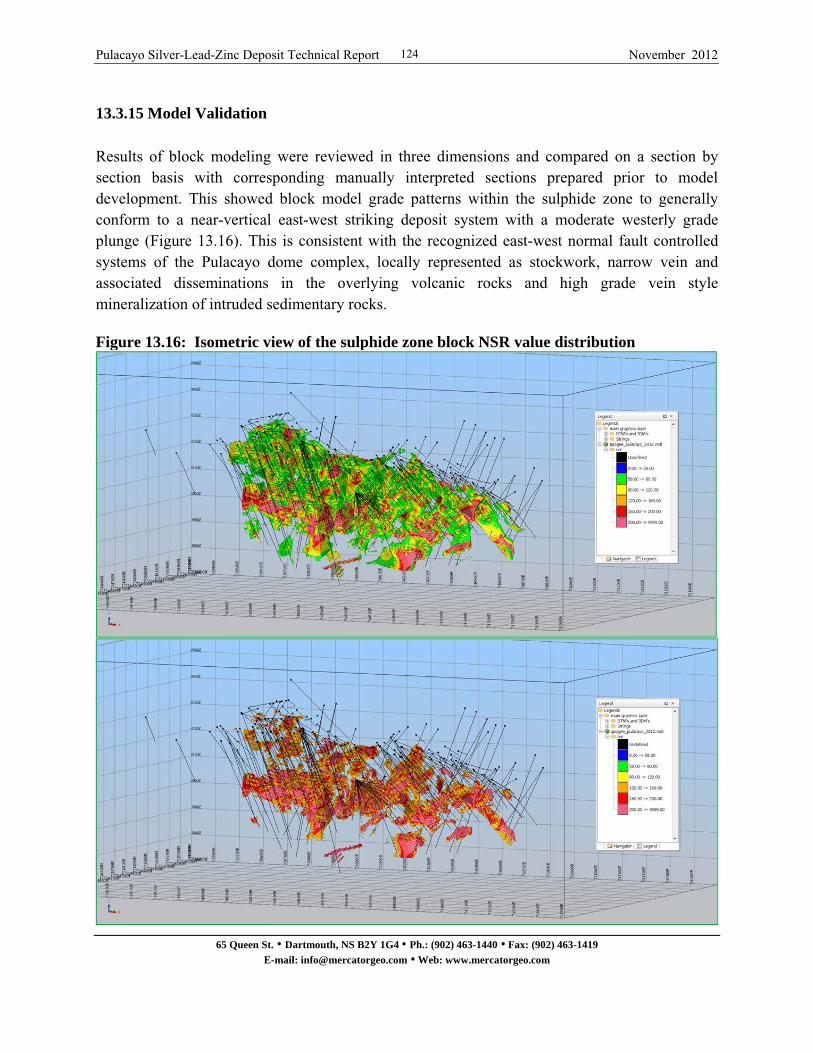
Pulacayo Silver-Lead-Zinc Deposit Technical Report November 2012
65 Queen St. • Dartmouth, NS B2Y 1G4 • Ph.: (902) 463-1440 • Fax: (902) 463-1419
E-mail: [email protected] • Web: www.mercatorgeo.com
124
13.3.15 Model Validation Results of block modeling were reviewed in three dimensions and compared on a section by section basis with corresponding manually interpreted sections prepared prior to model development. This showed block model grade patterns within the sulphide zone to generally conform to a near-vertical east-west striking deposit system with a moderate westerly grade plunge (Figure 13.16). This is consistent with the recognized east-west normal fault controlled systems of the Pulacayo dome complex, locally represented as stockwork, narrow vein and associated disseminations in the overlying volcanic rocks and high grade vein style mineralization of intruded sedimentary rocks. Figure 13.16: Isometric view of the sulphide zone block NSR value distribution

Pulacayo Silver-Lead-Zinc Deposit Technical Report November 2012
65 Queen St. • Dartmouth, NS B2Y 1G4 • Ph.: (902) 463-1440 • Fax: (902) 463-1419
E-mail: [email protected] • Web: www.mercatorgeo.com
125
Oxide zone silver grade distribution showed descrete zones of mineralization that have good correlation with higher grade mineralization within the underlying sulphide zone (Figure 13.17). Overall, results of the visual inspection of both the sulphide and oxide zones for all metals show an acceptable degree of consistency between the block model and the independently derived interpretations of the deposit. Figure 13.17: Isometric view of the oxide zone block silver grade distribution
Descriptive statistics were calculated for the drill hole composite values used in block model grade interpolations and these were compared to values calculated for the individual blocks in the block model (Table 13.6). The mean drill hole composite grades were found to compare acceptably with corresponding grades of the block model, thereby providing a general check on the model with respect to the underlying assay composite population. Descriptive statistics for
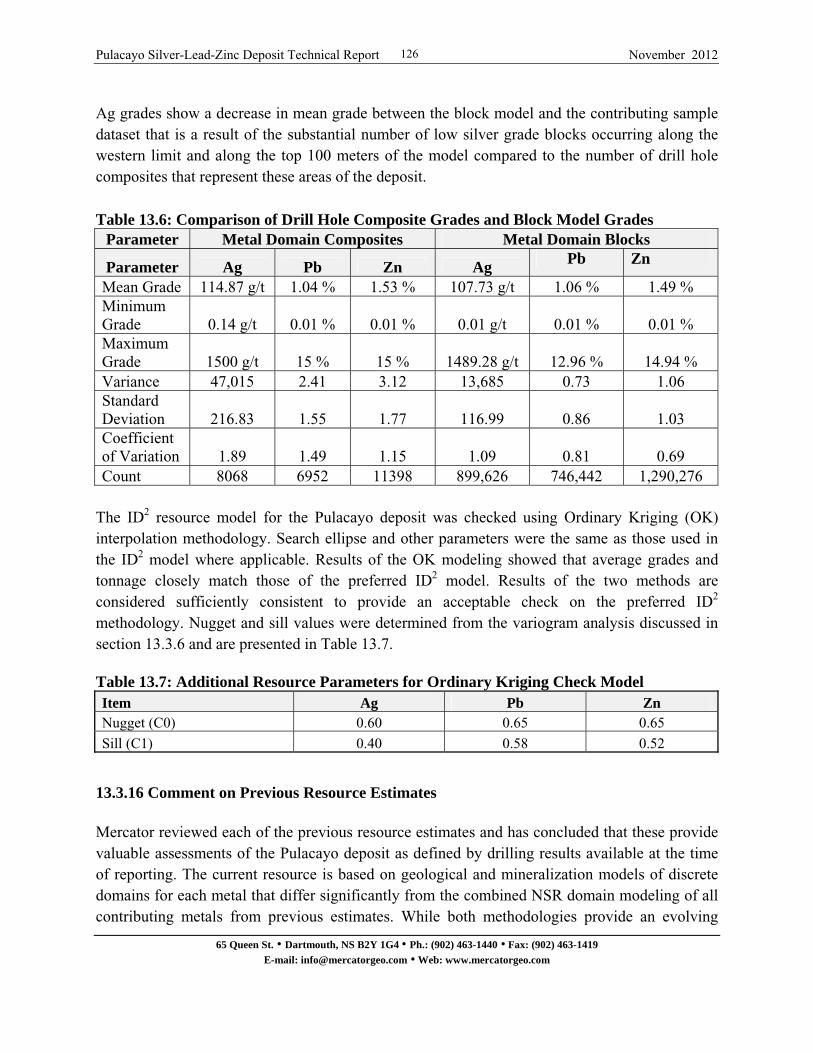
Pulacayo Silver-Lead-Zinc Deposit Technical Report November 2012
65 Queen St. • Dartmouth, NS B2Y 1G4 • Ph.: (902) 463-1440 • Fax: (902) 463-1419
E-mail: [email protected] • Web: www.mercatorgeo.com
126
Ag grades show a decrease in mean grade between the block model and the contributing sample dataset that is a result of the substantial number of low silver grade blocks occurring along the western limit and along the top 100 meters of the model compared to the number of drill hole composites that represent these areas of the deposit. Table 13.6: Comparison of Drill Hole Composite Grades and Block Model Grades
Parameter Metal Domain Composites Metal Domain Blocks
Parameter Ag Pb Zn Ag Pb Zn
Mean Grade 114.87 g/t 1.04 % 1.53 % 107.73 g/t 1.06 % 1.49 % Minimum Grade 0.14 g/t 0.01 % 0.01 % 0.01 g/t 0.01 % 0.01 % Maximum Grade 1500 g/t 15 % 15 % 1489.28 g/t 12.96 % 14.94 % Variance 47,015 2.41 3.12 13,685 0.73 1.06 Standard Deviation 216.83 1.55 1.77 116.99 0.86 1.03 Coefficient of Variation 1.89 1.49 1.15 1.09 0.81 0.69 Count 8068 6952 11398 899,626 746,442 1,290,276
The ID2 resource model for the Pulacayo deposit was checked using Ordinary Kriging (OK) interpolation methodology. Search ellipse and other parameters were the same as those used in the ID2 model where applicable. Results of the OK modeling showed that average grades and tonnage closely match those of the preferred ID2 model. Results of the two methods are considered sufficiently consistent to provide an acceptable check on the preferred ID2 methodology. Nugget and sill values were determined from the variogram analysis discussed in section 13.3.6 and are presented in Table 13.7. Table 13.7: Additional Resource Parameters for Ordinary Kriging Check Model Item Ag Pb Zn Nugget (C0) 0.60 0.65 0.65
Sill (C1) 0.40 0.58 0.52
13.3.16 Comment on Previous Resource Estimates Mercator reviewed each of the previous resource estimates and has concluded that these provide valuable assessments of the Pulacayo deposit as defined by drilling results available at the time of reporting. The current resource is based on geological and mineralization models of discrete domains for each metal that differ significantly from the combined NSR domain modeling of all contributing metals from previous estimates. While both methodologies provide an evolving

Pulacayo Silver-Lead-Zinc Deposit Technical Report November 2012
65 Queen St. • Dartmouth, NS B2Y 1G4 • Ph.: (902) 463-1440 • Fax: (902) 463-1419
E-mail: [email protected] • Web: www.mercatorgeo.com
127
assessment of grade distribution of the TVS and associated secondary structures, the current resource methodology aims at improving grade correlation and minimizing potential dilution of each metal with adjacent lower grade tonnes. Results from the current resource estimate differ from those of the previous resource. Outside of the stated methodology change, this reflects impact of new drilling results,, upgraded confidence in the underground workings digital model, inclusion of oxide zone and sulphide zone optimized pit resources and revised (higher) NSR cutoff values for underground resources.

Pulacayo Silver-Lead-Zinc Deposit Technical Report November 2012
65 Queen St. • Dartmouth, NS B2Y 1G4 • Ph.: (902) 463-1440 • Fax: (902) 463-1419
E-mail: [email protected] • Web: www.mercatorgeo.com
128
14 Adjacent Properties There are no adjacent properties as defined by NI43-101 that are pertinent to the Pulacayo mineral resource estimate described in this report.
Pulacayo Silver-Lead-Zinc Deposit Technical Report November 2012
65 Queen St. • Dartmouth, NS B2Y 1G4 • Ph.: (902) 463-1440 • Fax: (902) 463-1419
E-mail: [email protected] • Web: www.mercatorgeo.com
129
15 Other Relevant Data and Information There is no additional information or explanation considered necessary for this report
Pulacayo Silver-Lead-Zinc Deposit Technical Report November 2012
65 Queen St. • Dartmouth, NS B2Y 1G4 • Ph.: (902) 463-1440 • Fax: (902) 463-1419
E-mail: [email protected] • Web: www.mercatorgeo.com
130
16 Interpretation and Conclusions The Apogee 100% owned Pulacayo polymetallic deposit is located 18 km east of the city of Uyuni in the Department of Potosi in southwestern Bolivia, 460 km south southeast of the national capital La Paz, and 130 km southwest of Potosi, the department capital. The Pulacayo mine is the second largest historic producer of silver in Bolivia, with over 600 million ounces of past production. The extent of known mineralization is generally defined by the extent of the historic mine workings that occur over a strike length of approximately 2.7 km and to a vertical depth from surface of 1 km. Apogee has now tested approximately 1.5 km of the known deposit strike length, and locally to a vertical depth of approximately 660 m below surface, with a combined total of 69,739 m of diamond drilling in 226 surface drill holes and 42 underground drill holes plus 6 surface trenches. The Pulacayo deposit is interpreted as a low sulphidation epithermal deposit that hosts both precious and base metal mineralization within Silurian sediments of the Quenhua Formation and intruding Miocene andesitic volcanic rocks of the Rotchild and Megacristal units. Of the 1000 m vertical extent of sulphide mineralization, the top 450 m are hosted within the intruding volcanic unit and bottom 550 m are hosted in the underlying sedimentary unit. Mineralization hosted by volcanic rocks occurs over tens of meters in thickness within a stockwork of narrow veins and veinlets and is accompanied by disseminations in associated argillicly-altered margin areas. The intruded sedimentary rocks host spatially constrained, bonanza style high grade veins that locally measure up to several meters in width, and these typically bifurcate into networks of veins and disseminated zones within the overlying volcanic sequence. Veins are commonly banded in texture and can contain semi-massive to massive sulphides, with the primary minerals of economic importance being galena, sphalerite, tetrahedrite and other silver sulfosalts. In combination, these comprise the TVS mineralization that constitutes the Pulacayo deposit. The TVS mineralization is controlled by an east-west oriented normal fault system that links two northeast trending, steeply dipping, regional strike slip faults. The updated mineral resource for the Pulacayo deposit is tabulated below in Table 16.1 and has an effective date of September 28th, 2012.
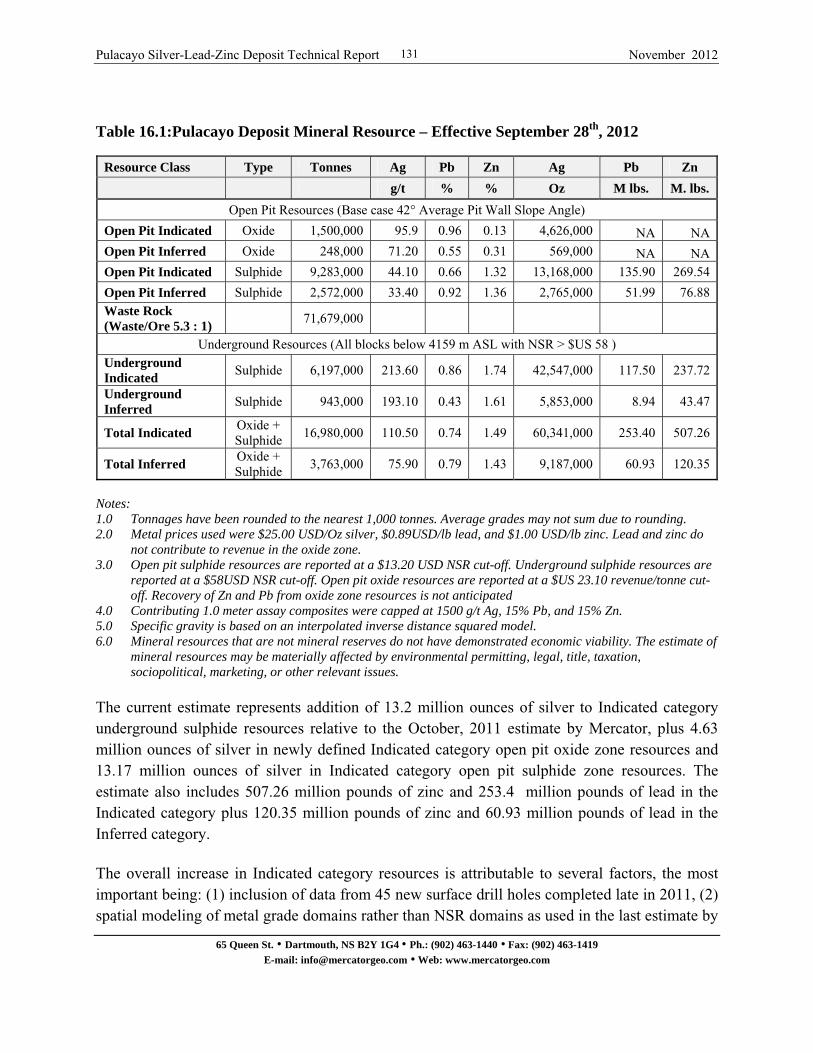
Pulacayo Silver-Lead-Zinc Deposit Technical Report November 2012
65 Queen St. • Dartmouth, NS B2Y 1G4 • Ph.: (902) 463-1440 • Fax: (902) 463-1419
E-mail: [email protected] • Web: www.mercatorgeo.com
131
Table 16.1:Pulacayo Deposit Mineral Resource – Effective September 28th, 2012
Resource Class Type Tonnes Ag Pb Zn Ag Pb Zn
g/t % % Oz M lbs. M. lbs.
Open Pit Resources (Base case 42° Average Pit Wall Slope Angle)
Open Pit Indicated Oxide 1,500,000 95.9 0.96 0.13 4,626,000 NA NAOpen Pit Inferred Oxide 248,000 71.20 0.55 0.31 569,000 NA NAOpen Pit Indicated Sulphide 9,283,000 44.10 0.66 1.32 13,168,000 135.90 269.54
Open Pit Inferred Sulphide 2,572,000 33.40 0.92 1.36 2,765,000 51.99 76.88Waste Rock (Waste/Ore 5.3 : 1)
71,679,000
Underground Resources (All blocks below 4159 m ASL with NSR > $US 58 ) Underground Indicated
Sulphide 6,197,000 213.60 0.86 1.74 42,547,000 117.50 237.72
Underground Inferred
Sulphide 943,000 193.10 0.43 1.61 5,853,000 8.94 43.47
Total Indicated Oxide + Sulphide
16,980,000 110.50 0.74 1.49 60,341,000 253.40 507.26
Total Inferred Oxide + Sulphide
3,763,000 75.90 0.79 1.43 9,187,000 60.93 120.35
Notes: 1.0 Tonnages have been rounded to the nearest 1,000 tonnes. Average grades may not sum due to rounding. 2.0 Metal prices used were $25.00 USD/Oz silver, $0.89USD/lb lead, and $1.00 USD/lb zinc. Lead and zinc do
not contribute to revenue in the oxide zone. 3.0 Open pit sulphide resources are reported at a $13.20 USD NSR cut-off. Underground sulphide resources are
reported at a $58USD NSR cut-off. Open pit oxide resources are reported at a $US 23.10 revenue/tonne cut-off. Recovery of Zn and Pb from oxide zone resources is not anticipated
4.0 Contributing 1.0 meter assay composites were capped at 1500 g/t Ag, 15% Pb, and 15% Zn. 5.0 Specific gravity is based on an interpolated inverse distance squared model. 6.0 Mineral resources that are not mineral reserves do not have demonstrated economic viability. The estimate of
mineral resources may be materially affected by environmental permitting, legal, title, taxation, sociopolitical, marketing, or other relevant issues.
The current estimate represents addition of 13.2 million ounces of silver to Indicated category underground sulphide resources relative to the October, 2011 estimate by Mercator, plus 4.63 million ounces of silver in newly defined Indicated category open pit oxide zone resources and 13.17 million ounces of silver in Indicated category open pit sulphide zone resources. The estimate also includes 507.26 million pounds of zinc and 253.4 million pounds of lead in the Indicated category plus 120.35 million pounds of zinc and 60.93 million pounds of lead in the Inferred category. The overall increase in Indicated category resources is attributable to several factors, the most important being: (1) inclusion of data from 45 new surface drill holes completed late in 2011, (2) spatial modeling of metal grade domains rather than NSR domains as used in the last estimate by
Pulacayo Silver-Lead-Zinc Deposit Technical Report November 2012
65 Queen St. • Dartmouth, NS B2Y 1G4 • Ph.: (902) 463-1440 • Fax: (902) 463-1419
E-mail: [email protected] • Web: www.mercatorgeo.com
132
Mercator, (3) inclusion of new open pit oxide and sulphide zone resources, and (4) enhanced confidence in accuracy of the digital historic workings model that allowed elimination of an Inferred category envelope previously established around the workings.
Pulacayo Silver-Lead-Zinc Deposit Technical Report November 2012
65 Queen St. • Dartmouth, NS B2Y 1G4 • Ph.: (902) 463-1440 • Fax: (902) 463-1419
E-mail: [email protected] • Web: www.mercatorgeo.com
133
17 Recommendations and Estimated Budget
17.1 Recommendations
Based on the findings of this report, the following recommendations are presented with respect to upgrading of existing Pulacayo mineral resources and exploration for extensions to the currently defined deposit. Since Apogee has already committed to completion of an independent underground mining feasibility study by consulting firm TWP, it is recognized that recommendations arising from that study may supercede in priority some, or all, of those presented below. This applies in particular to Item 1 that includes focus on oxide and sulphide zone resources within the optimized open pit shell above the 4159 m underground crown pillar elevation. (1) Infill core drilling to upgrade existing Inferred resources to Indicated status is possible in several areas of the resource model, including areas within the optimized open pit shell. Future infill drilling to provide coverage at approximately 50m x 50m centers is recommended in such areas to support future resource category conversion. A total core drilling allocation of 5,000 m is recommended for such conversion and the following priority areas have been identified: (a) Oxide Zone between 740300mE and 740700mE - above 4240m elevation (b) Sulphide Zone between 739950mE and 739650mE - 4000m to 4150m elevation (c) Sulphide Zone between 740850mE and 741150mE - 3900m to 4190m elevation (d) Sulphide Zone between 740000mE and 740860mE - 3775m to 3950m elevation (2) The areas notes above also present good potential for direct extension of deposit dimensions beyond current resource limits. This potential warrants systematic assessment at an initial 100 m step out interval and a core drilling allocation of 5,000 m is recommended for such assessment. (3) Future drilling definition of Measured category mineral resources at Pulacayo will require completion of a detailed infill drilling program within an area of existing TVS Indicated resources. Infill drilling in such a test area at 25 m and 12.5 m centers along a stoping scale panel is suggested to assess continuity and character of mineralization. Resulting data can be used along with existing drilling data to determine the optimum drill hole spacing required for Measured category resource definition. A core drilling allocation of 1000m is recommended for this program and opportunities may exist to amalgamate this work with that of item 6 below. For present purposes they are separately budgeted. (4) Extensive hard copy archives exist for historic mine workings at Pulacayo and some of this information was used to build the current digital workings model. However, assay data associated with the historic workings has not been digitized to a substantial degree and it is recommended that a digital assay compilation project also be undertaken within the resource area to better define grade trends. Consideration of such information in combination with block model results should facilitate future mine planning at the scale of individual stoping blocks and also
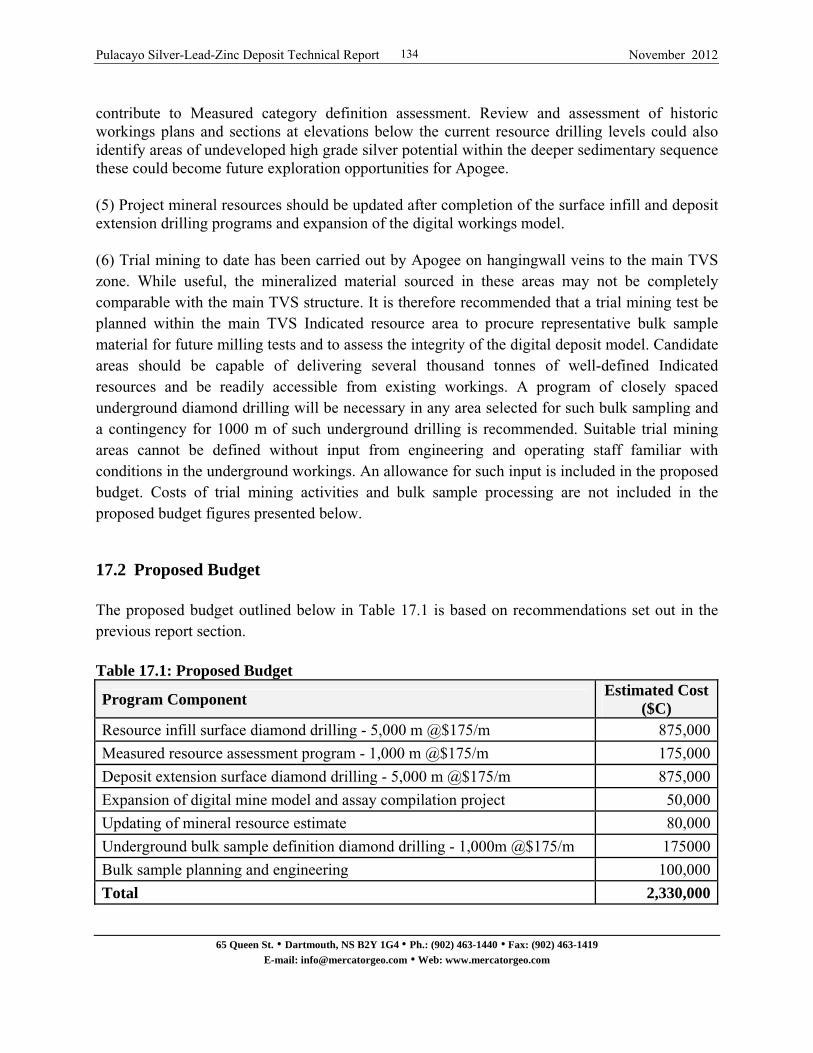
Pulacayo Silver-Lead-Zinc Deposit Technical Report November 2012
65 Queen St. • Dartmouth, NS B2Y 1G4 • Ph.: (902) 463-1440 • Fax: (902) 463-1419
E-mail: [email protected] • Web: www.mercatorgeo.com
134
contribute to Measured category definition assessment. Review and assessment of historic workings plans and sections at elevations below the current resource drilling levels could also identify areas of undeveloped high grade silver potential within the deeper sedimentary sequence these could become future exploration opportunities for Apogee. (5) Project mineral resources should be updated after completion of the surface infill and deposit extension drilling programs and expansion of the digital workings model. (6) Trial mining to date has been carried out by Apogee on hangingwall veins to the main TVS zone. While useful, the mineralized material sourced in these areas may not be completely comparable with the main TVS structure. It is therefore recommended that a trial mining test be planned within the main TVS Indicated resource area to procure representative bulk sample material for future milling tests and to assess the integrity of the digital deposit model. Candidate areas should be capable of delivering several thousand tonnes of well-defined Indicated resources and be readily accessible from existing workings. A program of closely spaced underground diamond drilling will be necessary in any area selected for such bulk sampling and a contingency for 1000 m of such underground drilling is recommended. Suitable trial mining areas cannot be defined without input from engineering and operating staff familiar with conditions in the underground workings. An allowance for such input is included in the proposed budget. Costs of trial mining activities and bulk sample processing are not included in the proposed budget figures presented below.
17.2 Proposed Budget The proposed budget outlined below in Table 17.1 is based on recommendations set out in the previous report section. Table 17.1: Proposed Budget
Program Component Estimated Cost
($C) Resource infill surface diamond drilling - 5,000 m @$175/m 875,000
Measured resource assessment program - 1,000 m @$175/m 175,000
Deposit extension surface diamond drilling - 5,000 m @$175/m 875,000
Expansion of digital mine model and assay compilation project 50,000
Updating of mineral resource estimate 80,000
Underground bulk sample definition diamond drilling - 1,000m @$175/m 175000
Bulk sample planning and engineering 100,000
Total 2,330,000

Pulacayo Silver-Lead-Zinc Deposit Technical Report November 2012
65 Queen St. • Dartmouth, NS B2Y 1G4 • Ph.: (902) 463-1440 • Fax: (902) 463-1419
E-mail: [email protected] • Web: www.mercatorgeo.com
135
18.0 Date and Signature The effective date of this report is September 28th, 2012. “Signed and sealed by” Date: November 12th, 2012 _______________________________ Peter Webster P.Geo, President Mercator Geological Services Limited “Signed and sealed by” Date: November 12th, 2012 _______________________________ Michael Cullen M.Sc., P.Geo, Chief Geologist Mercator Geological Services Limited “Signed and Sealed by” _______________________________ Date: November 12th, 2012 Eugene J. Puritch, P. Eng., President P&E Mining Consultants Inc.
Pulacayo Silver-Lead-Zinc Deposit Technical Report November 2012
65 Queen St. • Dartmouth, NS B2Y 1G4 • Ph.: (902) 463-1440 • Fax: (902) 463-1419
E-mail: [email protected] • Web: www.mercatorgeo.com
136
19 Statements of Qualifications
Pulacayo Silver-Lead-Zinc Deposit Technical Report November 2012
65 Queen St. • Dartmouth, NS B2Y 1G4 • Ph.: (902) 463-1440 • Fax: (902) 463-1419
E-mail: [email protected] • Web: www.mercatorgeo.com
137
CERTIFICATE of AUTHOR
I, Peter C. Webster, P. Geo. do hereby certify that:
I currently reside in Dartmouth, Nova Scotia and I am currently employed as President and Senior Manager with Mercator Geological Services Limited.
2. I graduated with a Bachelors Degree in Geology from Dalhousie University in
1981. In addition, I obtained a Certificate in Environmental Management (C.E.M.) from the Technical University of Nova Scotia in 1996.
3. I am a registered member in good standing of the Association of Professional
Geoscientists of Nova Scotia, registration number 047. I am a member in good standing of the Association of Professional Engineers and Geoscientists of Newfoundland and Labrador, member number 03337.
4. I have worked as a geologist in Canada and internationally for over 27 years since
my graduation from university in 1981. I have a wide variety of commodity experience including, gold, VMS, base metals, nickel, and industrial minerals. I have completed numerous NI43-101 compliant Technical Reports and Resource Estimates.
5. I have relevant work experience and authored reports on similar epithermal gold
deposits. I have worked in Mexico and evaluated similar style gold and silver mineralization and alteration.
6. I am a co-author of a previous resource estimate Technical Report prepared for
the Pulacayo property by Mercator on behalf of Apogee, this having an effective date of October 19th, 2011.
7. I have read the definition of “qualified person” set out in National Instrument 43-101 (“NI 43-101”) and certify that by reason of my education, affiliation with a professional association (as defined in NI 43-101) and past relevant work experience, I fulfill the requirements to be a “qualified person” for the purposes of NI 43-101.
8. I am the qualified person responsible all items (except sections 11 and 13) in this
Technical Report entitled “Updated Mineral Resource Estimate Technical Report For The Pulacayo Silver-Lead-Zinc Deposit, Pulacayo Township, Potosí District, Quijarro Province, Bolivia, Effective Date: September 28th, 2012.
9. I visited the Pulacayo property between August 2, 2011 to August 10, 2011 at
which time I visited the Pulacayo property and completed a review of Apogee drill program components, including protocols for drill core logging, storage,
Pulacayo Silver-Lead-Zinc Deposit Technical Report November 2012
65 Queen St. • Dartmouth, NS B2Y 1G4 • Ph.: (902) 463-1440 • Fax: (902) 463-1419
E-mail: [email protected] • Web: www.mercatorgeo.com
138
handling, sampling and security, viewed mineralization and alteration, and carried out a drill core check sampling program, all of which are relevant to this report.
10. To the best of my knowledge, information and belief, the Technical Report contains all scientific and technical information that is required to be disclosed to make those sections of the technical report not misleading.
11. I am independent of Apogee Silver Ltd. applying all of the tests in Section 1.5 of
National Instrument 43-101. 12. I have read National Instrument 43-101 and Form 43-101F1, and believe that this
Technical Report has been prepared in compliance with that instrument and form. Dated this 12th Day of November, 2012 “Signed and sealed by” ____________________________ Peter C. Webster, P. Geo. President Mercator Geological Services Limited
Pulacayo Silver-Lead-Zinc Deposit Technical Report November 2012
65 Queen St. • Dartmouth, NS B2Y 1G4 • Ph.: (902) 463-1440 • Fax: (902) 463-1419
E-mail: [email protected] • Web: www.mercatorgeo.com
139
CERTIFICATE of AUTHOR
I, Michael P. Cullen, P. Geo. do hereby certify that:
I currently reside in Halifax, Nova Scotia, Canada and am employed as a Senior Geologist by Mercator Geological Services Limited. 1. I graduated with a Master of Science (Geology) degree from Dalhousie University
in 1984 and received a Bachelor of Science degree (Honours, Geology) in 1980 from Mount Allison University.
2. I am a registered member in good standing of the following professional
associations: (1) Association of Professional Geoscientists of Nova Scotia, registration number 064, (2) Professional Engineers and Geologists of Newfoundland and Labrador, registration number 05058 and (3) Association of Professional Engineers and Geoscientists of New Brunswick, registration number L4333.
3. I have worked as a geologist in Canada and internationally since graduation from university.
4. I have relevant professional experience that includes exploration for similar style deposits and have co-authored numerous NI43-101 compliant Technical Reports and Resource Estimates. I have specific previous experience with respect to epithermal precious metal deposits in Canada, Mexico, Colombia and the United States.
5. I am a co-author of a previous resource estimate Technical Report prepared by Mercator for the Pulacayo property on behalf of Apogee, this having an effective date of October 19th, 2011.
6. I have read the definition of “qualified person” set out in National Instrument 43-101 (“NI 43-101”) and certify that by reason of my education, affiliation with a professional association (as defined in NI 43-101) and past relevant work experience, I fulfill the requirements to be a “qualified person” for the purposes of NI 43-101.
7. I am one of the qualified persons responsible for preparation of the Technical Report entitled “Updated Mineral Resource Estimate Technical Report For The Pulacayo Siver-Lead-Zinc Deposit, Pulacayo Township, Potosí District, Quijarro Province, Bolivia, Effective Date: September 28th, 2012. I am responsible for report sections 11 and 13 with the exception of section 13.3.13.
Pulacayo Silver-Lead-Zinc Deposit Technical Report November 2012
65 Queen St. • Dartmouth, NS B2Y 1G4 • Ph.: (902) 463-1440 • Fax: (902) 463-1419
E-mail: [email protected] • Web: www.mercatorgeo.com
140
8. I visited the Pulacayo Property on April 26th through 28th, 2012 and completed a review of Apogee drill program components, including protocols for drill core logging, storage, handling, sampling and security, viewed mineralization and alteration, carried out discussions with Apogee staff and completed a drill core check sampling program for purposes of evaluation of oxide zone mineralization at Pulacayo. All of these activities were relevant to this report.
9. I am not aware of any material fact or material change with respect to the subject matter of the Technical Report that is not reflected in the Technical Report, the omission to disclose which makes the Technical Report misleading.
10. I am independent of Apogee Silver Ltd. applying all of the tests in section 1.5 of
National Instrument 43-101.
11. I have read National Instrument 43-101 and Form 43-101F1, and believe that this Technical Report has been prepared in compliance with that instrument and form.
Dated this 12th Day of November, 2012 “Signed and sealed by” _________________________________ Michael P. Cullen, M. Sc., P. Geo. Chief Geologist Mercator Geological Services Limited
Pulacayo Silver-Lead-Zinc Deposit Technical Report November 2012
65 Queen St. • Dartmouth, NS B2Y 1G4 • Ph.: (902) 463-1440 • Fax: (902) 463-1419
E-mail: [email protected] • Web: www.mercatorgeo.com
141
CERTIFICATE of AUTHOR I, Eugene J. Puritch, P.Eng., residing at 44 Turtlecreek Blvd., Brampton, Ontario, L6W 3X7, do hereby certify that: 1. I am an independent mining consultant and President of P & E Mining Consultants Inc. 2. This certificate applies to the Technical Report titled “Updated Mineral Resource Estimate Technical Report For The Pulacayo Silver-Lead-Zinc Deposit, Pulacayo Township, Potosí District, Quijarro Province, Bolivia, Effective Date: September 28th, 2012.” 3. I am a graduate of The Haileybury School of Mines, with a Technologist Diploma in Mining, as well as obtaining an additional year of undergraduate education in Mine Engineering at Queen’s University. In addition I have also met the Professional Engineers of Ontario Academic Requirement Committee’s Examination requirement for Bachelor’s Degree in Engineering Equivalency. I am a mining consultant currently licensed by the Professional Engineers of Ontario (License No. 100014010), Association of Professional Engineers and Geoscientists Saskatchewan (License No. 16216), Professional Engineers and Geoscientists Newfoundland and Labrador (License No. 05998), Profession Engineers and Geoscientists New Brunswick (License No. L4778) and registered with the Ontario Association of Certified Engineering Technicians and Technologists (License No. 45252), as a Senior Engineering Technologist. I am also a member of the National Canadian Institute of Mining and Metallurgy. 4. I have read the definition of “qualified person” set out in National Instrument 43-101 (“NI 43-101”) and certify that, by reason of my education, affiliation with a professional association (as defined in NI 43-101) and past relevant work experience, I fulfill the requirements to be a “qualified person” for the purposes of NI 43-101. 5. I am one of the qualified persons responsible for preparation of the Technical Report entitled “Updated Mineral Resource Estimate Technical Report For The Pulacayo Silver-Lead-Zinc Deposit, Pulacayo Township, Potosí District, Quijarro Province, Bolivia, Effective Date: September 28th, 2012. I am responsible for report section 13.3.13. 6. I have practiced my profession continuously since 1978. My summarized career experience is as follows: Mining Technologist - H.B.M.& S. and Inco Ltd., 1978-1980 Open Pit Mine Engineer – Cassiar Asbestos/Brinco Ltd., 1981-1983 Pit Engineer/Drill & Blast Supervisor – Detour Lake Mine, 1984-1986
Pulacayo Silver-Lead-Zinc Deposit Technical Report November 2012
65 Queen St. • Dartmouth, NS B2Y 1G4 • Ph.: (902) 463-1440 • Fax: (902) 463-1419
E-mail: [email protected] • Web: www.mercatorgeo.com
142
Self-Employed Mining Consultant – Timmins Area, 1987-1988 Mine Designer/Resource Estimator – Dynatec/CMD/Bharti, 1989-1995 Self-Employed Mining Consultant/Resource-Reserve Estimator, 1995-2004 President – P & E Mining Consultants Inc, 2004-Present 7. I have not visited the Pulacayo property that is the subject of this Technical Report. 8. I am independent of Apogee Silver Ltd. applying the test in Section 1.5 of NI 43-101. 9. I have had no prior involvement with the project that is the subject of this Technical Report. 10. I have read NI 43-101 and Form 43-101F1. The portion of this Technical Report that I am responsible for has been prepared in compliance therewith. 11. As of the date of this certificate, to the best of my knowledge, information and belief, the Technical Report contains all scientific and technical information that is required to be disclosed to make the Technical Report not misleading. Dated this 12th Day of November, 2012 “Signed and sealed by” _________________________________ Eugene J. Puritch, P. Eng., President, P&E Mining Consultants Inc.
Pulacayo Silver-Lead-Zinc Deposit Technical Report November 2012
65 Queen St. • Dartmouth, NS B2Y 1G4 • Ph.: (902) 463-1440 • Fax: (902) 463-1419
E-mail: [email protected] • Web: www.mercatorgeo.com
143
20 References Cited (1992) Geology and Mineral Resources of the Altiplano and Cordillera Occidental, Bolivia. US Geological Survey Bulletin 1975. Denver, CO, USA. 1992. (1997) CODIGO DE MINERIA, Gaceta Oficial de Bolivia. La Paz, Bolivia. 17 March, 1997. Corbett, G.J., 2002, Epithermal gold for explorations, AIG Journal – Applied geoscientific practice and research in Australia Paper 2002-01, February 2002 26p. Corbett, G.J., and Leach, T.M., 1998, Southwest Pacific rim gold-copper systems: Structure, alteration and mineralization: Economic Geology, Special Publication 6, 238 p., Society of Economic Cullen, M. P. and Webster, P.C., 2011: Revised Mineral Resource Estimate Technical Report For The Pulacayo Ag-Pb-Zn Deposit, Pulacayo Township, Potosí District, Quijarro Province, Bolivia, Effective Date: October 19th , 2011; NI-43-101 Technical report prepared for Apogee Silver Limited by Merctaor Geological Services Limited, dated Deecmber 9th, 2011; 166p. Cullen, M. P. and Webster, P.C., 2012: Revised Mineral Resource Estimate Technical Report For The Pulacayo Ag-Pb-Zn Deposit, Pulacayo Township, Potosí District, Quijarro Province, Bolivia, Effective Date: October 19th , 2011; NI-43-101 Revised Technical report prepared for Apogee Silver by Mercator Geological Services Limited, Revision Date: May 23rd, 2012. Lindgren, W., 1922, A Suggestion for the Terminology of Certain Mineral Deposits: Economic Geology, v. 17, p. 292-294. Iriondo, L., Quispe F., Camacho, J., Aruni J., 2009, Memoria Geologica Proyecto Pulacayo-Pacamayo-Paca. Unpublished Internal Apogee Silver Report June 2009. Pressacco, R., Harris, G., Godard, M., Jacobs C., 2010 Technical Report on the Preliminary Assessment of the Pulacayo Project, Potosí District, Quijarro Province, Pulacayo Township, Bolivia: Unpublished. Document available at www.SEDAR.com, 238 p. Pressacco, R., and Shoemaker, S., 2008, Technical Report for the Pulacayo Project, Potosí District, Quijarro Province, Pulacayo Township, Bolivia: Unpublished. Document available at www.SEDAR.com, 207 pp. Pressacco, R., and Gowans, R., 2007, Technical Report on the Mineral Resource Estimate for the Paca Deposit, Potosí District, Quijarro Province, Thols, Pampa, Huanchaca and Pulacayo Townships, Bolivia: Unpublished Document available on the SEDAR web site at www.SEDAR.com, 226 p.
Pulacayo Silver-Lead-Zinc Deposit Technical Report November 2012
65 Queen St. • Dartmouth, NS B2Y 1G4 • Ph.: (902) 463-1440 • Fax: (902) 463-1419
E-mail: [email protected] • Web: www.mercatorgeo.com
144
Sempere, T., 1995: Sediment accumulation on top of the Andean orogenic wedge: Oligocene to late Miocene basins of the Eastern Cordillera, southern BoliviaDiscussion Geological Society of America Bulletin, November, 2000, v. 112, p. 1752 Starkey, J., 2011, NSR Calculator and Description of Methodology, Unpublished Apogee Internal document, Starkey & Associates Inc., Consulting Metallurgical Engineers 2010. White, N C and Hedenquist, J. W., 1994, Epithermal environments and styles of mineralization; variations and their causes, and guidelines for exploration, In: Epithermal gold mineralization of the Circum-Pacific; geology, geochemistry, origin and exploration; II.Siddeley-G (editor), Journal of Geochemical Exploration. 36; 1-3, Pages 445-474. 1990. Websites Used: Apogee Silver Ltd. http://apogeesilver.com Coeur d’Alene Mines Corporation http://www.coeur.com Glencore International http://www.glencore.com/ Golden Minerals plc http://www.goldenminerals.com/ Pan American Silver http://www.panamericansilver.com/
Pulacayo Silver-Lead-Zinc Deposit Technical Report November 2012
65 Queen St. • Dartmouth, NS B2Y 1G4 • Ph.: (902) 463-1440 • Fax: (902) 463-1419
E-mail: [email protected] • Web: www.mercatorgeo.com
145
Appendix 1
Drilling Related Documents Documents have been removed due to size but are available for viewing at the Apogee Silver Ltd. Head Office.
Pulacayo Silver-Lead-Zinc Deposit Technical Report November 2012
65 Queen St. • Dartmouth, NS B2Y 1G4 • Ph.: (902) 463-1440 • Fax: (902) 463-1419
E-mail: [email protected] • Web: www.mercatorgeo.com
146
Appendix 2
Resource Estimate Support Documents
Documents have been removed due to size but are available for viewing at the Apogee Silver Ltd. Head Office.

Pulacayo Silver-Lead-Zinc Deposit Technical Report November 2012
65 Queen St. • Dartmouth, NS B2Y 1G4 • Ph.: (902) 463-1440 • Fax: (902) 463-1419
E-mail: [email protected] • Web: www.mercatorgeo.com
147
Appendix 3
Plans and Sections
Documents have been removed due to size but are available for viewing at the Apogee Silver Ltd. Head Office.